

Submitted:
30 March 2026
Posted:
31 March 2026
You are already at the latest version
Abstract
Spring flood modeling is a major tool used to understand the risks of severe hydrological events in the context of climate change. In Kazakhstan spring of 2024 was a rapid shift from cold to mild temperatures in just a few weeks. While traditional flood forecasting methods have been limited in their ability to consider the interactions of the natural processes that create runoff, this research sets out to address these limitations by modelling the formation of spring floods using a numerical approach. The study discusses the effects of snowmelt and freeze-thaw processes on surface runoff and the flooding that results from it in the northern and western regions of Kazakhstan. A comprehensive model has been developed that considers the heat transfer in soil, infiltration of meltwater, and propagation of runoff. Numerical modelling indicates that in 2024, relative to 2021, there was earlier soil thawing and shallower depths of soil freezing. However, an increase in the intensity of snowmelt leads to the fact that the infiltration capacity of the soil is insufficient, despite the formation of a thawed layer. As a result, a higher surface runoff is formed. Using Saint-Venant’s equations to perform calculations indicates that higher values of current depth and velocity of runoff were observed in 2024 than in 2021, indicating a greater likelihood of flooding. Therefore, it can be concluded that increases in winter temperatures have the potential to create an increased flooding impact due to changes in the proportions of surface runoff and infiltration.
Keywords:
floods
; Kazakhstan
; freeze/thaw cycle
; heat equation
; surface runoff
; infiltration
1. Introduction
Spring floods are one of the most destructive hydrological phenomena, annually leading to significant economic losses and posing a threat to the safety of the population. This problem is especially acute in regions with a sharp continental climate, where intense snowmelt is superimposed on deep freezing of the soil. For Kazakhstan, the spring of 2024 was characterized by a sharp change in low temperatures and steady warming: the soil retained deep freezing, while the thawed layer remained thin. In the West Kazakhstan, Atyrau, Aktobe, Kostanay and North Kazakhstan regions, rapid snowmelt led to a catastrophic increase in surface runoff and floods [1,2]. The physical reason for this phenomenon lies in the fact that in spring the soil is a heterogeneous geological system, where the upper horizons gradually turn to a thawed state, while the lower horizons remain frozen [3,4]. This structure has a decisive influence on the processes of snowmelt, soil warming, and the movement of melt water. A sharp increase in air temperature forms a thawed layer faster than the lower frozen boundary of the soil warms up, as a result of which infiltration into the lower horizons is limited and water accumulates on the surface, forming a surface runoff [5]. The mechanism of movement of water in soil horizons differs significantly in degree of freezing: if in the upper meltwater layers water can move through macropores, channels, and conductive paths, then in the frozen part there is practically no possibility of free infiltration [6,7].
Various researchers have analyzed the impact of frozen soil and snowmelt on floods, considiring climatic conditions. Taking into account the condition of the frozen soil has been found to change runoff forecasts by 30-50% [8]. Green-Ampt infiltration models are used to describe these processes, which allow more accurate estimation of the amount of water that passes through the soil [9,10], while the rate of infiltration depends on the source of water intake and the structure of the soil [11]. Modern approaches emphasize that the complex integration of several processes - heat transfer, infiltration and snowmelt - provides more accurate modeling of floods than using models separately [12]. Using an approach adapted for hydrothermal processes, temperature distribution and moisture movement are determined by the contrast of physical properties between soil layers [13]. Heat transfer and infiltration schemes [3,4] are used for numerical modeling, and the infiltration model is implemented on the basis of Green-Ampt [9,10].
However, most of the existing studies are either general theoretical in nature or have been performed for other climatic zones. A comprehensive numerical analysis of the effect of soil freezing on spring runoff for the five regions of Kazakhstan affected by the 2024 floods has not previously been conducted using real meteorological data.
The purpose of this work is to numerically simulate the processes of heat transfer and infiltration in the freezing soils of West Kazakhstan, Atyrau, Aktobe, Kostanay and North Kazakhstan regions during the calm (2021) and flood (2024) years.
The recorded meteorological data of Kazhydromet for the studied regions [14] is used as input data. A total of 68 meteorological stations are involved: in Atyrau region (KZ-ATY) - 10, in Aktobe (KZ-AKT) - 16, in West Kazakhstan (KZ-ZAP) - 12, in Kostanay (KZ-KUS) - 18, in North Kazakhstan (KZ-SEV) - 12 (Figure 1).
Actual meteorological data is used for modeling: air temperature, soil surface temperature, snow cover height, precipitation, and soil surface condition. The time period chosen is from February to March for 2021 (calm year) and 2024 (flood year) [5]. These parameters serve as input data that determine the rate of melting, warming of the soil and the inflow of water.
The first section presents the initial data and methods of their processing for five regions of Kazakhstan. The second section describes the models of heat transfer and infiltration. The third section presents the simulation results and their comparative analysis.
2. Climate-Driven Input Data Analysis for Freeze-Thaw Processes
In order to identify the key climatic factors that led to a large-scale spring flood in a number of regions of Kazakhstan, the meteorological parameters in the flood year 2024 are analyzed and compared with the calm year 2021. The study was carried out on the basis of data from weather stations in five regions characteristic of the flood risk zone [14]. The values of the average monthly and average daily air temperature, the date of the first temperature transition through 0°C, the rate of its change () and various regional features of the thermal regime in February-April were used as initial parameters. Figure 2 assesses a general visual of the annual temperature course.
A comparison of the dynamics of air temperature in 2024 and 2021 shows a fundamentally different nature of seasonal warming. If in the calm year 2021 a steady transition of the average daily air temperature to a positive area occurred in late March and early April, then in 2024 a similar phenomenon was observed in the first days of February. This fact is confirmed by the data from the Table 1, and is also visualized in Figure 3.
Almost all stations recorded steady warming as early as February 2-6. This fact is critically important, since it is in February that the depth of soil freezing reaches its maximum, and its structure does not allow water to infiltrate downward. An additional comparison of temperature conditions demonstrates a steady positive anomaly in 2024. According to the Table 2, as well as a visual summary in Figure 4, where March and April 2024 are shown as significantly warmer compared to 2021.
Of particular importance is the assessment of the air heating rate (). In 2021, temperature changes occurred smoothly and averaged 1-3°C per day. In contrast, in 2024, temperature spikes of 5-7°C per day were observed, accompanied by sharp returns to negative values. The data is presented in the Table 3, and their dynamics is shown in Figure 5.
This type of temperature regime leads to accelerated destruction of the snow cover structure: snow quickly becomes saturated with water, loses its density and actively melts, and then, with a short-term cooling, it becomes covered with an ice crust, which further complicates the situation.
Thus, a comprehensive analysis of temperature data for five regions of Kazakhstan shows that the flood year 2024 was characterized by a combination of three factors: an abnormally early temperature transition through 0°C, a steady positive anomaly in the average daily temperature from February to April, as well as sudden daily temperature spikes. Such a simultaneous effect of extreme factors led to the fact that the snow began to melt much earlier than typical, with the ground completely frozen, which blocked the possibility of infiltration of meltwater. As a result, a powerful surface runoff formed in the regions, which became the key cause of the large-scale flood of 2024.
A comparison of the daily soil surface temperature for 2021 and 2024 reveals fundamental differences in the nature of soil warming in late winter and early spring (Figure 6).
In 2021, the warming of the soil surface occurred gradually: negative temperatures persisted until the end of March, while the transition through 0°C was short-lived and episodic, indicating the presence of stable snow cover and the absence of early melting. The soil reacted to the increase in air temperature smoothly, without sudden jumps, which is typical for calm years. In 2024, a completely different pattern is observed: in all regions, the transition of the soil surface through 0°C occurred much earlier, often already in the first days of February, that is, 4-6 weeks earlier than the climatic norm and on average a month earlier than in 2021. At the same time, the transition itself was abrupt, with a rapid increase in surface temperature from -10...-15°C to positive values within a few days.
This type of warming indicates that the soil began to thaw much earlier than the calendar period, although the deep layers remained frozen. Meltwater began to form with infiltration still completely blocked, as the frozen layer did not have time to warm up after the surface. In 2024, the surface temperature increased faster than the air temperature, which is typical for situations when snow becomes wet and actively absorbs solar radiation.
The anomaly plots shown in Figure 7 illustrate the difference in daily soil surface temperature between the flood year of 2024 and the normal year of 2021. As can be seen, there was a significant positive deviation in soil surface temperature in 2024 throughout nearly the entire period from February to April.
In all regions, there are bursts of the +8...+15°C anomaly in the first two weeks of February. This means that in 2024, the soil surface was significantly warmer than in the calm year 2021, warming occurred much faster than usual, and the heat wave reached the surface, despite the continued snow cover. It is such bursts that are a characteristic sign of the early and abnormal onset of spring warming, which predisposes to the formation of surface meltwater. Short-term anomaly dips up to -10...-15°C are shown, especially in the regions of Aktobe (KZ-AKT), Kostanay (KZ-KUS) and in the North Kazakhstan region (KZ-SEV). However, these episodes were short, did not lead to the restoration of stable freezing, and were quickly replaced by a new sharp warming. Such a temperature "fluctuations" accelerates the destruction of the snow cover and creates conditions for intensive melting with still cold soil in depth. Almost the whole of March and April 2024 are characterized by a stable positive trend of anomalies. The soil was warmer than normal by 3-8°C, the melting process occurred much faster and the soil surface reached a state of water saturation earlier than climatic conditions.
This effect is important for the thawed-frozen layer model: the upper layer actively warms up and moistens, while the deeper layers remain frozen and continue to prevent infiltration. In 2024, the soil surface warmed up earlier, more strongly and faster than in the calm year 2021. The thawed surface layer began to form against the background of the still completely frozen lower layer, the water that arose during melting could not infiltrate. Because of this, surface runoff accumulated and flood conditions were created already in February.
To assess the dynamics of seasonal melting of snow conditions in Figure 8 the temperature values were classified into three modes:
- — stable snow cover;
- — the area of phase transition ("wet snow");
- — lack of snow or active melting.
An analysis of the graphs for 2021 shows that negative surface temperatures (blue range) dominated most of February and March in all regions. The phase transition was recorded to a limited extent and mainly in the second half of March, which indicates the stability of the snow cover and the absence of significant fluctuations in the thermal regime. The appearance of stable positive values was observed only in early to mid-April. This temperature distribution indicates a consistent, gradually developing seasonal thawing characteristic of a calm hydrological environment. In this configuration, the upper melt layer is formed synchronously with the gradual warming of the underlying horizons, which ensures effective infiltration of melt water and minimizes the formation of surface runoff.
In contrast to 2021, the temperature charts for 2024 show a marked shift in the onset of melting at an earlier date. In all the regions studied, stable episodes of t > 0°C are recorded as early as the first half of February, that is, 4-6 weeks earlier than in 2021. There is also a significantly higher frequency of values close to zero (purple range), which reflects a prolonged regime of weakly positive temperatures and active phase transitions.
The transition from negative temperatures to positive ones occurs abruptly and without the long transition period typical for 2021. In some regions, melting-freezing cycles are recorded, contributing to the structural destruction of snow cover and the formation of an ice crust on the soil surface. This configuration enhances the surface accumulation of moisture, since meltwater weakly infiltrates while maintaining frozen lower horizons. Reconstruction of the snow water equivalent (SWE) (Figure 9) shows significantly higher values in 2024 compared to 2021.
In 2021: peak SWE ≈ 80-90 mm, and in 2024: peak SWE≈90-100 mm, with higher snow height. This is consistent with the increased height of snow cover in 2024 and indicates a higher volume of potential meltwater available to generate flood costs. The dynamics of melting is also significantly different: in 2024, SWE falls faster than in 2021, which confirms a more intensive transition of the cover to water in a narrow time interval. This is an indicator of increased flood risk.
In Figure 10 the anomaly of water reserves in the snow cover (SWE) reflects the difference in the water equivalent of snow between 2024 and 2021 with the same calendar dates, which allows us to assess differences in the conditions of accumulation and retention of snow.
During the early winter (≈30-45 day of the year), SWE fluctuates around zero, sometimes slightly deviating in the positive direction (up to 3-5 mm). This indicates similar snow accumulation conditions in both years, with no significant differences in depth or water equivalent of snow cover. From the end of February to the middle of March (≈45-70 day of the year), SWE begins to increase systematically, reaching 8-15 mm, which indicates a higher intensity of snow accumulation in 2024. This may be due to low temperatures, which prevented the metamorphosis of snow, or an increase in the amount of solid precipitation compared to 2021. In the period from mid-March to the end of March (≈70-90 day of the year), moderate fluctuations of SWE are observed in the range of 5-12 mm, which may reflect short-term thaws, local compaction or partial melting of the upper layers of snow. It is also worth considering that snow density and humidity can affect SWE changes, even with the same snow cover height.
At the end of March (≈95-100 day of the year), SWE drops sharply to -10...-15 mm, which is associated with intense snowmelt in 2024. It may also indicate colder conditions in 2021, when some of the snow reserves were still being held. In the region of 100-105 days of the year, there is a sharp surge in SWE to +40 mm, which is the most pronounced anomaly. This confirms a significant increase in water reserves in the snow cover in 2024, creating a high flood potential. In 2021, at this time, SWE was probably already declining. After 105-110 days (in late spring), SWE decreases rapidly, which indicates the melting of accumulated snow reserves and the equalization of conditions between the years, when both years reach the phase of snow cover disappearance.
Thus, a comprehensive analysis of temperature data for five regions Kazakhstan shows that the flood year 2024 was characterized by a combination of three factors: an abnormally early temperature transition through 0°C, a steady positive anomaly in the average daily temperature from February to April, as well as sudden daily temperature spikes. Such a simultaneous effect of extreme factors led to the fact that the snow began to melt much earlier than typical, with the ground completely frozen, which blocked the possibility of infiltration of meltwater. Further, these obtained data are used in process modeling.
3. Materials and Methods
To study the mechanisms of formation of spring floods in conditions of seasonal freezing of soils, a consistent construction and analysis of physical models for heat transfer, filtration of water in the soil and surface runoff is used.
The soil is represented as a multiphase medium in which thermal and hydrological processes are connected. Special attention is paid to the situation when the inflow of water exceeds the capacity of the soil. It is susceptible to infiltration due to the presence of a frozen or poorly permeable underlying layer. The paper considers three main interrelated models that lead to spring floods in conditions of partially frozen soil. Each of these physical and mathematical models describes a separate physical aspect of the process. Figure 11 illustrates how snow, soil, and surface runoff interact with each other.
The heat transfer model describes how melting is caused by air temperature, which heats the snow cover and topsoil [3,4,6,7,8]. The Green-Ampt infiltration model shows the movement of meltwater in the thawed soil layer and the limitation of filtration due to the frozen horizon [9,10,11]. The Saint-Venant 1D surface runoff model reflects how excess water moves across the surface and accumulates in low relief areas, forming floods [15,16]. All models are used in 1D format, as additional physical and hydrological parameters must be taken into account for more complex modeling. This section discusses the main physical processes included in the model. Despite their interrelation within the framework of the general scheme, for clarity, each process is presented separately in the following subsections.
3.1. Heat Transfer Modelling
The thermal conductivity model describes the vertical transfer of heat to the atmosphere-soil system and analyzes the seasonal dynamics of soil freezing and thawing.It also reproduces the evolution of the soil temperature profile and the position of the isotherm 0 °C, which, within the framework of the accepted approximation, is interpreted as a conditional freezing boundary. The temperature field of the soil is described by the equation of thermal conductivity in the one-dimensional vertical approximation [4]:
where: T is the soil temperature, t is time, z is depth, is the coefficient of thermal conductivity of the soil, depending on the type and condition of the soil. The thermal conductivity is set regionally, taking into account the type of soil: , where is the base value for the region, is the dimensionless correction factor for the soil cipher. The calculated area is limited by the depth and is sampled in increments . The time step corresponds to the daily interval .
The surface temperature is determined as follows: in the presence of observations of soil temperature, the measured value is used; in their absence, the attenuation of air temperature by snow cover is applied.:
where H is the height of the snow cover, is the coefficient of thermal insulation of snow.
The initial temperature distribution over depth was set based on the observed average soil temperature according to the Dirichlet condition:
At the upper boundary (), a boundary condition of the first kind was set, determined by the effective temperature of the soil surface:
The condition of zero heat flow was used at the lower boundary of the calculated area ():
this corresponds to the assumption that there is no heat exchange with deeper layers in the time interval under consideration.
An implicit difference scheme is used to numerically solve the heat equation: the Backward Euler method in time and the central difference approximation in space. After discretization, the equation for the inner node i takes the form:
which leads to a system of linear algebraic equations:
where is a numerical approximation of the temperature at the node of the spatial grid at time . For the inner nodes of the grid, the difference equation is written as .The numbering of nodes in space goes through the i index, and the time layers through the n index.
The resulting tridiagonal system was solved by the standard run-through method. The use of an implicit scheme ensures the unconditional stability of the calculation and the correct reproduction of temperature dynamics at a daily time step, which is critical for the analysis of seasonal processes of freezing and thawing [17].
The depth of seasonal freezing/thawing is defined as the depth of the first temperature transition through , at which the conditions are met and . This approach is widely used in engineering geocryology and allows stable monitoring of the phase transition front.
Changes in the thickness of the frozen layer determine the daily intensity of melting:
where is the equivalent volume of the frozen layer, is the density of ice, and is the density of water. The result is expressed in mm/day. The obtained depth of the thawed layer is then used to determine the effective capacity of the infiltration horizon in the Green–Ampt model.
3.2. Modeling of Water Infiltration Using the Green–Ampt Approach
This subsection discusses the process of water infiltration described using the Green-Ampt model. The paper uses a simplified form of the model, in which the difference in moisture content is considered constant and is included in the capillary pressure . Infiltration is calculated based on the classical Green-Ampt[18] model:
where is the saturated soil filtration coefficient, is the capillary pressure at the humidification front, and F is the accumulated infiltration.
To account for the limited depth of thawing, a lowering multiplier [19] is introduced:
where is the characteristic depth of the active layer. A linear relationship is chosen as the first approximation of the effect of thawing depth on the effective filtration capacity of the soil.
Limitation of melting intensity by final infiltration:
The residual balance determines the surface slope runoff. The resulting infiltration rate is used further to describe the surface runoff.
3.3. Surface Runoff Modeling Based on the Saint-Venant Equations
Using the one-dimensional form of the Saint-Venant equations in a reduced form (kinematic approximation), the surface runoff formed by meltwater is modeled. In the flat areas of Northern and Western Kazakhstan, where surface runoff occurs with low flow rates and smooth flow development. Under these conditions, the influence of the inertial terms of the fluid flow equations turns out to be less significant than the influence of surface tilt and friction forces, and the kinematic approximation of the Saint-Venant equations can be used to describe snowmelt in spring. The flow rate of excess meltwater calculated using heat transfer and infiltration models is used as a source term in the continuity equation.
A one-dimensional slope with the movement of a thin layer of surface water is considered. The flow is assumed to be laminar or slightly turbulent, with a small thickness of the water layer (millimeters–centimeters) and low speeds, which is typical for spring melt runoff in the flat areas of Northern and Western Kazakhstan. Under these conditions, the inertial terms and wave effects are negligible compared to gravity and drag forces, which makes it possible to use a kinematic approximation of the Saint-Venant equations. The x axis is directed along the slope: is the upper part, is the lower part. The main desired value is the depth of the surface water layer(h(x,t)).
In the kinematic wave approximation, the dynamics of surface runoff is described by the mass conservation equation [20]:
where is the depth of the surface runoff, m; is the water flow rate per unit width, m2/s; is the water source determined by the intensity of the surface inflow.
The source term is formed based on the previous modeling stages and is defined as the residual balance of meltwater:
where is the snowmelt intensity calculated from the thermal model, is the infiltration determined using the Green–Ampt model, taking into account the depth of thawing.
Thus, the surface runoff model is directly related to the physical processes of heat transfer and infiltration. To close the continuity equation, the empirical Manning[20] relation is used, which relates the average flow velocity to the depth of the water and the slope of the surface.:
where u is the average flow velocity, n is the surface roughness coefficient, and S is the slope of the surface.
The consumption per unit width is defined as:
Substituting the expression (15) into the equation (12) leads to a nonlinear kinematic wave equation:
At the initial time, it is assumed that there is no surface runoff:
The water inflow is set at the upper boundary of the slope, determined by the intensity of excess meltwater.:
The free flow condition is used at the lower boundary of the calculated area.:
this corresponds to the lack of water supply at the outlet of the site in question.
For the first step, an explicit upwind scheme is used: one-dimensional in space (1D), the source depends only on time, .
Flow:
where is the depth of the surface layer at the node i and the time step n.
Depth Update:
where is the source term at time step n.
Solving the equations of the kinematic wave makes it possible to determine the temporal dynamics of the depth of surface runoff, the speed and flow of water along the slope, as well as the moments of formation of maximum flood loads. Comparison of calculations for flood and calm years makes it possible to identify critical combinations of thermal and hydrological conditions under which the soil loses its ability to receive water, which leads to the development of surface runoff and floods.
The reference Table 4 contains the key physical, geographical and hydrological parameters of the five regions of Kazakhstan, which determine the nature of surface runoff and floods. Each parameter affects the speed and intensity of the water spreading along the slope.
It can be noted that an increase in the slope and height of the territory leads to an acceleration of runoff and an increase in its intensity, while the gentle relief helps to slow down the movement of water and its stagnation. Surface roughness and vegetation density increase flow resistance, reducing runoff velocity and simultaneously increasing infiltration. The type of relief determines the spatial distribution of water: from uniform runoff on flat surfaces to the concentration of flows in depressions and valleys.
Thus, the combination of relief characteristics and the properties of the underlying surface forms various hydrological regimes, which must be taken into account in flood modeling and calculations using the Saint-Venant equations.
4. Results of Modeling
Numerical modeling was carried out based on the sequential application of the processes of snowmelt, infiltration and formation of surface runoff. In Figure 12 a comparison of the dynamics of temperature profiles, the depth of the isotherm , the intensity of melting, infiltration and surface runoff in the spring period for the Aktobe region station (KZ-AKT) in two years - 2021 and 2024.
The following dynamics of the soil temperature regime is observed for the Aktobe region. According to Figure 12 (a) in 2021, in February-March, the soil froze significantly, which is reflected in the temperature graphs - values on the surface and in the upper layers fall below , with more pronounced fluctuations at a depth of 0 m or less pronounced with increasing depth. The period of active thawing begins in late March and early April, when the temperature profiles gradually move into a positive area, which is clearly seen by the upward shift of the temperature curves.
The depth of the isotherm 0°C reaches a maximum of about 0.6 m, which corresponds to the depth of the active thawing layer (Figure 12(b)). In 2024, the dynamics are similar, but there is a slightly earlier and more intense thawing, which is reflected in more pronounced temperature fluctuations and shallow freezing depth. The intensity of snowmelt reaches its maximum in early April (Figure 12 (c)), while a significant part of the meltwater is infiltrated into the ground. Nevertheless, the remainder of the meltwater forms a surface runoff, the peak values of which coincide with the maximum melting intensity. These data indicate that during the spring thawing period, surface floods are actively formed due to unbalanced infiltration. The heat map confirms Figure 12 (d) temporal dynamics: the freezing zone shifts downward over time, gradually giving way to zones of positive temperatures. The contour of the isotherm 0°C on the map serves as a clear boundary between frozen and thawed soil and corresponds to the values calculated on the graph of the depth of the isotherm.
Additionally, according to this model, the Table 5 examined how melting transforms into surface runoff and where infiltration is limited, which contributes to increased runoff.
Here is the depth of the 0°C isotherm(m), is the surface runoff (mm). The amount of surface runoff varies significantly between years, despite the close values of total melting. For 2024, runoff is observed in the KZ-AKT and KZ-ZAP regions, when runoff decreases in KZ-ATY (marked in bold). This indicates the dominant role of infiltration restrictions associated with soil freezing. Thus, the model adequately reproduces the seasonal features of the thermal regime and the water balance of the soil in the Aktobe region, which confirms its applicability for assessing the conditions of flood formation in the spring period. In Figure 13 shows a comparison of changes in water depth and flow rate over time for 2021 and 2024.
Until the beginning of April 2021, the values of water depth and flow remained close to zero, which indicates the dry state of the riverbed. In Figure 13 (a) At the beginning of April, there is a sharp increase in flow, accompanied by a jump in water depth. After that, the parameters quickly reach a quasi-stationary level and remain almost constant until the end of the billing period. And in 2024, non-zero values of water depth and flow are recorded already at the beginning of the period under review. The riverbed was pre-saturated and there was background runoff At the beginning of April 2024. The flow rate is additionally increasing, leading to a significant increase in water depth. In comparison, the results in terms of depth and flow in 2024 exceed the values of 2021.
Depending on the time and depth distribution in Figure 13 (b) represents the spatial distribution of water depth along the riverbed. By 2021, for a long time, the water depth along the entire length of the site remains closer to zero until April, and in April it quickly reaches a stable value. This has been preserved throughout the riverbed. The picture is different for 2024. Almost from the very beginning, there are non-zero water depths. In early April, the incoming flood wave spreads out against the background of the existing flow and this leads to a smoother change in depth. The maximum values obtained for 2024 exceed those for 2021, which indicates a higher water content of the time period under consideration.
Based on the results obtained, the Saint Venant model demonstrates the ability to reproduce the conditions of a dry riverbed with a sharp wave front, as well as a regime with pre-filling of the riverbed and subsequent flood development.
5. Discussion
Numerical modeling revealed significant differences in soil temperature conditions at the KZ-AKT station in the period from 2024 to 2021. These changes were caused by warmer winters and early spring warming, which led to two key consequences: a decrease in the depth of seasonal freezing and an earlier formation of the thawed layer. These observations confirm the high sensitivity of soil freezing and thawing to temperature conditions, which is consistent with the modern scientific understanding of cryogenic processes in response to temperature changes and fully consistent with the modern scientific understanding of the behavior of frozen soils in cold climates. Similar mechanisms of response of seasonally frozen soils to climate warming have been described in a number of studies. [6,8].
Calculations using the Stefan model have shown that in 2024 the isotherm 0°C reaches the surface much earlier than in 2021. However, infiltration modeling using the Green-Ampt scheme revealed limited water permeability during the initial period of snowmelt, despite earlier thawing of the soil. This indicates that even with partial thawing of the soil, unfavorable conditions for infiltration remain, which is consistent with the results of studies showing that the presence of residual ice and a high degree of saturation of the pores with water can significantly reduce the infiltration capacity. [3,9].
The obtained dependences between the intensity of snowmelt, infiltration, and surface runoff indicate that in 2024, an increase in melting intensity will compensate for a potential increase in infiltration due to a shallower penetration of frost. As a result, despite the weakening of the frozen layer, a larger surface runoff is formed. A similar nonlinear hydrological reaction of seasonally frozen soils was previously noted in studies of the interaction of snowmelt and infiltration processes [1,7].
Modeling the propagation of flood waves using one-dimensional Saint-Venant equations has shown that 2024 will be characterized by higher costs and depths compared to 2021. This indicates a potential increase in the risk of flooding during warm winters and early spring melting. The results obtained are consistent with the conclusions about the increased hydrological variability and nonlinear response of river systems to climate warming presented in the review articles [8].
This study has a number of limitations. First, the heat transfer model uses a simplified Stefan equation and assumes uniformity of soil properties in depth, while thermal conductivity and heat capacity actually vary significantly depending on soil moisture, texture, and density. Secondly, infiltration was estimated using the traditional Green-Ampt model without taking into account the porous structure of the soil (or its macropores, cracks, cryogenic channels formed during freezing and thawing). Thirdly, runoff calculations were carried out in a one-dimensional mode, without taking into account lateral tributaries, spatial heterogeneity of the relief and anthropogenic impact (reservoirs, irrigation networks), which can lead to errors in estimating water levels and flow.
In addition, the use of meteorological data with a daily time resolution limits the possibilities of analyzing short-term extreme processes associated with intense snowmelt or precipitation.
A promising direction for a more accurate description of infiltration processes is the use of physically more complex models that take into account the phase transitions of water in the soil and the nonlinear dependence of hydraulic conductivity on temperature and humidity. The obtained spatiotemporal data can serve as a basis for training machine learning algorithms aimed at predicting surface runoff and hydrological response in a changing climate.
6. Conclusions
To analyze the causes of floods in 2024 in five regions of Kazakhstan (West Kazakhstan region, Atyrau, Aktobe, Kostanay and North Kazakhstan region), a comprehensive study was conducted using data from 68 weather stations. Consistent application of the 1D models of Stefan heat transfer, Green-Ampt infiltration, and Saint-Venant runoff has shown effectiveness in modeling spring processes. The flood year 2024 was characterized by an abnormally early temperature transition through 0°C already in early February, which is 4-6 weeks earlier than the climatic norm. Finding the soil in a state of maximum freezing blocked the infiltration of meltwater into deep horizons.
According to the analysis of meteorological data, a combination of three factors was revealed in 2024: February thaws with frozen ground, temperature spikes reached °C per day and the height of the snow cover in 2024 was significantly higher (up to 135 cm versus 105 cm in 2021), and reserves of snow water equivalent (SWE) reached peak values of 90-100 mm.
Numerical modeling in Aktobe showed that the peak values of surface runoff exactly coincide with the moments of maximum melting intensity during unbalanced infiltration. The 0°C isotherm, which reached a depth of 0.6 m, served as a clear boundary separating the thawed active layer and the permafrost.
The developed integrated model reproduces the seasonal features of the thermal regime and the water balance of the soil. The results obtained can be used to improve early warning systems, allowing the state of the "ice sheet" in the soil to be taken into account when predicting the volume of spring runoff. The study emphasizes that in order to accurately forecast floods in Kazakhstan, it is necessary to monitor not only the amount of snow, but also the dynamics of soil freezing in conjunction with temperature anomalies in February.
Author Contributions
Conceptualization, Zh.B. and G.R.; methodology, A.A. and G.R.; software, A.A.; validation, A.A. and G.R.; formal analysis, A.A.; investigation, A.A.; resources, A.A; data curation, A.A.; writing—original draft preparation, A.A., G.R. and Zh.B.; writing—review and editing, A.A., G.R. and Zh.B.; visualization, A.A and G.R.; supervision, K.S.; project administration, K.S. All authors have read and agreed to the published version of the manuscript.
Funding
This research has been funded by the Science Committee of the Ministry of Science and Higher Education of the Republic of Kazakhstan (Grant No. AP26196267).
Data Availability Statement
Data is contained within the article and is available to all.
Conflicts of Interest
The authors declare no conflicts of interest.
References
- Terekhov, A.G.; Abayev, N.N.; Tillakarim, T.A.; Serikbay, N.T. Interrelation between Snow Cover Depth and Spring Flooding in Northern Kazakhstan. Sovrem. Probl. Distantsionnogo Zondirovaniya Zemli iz Kosmosa 2023, 20, 323–328. [Google Scholar] [CrossRef]
- Nurbatsina, A.; Salavatova, Z.; Tursunova, A.; Didovets, I.; Huthoff, F.; Rodrigo-Clavero, M.-E.; Rodrigo-Ilarri, J. Flood Modelling of the Zhabay River Basin under Climate Change Conditions. Hydrology 2025, 12, 35. [Google Scholar] [CrossRef]
- Suzuki, K. Estimation of Snowmelt Infiltration into Frozen Ground and Snowmelt Runoff in the Mogot Experimental Watershed in East Siberia. Int. J. Geosciences 2013, 4, 1346–1354. [Google Scholar] [CrossRef]
- Larwa, B. Heat Transfer Model to Predict Temperature Distribution in the Ground. Energies 2019, 12, 25. [Google Scholar] [CrossRef]
- Republican State Enterprise “Kazhydromet”. Annual Bulletin of Snow Cover Monitoring on the Territory of the Republic of Kazakhstan. 2024. [Online] (accessed 02 February 2026). (accessed on 02 February 2026).
- Zhang, T.; Armstrong, R.L.; Smith, J. Investigation of the Near-Surface Soil Freeze–Thaw Cycle in the Contiguous United States: Algorithm Development and Validation. J. Geophys. Res.: Atmos. 2003, 108, D22. [Google Scholar] [CrossRef]
- Agwat, X.Y. Snow Melting Water Infiltration Mechanism of Farmland Freezing–Thawing Soil and Determination of Meltwater Infiltration Parameter in Seasonal Frozen Soil Areas. Agric. Water Manag. 2021, 255, 107165. [Google Scholar]
- Zhao, Y.; Zheng, C.; Gelfan, A.; Watanabe, K.; Liu, H.; Wright, S.; Wu, X.; Quinton, W.; Wang, Y.; Yi, S.; Zhang, Y.; Shi, Y.; Jiao, W. Frozen Soil Hydrological Processes and Their Effects: A Review and Synthesis. Rev. Geophys. 2026. [Google Scholar] [CrossRef]
- Beitlerová, H. Improved Calibration of the Green–Ampt Infiltration Module in the EROSION-2D/3D Model. SOIL 2021, 7, 531–548. [Google Scholar] [CrossRef]
- del Vigo, Á.; Zubelzu, S.; Juana, L. Infiltration Models and Soil Characterisation for Hemispherical and Disc Sources Based on Green–Ampt Assumptions. J. Hydrol. 2021, 598, 125966. [Google Scholar] [CrossRef]
- Morbidelli, R.; Corradini, C.; Saltalippi, C.; Flammini, A.; Dari, J.; Govindaraju, R.S. Rainfall Infiltration Modeling: A Review. Water 2018, 10, 1873. [Google Scholar] [CrossRef]
- Zsoter, E.; Arduini, G.; Prudhomme, C.; Stephens, E.; Cloke, H. Hydrological Impact of the New ECMWF Multi-Layer Snow Scheme. Atmosphere 2022, 13, 727. [Google Scholar] [CrossRef]
- Ahmad, Q.A.; Ehsan, M.I.; Khan, N.; Majeed, A.; Zeeshan, A.; Ahmad, R.; Noori, F.M. Numerical Simulation and Modeling of a Poroelastic Media for Detection and Discrimination of Geo-Fluids Using Finite Difference Method. Alex. Eng. J. 2022, 61, 2139–2152. [Google Scholar] [CrossRef]
- Ecodata.kz. Ecodata.kz Climate Database (dm_climat_ru). 2026. [Online] (accessed 02 February 2026). (accessed on 02 February 2026).
- Berdyshev, A.; Abdiramanov, Z.; Bliyeva, D.; Akhtaeva, N. A brief overview of modern research of the processes dynamics in unsteady water flows using the shallow water equation. J. Math. Mech. Comput. Sci. 2021, 112. [Google Scholar]
- Yu, C.-W.; Hodges, B.; Liu, F. A new form of the Saint-Venant equations for variable topography. Hydrol. Earth Syst. Sci. 2020, 24, 4001–4024. [Google Scholar] [CrossRef]
- Pham, Q.T. A fast, unconditionally stable finite-difference scheme for heat conduction with phase change. Int. J. Heat Mass Transf. 1985, 28, 2079–2084. [Google Scholar] [CrossRef]
- Green, W.H.; Ampt, G.A. Studies on soil physics. 1. The flow of air and water through soils. J. Agric. Sci. 1911, 4, 1–24. [Google Scholar]
- Chen, J.; Gao, X.-G.; Zheng, X.; Miao, C.; Zhang, Y.; Du, Q.; Xu, Y. Simulation of Soil Freezing and Thawing for Different Groundwater Table Depths. Vadose Zone J. 2019, 18. [Google Scholar] [CrossRef]
- Chow, V.T. Open-Channel Hydraulics; McGraw-Hill: New York, 1959. [Google Scholar]
Figure 1.
Map of the weather station by regions of Kazakhstan: West Kazakhstan region (KZ-ZAP), Atyrau (KZ-ATY), Aktobe (KZ-AKT), Kostanay (KZ-KUS) and North Kazakhstan region (KZ-SEV)
Figure 1.
Map of the weather station by regions of Kazakhstan: West Kazakhstan region (KZ-ZAP), Atyrau (KZ-ATY), Aktobe (KZ-AKT), Kostanay (KZ-KUS) and North Kazakhstan region (KZ-SEV)
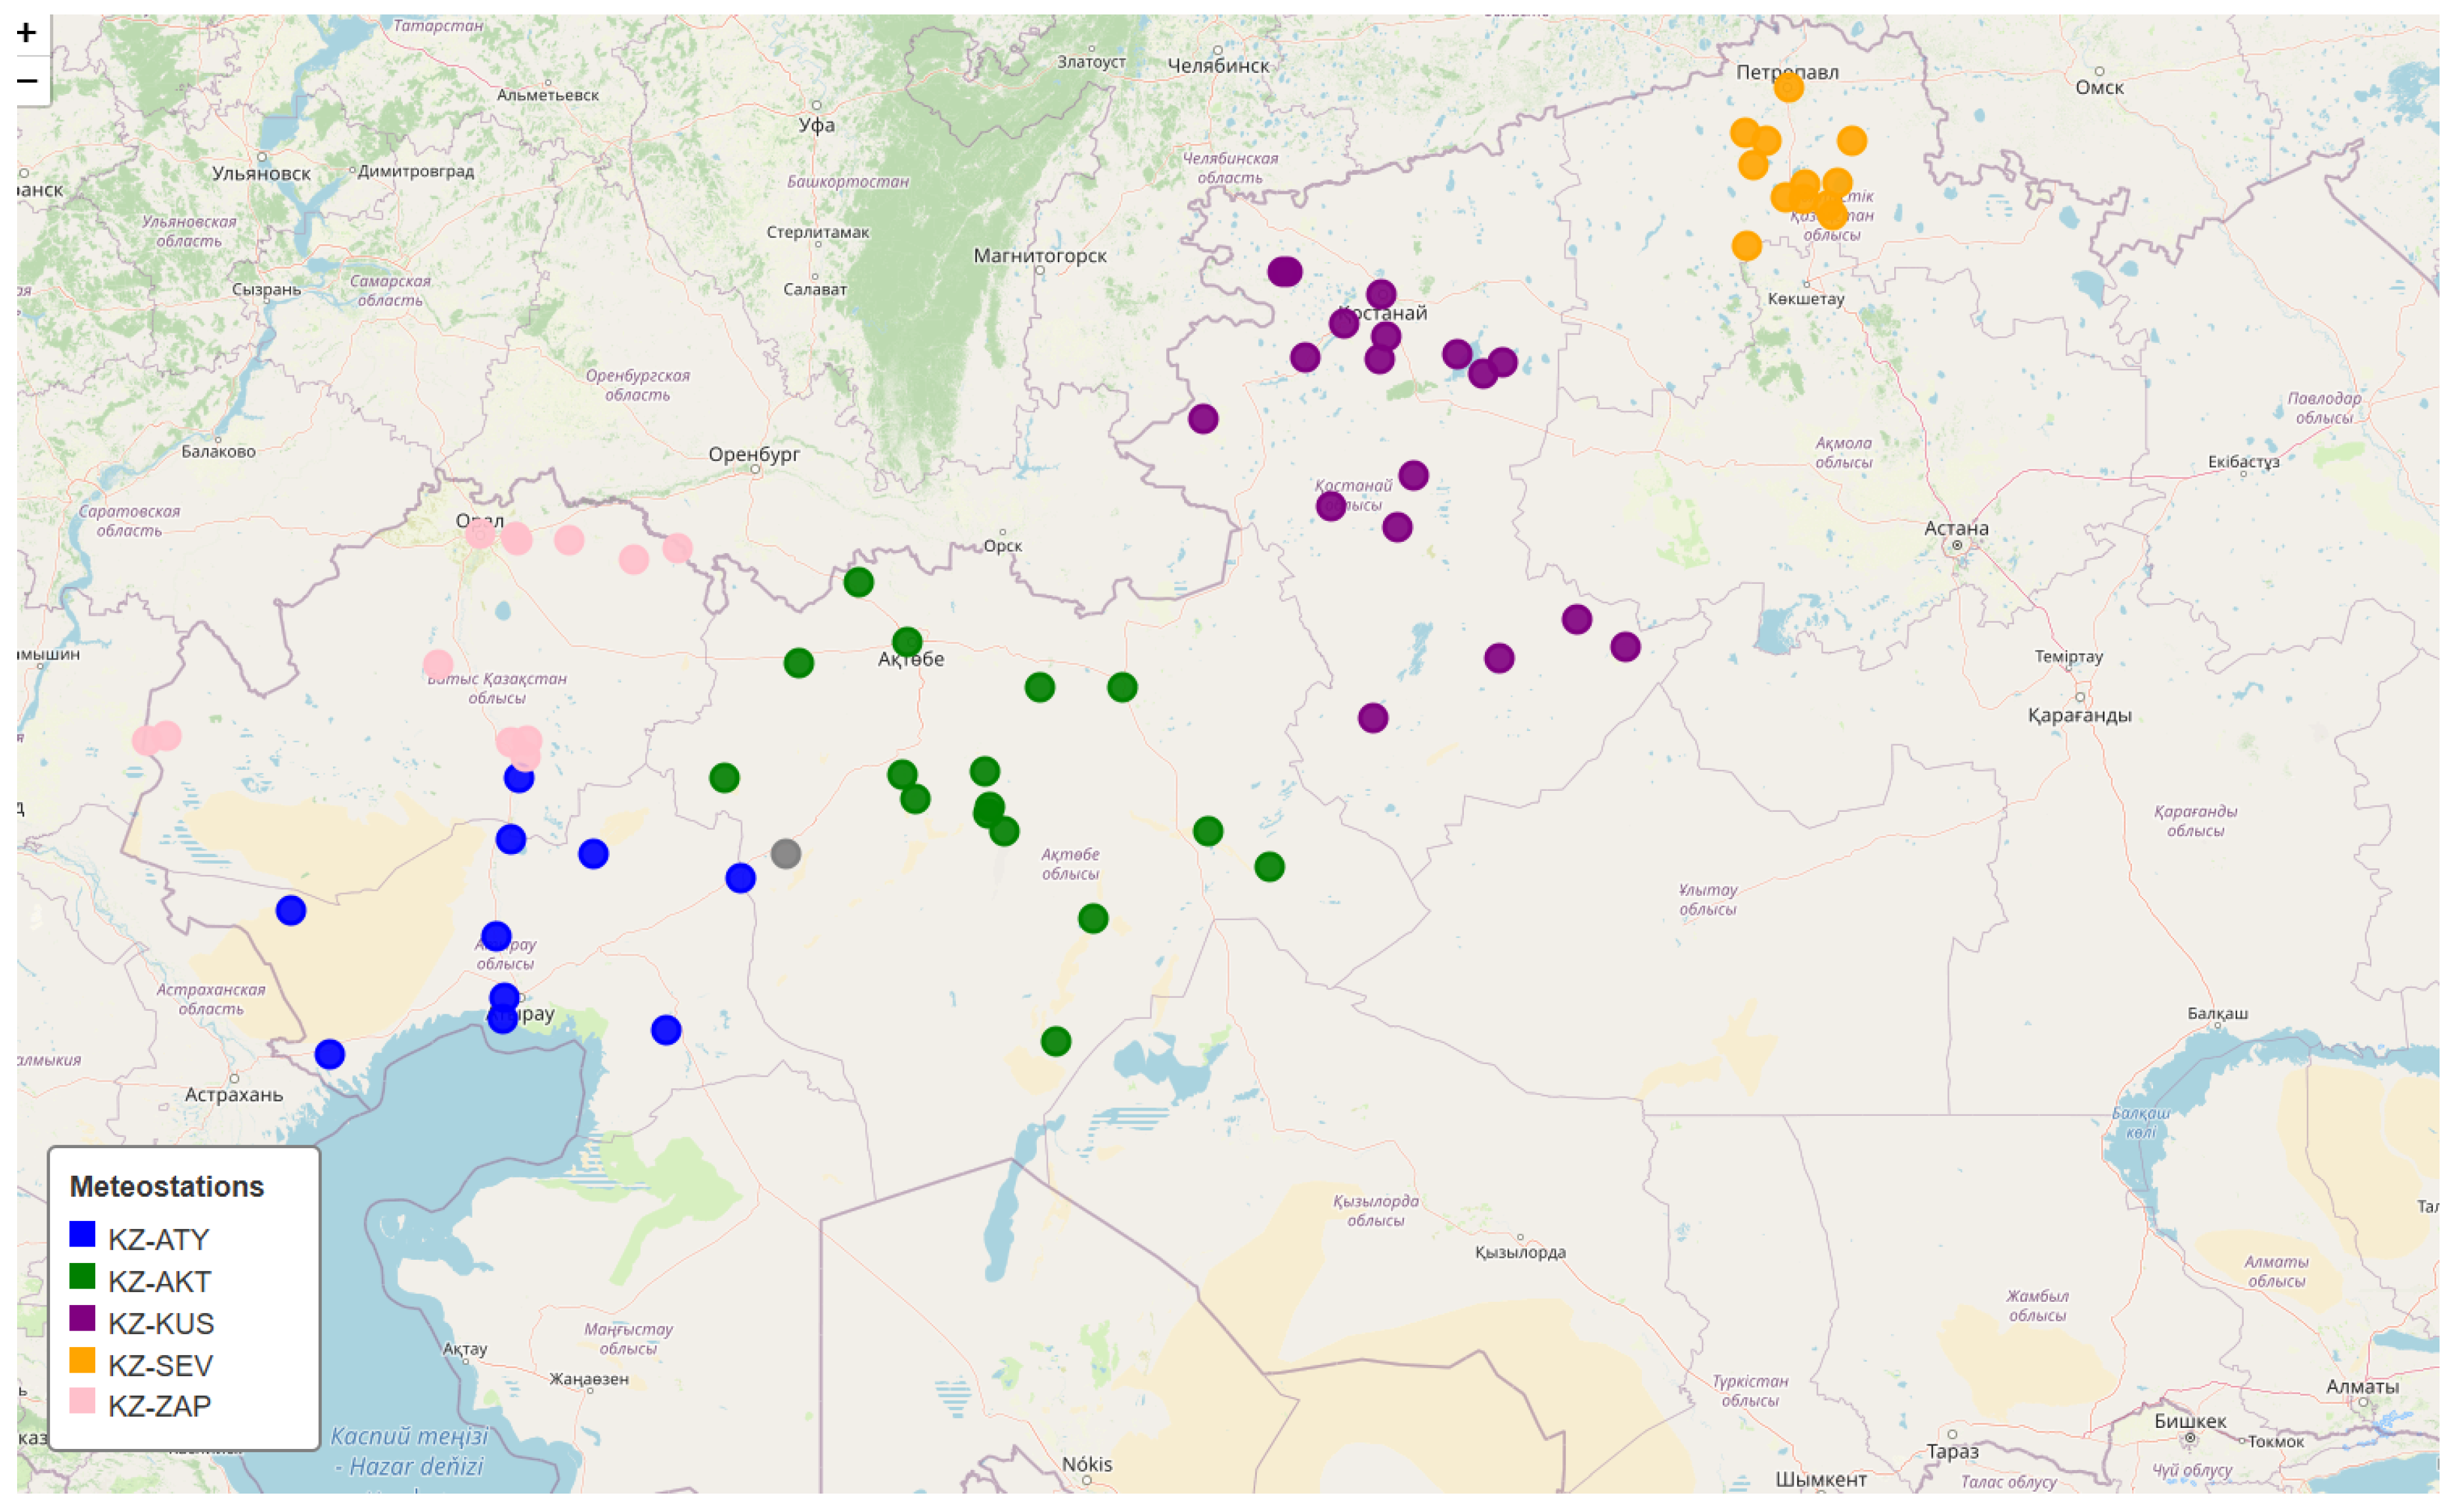
Figure 2.
Air temperature by region - 2021 and 2024
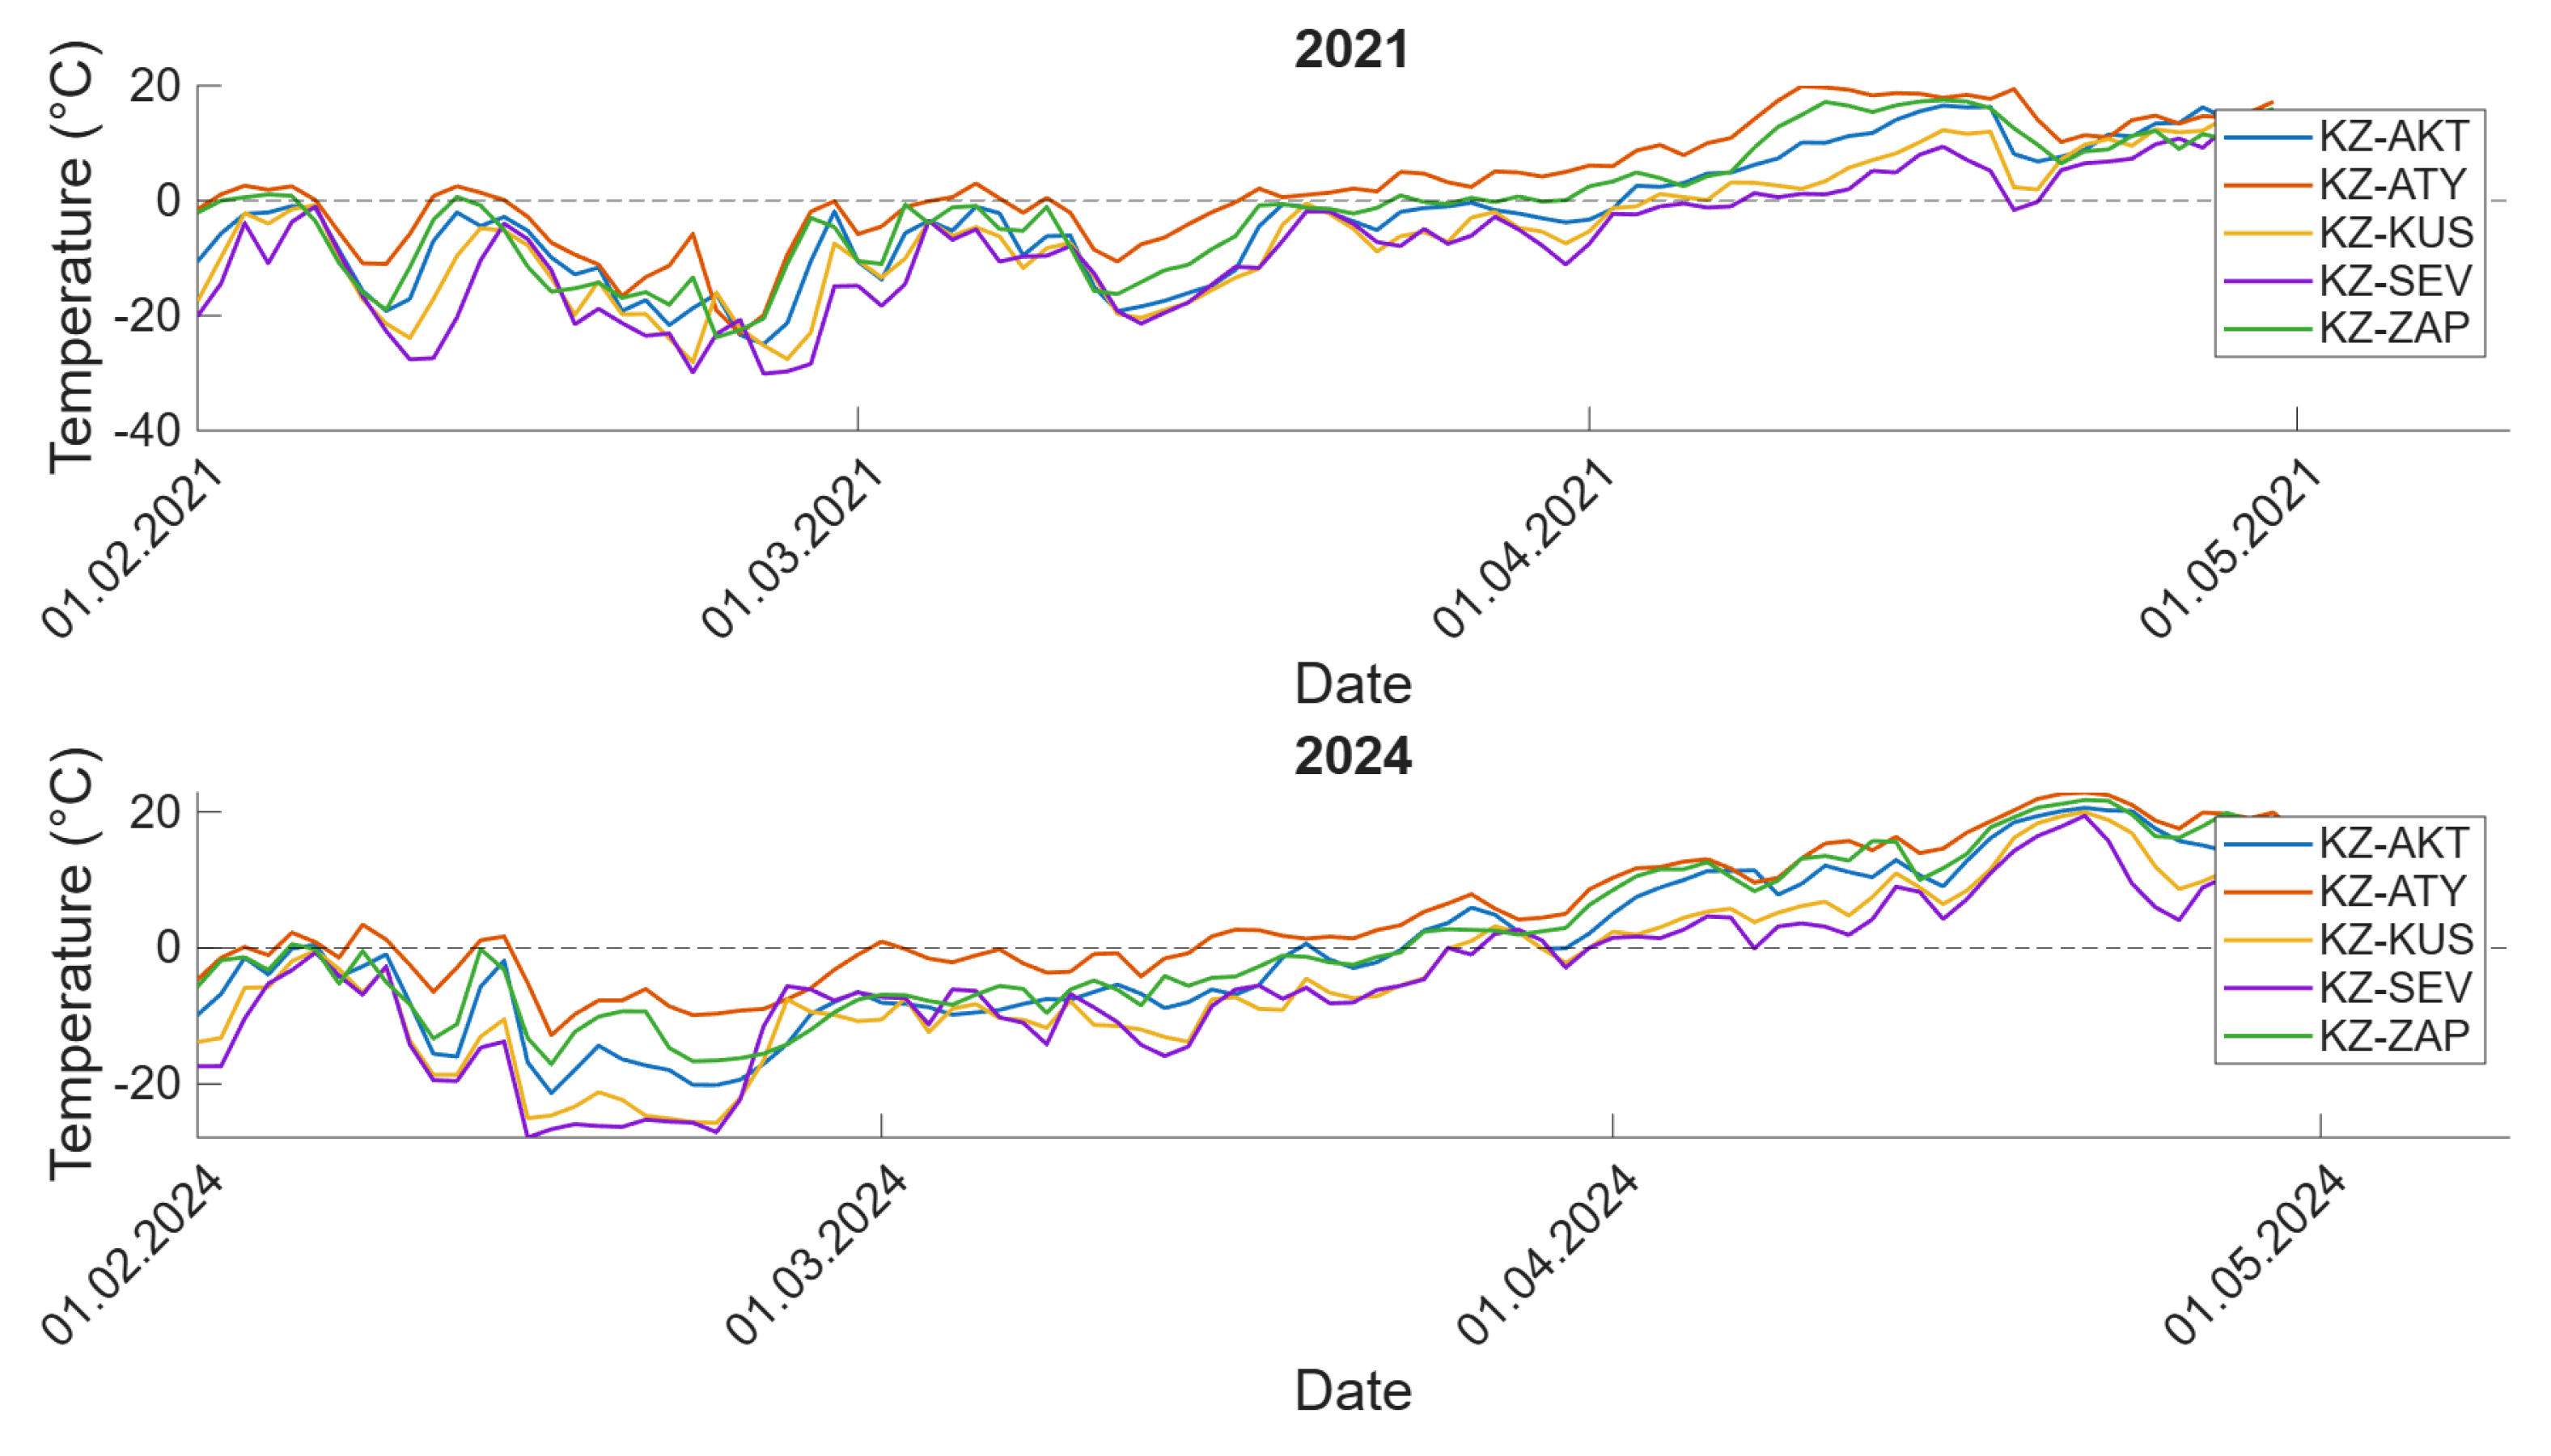
Figure 3.
First temperature transition date > 0°C
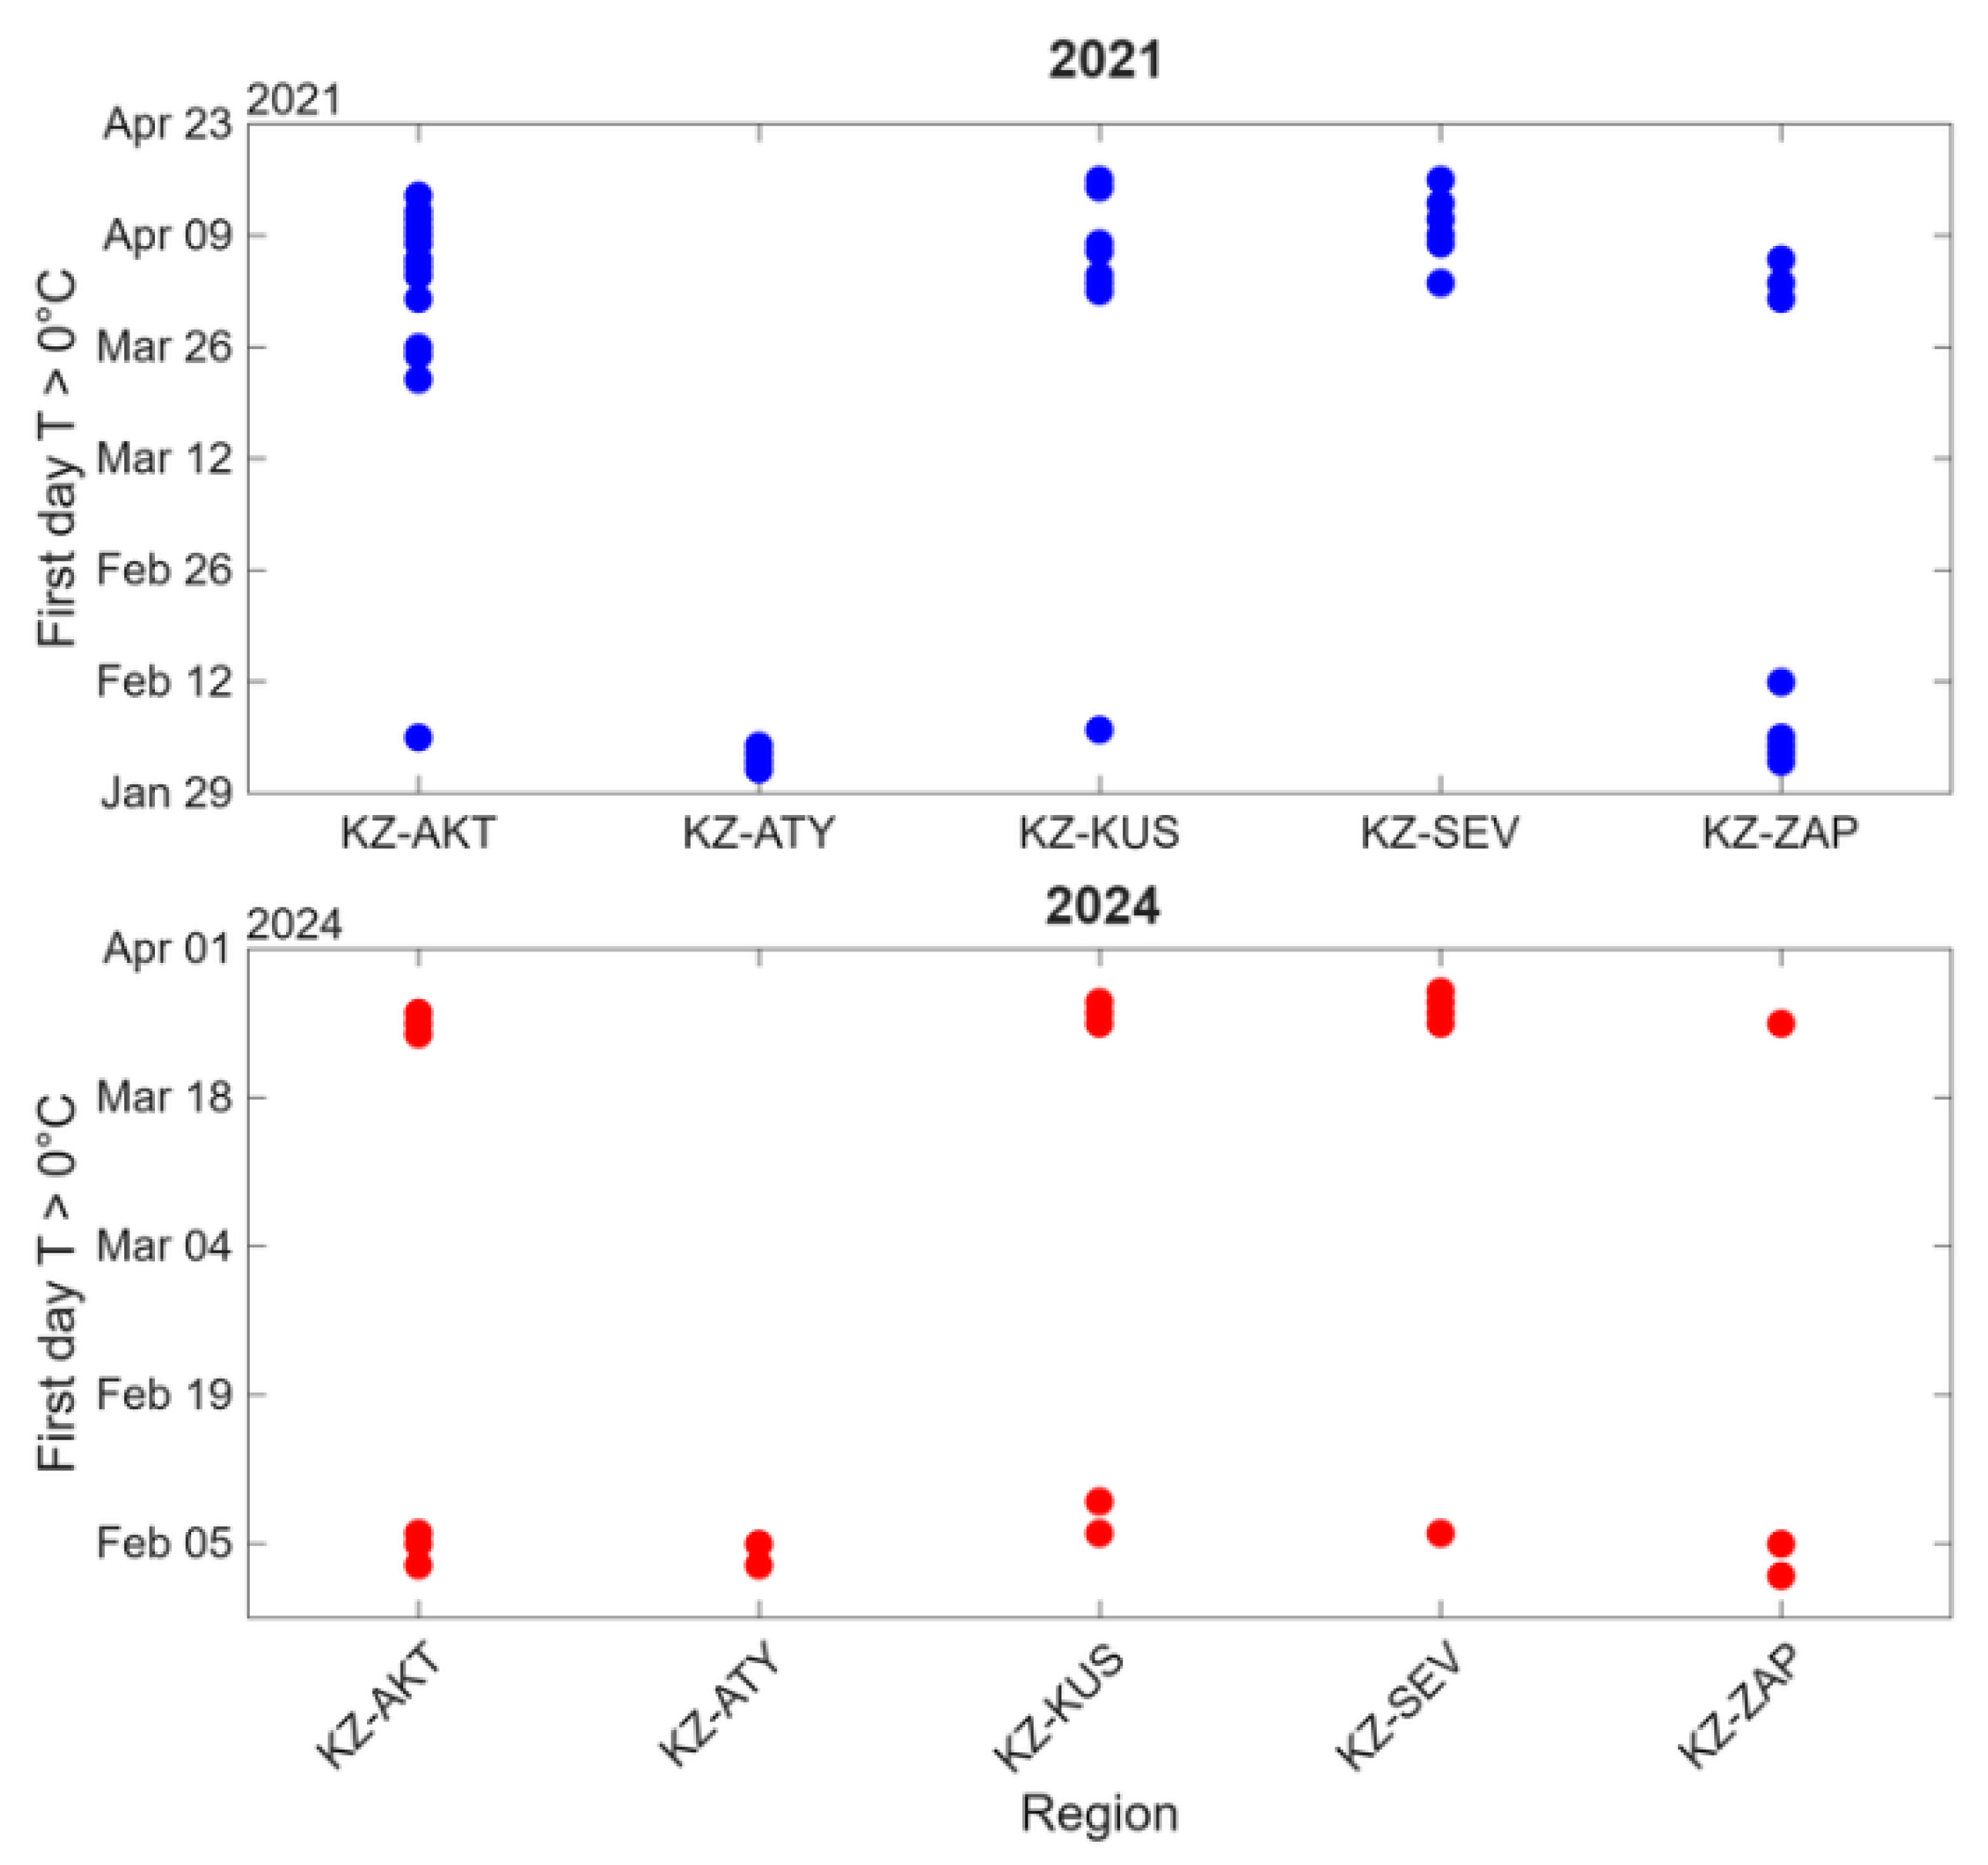
Figure 4.
Heatmap: average air temperature by month, region, and year.
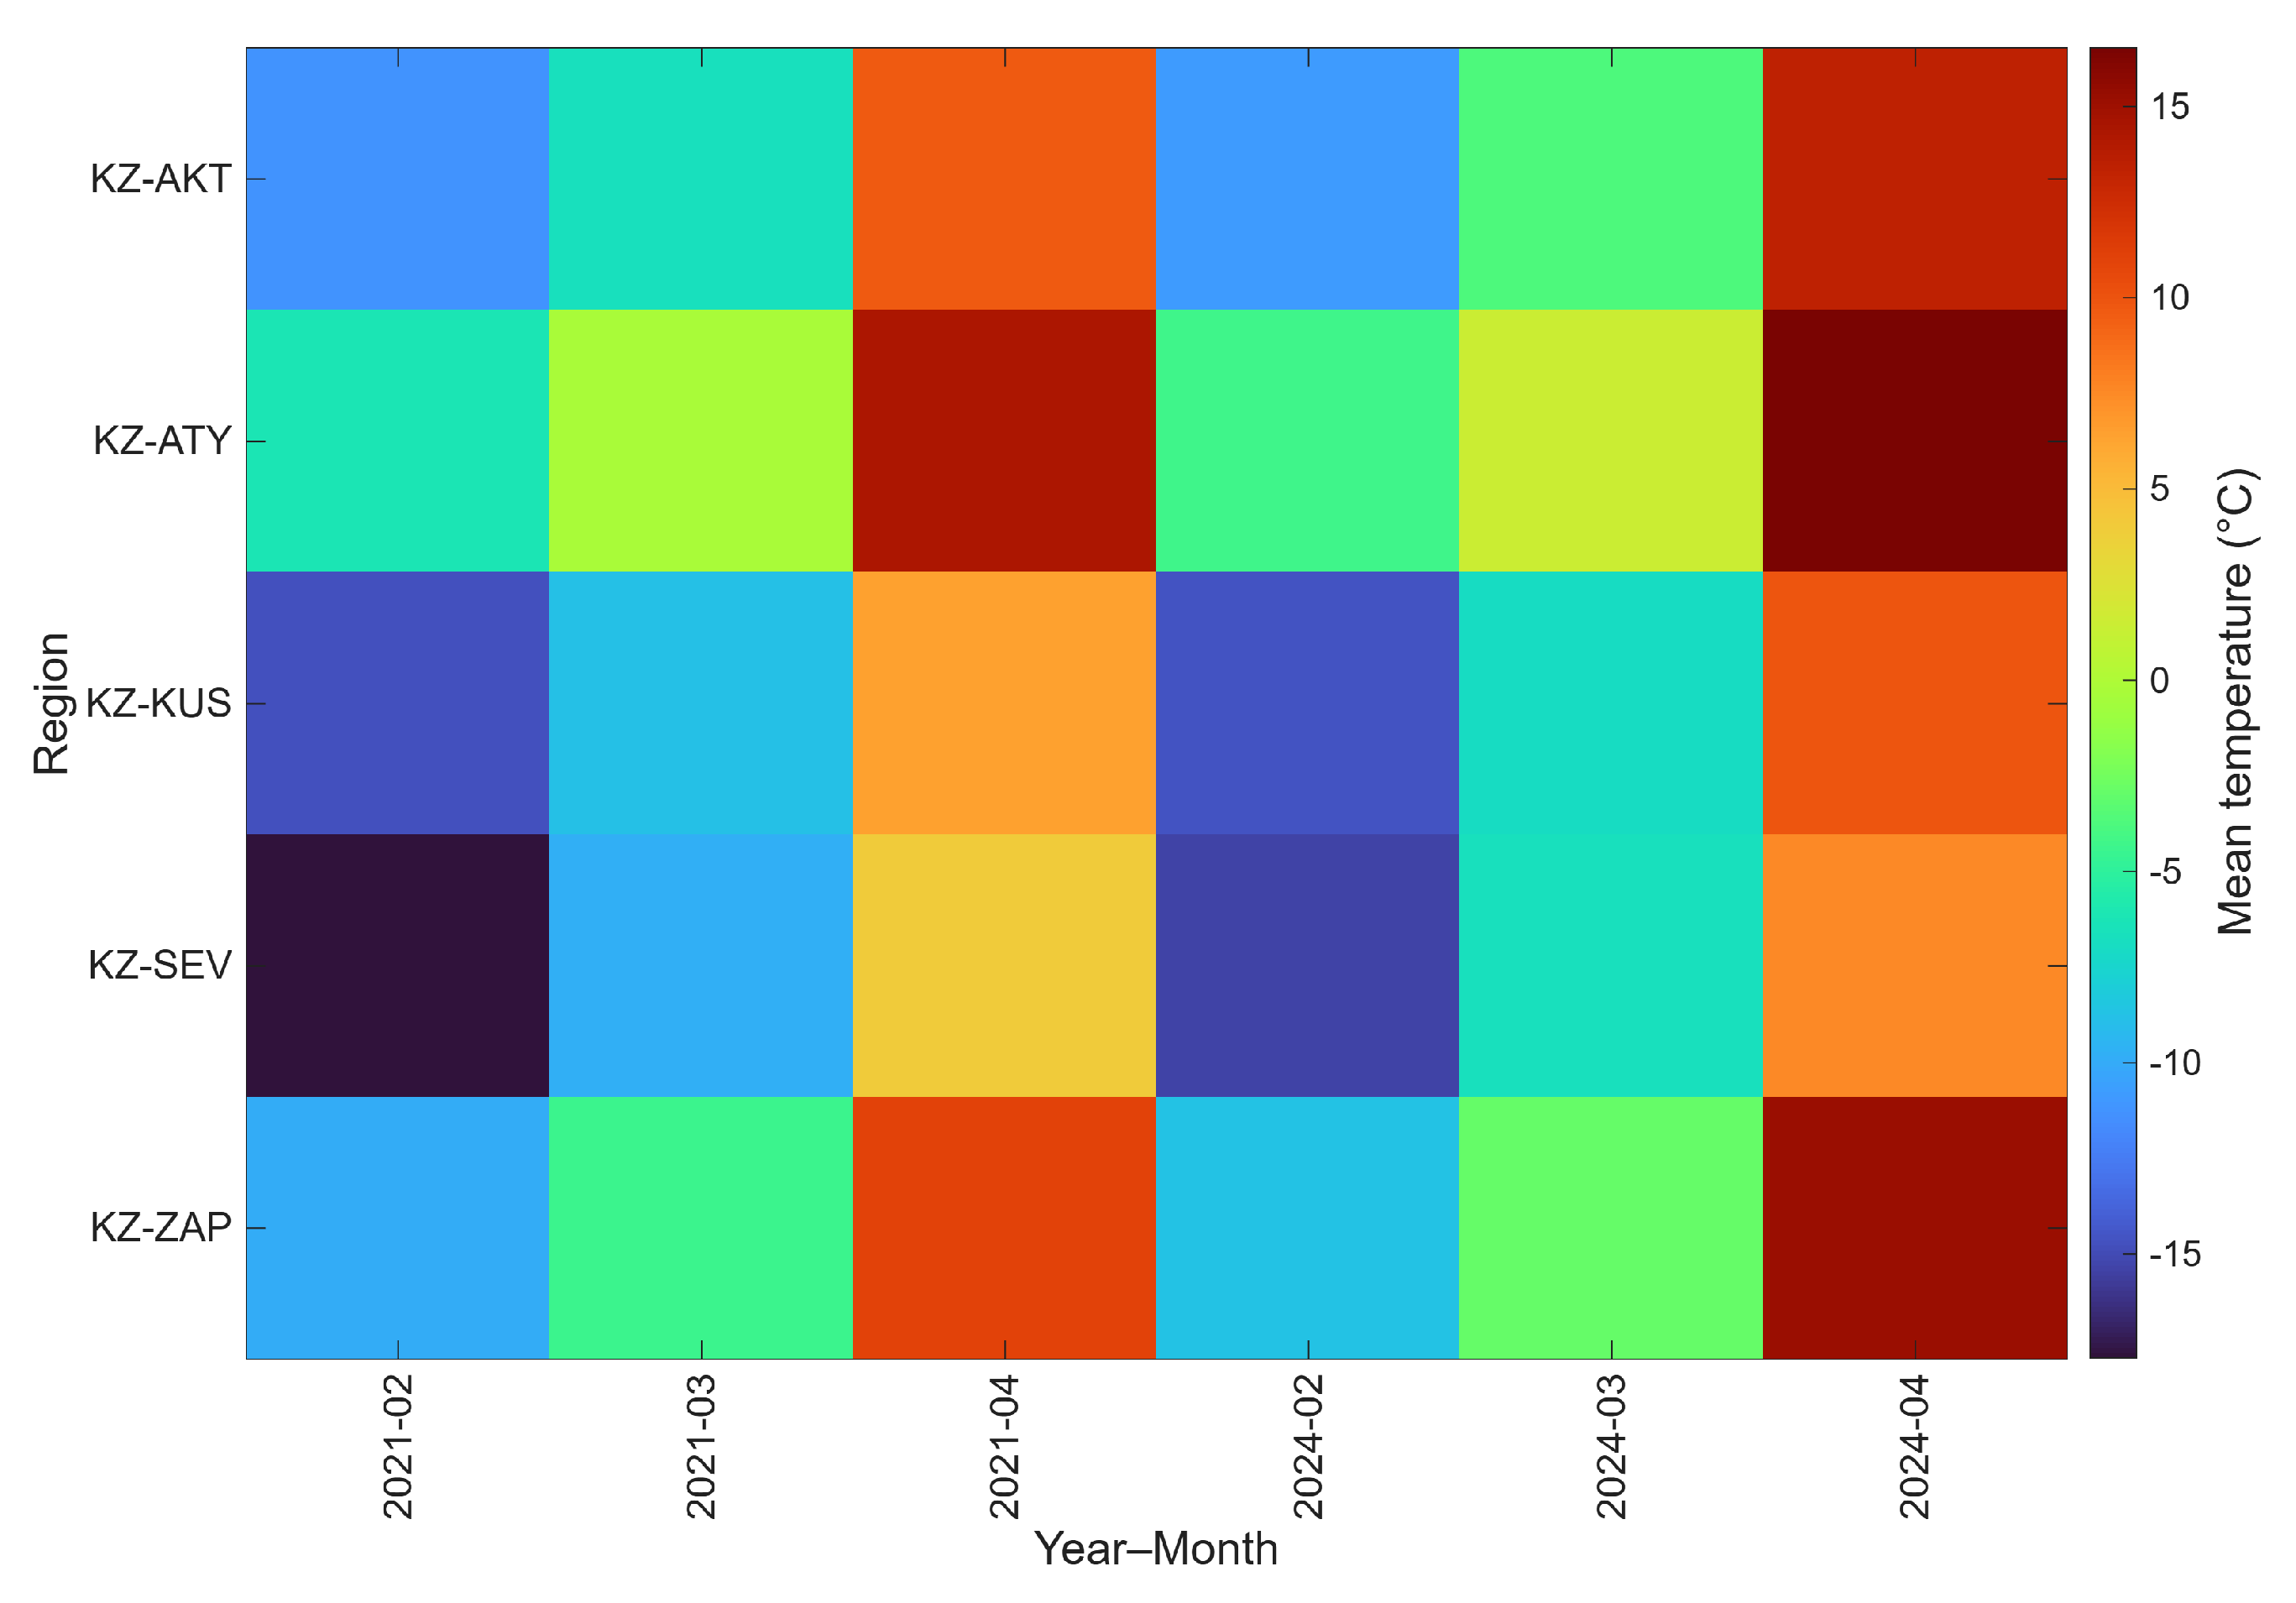
Figure 5.
Air heating rate (): 2021 vs 2024.
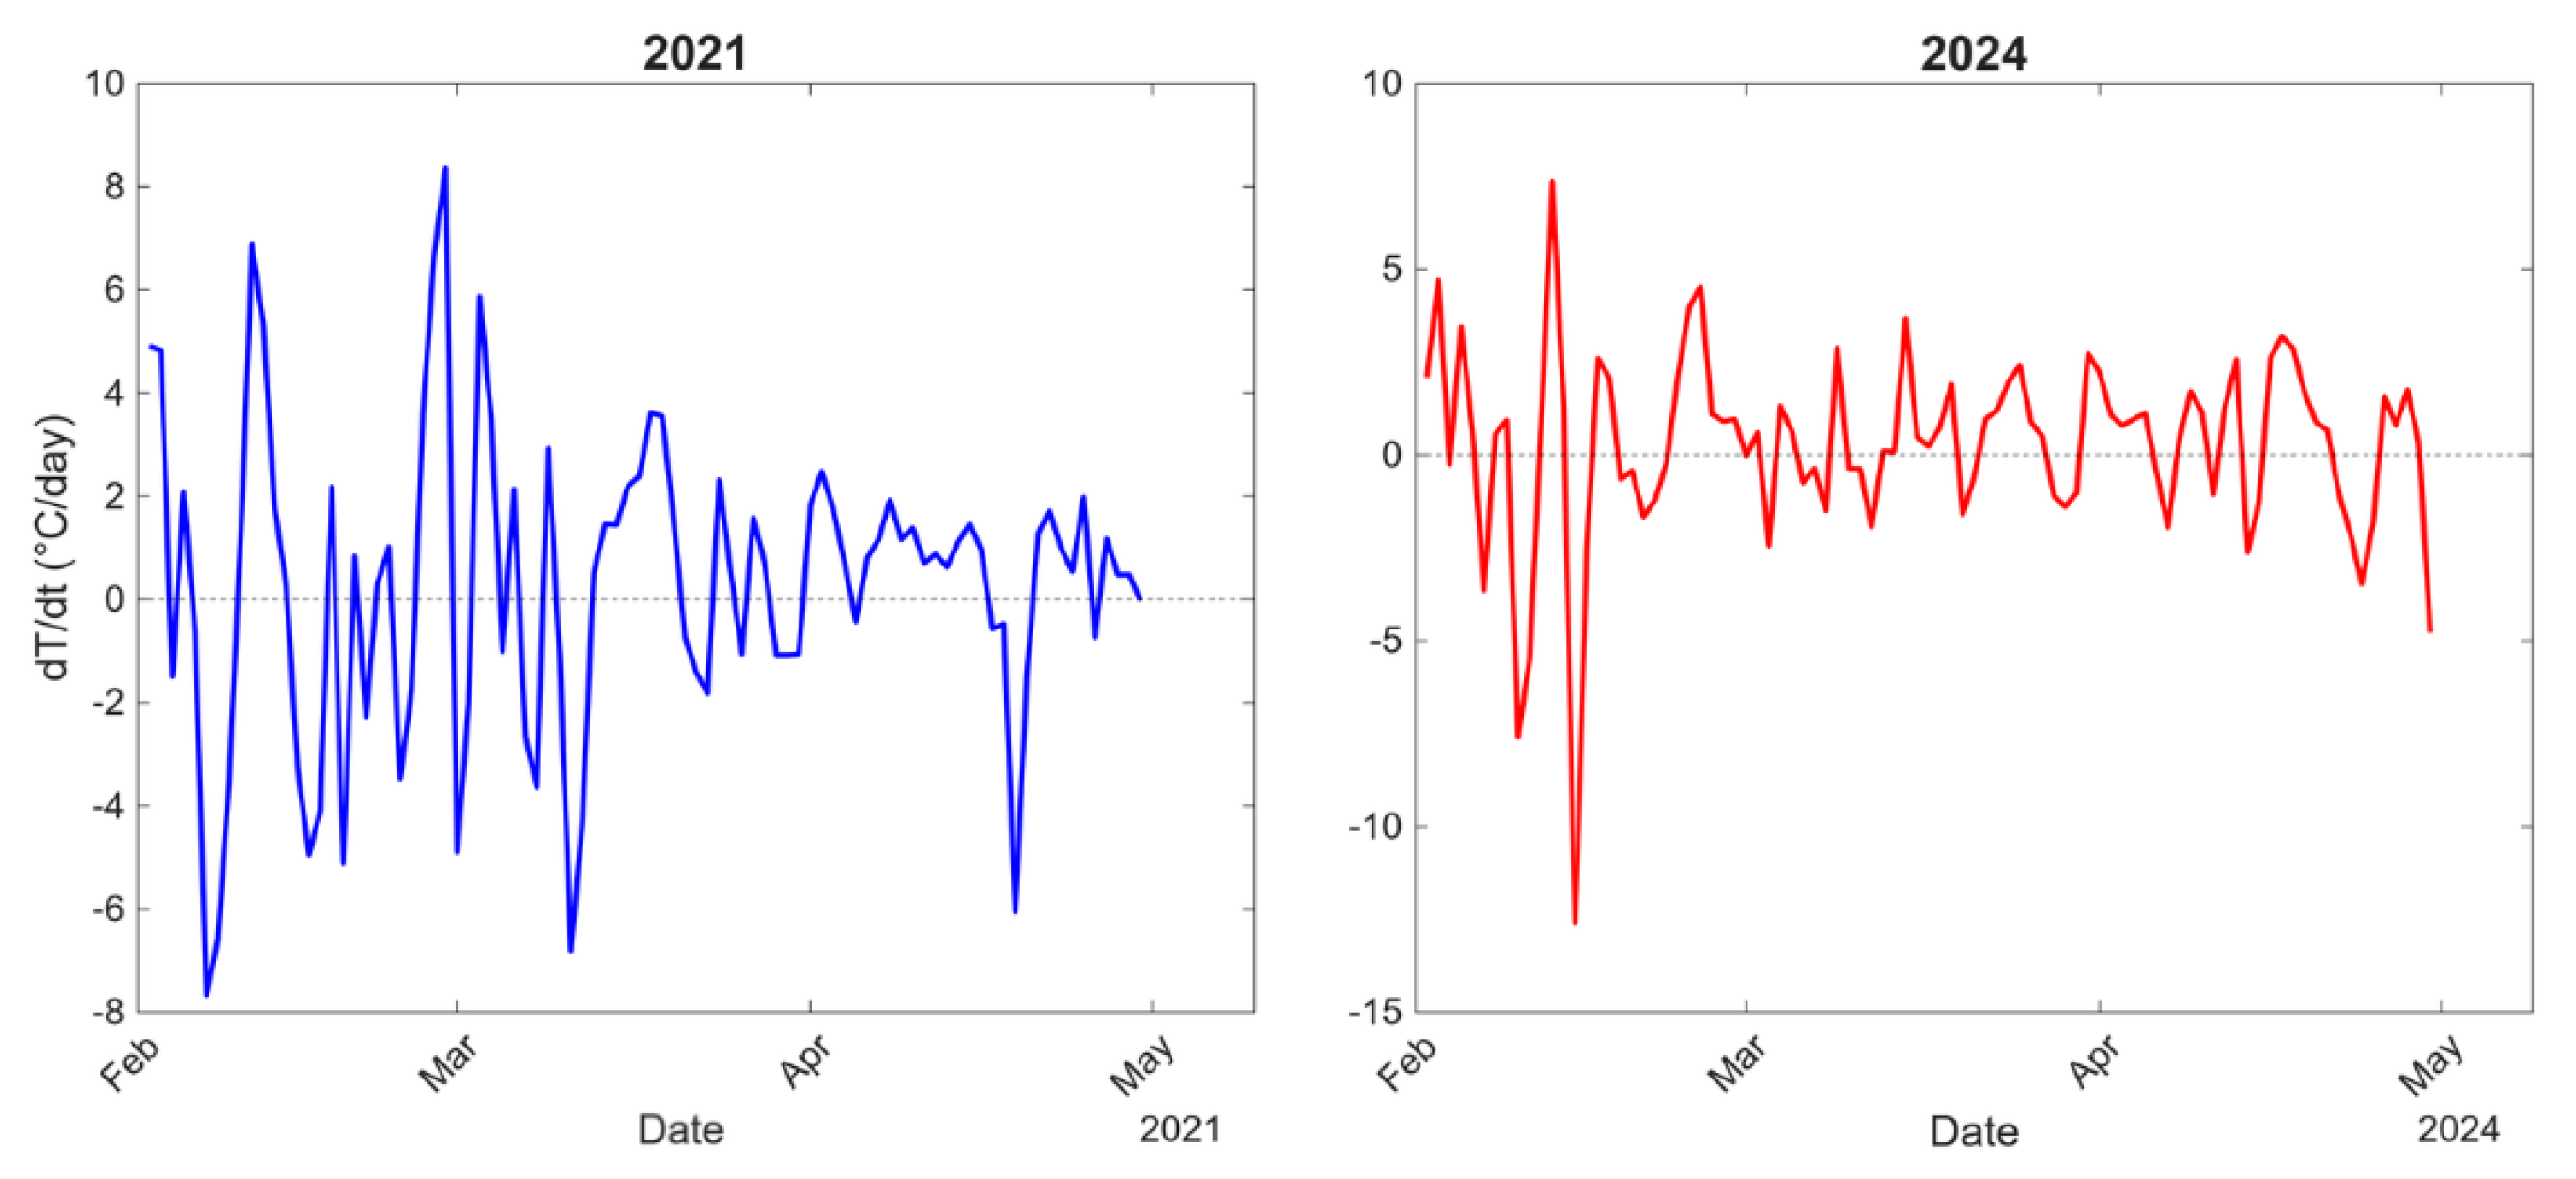
Figure 6.
Soil surface temperature: 2021 vs 2024.
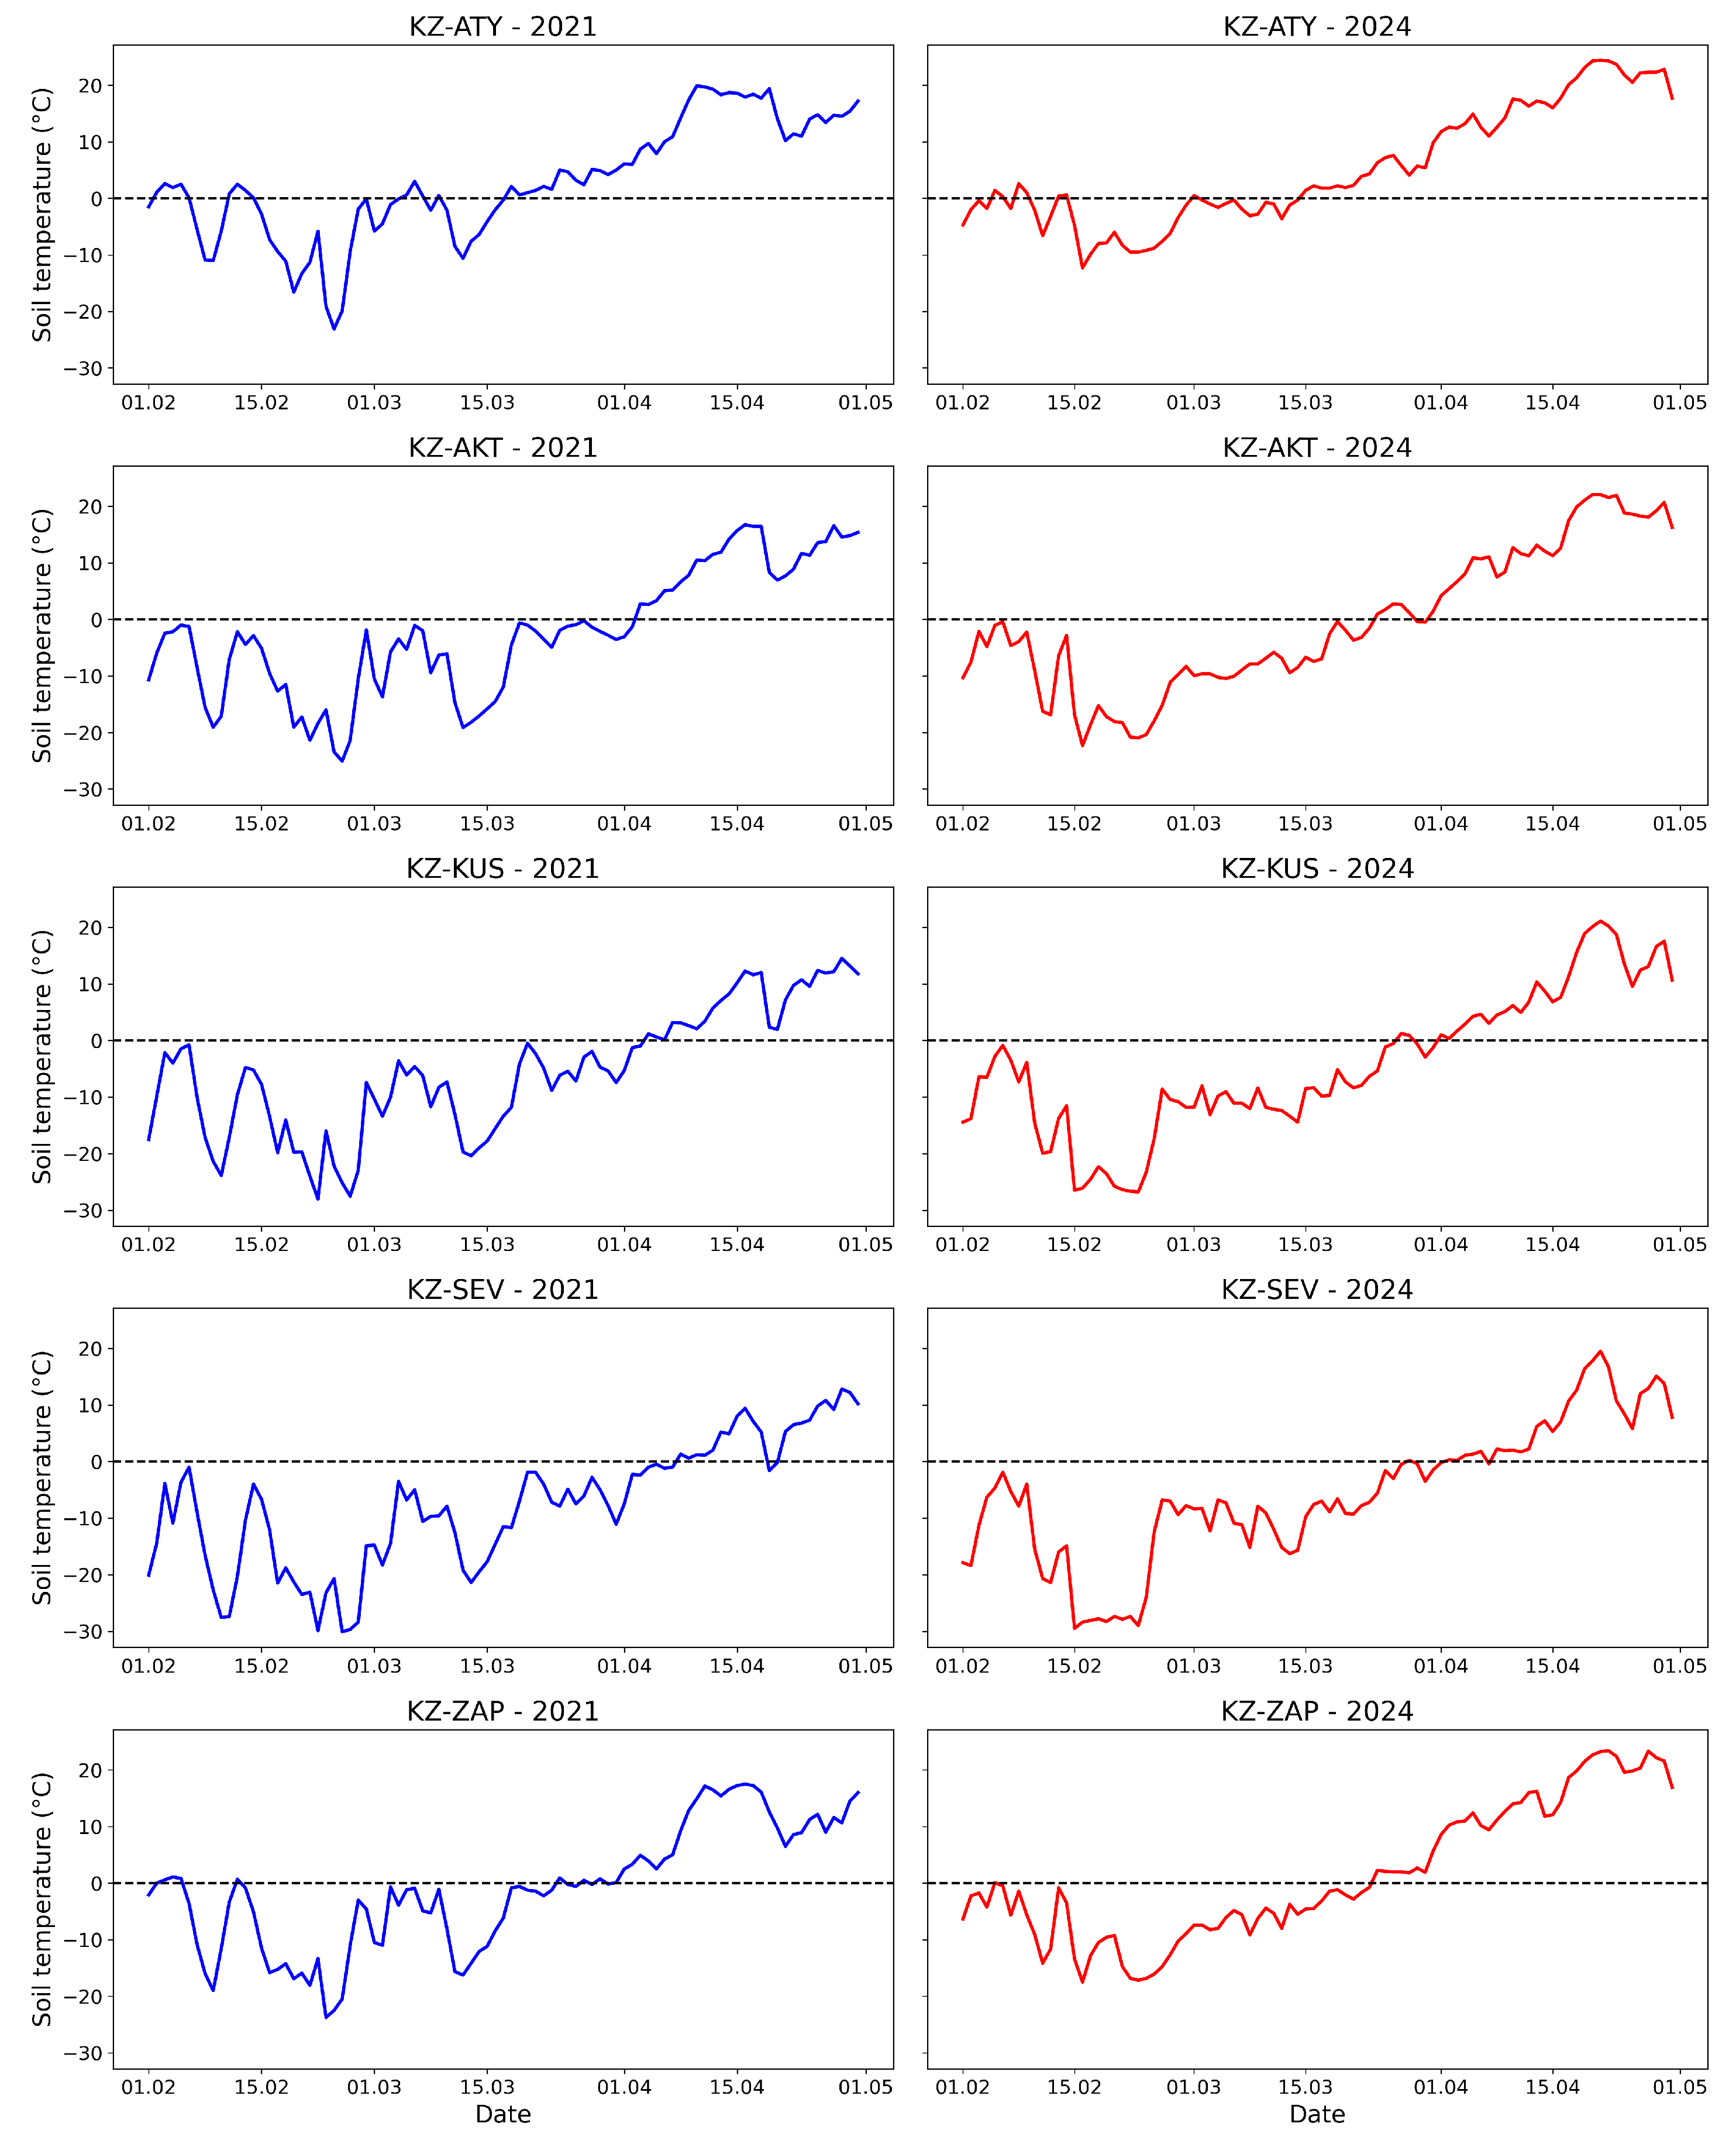
Figure 7.
Soil surface anomaly in 2024 vs 2021.
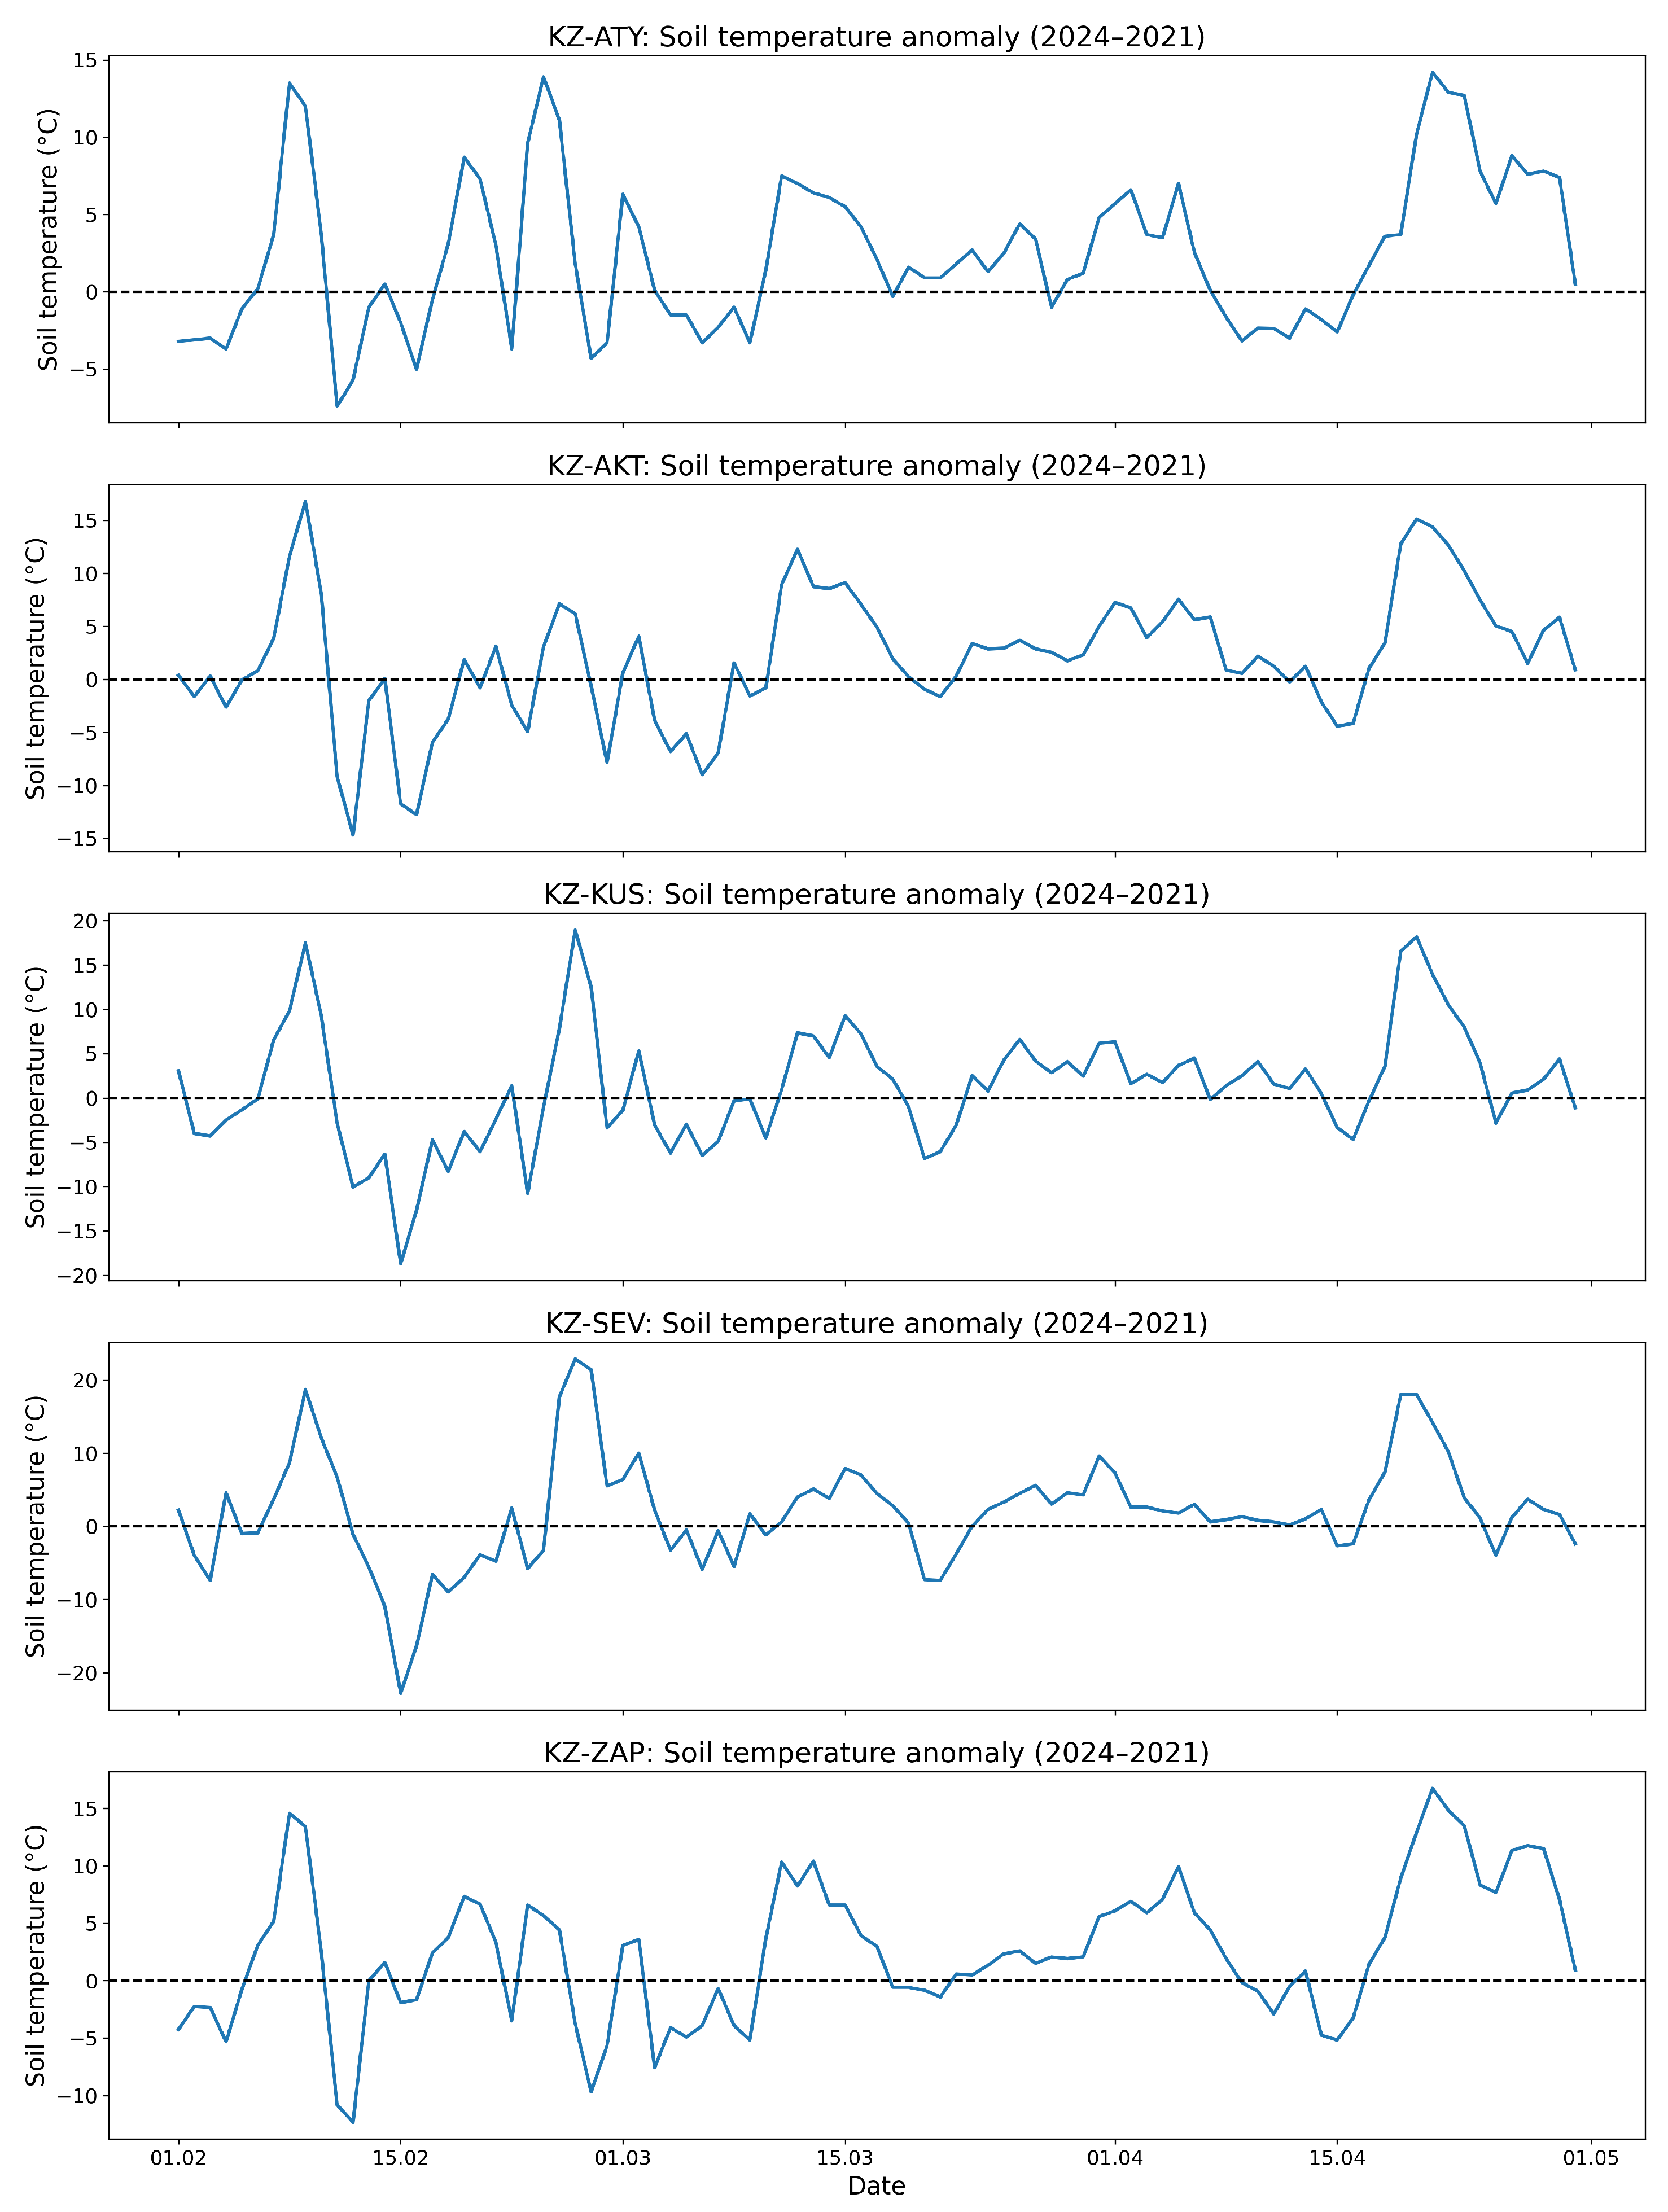
Figure 8.
Snow conditions in 2021 vs 2024.
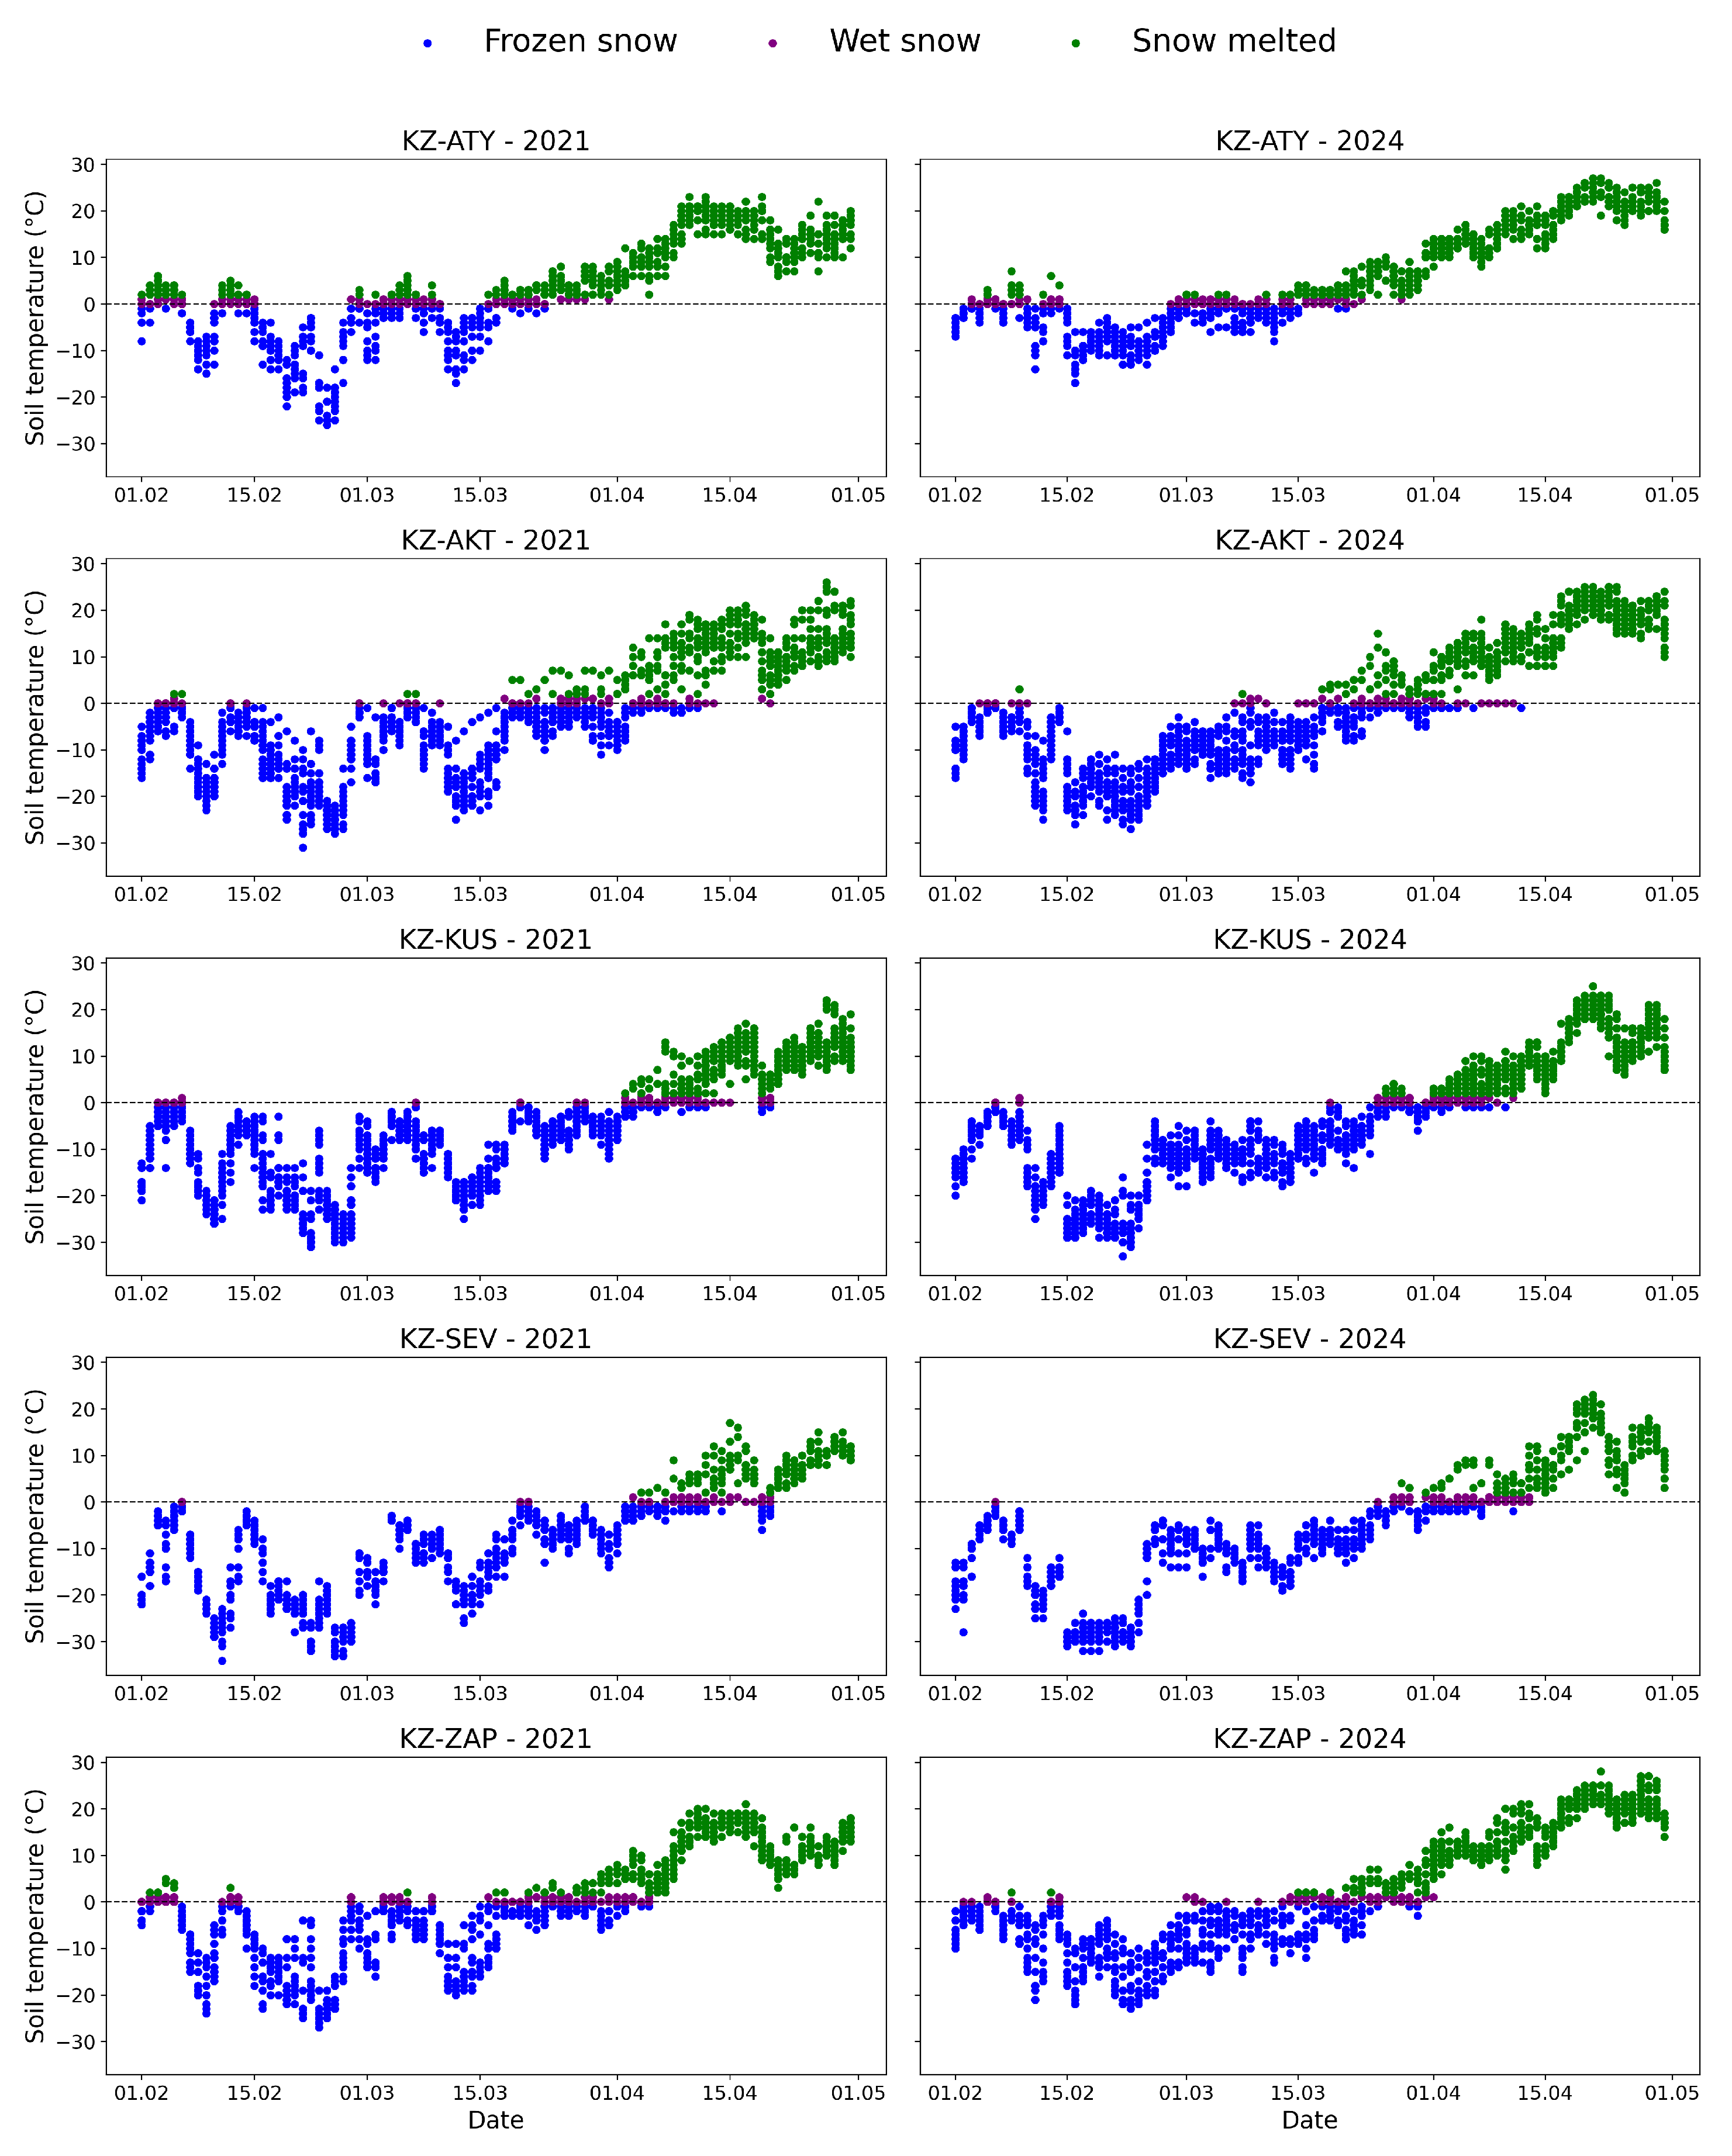
Figure 9.
Water reserves in the snow cover: 2021 vs 2024.
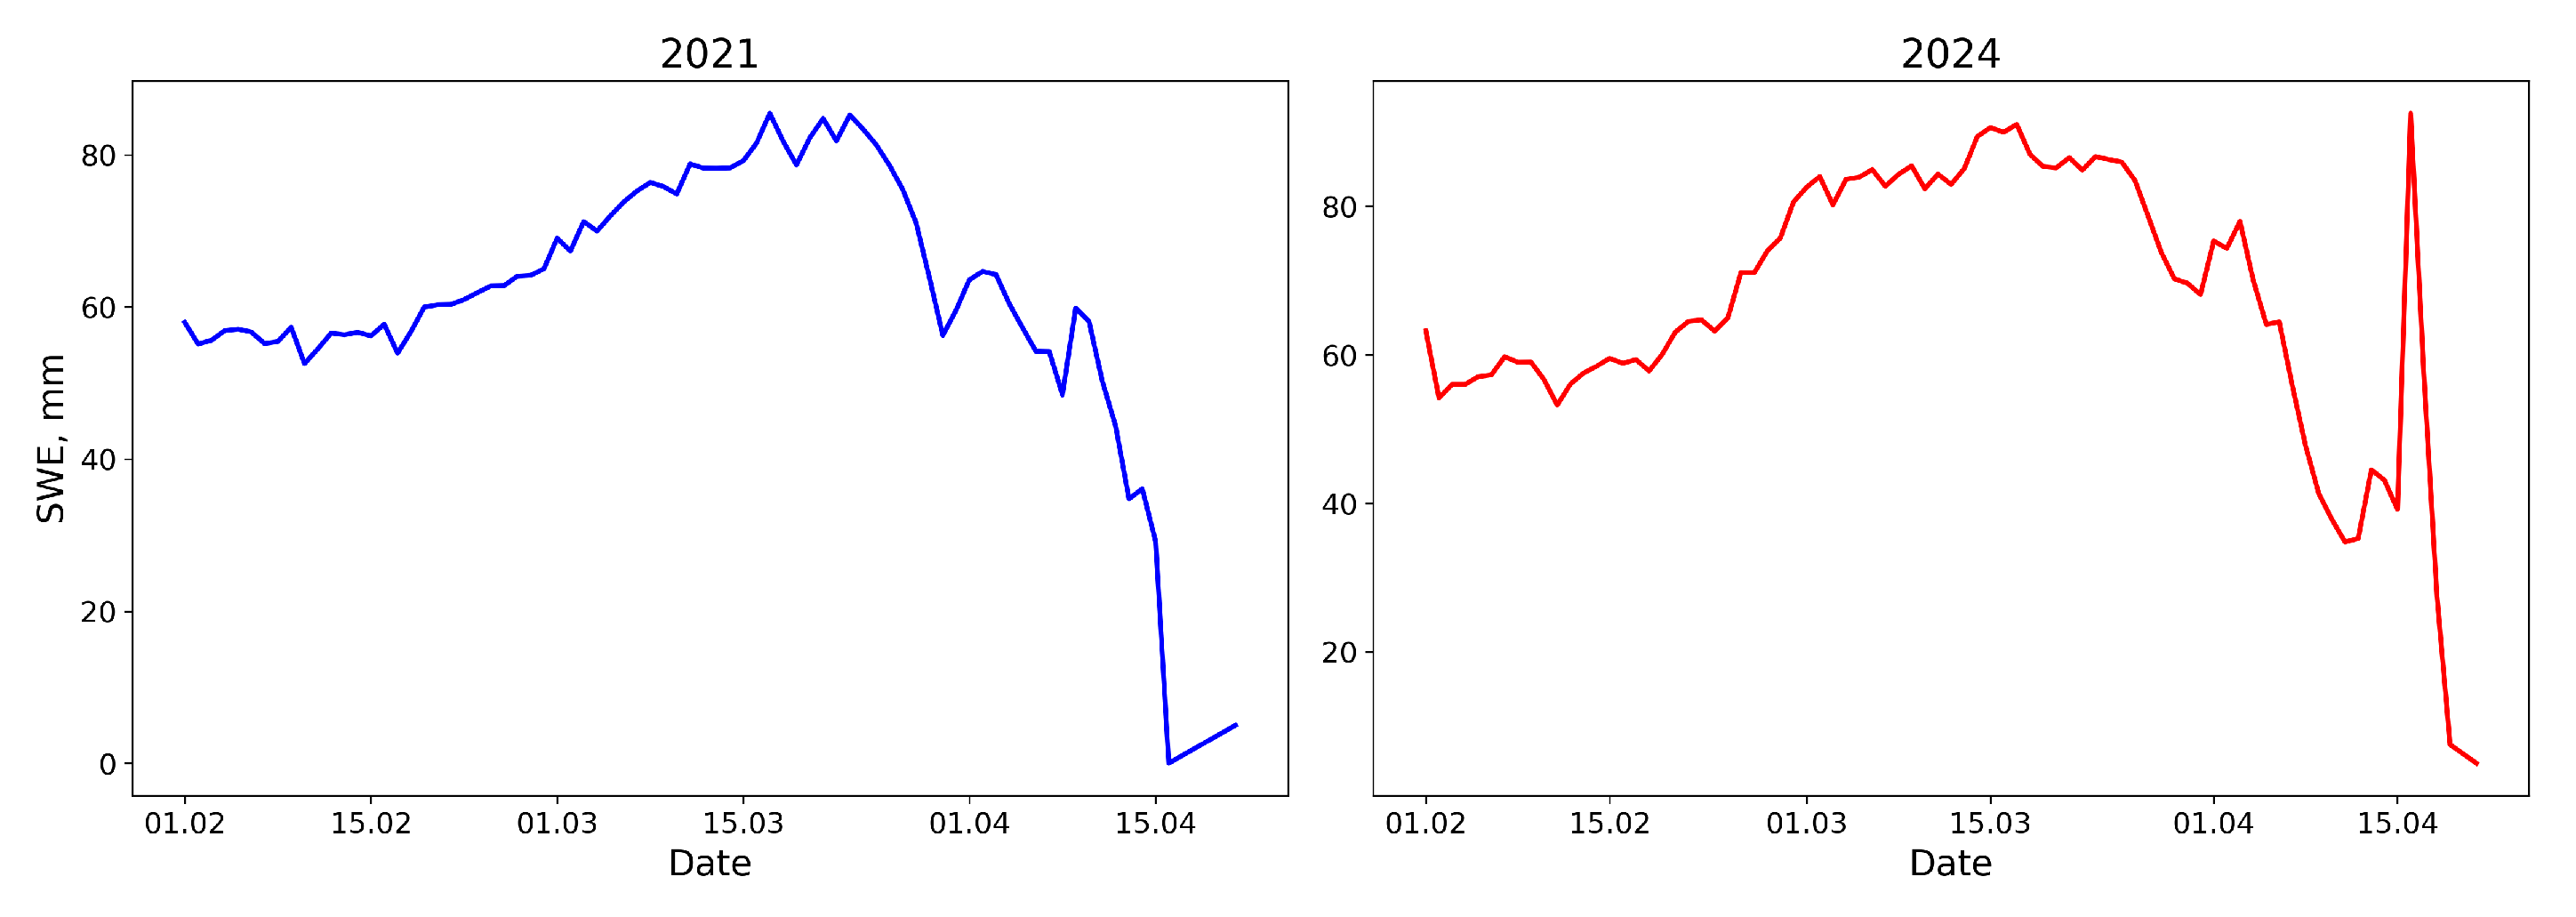
Figure 10.
SWE anomaly by day of the year (2024-2021).
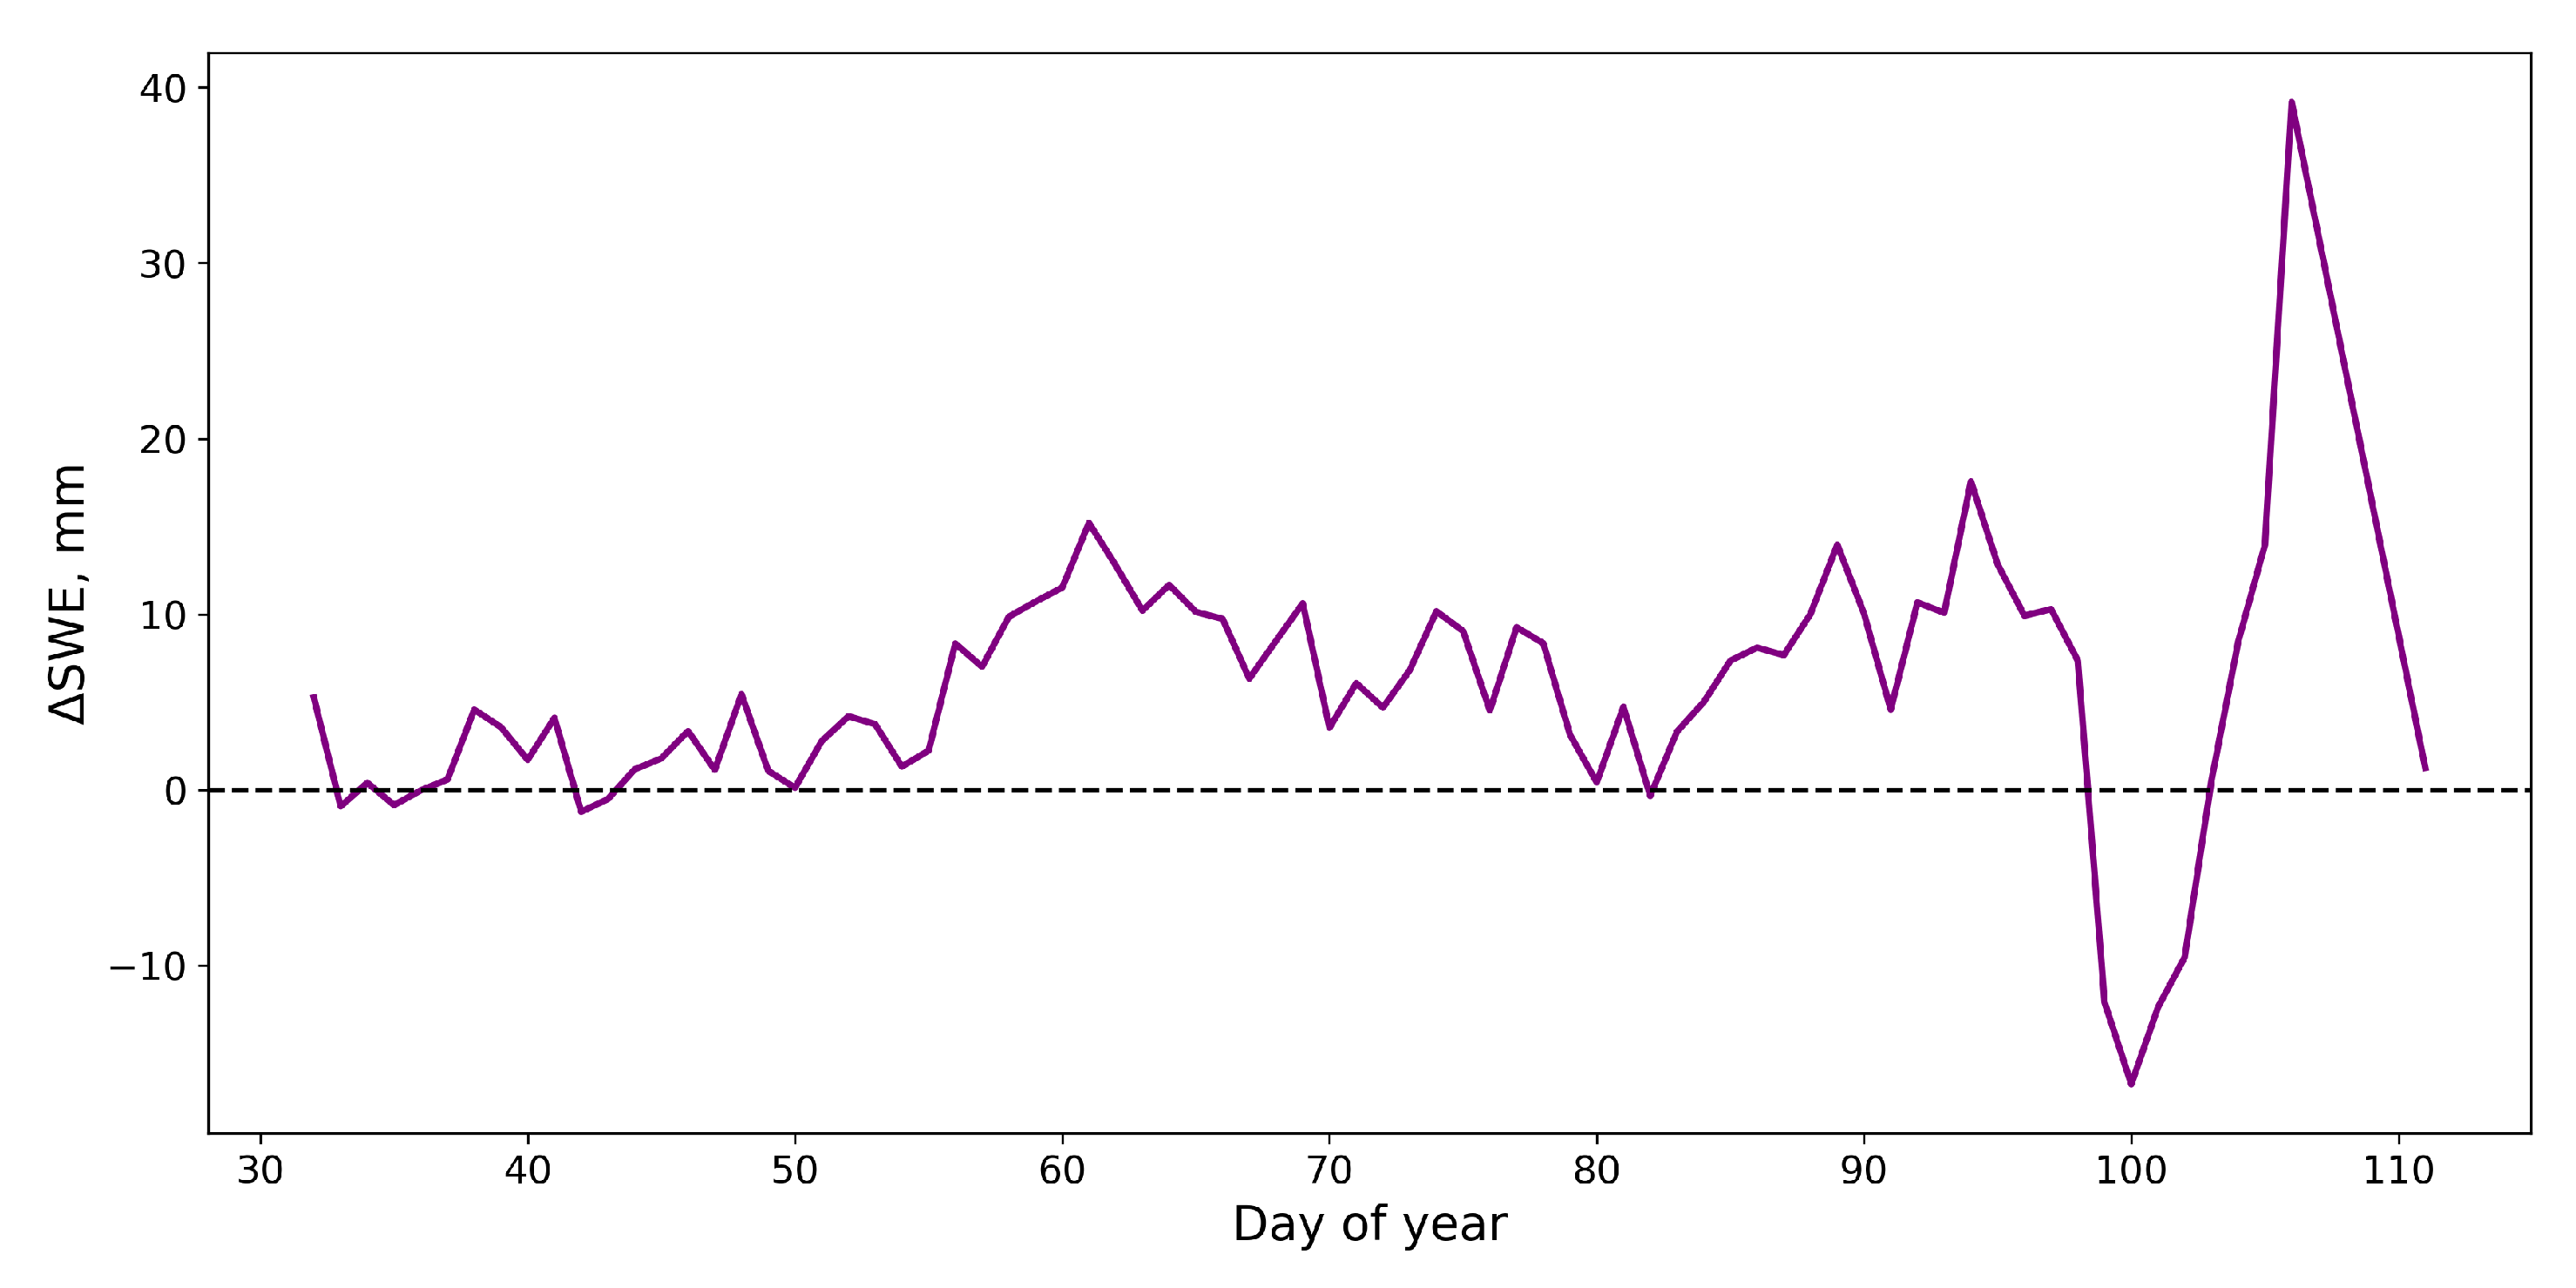
Figure 11.
Conceptual scheme of models.
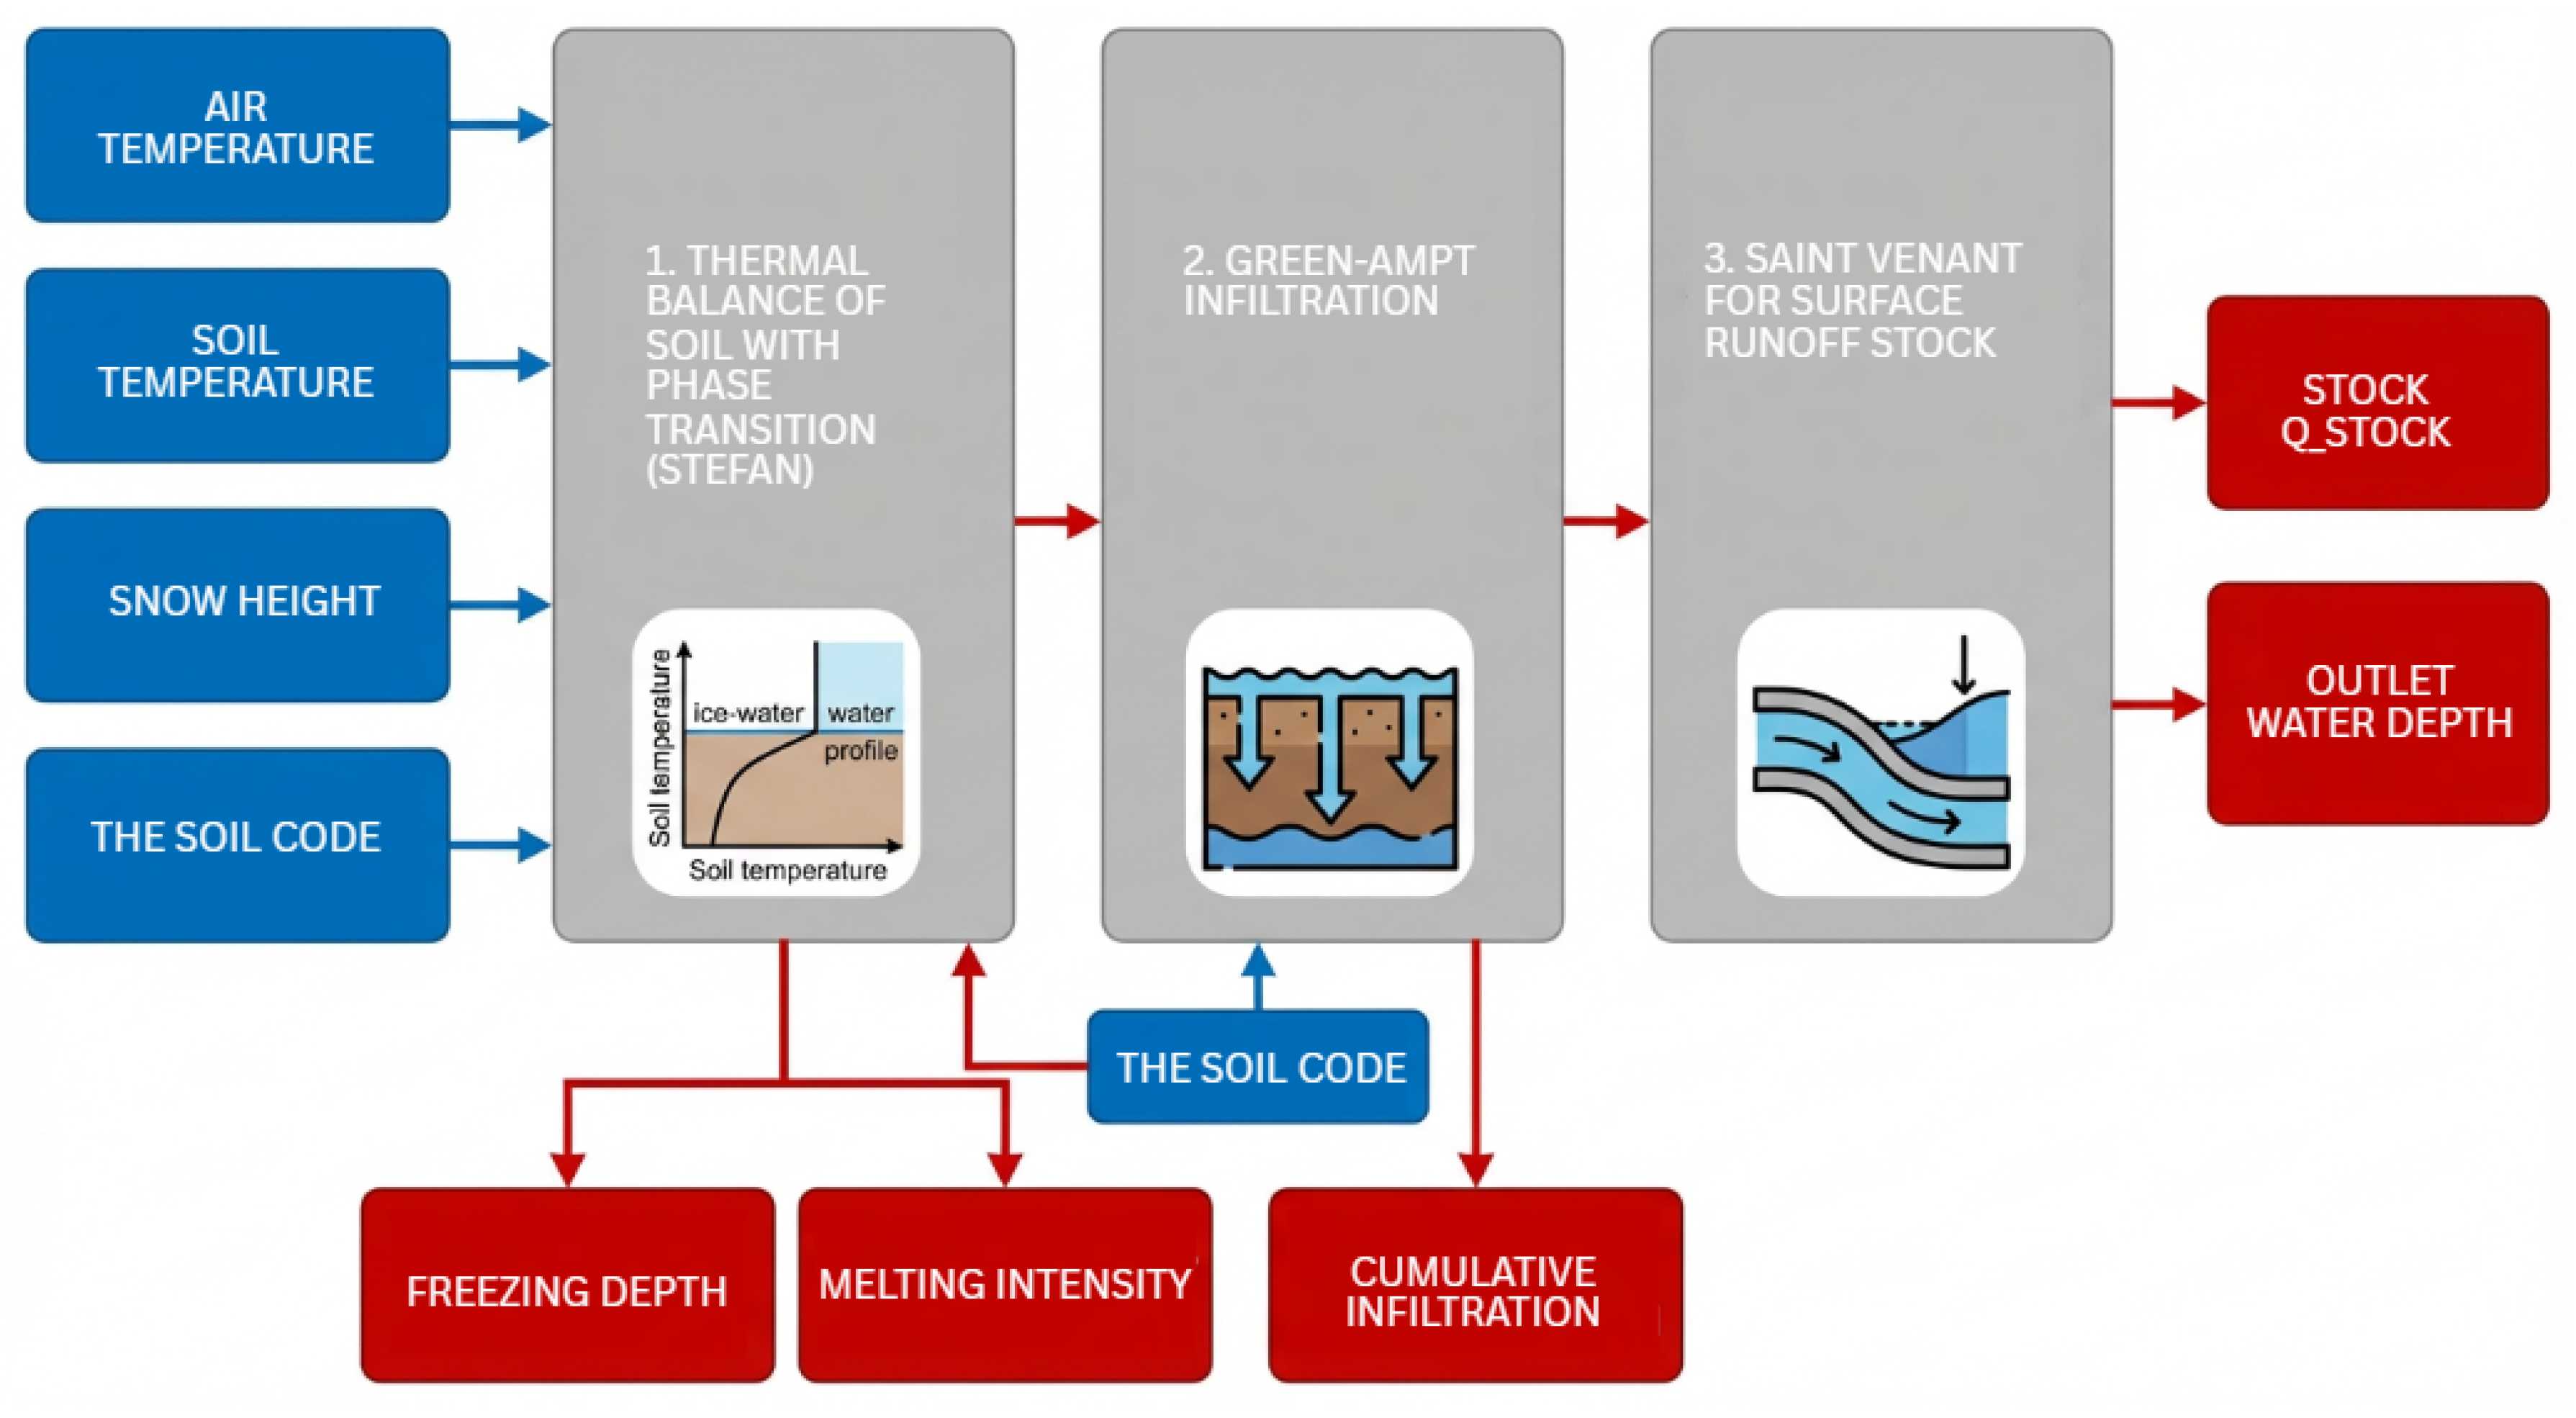
Figure 12.
1D thermal model of seasonal soil thawing. (a) Temperature profiles at depths of 0, 0.1, 0.3 and 0.5 m . (b) Depth of 0°C in the soil. (c) Melting, infiltration and surface runoff. (d) Heat map of the temperature distribution T(z,t).
Figure 12.
1D thermal model of seasonal soil thawing. (a) Temperature profiles at depths of 0, 0.1, 0.3 and 0.5 m . (b) Depth of 0°C in the soil. (c) Melting, infiltration and surface runoff. (d) Heat map of the temperature distribution T(z,t).
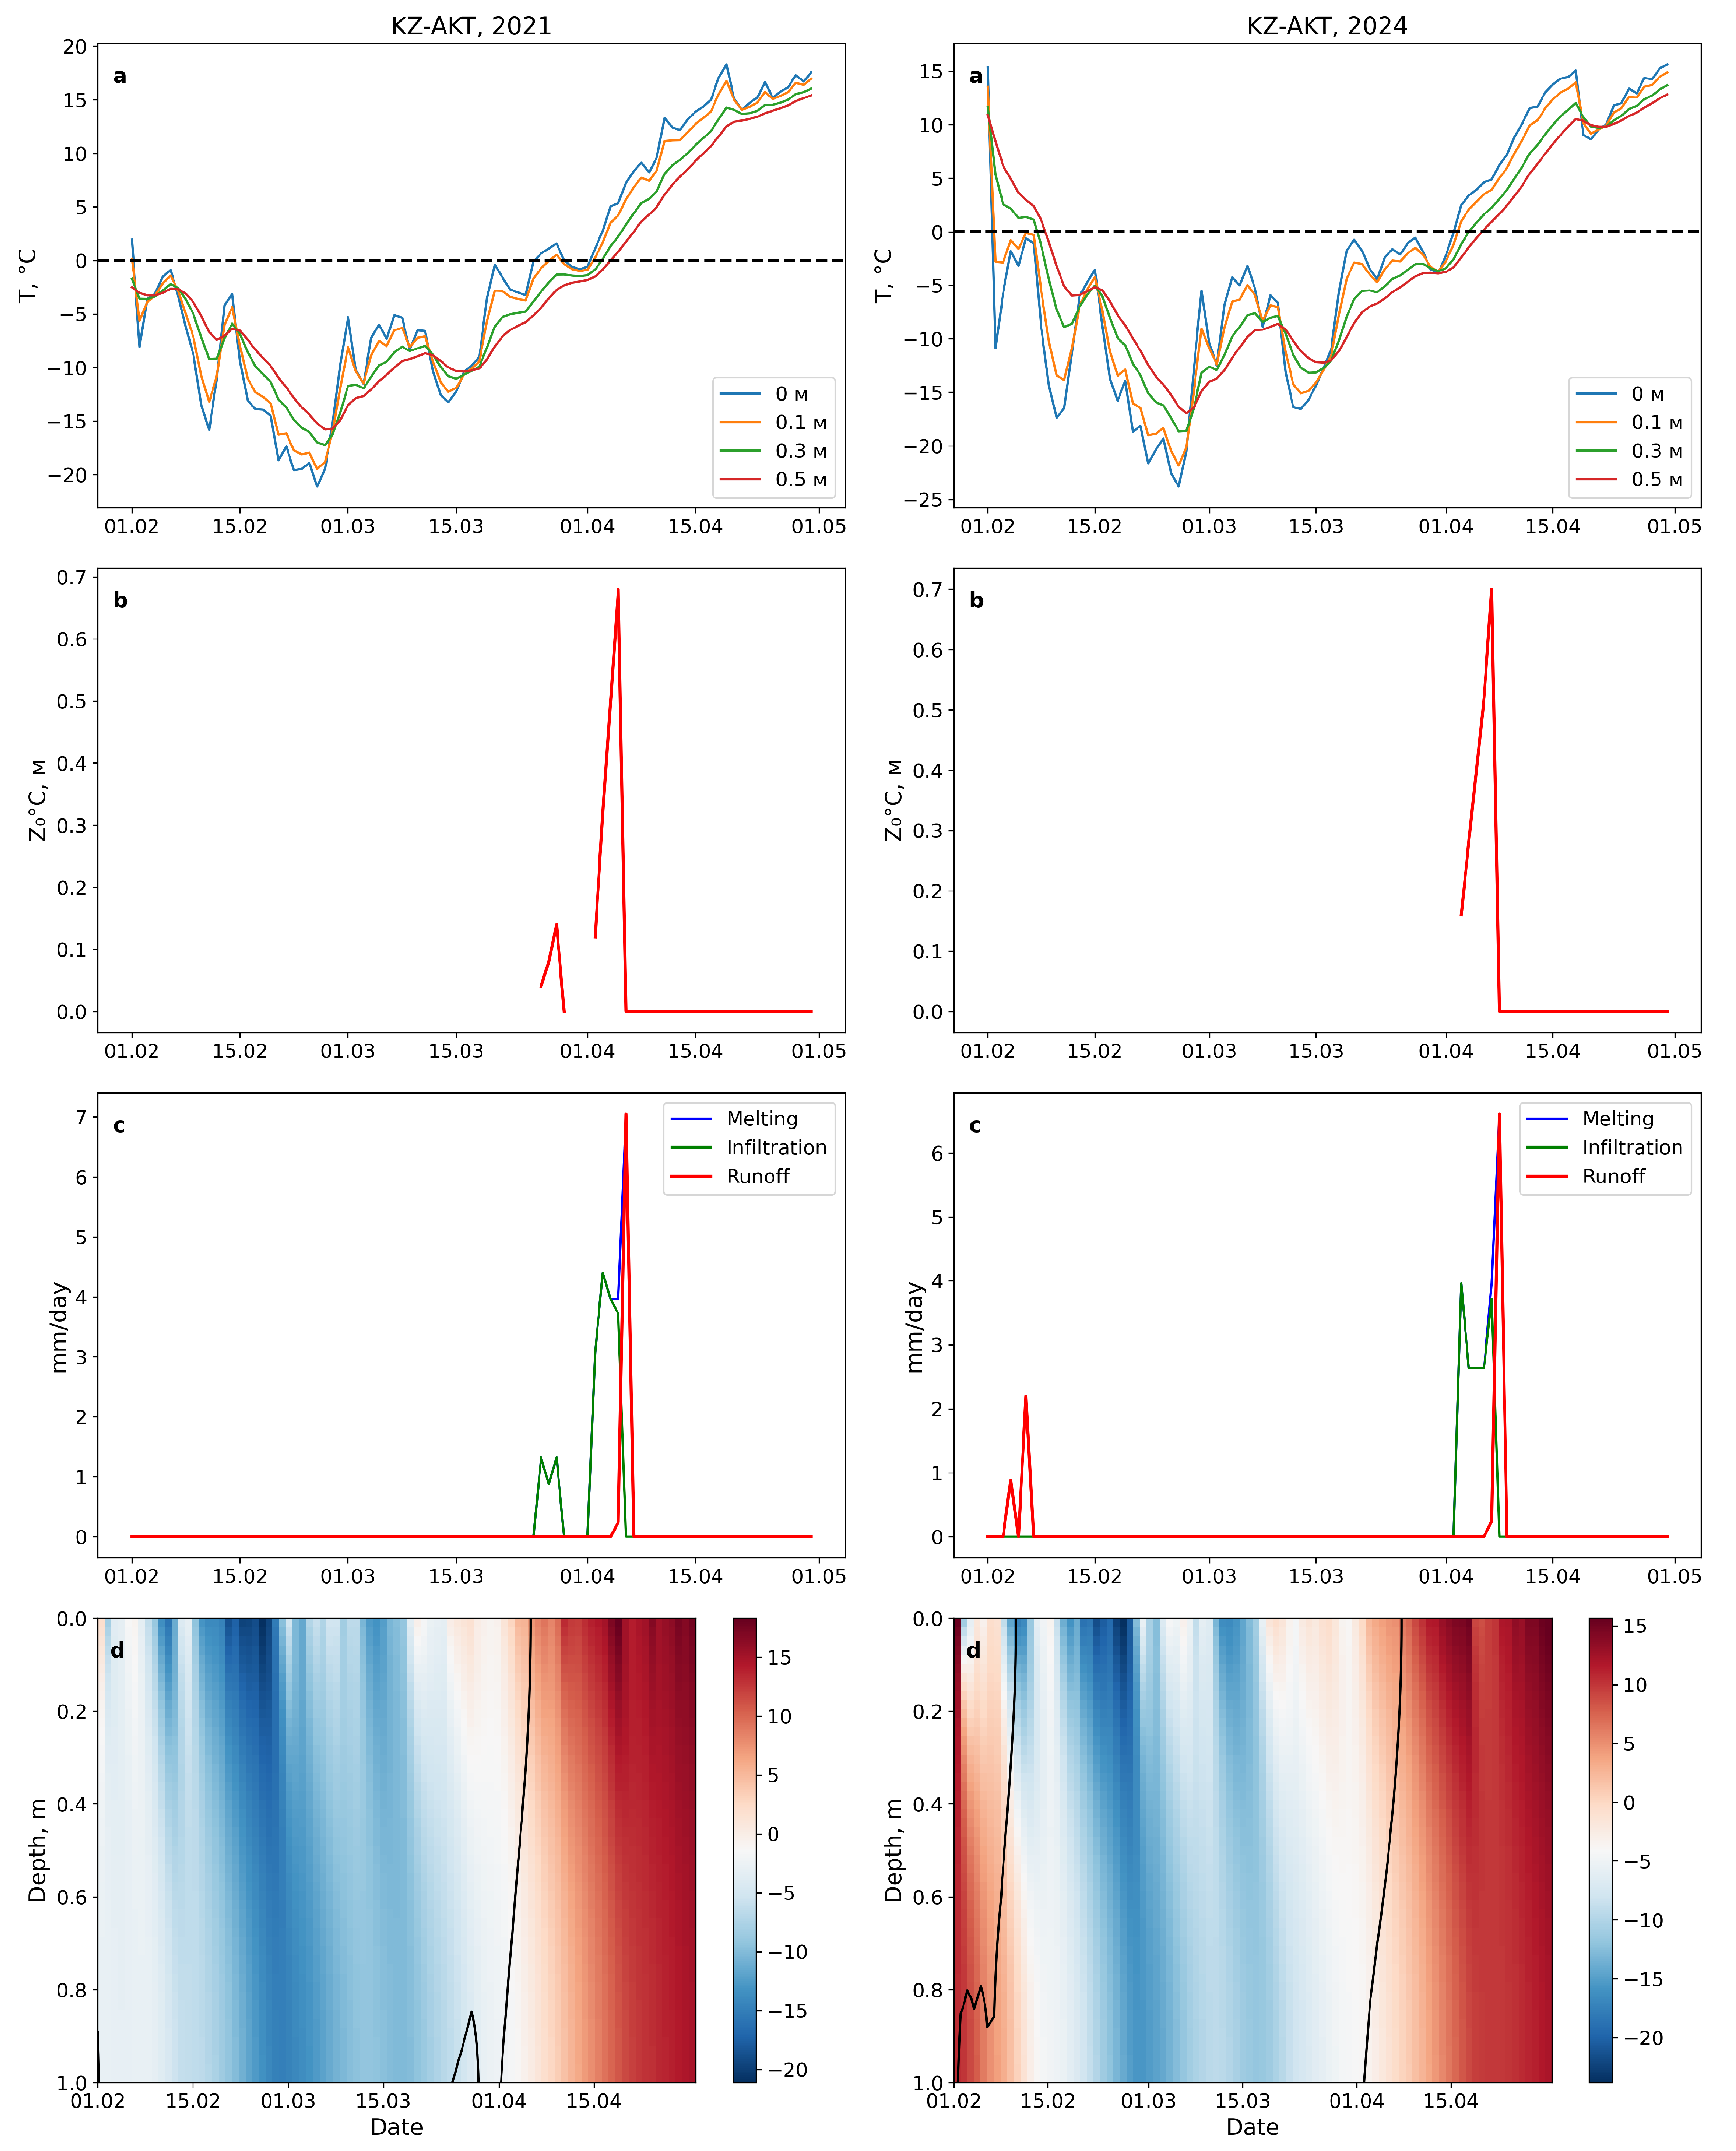
Figure 13.
Results of numerical modeling using Saint-Venant equations for Aktobe region (2021 and 2024). (a) Temporal dynamics of water depth and flow rate during the flood period. (b) The spatiotemporal spread of the water depth along the slope.
Figure 13.
Results of numerical modeling using Saint-Venant equations for Aktobe region (2021 and 2024). (a) Temporal dynamics of water depth and flow rate during the flood period. (b) The spatiotemporal spread of the water depth along the slope.
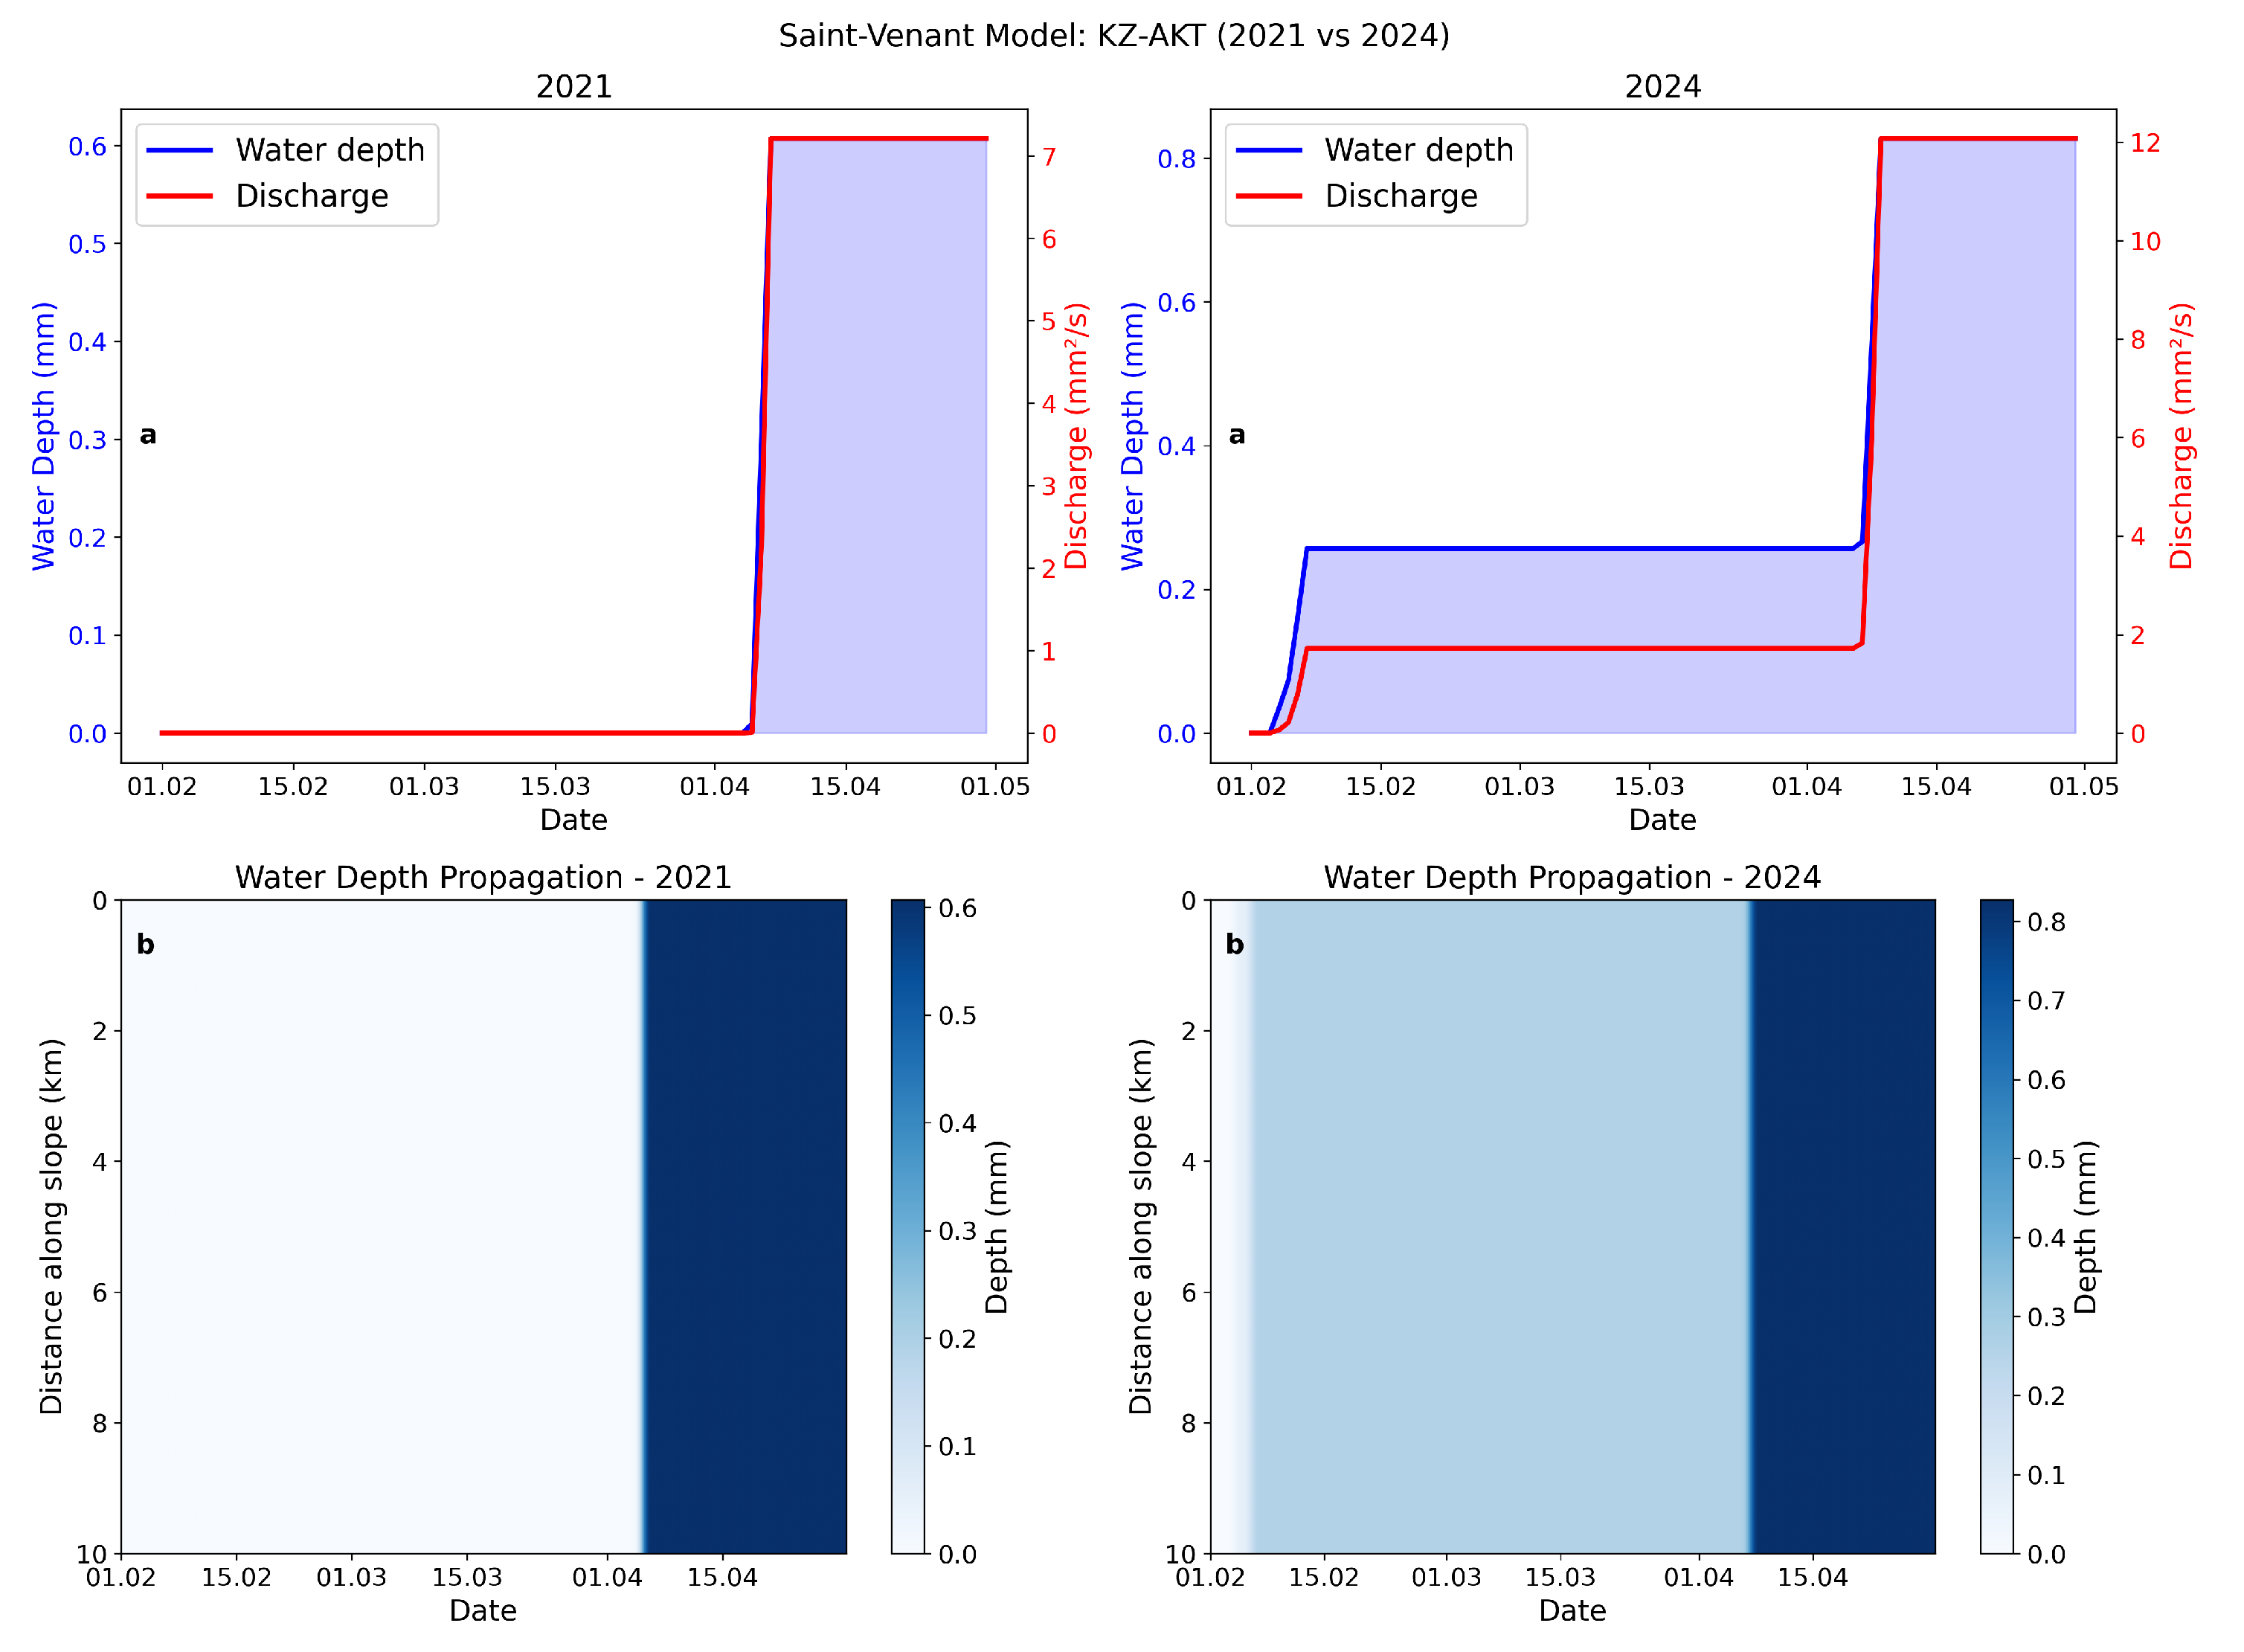

Table 1.
The first melting dates are in 2021 and 2024 (only parts of the data are shown).
| Region | Station | First thaw date 2021 | First thaw date 2024 |
| KZ-AKT | Aktobe | 2021-04-09 | 2024-02-05 |
| KZ-AKT | Ayakkum | 2021-02-05 | 2024-02-03 |
| KZ-AKT | Ilyinskiy | 2021-04-04 | 2024-02-05 |
| KZ-AKT | Irgiz | 2021-03-26 | 2024-02-05 |
| KZ-AKT | Karabutak | 2021-04-10 | 2024-02-06 |
| ... | |||
| KZ-ZAP | Uralsk | 2021-02-03 | 2024-02-03 |
| KZ-ZAP | Urda | 2021-02-09 | 2024-02-05 |
| KZ-ZAP | Chapaevo | 2021-02-11 | 2024-02-05 |
| KZ-ZAP | Chingirlau | 2021-02-09 | 2024-02-05 |
| KZ-ZAP | Yanvartsevo | 2021-02-12 | 2024-02-05 |
Table 2.
Average air temperature for the months of 2021 and 2024.
| Region | Month | 2021 (°C) | 2024 (°C) |
| KZ-AKT | 2 | -11.2 | -10.8 |
| KZ-AKT | 3 | -6.7 | -3.8 |
| KZ-AKT | 4 | 9.7 | 13.4 |
| KZ-ATY | 2 | -6.2 | 2.2 |
| KZ-ATY | 3 | -0.2 | 1.5 |
| KZ-ATY | 4 | 14.3 | 16.5 |
| KZ-KUS | 2 | -14.8 | -14.5 |
| KZ-KUS | 3 | -8.9 | -6.9 |
| KZ-KUS | 4 | 6.4 | 8.6 |
| KZ-SEV | 2 | -17.7 | -15.4 |
| KZ-SEV | 3 | -9.8 | -6.7 |
| KZ-SEV | 4 | 4.0 | 7.5 |
| KZ-ZAP | 2 | -9.8 | -8.7 |
| KZ-ZAP | 3 | -4.4 | 2.9 |
| KZ-ZAP | 4 | 11.0 | 15.1 |
Table 3.
TOP 10 sudden temperature spikes (°C/day).
| Region | Station | Jump 2021 | Region | Station | Jump 2024 |
| KZ-KUS | Kushmurun | 20 | KZ-AKT | Kos-Istek | 16,4 |
| KZ-KUS | Karasu | 19 | KZ-ZAP | Yanvartsevo | 16 |
| KZ-KUS | Tobol | 18 | KZ-AKT | Ilyinsky | 15,2 |
| KZ-KUS | Sarykol | 18 | KZ-ZAP | Kamenka | 14,9 |
| KZ-KUS | Karamendy | 18 | KZ-AKT | Aktobe | 14,7 |
| KZ-SEV | Ruzaevka | 18 | KZ-ZAP | Uralsk | 14,7 |
| KZ-KUS | Torgay | 18 | KZ-AKT | Rodnikovka | 14,7 |
| KZ-KUS | Rudny | 18 | KZ-ZAP | Chingirlau | 14,4 |
| KZ-KUS | Amangeldy | 17 | KZ-SEV | Petropavlovsk | 13,6 |
| KZ-SEV | Saumalkol | 17 | KZ-ZAP | Aksai | 13,5 |
Table 4.
Physical and geographical parameters of the regions of Northern and Western Kazakhstan.
| Region | Height (m) | Slope S | Manning n | Relief type | Land cover |
| KZ-SEV | 150–200 | 0.002 | 0.032 | Flat plain | Forest-steppe, grassland |
| KZ-KUS | 150–270 | 0.003 | 0.030 | Hilly plain | Steppe, sparse cover |
| KZ-AKT | 200–300 | 0.002 | 0.027 | Plateau | Semi-desert |
| KZ-ATY | 150–170 | 0.0008 | 0.023 | Lowland | Desert, semi-desert |
| KZ-ZAP | 150–200 | 0.0015 | 0.028 | Undulating plain | Grass steppe |
Table 5.
Surface runoff formed as a result of melting
| Region | 2021 | 2024 | 2021 | 2024 |
| KZ-AKT | 7.3 | 9.9 | 0.7 | 0.7 |
| KZ-ATY | 7.0 | 4.0 | 0.7 | 0.8 |
| KZ-KUS | 7.5 | 7.6 | 0.7 | 0.7 |
| KZ-SEV | 9.7 | 9.7 | 0.7 | 0.8 |
| KZ-ZAP | 4.4 | 7.0 | 0.8 | 0.7 |
Disclaimer/Publisher’s Note: The statements, opinions and data contained in all publications are solely those of the individual author(s) and contributor(s) and not of MDPI and/or the editor(s). MDPI and/or the editor(s) disclaim responsibility for any injury to people or property resulting from any ideas, methods, instructions or products referred to in the content. |
© 2026 by the authors. Licensee MDPI, Basel, Switzerland. This article is an open access article distributed under the terms and conditions of the Creative Commons Attribution (CC BY) license (http://creativecommons.org/licenses/by/4.0/).
Copyright: This open access article is published under a Creative Commons CC BY 4.0 license, which permit the free download, distribution, and reuse, provided that the author and preprint are cited in any reuse.