

Submitted:
23 March 2026
Posted:
25 March 2026
You are already at the latest version
Abstract
(1) Background: Although technology constantly evolves and revolutionising many industries in this digital age, the healthcare industry is comparatively conservative and has been slow to adopt new technologies due to concerns about patient safety. Notwithstanding the abundance of research on technology acceptance, the majority of them fail to take into account departmental variations, making it impossible to enhance technology adoption in the medical sector. (2) Methods: This study examined the factors influencing Malaysian emergency department healthcare professionals' acceptance of new medical technology by combining two external variables, which are organisational support and training, with the Technology Acceptance Model (TAM). The target population of this study consisted of emergency department healthcare professionals in Malaysian hospitals who are 25 to 60 years old and above. A total of 140 valid questionnaires were gathered after the survey was sent by email and WhatsApp to hospital emergency departments around the country. Data collected were analysed using SPSS and SmartPLS. (3) Results: Perceived usefulness and training have a significant impact on attitude toward use, whereas attitude toward use is the sole variable that directly influences behavioural intention to use and acts as a mediator in certain paths. (4) Conclusion: To encourage the successful adoption and use of technology, hospital administration should focus on the real needs of medical personnel, enhance their knowledge of it, and provide focused training.
Keywords:
technology adoption
; influence factors
; medical technology
; emergency departments
; ED
; technology acceptance model
; TAM
; SPSS
; SmartPLS
1. Introduction
During the digital age, the rapid growth of technology has had a significant impact on nearly every aspect of society as it contributes to the digital revolution in several industries globally [1]. In addition to bringing convenience and efficiency into daily lives, this period has also fundamentally changed the way traditional industries have always been [2]. Though many industries have benefited greatly from the widespread adoption of technology, the healthcare industry faces more difficult and particular challenges while implementing technology [3]. Considering the medical industry deals directly with life and health, each new technology presented must be thoroughly researched and reviewed. This is because it directly affects the patient’s life safety and overall medical quality, in addition to having a significant influence on routine medical procedures. Therefore, the possible changes brought about by technology have caused the healthcare industry to be on edge and cautious [4].
This is due to the fact that the healthcare industry has a high-risk nature, which implies that any technical errors or malfunctions can have serious consequences, such as misdiagnosis, medical misconduct and so on [5]. These repercussions might endanger the patient’s life [6]. Therefore, new technologies must be thoroughly evaluated before being introduced in the healthcare industry in order to guarantee their dependability and safety. Furthermore, professionals in the healthcare industry, including physicians and nurses, are often used to certain processes and procedures. Hence, the introduction of new technologies has the potential to disrupt their routines, which might provide difficulties with adaptation and even lead to resistance, especially if these technologies increase their workload or change the way they have always [7].
In contrast to other industries, the use of technology in the healthcare industry must demonstrate not only that it can assist in increasing productivity and saving costs, but also that it does not put patients’ health and safety in danger. This extremely careful approach underscores the difficulties and challenges of expanding technical innovation in this industry and reflects the high requirements of the healthcare industry for the use of technology. Consequently, there are still significant barriers and difficulties with the full implementation of the new technology in the healthcare industry, even though the technology has rapidly advanced and been widely used in other industries. However, innovation is essential in the healthcare industry. An example of Malaysian healthcare is shown in Figure 1 to give a basic overview of the sector and to assist in explaining the reasons behind its innovation.
Despite not being the most recent statistics, the figure makes it abundantly evident that even if the number of healthcare professionals is steadily rising, there are still insufficient numbers to satisfy the population’s demands. Figure 1 makes it evident that between 2010 and 2021, the ratio of doctors to population has decreased from 859 to 420. This figure is substantially beyond the WHO’s recommended ratio of 1:225 [8,9]. This ratio highlights Malaysia’s lack of healthcare professionals [8,9]. Not only is there a labour shortage in Malaysia’s healthcare industry, but the United States is also dealing with a comparable issue, which is shown in Figure 2.
Figure 2 displays the data from the United States, which shows fewer than 1,000 healthcare professionals per 100,000 population [10], demonstrating that the United States is facing the same issue as Malaysia. This highlighted the severity of the shortage of healthcare professionals, even in countries with different healthcare systems and resources. Although the Figure 1 and Figure 2 concentrated on two particular countries, they illustrated a worldwide problem that cuts beyond national boundaries, highlighting the difficulty of resolving the lack of healthcare professionals.
In light of this, it is imperative that new technologies be implemented in the healthcare industry [11]. This is due to the fact that technology is believed to be able to significantly enhance the standards and effectiveness of medical services, as well as reduce the excessive workload that comes with a lack of workers and lessen the strain on healthcare professionals. As of now, the healthcare industry has used a number of technologies, including electronic health records (EHR), to streamline information operations. This technology assists in preventing human mistakes and omissions while also increasing data processing efficiency and confidentiality [12]. Second, telemedicine technology reduces needless medical visits by using electronic programs to give patients immediate monitoring and direction on home treatment [13]. Additionally, artificial intelligence (AI) is being utilised in the healthcare industry to evaluate vast volumes of medical data in order to increase the precision of healthcare professionals’ diagnoses and treatments [14].
Although there are new technologies available to help the healthcare industry progress, healthcare still primarily relies on labour and antiquated technology since healthcare professionals are resistant to new technologies. Despite the fact that a great deal of study has been done on the healthcare industry’s technology-related backwardness, the majority of these studies have not thoroughly categorised the different hospital areas. This has caused certain research findings to be inapplicable to certain specialised departments, including the emergency department. This is because different departments face different problems, and due to the particularity of the department, these problems cannot be fully expressed in other departments [15,16].
Studies on the healthcare industry as a whole frequently fall short of providing a workable solution to the unique issues facing every given department, nor do they allay the worries of healthcare professionals over the use of new technologies [17]. This restricts the potential benefits of technology and contributes to its slow growth in technology promotion in the healthcare industry. For instance, healthcare professionals in the emergency department might be more concerned about the dependability of the technology in a high-stress setting to ensure it can be used swiftly and efficiently during emergency treatment. Meanwhile, the surgical department is more concerned about how technology will affect the surgical accuracy [18]. Therefore, research that does not focus on a single aspect of the healthcare industry often falls short of offering effective suggestions and is unable to address the unique demands of different divisions owing to the differences in needs [17].
AI usage in general hospital departments is mostly concentrated on broader activities, according to Fahim et al. (2025). AI in these departments are mostly in charge of duties that don’t directly involve patients, such as automating repetitive administrative procedures, predicting patient requirements, identifying diseases, and drug discovery [19,20]. However, Gün’s (2025) research on AI in the emergency department revealed that it is more likely to be used to directly support healthcare professionals in delivering quicker and more effective care [21]. For example, AI is utilised to provide clinical decision support specific to a patient’s condition, evaluate the severity of a patient’s symptoms in real time for triage choices, and so on. This implies that in order to provide prompt and precise clinical decision assistance in emergency departments, AI must function under time constraints and with sensitivity to the patient’s state [21]. These variations imply that compared to general departments, emergency departments have a harder time embracing AI. As a result, it is critical to particularly investigate technological acceptability in the emergency department context, rather than relying on studies from more stable clinical or administrative hospital settings.
Therefore, this study focuses on the emergency department, with the goal of investigating the key factors influencing emergency department healthcare workers’ acceptance of new technologies, thereby effectively increasing the level of new technology application in the medical field under high-pressure conditions. Concurrently, this study seeks to offer pertinent perspectives, research objectives, and development for additional high-stress medical domains. These insights may provide strategies and opportunities for the digital transformation of health professional education and healthcare professionals worldwide by assisting educators and health administrators in redesigning healthcare professional training systems, organisational support structures, and pertinent professional learning models. These insights might also help medical policymakers reevaluate their existing approaches to introducing new technologies. To examine the reasons behind healthcare professionals’ resistance to medical technology, this study used the Technology Acceptance Model (TAM) as a theoretical framework that was modified to fit the study’s objectives. Specifically, this study’s primary focus was on three research questions:
- What effects do perceived usefulness, perceived ease of use, organisational support, and training have on the attitudes of healthcare professionals about the adoption of new medical technology in emergency departments?
- What effects do perceived usefulness, perceived ease of use, organisational support, training, and attitude toward use have on healthcare professionals’ behavioural intention to use new medical technology in emergency departments?
- What influence does attitude towards use play in mediating the relationship between the behavioural intention to embrace new medical technology in emergency departments and perceived usefulness, perceived ease of use, organisational support, and training?
It is anticipated that this study would facilitate the seamless integration of modern technology in emergency departments, thereby enhancing the standard of medical treatment and lessening the strain on emergency department healthcare professionals. The results of the study could also have several benefits for stakeholders and further research. These benefits included providing medical policymakers a foundation to build more effective regulations and support networks for the uptake of medical technology. The results can also be used by educators to create training programs that better serve the requirements of emergency department healthcare professionals. Additionally, the findings of this study will provide technology developers with an idea to improve the design and usability of their products. In addition, it could also provide a foundation for further research into the factors affecting the uptake of medical technologies.
2. Literature Review
2.1. Technological Innovations in Emergency Departments
The emergency department has more responsibilities than other departments. Treating patients who need emergency rescue or who have sustained serious injuries is their first priority [22]. Due to the unique nature of the emergency department, healthcare professionals and resource management and coordination are important [23]. Healthcare professionals are required to allocate doctors, nurses, beds, and equipment in a timely and efficient manner while caring for patients that require emergency treatment [23]. Reasonable allocation is the secret to guaranteeing the effective operation of the emergency department and prompt patient response [23]. In addition to the above, the capacity of the emergency department to diagnose patients quickly is one of its key features. Healthcare professionals can quickly get comprehensive information about a patient’s condition using effective diagnostic techniques including imaging technologies and quick blood analysis, which strongly supports prompt treatment [23]. Additionally, the emergency department also places a high priority on patient admissions and transfers [24]. After considering and evaluating the condition of a patient, healthcare professionals would thus decide whether to admit the patient into the hospital or organise a transfer for the patient into a different department for the needed treatment [24]. This technique improves the overall effectiveness of the use of medical resources while at the same time allowing the emergency department sufficient capacity for admitting new patients.
Together, these characteristics and approaches build an effective emergency department operational structure able to provide timely and quality care for ill or injured patients. Despite this, because of continuously increasing populations and medical needs, the integration of new medical technologies into emergency departments has grown more indispensable. This study referenced a number of studies and found that although some medical technologies have been gradually practised in emergency departments throughout Malaysia, their adoption and coverage are still insufficient compared to countries with highly developed medical technologies, such as the United States (US). In this regard, not only is the effective use of medical assets hindered, but also the emergency department’s ability to quickly and efficiently meet patients.
In order to develop a further understanding of the real-world application of advanced medical technology in emergency departments and their role in enhancing medical efficiency, it is especially essential to learn from the experiences of those countries that possess highly advanced medical technology. For example, the US, as one of the upper-income countries, has widely applied various emerging innovative technologies in emergency departments and has become one of the countries with advanced medical technology in the world.
Firstly, the electronic health record (EHR) system is one of the most well-known technological innovations. The EHR system has made it possible for the patient’s medical records to be shared in real-time and allows healthcare professionals to quickly review all the relevant patients’ medical data, including different types of patients’ medical histories, prescribed medications, and so on. The use of all the full and rich patient data saved in the EHR will ultimately develop more accurate, patient-centred and patient-specific plans-of-care [25]. Moreover, AI-assisted diagnostic tools have also been adopted into the US healthcare environment. This technology could be deployed to discover on-time screening for the onset of rapidly life-threatening health conditions, such as cardiac attacks and stroke, and deliver optimal and immediate treatment suggestions at the site of healthcare professionals [26,27,28]. Besides that, the US has also extensively applied telemedicine and virtual nursing technologies. Through a combination of these two technologies together with each other, the healthcare professionals can offer medically acceptable online diagnostic and treatment to their patients. The application of telehealth and telemonitoring technology has reduced and alleviated the problem of scarcity of medical resources in rural health settings and congested hospitals in urban health settings [29].
To maximise the treatment programs, the US has implemented wearable technologies and smart devices in healthcare services together with the Internet of Things (IoT) technologies, to monitor the real-time data and other vital signs of patients [30,31,32,33,34]. Additionally, a fast image processing that incorporates three technologies of AI, CT, and MRI was adopted in the US [35]. It has significantly reduced the time required to provide image results, which offer considerable support for the effective operation of the emergency department [36,37,38,39,40]. In addition to the above technologies, the US has also successfully implemented a number of medical technologies, the use of which has greatly improved the efficiency and level of emergency departments in the US [39].
Different from the US, Malaysia as a developing nation with middle- and high-income levels has also implemented several innovative medical technologies in the emergency department [41]. Nonetheless, the overall penetration rate and application depth still lag much behind that of the US. For instance, some hospitals in Malaysia have adopted EHR systems, such as the MyEHR system, which facilitates the exchange of patient data [42,43]. Nevertheless, the coverage of this technology is restricted, and a single nationwide network has not yet been established [42]. It was discovered to have stability problems concurrently [44]. Rapid patient status changes in the hospital’s emergency department necessitate real-time data transfer for prompt clinical decision-making. The deployment of MyEHR may be further hampered by the emergency department’s inability to function efficiently due to erratic connection and system overload during peak hours.
Additionally, several Malaysian hospitals have also adopted telemedicine technology for facilitating patient support via online diagnosis platforms, prompted by the COVID-19 pandemic [45,46]. Nonetheless, the use of telemedicine in Malaysia is mostly restricted to simple consultation services with limited functionality [45]. In contrast to the US, where telemedicine is highly developed and widely used in virtual healthcare applications, telemedicine in Malaysia has a limited application in emergency departments, as urgent treatment and on-site intervention are necessary, which also contributes to its limited use in these settings [45]. Besides that, the automatic external defibrillators (AEDs) have also gained inclusion within the Malaysian healthcare system [47]. Even so, the prevalence and usage of this technology in Malaysia fall significantly behind that of the US, as only a few hospitals have placed it among emergency department services [47].
Furthermore, Malaysia has also embraced similar technologies like the use of automated medication control systems that have also been implemented in emergency departments of most hospitals, although the employment of AI-assisted diagnosis technology remains in its early stages [48]. This system allows healthcare professionals to improve the effectiveness of medicine distribution and reduce error rates [48]. Although the use of the technologies enhanced the emergency department’s operational efficiency, workforce shortages and insufficient medical information exchange persist in Malaysia.
In general, Malaysia is still lagging behind in the acceptance and usage of medical technology in the emergency department, which somewhat restricts the growth of medical service efficiency. Therefore, this study aims to explore the acceptance of medical technology in Malaysia from the perspective of healthcare professionals in emergency departments in order to mitigate existing problems and promote the further development of medical services.
Despite the fact that several studies have been carried out to enhance the adoption of medical technology, most of them fail to focus on particular departments and therefore cannot effectively address the problem of lagging medical technology application. Additionally, as most studies are based on other nations as the primary experimental locations, this may mean that the findings of the studies are unable to adequately address the issues Malaysia faces. This is because many nations deal with a variety of issues, such as disparities in resources and the environment. This emphasises the necessity of carrying out investigations that are customised for certain circumstances. Therefore, it is deemed vital to conduct this study that focuses on Malaysia’s emergency department, which is also seen to be able to compensate for the limitations of previous studies and present more useful recommendations and empirical results.
2.2. Theoretical Framework
Rapid scientific and technical advancements in recent years have resulted in the progressive integration of several cutting-edge technologies into many facets of human civilisation, improving people’s quality of life [49]. However, there is a lack of adoption of new technologies in some specialised industries, like healthcare, since people have concerns about the hidden risks and advantages of these technologies [50]. Many studies have been done to increase the use of technology, and one of the most concerned industries is healthcare. This is a result of the healthcare industry’s significantly lower adoption rate of new technology compared to other industries. Consequently, several studies have examined the factors influencing technology acceptability in an effort to boost the adoption rate of technology in the healthcare industry. The most often applied theoretical frameworks among these studies are the Technology Acceptance Model (TAM) and the Unified Theory of Acceptance and Use of Technology (UTAUT), demonstrating that they are applicable in this area [51].
Based on the Theory of Reasoned Action (TRA), Fred Davis introduced the Technology Acceptance Model (TAM) in 1989 to explain and forecast the adoption and application of technology [52,53,54]. Therefore, TAM is seen as an alternative to TRA and is also referred to as a simplified version of TRA. This is due to the fact that some TAM measuring methods are thought to be more suitable, accurate, and user-friendly than TRA in specific situations.
Venkatesh et al. (2003) proposed the Unified Theory of Acceptance and Use of Technology (UTAUT) in 2003. It incorporates eight current models, including TAM, to give a more complete framework for reaching more accurate findings [55,56]. According to Venkatesh et al. (2003), UTAUT can account for as much as 70% of the variations in behavioural intentions [57,58].
Attitude toward use is seen to be one of the significant factors that may influence users’ behavioural intention to utilise technology. As a result, TAM, with attitude toward use as a mediating variable, serves as the theoretical framework for this study. However, organisational support and training are also included in this study since it is believed that these are two significant factors influencing the adoption of technology. Although organisational support and training have been referred to as facilitating conditions (FC) in UTAUT’s theoretical framework, this study separates them into two independent factors to better understand their distinct roles in technology adoption. For example, training may be one-time and targeted at developing certain skills, whereas organisational support is comprehensive and long-term, depending on the company [59,60,61,62].
Aside from that, organisational support is intended to provide a positive climate to employees. At the same time, the intended improvement in technical skills of employees in relevant technical disciplines through training [59,61,62]. Additionally, organisational support is usually used to remove structural and emotional barriers, such as employee resistance to change. In contrast, training is mainly focused on addressing important omissions in the knowledge and skills of employees, such as knowledge of new advanced technology [59,61,62]. As such, it is vital to distinguish between organisational support and training. This is because it would enable researchers and practitioners to understand the distinct contributions of organisational support and training in technology adoption by controlling for organisational support and training uniquely. This will contribute to the development of more realistic solutions that will ensure the effective deployment of technology. Therefore, organisational support and training are respectively incorporated into the TAM model for analysis.
Numerous studies have also shown that TAM is reliable when used in research pertaining to healthcare. For instance, TAM was used as the theoretical framework by Ekaimi et al. (2024) to examine the variables influencing the utilisation of teleconsultation during the COVID-19 pandemic [63]. The use of TAM as a theoretical framework was also mentioned in a previous study by Zin et al. (2023) on elderly Koreans’ usage of digital healthcare resources [64]. Furthermore, a study by Alqudah et al. (2021) examined research publications that were released between 2010 and 2019. A total of 142 studies were included in their analysis following exclusion filtering. TAM has a dominant position in technological acceptance research in the healthcare industry, and 69 of these 142 studies employed it as their theoretical framework [65]. This demonstrates that TAM is applicable in this sector. TAM was thus used as a theoretical framework in this investigation.
However, the majority of previous studies that applied TAM theory focus on a general hospital department rather than a single department. As a result, current research still clearly lacks some specialisations with high levels of pressure and complexity, such as emergency departments, and there is very little discussion of their professional traits. For instance, previous TAM-based healthcare research has mostly focused on general clinical contexts or technologies, including EHR systems [66], teleconsultation [63], and older people’s adoption of digital health [64]. These environments differ significantly from emergency departments, where judgments must be made under time pressure and high cognitive load.
Although there are some studies aimed at emergency departments, the majority of them are carried out in nations with environments that differ from Malaysia’s, such as China, the US, and others. This draws attention to a study gap on the adoption of technology in Malaysian emergency departments. Therefore, the TAM theory’s inclusion in this study can further develop and assess the TAM’s performance in a high-pressure environment like the emergency department, as well as address the gap in Malaysia’s emergency department, and ultimately result in recommendations or improvements for other nations with comparable environments to Malaysia.
3. Conceptual Framework and Hypotheses
3.1. Conceptual Framework
The TAM model served as the theoretical foundation for this study, and the model was modified to fit its parameters, which included two variables, namely, organisational support and training. Figure 3 is provided to help illustrate the hypothesised in this study. All of the hypotheses of this study and the relationship paths between the variables are shown in detail in this figure.
According to Figure 3, the relationship paths for perceived usefulness, perceived ease of use, organisational support, and training on attitude toward use are represented by H1a, H2a, H3a, and H4a, respectively. Furthermore, the relationship paths for perceived usefulness, perceived ease of use, organisational support, and training on behavioural intention to use are represented by H1b, H2b, H3b, and H4b. Moreover, the mediating function of attitude toward use between perceived usefulness, perceived ease of use, organisational support, training, and behavioural intention to use are represented by H5a through H5d.
3.2. Variables And Hypothesis Development
The theories that this study is going to examine will be discussed in this section. A total of 13 hypotheses were established after reviewing several past studies.
3.2.1. Perceived Usefulness (PU)
“Perceived usefulness” (PU) refers to the extent to which a person thinks that employing a system might enhance productivity at work [67]. It is one of the main TAM theory components that has been brought up in a number of studies, and its significance in research on technology adoption has been emphasised.
Despite being a relatively new area of study, technology adoption in the healthcare industry has been extensively studied utilising the TAM. Most of those studies highlighted how important the perceived usefulness is in influencing attitudes towards technology innovation in the healthcare industry [64]. The majority of studies indicated that healthcare professionals are likely to have a more positive attitude toward new medical technologies if they believe it would effectively decrease their burden and improve their job performance [68,69,70,71]. On the other hand, healthcare professionals may also have a positive behavioural intention to use it if they feel that new medical technologies enable to improve patient outcomes, streamline workflows, or increase decision-making accuracy [68,71,72,73]. This led to the establishment of the following two hypotheses:
- H1a: Perceived Usefulness has a positive relationship with Attitude Toward Use.
- H1b: Perceived Usefulness has a positive relationship with Behavioural Intention to Use.
3.2.2. Perceived Ease of Use (PEOU)
“Perceived ease of use” (PEOU) refers to the extent to which someone thinks using a specific system will require minimal effort [67]. It is an essential part of the TAM in conjunction with perceived usefulness. perceived ease of use has often been demonstrated to be a key factor affecting technology adoption in the context of the TAM.
With the advancement of technology in the healthcare industry, numerous studies have been conducted on the subject using the TAM model. Within the studies, the majority of the literature was developed based on perceived ease of use to determine its impact on medical technology adoption and professional behaviours in the healthcare industry. Most of those studies demonstrate evidence on healthcare professionals with a tendency to agree to have a positive attitude towards medical technology that was easy to comprehend and user-friendly. This finding has been replicated by several subsequent studies, which show that ease of use and shorter learning curves increase acceptance and usefulness, thereby leading to a positive attitude [66,68,69,70,71]. Additionally, there are a number of studies noting that the ease of use of technologies also impacted the intention of healthcare professionals to use technology [71,72]. This led to the formulation of the subsequent hypotheses:
- H2a: Perceived Ease of Use has a positive relationship with Attitude Toward Use.
- H2b: Perceived Ease of Use has a positive relationship with Behavioural Intention to Use.
3.2.3. Organisational Support (OS)
Numerous studies, in addition to perceived usefulness and perceived ease of use, have also included organisational support (OS) as an important variable in extended TAM. Organisational support is defined as the degree to which employees feel that the organisation provides adequate resources and support for the technology to be effectively implemented [74].
The term “organisational support” also appeared in some studies in the health sector on technology acceptance, with it being identified as one of the important components of an emergent technology. There are several published studies on the topic that have suggested that if healthcare professionals receive adequate organisational support, such as technical support and resources available, they will develop a favourable attitude and eventually succeed in adapting and using a new system [68,75]. Additionally, several studies have shown that a high intention to use technology was attributed to well-organised support, highlighting the significance of the relationship between organisational support and the intention to use [75,76]. This support is instrumental in facilitating the process, reducing resistance to change, and increasing the likelihood of successful adoption of the technology. Based on the above rationale, the following hypotheses are posited:
- H3a: Organisational Support has a positive relationship with Attitude Toward Use.
- H3b: Organisational Support has a positive relationship with Behavioural Intention to Use.
3.2.4. Training (T)
In addition to support from the organisation, training has often been used in an attempt to explain technology uptake in the TAM. The term “training” (T) refers to that structured approach for building someone’s capacity and knowledge with the intent of increasing productivity and effectiveness in the work setting [60].
Training has been stated to provide the skills necessary for healthcare professionals to feel comfortable and competent in using a new technology within their respective healthcare contexts. Additionally, utilising a training approach can also mitigate fears about usability and resistance to adopting technology as well. There are a number of studies that have validated that appropriate training builds confidence and a more positive attitude towards adopting new technologies [73,77,78,79,80]. Furthermore, a few studies found that an established training model increased behaviour-based intention among healthcare professionals to use technologies, demonstrating a possible link between training and the behavioural intention to use [81,82]. As a result, training has been added as an independent variable to the study, and the following hypotheses were put out:
- H4a: Training has a positive relationship with Attitude Toward Use.
- H4b: Training has a positive relationship with Behavioural Intention to Use.
3.2.5. Attitude Toward Use (ATU)
In addition to perceived usefulness and perceived ease of use, the “Attitude Toward Use” (ATU) is also one of the main constructs within the TAM. In conjunction with perceived usefulness and perceived ease of use, attitude toward use is used to determine the behavioural intention of an individual in adopting a new technology. It refers to the generalised likes and dislikes of an individual in relation to a certain technology [74].
It involves the personal attitudes and beliefs that a person possesses towards an object of technology, which can have the potential to significantly affect the decision of an individual to adopt and employ the technology. According to several previous studies, people who have positive attitudes about technology tend to use and adopt technologies that they find useful and beneficial [64,66,68,83,84]. Conversely, a negative attitude can make the individual less willing to adopt technology that they consider unattractive or inconvenient, which could hinder adoption. Consequently, the following hypothesis was created:
- H6: Attitude Toward Use has a positive relationship with Behavioural Intention to Use.
3.2.6. The Mediating Effect of Attitude Toward Use
In this study, “attitude toward use” (ATU) is also proposed as a mediator variable, which mediates the effect exerted by the independent variables on the dependent variable.
Numerous studies have been conducted, all demonstrating a positive relationship of several independent variables with attitude toward use, including perceived usefulness, perceived ease of use, organisational support, and T [66,68,69,70,71,79,80]. In addition, several studies have established that behavioural intention to utilise emerging technologies as a dependent variable is positively affected by attitude toward use [64,68,70,84]. Based on these findings, it is valid to propose that attitude toward use may be a mediator for the relationship between the independent variable and the dependent variable. There are several studies that conducted recently, including those by Ren and Zhou (2023), Walle et al. (2023), and Xie et al. (2020), [66,85,86], that have provided support for this perspective. Accordingly, the subsequent hypotheses were put forth:
- H5a: Attitude Toward Use positively mediates the relationship between Perceived Usefulness and Behavioural Intention to Use.
- H5b: Attitude Toward Use positively mediates the relationship between Perceived Ease of Use and Behavioural Intention to Use.
- H5c: Attitude Toward Use positively mediates the relationship between Organisational Support and Behavioural Intention to Use.
- H5d: Attitude Toward Use positively mediates the relationship between Training and Behavioural Intention to Use.
4. Methodology
4.1. Survey Instrument and Data Collection
In order to guarantee compliance and safeguard participant privacy, this study underwent ethical approval prior to data collection. This study applied for ethics approval from Multimedia University’s Research Ethics Committee to highlight its ethical focus. The application was approved on 3 July 2024, with the approval number of EA0232024. This detail of the application is listed on the cover page of the study, along with the privacy and personal data protection act (PDPA) conditions. Additionally, participants were also given the assurance that their data would remain anonymous, as no personally identifiable information was gathered. All questions and associated answers were utilised only for academic purposes related to this study. Furthermore, the gathered data were securely archived in an aggregated form and used as a baseline reference for future evaluations, which was accessible only to the researcher and the supervisor.
The intention of this study is to determine the influences that can hinder emergency department healthcare professionals’ acceptance of new technologies. Therefore, the main requirement for sample recruitment was that participants must be healthcare professionals between the ages of 25 and 60 who are currently working in emergency departments. This ensures that all of the professionals engaged have sufficient experience working in emergency departments to be able to offer sincere and informed feedback based on their experience, in addition to aiding with accurate representation and generalisability.
Since the study examines the adoption of technology by healthcare professionals, it is necessary to ensure that the sample is confined to healthcare professionals. Thus, the judgmental sampling method, one of the non-probability sampling techniques, was employed in this study with the aim of having only participants with relevance. The efficient use of judgmental sampling in similar studies conducted by Singh et al. (2022) and Vidhya and Venkatesh (2024) further supports its effectiveness for use and application in this study [87,88]. Their study concluded that the use of judgmental sampling is an acceptable option for research studies that require to get information from respondents who are in the exact position required for the study or have the same experience to provide essential information on the issues being studied. Therefore, the sampling method used is valid and appropriate for the research aims of this study.
In addition, the sample size of this study has been determined using G*Power, which is one of the power analysis tools that is frequently used in social science-related research. By using 5 predictors, a medium effect size of 0.15, a 5% margin of error, and a 95% statistical power, G*Power suggested a minimum sample size of 138 respondents.
Furthermore, a total of 2 data analysis tools were employed in this study during the data analysis process in order to obtain an accurate result. First, the “Statistical Package for the Social Sciences” (SPSS) is applied to examine the acquired data for outliers and then perform a descriptive analysis. This is to ensure the reliability of gathered data and thus the precision in results. The filtered data is then processed to carry out in-depth data analysis by using SmartPLS after the data analysis in SPSS. In this step, two distinct evaluations are involved, namely, measurement model evaluation and structural model evaluation [89]. Moreover, mediation analysis is utilised, as the attitude toward use was also a mediator variable in this instance. Finally, the Importance-Performance Map Analysis (IPMA) summarises the significance and the individual effect of all the variables.
4.2. Measurement Items
This study used the questionnaire survey technique and created a questionnaire to gather data. This is because the questionnaire survey technique is an easy and effective way to gather a lot of data, making it appropriate for quantitative research that needs a lot of data. Since this study uses a quantitative research approach, it is also applicable. In addition, this study uses a cross-sectional research design, sometimes referred to as a one-time study. This approach satisfies the objectives of this study as it can quickly and easily gather the necessary data from a particular place.
A correlational method was used in this study to increase the accuracy of the research findings. This approach serves to lessen disruptions to the workplace and calls for less direct involvement from researchers. Additionally, the questionnaire was sent by email or WhatsApp in order to minimise in-person interactions and lessen the possibility of influencing respondents’ behaviour. Further guaranteeing the validity and dependability of the data was the fact that the study was carried out in the target hospital’s natural setting, which little disrupted the normal tasks of the healthcare professionals.
The questionnaire employed in this study consists of a cover page and 33 items separated into four sections, which are A, B, C, and D. The cover page provides a brief overview of the study’s history and includes an informed consent form to make that participants are aware of the study’s goals and willingly participate before completing the questionnaire. Three demographic questions, including years of work experience, gender, and age, are included in Part A. Additionally, Part B is broken down into four subsections, A, B, C, and D, for the four independent variables in this study, which are perceived usefulness, perceived ease of use, organisational support, and training. There are 5 items in each part, for a total of 20 items. Furthermore, Part C discusses the mediating variable, attitude towards usage, and includes 5 items. In addition, Part D concentrates on the dependent variable, behavioural intention to use, which also includes 5 items.
Table 1 provides a more thorough understanding of the questionnaire’s design structure by listing all of the variables and their corresponding items in this study. First, there are three items in Section A of the questionnaire, all of which are multiple-choice. Furthermore, Sections B, C, and D employed a 5-point Likert scale with 30 items in total. A rating scale of 1 to 5 will be used to guide participants’ responses, where 1 represents “strongly disagree,” 2 represents “disagree,” 3 represents “neutral,” 4 represents “agree,” and 5 represents “strongly agree.” Participants are able to more correctly express their thoughts with the use of this rating approach.
The 5-point Likert scale was used in this study since it is more straightforward and understandable than the 7-point scale. With just five choices, it makes it easier for responders to comprehend and reply rapidly, which is especially helpful for healthcare professionals who are pressed for time [90,91]. Additionally, TAM-based medical research has made extensive use of this scale. Its ability to measure individual attitudes and opinions is therefore indirectly demonstrated by this [92,93,94].
5. Results and Discussion
5.1. Descriptive Analysis
5.1.1. Outlier Checking
This study used an outlier test to prevent erroneous findings from in-depth analysis. The preliminary test results for the outlier checking are shown in Table 3.
Table 3 shows that the Mahalanobis distance has a maximum value of 23.861. Given that there are five independent variables in this study, the value should be less than 20.52 based on the Chi-Square distribution’s critical value [95]. However, the maximum value of the Mahalanobis distance of this study is 23.681, which is much higher than the crucial threshold of 20.52. This suggests that the sample contains outliers. Therefore, the outlier has to be eliminated in order to guarantee the validity of the analysis results and the quality of the data.
Additionally, the Cook’s distance is also included in Table 3. This table shows that the Cook distance’s maximum value is 0.955, which is less than the widely accepted criterion of 1. This indicates that there is no unusual case in the data gathered for this study.
The study retested the dataset after removing the outliers to ensure that no outliers were present. The analytical findings of the data following removal are displayed in Table 4.
According to the table, there is no outlier in the dataset. This is because the maximum value of Mahalanobis distance is 7.834, which is significantly lower than the critical value of 20.52. In addition, the maximum value of Cook’s distance decreased to 0.556, which is much lower than the threshold of 1, indicating that the dataset does not contain unusual cases.
5.1.2. Demographic Analysis
This study established a demographic data analysis section to more thoroughly explain the respondents’ fundamental characteristics, including factors like gender, age, and years of employment. Table 5 displays the pertinent findings.
Regarding gender, women made up the majority of the 139 respondents, with 80 individuals, or 57.6%. In the meantime, males comprised the remaining 59, or 42.4%.
In terms of age, the majority of respondents are in the 30 to 34 age range (n=48, 34.5%). The second age group is the 35 to 39 age range (n=33, 23.7%). The third age group is the 25 to 29 age range (n=20, 14.4%). The fourth age group is the 40 to 44 age range (n=14, 10.1%). Then followed the 50 to 54 age range (n=11, 7.9%). Next is the 55 to 59 age range (n=7, 5%). In addition, the last age group is the 45 to 49 age range (n=6, 4.3%). However, there are no respondents over 60 years old in this study.
As for years of employment, the majority of respondents had fewer than 5 to 9 years of experience working in the emergency departments (n=55, 39.6%). The second category is 10 to 14 years of experience (n=42, 30.2%). The 15 to 19 years of experience is the third highest category (n=19, 13.7%). In addition, there are 25 to 29 years of experience (n=13, 9.4%). Next are those with 30 years of experience (n=6, 4.3%). And there are 20 to 24 years of experience (n=4, 2.9%). However, none of the respondents in this study had more than 35 years of experience.
5.2. Measurement Model Assessment
5.2.1. Indicator Reliability, Internal Consistency Reliability and Convergent Validity
Assessing the reliability of the indicators and internal consistency is the first stage in evaluating a measurement model. In this stage, the reliability of the indicator is examined by using the factor loading value. Hair et al. (2019) propose that an ideal factor loading value of each indicator is 0.708 or higher [89]. Nonetheless, a factor loading value of at least 0.7 is also considered acceptable [89]. They both show a substantial absolute contribution from the indicator.
Following that, this stage also analyses the dependability of the internal consistency of the model. A total of two methods is carried out in this study to perform the reliability analysis for the internal consistency, namely, the Cronbach’s Alpha and composite reliability (CR). Given the criterion for Cronbach’s Alpha is 0.7, a construct with a Cronbach’s Alpha value of 0.7 or more is regarded as implying that it has adequate internal consistency [96,97,98]. Meanwhile, the composite reliability (CR) criterion is 0.60, which means that a construct is deemed acceptable if its CR value is 0.6 or above, whereas values of 0.7 or higher imply strong internal reliability [89].
Convergent validity is evaluated after the measurement model’s reliability assessment during the evaluation process. In this stage, the AVE value is employed to assess the convergent validity of the model. According to the convergent validity criterion, the AVE value must be 0.5 or above in order to indicate a substantial connection among the specific construct and its related indicators [89].
The findings of both the reliability and the validity analysis of this study, which cover the indicator reliability, internal consistency reliability and convergent validity, are listed in Table 6.
According to the table, the lowest factor loading value in this study is OS1, which is 0.847. Therefore, the factor loading values for each of the indicators are above the 0.7 threshold, indicating considerable absolute contributions.
Additionally, all the composite reliability values are also presented in this table. According to the value, OS and T have the lowest composite reliability value, which is 0.952. The PEOU comes next, with a composite reliability rating of 0.953. Following that, the ATU and BIU had the next highest composite reliability values at 0.963. Finally, PU had the highest composite reliability score at 0.970. Based on the values, all constructs had composite reliability scores above 0.9, which indicates strong internal reliability. It also suggests that the indicators are strong at consistently measuring their construct. This result validates the reliability of the measurement model, confirming that the model had a low construct measure error, and it was appropriate to measure healthcare professionals’ views of technology use.
In addition, this study also provided Cronbach’s Alpha as one additional layer of support to the results of the reliability analysis. For Cronbach’s Alpha, OS and T had the lowest score of 0.938. PEOU had a score of 0.939, followed by ATU and BIU, both had values of 0.952, and PU had the highest value of 0.961. Based on the results, all constructs passed the thresholds for Cronbach’s Alpha, and every construct achieved a score above 0.7, well above the 0.7 threshold. This indicates that all constructs had sufficient internal consistency to reliably measure the intended constructs.
Furthermore, the table shows that OS and T had the lowest AVE value, at 0.80. The PEOU comes next, with an AVE rating of 0.804. The BIU, which has an AVE of 0.838, follows next. Additionally, the AVE of ATU was 0.840, which was the second-highest AVE among these constructs. The last construct, which is the PU, had the highest AVE value with 0.864. Across all of the constructs, the lowest AVE was 0.8, which is above the standard for convergent validity of 0.5. This indicates that constructs in the research accounted for a minimum of 80% of the variance in the indicators. Hair et al. (2009) stated that a value of more than 0.7 is ideal [99]. Therefore, the AVE values for all constructs in this study, which include PU, PEOU, OS, T, ATU, and BIU, were above 0.7, indicating that all were optimal in terms of this standard. As a result, it could be suggested that the constructs are likely to have sufficient convergent validity and that the items are appropriate indicators of each construct. The results provided evidence that the measurement items in the current study had fairly high consistency with the constructs they accounted for, and therefore may be considered appropriate indicators of technology adoption for healthcare professions. This also validates the questionnaire design and demonstrates that the questions are well consistent with the latent variables they measure, hence validating the model’s convergent validity.
5.2.2. Discriminant Validity
Discriminant validity represents the last stage in the measurement model appraisal direction. To ensure that each construct in this model has a distinct value and does not conflict with the others, discriminant validity is employed [89].A total of two different methods will be used in this step to show that each construct is unique. These methods are the Heterotrait-Monotrait Ratio of Correlations (HTMT) and the Fornell-Larcker criterion.
5.2.2.1. Heterotrait-Monotrait Ratio of Correlations (HTMT)
HTMT is a well-known discriminant validity method that has been proven to be the most dependable approach available today. It has a threshold of 0.9 based on the rule of thumb of the HTMT. To fulfil the discriminant validity, each construct is required to have an HTMT value that is less than 0.90 [89]. Table 7 displays the outcomes of the HTMT.
The HTMT values for each of the constructs were listed in the table, which also showed that all of the HTMT values were acceptable for each of the constructs as they were all below 0.9. This shows that each of the constructs was empirically distinct from the others, which shows evidence of having discriminant validity. This finding suggests that all of the constructs in this study were empirically distinct and enabled participants to differentiate each of the related but different constructs. This is an empirical finding that can support the theoretical basis of the measurement model and always confirms the model’s ability to accurately capture these numerous but related constructs in medical technology adoption.
5.2.2.2. Fornell-Larcker Criterion
As one of the commonly used discriminant validity techniques, the Fornell-Larcker criterion is used in this study to determine the construct uniqueness. Since discriminant validity was the most dependable method before to the development of HTMT and most researchers still maintain this belief, this study used this criterion to further corroborate the findings of discriminant validity. The criterion is that the diagonal values of each construct, which are the square root of its AVE, must surpass its correlated values with the other constructs [100]. Table 8 displays the discriminant validity findings using the Fornell-Larcker method.
AVE values for each construct are shown in the table. The results show that each of the constructs located diagonally possesses an AVE value higher than its correlation with other constructs. This indicates strong evidence that the data from this study meet the threshold for discriminant validity. This suggests that participants in this study were able to differentiate between constructs that are related yet conceptually separate, as well as that each construct examined in the study is its own empirically distinct. This also fortifies the model’s theoretical framework and validates its suitability for studies pertaining to the healthcare industry.
5.3. Structural Model Assessment
5.3.1. Collinearity Assessment
During this evaluation, the analysis begins with an assessment of collinearity. Hair Jr. et al. (2021) propose that the VIF is able to be utilised in the collinearity assessment process to ascertain the collinearity issue between the constructs [89]. In accordance with the rule of thumb for collinearity evaluation, the data will have a collinearity issue if the constructs’ VIF value is 5 or above [89,101]. All the study’s hypotheses, the relationship between the constructs, and the VIF value for each of the hypotheses are summarised in Table 9.
According to the results of the collinearity assessment, the relationship with the highest VIF value, 3.790, is between ATU and BIU. The second-highest VIF value, 3.279, is found in the relationship between PU and BIU. This is followed by the following relationships, which are T and BIU, with a value of 2.890; PEOU and BIU, with a value of 2.595; PEOU and ATU, with a value of 2.536; T and ATU, with a value of 2.534; PU and ATU, with a value of 2.171; OS and BIU, with a value of 2.000; and OS and ATU, with a value of 1.997. According to Table 9, all of the VIF values are less than 5, indicating that this study has no multicollinearity issues.
5.3.2. Path Coefficient
The path coefficients come after the collinearity assessment. It is used to evaluate the magnitude of the path relationship between the constructs by referencing the standard beta. The standard beta value falls between the range of negative one (-1) and positive one (+1), where +1 reflects a positive path relationship and -1 reflects a negative path relationship. A strong relationship is shown by path coefficient values around +1 or -1, whereas a weak relationship is indicated by values close to 0 [89]. This stage further incorporates the t-value, p-value, and confidence interval bias to determine the significance of the relationship [89]. The results of the hypothesis testing are displayed in Table 10.
The findings in Table 10 show that the standard β values for each of the other hypotheses are all positive, indicating a positive relationship direction, except for the influence of T on BIU (H4b). This is because the β value of H4b is the lowest among all the paths, which is -0.005. This indicates that the negative relationship is very weak because it is in the opposite direction and very close to 0. In contrast, the influence of OS on ATU (H3a) has a positive relationship, but its β value is only 0.026, which is the weakest among all positive paths. However, with a β value of up to 0.706, the influence of ATU on BIU (H6) exhibits the strongest positive relationship.
Additionally, t-values were employed in this study to assess the significance of the path. Following the critical value criterion, three paths were identified, with 1.6449 denoting a 5% significance level and 2.3263 denoting a 1% significance level. According to the critical value critetion, the t-values of these three paths of PU to ATU (H1a, t=7.260), T to ATU (H4a, t=3.269), and ATU to BIU (H6, t=5.914) all exceeded two significant levels, which indicating that these paths are statistically significant. As a result, this study used a more stringent significance threshold, which is 1%, to guarantee the validity of the findings, and the related critical value was 2.3263.
Furthermore, the p-value was also examined in this study. As per the table, a total of three hypothesised connections are validated by the statistical significance, which are H1a (β=0.541, t=7.260, p<0.01), H4a (β=0.306, t=3.269, p<0.01), and H6 (β=0.706, t=5.914, p<0.01), as all of which have p-values less than 0.001. On the other hand, the p-values of H2a (β=0.125, t=1.518, p>0.01), H3a (β=0.026, t=0.338, p>0.01), H1b (β=0.124, t=1.023, p>0.01), H2b (β=0.036, t=0.337, p>0.01), and H3b (β=0.037, t=0.531, p>0.01) are all more than 0.01. This indicates that these hypotheses are not significant in this study, suggesting that they are not supported.
Moreover, the reliability of the results is further verified by using confidence intervals bias. The table indicates that the importance of H1a (0.411, 0.655), H4a (0.162, 0.472), and H6 (0.486, 0.884) is further supported by the fact that their confidence intervals do not contain 0. The remaining paths, such as H2a (-0.019, 0.251), H3a (-0.081, 0.165), H1b (-0.065, 0.335), H2b (-0.133, 0.216), H3b (-0.062, 0.174), and H4b (-0.131, 0.112), all have confidence intervals that include 0, arguing that these hypotheses are not statistically valid [102].
5.3.3. Coefficient of Determination (R2)
The third stage in assessing the structural model is the coefficient of determination (R2). It is used to calculate the inner model’s explanatory strength using the R-squared. Hair Jr. et al. (2017) state that the R-squared value falls between 0 and 1, with 0.25 to 0.50 being considered weak, 0.50 to 0.75 being considered moderate, and 0.75 and above being considered substantial [89]. The R-squared findings are displayed in Table 11.
According to the table, ATU has an R-squared of 0.736, which means that PU, PEOU, OS and T explain 73.6% of its variance. In accordance with Hair Jr. et al. (2017), with an R-square of 0.736, the ATU indicates a moderate model as it has passed the 0.5 criterion [89]. In contrast, BIU has an R-squared of 0.721, which means that PU, PEOU, OS, T and ATU explain 72.1% of its variance. According to Hair Jr. et al. (2017), the BIU has an R-squared of 0.721, which means it also indicates a moderate model as it has passed the 0.5 criterion [89].
5.3.4. Effect Size (f2)
The evaluation then proceeds to the effect size (f2), which is the fourth stage. It is used to determine the degree to which the independent variables may explain the changes observed within the dependent variable [89]. Following the effect size rule of thumb that proposed by Cohen (1988), the effect of each relationship may be categorised into three tiers based on its effect size value, where the value fall between 0.02 to 0.14 suggests a small impact size, 0.15 to 0.34 suggests a medium impact size, and 0.35 and higher suggests a big impact size [89,103]. The following table, Table 12, delivers a summary of the effect size measurements derived from the study.
The results reveal that the connections between PU and ATU, which is H1a, and the relationship between ATU and BIU, which is H6, have f-squared values of 0.510 and 0.473, respectively. Both of them exceeded the 0.35 criterion, which suggests that their impact sizes are big [89]. In the meantime, the f-squared values for the relationship between PEOU and ATU, which is H2a, and the relationship between T and ATU, which is H4a, are 0.023 and 0.140, respectively. Both were above the 0.02 threshold, indicating small impact sizes [89]. The remaining relationships had impact sizes below 0.02, including the relationship between OS and ATU, which is H3a, the relationship between PU and BIU, which is H1b, the relationship between PEOU and BIU, which is H2b, the relationship between OS and BIU, which is H3b, and the relationship between T and BIU, which is H4b. The sizes of all effects were 0.001, 0.017, 0.002, 0.002, and 0.000, respectively, indicating that none of them had an effect [89].
5.3.5. PLSPredict
The PLSPredict is the last stage in the structural model assessment process. In addition to R2 for assessing in-sample explanatory power, PLSPredict is employed for assessing out sample predictive power [89]. PLSPredict has two statistics-based prediction errors, which are “root-mean-square error” (RMSE) and “mean absolute error” (MAE) [89]. The results of the PLSPredict are displayed in Table 13.
Since all of the indices of ATU and BIU have positive Q2 predictors as shown in Table 13, the RMSE is utilised in this study. The PLS-SEM RMSE values for all indicators of both ATU and BIU were lower than the LM RMSE values. This indicates that both of them possess a strong capacity for prediction [89].
5.4. Mediation Analysis
The mediation analysis is used since this study contains one mediator variable, which is the ATU. It seeks to determine the degree to which the association of the independent variables with the dependent variable is influenced by the mediating influence of the mediator variable [104]. According to the general rule of mediation analysis, there are three levels of mediation effect. When only the indirect effect of independent and dependent variables is significant, a full mediation effect is identified [89]. When the direct and indirect effects are both significant, the partial mediation effect is identified [89]. When neither the direct effects nor the indirect effects are substantial, no mediation effect is identified [89]. Table 14 lists the analysis results related to the mediating effect.
According to the table, the standardised beta coefficient (β) shows that all paths are positive, which indicates that there is a positive relationship between all of the variables. Based on the results, H5a has the strongest correlation (β=0.382) among them, followed by H5d (β=0.216). In the meanwhile, the correlation of both the H5b (β=0.088) and H5c (β=0.018) are relatively weak as their β value is close to 0.
Moreover, the t-value analysis reveals that the t-values of H5a (t=4.722) and H5d (t=2.852) surpassed the crucial value of 2.3263, attaining a significant level of 1%. On the other hand, the t-values of H5b (t=1.392) and H5c (t=0.331) are below the threshold of 2.3263, suggesting that the indirect effects of these two paths are not statistically significant.
Simultaneously, this study integrated the p-value for further assessment. According to the table, H5a and H5d may be considered full mediation routes since their direct effects are not significant, and their p-values are both less than 0.01 in the table, confirming their strong indirect effects. Conversely, H5b and H5c had p-values larger than 0.01, which are 0.082 and 0.370, respectively, suggesting that these two pathways lack statistical validity and do not support mediation relationships.
Furthermore, the aforesaid conclusion is supported by the findings of the confidence interval analysis. Given that the confidence interval bias of both H5a (0.254, 0.519) and H5d (0.109, 0.363) do not include 0, suggesting that their indirect effects are consistent and dependable. On the other hand, the confidence interval bias of both H5b (-0.007, 0.201) and H5c (-0.058, 0.119) contained the 0 value, suggesting that their findings are not significant [102].
The findings of this study indicated that for healthcare professionals, their behavioural intention to use new medical technologies is not directly influenced by their perceptions of the technology’s utility or their training. However, both of these factors may indirectly positively influence behavioural intention to use by changing attitude toward using technology. This indicates that hospital administrators should first change their attitudes toward using technology to help improve healthcare professionals’ behavioural intention to use technology. For example, healthcare professionals could have formed a positive attitude toward technology and thereby have a strong behavioural intention if they had received training on how to use the technology relevant to their role. Additionally, hospital administrators can enhance healthcare professionals’ attitude toward technology and ultimately improve behavioural intention to use by demonstrating how technology can help healthcare professionals complete their daily tasks.
In contrast, BIU was not significantly impacted by PEOU or OS. According to the study’s findings, PEOU and OS did not directly or indirectly affect BIU through ATU. This is because neither PEOU nor OS was significantly associated with attitude. As a result, they had no significant influence on the behaviour of healthcare professionals to embrace new medical technology in this study.
To enhance comprehension of the mediation analysis, Figure 4 is presented. The figure displays every relationship with a distinct line colour, along with the corresponding t-value and p-value.
Figure 4 clearly demonstrates that the p-values for H5a and H5d are less than 0.01, suggesting that these two hypotheses are supported. However, the p-value for H5b and H5c is more than 0.01. This suggests that these two hypotheses are not supported.
5.5. Importance-Performance Map Analysis (IPMA)
The importance-performance map analysis (IPMA) is the final step in the process of data analysis. This analysis is used to measure the level of significance and performance of each construct to generate valid outcomes and insights [89]. The findings can be presented in two different formats, which are a figure and a table. In Figure 5, the constructs are represented in different colours to effectively present the result in a figure format. On the other hand, On the other hand, the precise values of each of the constructs are displayed in Table 15.
Figure 5 used “behavioural intention” as the dependent construct in the analysis. The placement of “attitude toward use” on the right side of the figure indicates it as the most significant and best-performing construct in the analysis. In contrast, “organisational support” is located on the left side of the figure, which suggests that “organisational support” has the least performance and importance among these constructs. The results indicate that researchers should focus on “attitude toward use” when looking to increase the usage of medical technologies in emergency departments, followed by “perceived usefulness”, “training”, “perceived ease of use” and “organisational support”.
The results of the IPMA with the precise values of every construct are displayed in Table 15. This table contained the study’s constructs, the importance value, which is also called the total effect, and the performance value.
As the table illustrates, the total effect of ATU is the largest, at 0.706. This suggests that the most important of these constructs is the ATU. In addition, ATU has the second-highest performance score, which is 70.27, suggesting that it does an excellent job of boosting adoption intention. Additionally, the PU received a score of 0.506, the second-highest total effect value. This suggests that it is crucial for enhancing the motivation to adopt. Meanwhile, PU had the greatest performance score, which is 74.16, indicating that it performs the best in terms of enhancing adoption intention.
Conversely, OS has the lowest total effect value, which is 0.055. This suggests that, in comparison to other constructs, it has less impact on enhancing adoption intention. Next in line were PEOU, with a total effect value of 0.124, followed by T, with a total effect value of 0.211. On the other hand, PEOU has the lowest performance rating, with a performance value of 62.261. This suggests that when compared to other constructs, it performs the least well. OS, with a performance value of 63.662, and T, with a performance score of 64.267, come next.
Therefore, researchers and hospital administrators ought to have concentrated on both ATU and PU in order to increase the use of medical technology in emergency departments. This is due to the fact that they received the greatest performance value and total effect value.
According to the findings, hospital administrators should prioritise attitude since it is the most crucial factor. The adoption rate of medical technology in the emergency departments by enhancing the positive attitude of healthcare professionals may also successfully increase. A positive attitude of healthcare professionals can be strengthened by providing in-depth information about the benefits and success cases of the technology. To achieve better results, hospital administrators should assign cases according to departments. For instance, hospital administrators might urge emergency department employees to share their good experiences with the technology, such as how it made them feel more supported, confident, or content with their jobs. Positive attitudes may be fostered by lowering staff worries and reinforcing positive cognitions through department-specific, accessible examples.
Simultaneously, attention should be paid to PU as the factor with the second-highest value in total effect and the highest performance value. By showcasing the advantages that technology may offer to particular departments, hospital administrators may effectively improve healthcare professionals’ perception of its usefulness in specialised areas like the emergency department. For instance, hospital administrators can share success stories from other emergency departments or host department briefings that highlight real performance metrics, like how well the technology reduces admission delays, to help make the advantages of the technology more concrete and compelling. By explicitly connecting the technology to better emergency department outcomes, emergency department healthcare professionals are more likely to think the technology is useful and worth using.
In addition, T is one of the factors that has to be considered, as it has the third-highest value for both performance and total effect. The total effect implies that it is an important factor in successfully enhancing the adoption of emergency department healthcare professionals of new medical technology. Nevertheless, it is evident from the performance value that the T was ineffective, which prevented a major increase in the use of the technology. Thus, hospital administrators should also reorganise the training program to improve healthcare professionals’ use of technology. This can be accomplished through the use of simulation learning, which mimics real-life emergency department scenarios, the creation of short, modular training sessions that accommodate the shift schedule of a busy department, like the emergency department, and on-the-job training assistance from peer mentors or technology providers. Additionally, prioritise the system’s useful, task-oriented features over its overall capability when creating training so that healthcare professionals can use it with assurance in the hectic, time-sensitive environment of the emergency department.
On the other hand, although PEOU and OS had the lowest total effect and performance, hospital administrators may still increase overall emergency department healthcare professionals’ acceptance of technology by strengthening both of these factors. For example, hospital administrators should design user-friendly technologies with simpler interfaces, few navigation steps, and real-time advice for the high-stress emergency department setting in order to increase PEOU. In order to prevent integration issues and give healthcare professionals a period of time to become used to utilising technology, hospital management should evaluate the technology’s usability with emergency department employees prior to introducing it completely. In terms of OS, hospital administration may demonstrate their backing for the deployment of technology by allocating healthcare professionals training sessions and incorporating emergency department healthcare professionals in pertinent decision- making. It is believed that by providing this kind of assistance, a positive atmosphere that promotes sustained usage may be established, boosting emergency department healthcare professionals’ confidence in implementing new technologies.
6. Conclusion
6.1. Summary of Analysis
The findings of the hypothesis testing carried out in the previous chapter are summarised and presented in a table for easier comprehension in this section. Both the hypothesis and the decision were presented in Table 16.
This study examined the factors influencing Malaysian emergency department healthcare professionals’ adoption of technological improvements by using an expanded technology acceptance model (TAM). Some noteworthy discoveries were obtained by adapting the structural model to the study’s parameters. First of all, the hypothesis of H1a was supported by the study’s findings, which the perceived usefulness (PU) significantly improves a person’s attitude towards usage (ATU). This finding supports the significance of perceived usefulness to attitude toward use and is in line with the earlier research findings. For instance, Pan and Gao (2021) noted that nurses are more willing to use the appropriate system when medical technology may streamline the nursing process, such as facilitating quick information exchange and dynamic condition monitoring [105]. Furthermore, research by Kalayou et al. (2020) found that the attitudes of healthcare professionals are significantly influenced by the perceived usefulness, especially when technology is viewed as a tool to improve efficacy, efficiency, and time savings [68].
Nevertheless, the hypothesis of H1b is not supported due to perceived usefulness, which shows no discernible direct impact on behavioural intention to use (BIU). Some studies have found the same outcome, despite the fact that the result is at odds with the findings of the majority of studies. For example, Walle et al. (2023) found that the behavioural intention of healthcare professionals to use electronic personal health record systems was not significantly impacted by perceived usefulness [66]. It is suspected that the disruption of workflows caused by new technology could be the cause of this outcome. Effective and systematic procedures are essential to medical work, and new technologies frequently disrupt the routine, which forces the users to adjust to using them, making them difficult to adopt in clinical settings with such limited time. Additionally, Tsai et al. (2020) stated that healthcare professionals find it challenging to appropriately assess the usefulness of technology before they are familiarised with it. Healthcare professionals typically need to go undergo a lengthy adaptation phase before they are able to comprehend the benefits of technology, as actual use is the primary way to establish perceived usefulness [106]. Accordingly, perceived usefulness has a relatively small effect on behavioural intention in the early stages [106]. In conclusion, regardless of whether perceived usefulness cannot predict intention to use directly, it is still a critical element that influences healthcare professionals’ attitudes and shapes the attitude response in the early stages of technological acceptance.
The hypothesis of H4a was also validated by this study, which revealed that training (T) significantly influenced attitude toward use, by emphasising its function in forming positive user perception. Existing research had also supported this result. For instance, Ho et al. (2020) demonstrated nurses would be more likely to understand the importance of technology and rapidly master its primary functions if they had systematic, high-quality instruction [107]. Additionally, this training not only fosters a positive attitude and confidence towards the use of technology, but also offers healthcare professionals the opportunity to experience firsthand on how useful it is in clinical settings through hands-on demonstrations.
However, the hypothesis of H4b was not validated because training did not significantly affect behavioural intention to use directly. This finding is aligned with the findings of some of the existing studies. For example, the study conducted by Weik et al. (2024) discovered that the healthcare professionals’ intention to use relevant medical equipment was not even increasing after training completion. This could be as a result of their propensity to view training as an addition to theoretical information rather than as a means of imparting operational skills, particularly in clinical settings [108]. Under this cognition, the training lacks direct value for them, thus affecting their behavioural use intention of the technology. Additionally, it is extremely difficult to allocate more time for training due to the heavy workload of emergency department healthcare professionals, which may further weaken their trust and attention to training [108].
In addition, the hypothesis of H6 is also supported by the findings of this study, that is, attitude toward use has a beneficial effect on behavioural intention to use consumption. According to the findings, it is encouraged that healthcare professionals hold positive attitudes toward medical technology has the potential to enhance their behavioural intention to employ the medical technology. The obtained finding aligns with the core proposition of TAM, which also emphasises the importance of attitudes in determining behavioural intentions. At the same time, the results of this study are consistent with the results of several studies. For example, Walle et al. (2023) discovered that the attitude of healthcare professionals had a big influence on their willingness to use medical technology [66]. Besides that, Wang et al. (2023) noted that attitude has a significant role in encouraging intention to use [71]. This relationship was further supported by the study conducted by Kalayou et al. (2020), which showed that healthcare professionals are more likely to exhibit a high propensity to employ medical technology when they perceive it has practical value, which may increase efficiency or lessen the burden [68]. In summary, the adoption of healthcare professionals of medical technology is significantly influenced by their attitude.
In addition to the significant direct relationship between perceived usefulness, T, and attitude toward use, the hypotheses of H2a, H2b, H3a, and H3b are not supported, as both perceived ease of use (PEOU) and organisational support (OS) are shown to have no significant direct influence on either attitude toward use or behavioural intention to use.
First, the hypothesis of H2a, that is, perceived ease of use has no significant direct effect on attitude toward use. Some studies have come to a similar conclusion, despite the fact that this runs counter to the findings of the majority of studies [66,109]. Chau and Hu (2002), for instance, noted that perceived ease of use has minimal impact on attitude toward use. Researchers believe that this may be related to the stronger professional ability of healthcare professional, making it easier for them to adapt to complex systems, so this factor will not effectively affect the attitude of healthcare professional in the emergency department towards new technologies [51]. In addition, Monthuy-Blanc et al. (2013) also believed that unless ease of use is an indispensable condition, it will not significantly affect attitudes [51]. Healthcare professionals are more concerned about the practical value of technology rather than whether it is easy to operate, especially in high-pressure environments such as emergency departments.
Besides that, the hypothesis of H2b of this study, which is perceived ease of use has a positive relationship with behavioural intention to use, was also found to be not supported. Similar results were found by Pan and Gao (2021), who pointed out that perceived ease of use was not a decisive variable in nurses’ readiness to accept technology [105]. Nurses are more concerned with how technology may improve nursing quality than with how easy it is to use, particularly in high-stress settings like emergency departments, when the usefulness of the technology is the main factor. Thus, considering all of these evident, perceived ease of use is not necessarily a deciding factor in medical technology acceptance.
After that, the next hypothesis is the hypothesis of H3a, the effect of organisational support on attitude toward use, which was found to have no significant direct effect in this study. This runs against the findings of certain studies [110,111]. Nonetheless, a few studies have different opinions. For instance, Kwak et al. (2022) noted that some healthcare professionals are hesitant to change their work habits as the implementation of new technology may interfere with the current workflow [84]. Therefore, it is challenging to change emergency department healthcare professionals’ attitudes towards new technology, even with organisational support.
Then follows the hypothesis of H3b, organisational support on behavioural intention to use, which this study revealed to have no discernible direct impact. Despite the fact that this result is at odds with the findings of the majority of studies [110,111], some have come to similar conclusions. For example, Alsyouf et al. (2022) argue that if technology does not bring clear advantages, even if the organisation provides adequate support, healthcare professionals’ interest and willingness to use technology will remain low [112]. It is evident that organisational support by itself is insufficient to encourage the use of technology unless such support can be converted into meaningful advantages for the workplace.
This implies that, although these variables are frequently highlighted in adoption literature, their impact in an emergency department setting can be minimal or indirect. Thus, this study supports the view that in clinical settings, particularly the emergency departments, actual application value, which is the key determinant of technology adoption, is more important than perceived ease of use and organisational support.
In addition to the direct path, this study contained an indirect path with attitude toward use as a mediating variable. The findings are displayed in Table 15. According to the study’s findings, attitude toward use fully mediates the relationship between perceived usefulness and behavioural intention to use, supporting the hypothesis of H5a. This finding indicates that healthcare professionals are more likely to have a positive attitude and be more willing to use the technology if they perceive that it would help them. This finding is consistent with the original theory of the TAM model and the results of studies that conducted by Chawla and Joshi (2023) and Lee (2023), both of which demonstrate that perceived usefulness may indirectly impact behavioural intention by establishing pleasant attitudes [113,114].
Furthermore, the hypothesis of H5d was confirmed, which suggests that attitude toward use fully mediates the relationship between training and behavioural intention to use. This finding indicates that healthcare professionals who have received proper training are more likely to embrace technology because they have a more favourable outlook on it. This result is consistent with the findings of the study that conducted by Seboka et al. (2021), which highlights the value of training in fostering adoption behaviour and enhancing attitudes [79].
Conversely, the hypothesis of H5b was not validated, which means that attitude toward use failed to serve as a mediator variable between perceived ease of use and behavioural intention to use. This indicates that even if healthcare professionals have a favourable opinion of technology, which is caused by its ease of use, their desire to use it will not be greatly increased. Although this finding goes against the original TAM theory, it is in line with the findings of Siripipatthanakul et al.’s (2023) study, which noted that attitude towards usage is not always the key to influencing behavioural intention through perceived ease of use [115].
Besides, there was no evidence to support the hypothesis of H5c, which means that attitude toward use failed to function as a mediator between organisational support and behavioural intention to use. This suggests that, although the ease of use of the device may have elicited positive emotions among healthcare professionals, these attitudes did not increase intention to use the device. This finding differs from that of Malarvizhi et al. (2025) [116], but it is in line with Kwak et al. (2022), who argue that while organisational support contributes to promoting positive attitudes, its effect on actual intention to use is minor [84].
In summary, this study examined the mediating function of the attitude toward use in addition to confirming the direct influence of each variable on behavioural intention to use. The findings of this study demonstrate that a few indirect pathways are noteworthy, which highlights the key role of attitude toward use plays in encouraging the adoption of technology, particularly in the influencing pathways of perceived usefulness and training. However, there is no significant indirect effect of perceived ease of use and organisational support on behavioural intention to use through the attitude toward use. This suggests that in an emergency, technological ease of use and organisational support might not be enough to translate into a clear intention to use. Overall, the findings of this study suggest that the existence of a mediating effect varies depending on the environment and that the process of technological adoption may be more complicated, requiring careful evaluation of several variables rather than depending only on one mechanism.
6.2. Theoretical Contributions
As technology has advanced, numerous studies have found the importance for the healthcare industry to adopt new developments, as technology is thought to greatly enhance healthcare procedures and service quality. However, the majority of the research concentrated on the overall hospital environment rather than the particular requirements of each department, which causes a research gap in this field. Therefore, by starting with the emergency department, this study is anticipated to close the gaps in the current literature and offer theoretical and methodological references for further relevant research.
The TAM is used as the theoretical framework for this study. In order to capture possible influencing factors that impact the acceptability of technological improvements in the emergency department, this study incorporated organisational support and training into the TAM and redesigned it. This is due to the fact that prior research has shown that training and organisational support are both significant determinants of the factors that impact the adoption of technology advancements in the healthcare industry [1,68,73,75,76,77,78,80,82]. This extension expands the theoretical scope of TAM by including individual cognitive elements, organisational and environmental aspects, and so on.
According to the result, perceived ease of use and organisational support have no significant impact on the adoption of technology innovations in emergency departments. On the other hand, perceived usefulness and training are proven to have a considerable impact, which may be considered a key influencing factor in emergency departments. This result goes against the fundamental assumption of TAM that perceived ease of use is one of the most important factors that influence the behavioural intention. Based on the findings, healthcare professionals are more likely to base their decision to accept technology on usefulness than ease of use in a high-risk and fast-paced setting like the emergency department. This implies that the predictive ability of TAM could rely on the environment and could influence significant original TAM constructs, such as perceived ease of use. In addition to the above, this result demonstrates that including training can improve the theoretical explanatory power of TAM, as training is found to have a significant direct influence on attitude toward use and an indirect influence on behavioural intention to use. This implies that in high-pressure settings like the emergency department, TAM should be extended to incorporate external factors beyond personal perceptions in order to provide a more solid foundation for technology adoption. As a result, one of the theoretical contributions of this study is to provide an expanded TAM model with a greater explanatory power in the medical profession, particularly in high-pressure settings like the emergency department.
The attitude toward use is one of the main components of the TAM model, although some research eliminated it from the framework because they thought that behavioural intention to use might be used to explain the attitude toward use, raising doubts about its theoretical validity. This research included attitude since it added two new factors based on the original TAM framework, which are organisational support and T. It is anticipated that training and organisational support would have an indirect impact on healthcare professionals’ intentions to utilise technology by influencing their attitudes. According to the results, attitude toward use still plays a mediating function in high-stress medical settings such as the emergency department. This is due to the relationship between perceived usefulness and training and behavioural intention to use is strongly mediated by attitude toward use, offering a further empirical evidence in favour of its theoretical validity. As a result, attitude toward use is a crucial mediator variable, particularly in high-stress medical settings like emergency departments, which is another theoretical contribution of this study.
In summary, this study offers important insights for particular improvements that must be made in the real use of technology in high-pressure settings by concentrating on the high-pressure setting of emergency departments. By extending the applicability of established models such as TAM to more specialised and demanding healthcare settings, these context-specific findings are able to provide information for the literature on technology adoption, which contributes theoretically. In this study, it was found that adding factors beyond subjective perception might considerably improve TAM’s explanatory power in hectic, high-pressure settings. In addition, this study demonstrated that attitude toward use is an indispensable mediating variable of TAM.
6.3. Practical Contributions
Based on the study’s findings, technology suppliers and hospital administrators alike can benefit from the valuable suggestions that this study has provided. The purpose of the suggested recommendations is to increase emergency department healthcare professionals’ adoption and willingness to use technology advancements. Additionally, the suggestions are ranked according to the findings of the Importance-Performance Map Analysis (IPMA) in order to improve technology adoption more effectively.
In line with the Importance-Performance Map Analysis (IPMA), this study emphasises the significance of attitude toward use in affecting behavioural intention to use. According to IPMA, attitude toward use is the most important factor and scores second highest in terms of performance. This finding reveals that healthcare professionals who have a positive attitude towards using medical technologies are more likely to have a favourable behavioural intention to use it. Therefore, hospital administrators should concentrate on encouraging healthcare professionals to have a positive attitude about the usage of new technologies. Hospital administrators should use useful tactics in addition to communications and meaningless statements to successfully improve healthcare professionals’ positive attitudes towards technology. For instance, hospital administrators should plan brief peer-sharing sessions during healthcare professionals’ breaks to emphasise prior successful experiences with technology adoption, given the hectic activity of the emergency department. Additionally, they can incorporate interactive technology demonstrations into their regular briefings. These approaches match the fast-paced nature of emergency department work while providing repeated, low-stress interactions that gradually increase healthcare professionals’ acceptability and confidence.
The results of this study also aid hospital administrators in allocating resources as efficiently as possible. The results imply that attitudes among healthcare professionals toward the use of medical technologies are influenced by perceived usefulness and ultimately affect their intention to use the technology. The IPMA results showed that perceived utility was effective in promoting the adoption of the emergency department technology, ranking second in significance only to attitude toward use and performing best for behavioural intention. Hospital administrators should have redirected resources for technology deployment in line with the findings in order to successfully improve the acceptance of technological developments by emergency department healthcare professionals. As a result, hospital administrators have to give top priority to funding emergency care-related technology, such as technologies that provide smooth integration with critical systems like imaging, laboratory findings, and triage data, as well as real-time access to patient values. In addition, hospital administrators should solicit feedback from emergency department healthcare professionals before implementing the technology to verify that the technology can directly assist time-sensitive clinical procedures, hence increasing its perceived usefulness.
Additionally, this study also suggests that training can improve healthcare professionals’ views on the use of new technologies, which in turn influences their propensity to use new technologies in the future. training rated third out of all variables in this study’s IPMA results, indicating that it significantly affects behavioural intention to use. Therefore, training not only serves to boost healthcare professionals’ technical confidence, but it is also a key factor in boosting technology adoption. Thus, hospital administrators should offer organised training programs to enhance healthcare professionals’ technical competency based on the study’s findings. Hospital administrators must give training that is realistic and adaptable to the emergency department’s unexpected and demanding environment. Consequently, it is recommended that hospital administrators create scenario-based training materials that replicate actual emergency department scenarios. This makes it possible for emergency department healthcare professionals to swiftly learn how to use technology. Additionally, hospital administrators can also provide healthcare professionals access to brief educational materials, including brief movies or app-based advice, that they may read on their phones during downtime.
In addition to the above, the findings of this study provide technology providers with insightful information. The study found that healthcare professionals in emergency rooms face particular technology challenges in a high-stress environment. In light of these challenges, technology providers should provide emergency departments with tailored solutions that are more practical and align with clinical practice. This might make it easier for healthcare professionals in emergency departments to adopt new technology. For instance, emergency department healthcare professionals should be involved in the creation of technology by technology providers so that usability testing may be done to handle the hectic and high-pressure nature of emergency care. By doing this, the technology may be swiftly optimised for emergency departments to meet the objectives of increasing productivity and decreasing burden. For example, the technology can be used to expedite paperwork, provide notifications for patients whose conditions worsen and so on. Besides that, technology providers may prevent issues integrating new and existing systems, increase implementation speed, and prevent repetitive alterations that impact emergency department efficiency by consulting pertinent personnel, such as healthcare professionals.
It is anticipated that adopting these recommendations will result in a considerable rise in the acceptance and adoption of technological innovations by emergency department healthcare professionals. Patients may eventually gain indirect advantages from it. This is due to the fact that better workflows and the right technological assistance may greatly enhance healthcare professionals’ job performance and raise the standard of emergency treatment.
6.4. Limitations of The Research
Despite the fact that this work has made substantial theoretical and practical contributions, demonstrating its significance, there are several limitations that compromise the accuracy of the findings. First of all, this study used a quantitative research design and a cross-sectional research design for data collection. The cross-sectional study design is a method of data collection in which all the data is gathered at a single moment in time. By employing this methodology, the study may encounter an issue that findings cannot accurately represent the change in attitudes and behavioural intentions of healthcare professionals towards the use of medical technologies along with the time-to-time advancement of medical technology in emergency departments.
Second, the self-report approach employed in this study could have resulted in response bias. Response bias is the result of individuals giving socially acceptable replies, overestimating their level of technological proficiency, or completing the questionnaire carelessly or without fully comprehending the questions. Moreover, respondents were unable to communicate with the researchers directly because this study relied on Google Forms for data collection. This may have decreased the questionnaire’s overall dependability and affected the precision of the data gathered since respondents who were having trouble with questions were unable to receive prompt assistance from researchers.
Additionally, the focus of this study is limited to four independent variables, which are perceived usefulness, perceived ease of use, organisational support and T. Hence, other potential influencing factors may be undervalued. Although this study concentrates on the important factors mentioned in earlier research, it is still possible that the model would overlook other factors that might impact the adoption of technological breakthroughs, such as peer pressure, system quality, or individual innovation capacity. The neglect of these factors might restrict the explanatory power of the model and limit the comprehensiveness of the research results.
Furthermore, the sample size of this study is 140, which is seen to be small in relation to the population of its intended respondents, even though the data came from a variety of Malaysian institutions. A larger sample size is ideal for obtaining reliable results when the population under research is large. Consequently, the results may not accurately reflect the perspective of emergency department healthcare professionals due to the small sample size of this study. This may eventually result in inaccurate findings, such as false negatives, which is the failure to identify a real impact, or false positives, which is the detection of an effect that does not exist.
6.5. Recommendations for Future Research
Following the discussion of the limitations of this study, several recommendations are presented for further research on the same topic. First of all, a longitudinal study design should be taken into consideration for future research. This method enables the researchers to monitor the evolution of healthcare professionals’ attitudes and behavioural intentions from time to time along with the organisation’s assistance and training. This could result in more precise findings.
Furthermore, future research might consider conducting a study using a mixed-methods research approach. Because mixed-methods research designs incorporate both qualitative and quantitative research designs, researchers may use this design to conduct in-person interviews and engage with respondents while gathering survey data. As a result, researchers could ensure that only the respondents who fulfil the requirements of the research are selected. Meanwhile, researchers could also provide them with extra information for the respondents to have a better understanding of the survey. This could effectively prevent respondents from filling out and submitting forms without as much deliberation or understanding, which normally only results in inaccurate findings. Additionally, a mixed-methods study design would allow the researcher to observe the emotional responses of the respondents toward the use of new medical technology, which could provide further documentation of their attitude towards that technology.
In addition, future research could include additional variables to identify potentially influencing factors. The model of the theoretical framework of a research study, such as TAM, UTAUT, and so on, may have increased predictive power when additional variables are included. The increase in predictive power means that the model may have the explanatory ability for the potentially influencing factors. This may ultimately build a greater understanding of the potentially influencing factors that affect the adoption of technology innovations. Thus, this may more likely result in a valid conclusion. For example, future research should include variables such as system quality, peer pressure, or previous technology experience that may affect users’ attitudes and intentions. Hence, they will be able to develop a more complete model that reflects the real world better.
Moreover, to better extend this research as a general estimation to other groups of healthcare professionals, a larger sample size should be examined. This is because a small sample size is a potential source of inaccuracies in the findings, whereas a larger sample size is better at creating a more accurate representation of the target population when the target population is larger. Besides that, a larger sample size is simultaneously more advantageous for estimates and better able to identify the actual effect. On top of that, a larger sample size has the potential to support researchers in generalising findings to another situation. Thus, researchers should consider a larger sample size, as it allows an in-depth investigation of respondents’ interests, including age, employment function, years of experience, or hospital type, and their effects on behavioural intention. A large sample indicates a more heterogeneous sample size, as it includes more respondents and a range of their characteristics. This allows for a greater richness of behaviour patterns that can inform the development of context-specific strategies for applying technologies for different groups of healthcare professionals.
6.6. Conclusion
The purpose of this research is to investigate why healthcare professionals in emergency departments are reluctant to adopt new technologies. In this research, the TAM model is used and is revised by adding two novel variables, which are “organisational support” and “training”. Since this study focused on emergency departments in particular, the target group is healthcare professionals working in emergency departments and aged from 25 to 60 years or older. The reasoning behind this age range is that they would have demonstrable experience of working in an emergency department, which would provide a level of support or further insight into the use of medical technologies. In this study, Google Forms was used as the sampling tool to gather a total of 140 responses, and SPSS and SmartPLS were used for the analysis of the data collected.
Based on the results of this study, the variables “perceived usefulness” and “training” can be regarded as having an effect on the attitudes of healthcare professionals towards the use of medical technologies. Furthermore, the “attitude” of healthcare professionals toward the use of medical technologies has a significant effect on their “behavioural intention to use” them. Additionally, the relationship between “perceived usefulness” and “behavioural intention to use”, as well as between “training” and “behavioural intention to use”, is significantly mediated by the mediator variable, “attitude toward use”.
The study provides both theoretical and practical contributions based on the findings. From a theoretical standpoint, this study includes two variables in the TAM, which are “organisational support” and “training”. The extended TAM is expected to offer a more focused framework for studies on technology adoption in the extremely demanding setting, such as the emergency department. Besides that, this study demonstrated the necessity of the “attitude toward use”, highlighting the significance of including it as a mediator variable in high-stress settings such as the emergency department. It is believed that this will help to fill the research gap of insufficient focus on specific departments in earlier healthcare-related studies.
From the practical standpoint, the results of this study offer helpful recommendations for both hospital administrators and technology providers to help them to optimise the process of implementing technology by focusing on factors that have a significant influence on the attitudes and behavioural intentions of healthcare professionals regarding the use of technology, such as “perceived usefulness”, “training” and “attitude toward use”. It is believed that future programs could more effectively encourage the adoption of medical technology in emergency departments and better meet the actual needs of healthcare professionals by taking into account these important factors. In addition, this study also provides valuable perspectives for future healthcare-related research, such as employing longitudinal designs to document the changes in attitudes and behavioural intention of healthcare professionals over time in order to enhance the accuracy of the findings and generate deeper insights. The research approach and findings of this study can serve as a guide to refine their findings and carry out more thorough studies in the healthcare industry. The findings of this study are expected to benefit all stakeholders, including hospital management, technology providers, and emergency department healthcare professionals.
In conclusion, this study can provide a more precise comprehension of the challenges that the emergency departments face during the adoption of new technologies by focusing on the unique conditions of a specific department, as well as how technological innovations can be successfully implemented into the emergency department setting. In this way, this study can successfully support a more seamless digital transformation in the healthcare industry. In addition to significantly enhancing hospital administration, this study found how perceived usefulness, training, and usage attitudes interacted. This result assists educators and policymakers in redesigning professional training curricula to better suit the emergency department setting, favourably impacting healthcare professionals’ attitudes towards technological learning, and contributing to global health professional education development. Furthermore, the findings of this study offer strategic direction for the implementation of novel technologies and useful recommendations to facilitate the efficient utilisation of medical technology in high-stress medical settings, such as emergency departments.
Author Contributions
Methodology, R.K.R. and A.S.; software, A.S. and A.T.L; validation, A.T.L.; formal analysis, A.T.L.; investigation, A.T.L.; resources, R.K.R. and A.T.L.; data curation, A.T.L.; supervision, R.K.R. and A.S.; writing—original draft, A.T.L.; writing—review and editing, R.K.R. and A.S. All authors have read and agreed to the published version of the manuscript.
Funding
This research received no funding.
Institutional Review Board Statement
Human volunteers served as participants in this study, which was carried out in accordance with ethical standards for studies using human beings. The Multimedia University Research Ethics Committee has granted ethical permission for this study on July 3, 2024 (approval number: EA0232024). Before beginning the study, each participant gave their informed consent, and no personally identifying information was gathered. Only the researcher and supervisor will have secure access to the data, which will only be used for academic reasons.
Informed Consent Statement
All participants were informed of the purpose and procedures of the study before participating in the study and gave their voluntary consent. All participants were guaranteed anonymity and confidentiality and had the right to withdraw at any time. This study obtained ethical approval (EA0232024) and complied with the principles of the Personal Data Protection Act (PDPA).
Data Availability Statement
The anonymous data from this study will be used for academic research only. The raw data are not publicly accessible due to ethical and privacy constraints. However, it is available upon reasonable request and with approval from the Multimedia University Research Ethics Committee.
Conflicts of Interest
The authors declare no conflicts of interest.
Abbreviations
The following abbreviations are used in this manuscript:
| WHO | World Health Organization |
| TAM | Technology Acceptance Model |
| TRA | Theory of Reasoned Action |
| UTAUT | Unified Theory of Acceptance and Use of Technology |
| PEOU | Perceived Ease of Use |
| PU | Perceived Usefulness |
| OS | Organisational Support |
| T | Training |
| ATU | Attitude Toward Use |
| BIU | Behavioural Intention to Use |
| FC | Facilitating Conditions |
| EHR | Electronic Health Records |
| SPSS | Statistical Package for the Social Sciences |
| SEM | Structural Equation Modelling |
| PLS-SEM | Partial Least Squares SEM |
| CMV | Common Method Variance |
| CMB | Common Method Bias |
| RMSE | Root-Mean-Square Error |
| MAE | Mean Absolute Error |
| IPMA | Importance-Performance Map Analysis |
| MDPI | Multidisciplinary Digital Publishing Institute |
| DOAJ | Directory of open access journals |
| TLA | Three letter acronym |
| LD | Linear dichroism |
References
- Vărzaru; Bocean, C. G. Digital Transformation and Innovation: The Influence of Digital Technologies on Turnover from Innovation Activities and Types of Innovation. Systems 2024, vol. 12(no. 9), 359. [Google Scholar] [CrossRef]
- Strassner; Gajdoš Kljusuri, J.; Raposo, A.; Hassoun, A.; Cropotova, J. Consumer acceptance of new food trends resulting from the fourth industrial revolution technologies: A narrative review of literature and future perspectives. eCollection 2022. Front. Nutr. 2022. [Google Scholar] [CrossRef]
- Bekbolatova, M.; Mayer, J.; Ong, C. W.; Toma, M. Transformative Potential of AI in Healthcare: Definitions, Applications, and Navigating the Ethical Landscape and Public Perspectives. Healthcare 2024, vol. 12(no. 2), 125. [Google Scholar] [CrossRef] [PubMed]
- Thacharodi. Revolutionizing healthcare and medicine: The impact of modern technologies for a healthier future—A comprehensive review. Health Care Science 2024, vol. 3(no. 5), 329–349. [Google Scholar] [CrossRef] [PubMed]
- Evans, H.; Snead, D. Understanding the errors made by artificial intelligence algorithms in histopathology in terms of patient impact. NPJ Digit. Med. 2024, vol. 7(no. 1). [Google Scholar] [CrossRef]
- Zhang, K. Revolutionizing Health Care: The Transformative Impact of Large Language Models in Medicine. J. Med. Internet Res. 2025, vol. 27, e59069. [Google Scholar] [CrossRef] [PubMed]
- Evans, M. I.; Britt, D. W. Resistance to Change. Reproductive Sciences 2023, vol. 30(no. 3), 835–853. [Google Scholar] [CrossRef]
- Karan. Achieving universal health coverage and sustainable development goals by 2030: investment estimates to increase production of health professionals in India. Hum. Resour. Health 2023, vol. 21(no. 1). [Google Scholar] [CrossRef]
- World Health Organization. HEALTH WORKFORCE REQUIREMENTS FOR UNIVERSAL HEALTH COVERAGE AND THE SUSTAINABLE DEVELOPMENT GOALS Background paper No. 1 to the Global Strategy on Human Resources for Health. 2016. Available online: http://www.who.int/about/licensing/.
- AAMC. U.S. physician workforce data dashboard. In Association of American Medical Colleges; 2023. [Google Scholar]
- Senbekov, M. The recent progress and applications of digital technologies in healthcare: A review. In Hindawi Limited; 2020. [Google Scholar] [CrossRef]
- Shah, S. M.; Khan, R. A. Secondary use of electronic health record: Opportunities and challenges. IEEE Access 2020, vol. 8, 136947–136965. [Google Scholar] [CrossRef]
- Nittari, G.; Savva, D.; Tomassoni, D.; Tayebati, S. K.; Amenta, F. Telemedicine in the COVID-19 Era: A Narrative Review Based on Current Evidence. In MDPI; 01 May 2022. [Google Scholar] [CrossRef]
- Ghaffar Nia, N.; Kaplanoglu, E.; Nasab, A. Evaluation of artificial intelligence techniques in disease diagnosis and prediction. In Springer Nature; 01 Dec 2023. [Google Scholar] [CrossRef]
- Duncan, R.; Eden, R.; Woods, L.; Wong, I.; Sullivan, C. Synthesizing Dimensions of Digital Maturity in Hospitals: Systematic Review. J. Med. Internet Res. 2022, vol. 24(no. 3), e32994. [Google Scholar] [CrossRef]
- Jat, Singh; Grønli, T.-M.; Ghinea, G. “Technological Utilization in Remote Healthcare: Factors Influencing Healthcare Professionals’ Adoption and Use,” 2024. Available online: https://orcid.org/0000-0001-7473-3010.
- Visclosky, T.; Funk, T.; Agubosim, C.; Chaou, C.-H.; Mahajan, P. Global Perspectives on Innovations in Emergency Care during the COVID-19 Pandemic: A Mixed Methods Study. J. Emerg. Trauma Shock 2024, vol. 17(no. 2), 66–72. [Google Scholar] [CrossRef]
- Morlotti; Cattaneo, M.; Paleari, S.; Manelli, F.; Locati, F. The digitalization of emergency department triage: the perspectives of health professionals and patients. BMC Health Serv. Res. 2024, vol. 24(no. 1). [Google Scholar] [CrossRef] [PubMed]
- Fahim, Y. A.; Hasani, I. W.; Kabba, S.; Ragab, W. M. Artificial intelligence in healthcare and medicine: clinical applications, therapeutic advances, and future perspectives. Eur. J. Med. Res. 2025, vol. 30(no. 1), 848. [Google Scholar] [CrossRef] [PubMed]
- Rabbani, S. A. Generative Artificial Intelligence in Healthcare: Applications, Implementation Challenges, and Future Directions. BioMedInformatics 2025, vol. 5(no. 3), 37. [Google Scholar] [CrossRef]
- Gün, M. Can AI match emergency physicians in managing common emergency cases? A comparative performance evaluation. BMC Emerg. Med. 2025, vol. 25(no. 1), 142. [Google Scholar] [CrossRef]
- Pavedahl, V.; Muntlin, Å.; Summer Meranius, M.; von Thiele Schwarz, U.; Holmström, I. K. Prioritizing and meeting life-threateningly ill patients’ fundamental care needs in the emergency room—An interview study with registered nurses. J. Adv. Nurs. 2022, vol. 78(no. 7), 2165–2174. [Google Scholar] [CrossRef]
- Patil, S. A NEW SERVICE MODEL FOR IDENTIFYING AND IMPROVING THE QUALITY OF EMERGENCY DEPARTMENT OPERATIONS IN TERTIARY SETTINGS; 2024. [Google Scholar]
- Sartini, M. Overcrowding in Emergency Department: Causes, Consequences, and Solutions—A Narrative Review 2022, MDPI. [CrossRef]
- Hussein, H.; Jawad, M.; Hassan, Z. “Behavior Intention of Chronic Illness Patients in Malaysia to Use IoT-based Healthcare Services,” 2023. Available online: https://www.researchgate.net/publication/372372180.
- Aleksandra, S.; Robert, K.; Klaudia, K.; Dawid, L.; Mariusz, S. Artificial Intelligence in Optimizing the Functioning of Emergency Departments; a Systematic Review of Current Solutions. In Shaheed Beheshti University of Medical Sciences and Health Services; 2024. [Google Scholar] [CrossRef]
- Almansouri, N. E. Early Diagnosis of Cardiovascular Diseases in the Era of Artificial Intelligence: An In-Depth Review. Cureus 2024. [Google Scholar] [CrossRef]
- Armoundas. “Use of Artificial Intelligence in Improving Outcomes in Heart Disease: A Scientific Statement From the American Heart Association,” Apr. 02, 2024. In Lippincott Williams and Wilkins. [CrossRef]
- David-Olawade, Clement; Olawade, D. B.; Ojo, I. O.; Famujimi, M. E.; Olawumi, T. T.; Esan, D. T. Nursing in the Digital Age: Harnessing telemedicine for enhanced patient care. Informatics and Health 2024, vol. 1(no. 2), 100–110. [Google Scholar] [CrossRef]
- Atta, R. M. Cost-effective vital signs monitoring system for COVID-19 patients in smart hospital. Health Technol. (Berl). 2022, vol. 12(no. 1), 239–253. [Google Scholar] [CrossRef]
- Chen, Q.; Sheng, N. A novel health monitoring system for vital signs using IoT. Sci. Rep. 2024, vol. 14(no. 1). [Google Scholar] [CrossRef] [PubMed]
- Jamal; Alsaedi, M.; Parandkar, P. Portable Smart Emergency System Using Internet of Things (IOT). Mesopotamian Journal of Big Data 2023, 77–82. [Google Scholar] [CrossRef]
- Jerry. “REVISTA DE INTELIGENCIA ARTIFICIAL EN MEDICINA,” 2023. Available online: https://redcrevistas.com/index.php/Revista.
- Salem, M.; Elkaseer, A.; El-Maddah, I. A. M.; Youssef, K. Y.; Scholz, S. G.; Mohamed, H. K. Non-Invasive Data Acquisition and IoT Solution for Human Vital Signs Monitoring: Applications, Limitations and Future Prospects 2022, MDPI. [CrossRef]
- Buaka, S. D.; Moid, M. Z. I. AI and medical imaging technology: evolution, impacts, and economic insights. Journal of Technology Transfer 2024. [Google Scholar] [CrossRef]
- Fathi, M. Potential strength and weakness of artificial intelligence integration in emergency radiology: a review of diagnostic utilizations and applications in patient care optimization. In Springer Science and Business Media Deutschland GmbH; 2024. [Google Scholar] [CrossRef]
- Liu, J.; Varghese, B.; Taravat, F.; Eibschutz, L. S.; Gholamrezanezhad, A. An Extra Set of Intelligent Eyes: Application of Artificial Intelligence in Imaging of Abdominopelvic Pathologies in Emergency Radiology. In Multidisciplinary Digital Publishing Institute (MDPI); 01 Jun 2022. [Google Scholar] [CrossRef]
- Pinto-Coelho, L. How Artificial Intelligence Is Shaping Medical Imaging Technology: A Survey of Innovations and Applications. In Multidisciplinary Digital Publishing Institute (MDPI); 01 Dec 2023. [Google Scholar] [CrossRef]
- Alowais, S. A. Revolutionizing healthcare: the role of artificial intelligence in clinical practice. In BioMed Central Ltd; 01 Dec 2023. [Google Scholar] [CrossRef]
- Cellina, M. Artificial Intelligence in Emergency Radiology: Where Are We Going? In Multidisciplinary Digital Publishing Institute (MDPI); 01 Dec 2022. [Google Scholar] [CrossRef]
- Waran, V.; Thillainathan, R.; Karuppiah, R.; Pickard, J. D. Equitable Access to State-of-the-Art Medical Technology—a Malaysian Mini–Public-Private Partnership Case Study. World Neurosurg. 2022, vol. 157, 135–142. [Google Scholar] [CrossRef]
- Hira, H. Khalid; Moshiul, A. M. Blockchain-based electronic health records: Revolutionizing healthcare in Malaysia. Asia Pacific Journal of Health Management 2024, vol. 19(no. 1), 226–233. [Google Scholar] [CrossRef]
- Zulkipli, N.; Hussin, N.; Yatin, S. F. M.; Ismail, A. Review: Challenges and Obstacles of Trusted Elements for Mobile Health Records Management; MDPI AG, Sep 2022. [Google Scholar] [CrossRef]
- Sahalan, M. I.; Yusof, F.; Abas, H. The challenges of using blockchain technology for medical data in public hospitals in Malaysia Article history. 2023. [Google Scholar]
- Loo, J. S. E. Exploring the rise of telehealth services in Malaysia: A retrospective study. Digit. Health 2023, vol. 9. [Google Scholar] [CrossRef]
- Tan, S. H.; Wong, C. K.; Yap, Y. Y.; Tan, S. K. Factors influencing telemedicine adoption among physicians in the Malaysian healthcare system: A revisit. Digit. Health 2024, vol. 10. [Google Scholar] [CrossRef]
- Na, F. Mh; Ay, N.; Mss, C. H.; Fauzi, M. H. KNOWLEDGE AND ATTITUDE TOWARDS CARDIOPULMONARY RESUSCITATION AND DEFIBRILLATION AMONG GENERAL PRACTITIONERS IN MELAKA, MALAYSIA; 2024. [Google Scholar]
- Mohd Mazlan, M. F.; Salleh, S. Z.; Ab Karim, M. S.; Abd Razak, N. A. Design and development of automated dispensing machine as medical device-based application: A review. Proc. Inst. Mech. Eng. C J. Mech. Eng. Sci. 2022, vol. 236(no. 18), 10033–10050. [Google Scholar] [CrossRef]
- Ziatdinov, R.; Atteraya, M. S.; Nabiyev, R. The Fifth Industrial Revolution as a Transformative Step towards Society 5.0. Societies 2024, vol. 14(no. 2), 19. [Google Scholar] [CrossRef]
- Aldwean; Tenney, D. Artificial Intelligence in Healthcare Sector: A Literature Review of the Adoption Challenges. Open Journal of Business and Management 2024, vol. 12(no. 01), 129–147. [Google Scholar] [CrossRef]
- Rouidi, M.; Elouadi, A.; Hamdoune, A. Acceptance and use of telemedicine technology by health professionals: Development of a conceptual model. Digit. Health 2022, vol. 8. [Google Scholar] [CrossRef] [PubMed]
- Davis, D.; Bagozzi, R. P.; Warshaw, P. R. User Acceptance of Computer Technology: A Comparison of Two Theoretical Models. Manage. Sci. 1989, vol. 35(no. 8), 982–1003. [Google Scholar] [CrossRef]
- Musa, G.; Fatmawati, I.; Nuryakin, N.; Suyanto, M. “Marketing research trends using technology acceptance model (TAM): a comprehensive review of researches (2002–2022),” 2024. In Cogent OA. [CrossRef]
- Leong, M. K.; Chaichi, K. The Adoption of Technology Acceptance Model (TAM) and Trust in Influencing Online Purchase Intention During the Covid-19 Pandemic: Empirical Evidence from Malaysia. International Journal of Academic Research in Business and Social Sciences 2021, vol. 11(no. 8). [Google Scholar] [CrossRef]
- Venkatesh, V.; Morris, M. G.; Davis, G. B.; Davis, F. D. User Acceptance of Information Technology: Toward a Unified View; 2003. [Google Scholar]
- Xue, L.; Rashid, A. M.; Ouyang, S. The Unified Theory of Acceptance and Use of Technology (UTAUT) in Higher Education: A Systematic Review. In SAGE Publications Inc.; 01 Jan 2024. [Google Scholar] [CrossRef]
- Sheikhtaheri; Taheri Moghadam, S.; Dehnad, A.; Tatarpoor, P. Factors influencing nurses’ acceptance of patient safety reporting systems based on the unified theory of acceptance and use of technology (UTAUT). Inform. Med. Unlocked 2024, vol. 49, 101554. [Google Scholar] [CrossRef]
- Zhu, Y. Understanding Use Intention of mHealth Applications Based on the Unified Theory of Acceptance and Use of Technology 2 (UTAUT-2) Model in China. Int. J. Environ. Res. Public Health 2023, vol. 20(no. 4). [Google Scholar] [CrossRef]
- Suravi, S. Training and development in the hybrid workplace. In Emerald Publishing; 13 Feb 2024. [Google Scholar] [CrossRef]
- Jeni, F. A.; Momotaj; Al-Amin, Md. The Impact of Training and Development on Employee Performance and Productivity: An Empirical Study on Private Bank of Noakhali Region in Bangladesh. South Asian Journal of Social Studies and Economics 2021, 1–18. [Google Scholar] [CrossRef]
- Ferdiana, S.; Khan, Z.; Ray, S. Investigating the Impact of Career Development, Organizational Commitment, and Organizational Support on Employee Retention. Journal of Management Studies and Development 2023, vol. 2(no. 02), 117–128. [Google Scholar] [CrossRef]
- Tang, Y.; Wang, Y.; Zhou, H.; Wang, J.; Zhang, R.; Lu, Q. The relationship between psychiatric nurses’ perceived organizational support and job burnout: Mediating role of psychological capital. Front. Psychol. 2023, vol. 14. [Google Scholar] [CrossRef]
- Ekaimi, S.; Utomo, P.; Gunawan, D.; Jimmy, S. Y.; Christian, M. Examining the Factors Influencing Teleconsultation Adoption During the Pandemic Using the TAM Model. Global Business and Finance Review 2024, vol. 29(no. 3), 149–160. [Google Scholar] [CrossRef]
- Zin, K. S. L. T.; Kim, S.; Kim, H. S.; Feyissa, I. F. A Study on Technology Acceptance of Digital Healthcare among Older Korean Adults Using Extended Tam (Extended Technology Acceptance Model). Adm. Sci. 2023, vol. 13(no. 2). [Google Scholar] [CrossRef]
- Alqudah; Al-Emran, M.; Shaalan, K. Technology acceptance in healthcare: A systematic review. In MDPI; 01 Nov 2021. [Google Scholar] [CrossRef]
- Walle, D. Predicting healthcare professionals’ acceptance towards electronic personal health record systems in a resource-limited setting: using modified technology acceptance model. BMJ Health Care Inform. 2023, vol. 30(no. 1). [Google Scholar] [CrossRef] [PubMed]
- Alsyouf. The Use of a Technology Acceptance Model (TAM) to Predict Patients’ Usage of a Personal Health Record System: The Role of Security, Privacy, and Usability. Int. J. Environ. Res. Public Health 2023, vol. 20(no. 2). [Google Scholar] [CrossRef] [PubMed]
- Kalayou, M. H.; Endehabtu, B. F.; Tilahun, B. The applicability of the modified technology acceptance model (Tam) on the sustainable adoption of ehealth systems in resource-limited settings. J. Multidiscip. Healthc. 2020, vol. 13, 1827–1837. [Google Scholar] [CrossRef]
- Kang, M. J.; Hwang, Y. C. Exploring the Factors Affecting the Continued Usage Intention of IoT-Based Healthcare Wearable Devices Using the TAM Model. Sustainability (Switzerland) 2022, vol. 14(no. 19). [Google Scholar] [CrossRef]
- Nazari-Shirkouhi, S.; Badizadeh, A.; Dashtpeyma, M.; Ghodsi, R. A model to improve user acceptance of e-services in healthcare systems based on technology acceptance model: an empirical study. J. Ambient Intell. Humaniz. Comput. 2023, vol. 14(no. 6), 7919–7935. [Google Scholar] [CrossRef]
- Wang, Y. Predicting pediatric healthcare provider use of virtual reality using a technology acceptance model. JAMIA Open 2023, vol. 6(no. 3). [Google Scholar] [CrossRef]
- Daragmeh; Lentner, C.; Sági, J. FinTech payments in the era of COVID-19: Factors influencing behavioral intentions of ‘Generation X’ in Hungary to use mobile payment. J. Behav. Exp. Finance 2021, vol. 32, 100574. [Google Scholar] [CrossRef]
- Shahbaz, M.; Gao, C.; Zhai, L.; Shahzad, F.; Arshad, M. R. Moderating Effects of Gender and Resistance to Change on the Adoption of Big Data Analytics in Healthcare. Complexity vol. 2020, 2020. [CrossRef]
- Semaan, J. Underwood; Hyde, J. An investigation of work-based education and training needs for effective bim adoption and implementation: An organisational upskilling model. Applied Sciences (Switzerland) 2021, vol. 11(no. 18). [Google Scholar] [CrossRef]
- Nugroho, H. S. W.; Notobroto, H. B.; Rosyanti, L. Acceptance model of a mandatory health information system in Indonesia. Healthc. Inform. Res. 2021, vol. 27(no. 2), 127–136. [Google Scholar] [CrossRef] [PubMed]
- Almagrashi; Mujalli, A.; Khan, T.; Attia, O. Factors determining internal auditors’ behavioral intention to use computer-assisted auditing techniques: an extension of the UTAUT model and an empirical study. Future Business Journal 2023, vol. 9(no. 1), 74. [Google Scholar] [CrossRef]
- Halbig; Babu, S. K.; Gatter, S.; Latoschik, M. E.; Brukamp, K.; von Mammen, S. Opportunities and Challenges of Virtual Reality in Healthcare – A Domain Experts Inquiry. Front. Virtual Real. 2022, vol. 3. [Google Scholar] [CrossRef]
- Tsarfati; Cojocaru, D. The Importance of Receiving Training in Computerized Technology for Nurses to Maintain Sustainability in the Health System. Sustainability (Switzerland) 2022, vol. 14(no. 23). [Google Scholar] [CrossRef]
- Seboka, T.; Yilma, T. M.; Birhanu, A. Y. Factors influencing healthcare providers’ attitude and willingness to use information technology in diabetes management. BMC Med. Inform. Decis. Mak. 2021, vol. 21(no. 1). [Google Scholar] [CrossRef]
- Iyanna, S.; Kaur, P.; Ractham, P.; Talwar, S.; Najmul Islam, A. K. M. Digital transformation of healthcare sector. What is impeding adoption and continued usage of technology-driven innovations by end-users? J. Bus. Res. 2022, vol. 153, 150–161. [Google Scholar] [CrossRef]
- Shahzad, M. F.; Xu, S.; Baheer, R. Assessing the factors influencing the intention to use information and communication technology implementation and acceptance in China’s education sector. Humanit. Soc. Sci. Commun. 2024, vol. 11(no. 1). [Google Scholar] [CrossRef]
- Choudhury; Asan, O. Impact of accountability, training, and human factors on the use of artificial intelligence in healthcare: Exploring the perceptions of healthcare practitioners in the US. Human Factors in Healthcare 2022, vol. 2, 100021. [Google Scholar] [CrossRef]
- Tu; Luo, S. C.; Lee, Y. L.; Shih, M. F.; Chiu, S. P. Exploring Usability and Patient Attitude towards a Smart Hospital Service with the Technology Acceptance Model. Int. J. Environ. Res. Public Health 2022, vol. 19(no. 10). [Google Scholar] [CrossRef]
- Kwak, Y.; Seo, Y. H.; Ahn, J. W. Nursing students’ intent to use AI-based healthcare technology: Path analysis using the unified theory of acceptance and use of technology. Nurse Educ. Today 2022, vol. 119, 105541. [Google Scholar] [CrossRef] [PubMed]
- Ren, Z.; Zhou, G. Analysis of Driving Factors in the Intention to Use the Virtual Nursing Home for the Elderly: A Modified UTAUT Model in the Chinese Context. Healthcare (Switzerland) 2023, vol. 11(no. 16). [Google Scholar] [CrossRef] [PubMed]
- Xie, W.; Huang, X.; Xu, X.; Chan, D. Y. C. Usage Intention of the Internet of Vehicles: A Study Based on the Technology Acceptance Model. ACM International Conference Proceeding Series, Association for Computing Machinery, Jun. 2020; pp. 118–123. [Google Scholar] [CrossRef]
- Singh, R.; Agarwal, S.; Pandiya, B. Customer experience in diagnostic centres: an empirical study. ResearchGate. 2022. Available online: https://www.researchgate.net/publication/360484190.
- Vidhya; Venkatesh, S. Unveiling the influence of Social Media and Email Campaign of Healthcare services and its perception: Exploring the mediating roles of patient testimonials and trustworthiness. In Atlantis Press; 2024; pp. 133–144. [Google Scholar] [CrossRef]
- Hair, J. F., Jr.; Hult, G. T. M.; Ringle, C. M.; Sarstedt, M.; Danks, N. P.; Ray, S. Partial Least Squares Structural Equation Modeling (PLS-SEM) Using R. 2021. [Google Scholar] [CrossRef]
- Aybek; Toraman, C. How many response categories are sufficient for Likert type scales? An empirical study based on the Item Response Theory. International Journal of Assessment Tools in Education 2022, vol. 9(no. 2), 534–547. [Google Scholar] [CrossRef]
- Sharma, H.; Ruikar, M. Crafting an effective questionnaire: An essential prerequisite of engaging surveys. Perspect. Clin. Res. 2025. [Google Scholar] [CrossRef]
- Abdelwahid, H. A.; Dahlan, H. M.; Mojemamy, G. M.; Al-Harbi, T. J.; Indarkiri, N. Y.; Tourkmani, A. M. Developing and standardizing a tool to assess the health education needs of diabetic patients at Jazan Armed Forces Hospital. Journal of the Egyptian Public Health Association 2025, vol. 100(no. 1), 3. [Google Scholar] [CrossRef]
- Al-Garni, M.; Shati, A. A.; Alamri, H. S.; Mahmood, S. E.; Alsamghan, A. S. Patients’ experience and satisfaction towards virtual health care during the COVID-19 pandemic in southern region of Saudi Arabia. Medicine 2025, vol. 104(no. 6), e41443. [Google Scholar] [CrossRef]
- Hamidi; Roberts, K. Evaluation of AI Chatbots for Patient-Specific EHR Questions. Jun 2023. Available online: http://arxiv.org/abs/2306.02549.
- Kokoska, S.; Nevison, C. Critical Values For The Chi-Square Distribution; 1989; pp. 58–59. [Google Scholar] [CrossRef]
- Too; Lau, S. H.; Tan, C. K. Validity and Reliability of a Conceptual Framework on Enhancing Learning for Students via Kinect: A Pilot Test. International Journal on Robotics, Automation and Sciences 2024, vol. 6(no. 1), 59–63. [Google Scholar] [CrossRef]
- Yang; Hua, J.; Geng, G.; Cui, M.; Yang, W.; Geng, Z. Multidimensional measure of instrumental support in transitional care – design and pilot test of a questionnaire assessing instrumental support among older adults with chronic diseases. BMC Geriatr. 2022, vol. 22(no. 1). [Google Scholar] [CrossRef]
- Bujang; Omar, E. D.; Foo, D. H. P.; Hon, Y. K. Sample size determination for conducting a pilot study to assess reliability of a questionnaire. Restor. Dent. Endod. 2024, vol. 49(no. 1). [Google Scholar] [CrossRef]
- Cheung, W.; Cooper-Thomas, H. D.; Lau, R. S.; Wang, L. C. Reporting reliability, convergent and discriminant validity with structural equation modeling: A review and best-practice recommendations. Asia Pacific Journal of Management 2024, vol. 41(no. 2), 745–783. [Google Scholar] [CrossRef]
- Rasoolimanesh, S. M. Discriminant validity assessment in PLS-SEM: A comprehensive composite-based approach. 2022. Available online: https://www.scriptwarp.com.
- Gapud, S. D.; Hair, J. F. “Mindful Leadership Under Fire: A Validation Study of a Hierarchical Component Model,” in State of the Art in Partial Least Squares Structural Equation Modeling (PLS-SEM): Methodological Extensions and Applications in the Social Sciences and Beyond; Radomir, L., Ciornea, R., Wang, H., Liu, Y., Ringle, C. M., Sarstedt, M., Eds.; Springer International Publishing: Cham, 2023; pp. 245–276. [Google Scholar] [CrossRef]
- Xu, Z.; Gao, F.; Fa, A.; Qu, W.; Zhang, Z. Statistical power analysis and sample size planning for moderated mediation models. Behav. Res. Methods 2024, vol. 56(no. 6), 6130–6149. [Google Scholar] [CrossRef] [PubMed]
- Cohen, J. Statistical Power Analysis for the Behavioral Sciences Second Edition; 1988. [Google Scholar] [CrossRef]
- AK. The effect of mediator variable on the higher heating value estimation of low-rank lignite. International Journal of Coal Preparation and Utilization 2025, 1–15. [Google Scholar] [CrossRef]
- Pan; Gao, W. Determinants of the behavioral intention to use a mobile nursing application by nurses in China. BMC Health Serv. Res. 2021, vol. 21(no. 1). [Google Scholar] [CrossRef] [PubMed]
- Tsai, T. H.; Lin, W. Y.; Chang, Y. S.; Chang, P. C.; Lee, M. Y. Technology anxiety and resistance to change behavioral study of a wearable cardiac warming system using an extended TAM for older adults. PLoS One 2020, vol. 15(no. 1). [Google Scholar] [CrossRef]
- Hussain. The mediating effects of perceived usefulness and perceived ease of use on nurses’ intentions to adopt advanced technology. BMC Nurs. 2025, vol. 24(no. 1). [Google Scholar] [CrossRef]
- Xie; Zhang, P.; Zhu, W. Perceived acceptance, intention to use and actual use behavior of digital information technologies among nursing professionals in Shanghai: a cross-sectional study. BMC Nurs. 2025, vol. 24(no. 1), 431. [Google Scholar] [CrossRef]
- Phorah, K. E.; Motsi, L. Acceptance and adoption determinants of telemedicine in public healthcare institutions. Curationis 2025, vol. 48(no. 1). [Google Scholar] [CrossRef]
- Kim, Y. J.; Choi, J. H.; Fotso, G. M. N. Medical professionals’ adoption of AI-based medical devices: UTAUT model with trust mediation. Journal of Open Innovation: Technology, Market, and Complexity 2024, vol. 10(no. 1). [Google Scholar] [CrossRef]
- Al-Maroof, R. S.; Alhumaid, K.; Salloum, S. The Continuous Intention to Use E-Learning, from Two Different Perspectives; 2020. [Google Scholar] [CrossRef]
- Alsyouf; Ishak, A. K.; Lutfi, A.; Alhazmi, F. N.; Al-Okaily, M. The Role of Personality and Top Management Support in Continuance Intention to Use Electronic Health Record Systems among Nurses. Int. J. Environ. Res. Public Health 2022, vol. 19(no. 17). [Google Scholar] [CrossRef]
- Chawla; Joshi, H. Role of Mediator in Examining the Influence of Antecedents of Mobile Wallet Adoption on Attitude and Intention. Global Business Review 2023, vol. 24(no. 4), 609–625. [Google Scholar] [CrossRef]
- Lee. Attitude As Main Mediating Factor Towards Acceptance Of Telemedicine In Improved Tam Model. International Medical University, 2023. Available online: https://hdl.handle.net/20.500.14377/32017.
- Siripipatthanakul, S.; Limna, P.; Sriboonruang, P.; Kaewpuang, P. Applying the TPB and the UTAUT Models Predicting Intentions to Use Telemedicine Among Thai People During the COVID-19 Pandemic. International Journal of Computing Sciences Research 2023, vol. 7, 1362–1384. [Google Scholar] [CrossRef]
- Malarvizhi, N.; Al Mamun, A.; Reza, M. N. H.; Yang, M. Seniors’ attitudes and intention toward IoT enabled healthcare devices in emerging economies. Sci. Rep. 2025, vol. 15(no. 1). [Google Scholar] [CrossRef]
Figure 1.
Doctors per 10,000 Population in Malaysia (2010–2021).
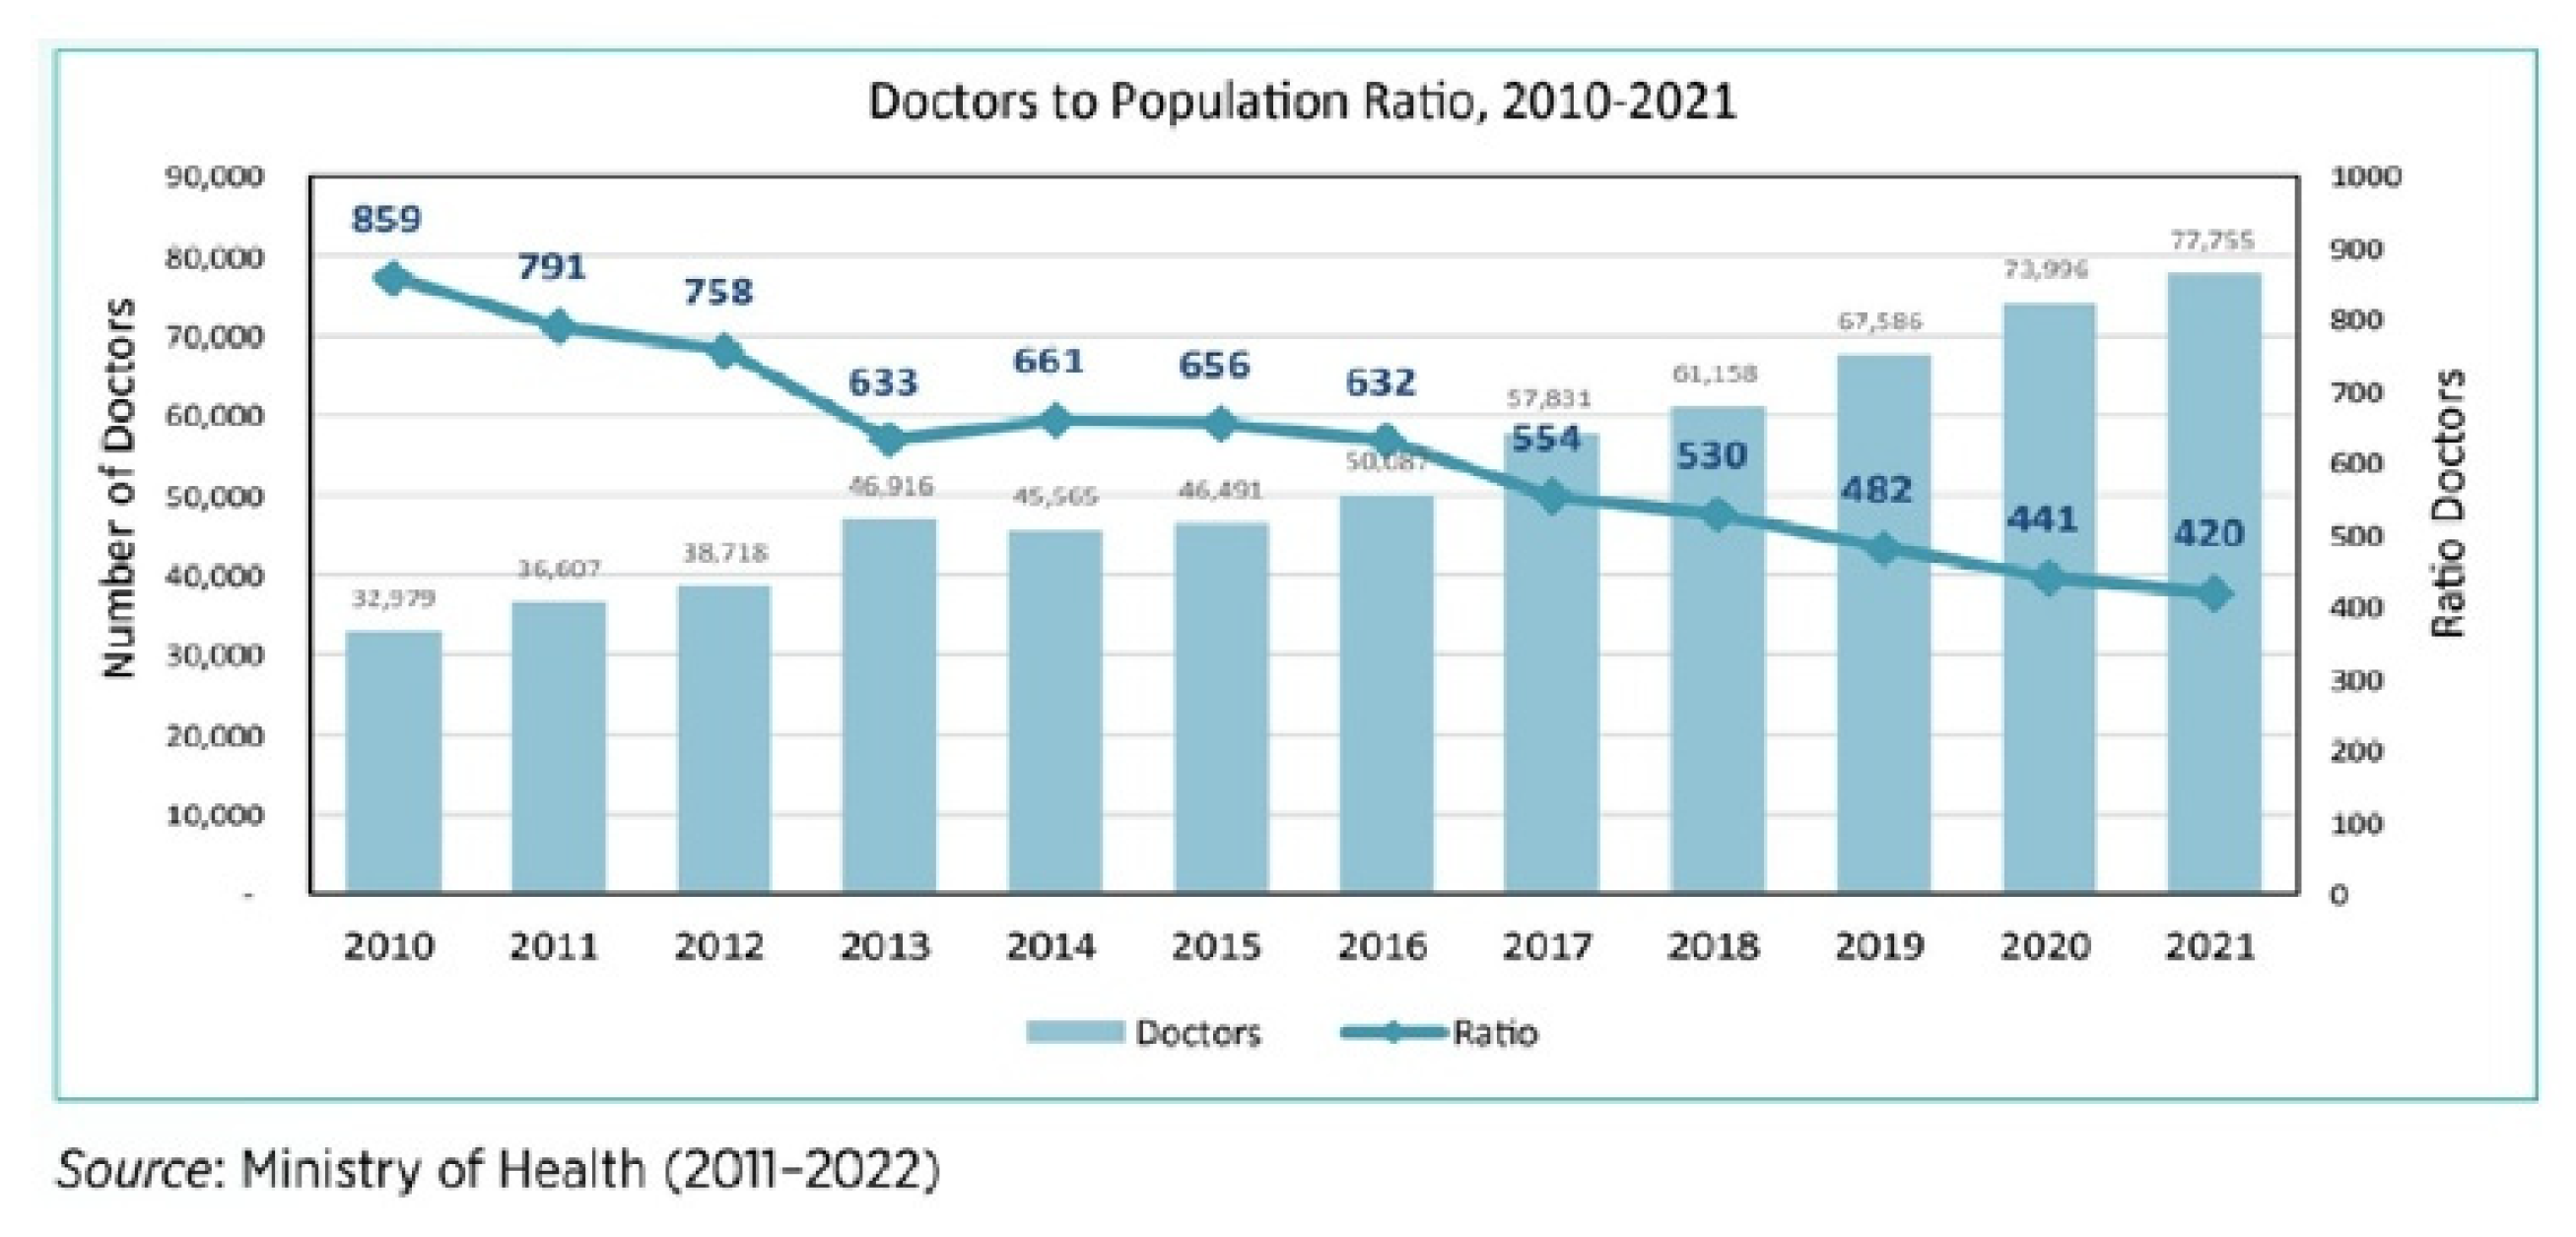
Figure 2.
Physicians per 100,000 Population in the United States by Region.
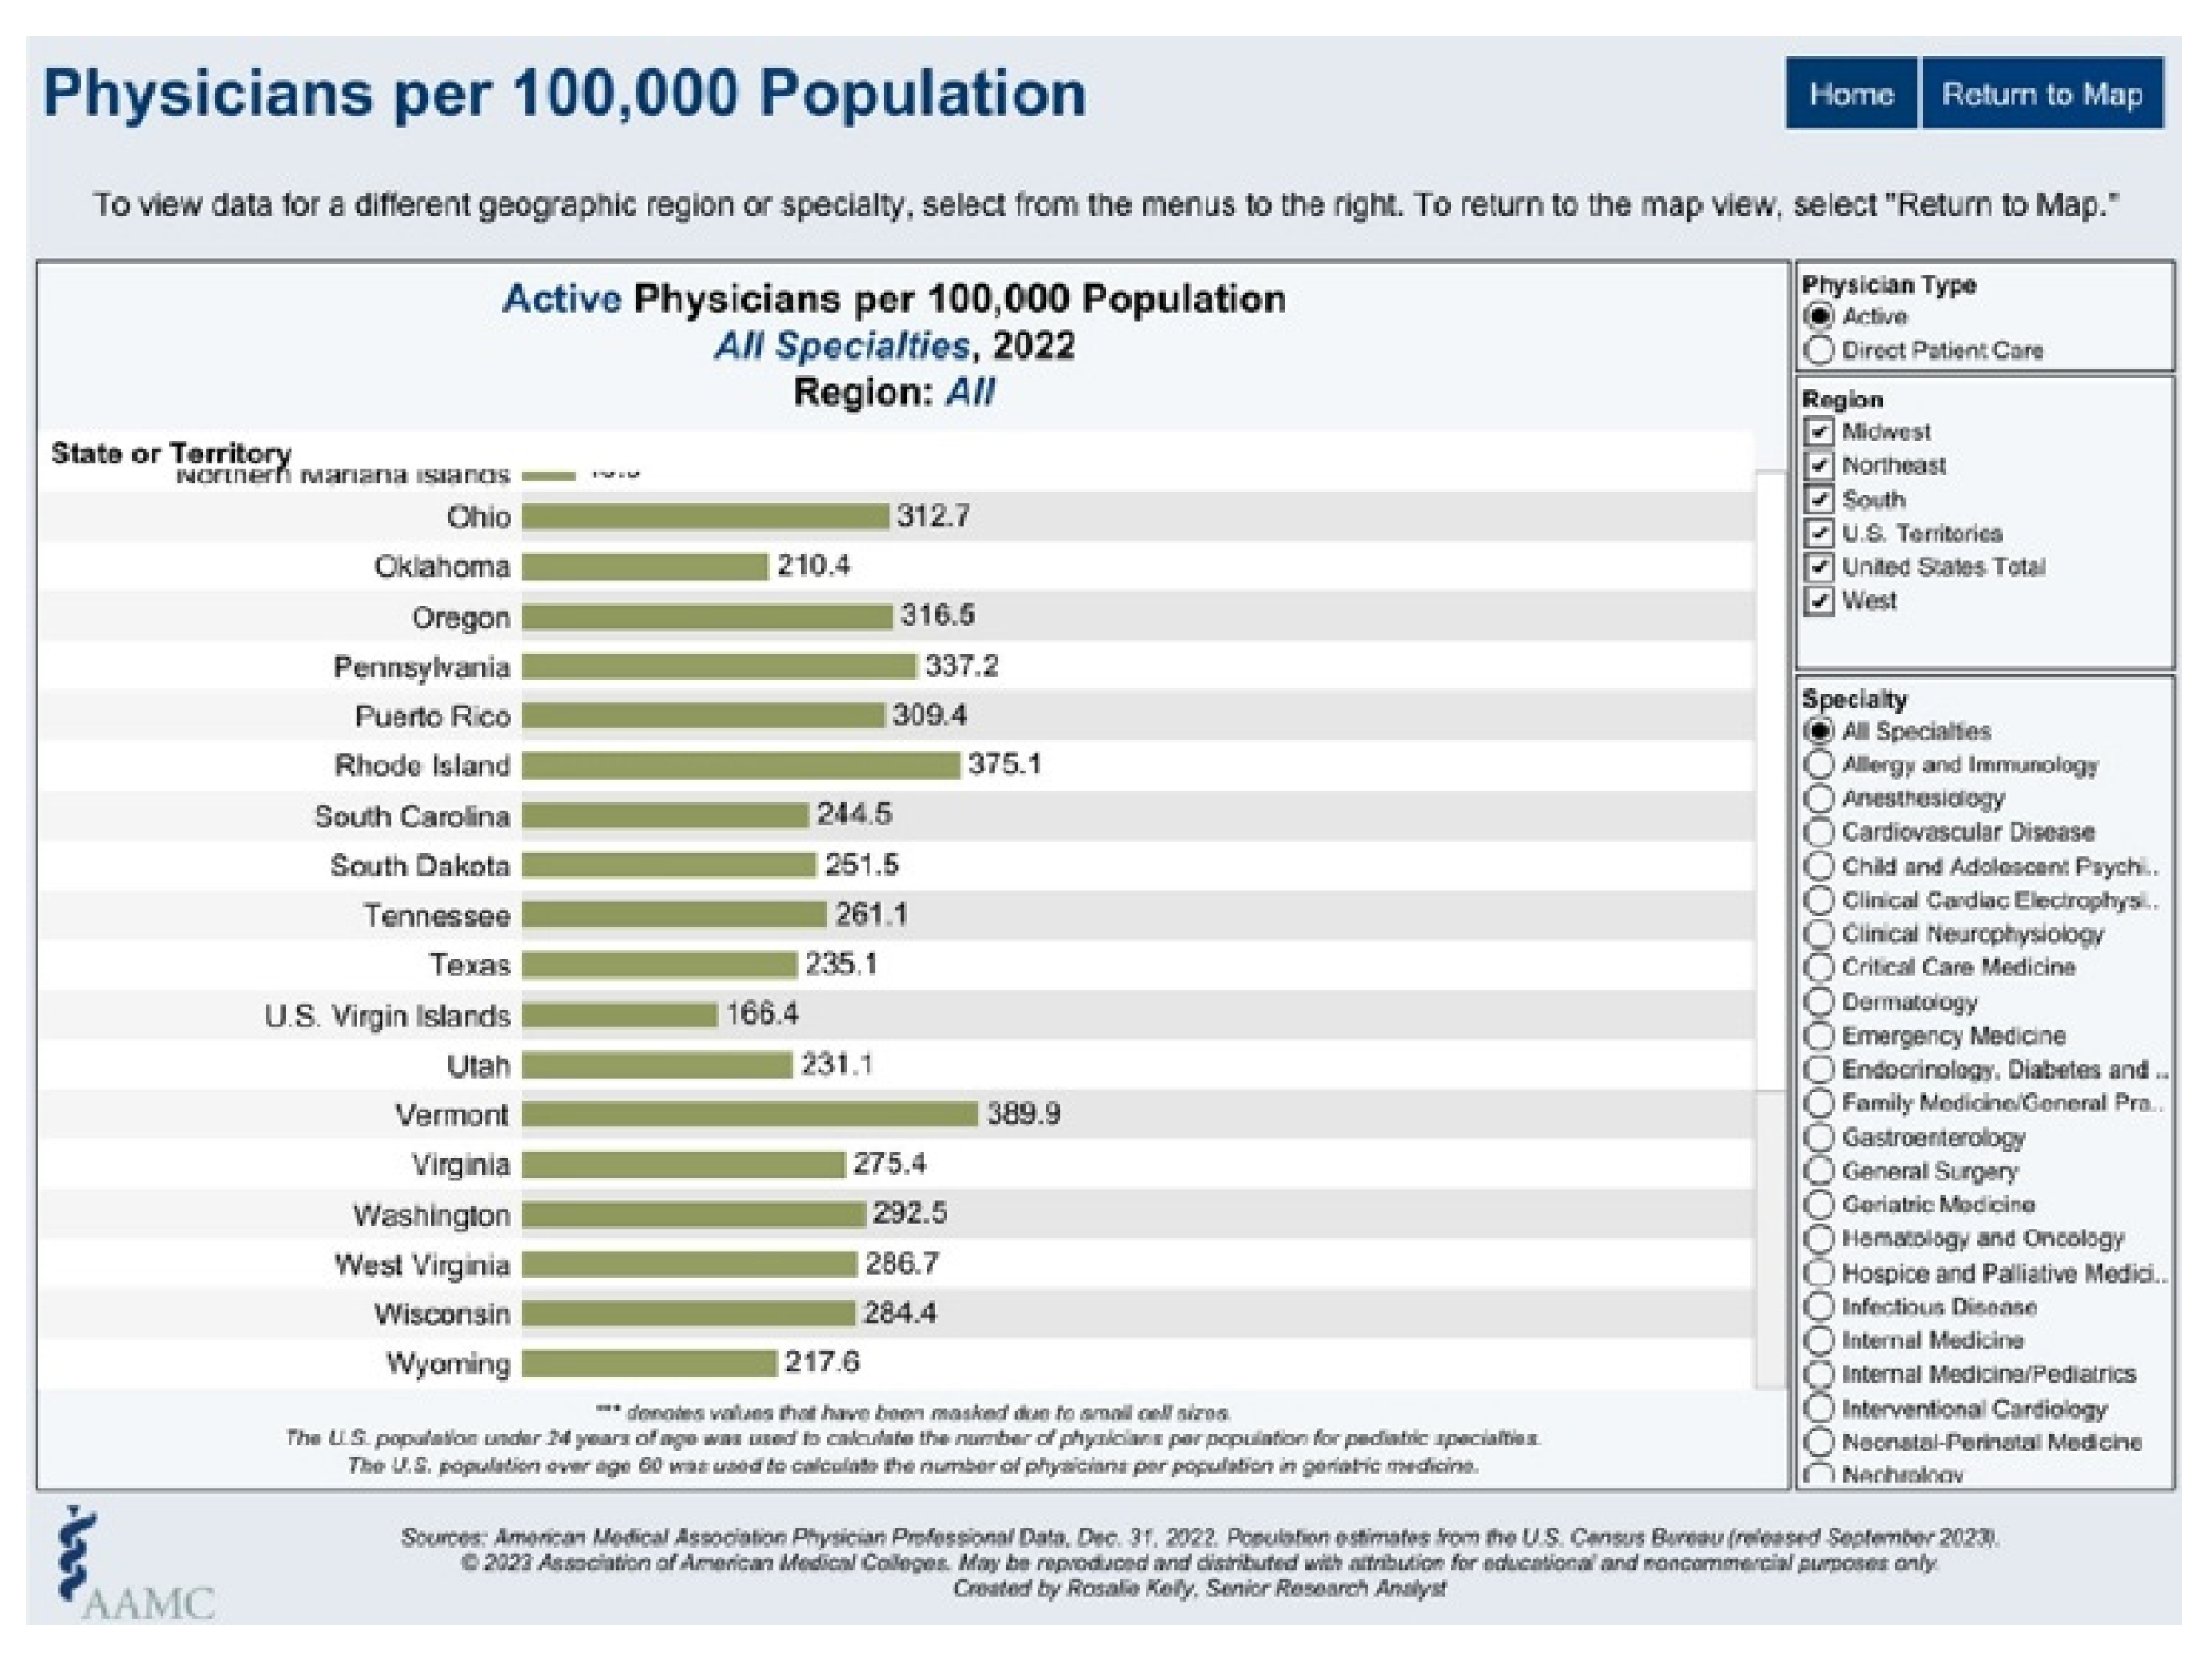
Figure 3.
Revised TAM Framework for the Study.
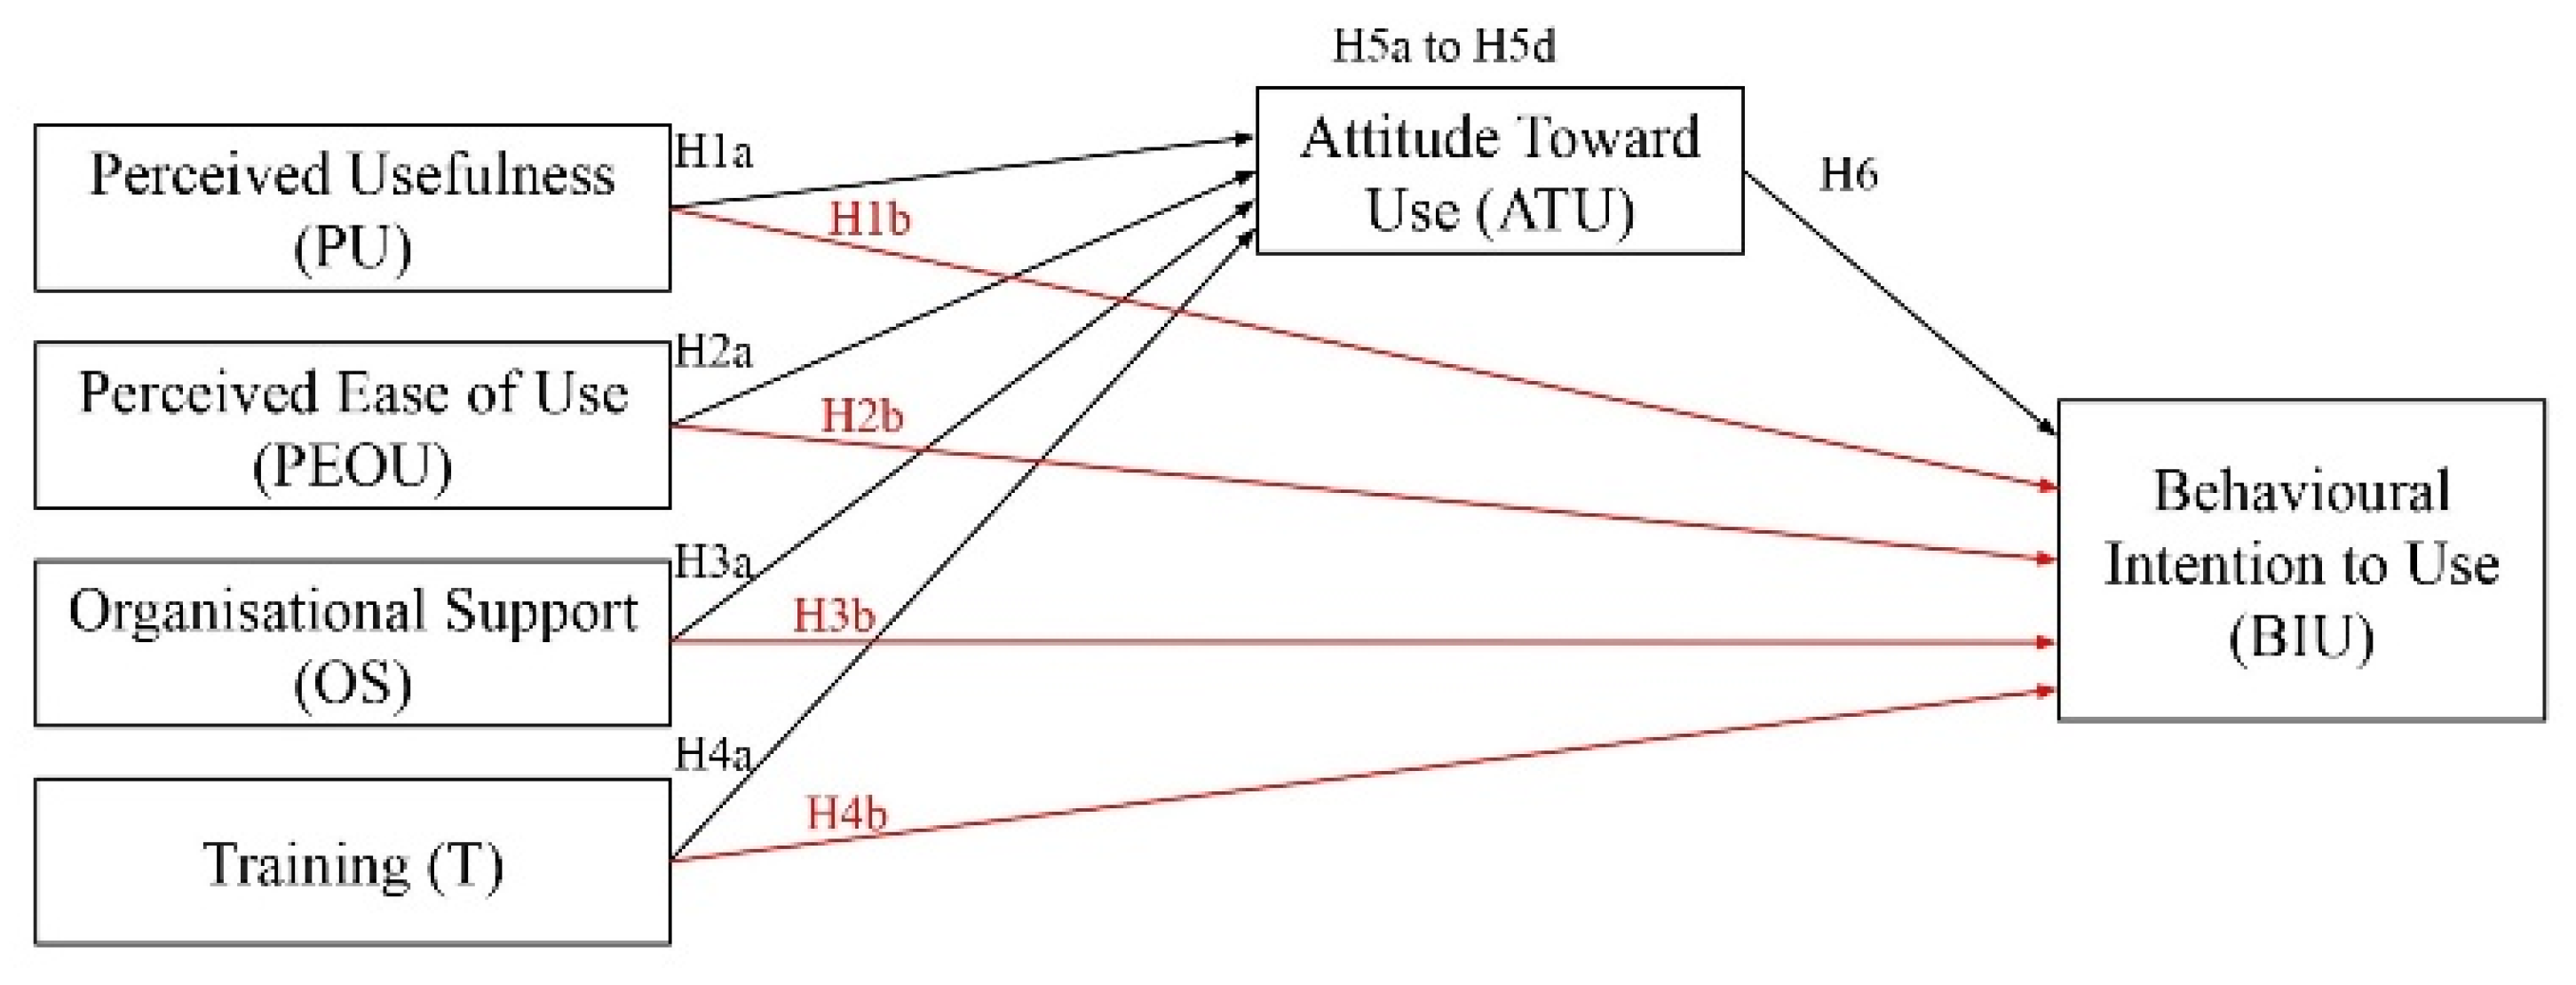
Figure 4.
Mediation Analysis Model with Path Coefficients and Significance Levels.
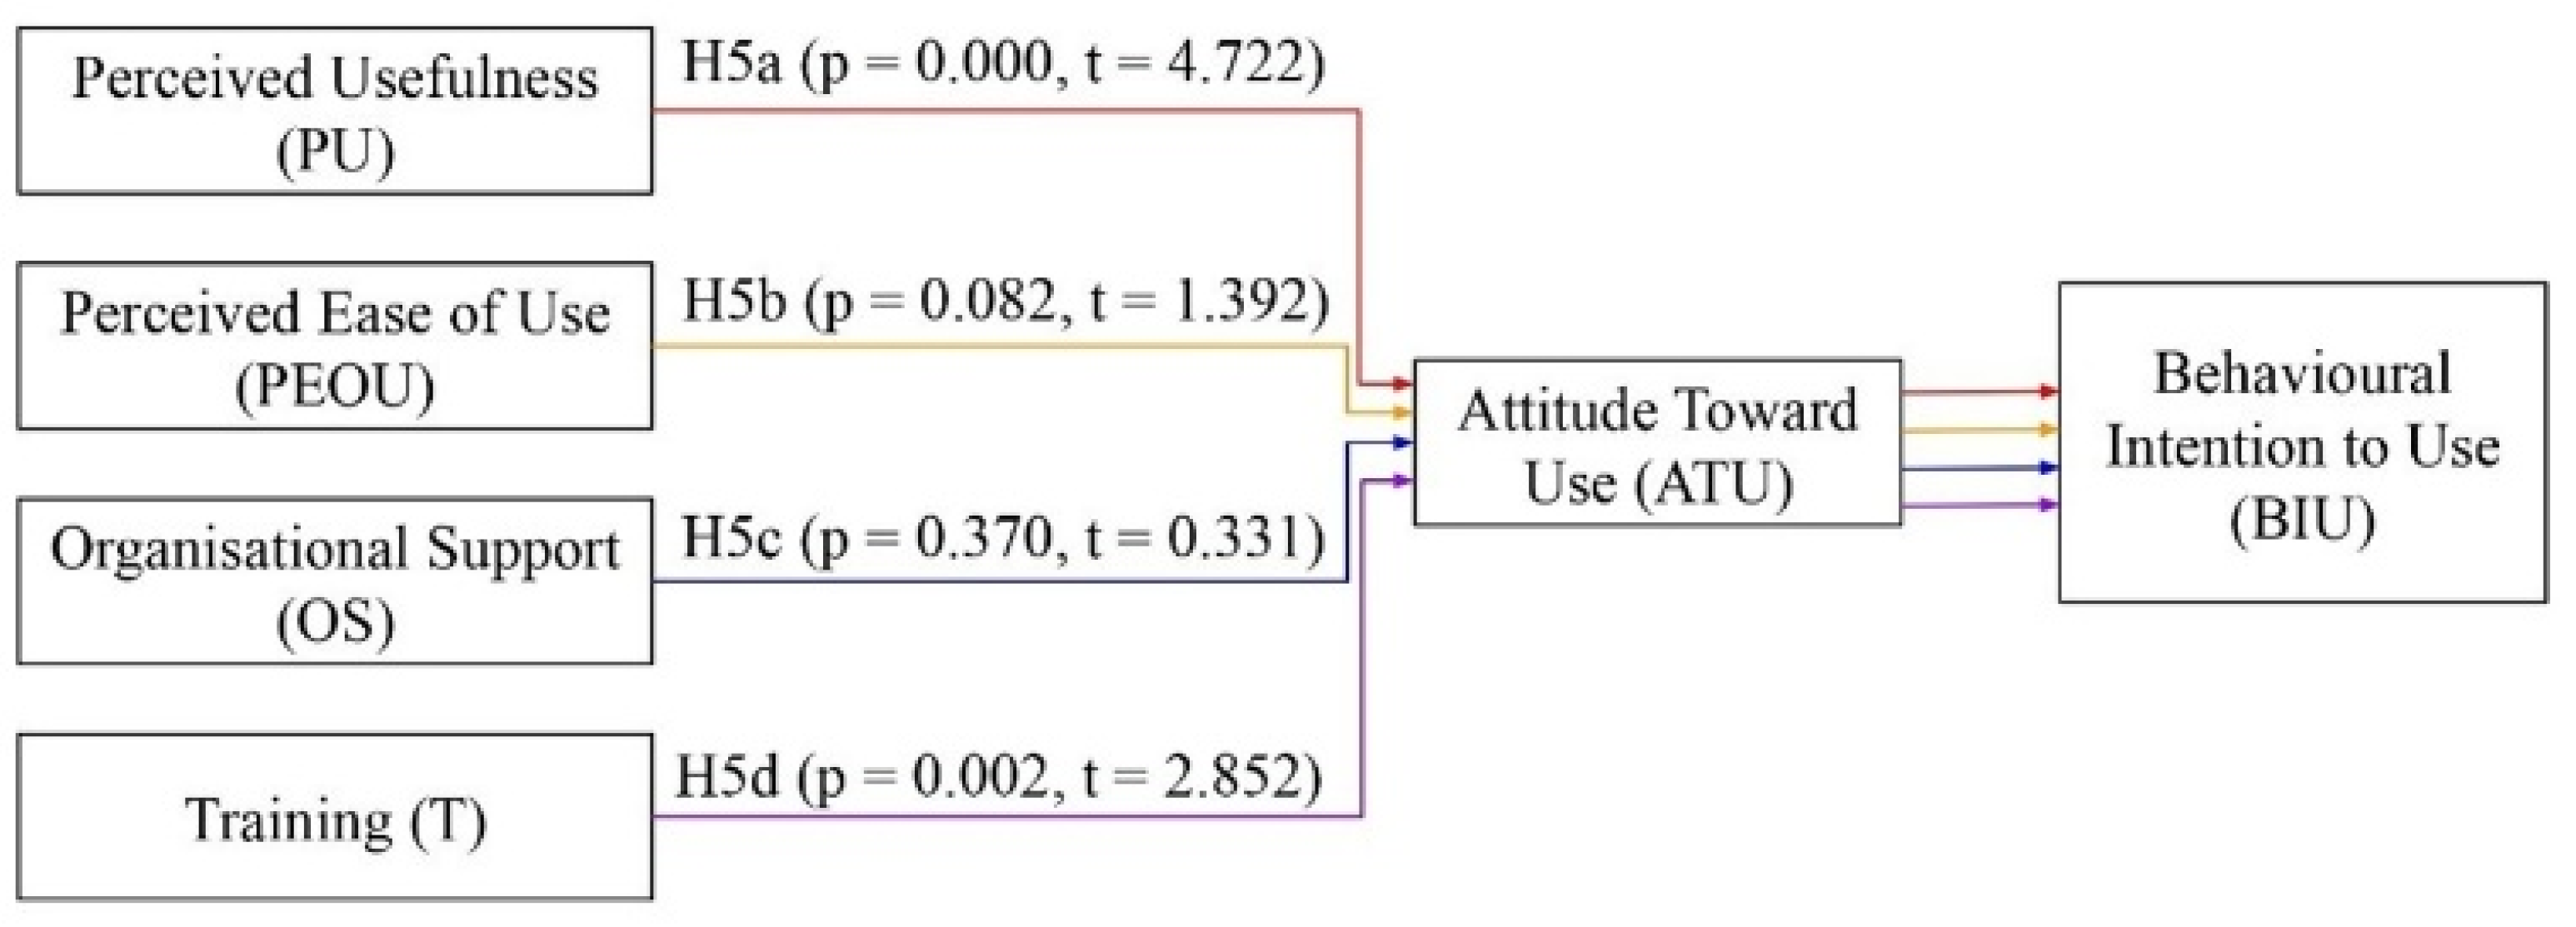
Figure 5.
Importance-Performance Map.
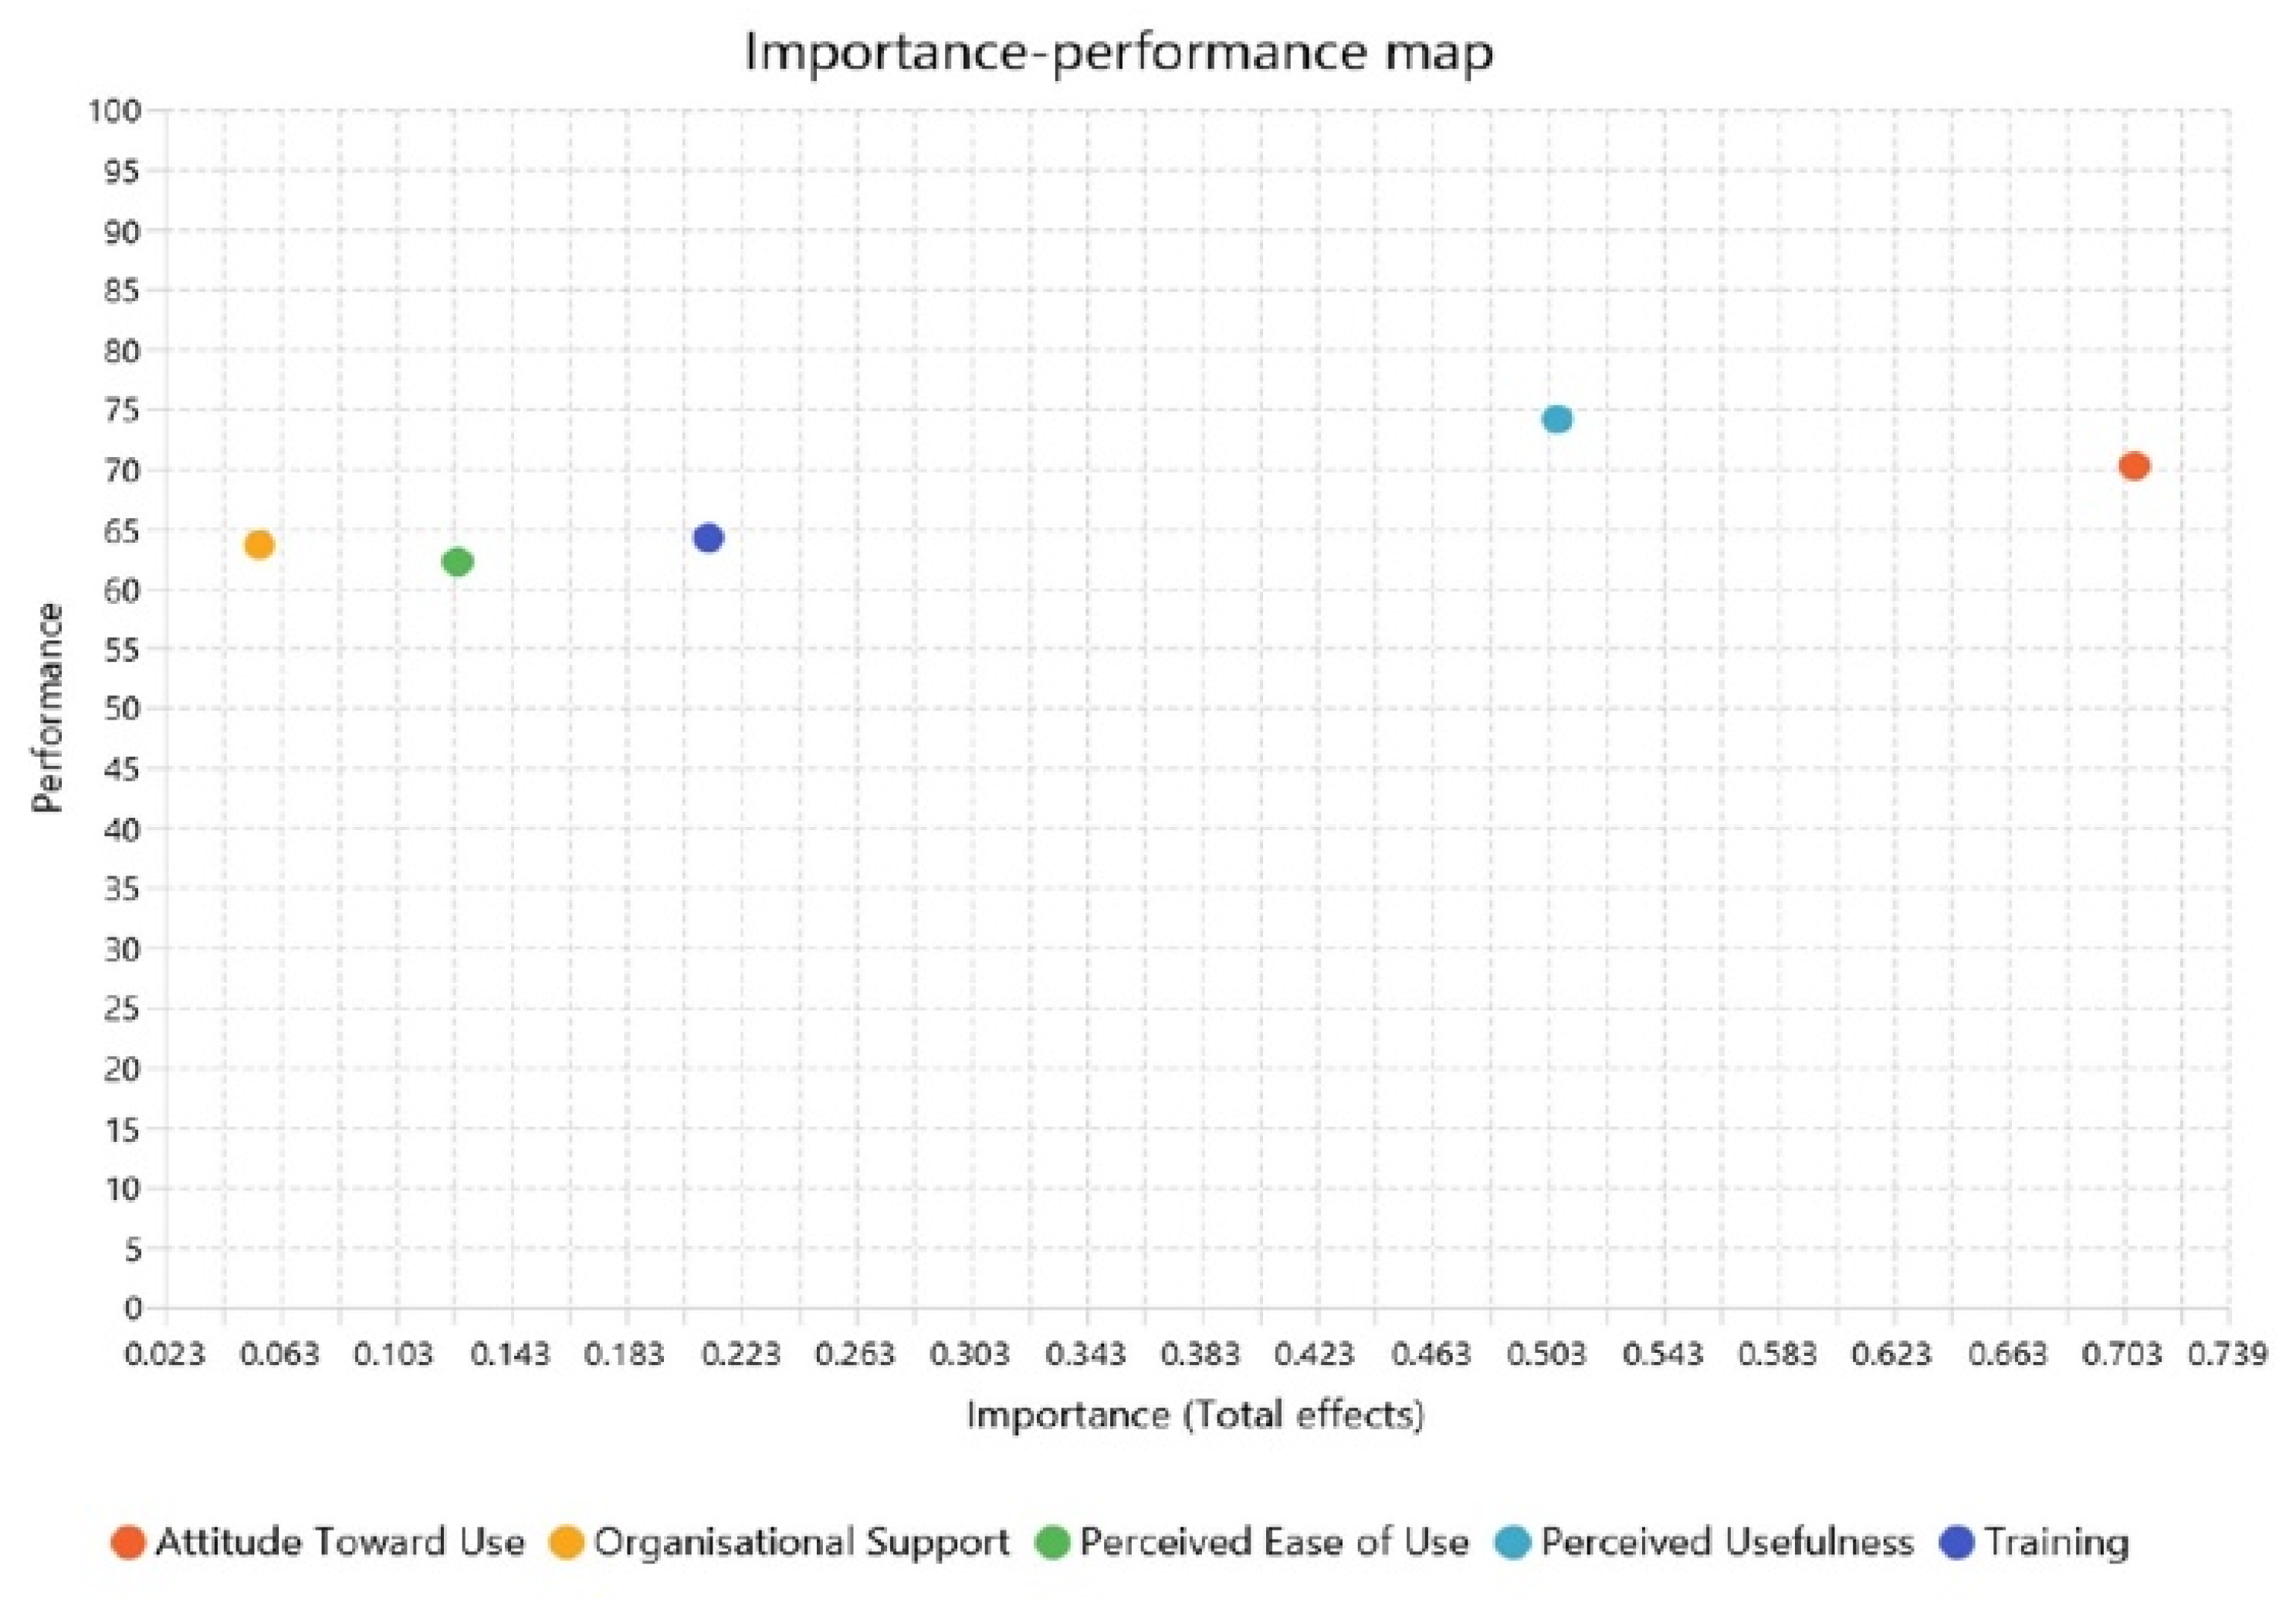

Table 1.
Measurement of Variables and Questionnaire Structure.
| Variable | Code | Section | Number of Item | Measure |
|---|---|---|---|---|
| Demographic Profile | A | 3 | Multiple-Choice | |
| Perceived Usefulness (PU) | Independent Variables | B – Sub A | 5 | Likert 5-point Scale 1 - Strongly Disagree 2 - Disagree 3 - Neutral 4 - Agree 5 - Strongly Agree |
| Perceived Ease of Use (PEOU) | Independent Variables | B – Sub B | 5 | Likert 5-point Scale 1 - Strongly Disagree 2 - Disagree 3 - Neutral 4 - Agree 5 - Strongly Agree |
| Organisational Support (OS) | Independent Variables | B – Sub C | 5 | Likert 5-point Scale 1 - Strongly Disagree 2 - Disagree 3 - Neutral 4 - Agree 5 - Strongly Agree |
| Training (T) | Independent Variables | B – Sub D | 5 | Likert 5-point Scale 1 - Strongly Disagree 2 - Disagree 3 - Neutral 4 - Agree 5 - Strongly Agree |
| Attitude Toward Use (ATU) | Mediator Variable | C | 5 | Likert 5-point Scale 1 - Strongly Disagree 2 - Disagree 3 - Neutral 4 - Agree 5 - Strongly Agree |
| Behavioural Intention to Use (BIU) | Dependent Variable | D | 5 | Likert 5-point Scale 1 - Strongly Disagree 2 - Disagree 3 - Neutral 4 - Agree 5 - Strongly Agree |
Table 2.
Tables should be placed in the main text near to the first time they are cited.
| Variables | Code | Items |
|---|---|---|
| Perceived Usefulness (PU) | PU1 | I feel using the new technology (Digital Stethoscope, Smart Device & Mobile Application) helps me perform my tasks in the emergency department effectively. |
| PU2 | I feel using the new technology (Digital Stethoscope, Smart Device & Mobile Application) boosts my productivity while working in the emergency department. | |
| PU3 | I feel using the technology (Digital Stethoscope, Smart Device & Mobile Application) enhances my overall job effectiveness. | |
| PU4 | I feel the technology (Digital Stethoscope, Smart Device & Mobile Application) simplifies my job duties. | |
| PU5 | I feel my job performance improves when I use this technology (Digital Stethoscope, Smart Device & Mobile Application). | |
| Perceived Ease of Use (PEOU) | PEOU1 | I feel the technology (Digital Stethoscope, Smart Device & Mobile Application) is easy to use in my daily tasks. |
| PEOU2 | I feel the technology (Digital Stethoscope, Smart Device & Mobile Application) is clear and understandable. | |
| PEOU3 | I feel I can quickly become skillful at using this technology (Digital Stethoscope, Smart Device & Mobile Application). | |
| PEOU4 | I feel it is straightforward to get the technology (Digital Stethoscope, Smart Device & Mobile Application) to perform desired tasks. | |
| PEOU5 | I feel learning to operate the technology (Digital Stethoscope, Smart Device & Mobile Application) is easy for me. | |
| Organisational Support (OS) | OS1 | I feel that my hospital’s leadership is committed to supporting the adoption of new medical technologies. |
| OS2 | I feel that my hospital provides adequate resources and infrastructure for using new technologies effectively. | |
| OS3 | I feel that my hospital fosters an environment where new technologies are actively encouraged and promoted. | |
| OS4 | I feel that technical support is readily available when I encounter issues with new medical technology. | |
| OS5 | I feel that my hospital addresses and resolves challenges related to the implementation of new technologies. | |
| Training (T) | T1 | I feel that the training provided for new medical technologies (Digital Stethoscope, Smart Device & Mobile Application) meets my clinical needs. |
| T2 | I feel that the training I receive is sufficient to understand the practical applications of new technologies (Digital Stethoscope, Smart Device & Mobile Application). | |
| T3 | I feel that I receive regular updates and additional training on new technologies (Digital Stethoscope, Smart Device & Mobile Application) relevant to my role. | |
| T4 | I feel that the training sessions are well-structured and easy to follow. | |
| T5 | I feel that the training enhances my confidence and ability to use new technologies (Digital Stethoscope, Smart Device & Mobile Application) effectively. | |
| Attitude Toward Use (ATU) | ATU1 | I feel the potential benefits of using this technology (Digital Stethoscope, Smart Device & Mobile Application) in my medical practice to be significant. |
| ATU2 | I feel the technology (Digital Stethoscope, Smart Device & Mobile Application) easy to use in my daily work routines. | |
| ATU3 | I feel that using this technology (Digital Stethoscope, Smart Device & Mobile Application) enhances my professional efficiency and effectiveness. | |
| ATU4 | I feel that the technology (Digital Stethoscope, Smart Device & Mobile Application) aligns well with my current work practices. | |
| ATU5 | I feel myself satisfied with the technology’s (Digital Stethoscope, Smart Device & Mobile Application) performance in my medical tasks. | |
| Behavioural Intention to Use (BIU) | BIU1 | I feel myself likely to continue using this technology (Digital Stethoscope, Smart Device & Mobile Application) in my future medical practice. |
| BIU2 | I feel that I am committed to adopting this technology (Digital Stethoscope, Smart Device & Mobile Application) as a regular part of my workflow. | |
| BIU3 | I feel that additional support and training would increase my likelihood of using this technology (Digital Stethoscope, Smart Device & Mobile Application). | |
| BIU4 | I feel that the potential of the technology for improved patient outcomes influences my intention to use this technology (Digital Stethoscope, Smart Device & Mobile Application). | |
| BIU5 | I feel that observing my colleagues successfully using this technology (Digital Stethoscope, Smart Device & Mobile Application) increases my intention to use it. |
Table 3.
Outlier Detection Results Before Removal.
| Statistic | Minimum | Maximum | N |
|---|---|---|---|
| Mahal. Distance | 0.035 | 23.861 | 140 |
| Cook’s Distance | 0.000 | 0.955 | 140 |
Table 4.
Outlier Detection Results After Removal.
| Statistic | Minimum | Maximum | N |
|---|---|---|---|
| Mahal. Distance | 0.006 | 7.834 | 139 |
| Cook’s Distance | 0.000 | 0.556 | 139 |
Table 5.
Demographic Summary.
| Demographic Variable | Category | Frequency | Percent | Valid Percent | Cumulative Percent | Total |
|---|---|---|---|---|---|---|
| Gender | Female | 80 | 57.6 | 57.6 | 57.6 | 139 |
| Male | 59 | 42.4 | 42.4 | 100 | ||
| Age | 25 - 29 years old | 20 | 14.4 | 14.4 | 14.4 | 139 |
| 30 - 34 years old | 48 | 34.5 | 34.5 | 48.9 | ||
| 35 - 39 years old | 33 | 23.7 | 23.7 | 72.7 | ||
| 40 - 44 years old | 14 | 10.1 | 10.1 | 82.7 | ||
| 45 - 49 years old | 6 | 4.3 | 4.3 | 87.1 | ||
| 50 - 54 years old | 11 | 7.9 | 7.9 | 95 | ||
| 55 - 59 years old | 7 | 5 | 5 | 100 | ||
| Years of Experience | 5 - 9 years | 55 | 39.6 | 39.6 | 39.6 | 139 |
| 10 -14 years | 42 | 30.2 | 30.2 | 69.8 | ||
| 15 -19 years | 19 | 13.7 | 13.7 | 83.5 | ||
| 20 - 24 years | 4 | 2.9 | 2.9 | 86.3 | ||
| 25 – 29 years | 13 | 9.4 | 9.4 | 95.7 | ||
| 30 – 34 years | 6 | 4.3 | 4.3 | 100 |
Table 6.
Reliability and Validity Results.
| Construct | Indicator | Factor Loading | Cronbach Alpha | Composite Reliability | Average variance extracted (AVE) |
|---|---|---|---|---|---|
| Attitude Toward Use | ATU1 | 0.898 | 0.952 | 0.963 | 0.840 |
| ATU2 | 0.917 | ||||
| ATU3 | 0.933 | ||||
| ATU4 | 0.929 | ||||
| ATU5 | 0.905 | ||||
| Behavioural Intention to Use | BIU1 | 0.894 | 0.952 | 0.963 | 0.838 |
| BIU2 | 0.932 | ||||
| BIU3 | 0.919 | ||||
| BIU4 | 0.928 | ||||
| BIU5 | 0.905 | ||||
| Organisational Support | OS1 | 0.847 | 0.938 | 0.952 | 0.800 |
| OS2 | 0.895 | ||||
| OS3 | 0.922 | ||||
| OS4 | 0.890 | ||||
| OS5 | 0.916 | ||||
| Perceived Ease of Use | PEOU1 | 0.890 | 0.939 | 0.953 | 0.804 |
| PEOU2 | 0.922 | ||||
| PEOU3 | 0.911 | ||||
| PEOU4 | 0.885 | ||||
| PEOU5 | 0.874 | ||||
| Perceived Usefulness | PU1 | 0.919 | 0.961 | 0.970 | 0.864 |
| PU2 | 0.947 | ||||
| PU3 | 0.949 | ||||
| PU4 | 0.910 | ||||
| PU5 | 0.923 | ||||
| Training | T1 | 0.897 | 0.938 | 0.952 | 0.800 |
| T2 | 0.868 | ||||
| T3 | 0.904 | ||||
| T4 | 0.906 | ||||
| T5 | 0.896 |
Table 7.
The Results of HTMT.
| Construct | ATU | BIU | OS | PEOU | PU | T |
|---|---|---|---|---|---|---|
| ATU | ||||||
| BIU | 0.885 | |||||
| OS | 0.493 | 0.436 | ||||
| PEOU | 0.753 | 0.678 | 0.481 | |||
| PU | 0.83 | 0.751 | 0.334 | 0.763 | ||
| T | 0.708 | 0.607 | 0.746 | 0.641 | 0.526 | |
| Note: “Attitude Toward Use” - ATU; “Behavioural Intention to Use” - BIU; “Organisational Support” - OS; “Perceived Ease of Use” - PEOU; “Perceived Usefulness” - PU; “Training” - T | ||||||
Table 8.
The Results of Fornell-Larcker.
| Construct | ATU | BIU | OS | PEOU | PU | T |
|---|---|---|---|---|---|---|
| ATU | 0.916 | |||||
| BIU | 0.844 | 0.916 | ||||
| OS | 0.472 | 0.423 | 0.895 | |||
| PEOU | 0.713 | 0.643 | 0.449 | 0.897 | ||
| PU | 0.794 | 0.720 | 0.324 | 0.726 | 0.930 | |
| T | 0.672 | 0.579 | 0.702 | 0.601 | 0.504 | 0.895 |
| Note: “Attitude Toward Use” - ATU; “Behavioural Intention to Use” - BIU; “Organisational Support” - OS; “Perceived Ease of Use” - PEOU; “Perceived Usefulness” - PU; “Training” - T | ||||||
Table 9.
The Results of Collinearity Assessment.
| Hypothesis | Relationship | VIF |
|---|---|---|
| H1a | PU -> ATU | 2.171 |
| H2a | PEOU -> ATU | 2.536 |
| H3a | OS -> ATU | 1.997 |
| H4a | T -> ATU | 2.534 |
| H1b | PU -> BIU | 3.279 |
| H2b | PEOU -> BIU | 2.595 |
| H3b | OS -> BIU | 2.000 |
| H4b | T -> BIU | 2.890 |
| H6 | ATU -> BIU | 3.790 |
| Note: “Attitude Toward Use” - ATU; “Behavioural Intention to Use” - BIU; “Organisational Support” - OS; “Perceived Ease of Use” - PEOU; “Perceived Usefulness” - PU; “Training” - T | ||
Table 10.
Hypothesis Testing Result.
| Confidence Intervals Bias | ||||||||
|---|---|---|---|---|---|---|---|---|
| Hypothesis | Relationship | Standard Beta | Standard Error | t-value | p-value | 5% | 95% | Decision |
| H1a | PU -> ATU | 0.541 | 0.074 | 7.260** | 0.000 | 0.411 | 0.655 | Supported |
| H2a | PEOU -> ATU | 0.125 | 0.082 | 1.518 | 0.065 | -0.019 | 0.251 | Not Supported |
| H3a | OS -> ATU | 0.026 | 0.075 | 0.338 | 0.368 | -0.081 | 0.165 | Not Supported |
| H4a | T -> ATU | 0.306 | 0.094 | 3.269** | 0.001 | 0.162 | 0.472 | Supported |
| H1b | PU -> BIU | 0.124 | 0.121 | 1.023 | 0.153 | -0.065 | 0.335 | Not Supported |
| H2b | PEOU -> BIU | 0.036 | 0.106 | 0.337 | 0.368 | -0.133 | 0.216 | Not Supported |
| H3b | OS -> BIU | 0.037 | 0.070 | 0.531 | 0.298 | -0.062 | 0.174 | Not Supported |
| H4b | T -> BIU | -0.005 | 0.074 | 0.070 | 0.472 | -0.131 | 0.112 | Not Supported |
| H6 | ATU -> BIU | 0.706 | 0.119 | 5.914** | 0.000 | 0.486 | 0.884 | Supported |
|
Note: 1. **significant at p-value < 0.01 2. “Attitude Toward Use” - ATU; “Behavioural Intention to Use” - BIU; “Organisational Support” - OS; “Perceived Ease of Use” - PEOU; “Perceived Usefulness” - PU; “Training” - T | ||||||||
Table 11.
The Coefficient of Determination (R2) Results.
| Construct | R-square (R2) | R-square adjusted |
|---|---|---|
| Attitude Toward Use | 0.736 | 0.728 |
| Behavioural Intention to Use | 0.721 | 0.711 |
Table 12.
The Results of Effect Size (f2).
| Hypothesis | Relationship | f-square (f2) | Impact |
|---|---|---|---|
| H1a | PU -> ATU | 0.510 | Big |
| H2a | PEOU -> ATU | 0.023 | Small |
| H3a | OS -> ATU | 0.001 | No |
| H4a | T -> ATU | 0.140 | Small |
| H1b | PU -> BIU | 0.017 | No |
| H2b | PEOU -> BIU | 0.002 | No |
| H3b | OS -> BIU | 0.002 | No |
| H4b | T -> BIU | 0.000 | No |
| H6 | ATU -> BIU | 0.473 | Big |
| Note: “Attitude Toward Use” - ATU; “Behavioural Intention to Use” - BIU; “Organisational Support” - OS; “Perceived Ease of Use” - PEOU; “Perceived Usefulness” - PU; “Training” - T | |||
Table 13.
The Results of Effect Size (f2).
| Indicator | Q2predict | PLS-SEM_RMSE | LM_RMSE | (PLS-SEM RMSE) - (LM_RMSE) | Remark |
|---|---|---|---|---|---|
| ATU1 | 0.541 | 0.510 | 0.570 | -0.060 | High Predictive Power |
| ATU2 | 0.622 | 0.522 | 0.585 | -0.063 | |
| ATU3 | 0.620 | 0.489 | 0.534 | -0.045 | |
| ATU4 | 0.588 | 0.516 | 0.593 | -0.077 | |
| ATU5 | 0.596 | 0.526 | 0.586 | -0.060 | |
| BIU1 | 0.540 | 0.528 | 0.590 | -0.062 | High Predictive Power |
| BIU2 | 0.494 | 0.525 | 0.583 | -0.058 | |
| BIU3 | 0.419 | 0.574 | 0.625 | -0.051 | |
| BIU4 | 0.474 | 0.543 | 0.564 | -0.021 | |
| BIU5 | 0.382 | 0.578 | 0.616 | -0.038 |
Table 14.
The Results of Mediation Analysis.
| Confidence Intervals Bias | |||||||||
| Hypothesis | Relationship | Standard Beta | Standard Error | t-value | p-value | 5% | 95% | Decision | Types of Mediation |
| H5a | PU -> ATU -> BIU | 0.382 | 0.081 | 4.722** | 0.000 | 0.254 | 0.519 | Supported | Full Mediation |
| H5b | PEOU -> ATU -> BIU | 0.088 | 0.063 | 1.392 | 0.082 | -0.007 | 0.201 | Not Supported | No Mediation |
| H5c | OS -> ATU -> BIU | 0.018 | 0.054 | 0.331 | 0.370 | -0.058 | 0.119 | Not Supported | No Mediation |
| H5d | T -> ATU -> BIU | 0.216 | 0.076 | 2.852** | 0.002 | 0.109 | 0.363 | Supported | Full Mediation |
|
Note: 1. **significant at p-value < 0.01 2. “Attitude Toward Use” - ATU; “Behavioural Intention to Use” - BIU; “Organisational Support” - OS; “Perceived Ease of Use” - PEOU; “Perceived Usefulness” - PU; “Training” - T | |||||||||
Table 15.
The Results of IPMA.
| Construct | Importance (Total Effect) | Performance |
|---|---|---|
| ATU | 0.706 | 70.27 |
| OS | 0.055 | 63.662 |
| PEOU | 0.124 | 62.261 |
| PU | 0.506 | 74.16 |
| T | 0.211 | 64.267 |
| Note: “Attitude Toward Use” - ATU; “Organisational Support” - OS; “Perceived Ease of Use” - PEOU; “Perceived Usefulness” - PU; “Training” - T | ||
Table 16.
Summary of Hypothesis Test Results.
| Hypothesis | Decision | |
|---|---|---|
| H1a | Perceived Usefulness has a positive relationship with Attitude toward Use. | Supported |
| H2a | Perceived Ease of Use has a positive relationship with Attitude toward Use. | Not Supported |
| H3a | Organisational Support has a positive relationship with Attitude toward Use. | Not Supported |
| H4a | Training has a positive relationship with Attitude toward Use. | Supported |
| H1b | Perceived Usefulness has a positive relationship with Behavioural Intention to Use. | Not Supported |
| H2b | Perceived Ease of Use has a positive relationship with Behavioural Intention to Use. | Not Supported |
| H3b | Organisational Support has a positive relationship with Behavioural Intention to Use. | Not Supported |
| H4b | Training has a positive relationship with Behavioural Intention to Use. | Not Supported |
| H6 | Attitude toward Use has a positive relationship with Behavioural Intention to Use. | Supported |
| The Mediating Effect of Attitude Toward Use | ||
| H5a | Attitude toward Use positively mediates the relationship between Perceived Usefulness and Behavioural Intention to Use. | Supported |
| H5b | Attitude toward Use positively mediates the relationship between Perceived Ease of Use and Behavioural Intention to Use. | Not Supported |
| H5c | Attitude toward Use positively mediates the relationship between Organisational Support and Behavioural Intention to Use. | Not Supported |
| H5d | Attitude toward Use positively mediates the relationship between Training and Behavioural Intention to Use. | Supported |
Disclaimer/Publisher’s Note: The statements, opinions and data contained in all publications are solely those of the individual author(s) and contributor(s) and not of MDPI and/or the editor(s). MDPI and/or the editor(s) disclaim responsibility for any injury to people or property resulting from any ideas, methods, instructions or products referred to in the content. |
© 2026 by the authors. Licensee MDPI, Basel, Switzerland. This article is an open access article distributed under the terms and conditions of the Creative Commons Attribution (CC BY) license.
Copyright: This open access article is published under a Creative Commons CC BY 4.0 license, which permit the free download, distribution, and reuse, provided that the author and preprint are cited in any reuse.