

Submitted:
17 March 2026
Posted:
18 March 2026
You are already at the latest version
Abstract
Automated defect classification in wafer maps is critical for semiconductor yield management and quality control, but pure deep learning models often underperform on rare or spatially subtle defect types and lack interpretability. Handcrafted spatial features can capture physical defect characteristics, yet their integration with modern CNNs is underexplored. We systematically evaluate eight physically motivated spatial descriptors: radial mean and standard deviation, directional entropy, aspect ratio, fail fraction, and zone-wise failure densities (core, mid, edge), by training a lightweight CNN (101k parameters) augmented with each descriptor, both individually and in full combination. To the best of our knowledge, this is the first systematic ablation study to quantify the synergistic effect of fusing physically-informed spatial descriptors with a modern, edge-optimized CNN for this task.On the WM-811K benchmark (eight defect classes, 25,519 labeled wafers), the vision-only baseline achieves 60.0% test accuracy and 0.615 weighted F1. Nearly every single descriptor individually underperforms the baseline, with the best descriptor (fail fraction) reaching only 60.1%. However, the full fusion of all eight descriptors significantly outperforms the baseline, reaching 72.7% accuracy (+12.7 points) and 0.728 weighted F1. This synergy demonstrates that spatial descriptors provide complementary information that is only realizable in combination.Per-class analysis reveals that the combination model substantially improves challenging classes: Donut F1 rises from 0.207 to 0.493, Edge-Loc from 0.384 to 0.672, and Center from 0.579 to 0.760. However, the Loc class remains challenging for all models, likely due to its diffuse spatial patterns.
Keywords:
wafer defect classification
; spatial feature fusion
; convolutional neural networks
; edge deployment
; semiconductor manufacturing
1. Introduction
Defect patterns in semiconductors impede electron flow in a device, causing leakage, performance issues, or total device failure. These imperfections directly slash production yield, forcing manufacturers to discard non-functional chips and increasing the cost per die. Advanced inspection tools and quality control environments are necessary to minimize defect density and maintain profitability as feature sizes shrink toward atomic scales.
Wafer bin maps are routinely inspected in semiconductor fabs to identify defect patterns and diagnose their failure modes by finding their root causes. Automated classification of these patterns is essential for rapid yield feedback, but edge-deployed inspection tools impose tight constraints on model size and latency. Convolutional neural networks (CNNs) have become the de facto standard for this task [1,2], yet they often struggle with rare defect classes and offer limited interpretability to process engineers.
Handcrafted spatial features, such as radial distributions, angular entropy, and zone-wise failure densities, were used with classical classifiers [3,4]. These features directly encode physical knowledge about defect formation (e.g., ring-shaped defects due to temperature gradients, edge-localized defects due to extraction or handling errors, scratch defects due to contamination, etc.). While deep learning has largely superseded such handcrafted features [1,5], we hypothesize that they can complement modern CNNs by providing explicit, interpretable information that pure vision models might not capture.
2. Related Work
The field of wafer map defect classification has evolved significantly, progressing from traditional image processing and classical machine learning to sophisticated deep neural networks and hybrid approaches. We review these developments, with a focus on the WM-811K benchmark, handcrafted feature methods, and fusion-based techniques, to contextualize our contributions.
2.1. Comprehensive Reviews and Taxonomies
The rapid growth of research in this area has recently been consolidated in several comprehensive surveys. Kim and Behdinan [5] provide a comprehensive review of machine learning and deep learning applications for wafer map defect recognition, covering CNN-based, generative, and hybrid architectures while highlighting persistent challenges such as class imbalance and limited labeled data. Taha [6] offers a structured taxonomy of ML classification techniques for wafer defect identification, noting that ResNet can achieve up to 99% accuracy on certain datasets while emphasizing computational trade-offs between deep learning models and more efficient algorithms like XGBoost. Manivannan [1] further examines learning under label scarcity, proposing a semi-supervised dual-head CNN for imbalanced wafer bin map classification and underscoring persistent challenges such as data scarcity, severe class imbalance, and the complexity of mixed-type defects.
2.2. Deep Learning on the WM-811K Benchmark
The WM-811K dataset has become the de facto standard for evaluating wafer defect classifiers. Nakazawa and Kulkarni [2] proposed a CNN-based framework for wafer map defect pattern classification and image retrieval, validating on both synthetically generated and real wafer maps. More recently, Tsai and Wang [7] proposed G2LGAN, a global-to-local generative adversarial network that extracts global and local features separately to generate effective training data under class imbalance, combined with random undersampling of the majority class; the method is validated on both WM-811K and an industry dataset. The latest trends involve advanced architectures such as diffusion models; WMDiff, proposed by Long et al. [8], is a multi-scale guidance diffusion network that eliminates noise through a guided denoising process, achieving 95.49% accuracy on WM-811K and outperforming state-of-the-art CNN and Transformer-based models.
2.3. Handcrafted and Classical Features
Prior to the dominance of deep learning, wafer defect classification relied heavily on handcrafted features. Harada et al. [9] used statistical descriptors (e.g., defect density, radial profiles) with distribution-based models to detect defects robust to process variation. Nakagaki et al. [3] employed multiple scanning electron microscope images for automatic defect recognition using feature extraction techniques. In industrial settings, Imoto et al. [10] applied CNN-based transfer learning to SEM images sampled from actual manufacturing facilities, demonstrating the feasibility of automated defect classification on real fab data. Saqlain et al. [11] combined a convolutional autoencoder for unsupervised feature learning with a classifier, demonstrating that learned features could outperform purely handcrafted ones. These methods, while interpretable and grounded in physical process knowledge, lacked the representational power to capture the full complexity of defect morphologies. The features we employ in this work (radial statistics, angular entropy, zone densities) are directly inspired by these earlier, interpretable approaches.
2.4. Fusion of Deep and Handcrafted Features
Recognizing the complementary strengths of deep and handcrafted features, several studies have explored hybrid fusion techniques. A notable example is the work by Kang et al. [4], who proposed a stacking ensemble classifier that combines a CNN-based classifier with a classifier built on handcrafted features. Their method assigns larger weights to the output of the superior base classifier for each defect class, effectively leveraging the advantages of both approaches to improve overall accuracy. This concept of fusion is central to our work; however, instead of an ensemble of separate classifiers, we integrate the features directly within a single, end-to-end trainable network. Feature fusion has also proven effective in other non-destructive testing domains, such as thermal wave imaging [12], where combining deep features with handcrafted statistical and frequency-domain features enhanced defect detection capability. The success of these methods across different applications reinforces the potential of our approach.
3. Methodology and Model Description
3.1. Input Preprocessing and Vision Backbone
The original, non-resized die-fail coordinates are distinguished using a tri-color heatmap scheme (blue = no die, gray = successful die, red = defect concentration). The original defect coordinates are computed using polar notation, where the failure radius of each die is normalized to the radius of the full wafer map:
() is the centroid of all die positions independent of their wafer maps’ aspect ratios, and R is the maximum radial distance from the center to an edge die. This notation provides an () representation for computing eight spatial descriptors that serve as geometric constraints from the original die-fail coordinates:

Table 1.
Definitions of spatial descriptors used in ablation study.
| Descriptor | Definition |
|---|---|
| r_mean | mean distance of failing dies from wafer center (normalized by radius). |
| r_std | standard deviation of those distances. |
| ang_entropy_norm | entropy of angular distribution (normalized by log(36) for 36 bins). |
| aspect_ratio | ratio of the first to second PCA eigenvalue of the failing die coordinate distribution. |
| fail_fraction | proportion of failing dies among all dies. |
| zone_core/mid/edge | fraction of failing dies falling in equal-width radial bands. |
Figure 1.
Sample wafer maps for the center defect class with computed spatial descriptors.
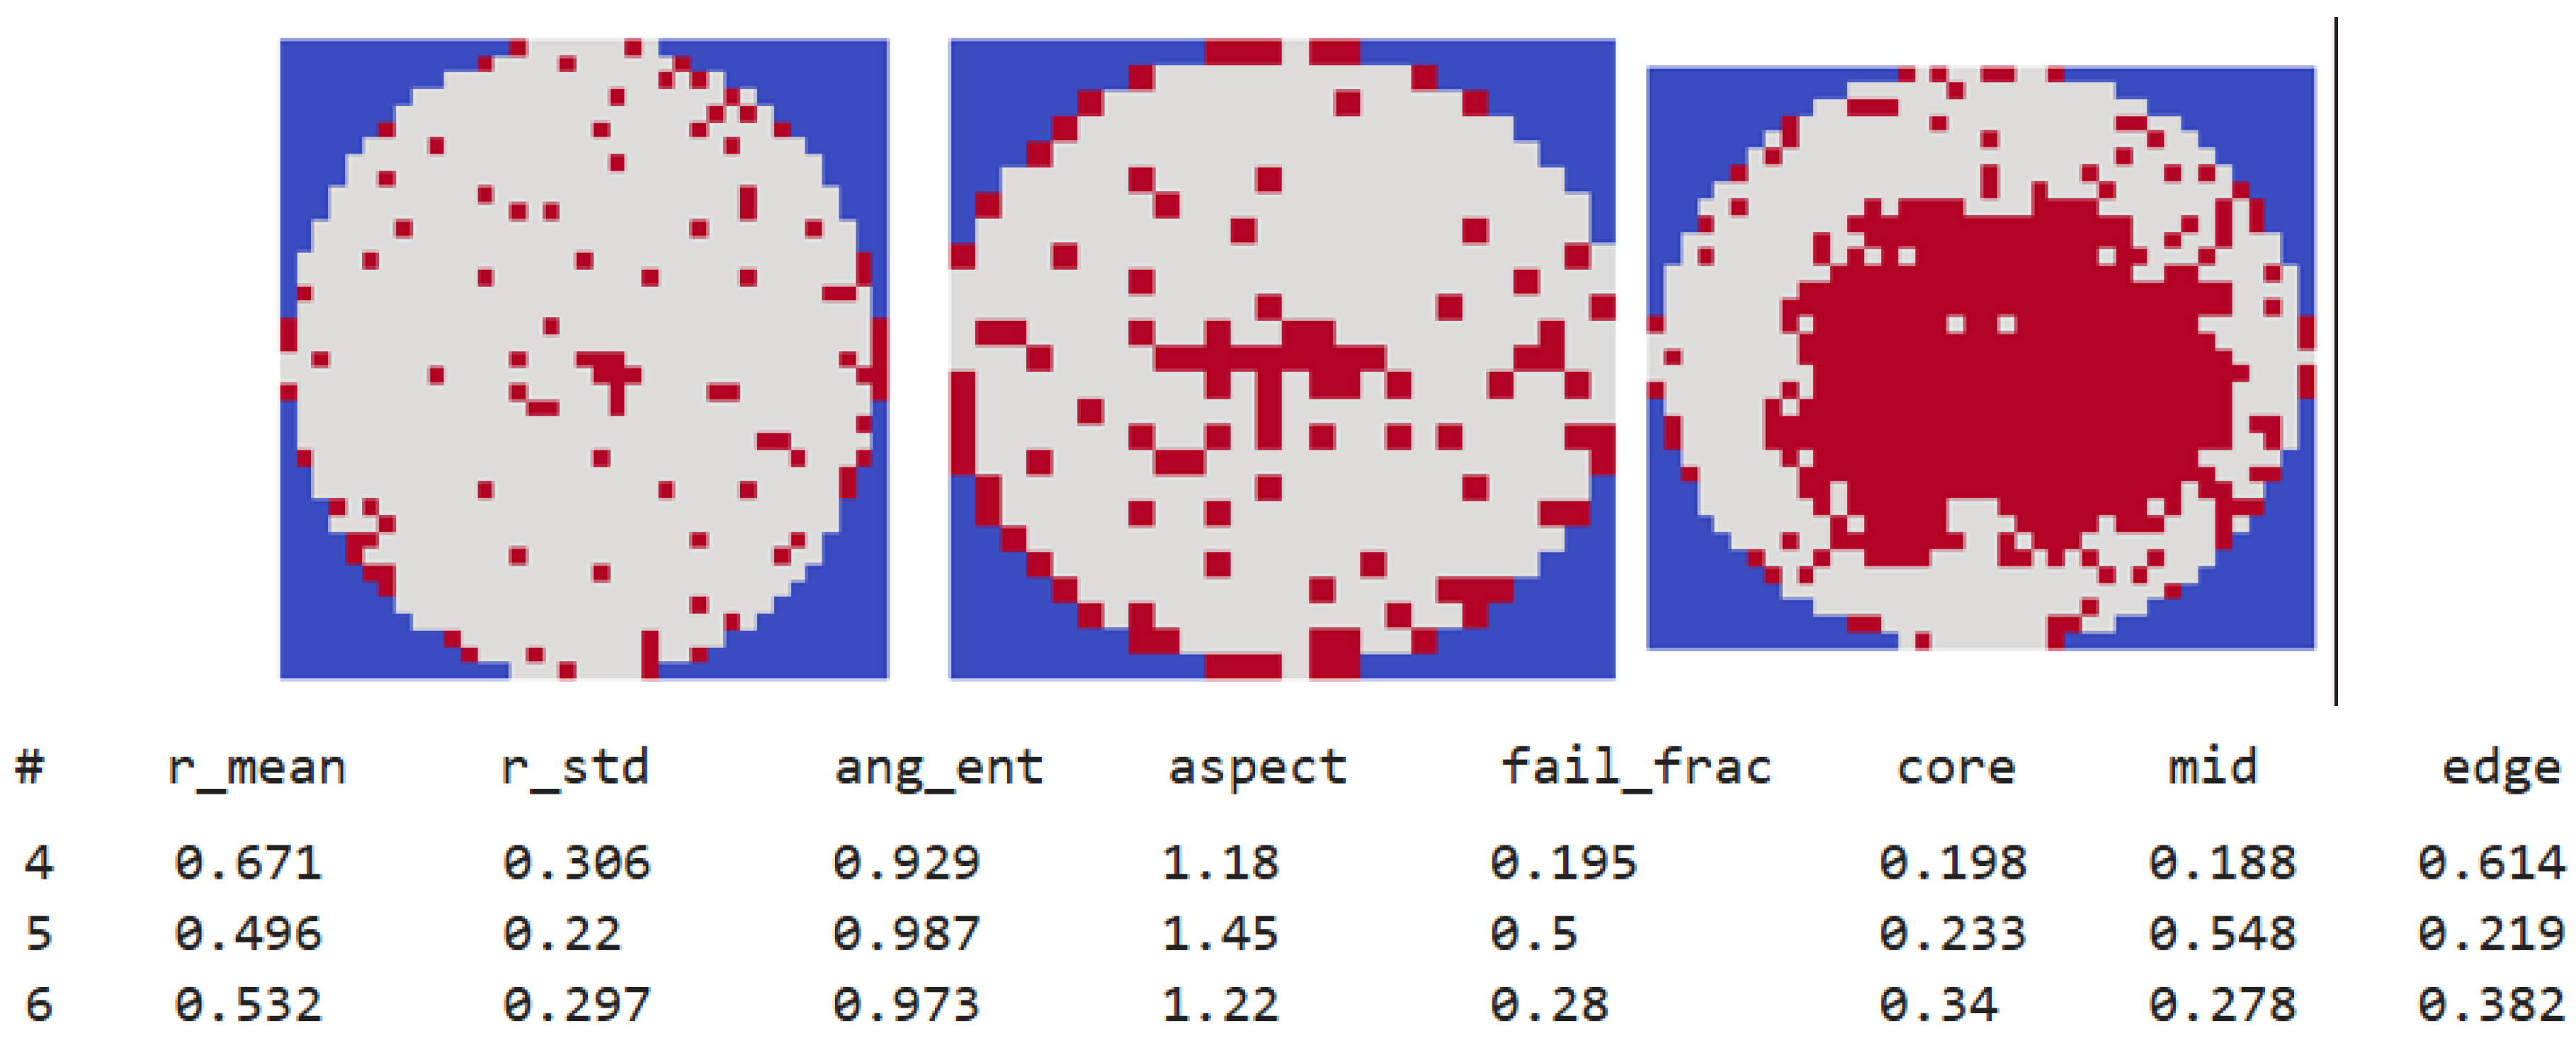
Wafer maps (grayscale, variable resolution) are resized to 224×224 using bilinear interpolation to match common vision backbones. The resized image is normalized to [0,1] and then standardized with mean=0.5, std=0.5. Descriptors are standardized (z-score) using a scaler fitted only on the training set to avoid data leakage.
3.2. Vision Backbone
The CNN backbone is intentionally designed for lightweight edge deployment and consists of three convolutional blocks:
This produces a 128-dimensional feature vector. The backbone contains 92,672 parameters.
3.3. Descriptor MLP
For models that incorporate descriptors, the normalized descriptor vector is passed through a two-layer MLP:
where d is the descriptor dimensionality ( for single-descriptor models, for full fusion). This produces a 32-dimensional descriptor embedding.
3.4. Fusion and Classifier
All models including the vision-only baseline share the same classifier head for architectural fairness:
where for the vision-only model and for fusion models, as the visual features and descriptor embedding are concatenated prior to classification. Total parameter counts are summarized in Table 2.
3.5. Training Details
All models are trained from scratch under identical conditions. We use cross-entropy loss with class weights computed via sklearn.utils.class_weight to address class imbalance. The optimizer is Adam with an initial learning rate of , reduced on validation accuracy plateau with patience 3 and factor 0.5. Models are trained for 30 epochs with batch size 64. Data is split into train/validation/test sets (70/15/15) using stratified sampling with random seed 42.
3.6. Models Evaluated
We train and evaluate the following model variants:
- Vision-only: CNN backbone and classifier, no descriptors.
- Single-descriptor (8 models): CNN augmented with one descriptor at a time.
- Full fusion: CNN augmented with all eight descriptors simultaneously.
All models use the same hyperparameters, data split, and random seed.
4. Experimental Results
The testing utilizes WM-811K wafer maps, filtered to 25,519 wafers with confirmed defect patterns (eight classes: Center, Donut, Edge-Loc i.e edge dislocation, Edge-Ring, Loc i.e point dislocation, Near-full, Random, and Scratch). Note that wafers labeled “none” or unlabeled are excluded because they lack any distinct defect morphology.
Table 3.
Overall test metrics for all model variants, sorted by accuracy.
| Model | Accuracy (%) | Weighted F1 | Macro F1 |
|---|---|---|---|
| Full fusion (all 8) | 72.70 | 0.7283 | 0.6545 |
| Vision-only baseline | 59.95 | 0.6152 | 0.5338 |
| fail_fraction | 60.08 | 0.6200 | 0.5274 |
| aspect_ratio | 56.03 | 0.5318 | 0.4406 |
| zone_edge | 51.31 | 0.4414 | 0.3887 |
| r_std | 50.52 | 0.4988 | 0.4216 |
| r_mean | 49.69 | 0.3985 | 0.3724 |
| ang_entropy_norm | 44.41 | 0.3052 | 0.3314 |
| zone_core | 44.20 | 0.4606 | 0.4254 |
| zone_mid | 36.39 | 0.3598 | 0.3834 |
The full fusion model improves over vision on most classes, with substantial gains on Center, Donut, Edge-Loc, and Scratch.
Individual descriptors often hurt performance on specific classes (e.g., fail_fraction degrades Center and Donut, zone_edge collapses Center and Donut to zero). This explains why single descriptors underperform the baseline.
The synergy in the full model integrates complementary information, mitigating individual weaknesses.
Figure 2 shows the confusion matrix for the full fusion model and vision-only baseline model. The diagonal dominance confirms strong performance, with most confusion occurring among Loc, Edge-Loc, and Scratch defect classes.
4.1. Edge Deployment Metrics
The full fusion model occupies 0.42 MB (PyTorch) and 0.40 MB (ONNX), with an inference time of 2.80 ms on an Apple M4 CPU at batch size 1. Single-descriptor models contain 104,616 parameters and the full fusion model 104,840 parameters. This is an overhead of only 3.3% over the vision-only baseline (101,448 parameters). These characteristics suggest feasibility for edge deployment, though hardware-specific validation on target devices (e.g., ARM Cortex, FPGA) would be required before production use.
5. Discussion
5.1. Descriptor Synergy
The central finding is that no individual spatial descriptor substantially improves over the vision-only baseline, yet their full combination yields a 12.7-point accuracy gain. This result demonstrates that the descriptors encode complementary aspects of defect morphology that are individually insufficient but collectively powerful. fail_fraction captures overall defect density, zone_core/mid/edge localizes defects radially, r_std captures the spatial spread of failures, ang_entropy_norm captures directional regularity, and aspect_ratio captures elongation. Alone, each descriptor provides a partial and often misleading signal. Together, they resolve ambiguities that the CNN cannot resolve from pixel information alone.
5.2. Why Individual Descriptors Underperform
Table 4 reveals the mechanism behind individual descriptor failure. Each descriptor collapses performance on specific classes while augmenting others. For example, r_mean and zone_edge both reduce Center and Donut F1 to zero, suggesting that these descriptors introduce a strong radial bias that conflicts with the spatial signatures of centrally-located defects, such as a moderately low fail_fraction and a high zone_core at any failed die dispersity. ang_entropy_norm collapses Edge-Loc and Loc to zero, likely because these classes do not exhibit strong directional regularity since they are formed by the insertion of half-planes into the semiconducting lattice. zone_mid produces the worst overall model at 36.4% accuracy, collapsing Donut entirely despite zone_mid being the descriptor most physically motivated for that class. This is likely due to an overlap in the range of fail_fraction data observed between the Donut and Center classes, where defect densities end up yielding a more dominant spatial signature compared to the core/mid/edge parameters. Since both classes have similar defect densities, but their per-band concentration varies, the model is prone to confusion. The full fusion model balances these competing signals through the learned fusion layer, allowing the network to weigh each descriptor appropriately per class. Examples of this phenomenon with respect to the above insufficiencies when weighing each descriptor in isolation are explored in more detail in the following section.
5.3. Per-Class Analysis
In the full fusion model, the most dramatic improvement is on Edge-Loc. It rises from 0.384 to 0.672. This class is characterized by defects localized near wafer edges due to handling or extraction errors, and its pattern has a strong radial signature directly captured by zone_edge and r_mean. zone_edge alone achieves only 0.372 F1 on Edge-Loc, yet the full fusion achieves 0.672. These trends broadly suggest that the radial localization signal is only useful when combined with density and directional information from other descriptors.
Center defects improve from 0.579 to 0.760. zone_core directly encodes the fraction of failures in the innermost radial band, making it the natural descriptor for this class. However, zone_core alone collapses Center F1 to 0.000, suggesting that center localization alone is insufficient and must be combined with density (fail_fraction) and spread (r_std) to disambiguate Center from other centrally-biased patterns such as Loc.
Donut defects show a large improvement from 0.207 to 0.493. The Donut class is characterized by a ring of failures at intermediate radii, which zone_mid is explicitly designed to capture. We were surprised to see that zone_mid alone produces the worst overall model and collapses Donut F1 to 0.000. In addition to the earlier described overlap in fail_fraction This counterintuitive result suggests that the mid-zone signal is highly ambiguous in isolation (many defect classes have some mid-zone failures) and only becomes discriminative when combined with r_std, which captures the ring-like concentration of failures at a consistent radius, and ang_entropy_norm, which captures the isotropic angular distribution characteristic of Donut defects.
Scratch defects improve modestly from 0.276 to 0.378. Scratches are directional linear patterns with low angular entropy and high aspect ratio. ang_entropy_norm and aspect_ratio are the natural descriptors for this class, yet both individually produce near-zero Scratch F1. The modest improvement in the full fusion model suggests that scratch patterns remain difficult to characterize with global spatial statistics alone; local texture or morphological features would likely be more effective, especially given that scratch defects can be induced by varied, often co-independent failure modes (for instance, chemical deposition on substrate versus tool abrasion during die separation).
Across all models, the Loc class is the most challenging, with F1 scores between 0.276 and 0.371. Loc defects consist of small, localized clusters that can appear anywhere on the wafer, producing no consistent radial, zonal, or angular signature. None of the eight descriptors encode local spatial clustering, which explains why the full fusion model offers only marginal improvement on this class. Higher-resolution local features or spatial attention mechanisms extending beyond pixel-by-pixel characterization would likely be required to make meaningful progress on Loc classification.
Near-full defects show a slight decline in the full fusion model (0.917 to 0.880). This class covers nearly the entire wafer surface and is already well-characterized by the CNN’s global receptive field. The descriptor signals add marginal noise for this class since fail_fraction approaches 1.0 and zone distributions are approximately uniform, providing little discriminative information from other spatial parameters beyond what the image already visually conveys in the convolution layer.
5.4. Limitations
All experiments are conducted with a single random seed (42), meaning reported metrics reflect a single training run. The validation loss instability observed during training, with accuracy oscillating by up to 10 points between consecutive epochs, suggests that results may have non-trivial variance across seeds. Multiple seeds would be required to establish statistical robustness of the reported gains.
Results are evaluated exclusively on the WM-811K benchmark. This dataset, while the standard benchmark, consists of processed wafer maps from a single source of micrographs collected in identical conditions. Generalization to real fabrication environments, different process nodes, or other wafer map datasets has not been tested, but is the logical next step for model augmentation.
The fusion strategy is limited to feature concatenation followed by a shared classifier. More expressive mechanisms, such as attention-based descriptor weighting, feature-wise linear modulation (FiLM), or learned gating, may better capture the conditional relevance of each descriptor per defect class without competing signals leading to model noise.
Edge deployment feasibility is assessed only on an Apple M4 CPU, which is not representative of actual semiconductor fab inspection hardware in physical assembly lines. Inference time on ARM Cortex, FPGA, or dedicated vision accelerators would be required before drawing deployment conclusions in a production-ready environment.
Finally, the descriptor and their geometric constraints were chosen based on physical intuition rather than a data-driven selection process. A leave-one-out ablation or mutual information analysis would quantify which descriptors contribute most to the observed synergy and whether the full set of eight is necessary for a thorough comparative study of the fusion and baseline models.
6. Conclusions
On the WM-811K benchmark (eight defect classes, 25,519 labeled wafers), the vision-only baseline achieves 60.0% test accuracy and 0.615 weighted F1. Nearly every single descriptor individually underperforms the baseline, with the best descriptor (fail fraction) reaching only 60.1%. However, the full fusion of all eight descriptors significantly outperforms the baseline, reaching 72.7% accuracy (+12.7 points) and 0.728 weighted F1. This synergy demonstrates that spatial descriptors provide complementary information that is only realizable in combination. Per-class analysis reveals that the combination model substantially improves challenging classes: Donut F1 rises from 0.207 to 0.493, Edge-Loc from 0.384 to 0.672, and Center from 0.579 to 0.760. However, the Loc class remains challenging for all models, likely due to its diffuse spatial patterns. The entire model occupies under 0.5 MB and runs in less than 3 ms on an Apple M4 CPU, suggesting suitability for edge deployment pending hardware-specific validation. Our results demonstrate that combining multiple spatial descriptors yields significant gains through synergy, and the ablation study provides interpretable insights into which physical features complement each other.
We presented a systematic ablation study of eight physically motivated spatial descriptors fused with a lightweight CNN for semiconductor wafer map defect classification. Using a controlled experimental design in which all models share identical classifier architectures, we demonstrated that no individual descriptor substantially improves over the vision-only baseline, yet their full combination yields a 12.7-point accuracy gain (59.95% to 72.70%).
Per-class analysis reveals that the fusion model achieves the largest gains on Edge-Loc (+28.8 points) and Center (+18.1 points): classes with strong radial spatial signatures that the descriptors are well-suited to capture. Donut defects improve substantially (+28.6 points) despite zone_mid, the most physically motivated descriptor for that class, being the worst-performing individual model. This result underscores the core finding: physical motivation at the individual descriptor level does not predict individual descriptor utility, but does predict collective utility through synergy. The Loc class remains challenging for all models, with F1 scores between 0.276 and 0.371, suggesting that global spatial statistics are insufficient for defects lacking consistent spatial signatures.
The full fusion model contains only 104,840 parameters and occupies 0.40 MB in ONNX format, representing a 3.3% parameter overhead over the vision-only baseline. These characteristics suggest suitability for resource-constrained deployment pending hardware-specific validation.
Future work should conduct leave-one-out and subset ablations to identify which descriptors drive the observed synergy, evaluate across multiple random seeds to establish statistical robustness, and investigate attention-based fusion mechanisms that can adaptively weight descriptors per input. Validation on real fabrication data and additional wafer map benchmarks would further establish the generalizability of the approach.
Appendix A. Full Per-Class F1 Scores
Table A1.
Per-class F1 scores — Part 1.
| Class | Full fusion | Vision-only | fail_fraction | aspect_ratio | r_std |
|---|---|---|---|---|---|
| Center | 0.760 | 0.579 | 0.433 | 0.535 | 0.006 |
| Donut | 0.493 | 0.207 | 0.166 | 0.159 | 0.139 |
| Edge-Loc | 0.672 | 0.384 | 0.473 | 0.068 | 0.329 |
| Edge-Ring | 0.934 | 0.935 | 0.935 | 0.896 | 0.928 |
| Loc | 0.356 | 0.276 | 0.371 | 0.405 | 0.249 |
| Near-full | 0.880 | 0.917 | 0.872 | 0.786 | 0.746 |
| Random | 0.763 | 0.697 | 0.779 | 0.675 | 0.715 |
| Scratch | 0.378 | 0.276 | 0.190 | 0.000 | 0.261 |
Table A2.
Per-class F1 scores — Part 2.
| Class | zone_edge | r_mean | ang_entropy_norm | zone_core | zone_mid |
|---|---|---|---|---|---|
| Center | 0.000 | 0.000 | 0.256 | 0.000 | 0.547 |
| Donut | 0.000 | 0.000 | 0.134 | 0.163 | 0.000 |
| Edge-Loc | 0.372 | 0.372 | 0.000 | 0.343 | 0.209 |
| Edge-Ring | 0.791 | 0.745 | 0.605 | 0.824 | 0.445 |
| Loc | 0.192 | 0.000 | 0.000 | 0.250 | 0.089 |
| Near-full | 0.830 | 0.900 | 0.936 | 0.898 | 0.698 |
| Random | 0.732 | 0.765 | 0.720 | 0.706 | 0.815 |
| Scratch | 0.193 | 0.198 | 0.000 | 0.219 | 0.264 |
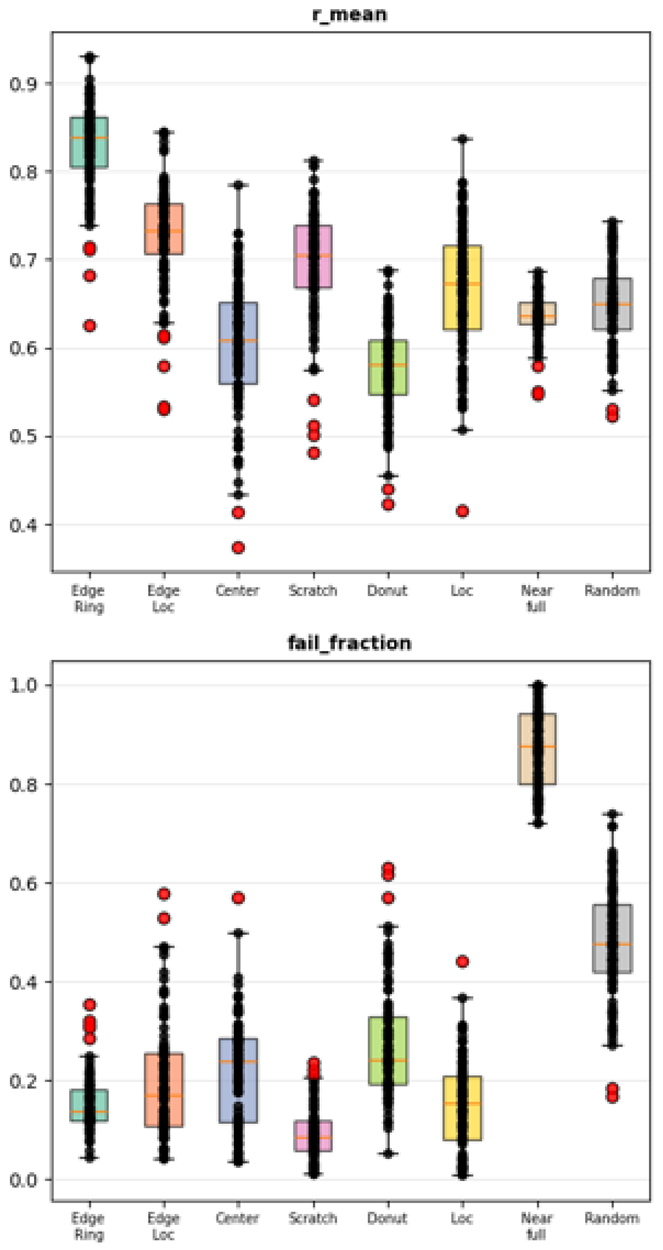
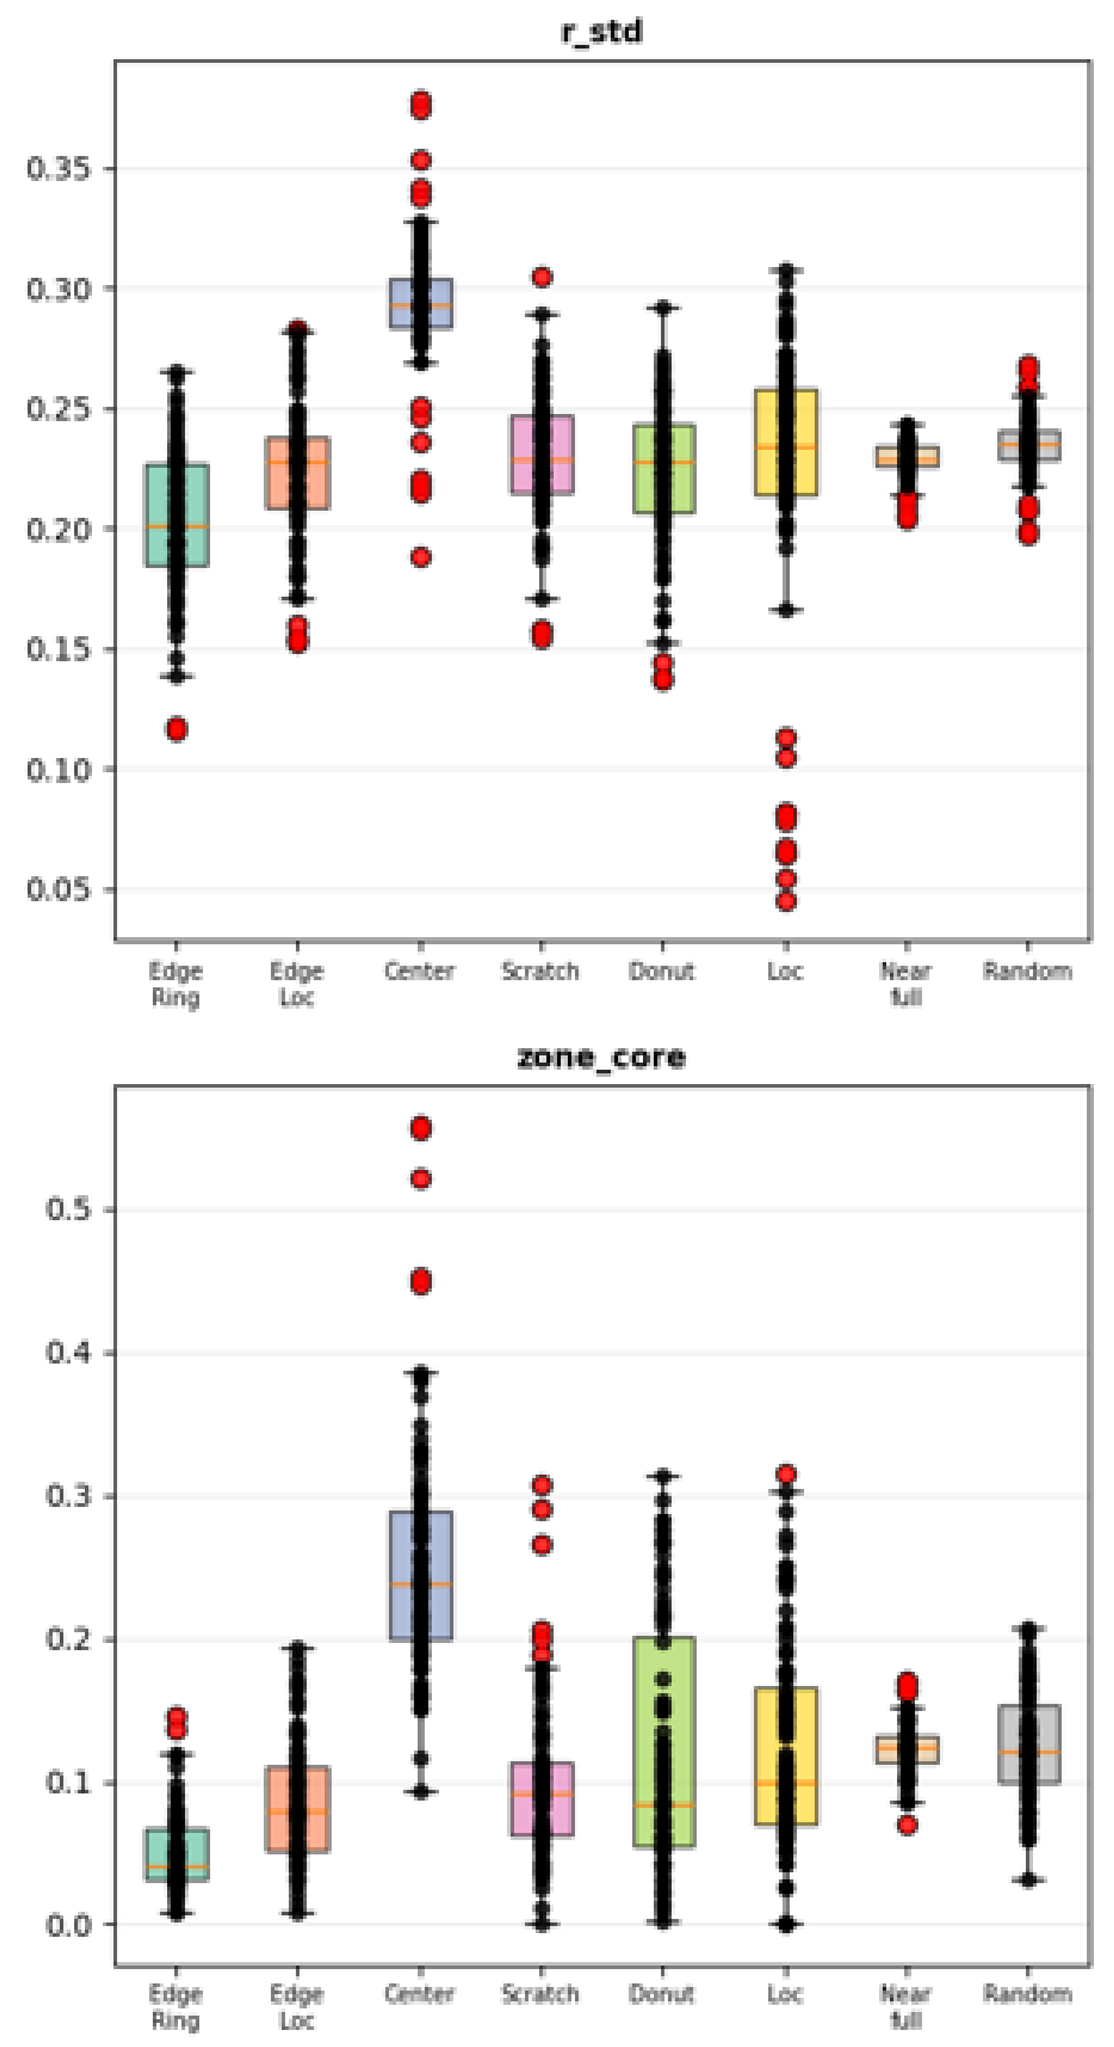
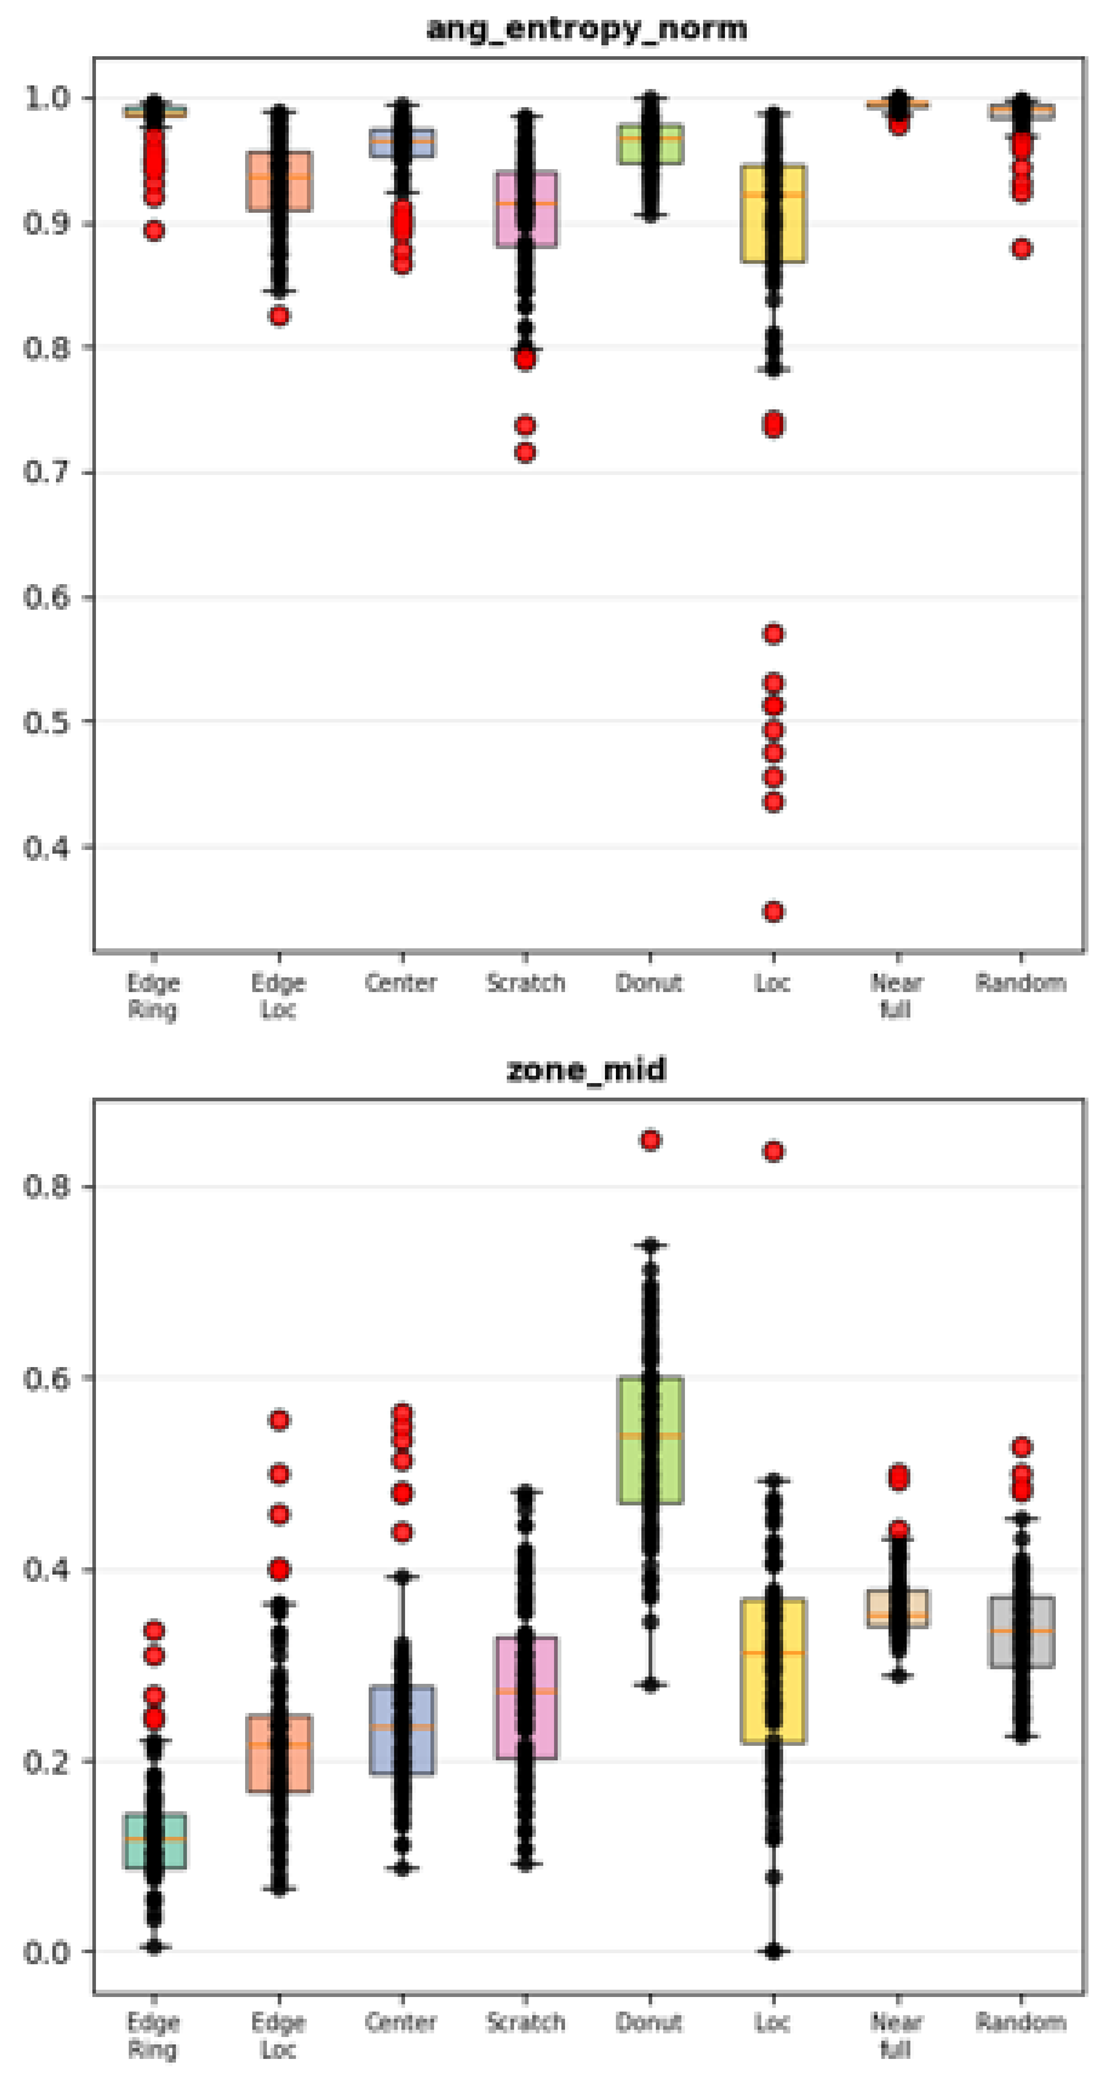
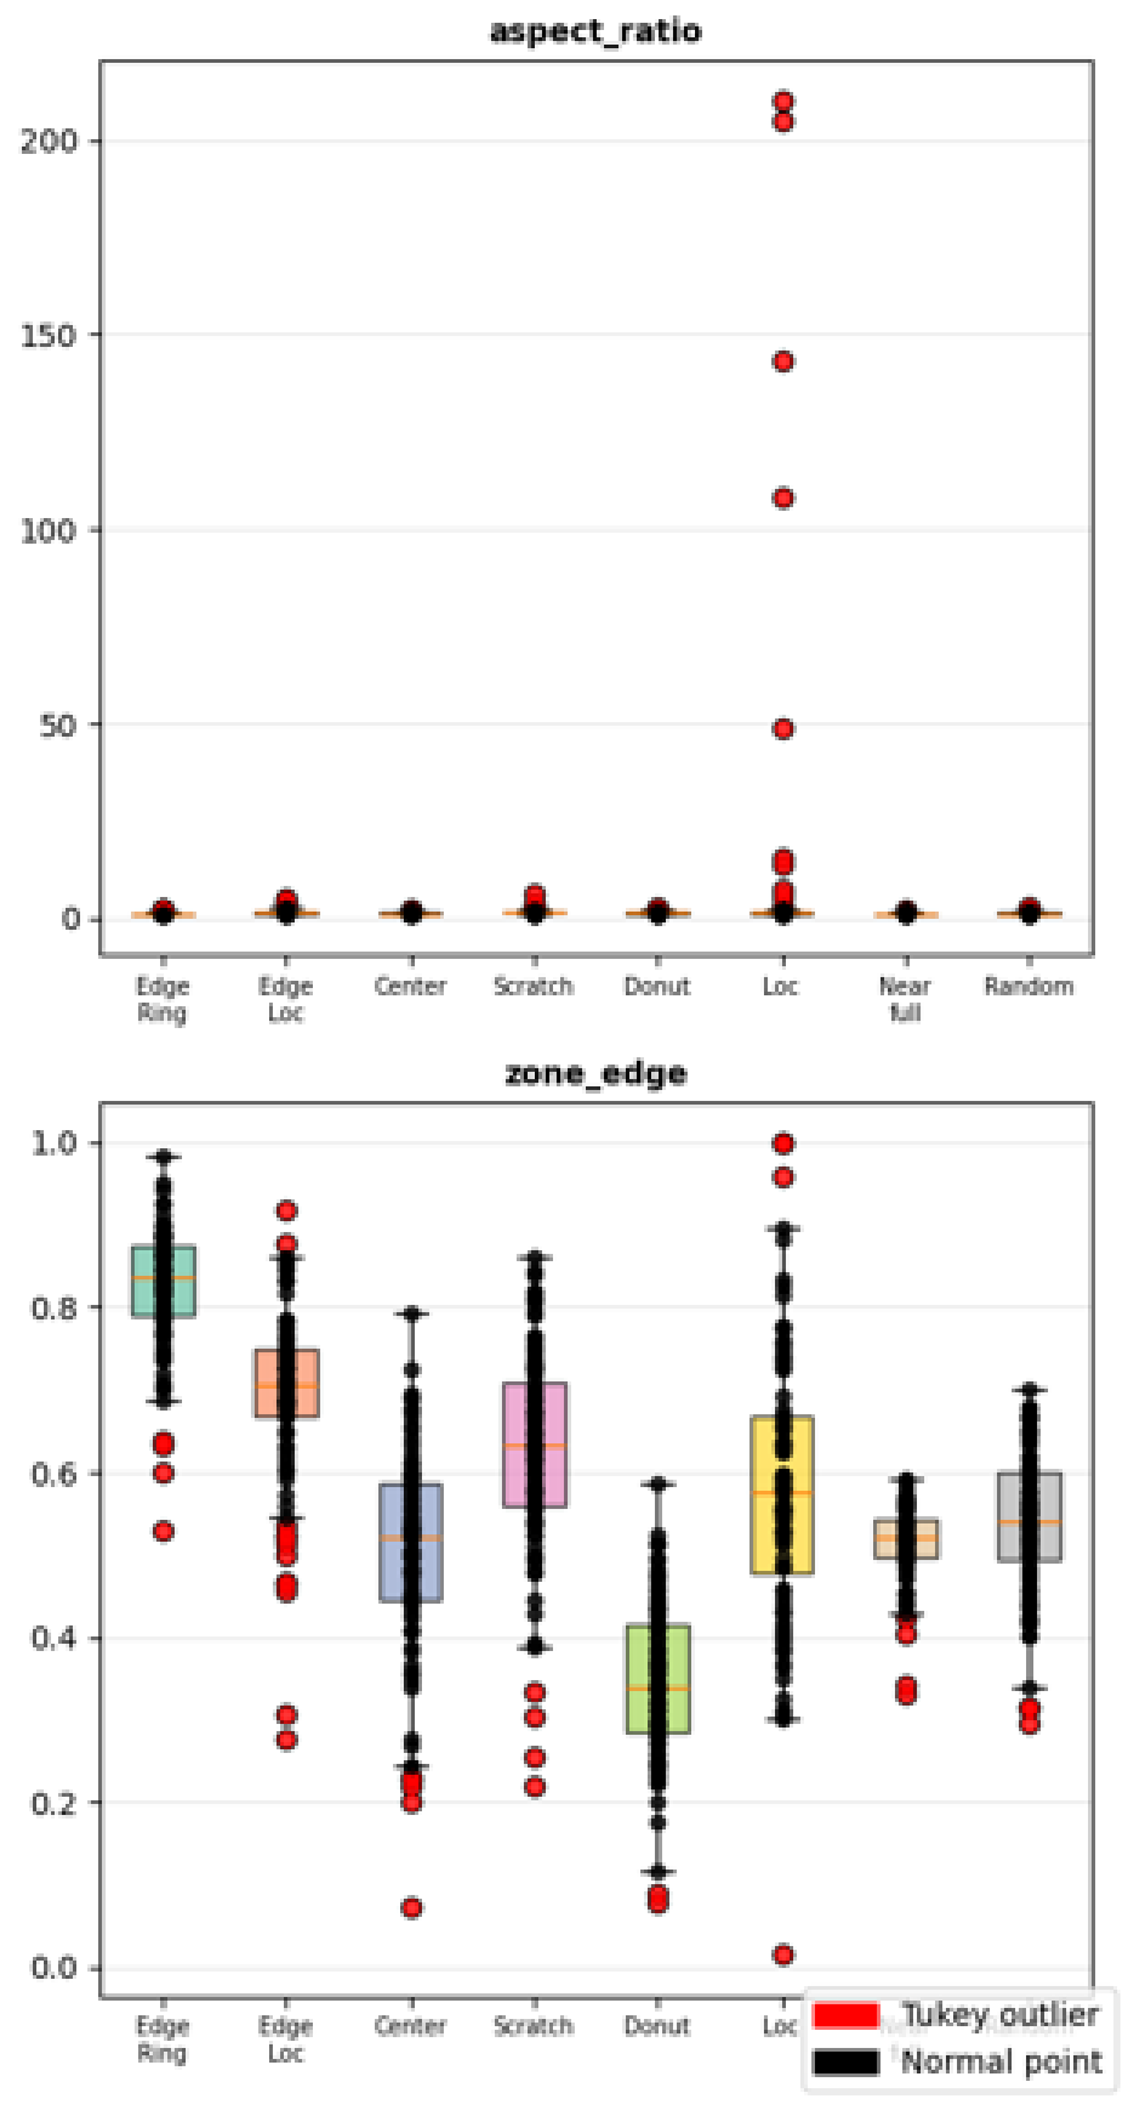
Appendix B. Feature Distributions Per Class
References
- Manivannan, S. Semi-Supervised Imbalanced Classification of Wafer Bin Map Defects Using a Dual-Head CNN. Expert Systems with Applications 2024, 238, 122301. [Google Scholar] [CrossRef]
- Nakazawa, T.; Kulkarni, D.V. Wafer Map Defect Pattern Classification and Image Retrieval Using Convolutional Neural Networks. IEEE Transactions on Semiconductor Manufacturing 2018, 31, 309–314. [Google Scholar] [CrossRef]
- Nakagaki, R.; Honda, T.; Nakamae, K. Automatic Recognition of Defect Areas on a Semiconductor Wafer Using Multiple Scanning Electron Microscope Images. Measurement Science and Technology 2009, 20, 075503. [Google Scholar] [CrossRef]
- Kang, S.; Cho, S.; Ahn, J.H. A Stacking Ensemble Classifier for Wafer Map Defect Pattern Classification. IEEE Transactions on Semiconductor Manufacturing 2020, 33, 638–646. [Google Scholar]
- Kim, T.; Behdinan, K. Advances in Machine Learning and Deep Learning Applications Towards Wafer Map Defect Recognition and Classification: A Review. Journal of Intelligent Manufacturing 2023, 34, 3215–3247. [Google Scholar] [CrossRef]
- Taha, K. Observational and Experimental Insights into Machine Learning-Based Defect Classification in Wafers. Journal of Intelligent Manufacturing 2025. [Google Scholar] [CrossRef]
- Tsai, T.H.; Wang, C.Y. Wafer Map Defect Classification Using Deep Learning Framework with Data Augmentation on Imbalance Datasets. Journal on Image and Video Processing 2025, 2025. [Google Scholar] [CrossRef]
- Long, Z.; Yan, J.; Piao, M. Multi-Scale Guidance Diffusion Network for Wafer Map Defect Recognition. Expert Systems with Applications 2025, 267, 126134. [Google Scholar] [CrossRef]
- Harada, M.; Minekawa, Y.; Nakamae, K. Defect Detection Techniques Robust to Process Variation in Semiconductor Inspection. Measurement Science and Technology 2019, 30, 035402. [Google Scholar] [CrossRef]
- Imoto, K.; Nakai, T.; Ike, T.; Haruki, K.; Sato, Y. A CNN-Based Transfer Learning Method for Defect Classification in Semiconductor Manufacturing. IEEE Transactions on Semiconductor Manufacturing 2019, 32, 455–459. [Google Scholar] [CrossRef]
- Saqlain, M.; Abbas, Q.; Lee, J.Y. A Deep Convolutional Neural Network for Wafer Defect Identification Using an Autoencoder. IEEE Access 2020, 8, 43555–43565. [Google Scholar]
- Vesala, G.T.; Ghali, V.S.; Vijaya Lakshmi, A.; Naik, R.B. Deep and Handcrafted Feature Fusion for Automatic Defect Detection in Quadratic Frequency Modulated Thermal Wave Imaging. Russian Journal of Nondestructive Testing 2021, 57, 476–485. [Google Scholar] [CrossRef]
Figure 2.
Confusion matrices for full fusion (all descriptors + CNN) and vision-only baseline models.
Figure 2.
Confusion matrices for full fusion (all descriptors + CNN) and vision-only baseline models.
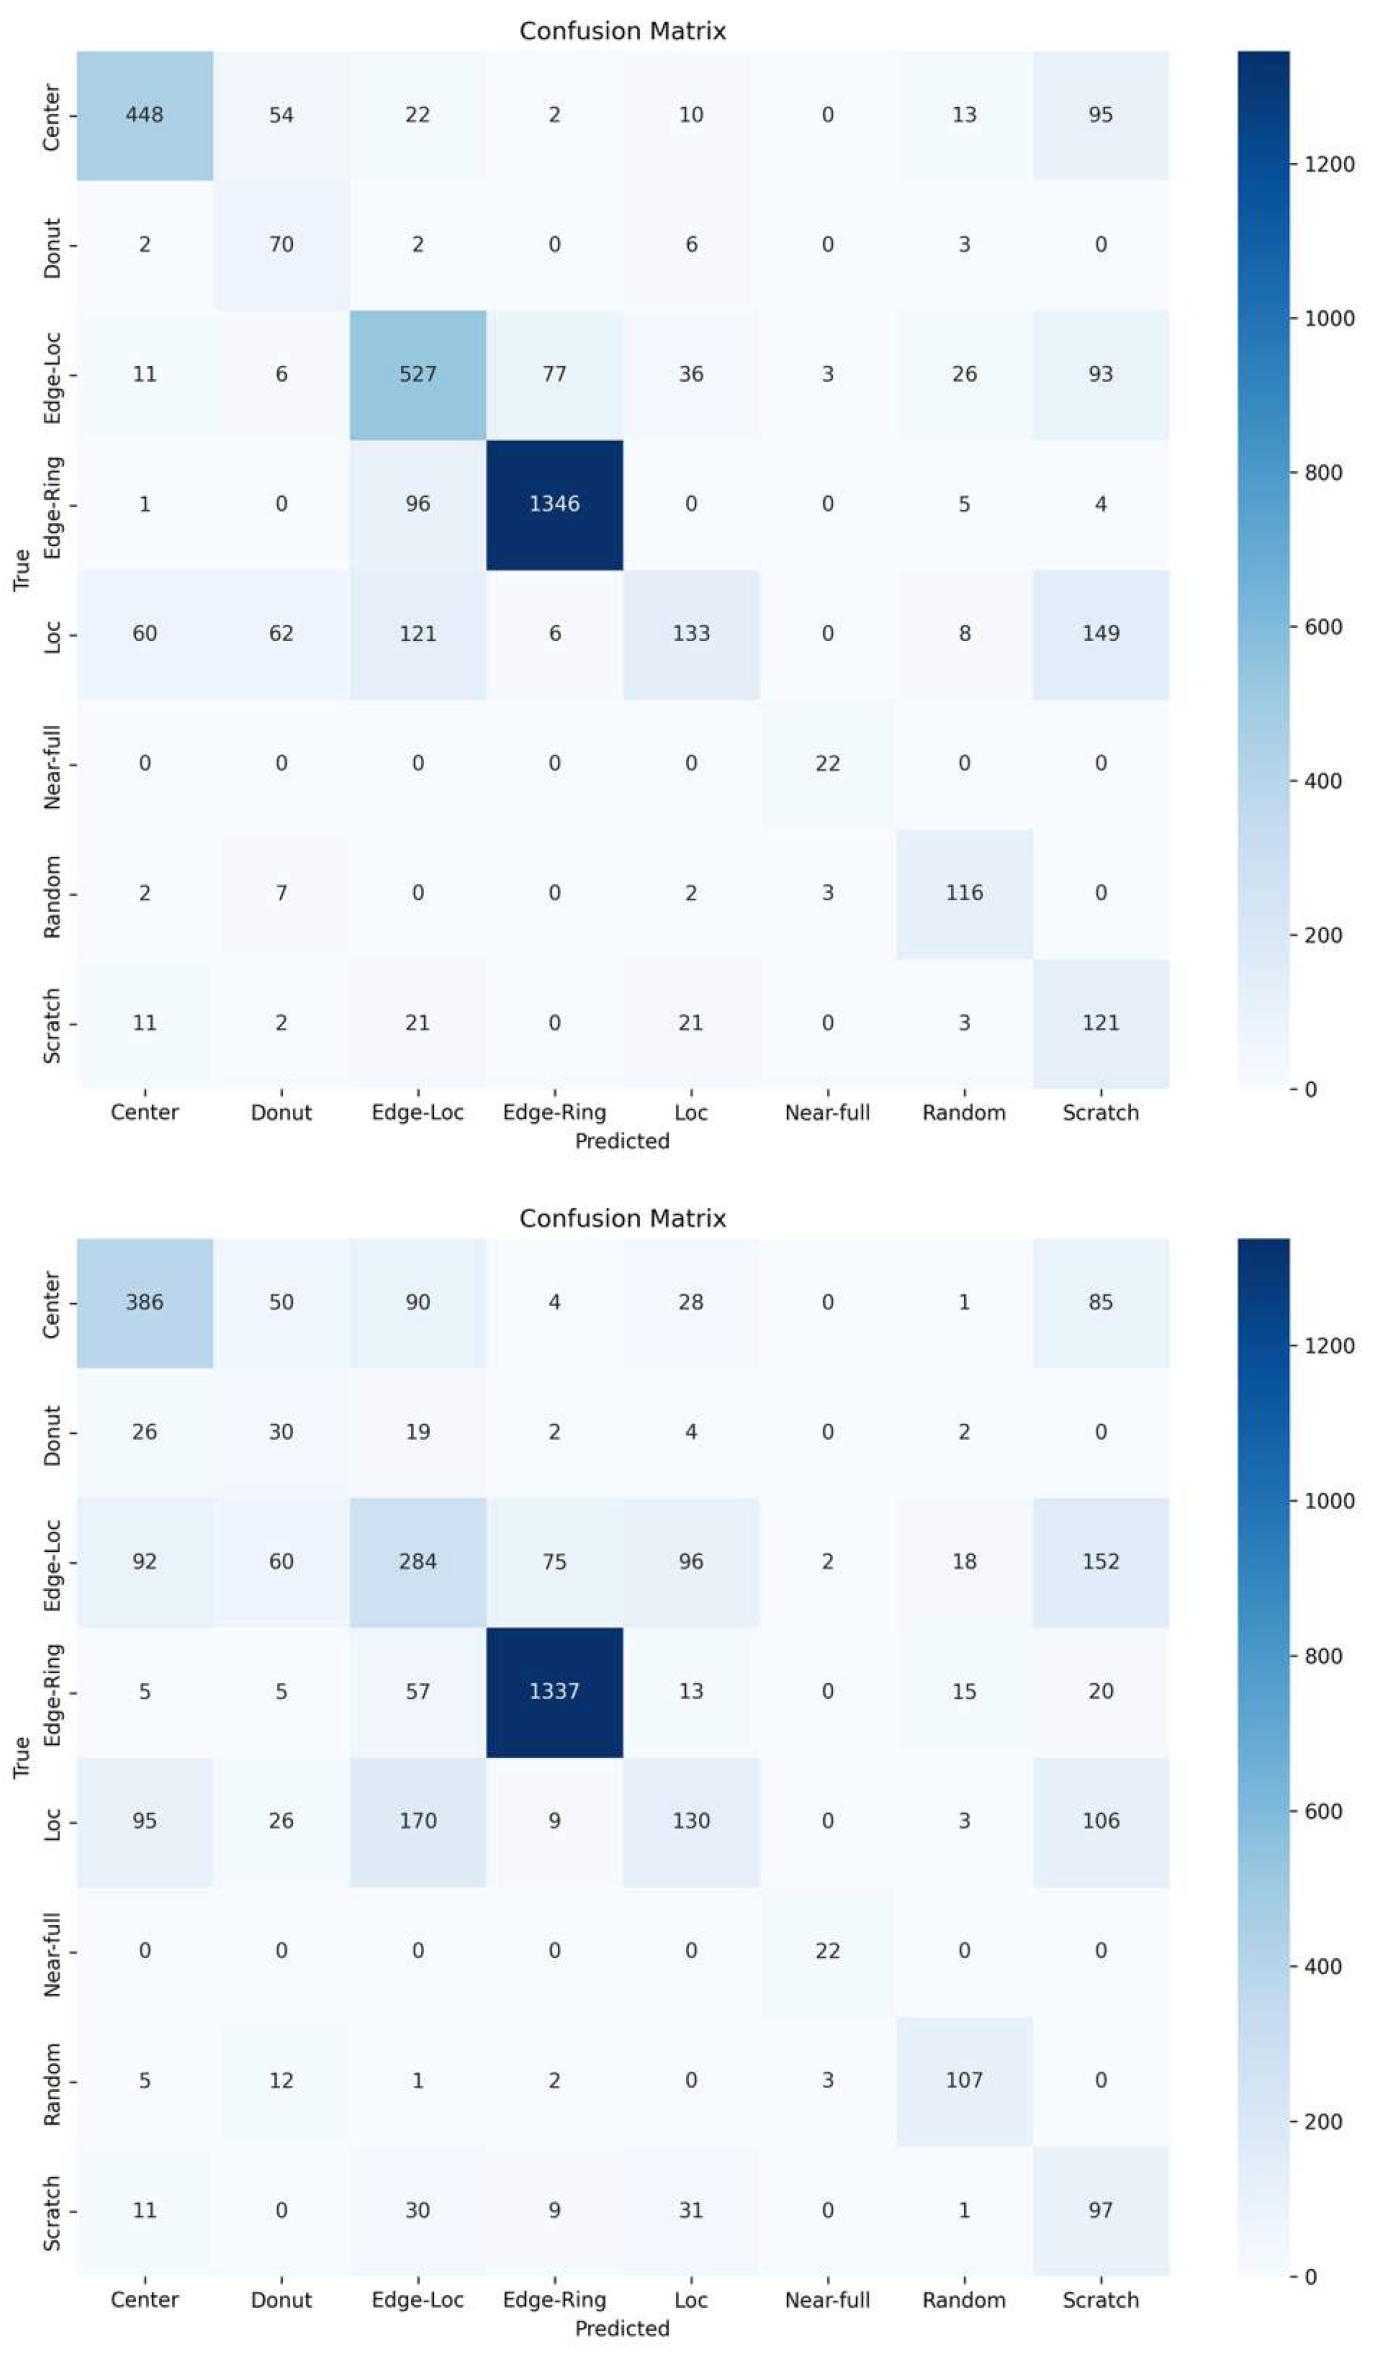
Table 2.
Parameter counts for each model variant.
| Model | Parameters |
|---|---|
| Vision-only | 101,448 |
| Single descriptor (any) | 104,616 |
| Full fusion (8 descriptors) | 104,840 |
Table 4.
Per-class F1 scores for selected models.
| Class | Vision-only | Full fusion | fail_fraction | zone_mid |
|---|---|---|---|---|
| Center | 0.579 | 0.760 | 0.433 | 0.547 |
| Donut | 0.207 | 0.493 | 0.166 | 0.000 |
| Edge-Loc | 0.384 | 0.672 | 0.473 | 0.209 |
| Edge-Ring | 0.935 | 0.934 | 0.935 | 0.445 |
| Loc | 0.276 | 0.356 | 0.371 | 0.089 |
| Near-full | 0.917 | 0.880 | 0.872 | 0.698 |
| Random | 0.697 | 0.763 | 0.779 | 0.815 |
| Scratch | 0.276 | 0.378 | 0.190 | 0.264 |
Disclaimer/Publisher’s Note: The statements, opinions and data contained in all publications are solely those of the individual author(s) and contributor(s) and not of MDPI and/or the editor(s). MDPI and/or the editor(s) disclaim responsibility for any injury to people or property resulting from any ideas, methods, instructions or products referred to in the content. |
© 2026 by the authors. Licensee MDPI, Basel, Switzerland. This article is an open access article distributed under the terms and conditions of the Creative Commons Attribution (CC BY) license (http://creativecommons.org/licenses/by/4.0/).
Copyright: This open access article is published under a Creative Commons CC BY 4.0 license, which permit the free download, distribution, and reuse, provided that the author and preprint are cited in any reuse.