Preprint
Article

This version is not peer-reviewed.

Association of Serum Calprotectin and the C-Reactive Protein–Triglyceride–Glucose Index with SYNTAX Score in Patients with Stable Coronary Artery Disease

A peer-reviewed version of this preprint was published in:
Medicina 2026, 62(5), 928. https://doi.org/10.3390/medicina62050928

Submitted:

17 March 2026

Posted:

18 March 2026

You are already at the latest version

Abstract

Background and Objectives: Systemic inflammation is a key driver in the progression and complexity of coronary artery disease (CAD). Serum calprotectin and the C-reactive protein–triglyceride–glucose index (CTI) have emerged as potential inflammatory and metabolic biomarkers; however, their association with angiographic disease severity has not been clearly defined. This study aimed to evaluate the relationship between serum calprotectin, CTI, and the SYNTAX score (SS) in patients with stable CAD. Materials and Methods: A total of 134 patients undergoing coronary angiography were enrolled. The SS was calculated to quantify coronary lesion complexity. Patients were classified into two groups based on the results of the coronary angiogram: low SS (n = 73, SS <23), and intermediate–high SS (n = 61, SS >23). Serum calprotectin, and CTI were obtained at baseline. Correlation analyses were performed to evaluate associations between biomarkers and SS. Receiver operating characteristic (ROC) curve analysis assessed the ability of these biomarkers to predict intermediate–high SS. Univariable and multivariable logistic regression analyses were performed to determine independent associations. Results: Patients with intermediate–high SS had significantly higher levels of serum calprotectin (1009.5 vs. 505.7 ng/mL), and CTI (9.9 vs. 9.5) compared with those with low SS (all p<0.001). Spearman correlation analysis demonstrated significant positive correlations between SS and, serum calprotectin (ρ = 0.488), and CTI (ρ = 0.453) (all p < 0.001). ROC analysis showed moderate discriminatory performance for predicting intermediate–high SS (0.739 for serum calprotectin, and 0.722 for CTI). In multivariable models, CTI showed the strongest independent association with intermediate–high SS (OR: 4.66, 95% CI: 2.00–10.84, p<0.001). Conclusions: Serum calprotectin and CTI were significantly associated with coronary lesion complexity, as measured by the SS. These biomarkers may serve as valuable tools for identifying patients with greater CAD severity and anatomical complexity.

Keywords: 
;  ;  ;  ;  ;  

1. Introduction

Coronary artery disease (CAD) is one of the leading causes of morbidity and mortality worldwide [1,2,3]. The anatomical extent and complexity of coronary atherosclerosis are important determinants guiding both revascularization decisions and clinical management [3]. The Synergy between Percutaneous Coronary Intervention and TAXUS and Cardiac Surgery (SYNTAX) score (SS) is a validated angiographic tool designed to measure coronary lesion complexity. It has demonstrated strong prognostic benefit in patients with stable CAD [4]. SS typically ranges from zero to the values exceeding 60 in cases of highly complex coronary anatomy. Higher scores reflect a greater anatomical burden and disease complexity [5,6]. According to the SS classification, patients are classified into three groups: low risk (<23), intermediate risk (23-32), and high risk (≥33). It is known that patients with intermediate-high SS have worse clinical outcomes, including increased mortality, myocardial infarction and major adverse cardiovascular events, and generally require more complex revascularization strategies [5]. Regarding prognostic evaluation, findings from the BARI 2D trial indicated that individuals with an intermediate-high SS (>23) faced a significantly elevated risk for development of major adverse cardiovascular events [7]. Inflammation plays a leading role in all stages of atherosclerosis, from plaque formation to progression and eventual destabilization. Accordingly, systemic inflammatory activity is a potential marker of disease severity beyond conventional cardiovascular risk factors [8]. CRP has been extensively investigated and associated with adverse cardiovascular outcomes and increased plaque burden [9]. However, CRP represents a non-specific inflammatory response and may not fully reflect the complexity of inflammatory pathways involved in advanced CAD. Calprotectin, also known as S100A8/A9 or MRP8/14, is a heterodimer of S100A8 and S100A9 proteins released primarily by activated neutrophils and monocytes. Unlike CRP, which reflects general systemic inflammation, calprotectin directly reflects neutrophil-monocyte activation and local vascular inflammatory activity. High serum calprotectin levels have been associated with endothelial dysfunction, plaque instability, poorly developed coronary collateral circulation, and adverse cardiovascular outcomes [10,11,12]. Experimental and clinical studies demonstrate that calprotectin plays an active role in atherogenesis by promoting leukocyte recruitment and potentiating inflammatory signaling within the vascular wall [11]. Increasing evidence highlights the interplay between metabolic dysregulation and inflammation in the pathophysiology of CAD. The triglyceride-glucose (TyG) index has been proposed as an indicator of insulin resistance and has shown significant associations with cardiovascular risk and atherosclerotic burden [13,14,15]. Recently, composite indices integrating inflammatory and metabolic components such as C-reactive protein-triglyceride-glucose index (CTI) have been introduced to better reflect the inflammatory-metabolic environment contributing to the severity of CAD [15]. However, the clinical significance of CTI and serum calprotectin in relation to coronary lesion complexity has not been fully elucidated. We hypothesized that higher levels of these inflammation-related biomarkers would be associated with greater angiographic coronary complexity and would help identify patients with moderate-to-high SS. Therefore, the present study aimed to investigate the relationship between serum calprotectin, CTI, and SS in patients with stable CAD.

2. Materials and Methods

2.1. Study Design and Population

This prospective cross-sectional study was conducted at the Department of Cardiology, Faculty of Medicine, Yozgat Bozok University, Türkiye. The study included 134 consecutive patients aged between 18 to 80 years old with CAD who presented with stable angina pectoris or angina-equivalent symptoms and underwent diagnostic coronary angiography between June 2019 and May 2020. Patients were excluded if they met any of the following criteria: acute coronary syndrome; active infection; ongoing inflammatory or autoimmune disorders; prior coronary artery bypass grafting; previous percutaneous coronary intervention; heart failure with a left ventricular ejection fraction (LVEF) < 50%; hypertrophic cardiomyopathy; coronary artery spasm; moderate-to-severe valvular heart disease; congenital cardiac anomalies; thyroid dysfunction; renal impairment (eGFR < 50 mL/min/1.73 m2); hepatic dysfunction (transaminase levels exceeding three times the upper normal limit); hematologic disorders; or active malignancy. Additionally, individuals receiving lipid-lowering therapy were excluded to minimize potential effects on metabolic and inflammatory markers. All demographic, clinical, laboratory, and angiographic data were collected prospectively during the index hospitalization.

2.2. Clinical Definitions and Echocardiography

Individuals with fasting plasma glucose level of ≥126 mg/dL or receiving oral antidiabetic medication or insulin therapy were considered to have diabetes mellitus. Hypertension was defined as systolic blood pressure of ≥140 mmHg, diastolic blood pressure of ≥90 mmHg, or the use of antihypertensive drugs at the time of evaluation. Hyperlipidemia was defined as a total serum cholesterol level of ≥200 mg/dL. Smoking status was recorded as active tobacco use at the time of clinical assessment. Body mass index (BMI) was calculated by dividing body weight in kilograms by the square of height in meters (kg/m2). Transthoracic echocardiography was performed using a Philips Affiniti 50 ultrasound system (Philips Healthcare, Eindhoven, the Netherlands) in accordance with the recommendations of the American Society of Echocardiography. The LVEF was calculated using the modified biplane Simpson’s method.

2.3. Laboratory Measurements

Fasting venous blood samples were obtained upon admission, prior to coronary angiography. Samples were collected in 5 mL BD Vacutainer SST II Advance tubes (Becton, Dickinson and Company, Franklin Lakes, NJ, USA) and centrifuged at 1300 × g for 10 minutes following clot completion. The separated sera were stored at –80 °C until the time of analysis. Serum calprotectin levels were measured using Human Enzyme-Linked Immunosorbent Assay (ELISA) kits (Sunlong Biotech Co., Ltd., Hangzhou, China), with values expressed in ng/mL. A complete blood count was performed using the XN 1000 analyzer (Sysmex America Inc., Lincolnshire, IL, USA). CRP levels, fasting glucose, triglycerides, and liver and kidney function parameters were measured using the Architect ci4100 automated analyzer (Abbott, Abbott Park, IL, USA). The CTI was calculated based on established formulas integrating inflammatory and metabolic components [16], using fasting serum triglyceride, fasting plasma glucose, and CRP levels obtained from venous blood samples collected after an overnight fast of at least 8 hours. Triglyceride and glucose values were converted from mg/dL to mmol/L before CTI calculation.
CTI = ln [CRP (mg/L) × triglyceride (mmol/L) × glucose (mmol/L) / 2].

2.4. Coronary Angiography and Angiographic Evaluation

Coronary angiography was performed via the radial or femoral artery using the standard Judkins technique. Coronary arteries were visualized in cranial, caudal, and right/left oblique projections using a Philips Allura Xper FD10 system (Philips Healthcare, Eindhoven, Netherlands). Iopromide (Ultravist 370, Schering AG, Berlin, Germany) was used as the contrast medium. Only patients with optimal angiographic image quality were included. Angiograms and quantitative coronary analyses were independently assessed by two experienced cardiologists who were blinded to clinical and laboratory data. Luminal diameter stenosis was recorded according to the American Heart Association reporting system, with the anatomical location and percentage of stenosis documented for each lesion. The SS was calculated for all patients using dedicated software (available at http://www.syntaxscore.com/calc/start.htm). Thereafter, the patients were divided into two groups based on the severity of CAD: low SS (n =73, SS <23), and intermediate–high SS (n = 61, SS >23).

2.5. Ethical Approval

The study protocol was reviewed and approved by the Local Ethics Committee (Decision Date: 24 April 2019; Approval Number: 2017-KAEK-189-01). The study was conducted in strict accordance with the principles outlined in the Declaration of Helsinki. All procedures involving human participants were performed in compliance with institutional and national ethical standards. All participants were fully informed about the study’s objectives and provided written informed consent prior to enrollment.

2.6. Statistical Analysis

All statistical analyses were performed using the Python programming language (version 3.11) with the pandas, NumPy, and SciPy libraries. The normality of continuous variables was assessed using the Shapiro–Wilk test and further evaluated by visual inspection of histograms and Q–Q plots. As none of the continuous variables showed a normal distribution, data are presented as medians with interquartile ranges (IQR), while categorical variables are expressed as absolute numbers and percentages. Comparisons of continuous variables between groups were performed using the non-parametric Mann–Whitney U test. Associations between inflammatory biomarkers and CAD severity were evaluated using Spearman’s rank correlation analysis. The diagnostic performance of CRP, serum calprotectin, and the CTI for predicting intermediate–high SS was assessed using receiver operating characteristic (ROC) curve analysis. Discriminatory ability was quantified by calculating the area under the curve (AUC), and statistical significance was tested against the null hypothesis of an AUC of 0.5. Optimal cut-off values were determined using the Youden index to maximize sensitivity and specificity. Comparisons between ROC curves were conducted using the Hanley and McNeil method [17]. Odds ratios (ORs) with 95% confidence intervals (CIs) were calculated to estimate the risk of intermediate–high coronary complexity associated with elevated biomarker levels. A two-tailed p-value of < 0.05 was considered statistically significant for all analyses.

3. Results

3.1. Baseline Characteristics of the Study Population

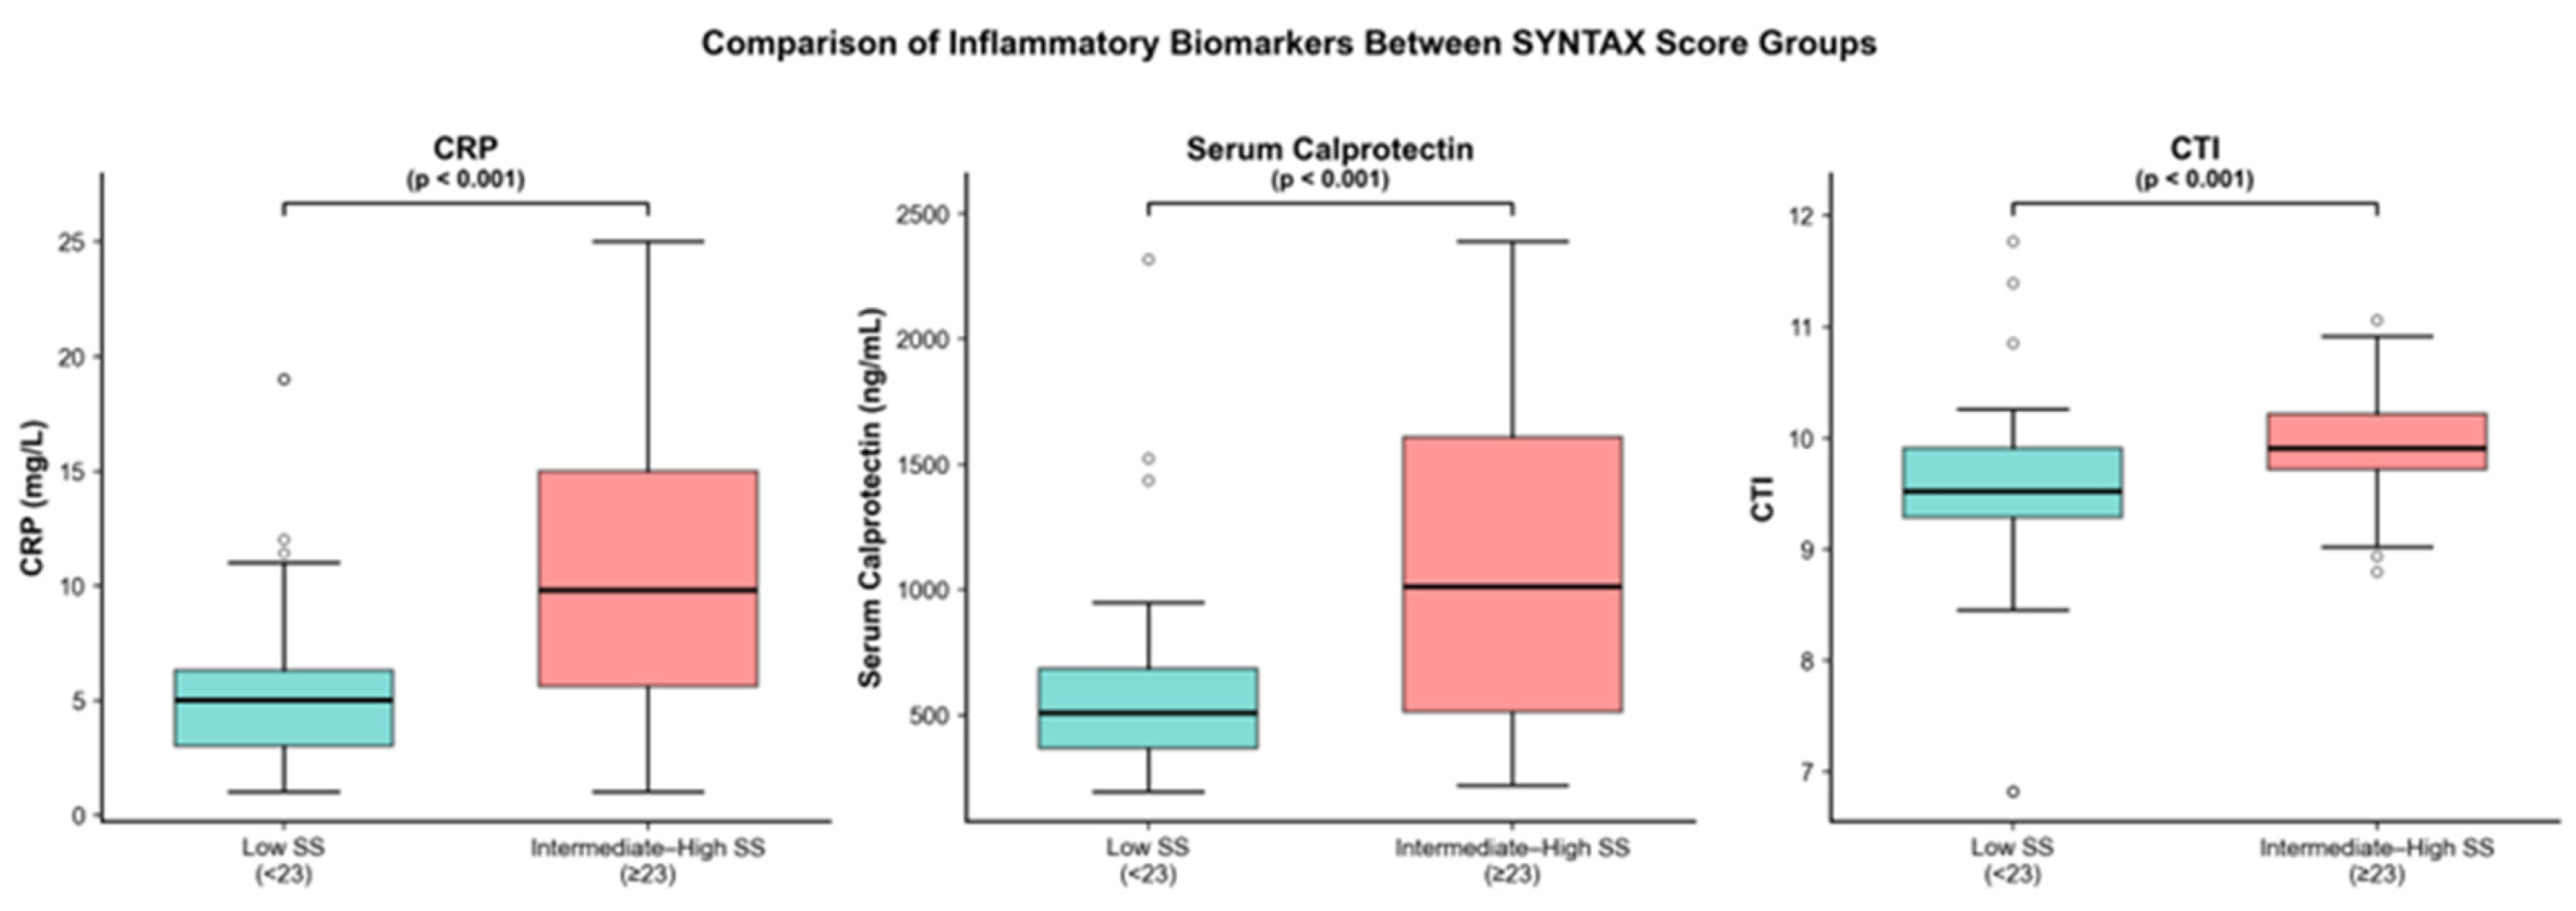
A total of 134 patients with angiographically confirmed CAD were included in the analysis and divided into two groups according to SS: low SS (n = 73) and intermediate–high SS (n = 61). The mean age of the study population was 61.3 ± 7.8 years, and 70.9% of the patients were male. The mean BMI was 24.63 ± 2.2 kg/m2, reflecting a predominantly normal-to-overweight population. Common cardiovascular risk factors were highly prevalent, including dyslipidemia (53.7%), diabetes mellitus (51.5%), hypertension (48.5%), and active smoking (42.5%). The mean SS was 24.29 ± 10.99, and 45.5% of patients were classified as having intermediate–high SS. Inflammatory markers demonstrated a mean CRP level of 7.56 ± 5.13 mg/L. Additionally, the mean serum calprotectin level was 838.06 ±582.03 ng/mL, and the mean CTI was 9.74 ± 0.65. Baseline demographic and clinical characteristics were comparable between the two groups (Table 1). Although patients in the intermediate–high SS group tended to be older, the difference did not reach statistical significance. Systolic and diastolic blood pressure, BMI, heart rate, and LVEF were similar between the groups (all p > 0.05). There were no significant differences in smoking status, dyslipidemia, diabetes mellitus, or hypertension. Triglyceride levels were higher in the intermediate–high SS group; however, this difference was borderline and did not reach statistical significance (p = 0.053). Routine biochemical parameters did not differ significantly between the groups (all p > 0.05). Notably, inflammatory markers showed significant differences. CRP levels were markedly elevated in the intermediate–high SS group compared with the low SS group (9.8 [5.6–15.0] vs. 5.0 [3.0–6.3] mg/L, p < 0.001). Similarly, serum calprotectin levels were significantly higher in patients with intermediate–high SS (1009.5 [511.6–1607.6] vs. 505.7 [365.1–684.9] ng/mL, p < 0.001). Additionally, the CTI was significantly increased in the intermediate–high SS group (9.9 [9.7–10.2] vs. 9.5 [9.3–9.9], p < 0.001).

3.2. Correlation Between Inflammatory Biomarkers and SYNTAX Score

Correlation analyses between clinical variables and the SS are presented in Table 2. Spearman correlation analysis demonstrated significant positive associations between the SS and key inflammatory biomarkers. Serum calprotectin showed a moderate correlation with SS (ρ = 0.488, p < 0.001), similar to that observed for CRP (ρ = 0.488, p < 0.001). CTI was also significantly correlated with SS (ρ = 0.453, p < 0.001) (Figure 1). Triglyceride levels showed a weak positive correlation with the SS; however, this relationship was not statistically significant (ρ = 0.168, p = 0.053). Furthermore, traditional cardiovascular risk factors and other lipid parameters did not show a significant correlation with the SS. Kendall’s tau-b correlation analysis, performed as a complementary analysis due to the presence of tied ranks in CRP values, confirmed these findings. The Kendall τ-b coefficients were 0.341 for CRP, 0.353 for serum calprotectin, and 0.326 for CTI, all indicating statistically significant associations with the SS (p < 0.001 for all).

3.3. Comparison According to SYNTAX Score Category

When patients were stratified according to SS categories, those with intermediate–high SS exhibited significantly higher median levels of inflammatory biomarkers compared with the low SS group. Median CRP levels were 9.8 mg/L (IQR: 5.6–15.0) in the intermediate–high SS group and 5.0 mg/L (IQR: 3.0–6.3) in the low SS group (p < 0.001). Similarly, serum calprotectin levels were significantly elevated in patients with intermediate–high SS (1009.5 ng/mL [IQR: 511.6–1607.7]) compared with those with low SS (505.7 ng/mL [IQR: 365.1–684.9]; p < 0.001). CTI was likewise significantly higher in the intermediate–high SS group (median 9.90 vs. 9.52; p < 0.001) (Figure 2).

3.4. Diagnostic Performance for Intermediate–High SYNTAX Score

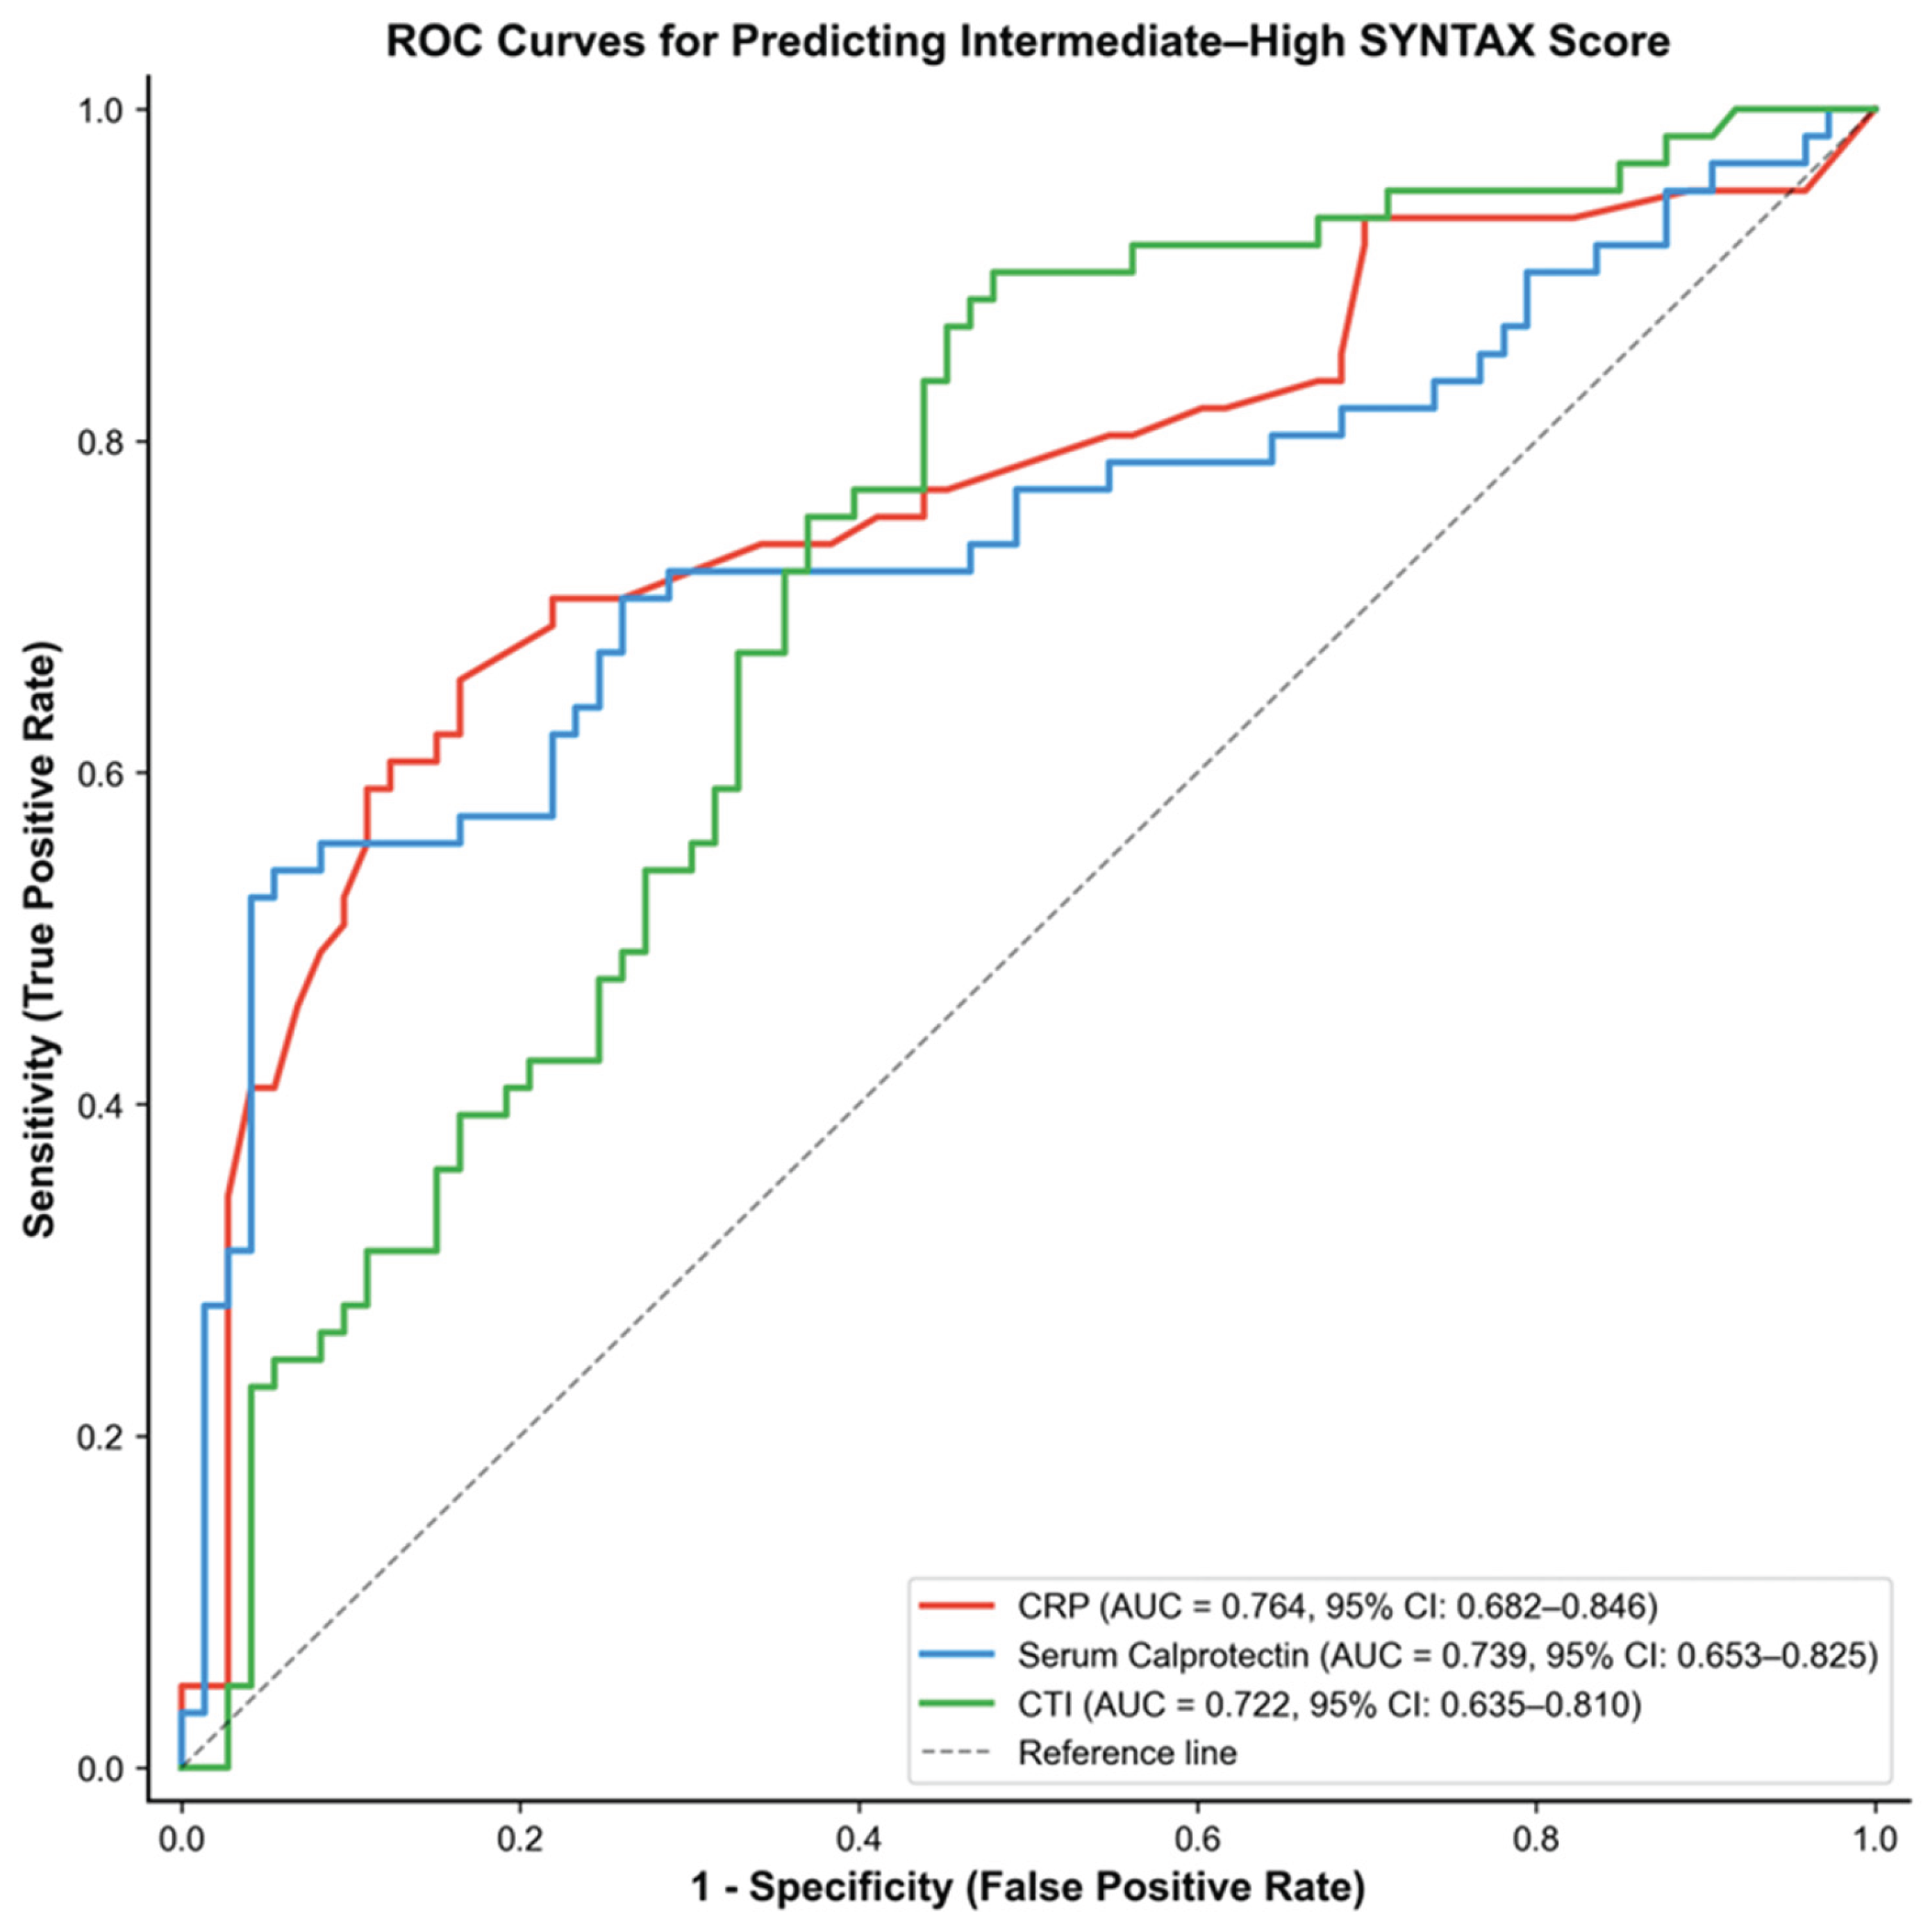
ROC curve analysis was performed to evaluate the discriminatory ability of CRP, serum calprotectin, and CTI for predicting Remarkably, CTI continued to show the strongest independent associatio intermediate-high SS. CRP demonstrated the highest discriminatory performance with an AUC of 0.764 (95% CI: 0.682–0.846, p < 0.001), followed by serum calprotectin (AUC: 0.739; 95% CI: 0.653–0.825, p < 0.001) and the CTI (AUC: 0.722; 95% CI: 0.635–0.810, p < 0.001) (Figure 3). Optimal cut-off values derived using the Youden index were 7.40 mg/L for CRP, 944.28 ng/mL for serum calprotectin, and 9.56 for the CTI (Table 3a).
Pairwise comparisons of the ROC curves were performed using the Hanley–McNeil method to evaluate whether the discriminatory performance of the three biomarkers differed significantly (Table 3b). The comparison between CRP and serum calprotectin showed a small difference in AUC that was not statistically significant (ΔAUC = 0.025; z = 0.480; p = 0.631). Similarly, the difference between CRP and CTI did not reach statistical significance (ΔAUC = 0.042; z = 0.802; p = 0.422). Likewise, serum calprotectin and CTI demonstrated no significant difference in discriminatory performance (ΔAUC = 0.017; z = 0.298; p = 0.766).
To further quantify the association between inflammatory biomarkers and coronary lesion complexity, univariable and multivariable logistic regression analyses were performed with intermediate–high SS (≥23) as the dependent variable and continuous biomarker levels as independent variables (Table 4). In the univariable analysis, higher levels of all three biomarkers were significantly associated with an increased likelihood of intermediate–high SS. Each 1 mg/L increase in CRP was associated with a 27% higher odds of intermediate–high coronary complexity (OR: 1.27; 95% CI: 1.15–1.40; p < 0.001). Similarly, for serum calprotectin, each 100 ng/mL increase corresponded to a 24% increase in odds of intermediate–high SS (OR: 1.24; 95% CI: 1.13–1.35; p < 0.001). Among the evaluated biomarkers, CTI demonstrated the strongest association, with each 1-unit increase associated with a 3.82-fold higher odds of intermediate–high coronary complexity (OR: 3.82; 95% CI: 1.79–8.16; p < 0.001). After adjustment for potential confounders including age, sex, diabetes mellitus, hypertension, and smoking status, the associations remained robust in the multivariable logistic regression analysis. The adjusted OR for CRP remained 1.27 per 1 mg/L increase (95% CI: 1.15–1.41; p < 0.001), while serum calprotectin retained a significant association with an adjusted OR of 1.24 per 100 ng/mL increase (95% CI: 1.13–1.36; p < 0.001). CTI continued to show the strongest independent association, with an adjusted OR of 4.66 per unit increase (95% CI: 2.00–10.84; p < 0.001).

4. Discussion

This study demonstrated a significant association between serum calprotectin, CRP, and CTI and angiographic coronary complexity assessed by SS in patients with stable CAD. While these biomarkers showed moderate but significant correlations with SS, CTI showed the strongest independent association in multivariate analysis. Although ROC analysis showed statistically significant discriminatory capacity, the observed AUC values remained moderate rather than reflecting a strong distinction. Therefore, these biomarkers should be interpreted as auxiliary tools, not independent tools, for anatomical risk stratification. Previous studies have shown that high CRP levels are associated with adverse cardiovascular outcomes and increased atherosclerotic events. Furthermore, several studies have shown that CRP plays a role as a marker of systemic inflammation in CAD [8,9]. Our findings confirmed that CRP is not only associated with clinical outcomes but also correlates with angiographic disease complexity. These proteins are particularly concentrated in areas with inflammatory cell infiltration, and this increased expression has been shown to be associated with intraplaque inflammation and tissue destruction. This suggests that calprotectin may function as a biomarker in acute coronary syndrome [11]. This is consistent with the growing evidence that calprotectin is associated with plaque fragility and adverse cardiovascular outcomes, as shown in studies. Demir et al. reported that high serum calprotectin levels were independently associated with impaired coronary collateral circulation in patients with stable CAD and suggested a potential link between increased inflammatory activity and adverse coronary vascular remodeling [12]. This observation suggests that calprotectin reflects more than just systemic inflammation. It may also reflect localized inflammatory processes affecting coronary anatomy and microvascular function. These mechanisms may explain the relationship between high serum calprotectin levels and increased angiographic coronary complexity observed in our study. Serum calprotectin has been consistently associated with adverse outcomes in various ischemic vascular conditions. High calprotectin concentrations have been associated with higher disease severity and worse functional outcomes in acute ischemic events, suggesting that this biomarker reflects an inflammatory response contributing to tissue damage and poor prognosis [18]. In addition, higher serum calprotectin levels have been observed in overweight individuals and those with impaired glucose metabolism, even among healthy populations, suggesting that inflammatory activation may precede clinical signs of CAD [19]. These data support the idea that calprotectin is a marker of prognostic significance in multiple vascular regions. Our study demonstrated that serum calprotectin had a moderate ability to distinguish between moderate and high SS; the AUC was 0.739 (95% CI: 0.653–0.825). It provided a sensitivity of 54.1% and a remarkably high specificity of 94.5%, suggesting that high calprotectin levels can identify patients with advanced coronary lesion complexity with high sensitivity. In their cohort of 1,007 patients with acute coronary syndrome, Xiong et al. demonstrated that the TyG index independently predicted intermediate–high coronary complexity defined as a SS >23. In that study, a weak but significant positive correlation was observed between the TyG index and the SS (r = 0.22, p < 0.001), and the TyG index remained an independent predictor of intermediate–high SS in multivariable logistic regression analysis (OR: 2.645, 95% CI: 1.902–3.679, p < 0.001), with an area under the ROC curve of 0.631 (95% CI: 0.588–0.674) [20]. These findings suggest that metabolic dysregulation plays a key role in the development of coronary lesion complexity. The CTI, an index that integrates systemic inflammation and metabolic dysfunction with CRP also contributing to the TyG index, showed a significant association with coronary lesion complexity in our study, consistent with the study above. ROC analysis showed that CTI predicted intermediate–high SS with an AUC of 0.722 (95% CI: 0.635–0.810), indicating a moderate discriminatory performance. The optimal cut-off value of 9.56 yielded a high sensitivity of 90.2%, suggesting that CTI may be particularly useful for identifying patients at increased anatomical risk. Furthermore, in multivariable logistic regression analysis, CTI remained an independent predictor of intermediate–high SS, with each one-unit increase associated with 4.66-fold higher odds of greater coronary complexity (95% CI: 2.00–10.84, p < 0.001). CTI may provide complementary information beyond traditional metabolic markers in identifying patients with more complex CAD. Recent evidence has further emphasized the role of CTI as a marker of extensive coronary involvement. Machine learning–based analyses have demonstrated that CTI is a strong predictor of multivessel disease and may outperform several traditional cardiovascular risk factors in identifying advanced coronary pathology [21]. In line with this evolving perspective, classical risk factors in our cohort did not show a significant association with the SS. Consistent evidence from diverse cardiovascular populations, including patients with heart failure [22], elderly individuals [23], and those undergoing percutaneous coronary intervention further supports the prognostic value of indices integrating inflammation and insulin resistance [24]. These studies indicate that CRP–triglyceride–glucose-based indices provide an integrated framework linking metabolic dysfunction, inflammatory activity, angiographic coronary complexity, and adverse cardiovascular outcomes. Furthermore, CTI incorporates CRP within its formula, which may partially explain the similarity in predictive performance between these markers. This structural relationship warrants careful statistical modeling in future studies to avoid collinearity and to clarify the independent contribution of each biomarker. This study had some limitations. First, this study is a small-sample size and is a single-center study. Second, the cross-sectional design hinders the establishment of causal relationships; longitudinal and prospective studies are needed to clarify whether serum calprotectin or CTI plays a direct role in the severity of coronary atherosclerosis. Third, measurements were taken only once, and temporal changes in inflammatory or metabolic status were not assessed. Fourth, confounding from unmeasured variables cannot be ignored. Data regarding drug intensity, inflammatory comorbidities, and lifestyle factors was limited and may have influenced biomarker levels.

5. Conclusions

This study demonstrated that serum calprotectin and CTI were significantly associated with angiographic coronary lesion complexity, as assessed by SS, in patients with stable CAD. Both biomarkers showed moderate but significant correlations with SS and demonstrated moderate discriminative performance in identifying patients with moderate-to-high anatomical disease burden. However, large-scale population studies are needed to understand further clinical benefits of these parameters and to find area of clinical implications.

Author Contributions

Conceptualization, V.D. and H.E.; methodology, V.D., H.E., and Y.T.; software, V.D., H.E., and M.R.B.; validation, V.D., H.E., and C.A.; formal analysis, V.D., H.E., and M.G.; investigation, V.D., H.E., M.R.B., and H.A.; resources, V.D., H.E., and M.I.D.; data curation, V.D., H.E., O.Y., and S.I.; writing—original draft preparation, V.D., H.E., and Y.T.; writing—review and editing, V.D., H.E., M.R.B., and C.A.; visualization, V.D., H.E., and M.G.; supervision, V.D., H.E., and S.I.; project administration, V.D., H.E., and H.A. All authors have read and agreed to the published version of the manuscript.

Institutional Review Board Statement

The study was conducted in accordance with the Declaration of Helsinki and approved by the Ethics Committee of Yozgat Bozok University (protocol code: 2017-KAEK-189-01; date of approval: 24 April 2019).

Data Availability Statement

The data presented in this study are available on request from the corresponding author. The data are not publicly available due to ethical restrictions and patient privacy.

Conflicts of Interest

The authors declare no conflict of interest.

Abbreviations

The following abbreviations are used in this manuscript:
AUC Area under the curve
BMI Body mass index
CAD Coronary artery disease
CI Confidence interval
CRP C-reactive protein
CTI C-reactive protein–triglyceride–glucose index
ELISA Enzyme-linked immunosorbent assay
IQR Interquartile range
LVEF Left ventricular ejection fraction
OR Odds ratio
ROC Receiver operating characteristic
SS SYNTAX score
TyG Triglyceride–glucose index

References

  1. Kodeboina, M.; Piayda, K.; Jenniskens, I.; Vyas, P.; Chen, S.; Pesigan, R.J.; Ferko, N.; Patel, B.P.; Dobrin, A.; Habib, J.; et al. Challenges and Burdens in the Coronary Artery Disease Care Pathway for Patients Undergoing Percutaneous Coronary Intervention: A Contemporary Narrative Review. Int. J. Environ. Res. Public Health 2023, 20, 5633. [Google Scholar]
  2. Sultana, N.; Ha, F.J.; White, A.; Brown, A.J.; Nerlekar, N. Revascularization in Stable Coronary Disease: A Systematic Review and Meta-Analysis of Randomized Clinical Trials. Int. J. Angiol. 2025, 34, 360–369. [Google Scholar] [CrossRef]
  3. Iqbal, J.; Serruys, P.W.; Taggart, D.P. Optimal revascularization for complex coronary artery disease. Nat. Rev. Cardiol. 2013, 10, 635–647. [Google Scholar] [CrossRef]
  4. Banning, A.P.; Serruys, P.; De Maria, G.L.; Ryan, N.; Walsh, S.; Gonzalo, N.; van Geuns, R.J.; Onuma, Y.; Sabate, M.; Davies, J.; et al. Five-year outcomes after state-of-the-art percutaneous coronary revascularization in patients with de novo three-vessel disease: Final results of the SYNTAX II study. Eur. Heart J. 2022, 43, 1307–1316. [Google Scholar]
  5. Byrne, R.A.; Fremes, S.; Capodanno, D.; Czerny, M.; Doenst, T.; Emberson, J.R.; Falk, V.; Gaudino, M.; McMurray, J.J.V.; Mehran, R.; et al. 2022 Joint ESC/EACTS review of the 2018 guideline recommendations on the revascularization of left main coronary artery disease in patients at low surgical risk and anatomy suitable for PCI or CABG. Eur. Heart J. 2023, 44, 4310–4320. [Google Scholar]
  6. Masuda, S.; Serruys, P.W.; Kageyama, S.; Kotoku, N.; Ninomiya, K.; Garg, S.; Soo, A.; Morel, M.A.; Puskas, J.D.; Narula, J.; et al. Treatment recommendation based on SYNTAX score 2020 derived from coronary computed tomography angiography and invasive coronary angiography. Int. J. Cardiovasc. Imaging 2023, 39, 1795–1804. [Google Scholar] [CrossRef]
  7. Ikeno, F.; Brooks, M.M.; Nakagawa, K.; Kim, M.K.; Kaneda, H.; Mitsutake, Y.; Vlachos, H.A.; Schwartz, L.; Frye, R.L.; Kelsey, S.F.; et al. SYNTAX score and long-term outcomes: The BARI-2D trial. J. Am. Coll. Cardiol. 2017, 69, 395–403. [Google Scholar]
  8. Libby, P. Inflammation in atherosclerosis. Nature 2002, 420, 868–874. [Google Scholar] [CrossRef] [PubMed]
  9. Ridker, P.M. C-reactive protein and the prediction of cardiovascular events among those at intermediate risk: Moving an inflammatory hypothesis toward consensus. J. Am. Coll. Cardiol. 2007, 49, 2129–2138. [Google Scholar] [PubMed]
  10. Sun, Y.; Xu, H.; Gao, W.; Deng, J.; Song, X.; Li, J.; Liu, X. S100A8/A9 proteins: Critical regulators of inflammation in cardiovascular diseases. Front. Cardiovasc. Med. 2024, 11, 1394137. [Google Scholar] [CrossRef] [PubMed]
  11. Zuo, Y.; NaveenKumar, S.K.; Navaz, S.; Liang, W.; Sugur, K.; Kmetova, K.; Ayers, C.R.; Kluge, L.; Chong, E.; Shah, A.M.; et al. Epidemiological and translational study of calprotectin and atherosclerotic cardiovascular disease. JAMA Cardiol. 2025, 10, 718–727. [Google Scholar] [CrossRef]
  12. Demir, V.; Ede, H.; Ercan, M.; Turan, Y.; Hidayet, S.; Inandiklioglu, N.; Erbay, A.R. Relationship of serum calprotectin, angiopoietin 1, and angiopoietin 2 levels with coronary collateral circulation in patients with stable coronary artery disease. Kardiol. Pol. 2019, 77, 1155–1162. [Google Scholar] [CrossRef]
  13. Sun, Y.; Guo, Y.; Ma, S.; Mao, Z.; Meng, D.; Xuan, K.; Lu, R.; Pan, X.; Zhu, X. Association of C-reactive protein–triglyceride glucose index with the incidence and mortality of cardiovascular disease: A retrospective cohort study. Cardiovasc. Diabetol. 2025, 24, 313. [Google Scholar] [CrossRef] [PubMed]
  14. Lu, Z.; Li, L.; Wang, X.; Lv, L.; Rong, S.; Li, B. Association between C-reactive protein–triglyceride glucose index and future cardiovascular disease risk in a population with cardiovascular–kidney–metabolic syndrome stage 0–3. Sci. Rep. 2025, 15, 31152. [Google Scholar] [CrossRef] [PubMed]
  15. Chen, Y.; Jia, W.; Guo, J.; Yang, H.; Sheng, X.; Wei, L.; Li, J. Association between the C-reactive protein–triglyceride glucose index and new-onset coronary heart disease among metabolically heterogeneous individuals. Cardiovasc. Diabetol. 2025, 24, 316. [Google Scholar] [CrossRef] [PubMed]
  16. Ruan, G.T.; Xie, H.L.; Zhang, H.Y.; Liu, C.A.; Ge, Y.Z.; Zhang, Q.; Wang, Z.W.; Zhang, X.; Tang, M.; Song, M.M.; et al. A novel inflammation and insulin resistance related indicator to predict the survival of patients with cancer. Front. Endocrinol. 2022, 13, 905266. [Google Scholar] [CrossRef]
  17. Hanley, J.A.; McNeil, B.J. The meaning and use of the area under a receiver operating characteristic (ROC) curve. Radiology 1982, 143, 29–36. [Google Scholar] [CrossRef]
  18. Li, H.; Zhao, K.; Yu, W. Correlation of serum calprotectin with outcome of acute cerebral infarction. Open Med. 2025, 20, 20251207. [Google Scholar] [CrossRef]
  19. Bergmann, K.; Stefańska, A.; Kuligowska-Prusińska, M.; Krintus, M. Serum calprotectin is associated with overweight and laboratory markers of glucose metabolism in apparently healthy young adults—A cross-sectional descriptive study. Metabolites 2025, 15, 756. [Google Scholar] [CrossRef]
  20. Xiong, S.; Chen, Q.; Long, Y.; Su, H.; Luo, Y.; Liu, H.; Chen, Y.; Feng, Q.; Peng, X.; Jiang, M.; et al. Association of the triglyceride–glucose index with coronary artery disease complexity in patients with acute coronary syndrome. Cardiovasc. Diabetol. 2023, 22, 56. [Google Scholar] [CrossRef]
  21. Hou, L.; Li, Y.; Liu, Q. C-reactive protein–triglyceride glucose index in predicting three-vessel coronary artery disease risk: A retrospective study using machine learning approaches. Ann. Med. 2025, 57, 2584308. [Google Scholar] [CrossRef] [PubMed]
  22. Kaya, Ç.; Öztürk, C. Prognostic value of the CRP-TyG index for in-hospital and 1-year mortality in patients with decompensated heart failure. BMC Cardiovasc. Disord. 2026, 26, 65. [Google Scholar] [CrossRef] [PubMed]
  23. Ni, G.; Chen, Z.; Zhu, A.; Cheang, I.; Zhu, X.; Fu, Y.; Zhang, H.; Li, X. Association between C-reactive protein–triglyceride glucose index (CTI) and cardiovascular and all-cause mortality risk among the elderly population: Insights from three datasets. Clin. Res. Cardiol. 2026, 1, 7. [Google Scholar] [CrossRef] [PubMed]
  24. Gao, A.; Peng, B.; Gao, Y.; Yang, Z.; Li, Z.; Guo, T.; Qiu, H.; Gao, R. Evaluation and comparison of inflammatory and insulin resistance indicators on recurrent cardiovascular events in patients undergoing percutaneous coronary intervention: A single-center retrospective observational study. Diabetol. Metab. Syndr. 2025, 17, 157. [Google Scholar] [CrossRef]
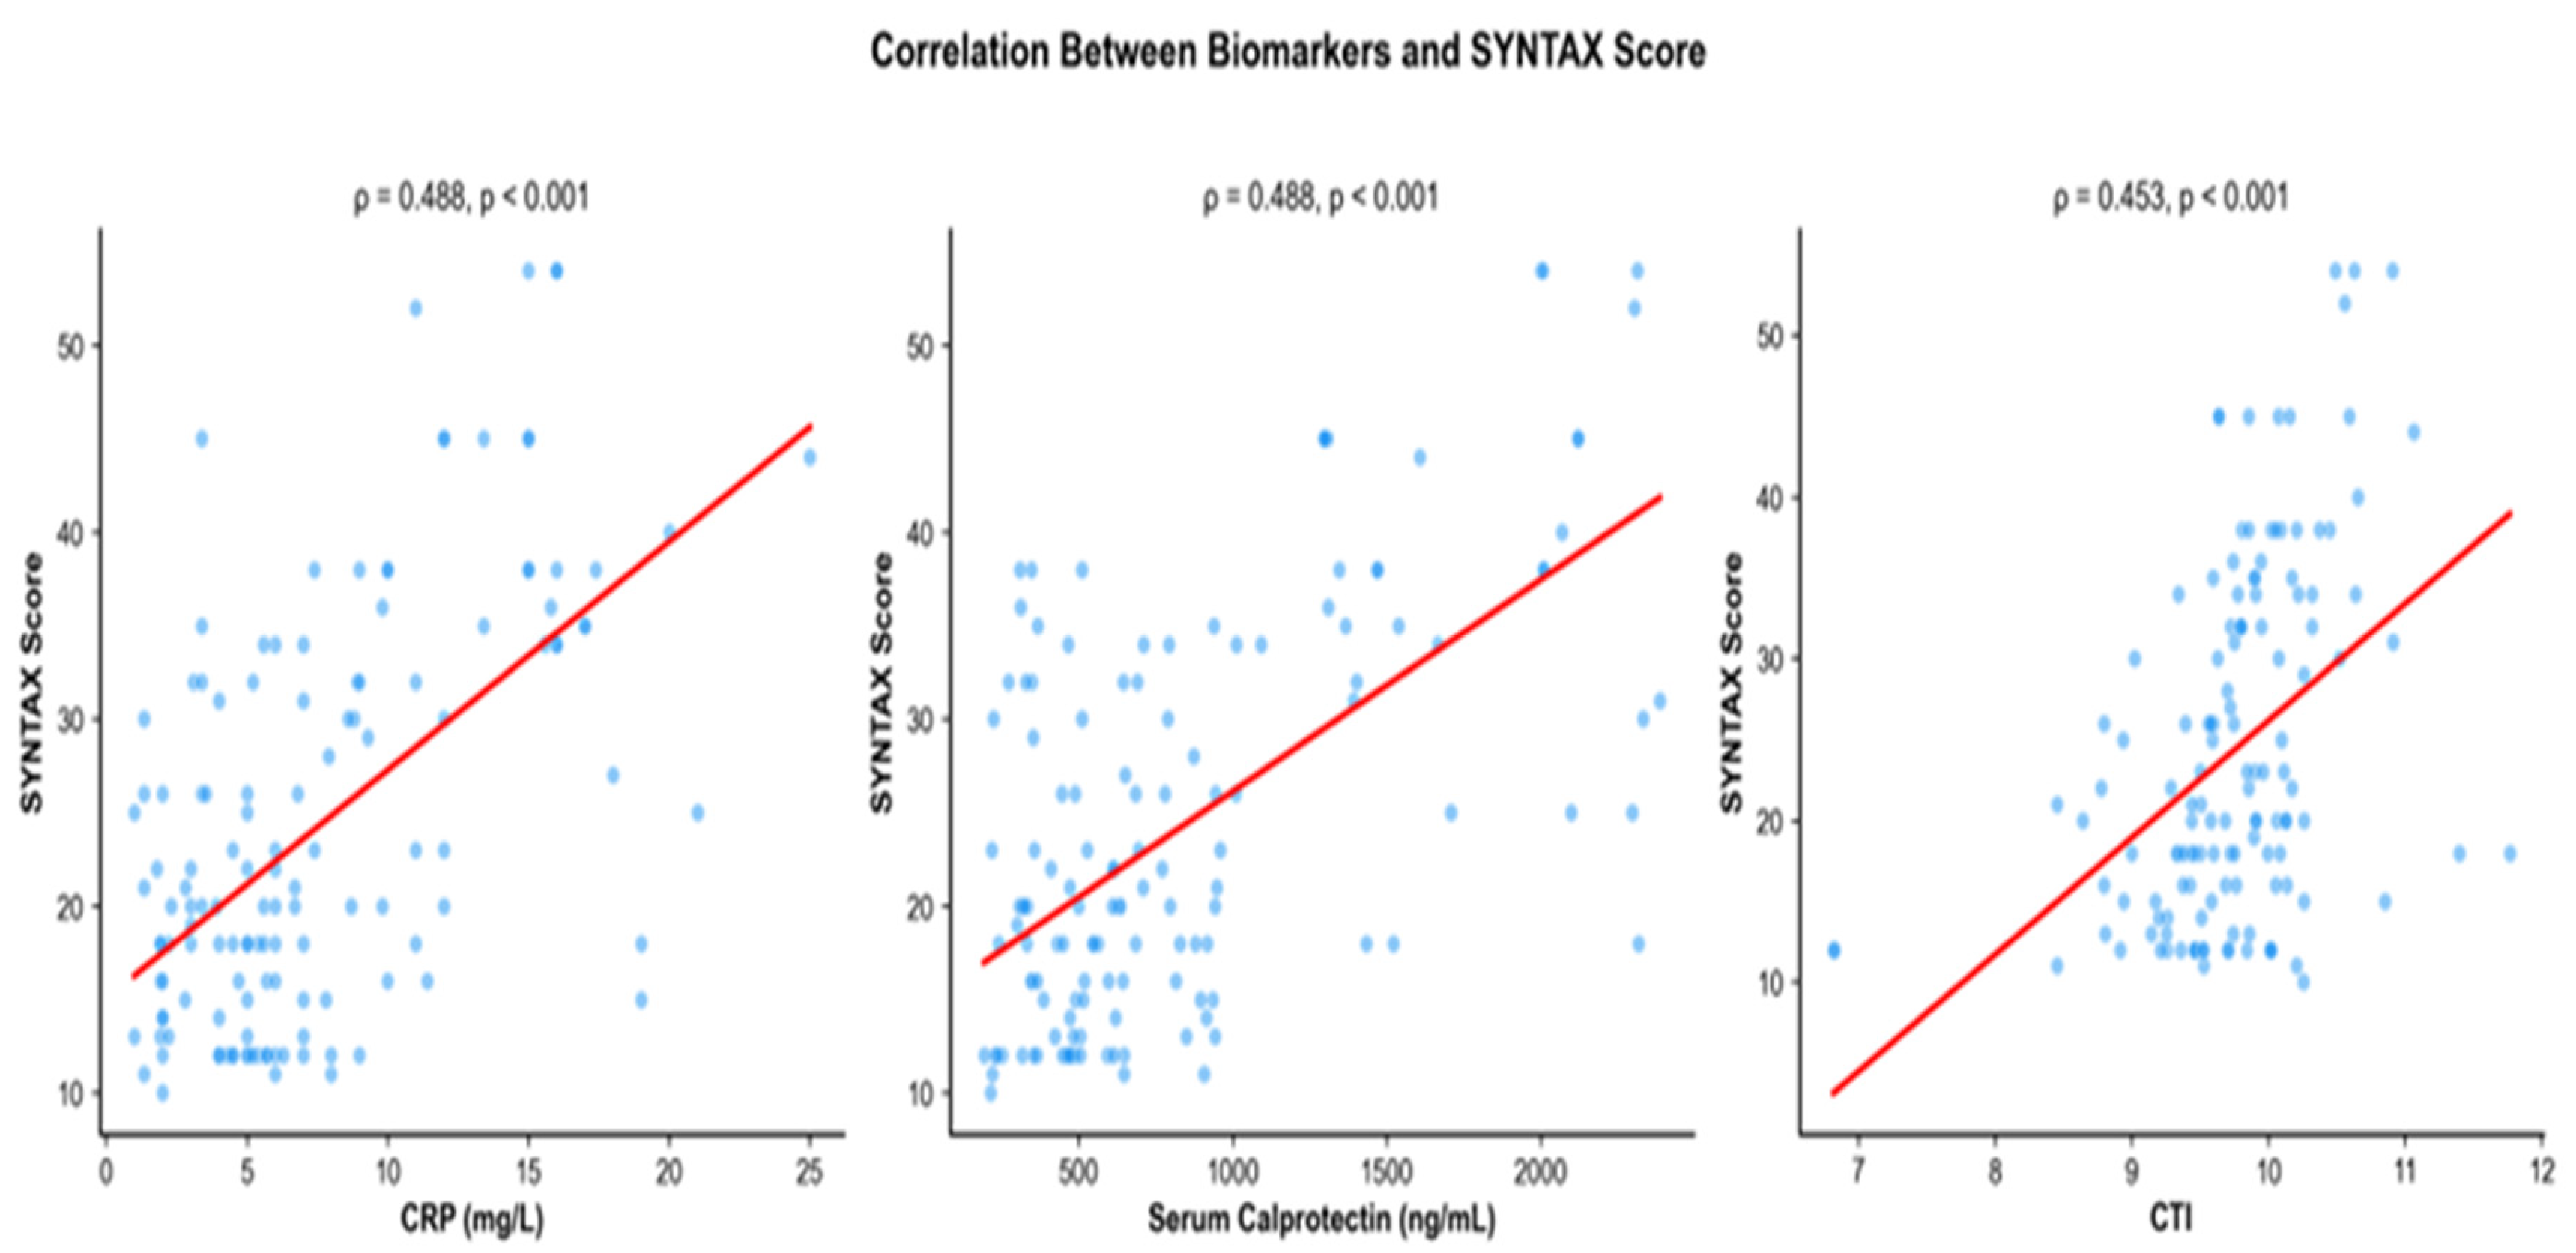
Figure 1. Scatter plots showing the correlation between CRP, serum calprotectin, CTI and SYNTAX score. ρ, Spearman rank correlation coefficient. The red line represents the linear regression fit.
Preprints 203686 g001
Figure 2. Box plots comparing CRP, serum calprotectin, and CTI between low SYNTAX score (<23) and intermediate–high SYNTAX score (≥23) groups. The central line represents the median; the box represents the interquartile range. P-values from Mann–Whitney U test.
Preprints 203686 g002
Figure 3. Receiver operating characteristic (ROC) curves comparing the diagnostic performance of CRP, serum calprotectin, and CTI for predicting intermediate–high SYNTAX score (>23). AUC, area under the curve; CI, confidence interval.
Preprints 203686 g003
Table 1. Baseline demographic and clinical characteristics of patients according to SYNTAX score category.
Variable Low SS (<23)
(n = 73)
Intermediate–High SS (≥23)
(n = 61)
p-value
Age (years) 60 (55–67) 65 (57–67) 0.076
Body Mass Index (kg/m2) 24.5 (23.5–26.5) 24.1 (23.4–25.8) 0.252
Systolic BP (mmHg) 130 (130–140) 135.0 (127.5–140.0) 0.286
Diastolic BP (mmHg) 80 (78–80) 80 (75–80) 0.960
Heart Rate (bpm) 78 (76–80) 78 (75–80) 0.454
Fasting Glucose (mg/dL) 100 (90–132) 98 (90–123) 0.321
BUN (mg/dL) 25 (23–30) 25 (21–28) 0.278
Creatinine (mg/dL) 0.9 (0.8–1.0) 0.8 (0.8–0.9) 0.286
Total Cholesterol (mg/dL) 213 (191–234) 219 (209–234) 0.177
Triglycerides (mg/dL) 145 (114–183) 166 (140–193) 0.053
HDL-C (mg/dL) 40 (37–45) 40 (34–41) 0.273
LDL-C (mg/dL) 124 (110–145) 132 (118–145) 0.161
AST (U/L) 18 (14–20) 18 (11–21) 0.547
ALT (U/L) 22 (18–26) 21 (18–25) 0.885
CRP (mg/L) 5.0 (3.0–6.3) 9.8 (5.6–15.0) <0.001
WBC (×103/µL) 7.8 (7.0–8.9) 7.8 (6.7–8.9) 0.845
Hemoglobin (g/dL) 14.4 (13.3–15.3) 14.6 (13.8–15.8) 0.505
Platelet (×103/µL) 250 (201–275) 250 (172–276) 0.591
Serum Calprotectin (ng/mL) 505.7 (365.1–684.9) 1009.5 (511.6–1607.6) <0.001
CTI 9.5 (9.3–9.9) 9.9 (9.7–10.2) <0.001
LVEF (%) 52 (50–54) 53 (52–54) 0.431
Gender 0.773
Male, n (%) 51 (69.9) 44 (72.1)
Female, n (%) 22 (30.1) 17 (27.9)
Smoking Status 0.494
Non-smoker, n (%) 40 (54.8) 37 (60.7)
Smoker, n (%) 33 (45.2) 24 (39.3)
Dyslipidemia 0.938
Absent, n (%) 34 (46.6) 28 (45.9)
Present, n (%) 39 (53.4) 33 (54.1)
Diabetes Mellitus 0.887
Absent, n (%) 35 (47.9) 30 (49.2)
Present, n (%) 38 (52.1) 31 (50.8)
Hypertension 0.213
Absent, n (%) 34 (46.6) 35 (57.4)
Present, n (%) 39 (53.4) 26 (42.6)
Data are presented as median (interquartile range) for continuous variables and n (%) for categorical variables. P-values from Mann–Whitney U test for continuous variables and chi-square test for categorical variables. Bold p-values indicate statistical significance (p < 0.05). SS, SYNTAX score; BP, blood pressure; BUN, blood urea nitrogen; HDL-C, high-density lipoprotein cholesterol; LDL-C, low-density lipoprotein cholesterol; AST, aspartate aminotransferase; ALT, alanine aminotransferase; CRP, C-reactive protein; WBC, white blood cell; CTI, CRP–triglyceride–glucose index; LVEF, left ventricular ejection fraction.
Table 2. Correlation coefficients between clinical variables and SYNTAX score.
Variable Spearman ρ Kendall τ-b p-value
CRP (mg/L) 0.488 0.341 <0.001
Serum Calprotectin (ng/mL) 0.488 0.353 <0.001
CTI 0.453 0.326 <0.001
Triglycerides (mg/dL) 0.168 0.053
Body Mass Index (kg/m2) -0.139 0.110
Total Cholesterol (mg/dL) 0.130 0.133
Hemoglobin (g/dL) 0.121 0.169
LDL-C (mg/dL) 0.103 0.238
HDL-C (mg/dL) -0.090 0.303
Age (years) 0.085 0.327
AST (U/L) -0.083 0.339
WBC (×103/µL) -0.083 0.347
Heart Rate (bpm) 0.078 0.372
Systolic BP (mmHg) 0.073 0.401
BUN (mg/dL) -0.073 0.405
ALT (U/L) -0.062 0.474
Creatinine (mg/dL) -0.055 0.530
LVEF (%) 0.046 0.596
Platelet (×103/µL) 0.030 0.737
Diastolic BP (mmHg) 0.021 0.809
Fasting Glucose (mg/dL) -0.019 0.826
ρ, Spearman rank correlation coefficient; τ-b, Kendall’s tau-b rank correlation coefficient. Kendall’s tau-b values are presented for the three key biomarkers as a complementary analysis given the substantial number of tied ranks in CRP values (56 unique values among 134 observations). p-values correspond to the Spearman correlation. Bold p-values indicate statistical significance (p < 0.05). CRP and serum calprotectin yielded nearly identical Spearman coefficients at three decimal places; at five decimal precision: CRP ρ = 0.48834, serum calprotectin ρ = 0.48831. CRP, C-reactive protein; CTI, CRP–triglyceride–glucose index.
Table 3. a. Receiver operating characteristic curve analysis for predicting intermediate–high SYNTAX score. b. Pairwise comparison of ROC curves using the Hanley–McNeil method.
Variable AUC (95% CI) p-value Cut-off Sensitivity (%) Specificity (%) Youden Index
CRP 0.764 (0.682–0.846) <0.001 7.40 65.6 83.6 0.491
Serum Calprotectin 0.739 (0.653–0.825) <0.001 944.28 54.1 94.5 0.486
CTI 0.722 (0.635–0.810) <0.001 9.56 90.2 52.1 0.422
Comparison ΔAUC z-statistic p-value
CRP vs Serum Calprotectin 0.025 0.480 0.631
CRP vs CTI 0.042 0.802 0.422
Serum Calprotectin vs CTI 0.017 0.298 0.766
AUC, area under the curve; CI, confidence interval. Optimal cut-off values determined by the Youden index. P-values represent comparison against the null hypothesis (AUC = 0.5) using the Hanley–McNeil method. CRP, C-reactive protein; CTI, CRP–triglyceride–glucose index. ΔAUC, difference in area under the curve. P-values from Hanley–McNeil method for comparing correlated ROC curves.
Table 4. Univariable and multivariable logistic regression analysis for predicting intermediate–high SYNTAX score.
Biomarker Unadjusted OR (95% CI) p-value Adjusted OR* (95% CI) p-value
CRP (per 1 mg/L) 1.27 (1.15–1.40) <0.001 1.27 (1.15–1.41) <0.001
Serum Calprotectin (per 100 ng/mL) 1.24 (1.13–1.35) <0.001 1.24 (1.13–1.36) <0.001
CTI (per 1 unit) 3.82 (1.79–8.16) <0.001 4.66 (2.00–10.84) <0.001
OR, odds ratio; CI, confidence interval. Odds ratios represent the risk per unit increase in each biomarker. Serum calprotectin OR is expressed per 100 ng/mL increase. *Adjusted for age, sex, diabetes mellitus, hypertension, and smoking status. CRP, C-reactive protein; CTI, CRP–triglyceride–glucose index.
Disclaimer/Publisher’s Note: The statements, opinions and data contained in all publications are solely those of the individual author(s) and contributor(s) and not of MDPI and/or the editor(s). MDPI and/or the editor(s) disclaim responsibility for any injury to people or property resulting from any ideas, methods, instructions or products referred to in the content.
Copyright: This open access article is published under a Creative Commons CC BY 4.0 license, which permit the free download, distribution, and reuse, provided that the author and preprint are cited in any reuse.