

Submitted:
17 March 2026
Posted:
18 March 2026
You are already at the latest version
Abstract
The Florida Keys National Marine Sanctuary (FKNMS) is monitored by an extensive but fragmented constellation of remote sensing and in-situ observation platforms: Sentinel-2 and Landsat multispectral satellite imagery, NOAA Coral Reef Watch satellite-derived thermal products, autonomous underwater vehicle photography, passive acoustic hydrophone arrays, vessel-tracking AIS transponders, and multi-agency water-quality sensor networks—collectively covering 2,900 square nautical miles of reef, seagrass, and mangrove habitat supporting more than 6,000 species. These data streams operate in silos, producing isolated assessments that cannot support the integrated, time-sensitive management decisions the sanctuary requires. Meanwhile, the sanctuary’s static zone boundaries, designed from 1990s-era reef assessments, now protect degraded substrate in some areas while leaving climate-resilient coral assemblages unprotected in others. We propose an energy-aware, tiered AI architecture that fuses these multi-source remote sensing and in-situ data streams into a digital twin of the FKNMS ecosystem. The architecture assigns remote sensing analytics tasks across three computational tiers—classical machine learning for structured sensor and satellite-derived indices, deep learning for unstructured imagery and acoustic spectrograms, and foundation models for cross-modal reasoning and multi-agency report synthesis—reserving the most energy-intensive techniques for tasks where they are irreplaceable. A reinforcement learning agent operates on the fused remote sensing state representation to recommend real-time adjustments to sanctuary zone boundaries, optimizing for coral recovery, sustainable fish stocks, and biodiversity under socioeconomic constraints. We ground each architectural component in existing, publicly available remote sensing infrastructure and demonstrate the framework through three prescriptive scenarios: satellite-triggered bleaching early warning with adaptive closures, remote-sensing-informed lionfish invasion management, and climate-adaptive rezoning driven by multi-temporal imagery analysis. The architecture directly addresses the energy-conservation paradox—the risk that computationally expensive remote sensing analytics intended to protect the environment may themselves cause environmental harm—by formalizing energy cost as a first-class constraint in model selection. This work complements a companion paper applying the same tiered architecture to the Greater Yellowstone Ecosystem, demonstrating extensibility across terrestrial and marine remote sensing domains.
Keywords:
remote sensing
; data fusion
; digital twin
; marine conservation
; Sentinel-2
; coral reef
; reinforcement learning
; dynamic zoning
; energy-conscious AI
; benthic habitat mapping
; Florida Keys
; marine protected area
1. Introduction
The Florida Keys National Marine Sanctuary is among the most intensively monitored marine environments in the world—and among the most poorly integrated. Satellite remote sensing platforms (Sentinel-2, Sentinel-3, Landsat), NOAA Coral Reef Watch thermal products, autonomous underwater vehicle imagery, passive acoustic hydrophone arrays, real-time buoy sensor networks, vessel AIS transponders, and multi-agency water quality monitoring programs collectively generate terabytes of observational data across the sanctuary’s 2,900 square nautical miles each year. Yet these data streams feed into separate analytical pipelines maintained by different agencies, producing isolated snapshots of an ecosystem that functions as a single interconnected system.
The sanctuary protects a system of extraordinary ecological and economic value. Its coral barrier reef—the only one in the continental United States—stretches alongside the largest documented contiguous seagrass community in the Northern Hemisphere. More than 6,000 animal species depend on this interconnected web of reefs, seagrass, mangrove, and hard-bottom habitats [1]. The sanctuary generates billions in annual economic activity through tourism, recreational fishing, and commercial fisheries, supporting the livelihoods of the island chain’s 80,000 permanent residents and the millions who visit each year [2].
This system is in crisis. The 2023 marine heat wave pushed sea surface temperatures in shallow Keys waters past 100F, triggering the most severe mass coral bleaching event ever recorded on the Florida reef tract [3]. Invasive lionfish continue to spread, consuming juvenile grouper and snapper at rates that threaten both ecosystem equilibrium and the viability of the commercial fishery [4]. Nutrient loading from development, aging wastewater infrastructure, and upstream Everglades hydrology fuels algal blooms that smother corals and degrade seagrass [5]. These stressors do not act in isolation. They compound one another in ways that current management systems struggle to track, let alone anticipate.
The sanctuary’s primary management tool is spatial zoning: Sanctuary Preservation Areas, Ecological Reserves, Wildlife Management Areas, and Special-use Areas that regulate fishing, diving, anchoring, and vessel transit across the sanctuary’s 2,900 square nautical miles [6]. The current zone boundaries were designed in the 1990s based on ecological assessments and were last substantially updated through the Restoration Blueprint process. They reflect a snapshot of an ecosystem that no longer exists. Coral communities have shifted. Bleaching events strike different sites with different severity. Lionfish invasion fronts advance and retreat. Seagrass beds expand and contract with water quality cycles. The resilient reef sites of 1997 may now be rubble, while unprotected areas may harbor the genotypes most likely to survive the next thermal event.
We term this the static-dynamic management paradox: the zones are fixed, but everything they are meant to protect is moving. This paradox is not unique to the Florida Keys, but the Keys present it in an especially acute form because of the sanctuary’s multi-agency governance structure, the diversity of its data streams, and the speed at which its ecosystem is changing under climate stress.
This paper proposes a solution grounded in a tiered, energy-aware AI architecture that fuses the sanctuary’s fragmented remote sensing and in-situ data streams into a digital twin of the FKNMS ecosystem. The digital twin integrates data from satellite remote sensing (Sentinel-2 multispectral imagery at 10-meter resolution, Sentinel-3 ocean color at 300-meter resolution, Landsat 30-meter composites, NOAA Coral Reef Watch satellite-derived thermal products), underwater imagery (AUV and diver structure-from-motion surveys), passive acoustic monitoring (SanctSound hydrophone arrays), in-situ water quality sensor networks (FIU’s 340-station monitoring program and real-time buoys), and vessel tracking systems (AIS transponders) into a continuously updated model of ecosystem state. A reinforcement learning agent operates on this fused remote sensing state representation to evaluate the effectiveness of current zone boundaries and recommend adaptive adjustments—such as temporary closures, seasonal restrictions, boundary shifts, and resource reallocations for restoration—that optimize conservation outcomes under socioeconomic constraints.
A companion paper [7] applies the same architectural framework to the Greater Yellowstone Ecosystem, where the challenge is trophic cascade modeling and prescriptive wildlife management interventions. The present work differs in three respects. First, the remote sensing modalities are fundamentally different: satellite multispectral imagery of submerged habitats (requiring water column correction and depth-invariant index computation), passive underwater acoustics, AUV-acquired benthic photography, and vessel AIS tracking replace the camera-trap, GPS-collar, and aerial survey data of the terrestrial case, testing the architecture’s generalizability across remote sensing domains. Second, the management mechanism is spatial zone optimization rather than species-level intervention, shifting the AI emphasis from predictive modeling toward multi-objective reinforcement learning operating on a fused remote sensing state representation. Third, the paper formalizes what we term the static-dynamic management paradox, complementing the energy-conservation paradox formalized in the companion work.
The contributions of this paper are fourfold in nature:
- We present a comprehensive architecture for fusing multi-source marine remote sensing data—satellite multispectral imagery, satellite-derived thermal products, AUV photography, passive acoustic recordings, in-situ sensor networks, and vessel tracking data—into a coherent digital twin state representation suitable for automated management decision support.
- We formalize the static-dynamic management paradox in marine protected areas and propose remote-sensing-driven dynamic zoning as a resolution.
- We demonstrate that the tiered, energy-aware architecture introduced in the companion paper [7] generalizes from terrestrial to marine remote sensing domains, across fundamentally different data modalities and management mechanisms.
- We ground every component of the proposed architecture in existing, publicly available remote sensing and monitoring infrastructure, establishing feasibility without requiring new satellite deployments, novel sensor networks, or additional monitoring programs.
The remainder of this paper is organized as follows. Section 2 reviews related work in remote sensing for marine conservation and AI-driven marine ecosystem monitoring. Section 3 describes the FKNMS ecosystem, its multi-source remote sensing infrastructure, and its management challenges in detail. Section 4 presents the energy-aware tiered architecture and the energy-conservation paradox in the marine remote sensing domain. Section 5 details the three computational tiers, grounding each component in existing remote sensing data sources and validated methods. Section 6 describes the reinforcement learning formulation for dynamic zone optimization operating on the fused remote sensing state representation. Section 7 presents three prescriptive scenarios that show the framework in operation. Section 8 discusses limitations, ethical aspects, and implementation pathways. Section 9 concludes with future research directions.
2. Related Work
2.1. Remote Sensing and AI for Marine Ecosystem Monitoring
The application of remote sensing and artificial intelligence to marine ecosystem monitoring has expanded rapidly over the past decade. Satellite-based benthic habitat mapping using Sentinel-2 multispectral data and machine learning classifiers is now well established, with workflows combining the platform’s 10-meter spatial resolution, 5-day revisit cycle, and 13 spectral bands with support vector machines achieving classification accuracies exceeding 80% for coral, seagrass, and hard-bottom substrate discrimination [8]. These satellite-derived habitat maps provide the spatial foundation for marine protected area management but are typically produced as static snapshots rather than continuously updated inputs to decision systems. Underwater image analysis using convolutional neural networks has advanced coral health assessment, enabling automatic detection of bleaching, disease, and algal overgrowth from diver and AUV imagery [9]. Passive acoustic monitoring, or soundscape ecology, has emerged as a complementary remote sensing modality; hydrophone recordings register and detect species-specific vocalizations, spawning events, and anthropogenic noise levels, providing continuous indicators of biodiversity without physical disturbance to the reef [10].
Species distribution simulation for invasive species management has produced validated tools for lionfish in the western Atlantic. The U.S. Geological Survey has applied correlative species distribution models (MaxEnt) and cellular automata simulations using publicly available oceanographic parameters to predict lionfish habitat suitability and invasion trajectories [11]. Length-based, age-structured population models have characterized lionfish demographics in Florida waters [12], and removal effort modeling has established the thresholds (27–65% annual adult removal) required to suppress lionfish populations [13].
2.2. Digital Twins in Environmental Management
The digital twin concept—a continuously updated virtual replica of a physical system—has been applied to ocean monitoring in several contexts. Operational oceanographic forecasting systems like HYCOM and the Copernicus Marine Service maintain global digital twins of ocean physics. However, these systems model oceanographic variables (temperature, salinity, currents) without coupling them to the ecological state. Ecological digital twins that integrate biological monitoring data with physical models remain largely conceptual in the marine domain [14]. The European Digital Twin of the Ocean initiative constitutes the most ambitious effort to date, but its scope is continental rather than site-specific, and it does not incorporate the prescriptive management layer that distinguishes the present work.
2.3. Reinforcement Learning for Conservation Decision-Making
Reinforcement Learning (RL) has seen limited but growing applications in conservation. RL agents have been applied to anti-poaching patrol optimization [15], adaptive fishery management [16], and wildfire suppression resource allocation [17]. In the marine domain, RL has been proposed for marine protected area design as a spatial optimization problem [18], but existing formulations treat zone boundaries as one-time design decisions rather than continuously adaptive management instruments. To our knowledge, no prior work formulates dynamic marine zoning as a continuous RL problem in which the agent receives real-time ecosystem state from a digital twin and recommends boundary adjustments on an ongoing basis.
2.4. The Energy-Conservation Paradox in Marine Remote Sensing
The energy cost of AI systems deployed for remote sensing-based conservation has received limited attention in marine literature. Foundation models used for report synthesis, satellite image classification, and scenario generation carry substantial training and inference energy footprints [19]. In a marine sanctuary context, where the explicit mission is environmental protection, the paradox is acute: the AI system processing satellite imagery and acoustic data consumes energy and produces emissions to protect the ecosystem from the effects of energy consumption and emissions. The companion paper [7] formalizes this paradox through a net conservation impact metric () and proposes the tiered architecture as a resolution. The present work extends that formalization to marine remote sensing analytics, where the data modalities differ, but the paradox remains the same.
2.5. Gaps Addressed by This Work
Our review of the literature reveals three gaps. First, existing marine remote sensing applications operate in isolated analytical silos—satellite-based reef classification here, AUV imagery analysis there, acoustic biodiversity assessment elsewhere—with no integrating framework that fuses these heterogeneous remote sensing modalities into a coherent ecosystem state representation. Second, no prior work proposes dynamic marine zoning driven by continuous multi-source remote sensing assessment; spatial management is still a periodic, plan-based process disconnected from the temporal resolution that modern remote sensing platforms already provide. Third, the energy cost of marine remote sensing analytics is not formally incorporated into architectural decisions, despite the substantial computational demands of processing satellite imagery time series, deep learning inference on underwater photography, and acoustic spectrogram analysis. This paper handles all three gaps through the tiered digital twin architecture.
3. The Florida Keys National Marine Sanctuary: Ecosystem, Remote Sensing Infrastructure, and Management
3.1. Ecosystem Overview
The FKNMS protects approximately 2,900 square nautical miles of coastal and ocean waters surrounding the Florida Keys island chain, encompassing more than 1,700 islands and extending into the Atlantic Ocean, Florida Bay, and the Gulf of Mexico [1]. The sanctuary is jointly managed by NOAA and the State of Florida under a co-trustee agreement, with the Florida Fish and Wildlife Conservation Commission enforcing sanctuary regulations [6].
The ecosystem comprises several interconnected habitats. The coral barrier reef—the third largest in the world—runs parallel to the island chain along the Atlantic side. Behind the reef, extensive hard-bottom and patch-reef communities support diverse fish assemblages. The backcountry waters of Florida Bay and the Gulf side harbor the largest documented contiguous seagrass community in the Northern Hemisphere, which serves as a critical nursery habitat for commercially important species and a feeding ground for sea turtles and manatees [20]. Mangrove shorelines provide additional nursery habitat and buffer the transition between terrestrial and marine environments.
3.2. Converging Threats
The sanctuary faces five major threat classes that interact in non-linear ways.
Thermal stress and coral bleaching have increased dramatically. Three large-scale, long-term regional monitoring programs conducted annually or biannually across the Florida reef tract document a decades-long decline in coral cover, punctuated by acute bleaching events [3]. The 2023 heat wave represented an unprecedented thermal anomaly that exceeded all historical records for the region.
Invasive lionfish have established self-sustaining populations throughout the sanctuary. A female lionfish can produce 30,000 to 40,000 eggs every few days and reaches sexual maturity within one year [4]. Lionfish prey on juvenile commercially important species, including grouper and snapper, and on parrotfish that control algal overgrowth on coral substrates. The ecological cascade—lionfish reduce parrotfish, algae overtake stressed corals, reef structure degrades, fish habitat declines—connects the invasion directly to reef collapse.
Water quality degradation from nutrient loading, aging wastewater infrastructure, and upstream hydrological changes in the Everglades system introduces nitrogen and phosphorus that fuel algal blooms, reduce water clarity, and directly impair coral growth and reproduction [5].
Tourism pressure from millions of annual visitors produces cumulative mechanical stress through boat groundings (more than 300 reported annually, with nearly 80% impacting seagrass habitat [20]), anchor damage, diver contact with corals, and marine debris.
Climate change compounds all the above through sea-level rise, ocean acidification, intensifying hurricanes, and shifting current patterns.
3.3. Existing Remote Sensing and Monitoring Infrastructure
A critical premise of this paper is that the remote sensing and monitoring infrastructure required for the proposed architecture already exists. We do not propose launching new satellites, deploying novel sensor networks, or building new monitoring programs. Instead, we propose fusing existing remote sensing data streams that currently operate in analytical silos into a coherent digital twin state representation.
Satellite remote sensing. The ESA Copernicus program provides freely available Sentinel-2 multispectral imagery at 10-meter resolution with a 5-day global revisit cycle, and Sentinel-3 ocean color products at 300-meter resolution [21]. NASA’s Landsat program provides complementary 30-meter multispectral imagery. Both archives are accessible through Google Earth Engine for cloud-based processing. NOAA Coral Reef Watch provides satellite-derived sea surface temperature, bleaching alert areas, and degree heating week products at reef-scale resolution [22]. These data streams are established, publicly funded, and freely accessible.
In-situ water quality monitoring. Florida International University’s Southeast Environmental Research Center operates a network of 340 fixed sampling sites distributed throughout South Florida’s coastal ecosystems, measuring nutrients, chlorophyll-a, turbidity, dissolved oxygen, and additional parameters on a quarterly (FKNMS) to monthly (Florida Bay) basis [23]. Four real-time water quality monitoring buoys deployed at Fowey Rocks, Molasses Reef, Sombrero Key, and Sand Key transmit continuous temperature, turbidity, pH, dissolved oxygen, conductivity, and depth data [24].
Real-time meteorological and oceanographic data. NOAA’s Mission: Iconic Reefs has deployed smart buoys at each of its seven restoration sites, transmitting real-time wind speed, ocean temperature, and other conditions via a publicly accessible web interface [25]. The NOAA National Data Buoy Center operates multiple C-MAN stations throughout the Keys (Sombrero Key, Long Key, Key West), and the CO-OPS Data Retrieval API provides programmatic access to wind, temperature, water level, and tidal current data [26].
Underwater imagery. NOAA’s National Centers for Coastal Ocean Science operates micro-sized Autonomous Underwater Vehicles (AUVs) that collect high-resolution seabed imagery at Mission: Iconic Reefs restoration sites, covering football-field-sized areas in approximately 30 minutes [27]. The U.S. Geological Survey has published nearly 40,000 diver-based structure-from-motion images from coral restoration surveys in the Lower Florida Keys [28]. Historical photographic records from USGS document reef change at Carysfort Reef and Grecian Rocks from 1959 to 2015 [29].
Passive acoustic monitoring. NOAA and the U.S. Navy operate the Sanctuary Soundscape Monitoring Project (SanctSound) with four standardized hydrophone sites within the FKNMS—Western Dry Rocks, Eastern Sambo, 9 Ft. Stake/Eyeglass Bar, and Sombrero Reef—continuously recording since 2018 [30]. NOAA is already testing AI and machine learning technologies to detect changes in ecosystem health from these acoustic data [31].
Seagrass monitoring. FIU’s Seagrass Monitoring Project maintains a multi-tiered sampling program: Level 1 stations sampled quarterly for seagrass abundance, demographics, productivity, and nutrient availability; Level 2 and Level 3 stations sampled annually at randomly selected locations across the sanctuary [32]. Satellite-derived seagrass mapping using Sentinel-2 and Landsat with machine learning classifiers has been validated in Florida waters with classification accuracies exceeding 79% [33].
Lionfish and reef fish tracking. The USGS Nonindigenous Aquatic Species database tracks lionfish distribution [11]. The Reef Environmental Education Foundation (REEF) maintains sighting databases and coordinates removal derbies throughout the Keys [34]. The Florida Fish and Wildlife Conservation Commission operates acoustic telemetry arrays with over 170 receivers stretching from Key Largo to Dry Tortugas National Park, tracking the movement ecology of snappers, groupers, lionfish, hogfish, and other reef species [35].
Vessel traffic data. Automatic Identification System (AIS) data provide vessel traffic patterns throughout the sanctuary, and high-resolution satellite imagery has been correlated with hydrophone recordings to quantify recreational vessel impact on reef soundscapes [30].
3.4. Multi-Agency Governance Complexity
The FKNMS is managed through a complex multi-agency governance structure that includes NOAA’s Office of National Marine Sanctuaries, the Florida Department of Environmental Protection, the Florida Fish and Wildlife Conservation Commission, the South Atlantic Fishery Management Council, the Gulf of Mexico Fishery Management Council, Monroe County government, the U.S. Environmental Protection Agency, the tourism industry, commercial and recreational fishing organizations, dive operators, and environmental NGOs [6]. Each agency maintains its own data systems, operates under its own mandates, and produces reports in its own formats. This institutional fragmentation is itself a major barrier to integrated ecosystem management and a key challenge that the digital twin architecture must address.
4. Energy-Conscious Tiered Architecture
4.1. The Energy-Conservation Paradox in Marine Remote Sensing Analytics
The energy-conservation paradox, formalized in the companion paper [7], states that AI systems deployed for environmental protection may carry an energy footprint that partially or fully offsets their conservation benefits. The paradox is measured by the net conservation impact metric:
where:
- Inet is the net conservation impact of the AI system,
- Bcons is the measurable conservation benefit attributable to the AI system’s recommendations (e.g., hectares of coral protected, species recovery index improvement, avoided bleaching mortality),
- EAI is the total energy consumed by the AI system (training + inference, measured in kWh), and
- α is a conversion factor translating energy consumption into environmental impact units (e.g., CO2 equivalent emissions per kWh, scaled to habitat degradation equivalents).
For to be positive—that is, for the AI system to yield a genuine conservation benefit—the conservation gains must exceed the environmental costs of the computation itself.

Table 1.
presents published energy consumption estimates for representative AI techniques spanning three computational tiers, illustrating the orders-of-magnitude differences that motivate the tiered architecture. Estimates are based on published benchmarks [19].
Table 1.
presents published energy consumption estimates for representative AI techniques spanning three computational tiers, illustrating the orders-of-magnitude differences that motivate the tiered architecture. Estimates are based on published benchmarks [19].
| AI Technique | Energy per Inference | Training Energy |
|---|---|---|
| Random Forest / GBDT | ~10⁻⁵ kWh | ~10⁻¹ kWh |
| ARIMA / Prophet | ~10⁻⁵ kWh | ~10⁻² kWh |
| SVM (seagrass classifier) | ~10⁻⁵ kWh | ~10⁻¹ kWh |
| MaxEnt (species distribution) | ~10⁻⁵ kWh | ~10⁻¹ kWh |
| CNN (ResNet / EfficientNet) | ~10⁻⁴ kWh | ~10¹ kWh |
| RNN / spectrogram CNN | ~10⁻⁴ kWh | ~10¹ kWh |
| U-Net (satellite anomaly) | ~10⁻⁴ kWh | ~10¹ kWh |
| Deep RL (PPO / MuZero) | ~10⁻³ kWh | ~10² kWh |
| LLM (GPT-4 class) | ~10⁻² kWh | ~10⁶ kWh |
| Multimodal FM | ~10⁻² kWh | ~10⁶ kWh |
In the marine remote sensing domain, this paradox takes a specific form. A foundation model tasked with synthesizing multi-agency reports on coral health may consume energy equivalent to several transatlantic flights during training [19]. If its output results in a zone boundary adjustment that protects 500 hectares of resilient coral from bleaching-related mortality, the conservation benefit is likely to far exceed the energy cost. However, if the same synthesis task could have been accomplished using a keyword extraction pipeline based on standard methods, the foundation model’s deployment would represent an unnecessary environmental cost. Similarly, processing every Sentinel-2 revisit through a computationally expensive deep learning segmentation model when a classical spectral index achieves adequate accuracy for seagrass extent tracking wastes energy without improving management outcomes. The tiered architecture solves this by assigning each remote sensing analytics task to the lowest-energy tier that meets the performance requirement.
Definition 1 (Energy-Aware Conservation AI). An AI system for conservation is energy-aware if, for each conservation task , it selects the AI technique that minimizes subject to the constraint that , where is the minimum acceptable conservation benefit for task .
4.2. Three-Tier Architecture
The architecture assigns conservation analytics tasks to three computational tiers based on task complexity, data modality, and energy cost. This structure follows the tiered design introduced in the companion paper [7], adapted here for marine data modalities and spatial management objectives.
Tier 1: Classical Machine Learning. This tier handles tasks that operate on structured, tabular, or low-dimensional data derived from remote sensing platforms and sensor networks: time-series forecasting from satellite-derived thermal indices and buoy sensors, species distribution prediction modeling from oceanographic parameters, and regression-based predictions from historical monitoring records. Algorithms include gradient-boosted decision trees, random forests, support vector machines, ARIMA, and logistic regression. Energy cost per inference is minimal—typically measured in milliwatt-hours. This tier processes satellite-derived spectral indices (NDVI, SSII, degree heating weeks), water quality sensor data, buoy network telemetry, fishery catch records, and visitor statistics.
Tier 2: Deep Learning. This tier handles tasks that require pattern recognition in high-dimensional, unstructured remote sensing data: benthic habitat classification from AUV and diver underwater photography, spectrogram analysis from passive acoustic hydrophone recordings, and anomaly detection in multi-temporal Sentinel-2 and Sentinel-3 satellite imagery composites. Algorithms include convolutional neural networks, recurrent networks, autoencoders, and—critically—the reinforcement learning agent for dynamic zone optimization that operates on the fused remote sensing state vector. Energy cost per inference is moderate, typically measured in watt-hours, with higher one-time training costs. This tier is justified when classic ML methods cannot extract the relevant signal from the remote sensing data’s spatial, spectral, or temporal complexity.
Tier 3: Foundation Models. This tier handles tasks that require reasoning across heterogeneous remote sensing and non-remote-sensing data types, natural language understanding, or generative synthesis: multi-agency report integration, cross-modal anomaly reasoning (correlating satellite, acoustic, and in-situ sensor alerts), scenario narrative generation for the stakeholders, and international science synthesis. Energy cost is the highest of the three tiers, both for training and inference. Foundation models are deployed only for tasks where their capabilities—multi-modal reasoning across disparate remote sensing modalities, zero-shot generalization, natural language interaction—are irreplaceable.
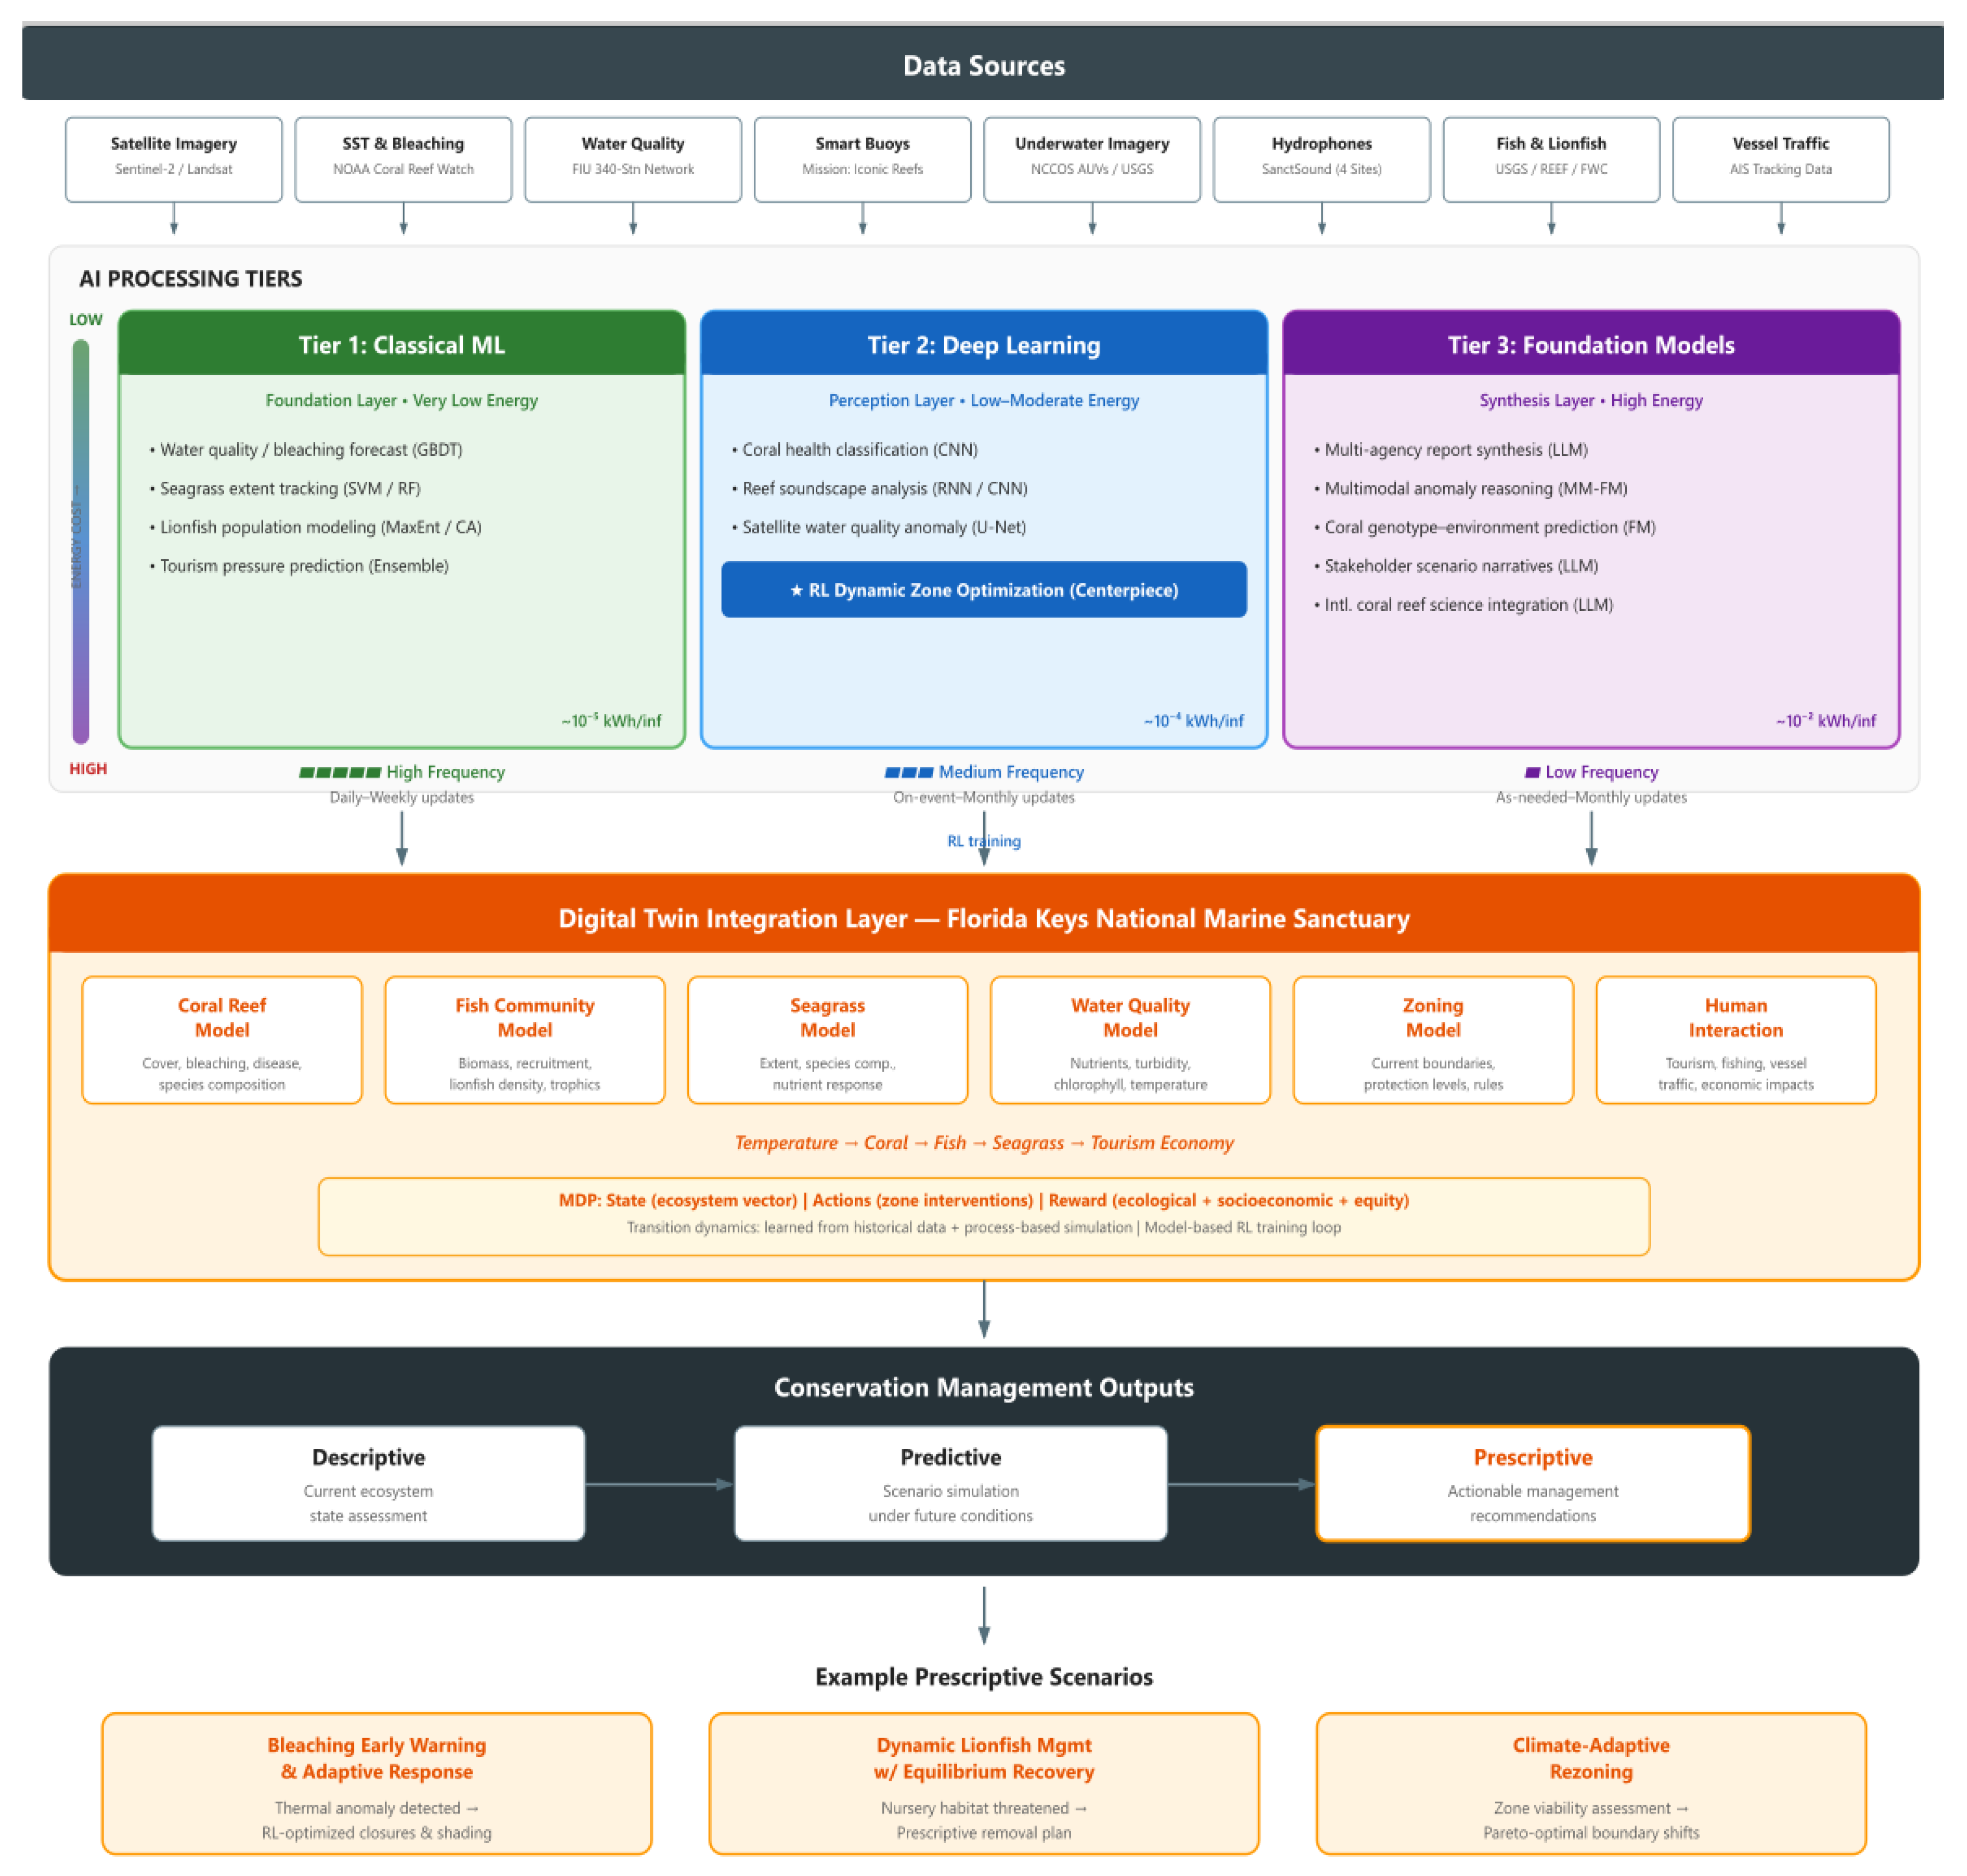
Figure 1 presents the complete architecture, illustrating the data flow from multi-source remote sensing platforms through the three computational tiers into the digital twin and its prescriptive management outputs.
4.3. Tier Assignment Criteria
Each candidate task is evaluated against three criteria:
Data modality. Structured or tabular data derived from remote sensing platforms (satellite-derived indices, sensor time series, AIS vessel tracks) routes to Tier 1. High-dimensional, unstructured remote sensing data (AUV imagery, acoustic spectrograms, multi-temporal multispectral satellite composites) are routed to Tier 2. Heterogeneous multi-modal data requiring cross-domain reasoning or natural language routes to Tier 3.
- 5.
- Performance threshold. If a Tier 1 method obtains the required accuracy for the management decision at hand, the task remains at Tier 1 regardless of whether a Tier 2 method could achieve marginally higher accuracy. The marginal accuracy boost must justify the increased energy cost.
- 6.
- Irreplaceability. A task moves to a higher tier only if lower-tier methods demonstrably fail to meet the minimum performance threshold. Stakeholder-facing natural language interaction, for example, cannot be accomplished at Tier 1; it inherently requires Tier 3.
This framework ensures that the most energy-intensive computation is reserved for the tasks where it delivers irreplaceable value, aligning computational expenditure with conservation impact.
5. Computational Tier Detail
Table 2.
maps specific FKNMS conservation tasks to the appropriate computational tier, identifying the AI technique, primary data source, update frequency, and energy classification. All data sources are publicly available and currently operational.
Table 2.
maps specific FKNMS conservation tasks to the appropriate computational tier, identifying the AI technique, primary data source, update frequency, and energy classification. All data sources are publicly available and currently operational.
| Conservation Task | Tier | AI Technique | Data Source | Update Frequency | Energy |
|---|---|---|---|---|---|
| Bleaching risk forecasting | 1 | GBDT / ARIMA | Buoy sensors, NOAA CRW, NDBC | Weekly | Very Low |
| Seagrass extent tracking | 1 | SVM / Random Forest | Sentinel-2, Landsat, FIU ground truth | Quarterly | Very Low |
| Lionfish spread modeling | 1 | MaxEnt / Cellular Automata | USGS NAS, REEF sightings, oceanographic params | Monthly | Very Low |
| Tourism pressure prediction | 1 | Ensemble regression | Visitor counts, AIS, mooring buoy usage | Weekly | Very Low |
| Coral health classification | 2 | CNN (EfficientNet) | NCCOS AUV imagery, USGS SfM surveys | On mission | Low |
| Reef soundscape analysis | 2 | CNN + RNN (spectrogram) | SanctSound hydrophones (4 sites) | Continuous | Low |
| Water quality anomaly detection | 2 | U-Net / Autoencoder | Sentinel-2/3, FIU sensor calibration | Bi-weekly | Moderate |
| Dynamic zone optimization | 2 | Deep RL (MuZero family) | Digital twin state vector | Weekly–Monthly | Moderate |
| Multi-agency report synthesis | 3 | LLM (GPT-class) | NOAA, FWC, SAFMC, GMFMC reports | As needed | High |
| Multimodal anomaly reasoning | 3 | Multimodal FM | Cross-tier alerts | Event-triggered | High |
| Coral genotype–env. prediction | 3 | Fine-tuned FM | Genetics data, restoration outcomes | Quarterly | High |
| Stakeholder scenario narratives | 3 | LLM (GPT-class) | Digital twin simulation outputs | As needed | High |
| Intl. reef science integration | 3 | LLM (GPT-class) | Global reef literature | Monthly | High |
5.1. Tier 1: Classical Machine Learning
Water quality prediction and bleaching risk forecasting. Time-series models (gradient-boosted trees, ARIMA) fuse data from FIU’s 340-station monitoring network, real-time buoy sensors, NOAA NDBC C-MAN stations, and Mission: Iconic Reefs smart buoys to forecast thermal exceedance probability at each reef site 2–4 weeks ahead. Input features include sea surface temperature trends, wind speed and direction (which affect upwelling and cooling), degree heating week accumulation from NOAA Coral Reef Watch, and historical bleaching response at each site. The output is a per-site bleaching risk score that feeds into the Tier 2 RL agent’s state depiction.
Seagrass extent tracking. Support vector machine or random forest classifiers applied to Sentinel-2 and Landsat composites via Google Earth Engine, using established spectral indices (NDVI for intertidal beds, SSII for submerged beds) and ground truth from FIU’s multi-tiered seagrass monitoring program. This approach has been validated across multiple geographies, achieving accuracies exceeding 79% [33], and requires no new satellite infrastructure. Outputs are quarterly or seasonal seagrass extent maps that track habitat change across the sanctuary.
Lionfish population spread modeling. Correlative species distribution models (MaxEnt) and cellular automata simulations using oceanographic parameters (SST, salinity, current velocity, bathymetry) from public sources, validated against the USGS Nonindigenous Aquatic Species database and REEF sighting records. Length-based age-structured population models estimate density by zone and project trajectories under various removal-effort scenarios. These models are computationally inexpensive and leverage decades of established methodology.
Tourism pressure prediction. Ensemble regression models using historical visitor counts, seasonal patterns, vessel AIS data, and mooring buoy usage records to forecast spatial-temporal visitor density across the sanctuary. The output enables proactive management of high-traffic reef sites, particularly during periods of coincident ecological stress.
5.2. Tier 2: Deep Learning
Underwater coral health classification. Convolutional neural networks trained using the growing corpus of FKNMS underwater imagery—NCCOS AUV missions, USGS structure-from-motion surveys (nearly 40,000 images from 2022–2023 alone), and historical USGS photographic records—for automated classification of bleaching percentage, disease prevalence (stony coral tissue loss disease, white band disease), algal overgrowth, and coral species identification. Transfer learning from existing coral reef image datasets lowers training data requirements and energy cost. Inference can be deployed on edge devices aboard AUVs for near-real-time field assessment.
Reef soundscape analysis. Spectrogram-based CNNs and recurrent neural networks applied to continuous recordings from the four SanctSound hydrophone sites for automated species identification, fish spawning event detection, snapping shrimp activity quantification (a proxy for invertebrate biodiversity), vessel traffic quantification, and aggregate biodiversity index estimation. NOAA is already piloting AI/ML approaches on these data [31]; the present framework assimilates acoustic-derived biodiversity indicators into the digital twin’s state depiction alongside visual and chemical data streams.
Satellite-based water quality anomaly detection. Deep autoencoders or U-Net models for identifying harmful algal bloom onset, runoff plume propagation from Florida Bay, and anomalous turbidity patterns from multi-temporal Sentinel-2 and Sentinel-3 composites. Calibrated against the FIU in-situ sensor network, these models detect spatial water quality anomalies that point sensors alone cannot capture, providing early warning of threats to downstream reef and seagrass habitats.
Reinforcement learning for dynamic zone optimization. This is the architectural centerpiece and is detailed in Section 6.
5.3. Tier 3: Foundation Models
Multi-agency report synthesis and regulatory monitoring. Continuous ingestion and structured extraction from reports produced by NOAA, Florida DEP, FWC, South Atlantic and Gulf Fishery Management Councils, Monroe County, EPA, and partner NGOs. The foundation model identifies management-relevant findings across agency boundaries and flags regulatory changes—such as new fishery rules, updated water quality standards, and revised species listings—that affect the digital twin’s constraint space.
Multimodal anomaly reasoning. A reasoning layer that ingests alerts from multiple Tier 1 and Tier 2 models simultaneously (acoustic anomaly + thermal spike + vessel traffic surge + water quality degradation converging on the same reef site) and generates natural-language threat assessments that explain the compound risk to managers. This capability requires multimodal reasoning and explanation generation, which distinguish foundation models from narrower approaches.
Coral resilience prediction via genotype-environment integration. Foundation model fine-tuned on coral genetics data (thermal tolerance profiles, disease resistance markers from Mission: Iconic Reefs outplanting records), cross-referenced with environmental exposure histories. Output: site-specific recommendations for which coral genotypes should be prioritized in restoration, based on projected future thermal and water quality conditions. This application leverages foundation models’ capacity to reason across heterogeneous data domains—genetics, oceanography, restoration outcomes—that do not share a common feature space amenable to classical machine learning methods.
Scenario narrative generation for stakeholder decision support. Natural-language interface that translates quantitative digital twin outputs into actionable policy narratives for the sanctuary’s diverse stakeholder community: tourism operators, commercial and recreational fishers, dive operators, county officials, federal regulators, and environmental advocates. Stakeholders have the ability to pose natural-language what-if queries (“What happens to lobster habitat if we expand the Ecological Reserve at Western Sambo by 30%?”) and receive responses grounded in the digital twin’s simulation outputs.
International coral reef science integration. Systematic synthesis of research from analogous reef systems (Great Barrier Reef, Mesoamerican Reef, Red Sea, Indo-Pacific) to identify transferable management strategies, early warning indicators validated in other geographies, and restoration techniques proven at scale elsewhere. This positions FKNMS management within the global knowledge base rather than treating each reef system as an isolated case.
6. Reinforcement Learning for Dynamic Zone Optimization
6.1. Problem Formulation
We formulate dynamic marine zoning as a continuous-state, discrete-action Markov Decision Process (MDP).
State space (). The state at time is the digital twin’s fused multi-source remote sensing assessment: a vector encoding per-zone values for satellite-derived coral cover (from Sentinel-2 benthic classification), bleaching severity (from NOAA CRW satellite thermal products and AUV imagery), fish biomass by trophic level (from acoustic and survey data), seagrass extent (from satellite-derived habitat maps), lionfish density (from species distribution models), water quality indices (from satellite anomaly detection and in-situ sensors), vessel traffic intensity (from AIS data), restoration investment level, and current zone classification. This state is updated at the temporal resolution of the fastest-updating remote sensing stream (hourly for buoy sensors; 5-day for Sentinel-2 revisits; the composite state vector is refreshed on a configurable management-relevant time step, e.g., weekly).
Action space (). The Reinforcement Learning (RL) agent can recommend a set of zone-level actions at each time step: (1) temporarily close a zone to diving or snorkeling, (2) temporarily close a zone to fishing, (3) upgrade a zone’s protection classification (e.g., from general use to Sanctuary Preservation Area), (4) downgrade a zone’s protection classification, (5) reallocate restoration resources (e.g., shift coral outplanting effort from site A to site B), (6) trigger targeted lionfish removal in a zone, (7) maintain current status. The action space is discrete and zone-indexed, with the total action space being the Cartesian product across zones—practically constrained by management feasibility rules.
Reward function (). The reward is a multi-objective function combining:
- Ecological benefit: change in coral cover, fish recruitment indices, seagrass extent, biodiversity indicators (derived from acoustic and survey data).
- Threat reduction: decrease in lionfish density, reduction in bleaching exposure (through adaptive closures), water quality improvement.
- Socioeconomic cost: economic impact of closures on tourism revenue, fishing livelihoods, and dive operator income (estimated from AIS data, visitor statistics, and fishery landings).
- Equity constraint: ensuring that closures and restrictions are not disproportionately concentrated in zones that serve specific user communities.
- Regulatory feasibility: penalty for actions that exceed the sanctuary manager’s legal authority or call for multi-agency approval beyond a defined complexity threshold.
The reward function is parameterized to allow managers to adjust the relative weighting of ecological versus socioeconomic objectives, indicating the inherently political nature of zoning decisions. The RL agent does not make decisions; it generates Pareto-optimal recommendations that expose tradeoffs.
Transition dynamics (). The digital twin serves as the environment model. Transition dynamics are partially learned from historical data (How did coral cover respond to past closures? How quickly did fish biomass recover in previous Ecological Reserves?) and partially simulated using process-based ecological models (bleaching response curves, lionfish population growth functions, seagrass recovery trends under different nutrient conditions).
6.2. Training Approach
The RL agent is trained in simulation using the digital twin as the environment, rather than being deployed directly into the real ecosystem. This is critical for two reasons. First, real-world experimentation with zone boundaries is legally and ecologically risky. Second, simulation training enables the agent to explore the impact of a wide range of management actions—including aggressive closures, extended no-take periods, and novel zone configurations—that would be too risky or infeasible to test directly on a living reef system.
Training uses a model-based RL approach (e.g., Dreamer or MuZero family) that learns a world model from historical data and generates synthetic rollouts for policy optimization. The world model encodes the ecosystem’s transition dynamics—how coral cover at site X responds to a temperature spike given its current stress level, fish community composition, and protection status. The policy is optimized to maximize cumulative discounted reward over a planning horizon aligned with management plan review cycles (typically 5–10 years).
6.3. Deployment and Human-in-the-Loop
The trained RL agent operates in an advisory capacity. At each management decision point (configurable: weekly, monthly, or event-triggered), the agent evaluates the current ecosystem state and produces a ranked list of recommended actions, each annotated with:
- Projected ecological outcome (coral cover trajectory, fish biomass trajectory).
- Projected socioeconomic impact (revenue change by sector).
- Confidence interval derived from ensemble rollouts through the world model.
- Energy cost of the recommendation’s downstream monitoring requirement.
Sanctuary managers review the recommendations, apply political and practical judgment, and decide whether and how to act. The system records all recommendations and outcomes, enabling continuous refinement of the world model and policy via offline RL updates. Over time, the logged decision data also provides an empirical record of management effectiveness that can inform regulatory review processes.
6.4. Energy Footprint Analysis
Table 3.
compares estimated annual energy consumption of the tiered architecture against a hypothetical foundation-model-centric baseline in which all conservation tasks are routed through a large language or multimodal model. The most dramatic savings emerge in Tier 1, where classical ML techniques perform forecasting, species distribution modeling, and regression at energy costs two to three orders of magnitude lower than equivalent foundation model queries. Since these tasks account for the highest inference volumes (daily or weekly updates across multiple variables), the cumulative savings are substantial. Estimates are based on published benchmarks [19] and are approximate; actual consumption will vary with hardware, cloud provider, and implementation details.
Table 3.
compares estimated annual energy consumption of the tiered architecture against a hypothetical foundation-model-centric baseline in which all conservation tasks are routed through a large language or multimodal model. The most dramatic savings emerge in Tier 1, where classical ML techniques perform forecasting, species distribution modeling, and regression at energy costs two to three orders of magnitude lower than equivalent foundation model queries. Since these tasks account for the highest inference volumes (daily or weekly updates across multiple variables), the cumulative savings are substantial. Estimates are based on published benchmarks [19] and are approximate; actual consumption will vary with hardware, cloud provider, and implementation details.
| Component | Tiered Architecture (kWh/yr) | FM-Centric Baseline (kWh/yr) |
|---|---|---|
| Tier 1 tasks (4 tasks) | 20–30 | 1,400–2,100 |
| Tier 2 tasks (4 tasks) | 700–1,000 | 1,600–2,300 |
| Tier 3 tasks (5 tasks) | 250–400 | 750–950 |
| Model retraining (amortized) | 40–60 | ~0 (API-based) |
| Total | 1,010–1,490 | 3,750–5,350 |
7. Prescriptive Scenarios
7.1. Scenario 1: Bleaching Early Warning and Adaptive Response
The digital twin combines multi-source remote sensing data for thermal monitoring: real-time sea surface temperature from Mission: Iconic Reefs smart buoys (seven sites), NOAA NDBC C-MAN stations (Sombrero Key, Long Key, Key West), and the CO-OPS API for programmatic wind and temperature feeds. Satellite-derived degree-heating-week products from NOAA Coral Reef Watch—computed from geostationary and polar-orbiting satellite SST retrievals—provide the broader spatial context that point sensors cannot capture. Tier 1 time-series models fuse these satellite and in-situ thermal data streams to forecast site-level thermal exceedance probability 2–4 weeks ahead.
When the forecast crosses a configurable bleaching risk threshold, the system escalates. Tier 2 models analyze the most recent AUV and diver imagery to assess the current coral stress state at threatened sites. Acoustic models derived from SanctSound hydrophone data detect changes in reef biological activity that may signal early stress.
The RL agent evaluates which threatened sites warrant intervention based on their ecological value (coral cover, genetic diversity of outplanted colonies, restoration investment), current visitor pressure, and available management capacity. It recommends a response portfolio: emergency shading deployment at the highest-value restoration sites, temporary dive site closures to reduce cumulative anthropogenic stress, and reallocation of monitoring resources to the most threatened zones. The Tier 3 foundation model generates stakeholder communications explaining the rationale for closures, projected duration, and expected recovery benefits—in formats appropriate for dive operators, tourism boards, and the general public.
7.2. Scenario 2: Dynamic Lionfish Management with Prescriptive Equilibrium Recovery
Tier 1 species distribution models project lionfish expansion fronts using current oceanographic conditions from public data sources. Population models estimate per-zone lionfish density and forecast trajectory under the current removal effort level. Prey impact models quantify the projected effect on juvenile grouper and snapper nursery habitat.
The RL agent receives this assessment along with operational constraints: the number of trained removal divers available, derby scheduling windows, vessel availability, and budget. The manager specifies a recovery target—for example, reducing lionfish density in the Lower Keys nursery zones to below a threshold level within 18 months.
The RL agent optimizes a corrective action plan: specific removal derby locations (prioritized by proximity to nursery habitat), timing (aligned with lionfish reproductive cycles to maximize population-level impact), intensity targets for each event, and resource allocation across zones. The objective function balances the cost of effort, the ecological benefit per lionfish removed (weighted by the trophic significance of the removal location), and time-to-equilibrium. The digital twin simulates the downstream fishery impacts of the recommended plan versus inaction, providing managers with quantified comparisons of outcomes.
The Tier 3 foundation model translates the plan into actionable briefings for dive operators and derby organizers, and generates economic-impact narratives that show projected grouper and snapper population restoration timelines for the fishing community.
7.3. Scenario 3: Climate-Adaptive Rezoning
The digital twin integrates NOAA satellite-derived sea level rise projections, shifting current pattern models, coral thermal tolerance data from Mission: Iconic Reefs genotype libraries, and multi-decadal satellite and in-situ bleaching response records by site. Tier 1 classical machine learning classifies each current zone as high, transitional, or low future viability based on combined satellite-derived climate projections and site-level resilience indicators extracted from the fused remote sensing record.
Tier 2 deep learning models evaluate chronological sequences of AUV underwater imagery and multi-temporal Sentinel-2 satellite composites to detect which currently unprotected areas harbor the most climate-resilient coral assemblages—sites where satellite-derived coral cover indicators have held steady or recovered despite thermal events visible in the NOAA CRW satellite record.
The Tier 3 foundation model reviews and distills lessons from prior climate-adaptive marine rezoning efforts internationally—including the Great Barrier Reef’s 2004 rezoning process and Palau’s protected area network design—to identify transferable strategies, design principles, and stakeholder engagement approaches that can inform the FKNMS context.
The RL agent generates recommended zone boundary adjustments for the next management plan review cycle. The optimization balances protecting the highest-resilience sites, maintaining fishery access (weighted by economic dependence), minimizing socioeconomic disruption stemming from boundary changes, and meeting the 30x30 conservation targets established under the America the Beautiful initiative. The agent produces multiple Pareto-optimal scenarios, each illustrating a different balance of ecological protection and socioeconomic continuity.
The Tier 3 foundation model generates plain-language summaries of each scenario for public comment periods and enables natural-language what-if queries from stakeholders during the public engagement process—translating the inherently technical output of the RL optimization into the language of community decision-making.
8. Discussion
8.1. Limitations
This work presents a conceptual framework and does not include empirical testing using operational data. The prescriptive scenarios are illustrative, not experimentally verified. The reinforcement learning formulation, while grounded in established methods, has not been trained on FKNMS data or evaluated for policy quality. The digital twin’s transition dynamics model would require extensive calibration against monitoring data before deployment.
The multi-agency governance structure of the FKNMS presents institutional barriers that go beyond technology. Zone boundary changes require formal regulatory processes involving public comment periods, ecological impact assessments, and inter-agency negotiation. The RL agent’s recommendations, however ecologically optimal, may be politically or procedurally infeasible. The architecture’s advisory role—recommending rather than deciding—is a calculated design choice, but it means the system’s conservation impact depends entirely on the institutional willingness to act on its outputs.
Remote sensing data integration across agencies presents practical barriers. Different satellite processing pipelines use different atmospheric correction algorithms, different spatial reference systems, and different radiometric calibration standards. In-situ monitoring programs operate on diverse temporal sampling schedules and quality assurance protocols. Fusing these heterogeneous remote sensing and sensor data streams into a coherent digital twin state representation requires significant data engineering effort—including spatial co-registration, temporal interpolation, cross-calibration between satellite-derived and in-situ measurements, and uncertainty propagation—that should not be underestimated.
8.2. Ethical Considerations
Dynamic zoning directly affects livelihoods. A zone closure that protects recovering coral may eliminate fishing access for families that have fished those waters for generations. The RL agent’s reward function encodes values—how much ecological benefit justifies how much economic disruption—and those values are inherently political, not technical. We emphasize that the system is designed to illuminate tradeoffs and generate options, not to make decisions. The final authority must rest with human managers accountable to the communities they serve.
Algorithmic transparency is essential. Managers and stakeholders need to understand why the system recommends a particular action. The Tier 3 foundation model’s natural-language explanation capability is not a convenience feature; it is an ethical requirement. Black-box optimization of zone boundaries affecting community livelihoods would be neither appropriate nor politically sustainable.
Environmental justice considerations must inform the reward function’s equity constraints. Closures must not disproportionately burden lower-income communities or subsistence fishers while protecting tourism revenue in higher-income areas. The parameterizable reward function is designed to make these tradeoffs explicit and adjustable, but the default parameterization must reflect equity principles.
8.3. Implementation Pathway
We propose a phased implementation. Phase 1 builds the remote sensing data fusion layer, connecting existing satellite, acoustic, imagery, and sensor monitoring streams into a unified digital twin state representation with standardized spatial reference systems and temporal alignment. This phase delivers immediate value by breaking down remote sensing data silos, even without AI. Phase 2 deploys Tier 1 classical ML models for satellite-derived bleaching forecasting, Sentinel-2-based seagrass tracking, and species distribution modeling—well-validated remote sensing applications with low energy cost and high management relevance. Phase 3 adds Tier 2 deep learning for AUV imagery classification, acoustic spectrogram analysis, satellite-based water quality anomaly detection, and initial RL agent training in simulation. Phase 4 introduces Tier 3 foundation models for multi-agency report synthesis, stakeholder correspondence, and cross-modal reasoning across heterogeneous remote sensing data streams. Each phase delivers standalone management value, diminishing the risk of an all-or-nothing implementation.
8.4. Alignment with Federal Conservation Priorities
The proposed framework directly supports the America the Beautiful initiative’s goal of conserving at least 30% of U.S. lands and waters by 2030. Dynamic zoning informed by real-time ecosystem state could demonstrate that effective conservation of marine areas is achievable not just through expanding protected boundaries, but through smarter, adaptive management within existing sanctuary footprints. The framework is also consistent with the National Marine Sanctuaries Act’s mandate for science-based management, NOAA’s coral reef conservation priorities, and the Inflation Reduction Act’s investments in climate resilience.
9. Future Work and Conclusion
9.1. Future Research Directions
Several research directions emerge from this work. First, empirical testing of the multi-source remote sensing fusion pipeline through the deployment of a proof-of-concept digital twin in a defined sub-region of the FKNMS (e.g., the Lower Keys reef tract or the Mission: Iconic Reefs restoration sites) would assess the framework’s real-world applicability and quantify the accuracy gains from fusing satellite, acoustic, imagery, and in-situ sensor data versus processing each modality independently. Second, hyperspectral remote sensing from next-generation satellite platforms (e.g., ESA CHIME, NASA SBG) could significantly improve benthic habitat discrimination, enabling the Tier 1 classifiers to distinguish coral species assemblages rather than broad substrate categories, and the framework should be designed to accommodate these higher-dimensional data streams. Third, federated learning could enable cross-agency remote sensing data sharing among NOAA, FWC, FIU, the fishery management councils, and partner institutions without centralized data collection, thereby addressing concerns about institutional sovereignty over monitoring data. Fourth, transfer learning from analogous reef systems (the Great Barrier Reef and the Mesoamerican Reef) could improve model performance in the FKNMS, particularly for rare-event prediction from satellite thermal products, such as mass bleaching. Fifth, the development of marine remote sensing fusion benchmarks—standardized datasets combining satellite imagery, underwater photography, acoustic recordings, and in-situ sensor data with management-relevant labels—would enable meaningful comparison of multi-modal integration approaches and AI-powered zoning recommendations against expert judgment.
9.2. Conclusion
This paper proposes an energy-aware, tiered AI architecture that fuses multi-source remote sensing and in-situ monitoring data into a digital twin of the Florida Keys National Marine Sanctuary, addressing the static-dynamic management paradox—the mismatch between fixed zone boundaries and a rapidly changing marine ecosystem. The architecture demonstrates that the extensive remote sensing infrastructure already deployed across the FKNMS—Sentinel-2 and Landsat satellite imagery, NOAA Coral Reef Watch thermal products, AUV benthic photography, passive acoustic hydrophone arrays, real-time buoy sensors, and vessel AIS tracking—can be integrated into a coherent ecosystem state representation capable of supporting prescriptive management decisions, provided that analytical tasks are matched to the most energy-efficient AI technique capable of delivering the required benefit.
The reinforcement learning agent at the architecture’s core transforms the fused remote sensing state representation from a descriptive monitoring tool into a prescriptive management instrument, generating Pareto-optimal zone management recommendations that make ecological-socioeconomic tradeoffs explicit and navigable for managers and stakeholders. Every remote sensing and monitoring data source cited in this paper is publicly available, currently operational, and funded through existing programs. The architecture does not require new satellites, new sensor networks, or new monitoring programs. It requires fusing what already exists.
Together with the companion paper on the Greater Yellowstone Ecosystem [7], this work shows that the tiered, energy-aware digital twin architecture can be generalized across terrestrial and marine remote sensing domains, across trophic cascade modeling and spatial zone optimization, and across camera-trap-and-GPS data modalities and satellite-multispectral, hydrophone, and AUV-imagery data modalities. The underlying principle is the same: conservation remote sensing analytics must be energy-conscious by design, data-grounded by requirement, and prescriptive by aspiration.
The coral reefs of the Florida Keys will not wait for perfect models. They need better decisions, made faster, informed by the fusion of remote sensing data that already exists. The architecture proposed here is a framework for delivering those decisions.
Acknowledgments
The author acknowledges NOAA’s Office of National Marine Sanctuaries, the Mission: Iconic Reefs program, the Florida Fish and Wildlife Conservation Commission, and Florida International University’s Southeast Environmental Research Center for their foundational monitoring and data collection efforts that make this work conceptually feasible. The author also acknowledges the fishing, diving, and tourism communities of the Florida Keys, whose livelihoods depend on the health of the marine ecosystem this framework seeks to protect.
Abbreviations
The following abbreviations are used in this manuscript:
| FKNMS | Florida Keys National Marine Sanctuary |
| AI | Artificial Intelligence |
| ML | Machine Learning |
| RL | Reinforcement Learning |
| MDP | Markov Decision Process |
| AUV | Autonomous Underwater Vehicle |
| AIS | Automatic Identification System |
| CNN | Convolutional Neural Network |
| RNN | Recurrent Neural Network |
| FM | Foundation Model |
| LLM | Large Language Model |
| SST | Sea Surface Temperature |
| SfM | Structure from Motion |
| NDVI | Normalized Difference Vegetation Index |
| NOAA | National Oceanic and Atmospheric Administration |
| FWC | Florida Fish and Wildlife Conservation Commission |
| FIU | Florida International University |
| USGS | United States Geological Survey |
| EPA | Environmental Protection Agency |
| ESA | European Space Agency |
| CRW | Coral Reef Watch |
References
- NOAA. Florida Keys National Marine Sanctuary. Available online: https://floridakeys.noaa.gov/ (accessed on 12 March 2026).
- Johns, T.P.; Lecky, J.; Leeworthy, V.R.; Wiley, P.C.; Tonioli, F.C. Socioeconomic Study of Reefs in Southeast Florida; Florida DEP: Tallahassee, FL, USA, 2001. [Google Scholar]
- NOAA Coral Reef Watch. Florida Keys 2023 Bleaching Event. Available online: https://coralreefwatch.noaa.gov/ (accessed on 12 March 2026).
- NOAA Fisheries. Impacts of Invasive Lionfish. Available online: https://www.fisheries.noaa.gov/southeast/ecosystems/impacts-invasive-lionfish (accessed on 12 March 2026).
- NOAA FKNMS. Water Quality Protection Program. Available online: https://floridakeys.noaa.gov/wqpp/ (accessed on 12 March 2026).
- NOAA. Florida Keys National Marine Sanctuary Management Plan; NOAA: Silver Spring, MD, USA, 2007. [Google Scholar]
- Narula, H.D.S. Energy-Aware AI Framework for Predictive Conservation: A Digital Twin Architecture for the Greater Yellowstone Ecosystem. Submitted to IJAI4S 2026. manuscript in review. [Google Scholar]
- Traganos, D.; Aggarwal, B.; Poursanidis, D.; Topouzelis, K.; Chrysoulakis, N.; Reinartz, P. Towards Global-Scale Seagrass Mapping and Monitoring Using Sentinel-2 on Google Earth Engine: The Case Study of the Aegean and Ionian Seas. Remote Sens. 2018, 10, 1227. [Google Scholar] [CrossRef]
- Piñeros, V.J.; Fonteneau, M.; Rufas Talens, J.; Roupióz, L.; Del Rio, J.; Bozzeda, F.; Spadon, G. From Remote Sensing to Artificial Intelligence in Coral Reef Monitoring. Machines 2024, 12, 693. [Google Scholar] [CrossRef]
- Simmons, K.; Eggleston, D.B.; Bohnenstiehl, D.R. Soundscape Ecology of Coral Reef Ecosystems in Florida Keys National Marine Sanctuary. PLoS ONE 2021, 16, e0256985. [Google Scholar] [CrossRef]
- USGS. Invasive Species: Lionfish; Wetland and Aquatic Research Center. Available online: https://www.usgs.gov/ (accessed on 12 March 2026).
- Johnson, M.A.; Stallings, C.S. Age, Growth and Population Structure of Invasive Lionfish in Northeast Florida. PeerJ 2016, 4, e2730. [Google Scholar] [CrossRef] [PubMed]
- UF IFAS Extension. Invasive Lionfish: Pterois volitans and P. miles; SGEF-208; University of Florida: Gainesville, FL, USA, 2021. [Google Scholar]
- European Commission. Destination Earth—Digital Twin of the Ocean; European Commission: Brussels, Belgium, 2022. [Google Scholar]
- Fang, F.; Nguyen, T.H.; Pickles, R.; Lam, W.Y.; Clements, G.R.; An, B.; Singh, A.; Tambe, M.; Lemieux, A. PAWS: Game Theory-Based Anti-Poaching Patrol Planning. AI Mag. 2017, 38, 23–36. [Google Scholar] [CrossRef]
- Ju, J.; Kurniawati, H.; Kroese, D.; Ye, N. Model-Based Offline Reinforcement Learning for Sustainable Fishery Management. Expert Syst. 2025, 42, e13324. [Google Scholar] [CrossRef]
- Altamimi, H.; Yin, L.; Sisson, S.A.; Bollt, E.M. Reinforcement Learning for Wildfire Suppression Resource Allocation. Environ. Model. Softw. 2023, 169, 105820. [Google Scholar] [CrossRef]
- Lapeyrolerie, M.; Boettiger, C. Deep Reinforcement Learning for Conservation Decisions. Methods Ecol. Evol. 2022, 13, 2649–2662. [Google Scholar] [CrossRef]
- Strubell, E.; Ganesh, A.; McCallum, A. Energy and Policy Considerations for Deep Learning in NLP. In Proceedings of the 57th Annual Meeting of the Association for Computational Linguistics, Florence, Italy, 28 July–2 August 2019; pp. 3645–3650. [Google Scholar] [CrossRef]
- NOAA FKNMS. Seagrass Monitoring. Available online: https://floridakeys.noaa.gov/science/research-and-monitoring/seagrass.html (accessed on 12 March 2026).
- ESA. Sentinel-2 Mission. Available online: https://sentinel.esa.int/web/sentinel/missions/sentinel-2 (accessed on 12 March 2026).
- Liu, C.M.; Strong, A.E.; Skirving, W. Remote Sensing of Sea Surface Temperatures during 2002 Barrier Reef Coral Bleaching. Remote Sens. 2014, 6, 11402–11416. [Google Scholar] [CrossRef]
- Boyer, J.N.; Briceño, H.O. Annual Report of the Water Quality Monitoring Project for the FKNMS; FIU SERC: Miami, FL, USA, 2014. [Google Scholar]
- Florida, DEP. Real-Time Water Quality Monitoring for the FKNMS. Available online: https://floridadep.gov/ (accessed on 12 March 2026).
- NOAA FKNMS. Real-Time Water Temperature Data at Mission: Iconic Reef Sites. Available online: https://floridakeys.noaa.gov/news/2024/ (accessed on 12 March 2026).
- NOAA CO-OPS. Data Retrieval API. Available online: https://api.tidesandcurrents.noaa.gov/ (accessed on 12 March 2026).
- NCCOS. Autonomous Underwater Vehicle Collects Imagery to Evaluate Coral Restoration Effort; NOAA NCCOS: Silver Spring, MD, USA, 2023. [Google Scholar]
- Toth, L.T.; Stathakopoulos, A.; Kuffner, I.B.; Ruzicka, R.R. Diver-Based Structure-from-Motion Imagery from Coral Reef Restoration Surveys in the Lower Florida Keys; USGS Data Release; U.S. Geological Survey: Reston, VA, USA, 2025. [Google Scholar]
- USGS. Florida Keys Corals: A Photographic Record of Changes from 1959 to 2015; U.S. Geological Survey: Reston, VA, USA, 2016. [Google Scholar]
- NOAA Sanctuaries. Hum, Crackle, Knock: Monitoring Reef Habitats in Florida Keys National Marine Sanctuary; NOAA: Silver Spring, MD, USA, 2021. [Google Scholar]
- NOAA FKNMS. Soundscape Research. Available online: https://floridakeys.noaa.gov/science/research-highlights/soundscape.html (accessed on 12 March 2026).
- FIU Seagrass Ecosystems Research Lab. Seagrass Monitoring Project. Available online: https://serc.fiu.edu/seagrass/ (accessed on 12 March 2026).
- Lizcano-Sandoval, L.; Anastasiou, C.; Hu, C. Seagrass Mapping of North-Eastern Brazil Using Google Earth Engine and Sentinel-2 Imagery. Environ. Sustain. Indic. 2024, 21, 100334. [Google Scholar] [CrossRef]
- REEF. Invasive Species Program. Available online: https://www.reef.org/programs/invasive-species-program (accessed on 12 March 2026).
- SECOORA. Florida Keys Telemetry. Available online: https://secoora.org/fact/projects/florida-keys-telemetry/ (accessed on 12 March 2026).
Figure 1.
Tiered energy-aware AI architecture for the FKNMS digital twin. Remote sensing and in-situ data sources (top) feed into three computational tiers of increasing energy cost: Tier 1 classical ML (green), Tier 2 deep learning (blue), and Tier 3 foundation models (purple). The fused outputs populate the digital twin state representation, which drives the RL-based dynamic zone optimizer () to generate descriptive, predictive, and prescriptive management outputs. Three example prescriptive scenarios are shown at bottom.
Figure 1.
Tiered energy-aware AI architecture for the FKNMS digital twin. Remote sensing and in-situ data sources (top) feed into three computational tiers of increasing energy cost: Tier 1 classical ML (green), Tier 2 deep learning (blue), and Tier 3 foundation models (purple). The fused outputs populate the digital twin state representation, which drives the RL-based dynamic zone optimizer () to generate descriptive, predictive, and prescriptive management outputs. Three example prescriptive scenarios are shown at bottom.
Disclaimer/Publisher’s Note: The statements, opinions and data contained in all publications are solely those of the individual author(s) and contributor(s) and not of MDPI and/or the editor(s). MDPI and/or the editor(s) disclaim responsibility for any injury to people or property resulting from any ideas, methods, instructions or products referred to in the content. |
© 2026 by the authors. Licensee MDPI, Basel, Switzerland. This article is an open access article distributed under the terms and conditions of the Creative Commons Attribution (CC BY) license (http://creativecommons.org/licenses/by/4.0/).
Copyright: This open access article is published under a Creative Commons CC BY 4.0 license, which permit the free download, distribution, and reuse, provided that the author and preprint are cited in any reuse.