

Submitted:
02 July 2026
Posted:
03 July 2026
You are already at the latest version
Abstract
This study aims to investigate the dynamics of forest fires in Brazil, particularly in the Amazon region, motivated by the fact that approximately 60% of the Amazon rainforest lies within Brazilian territory, thus making the country central to the understan-ding and managing this critical environmental issue. Forest fires in the Brazilian forests, especially within the Amazon, represent a major environmental challenge, with significant impacts on biodiversity, atmospheric composition, and climate regulation. In recent decades, fire activity has intensified due to climate variability and growing anthropogenic pressure, raising concerns about a possible transition of the Amazon from a carbon sink to a carbon source.
This study examines the spatial and temporal variability of fire activity across Brazil, with a specific focus on the Brazilian Amazon, covering the period 2001–2022. The analysis is based on satellite-derived active fire data from NASA’s Fire Information for Resource Management System (FIRMS), using observations from the Moderate Resolu-tion Imaging Spectroradiometer (MODIS) and the Visible Infrared Imaging Radiometer Suite (VIIRS). Fire Radiative Power (FRP) is employed as a proxy for fire intensity and combustion dynamics. The VIIRS sensor, characterized by improved sensitivity to small and low-intensity fires, highlights the increase in fire activity observed after 2012.
Significant peaks in fire activity were detected in 2004, 2005, 2007, and again after 2019. Statistical analyses reveal marked interannual variability and cyclical patterns in FRP, associated with fluctuations in drought conditions, precipitation regimes, land-use changes, human pressure and environmental policy measures. Overall, the results emphasize the importance of integrating multi-sensor satellite observations for long-term monitoring of fire regimes in Brazil, with particular relevance for the Amazon region.
Keywords:
Brazilian forest
; Brazilian Amazon
; fire activities
; remote sensing
; satellite monitoring
1. Introduction
The Amazon Basin is a vast region of South America dominated by the Amazon rainforest, the largest tropical rainforest on Earth. Although the Amazon extends across multiple South American countries, approximately 60% of the rainforest is located within Brazilian territory, making Brazil the most relevant region for the analysis of large-scale fire dynamics and land-use change. This ecosystem hosts exceptional biological diversity and plays a fundamental role in regulating global biogeochemical cycles, atmospheric circulation, and climate at both regional and global scales [1]. At the same time, the Amazon is strongly influenced by social, economic, and political processes, as land-use decisions and environmental policies directly affect forest conservation and degradation. Over recent decades, deforestation has emerged as one of the principal threats to the Amazon biome. Forest loss is primarily driven by agricultural expansion, livestock production, land grabbing, land speculation, unsustainable logging, and poorly planned infrastructure development [2]. These processes have altered extensive forest areas, increased landscape fragmentation, and reduced ecosystem resilience.
Fire has become an increasingly important disturbance factor in the Amazon. During the dry season, typically extending from June to November, fires are widely used for land clearing and agricultural management. However, climate variability and recurrent droughts have enhanced forest flammability by reducing vegetation moisture and increasing fuel availability [3]. Extreme drought events, such as those recorded in 2005 and 2010, were associated with large-scale climate anomalies and widespread fire activity across the basin [4]. Nevertheless, fire occurrence does not always scale linearly with drought severity, indicating the influence of additional non-climatic drivers. Fires release substantial amounts of greenhouse gases and aerosols, intensify climate–fire feedback, and accelerate forest degradation, raising concerns that the Amazon could shift from a carbon sink to a net carbon source [2,5,6].
Since the mid-1990s, the frequency of extreme drought events in the Amazon has increased, accompanied by rising fire activity and associated emissions, with pronounced ecological and economic impacts, particularly in Brazil [4,7]. Understanding how fire regimes respond to the combined effects of climate variability and human pressure is therefore essential for assessing ecosystem resilience and supporting effective mitigation and land management strategies.
Satellite remote sensing provides an indispensable means of monitoring fire activity across large and inaccessible regions such as the Amazon. Fire detection and characterization rely primarily on observations from polar-orbiting satellites operated by the National Aeronautics and Space Administration (NASA) and partner agencies. NASA’s Fire Information for Resource Management System (FIRMS) (https://firms.modaps.eosdis.nasa.gov/, accessed May 2023) distributes near real-time active fire data derived from the Moderate Resolution Imaging Spectroradiometer (MODIS) and the Visible Infrared Imaging Radiometer Suite (VIIRS). MODIS instruments aboard the Terra and Aqua satellites have enabled global fire monitoring since the early 2000s, while VIIRS sensors aboard Suomi-NPP and NOAA-20 ensure data continuity with improved spatial resolution and enhanced sensitivity to small and low-intensity fires [7,8].
Previous studies have evaluated MODIS and VIIRS fire products in terms of detection performance and estimates of Fire Radiative Power (FRP). Although both sensors capture consistent temporal patterns, differences in spatial resolution and detection algorithms lead to systematic differences in FRP estimates [8,9]. The combined use of MODIS and VIIRS thus enables a more comprehensive characterization of fire activity across heterogeneous land-cover types and fire regimes.
In this study, fire activity in the Amazon rainforest is analyzed for the period 2001–2022 using active fire data from MODIS and VIIRS distributed through NASA’s FIRMS platform. Fire activity is characterized in terms of frequency (number of detected events) and intensity, quantified using FRP. To investigate the role of climate variability, satellite-based precipitation data from the Global Precipitation Measurement (GPM) IMERG product are also employed, allowing assessment of precipitation anomalies and drought conditions in relation to fire activity.
The main objective of this study is to characterize the spatial and temporal patterns of fire activity in the Brazilian Amazon over the past two decades and to evaluate the relative influence of climatic variability and non-climatic factors. Particular attention is given to periods of extreme fire activity, including the drought years and the recent period from 2019 to 2021, during which high fire frequency and intensity occurred despite near-average precipitation conditions. By integrating fire counts, FRP, and precipitation data, this study aims to improve understanding of the combined role of climate and human activities in shaping fire regimes in the Amazon region. To ensure consistency between datasets, the comparison between MODIS and VIIRS observations was performed over the overlapping period 2012–2022. Both datasets were filtered using consistent criteria, including high-confidence detections and FRP values above 100 MW. Annual indicators such as mean FRP, maximum FRP, cumulative FRP, and fire counts were then calculated independently for each sensor. Since Brazil contains the largest portion of the Amazon rainforest and represents the most relevant region for large-scale fire dynamics, the analysis focuses on Brazilian territory. In addition, a quantitative comparison between MODIS and VIIRS observations was performed to evaluate the consistency and limitations of multi-sensor fire monitoring approaches.
2. Materials and Methods
Space-based remote sensing from NASA’s Earth Observing System (EOS) (https://firms.modaps.eosdis.nasa.gov/, accessed May 2023) and the Fire Information for Resource Management System (FIRMS) provides near real-time observations of Earth’s surface and plays a key role in monitoring environmental change and fire activity. FIRMS distributes active fire data derived from the Moderate Resolution Imaging Spectroradiometer (MODIS) and the Visible Infrared Imaging Radiometer Suite (VIIRS), enabling global and regional fire detection and supporting fire management and strategic monitoring efforts. In addition, precipitation data from the Global Precipitation Measurement (GPM) mission were used to examine the relationship between drought conditions and the occurrence and spread of forest fires.
2.1. Study Domain
The study area was defined to cover Brazil, which hosts most of the Amazon rainforest. Although the Amazon basin extends across several South American countries, approximately 60% of the forest is located in Brazil, making it the most representative region for analysing large-scale fire dynamics within the Amazon biome. For this reason, all satellite data used in this study were downloaded and processed considering Brazil as the geographical area of interest.
Fire activity was analyzed in relation to the main vegetation formations characterizing Brazil and the Amazon region, specifically tropical forest, savanna, and grassland ecosystems (Figure 1). These land-cover types differ markedly in vegetation structure, fuel availability, and moisture conditions, which strongly influence fire occurrence and intensity.
The spatial distribution of land-cover classes was derived from the MapBiomas dataset (https://plataforma.monitorfogo.mapbiomas.org/, accessed December 2025), which provides harmonized land-use and land-cover information for Brazil. Figure 1 shows that tropical forest formations dominate the central and northern parts of the country, corresponding to the core of the Amazon biome, while savanna and grassland ecosystems are mainly distributed across the southern and eastern transition zones. This spatial variability strongly influences regional fire regimes, since vegetation structure, fuel availability, and moisture conditions differ considerably among these ecological domains.
Table 1 illustrates which sensors and corresponding time periods will be utilized for the qualitative and quantitative analyses in the following chapters.
2.2. GPM Sensor
Annual precipitation data were obtained from the Global Precipitation Measurement (GPM) Final Run product (GPM_3IMERGHH v07), provided as time-averaged multi-satellite precipitation estimates with gauge calibration. The dataset consists of half-hourly precipitation rates at a spatial resolution of 0.1°, expressed in millimeters per hour (mm h⁻¹). For each year, mean precipitation rates were computed by averaging all half-hourly observations over the corresponding annual period.
Cumulative annual precipitation totals (mm·year⁻¹) were derived by converting mean precipitation rates to annual values using appropriate temporal scaling factors (hours per day and days per year). The resulting rasters represent the total annual precipitation accumulated in each grid cell. Spatially averaged precipitation values were then calculated over the domain territory to enable consistent comparison with interannual fire activity.
The GPM mission's primary instruments are onboard the GPM Core Observatory spacecraft, jointly led by the National Aeronautics and Space Administration (NASA) and the Japan Aerospace Exploration Agency (JAXA), was launched in 2014 to provide high-resolution, near-global precipitation estimates and to ensure continuity with earlier missions such as the Tropical Rainfall Measuring Mission (TRMM, 1997–2015). The integration of multiple satellite observations within the GPM framework allows improved characterization of precipitation variability across diverse climatic regimes.
Annual precipitation data from GPM were analyzed for the period 2001–2022 to assess the influence of hydrological variability on fire activity in the area. The use of satellite-based precipitation estimates ensures spatial consistency and supports the identification of drought and wet years relevant to fire regime dynamics.
2.3. MODIS and VIIRS Sensors
Fire activity was analyzed using satellite-based products for detecting active fires, which originate from the Moderate Resolution Imaging Spectroradiometer (MODIS) and the Visible Infrared Imaging Radiometer Suite (VIIRS) and are distributed via NASA's/FIRMS web-portal. Detailed descriptions of the data products are publicly available and include information such as the latitude and longitude of the fire pixels, brightness temperature, the fire radiative power (FRP), and the detection confidence. The active fire data from MODIS were obtained from the Collection-6 Level-2 fire products (MOD14 for Terra and MYD14 for Aqua) and analyzed for the period from 1 January 2001 to 31 December 2022, with a nominal spatial resolution of approximately 1 km. The active fire data from VIIRS were retrieved from the 375 m product for active fires (VNP14IMG) and analyzed for the period from January 1, 2012, to December 31, 2022, for the Suomi-NPP and NOAA-20 platforms.
In this study, fire activity was characterized by using fire radiative power (FRP) in megawatts (MW), which is a quantitative measure of fire intensity and allows for the assessment of spatial and temporal patterns of active fires.
Due to differences in spatial resolution, radiometric sensitivity, and detection algorithms, MODIS and VIIRS fire products are not directly comparable at the pixel level. VIIRS, with its higher spatial resolution, is more sensitive to small and low-intensity fires, whereas MODIS tends to aggregate fire signals over larger pixels, often resulting in higher FRP values for individual detections. For this reason, a consistent filtering approach and comparative analysis are required to ensure a meaningful interpretation of multi-sensor fire datasets.
2.4. Fire Radiative Power
Accurate quantification of fuel consumption, trace gas emissions, and aerosol release from biomass burning is essential for understanding the global carbon cycle, land–atmosphere interactions, and weather dynamics [10]. Traditionally, fuel consumption has been estimated as the product of the burned area, pre-fire fuel load, and combustion completeness, where burned area is expressed in square meters, fuel load in kilograms per square meter, and combustion completeness as a dimensionless factor ranging from 0 to 1 [11].
An alternative approach was introduced by Kaufman [12], who proposed the rate of fire radiative energy release as a proxy for combustion rate. This concept enabled the use of Fire Radiative Power (FRP) observations from polar-orbiting satellites to characterize active fire properties [13,14,15], estimate biomass consumption and emissions of trace gases and aerosols [16,17], and infer smoke plume injection heights [18,19].
Data regarding the timing, spatial coordinates, and radiative properties of MODIS active fire pixels are stored in different formats [20]. The data currently available for download in the FIRMS web portal use Level 2 Fire Products from Collection 6 (abbreviated as MOD14 for Terra and MYD14 for Aqua), as these datasets provide the geographic and image coordinates as well as the FRP for each 1-km active fire pixel detected by MODIS. In addition, users can obtain near real-time (NRT) 375-m VIIRS active fire product (abbreviated VNP14IMG) data generated by NASA's Land, Atmosphere Near Real-Time Capability for EOS (LANCE) system. The former is also distributed in formats compatible with GIS systems (e.g., ASCII, shapefiles). VIIRS NRT active fire data is intended primarily for use in fire management applications that require access to low-latency data. However, users are cautioned that there may be gaps in coverage resulting from temporary interruptions in the NRT data processing chain.
2.5. Quality Check
Additional quality control procedures were applied to the fire datasets to ensure the robustness of the analysis. For MODIS, fire pixel confidence is provided as a continuous metric ranging from 0 to 100% and is commonly categorized into low, nominal, and high confidence levels. The choice of a confidence threshold involves a trade-off between minimizing false detections and maximizing detection sensitivity. VIIRS active fire products use a comparable three-level confidence classification (low, nominal, and high), based on contextual and radiometric tests for pixel-level quality assessment.
To improve the reliability of the analysis, only high-confidence fire detections were retained. MODIS pixels with confidence values higher than 80% and VIIRS detections classified as high confidence were selected, following commonly adopted criteria in active fire studies [7,21]. In addition, FRP values lower than 100 MW were excluded in order to reduce the influence of weak thermal anomalies and potential noise [15]. The filtered dataset was then used to investigate the spatial and temporal variability of fire activity and to characterize fire intensity across the study area.
2.6. QGIS and Average Procedures
All spatial and statistical analyses presented in Chapter 3 were performed using the open-source geographic information system QGIS (https://qgis.org/; accessed 10/05/2024), using data downloaded in shapefile format. This software was chosen based on the availability of the file type and its ability to manage large georeferenced data sets while performing statistical operations directly on vector layers.
The shapefiles are downloaded for each year in the specified domain and contain the date and time of acquisition, the confidence level, and the fire radiative power (FRP).
All datasets were filtered as specified in Section 2.5 on quality control, and annual indicators of fire activity and FRP variability were subsequently calculated using the QGIS attribute table and field calculation tools. The final representation of the data was carried out by importing the data from QGIS into Excel calculation software.
3. Results
3.1. Analysis of Average Annual Precipitation with GPM Sensor
Figure 2 shows the interannual variability of average annual precipitation over Brazil, derived from the GPM IMERG Final Run dataset for the period 2001–2022, calculated as annual spatial averages over the study domain. Annual precipitation values range from approximately 1370 mm year⁻¹ to 1650 mm year⁻¹, illustrating the considerable variability from one year to the next throughout the study period. Higher precipitation amounts were observed in 2009 (1608 mm year⁻¹) and 2011, when the highest annual average precipitation in the entire time series (1644 mm year⁻¹) was recorded. In contrast, 2012 and 2013 were relatively dry, with the lowest annual precipitation recorded in 2013 (1373 mm year⁻¹). These dry years were followed by a partial recovery in precipitation, with values generally above 1450 mm year⁻¹ in the subsequent period. Overall, the time series does not show a monotonically increasing or decreasing trend but instead highlights the pronounced interannual variability of precipitation in the region.
This variability aligns with previous studies highlighting the pronounced interannual fluctuations of precipitation, driven by large-scale atmospheric and oceanic processes, including variations in moisture transport and circulation patterns [4,22]. Mean annual precipitation across the basin is approximately 2200 mm yr⁻¹, with higher totals exceeding 3000 mm year⁻¹ in the northwestern Amazon and lower values of ~ 1000 – 1500 mm year⁻¹ in the southern and eastern regions [23].
The use of satellite-based precipitation estimates from the GPM mission provides spatially consistent coverage of the entire study area and provides a reliable basis for analyzing the role of hydrological variability in driving fire activity, as discussed in the following sections.
The alternation between wetter and drier conditions at the basin level is also consistent with the major climatic anomalies described in the literature. In particular, Marengo and Espinoza [4] identified the years 2005, 2010, and 2015–2016 as severe drought events in the Amazon region, associated with significant hydrological and ecological impacts. Although these events are not always fully captured by annual precipitation averages at the watershed level, they represent well-documented extreme hydroclimatic conditions that strongly influence ecosystem functioning and vulnerability to fires.
3.2. Spatial Distribution of Fire Activity Across Land Cover Types
To complement the quantitative analyses presented below, a qualitative assessment of the spatial distribution of active fires was conducted using FIRMS data for the period 2001–2022. Representative examples from August, October, and December, corresponding to the peak fire season, were selected to illustrate recurring spatial patterns and periods of enhanced fire activity. Since MODIS observations were available throughout the study period, while VIIRS data became available after 2012, the selected years include periods characterized by particularly high fire frequencies [7]. In order to establish a direct relationship between fire occurrence and land cover, fire distributions were overlaid with land-use and land-cover classes derived from the MapBiomas dataset. This approach allows identification of the vegetation and land-use types most frequently affected by fires and provides a visual assessment of the relationship between fire occurrence, landscape composition, and human-modified environments.
Figure 3 (a, b, c) shows the distribution of fires detected in August 2004, 2017, and 2021. The comparison shows that a peak in fire activity was already recorded in 2004 based only on MODIS data (fig.3a), while 2017 and 2021 report a renewed increase in fires, partly due to the improved detection capabilities of VIIRS (figs.3 b, c). Figure 3(b) and 3(c) show that fire activity is concentrated mainly along the southern and southeastern margins of the Amazon biome, where forest formations are increasingly fragmented by agricultural land uses and managed landscapes. In contrast, the central forested regions exhibit a lower density of fire occurrences. This spatial correspondence suggests a close relationship between fire occurrence and land-use transitions.
Figure 4 shows the distribution of fires detected in October for the years 2004, 2017, and 2021. The comparison indicates that October 2004 already recorded a remarkably high number of events, even though only MODIS data were available. The years 2017 and 2021 show a persistent and widespread distribution of fire activity, consistent with the increased detection capability provided by VIIRS observations after 2012. These maps emphasize that October is typically one of the peak months for fire activity, with events concentrated mainly in the transition zones between tropical forest and grassland land-cover types. The overlay with land-cover information indicates that many fire hotspots occur in areas characterized by forest edges and agricultural expansion zones. These landscapes are particularly susceptible to fire due to the combined effects of seasonal drought, vegetation disturbance, and human activities.
Figure 5 illustrates the distribution of fires detected in December for the years 2017, 2019, and 2021. Compared to August and October, December is characterized by a higher occurrence of fires in north-eastern and eastern Brazil, outside the core Amazon region. These fires are frequent but, in most cases, less intense, reflecting the prevalence of fine fuels in open and anthropogenic landscapes. Overall, this pattern highlights a clear seasonal shift in fire activity across the study area, which differs from what is observed during the core dry-season months. The land-cover overlay further shows that December fires are predominantly associated with agricultural and managed landscapes rather than continuous tropical forest, indicating the importance of land-use practices in shaping seasonal fire occurrence.
The spatial distributions shown in Figure 3, Figure 4 and Figure 5 reveal a strong relationship between fire occurrence and land-cover patterns. Most fires are concentrated in the southern and southeastern portions of the Brazilian Amazon, where forest formations transition into agricultural land, plantations, and other managed landscapes. These areas correspond to zones characterized by greater human pressure, landscape fragmentation, and active land-use change. In contrast, the central Amazon, dominated by continuous tropical forest, generally exhibits lower fire densities. The observed spatial patterns therefore suggest that fire occurrence is strongly associated with land-use transitions and anthropogenic landscape modification, in addition to climatic variability.
3.3. Quantitative Analysis of Firepower
The quantitative analysis of Fire Radiative Power (FRP) associated with fire activity in the Amazon Rainforest was carried out using statistical indicators: maximum, mean, median, and standard deviation values. These metrics were used to characterize both the magnitude and variability of fire intensity.
Figure 6 presents the interannual variability of FRP derived from MODIS observations for the period 2001–2022, combining annual mean FRP values, maximum FRP values, and the associated standard deviation.
The time series indicates strong variability in fire intensity over the years. Mean and maximum FRP values tend to be higher in the early 2000s, while 2010 clearly stands out as one of the most intense fire years in the entire record. This year is notable not only for the high FRP values, but also for the overall spread of fire activity.
The standard deviation remains high throughout the entire period. This suggests that FRP values often vary greatly within a single year and that low- and high-intensity fires occur simultaneously in the study area. In other words, fire activity is not uniform either spatially or in terms of intensity. This behavior is likely related to the heterogeneity of the territory. As shown in Figure 2, the study area encompasses a variety of land cover types and environmental conditions associated with different fire regimes. Fire activity is more frequently observed along the southern and southeastern parts of the basin, particularly in areas affected by forest disturbances and seasonal drought (Figure 3Figures –Figure 5). In contrast, fire intensity is generally lower in the central and wetter forest areas.
Taken together, these spatial differences help explain the large interannual variations observed in the FRP statistics derived from MODIS. They also suggest that regional characteristics and land use patterns play an important role in shaping the observed fire intensity signals.
Figure 7 shows the FRP statistics derived from VIIRS observations for the period 2012–2022, including annual averages, maximum values, and the associated standard deviation. The VIIRS time series shows significant interannual variability in both the mean and maximum FRP, with several years standing out due to relatively high fire intensity.
Compared to MODIS, the FRP values derived from VIIRS are generally lower, although the two sensors show similar temporal patterns. This behavior has already been described in the literature and can be largely explained by differences in sensor characteristics. In particular, the higher spatial resolution of VIIRS (375 m) compared to MODIS (approximately 1 km) improves the detection of small and less intense fires but often leads to lower pixel-level FRP estimates for concurrent fire events [8,9,21]. Additional factors, such as differences in spatial sampling, spectral sensitivity, saturation effects, and viewing angle dependence, also play a role and contribute to the fact that the FRP values derived from MODIS and VIIRS cannot be considered directly interchangeable. Therefore, caution should be exercised when comparing the absolute FRP values between the two datasets.
Overall, the combined analysis of FRP statistics derived from MODIS and VIIRS underscores the strong temporal variability of fire intensity in the Brazilian Amazon. At the same time, it emphasizes the importance of considering sensor-specific characteristics and spatial heterogeneity when interpreting long-term fire activity patterns.
3.4. Analysis of Cumulative Fire Radiative Power and FRP Classes
To assess fire intensity, the total number of events detected using MODIS-FRP and VIIRS-FRP data was analyzed, and the fires were classified by grouping FRP values into 10 categories. Cumulative FRP values are reported in units of 10⁴ MW, consistently with the normalization applied in Table 2 and Table 3. Table 2 and Table 3 report, respectively for MODIS (2001–2022) and VIIRS (2012–2022), the annual number of fire events per FRP class together with the corresponding cumulative FRP values.
The MODIS-based analysis highlights a marked interannual variability in cumulative FRP, with several years characterized by significantly higher fire intensity. Periods of high cumulative FRP correspond to years previously identified as major fire seasons, while years with lower cumulative values indicate reduced fire activity and/or wetter conditions and this variability reflects the combined influence of climate anomalies and land use dynamics operating on a regional scale.
For the VIIRS period (2012–2022), cumulative FRP values are generally lower than those derived from MODIS, while showing consistent interannual fluctuations (Table 3).
The distribution among FRP classes confirms the predominance of low, to moderate, intensity fires, with most detections falling within the lowest FRP ranges and only a very small percentage associated with high-intensity fires. This pattern is consistent with the typical fire regime in the Amazon basin, where most fires are related to surface burning and land management practices rather than large canopy fires.
Figure 8 shows the yearly time series of the cumulative FRP retrievals from MODIS (green bars) and VIIRS (blue bars) averaged over the study area.
A direct comparison between MODIS and VIIRS during the overlapping period shows that the two sensors display similar temporal patterns in cumulative FRP. However, clear differences in magnitude are also evident. These differences are mainly linked to sensor-specific characteristics, especially spatial resolution and fire detection algorithms.
VIIRS, with its finer spatial resolution of 375 m, is more sensitive to small and low-intensity fires. MODIS, with a coarser spatial resolution of about 1 km, instead tends to report higher FRP values for coincident fire pixels. This effect is largely related to spatial aggregation within the MODIS pixel and has been widely discussed in previous studies [8,9,15,21].
A further comparison between Figure 6 and Figure 8 reveals that years characterized by high maximum FRP values also tend to have a high cumulative FRP. However, while Figure 6 highlights the intensity of the most extreme events, Figure 8 reflects the overall contribution of all fire classes. This difference allows for a clearer distinction between isolated episodes of high intensity and years dominated by widespread fires of moderate intensity.
Looking at the results as a whole, the class-based FRP analysis confirms that fire intensity in the Amazon is highly variable, both in time and across space. From this analysis, this variability does not appear to be driven by a single factor. Rather, it reflects the combined influence of hydroclimatic variability and land-use dynamics, particularly in areas affected by deforestation and sustained human pressure. Similar conclusions have been reported in different studies on Amazonian fire regimes, which highlight the interaction between climate conditions and anthropogenic processes [10,20].
3.5. Total Number of Events
The temporal evolution of the total number of fire events detected by MODIS and VIIRS over the study period are shown in Figure 9.
The temporal evolution of fire events reveals a marked variability from one year to another. The pattern indicates that fire activity is not stable over time. Probably, the trend of the total number of events responds to a combination of environmental conditions and human-related drivers that vary from year to year.
Early in the record, during the MODIS-only era, several years stand out for their high fire activity. These years are consistent with the elevated cumulative FRP values discussed in Section 3.4. They are followed by intervals during which fire activity decreases noticeably, suggesting the influence of both climatic variability and changes in land-use practices over time.
Indeed, as demonstrated, the inclusion of the 2012 VIIRS observations adds further detail to the analysis. Even so, during the overlapping periods, the total number of events detected by MODIS remains comparable to, or in some cases higher than, those reported by VIIRS. This is mainly related to the combined coverage of the Terra and Aqua platforms and their higher temporal sampling frequency. At the same time, VIIRS provides a more detailed picture of the spatial distribution of fire activity.
In the most recent years, fire activity shows a renewed increase, in agreement with the patterns observed in the cumulative FRP analysis. Notably, this increase also occurs in years that are not characterized by extreme rainfall deficits. This suggests that, alongside climatic factors, anthropogenic drivers such as deforestation, land clearing, and changes in land management practices are playing an increasingly important role in shaping fire occurrences within the Brazilian Amazon. The combined analysis of fire counts and FRP therefore points to the coexistence of climatic and human controls on the regional fire regime [24].
3.6. Annual Cumulative Precipitation and Fire Occurrence
In Figure 10 we have reported annual average precipitation with maximum fire radiative power (FRP) values. The comparison shows a tendency for maximum FRP values to increase in years with low precipitation, although this relationship is not strictly linear.
Years with higher precipitation levels, such as 2009 and 2011, are generally associated with lower maximum FRP values recorded by MODIS, suggesting that fires tend to be less intense under wetter conditions. In contrast, years affected by severe hydrological anomalies, particularly 2005 and 2010, show significant peaks in maximum FRP, a behavior consistent with increased flammability during drought periods and supporting the relationship between dry conditions and intense fire activity discussed in Section 2.4.
However, this relationship is not always straightforward. For instance, years such as 2012 and 2013 are characterized by relatively low precipitation, yet neither maximum FRP nor fire event counts (Figure 11) reach the levels observed during major drought years. This indicates that rainfall deficit alone is not sufficient to explain the most intense fire seasons and suggests the influence of additional factors, including short-term precipitation anomalies, vegetation conditions, fuel accumulation, and land-use dynamics [5,25].
A similar complexity emerges in recent years: in 2020, relatively high maximum FRP values are observed in both MODIS and VIIRS datasets despite precipitation being close to the long-term average. This suggests that high fire intensity can occur even without severe drought conditions, indicating an increasing role of non-climatic factors.
Figure 11 compares annual precipitation with the total number of detected fires. In general, years with lower rainfall tend to coincide with a higher number of fire events. This is clearly visible in years such as 2005, 2007, and 2010, confirming what was already discussed in previous sections.
At the same time, the relationship between rainfall and fire frequency is not constant throughout the entire period. From around 2019 onwards, both MODIS and VIIRS show a new and persistent increase in the number of detected fires, even though annual precipitation remains close to average values. In other words, fire activity stays high despite the absence of extreme rainfall deficits.
In contrast to the behaviour observed for the years 2013, the years 2020 and 2021 show high and prolonged fire activity, despite rainfall values being close to the long-term average. This trend has been widely associated with increased deforestation rates and weakened enforcement of environmental regulations in recent years [2,5].
As already highlighted, the ambiguity between rainfall and the occurrence of fires suggests that factors other than climate are becoming increasingly important. This highlights the importance of considering both climate variability and land use dynamics when interpreting recent trends in fire activity.
3.7. Comparison Between MODIS and VIIRS observations
A quantitative comparison between MODIS and VIIRS fire observations was carried out for the overlapping period 2012–2022 using annual cumulative Fire Radiative Power (FRP) as a common indicator. Only high-confidence detections were considered, and cumulative FRP values were estimated by aggregating the FRP classes over the study area.
The comparison shows a very strong agreement between the two datasets, with a Pearson correlation coefficient close to 1 (R ≈ 0.99). Both sensors reproduce similar interannual variability in fire activity, with the main peaks occurring in the same years, particularly in 2015, 2019, and 2020. This indicates that MODIS and VIIRS consistently capture the temporal evolution of fire activity across the Brazilian Amazon.
Despite this agreement, clear differences in FRP magnitude are observed between the two datasets. MODIS systematically reports higher cumulative FRP values than VIIRS throughout the overlapping periods. On average, MODIS-derived FRP values are approximately 2–3 times higher than those obtained from VIIRS, indicating the presence of a consistent positive bias between the sensors.
These differences are mainly related to the spatial resolution and detection characteristics of the two instruments. The coarser spatial resolution of MODIS (approximately 1 km) tends to aggregate fire signals within individual pixels, often producing higher FRP values per detection. In contrast, the finer spatial resolution of VIIRS (375 m) improves the detection of smaller and lower-intensity fires, generally resulting in lower pixel-level FRP estimates. Similar differences between MODIS and VIIRS FRP retrievals have been reported in previous intercomparison studies [8,9,27].
Overall, the results indicate that MODIS and VIIRS provide a consistent representation of the temporal variability of fire activity, despite systematic differences in absolute FRP magnitude. These findings support the use of multi-sensor approaches for long-term fire monitoring, while also highlighting the importance of accounting for sensor-specific characteristics when comparing FRP values directly.
4. Discussion
The results of this study provide a comprehensive overview of fire dynamics in Brazilian forests, highlighting the complex interaction between climatic variability and anthropogenic drivers. The strong interannual variability observed in both FRP and fire counts confirms that fire activity is highly sensitive to environmental conditions, particularly drought events. Years such as 2005 and 2010 clearly demonstrate how severe hydrological anomalies can significantly enhance fire intensity and spatial extent, in agreement with previous studies on Amazonian fire regimes.
However, the analysis also reveals that climate alone cannot fully explain the observed patterns. In recent years, particularly after 2019, high fire activity has been recorded even under near-average precipitation conditions. This interpretation is further supported by the spatial analysis presented in Figure 3, Figure 4 and Figure 5, which shows that many fire hotspots are concentrated in agricultural and transitional land-cover classes located along the southern and southeastern margins of the Amazon biome. These findings suggest that land-use change and landscape fragmentation are increasingly contributing to the spatial distribution of fire activity across the region.
The comparison between MODIS and VIIRS further supports the robustness of the analysis. Despite differences in spatial resolution and detection characteristics, both sensors reproduce similar temporal patterns (R ≈ 0.99), confirming their suitability for long-term fire monitoring. At the same time, systematic differences in FRP magnitude highlight the need to account for sensor-specific characteristics when interpreting fire intensity. This aspect is particularly relevant for multi-sensor analyses, where differences in spatial aggregation and detection sensitivity can influence the quantitative results.
Finally, some limitations should be acknowledged. The use of FRP as a proxy for fire intensity provides a robust indicator of fire activity, but does not directly quantify total energy release or biomass consumption. In addition, the analysis relies on aggregated indicators at regional scale, which may mask local-scale variability and the effects of specific land-use transitions. Future studies should integrate higher-resolution datasets and additional variables, such as vegetation condition and land-use change metrics, to better capture the mechanisms driving fire dynamics in the region.
Overall, the results highlight the need for integrated approaches that combine satellite observations with climatic and socio-environmental data in order to improve the understanding and management of fire regimes in Brazilian forests.
5. Conclusions
This study analyzed fire activity in Brazilian forests, with particular focus on the Amazon region, over the period 2001–2022 using MODIS and VIIRS observations combined with GPM precipitation data. The results reveal strong interannual variability in both Fire Radiative Power (FRP) and fire occurrence, confirming the influence of hydroclimatic variability on regional fire regimes.
Nevertheless, the spatial and temporal analyses indicate that increased fire activity cannot be attributed solely to drought conditions. The spatial association between fire hotspots and land-use transformation areas suggests that anthropogenic pressure plays a major role in shaping recent fire dynamics in the Brazilian Amazon.
The comparison between MODIS and VIIRS demonstrates the efficacy of multi-sensor observations for long-term fire monitoring and provides consistent evidence of temporal variability in fire activity despite differences in sensor characteristics.
Overall, the results highlight the need to jointly consider climatic variability and land-use dynamics when assessing fire risk and developing strategies for the sustainable management of Amazonian ecosystems.
6. Patents
This research did not result in any patents.
Author Contributions
Conceptualization, M.T. and U.R.; methodology, M.T.; software, M.T. and A.C. ; validation, U.R.; formal analysis, M.T.; investigation, M.T.; resources, M.T., S.D.N. and G.P. ; data curation, M.T.; writing—original draft preparation, M.T.; writing—review and editing, U.R. and G.P.; visualization, S.D.N., S.V. and A.C.; supervision, U.R. and G.P.; project administration, G.P. All authors have read and agreed to the published version of the manuscript.
Funding
This research received no external funding.
Data Availability Statement
The datasets analyzed during the current study are publicly available. MODIS and VIIRS active fire data were obtained from NASA’s Fire Information for Resource Management System (FIRMS) (https://firms.modaps.eosdis.nasa.gov/). Precipitation data were retrieved from the Global Precipitation Measurement (GPM) IMERG Final Run product available through NASA’s Precipitation Processing System. Land-use and land-cover data were obtained from the MapBiomas Project platform (https://plataforma.monitorfogo.mapbiomas.org/). Spatial analyses were conducted using the open-source Geographic Information System QGIS. Processed datasets generated during the study are available from the corresponding author upon reasonable request.
Acknowledgments
The authors acknowledge the MODIS and VIIRS science teams and the NASA FIRMS personnel for providing open access to active fire data products. The authors also thank the NASA Global Precipitation Measurement (GPM) mission scientists for the production and dissemination of IMERG precipitation datasets. The MapBiomas Project is acknowledged for providing land-use and land-cover data used in this study. The authors gratefully acknowledge the Università Politecnica delle Marche (UNIVPM) and the National Research Council, Institute of Atmospheric Sciences and Climate (CNR-ISAC), for institutional support. The open-source Geographic Information System QGIS is also acknowledged for supporting spatial analysis and data processing. The authors would also like to thank Enrico Mancinelli for his valuable support during the final preparation of the manuscript.
Conflicts of Interest
The authors declare no conflict of interest.
Abbreviations
The following abbreviations are used in this manuscript:
| FRP | Fire Radiative Power |
| FIRMS | Fire Information for Resource Management System |
| MODIS | Moderate Resolution Imaging Spectroradiometer |
| VIIRS | Visible Infrared Imaging Radiometer Suite |
| GPM | Global Precipitation Measurements |
| IMERG | Integrated Multi-satellite Retrievals for GPM |
| EOS | Earth Observating System |
References
- Lima, C.H.R.; AghaKouchak, A.; Randerson, J.T. Unraveling the Role of Temperature and Rainfall on Active Fires in the Brazilian Amazon Using a Nonlinear Poisson Model. J. Geophys. Res. Biogeosciences 2018, 123, 117–128. [Google Scholar] [CrossRef]
- Gatti, L.V.; Basso, L.S.; Miller, J.B.; Gloor, M.; Domingues, L.G.; Cassol, H.L.G.; Tejada, G.; Aragão, L.E.O.C.; Nobre, C.; Peters, W.; et al. Amazonia as a carbon source linked to deforestation and climate change. Nature 2021, 595, 388–393. [Google Scholar] [CrossRef] [PubMed]
- D’Amato, G.; Vitale, C.; De Martino, A.; Viegi, G.; Lanza, M.; Molino, A.; Sanduzzi, A.; Vatrella, A.; Annesi-Maesano, I.; D’Amato, M. Climate change, allergy and asthma, and the role of tropical forests. World Allergy Organ. J. 2017, 10, 11. [Google Scholar] [CrossRef] [PubMed]
- Marengo, J.A.; Espinoza, J.C. Extreme seasonal droughts and floods in Amazonia: causes, trends and impacts. Int. J. Clim. 2016, 36, 1033–1050. [Google Scholar] [CrossRef]
- Aragão, L.E.O.C.; Anderson, L.O.; Fonseca, M.G.; Rosan, T.M.; Vedovato, L.B.; Wagner, F.H.; Silva, C.V.J.; Silva Junior, C.H.L.; Arai, E.; Aguiar, A.P.; et al. 21st Century drought-related fires counteract the decline of Amazon deforestation carbon emissions. Nat. Commun. 2018, 9, 536. [Google Scholar] [CrossRef] [PubMed]
- Nepstad, D.C.; Stickler, C.M.; Filho, B.S.; Merry, F. Interactions among Amazon land use, forests and climate: prospects for a near-term forest tipping point. Philos. Trans. R. Soc. B Biol. Sci. 2008, 363, 1737–1746. [Google Scholar] [CrossRef] [PubMed]
- Giglio, L.; Schroeder, W.; Justice, C.O. The collection 6 MODIS active fire detection algorithm and fire products. Remote. Sens. Environ. 2016, 178, 31–41. [Google Scholar] [CrossRef] [PubMed]
- Li, F.; Zhang, X.; Kondragunta, S.; Csiszar, I. Comparison of Fire Radiative Power Estimates From VIIRS and MODIS Observations. J. Geophys. Res. Atmos. 2018, 123, 4545–4563. [Google Scholar] [CrossRef]
- Fu, Y.; Li, F.; Yu, H.; et al. Fire detection and fire radiative power in forests and low-biomass lands in Northeast Asia: MODIS versus VIIRS fire products. Remote Sens. 2020, 12, 2870. [Google Scholar] [CrossRef]
- Bowman, D.M.J.S.; Balch, J.K.; Artaxo, P.; Bond, W.J.; Carlson, J.M.; Cochrane, M.A.; D’Antonio, C.M.; DeFries, R.S.; Doyle, J.C.; Harrison, S.P.; et al. Fire in the Earth System. Science 2009, 324, 481–484. [Google Scholar] [CrossRef] [PubMed]
- Seiler, W.; Crutzen, P.J. Estimates of gross and net fluxes of carbon between the biosphere and the atmosphere from biomass burning. Clim. Chang. 1980, 2, 207–247. [Google Scholar] [CrossRef]
- Kaufman, Y.J.; Justice, C.O.; Flynn, L.P.; Kendall, J.D.; Prins, E.M.; Giglio, L.; Ward, D.E.; Menzel, W.P.; Setzer, A.W. Potential global fire monitoring from EOS-MODIS. J. Geophys. Res. 1998, 103, 32215–32238. [Google Scholar] [CrossRef]
- Wooster, M.J.; Zhang, Y.H. Boreal forest fires burn less intensely in Russia than in North America. Geophys. Res. Lett. 2004, 31. [Google Scholar] [CrossRef]
- Smith, A.M.S.; Wooster, M.J. Remote classification of head and backfire types from MODIS fire radiative power and smoke plume observations. Int. J. Wildland Fire 2005, 14, 249–254. [Google Scholar] [CrossRef]
- Ichoku, C.; Giglio, L.; Wooster, M.J.; Remer, L.A. Global characterization of biomass-burning patterns using satellite measurements of fire radiative energy. Remote. Sens. Environ. 2008, 112, 2950–2962. [Google Scholar] [CrossRef]
- Ellicott, E.; Vermote, E.; Giglio, L.; Roberts, G. Estimating biomass consumed from fire using MODIS FRE. Geophys. Res. Lett. 2009, 36. [Google Scholar] [CrossRef]
- Kaiser, J.W.; Heil, A.; Andreae, M.O.; Benedetti, A.; Chubarova, N.; Jones, L.; Morcrette, J.-J.; Razinger, M.; Schultz, M.G.; Suttie, M.; et al. Biomass burning emissions estimated with a global fire assimilation system based on observed fire radiative power. Biogeosciences 2012, 9, 527–554. [Google Scholar] [CrossRef]
- Martin, M.V.; Logan, J.A.; Kahn, R.A.; Leung, F.-Y.; Nelson, D.L.; Diner, D.J. Smoke injection heights from fires in North America: analysis of 5 years of satellite observations. Atmos. Meas. Tech. 2010, 10, 1491–1510. [Google Scholar] [CrossRef]
- Mazzoni, D.; Logan, J.A.; Diner, D.; Kahn, R.; Tong, L.; Li, Q. A data-mining approach to associating MISR smoke plume heights with MODIS fire measurements. Remote. Sens. Environ. 2007, 107, 138–148. [Google Scholar] [CrossRef]
- Giglio, L.; Randerson, J.T.; van der Werf, G.R. Analysis of daily, monthly, and annual burned area using GFED4. J. Geophys. Res. Biogeosci. 2013, 118, 317–328. [Google Scholar]
- Schroeder, W.; Oliva, P.; Giglio, L.; Csiszar, I.A. The New VIIRS 375 m active fire detection data product: Algorithm description and initial assessment. Remote. Sens. Environ. 2014, 143, 85–96. [Google Scholar] [CrossRef]
- Mu, Y.; Jones, C. An observational analysis of precipitation and deforestation age in the Brazilian Legal Amazon. Atmos. Res. 2022, 271. [Google Scholar] [CrossRef]
- Arvor, D.; Funatsu, B.M.; Michot, V.; Dubreuil, V. Monitoring Rainfall Patterns in the Southern Amazon with PERSIANN-CDR Data: Long-Term Characteristics and Trends. Remote. Sens. 2017, 9, 889. [Google Scholar] [CrossRef]
- Silveira, M.V.F.; Petri, C.A.; Broggio, I.S.; et al. Drivers of Fire in the Brazilian Amazon: Recent Trends and Policy Implications. Remote Sens. 2020. [Google Scholar]
- Phillips, O.L.; Aragão, L.E.O.C.; Lewis, S.L.; Fisher, J.B.; Lloyd, J.; López-González, G.; Malhi, Y.; Monteagudo, A.; Peacock, J.; Quesada, C.A.; et al. Drought Sensitivity of the Amazon Rainforest. Science 2009, 323, 1344–1347. [Google Scholar] [CrossRef] [PubMed]
- Alencar, A.A.C.; Arruda, V.L.S.; da Silva, W.V.; Conciani, D.E.; Costa, D.P.; Crusco, N.; Duverger, S.G.; Ferreira, N.C.; Franca-Rocha, W.; Hasenack, H.; et al. Long-Term Landsat-Based Monthly Burned Area Dataset for the Brazilian Biomes Using Deep Learning. Remote. Sens. 2022, 14, 2510. [Google Scholar] [CrossRef]
Figure 1.
Study area with the six Brazilian biomes, and its corresponding land use and land cover classes according to the MapBiomas Collection 6.
Figure 1.
Study area with the six Brazilian biomes, and its corresponding land use and land cover classes according to the MapBiomas Collection 6.
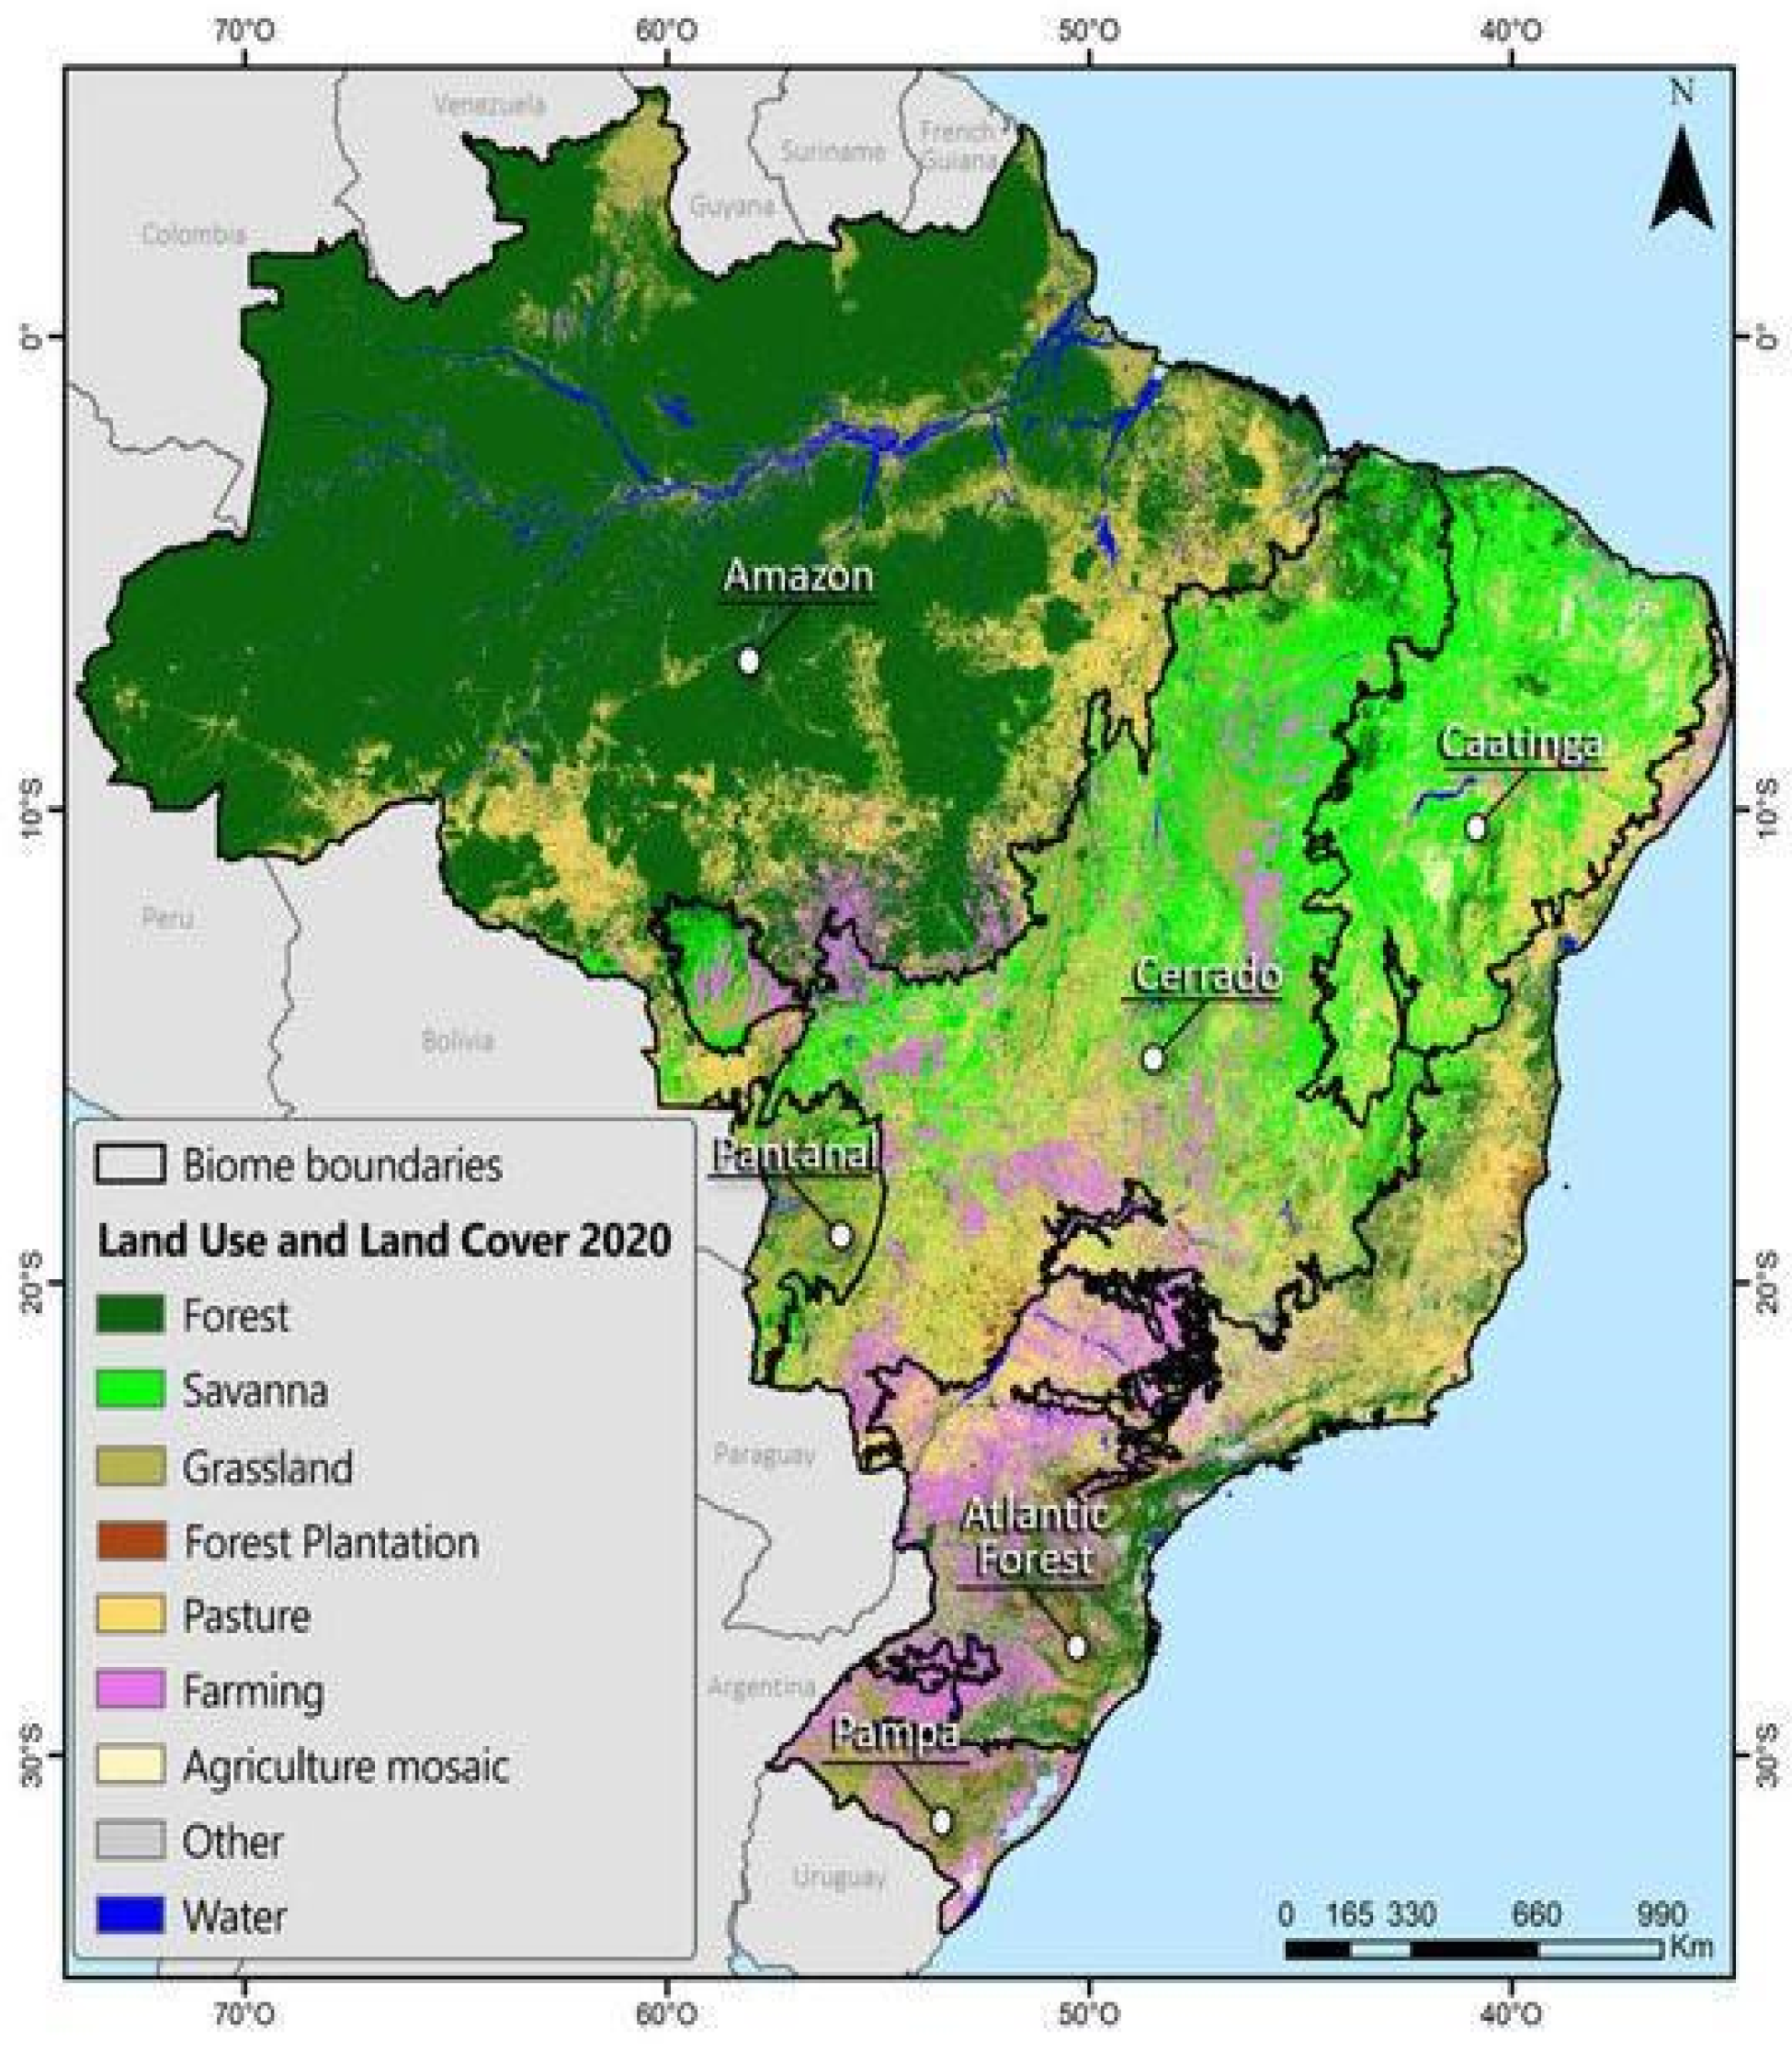
Figure 2.
Average annual precipitation for the period 2001–2022 derived from GPM data.
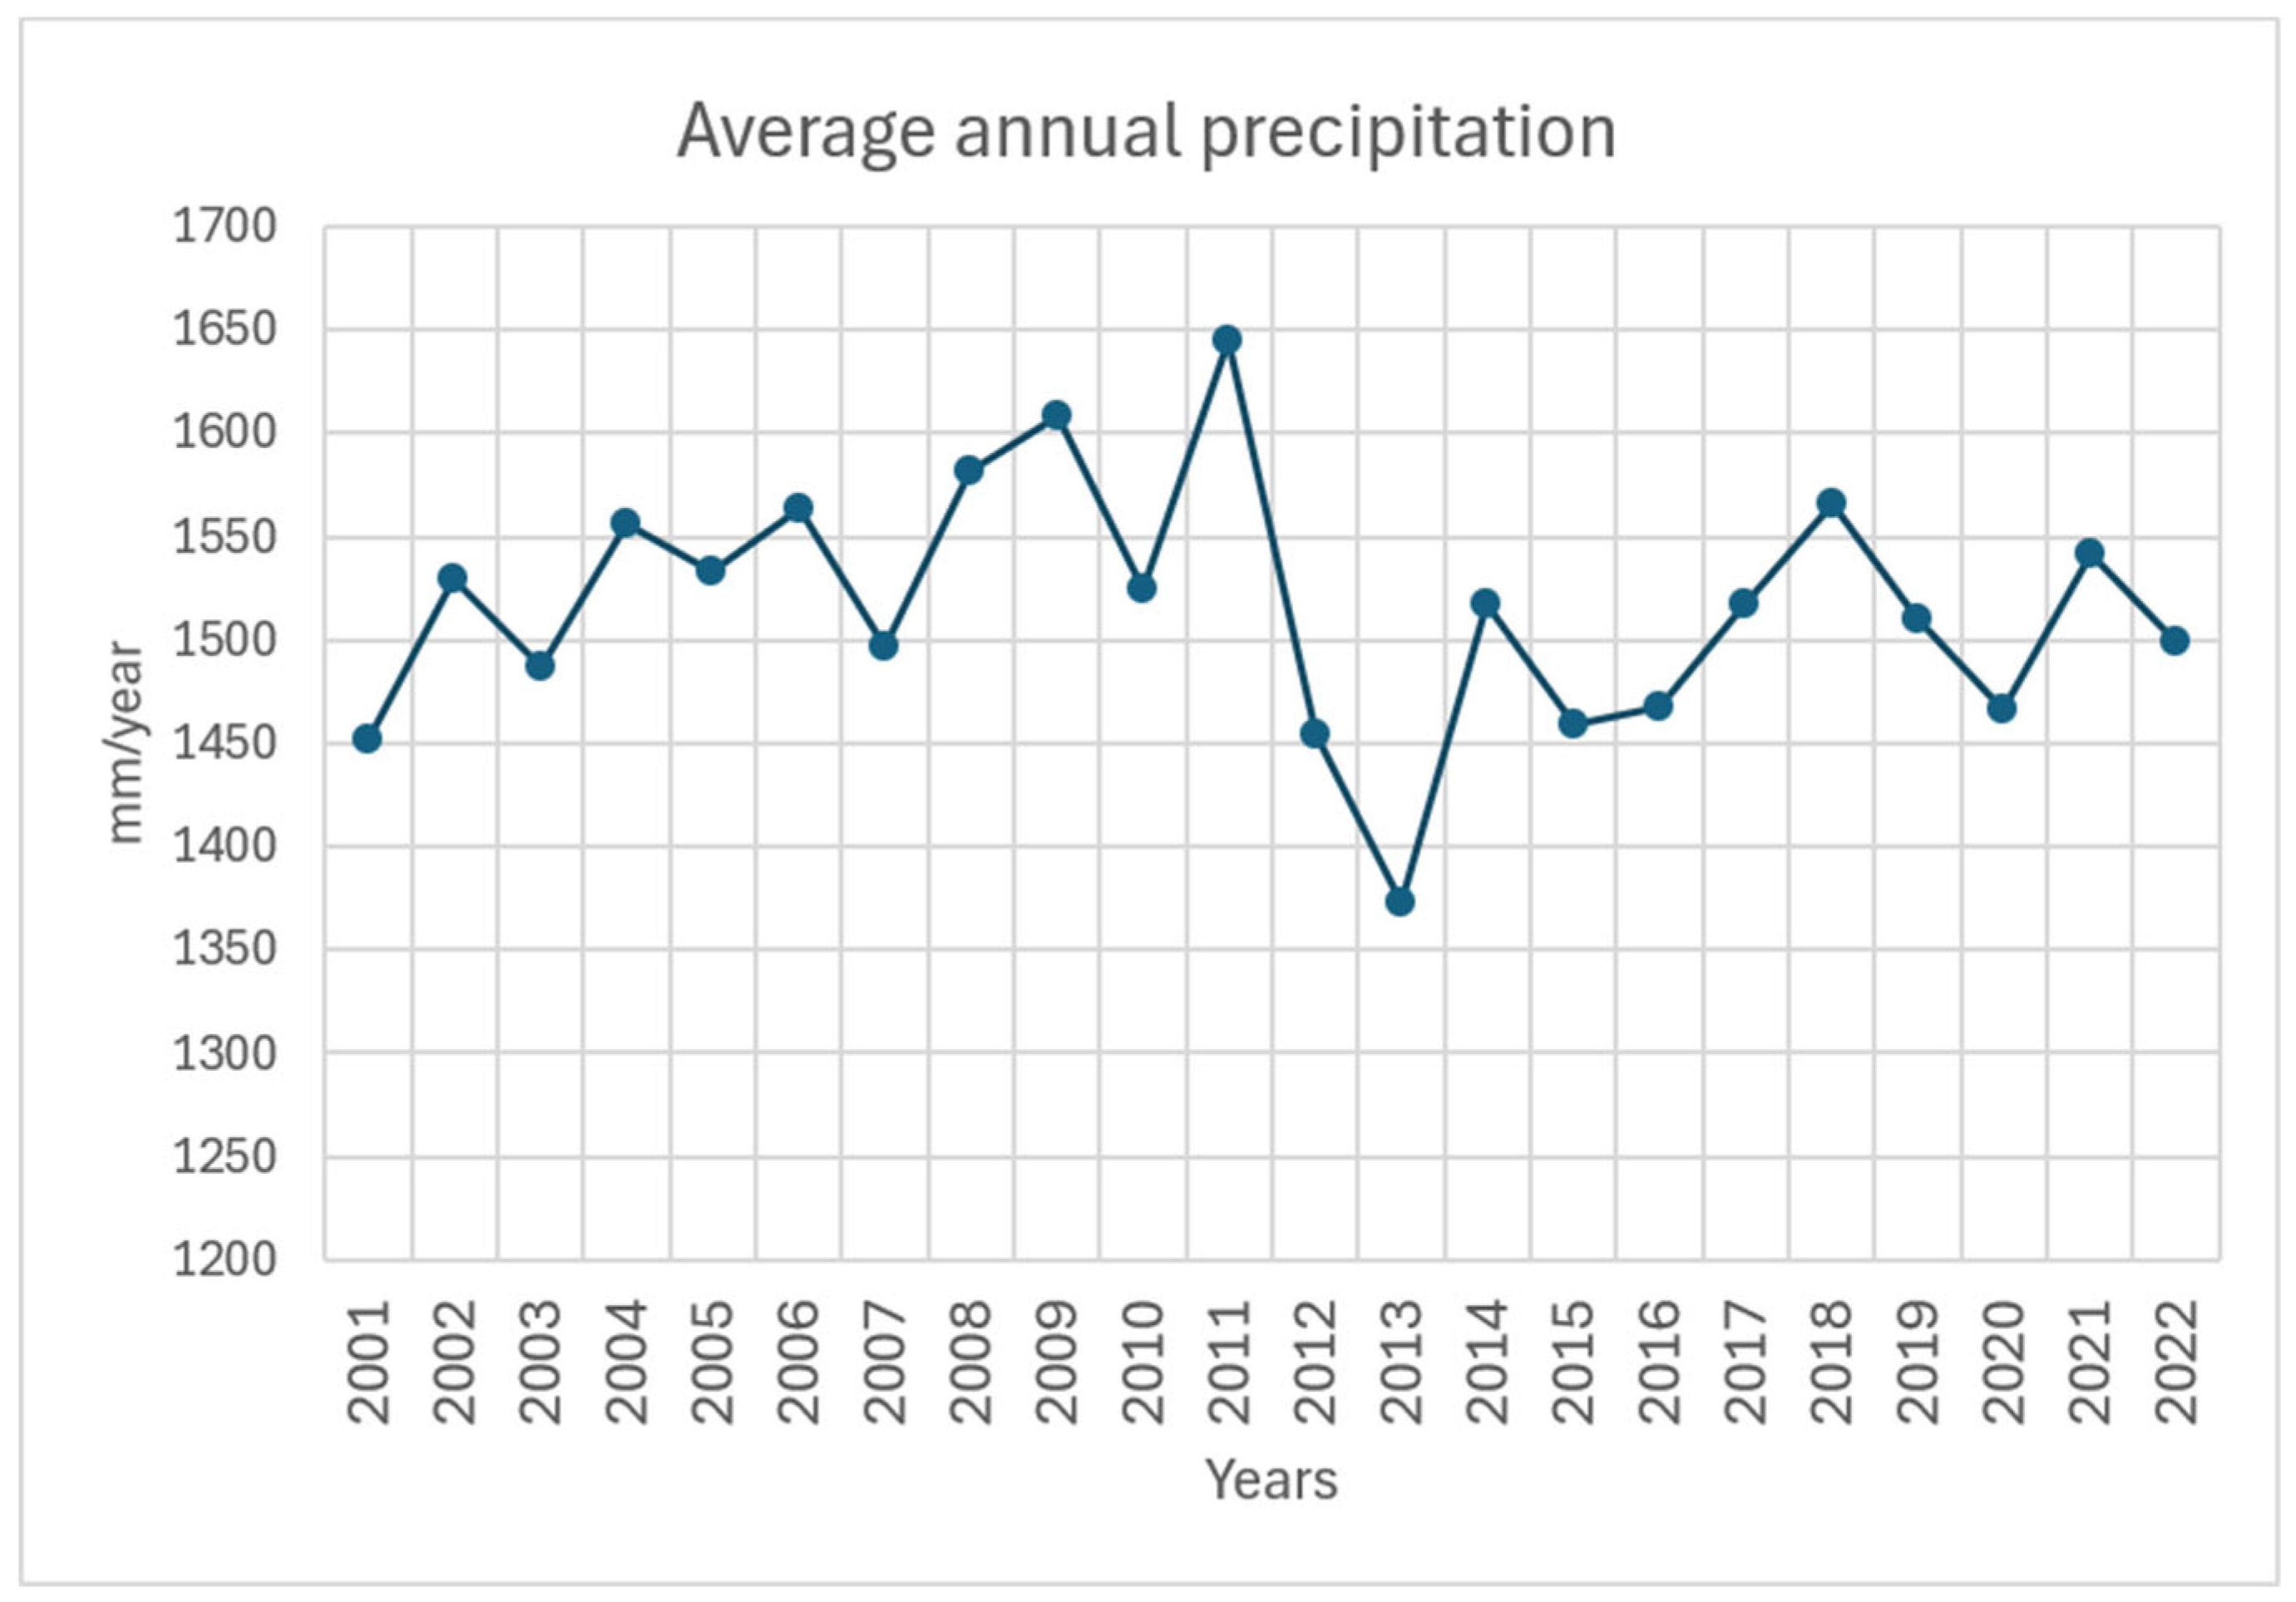
Figure 3.
Spatial distribution of fire activity in August for (a) 2004, (b) 2017 and (c) 2021 from FIRMS overlaid with MapBiomas land-cover classes.
Figure 3.
Spatial distribution of fire activity in August for (a) 2004, (b) 2017 and (c) 2021 from FIRMS overlaid with MapBiomas land-cover classes.
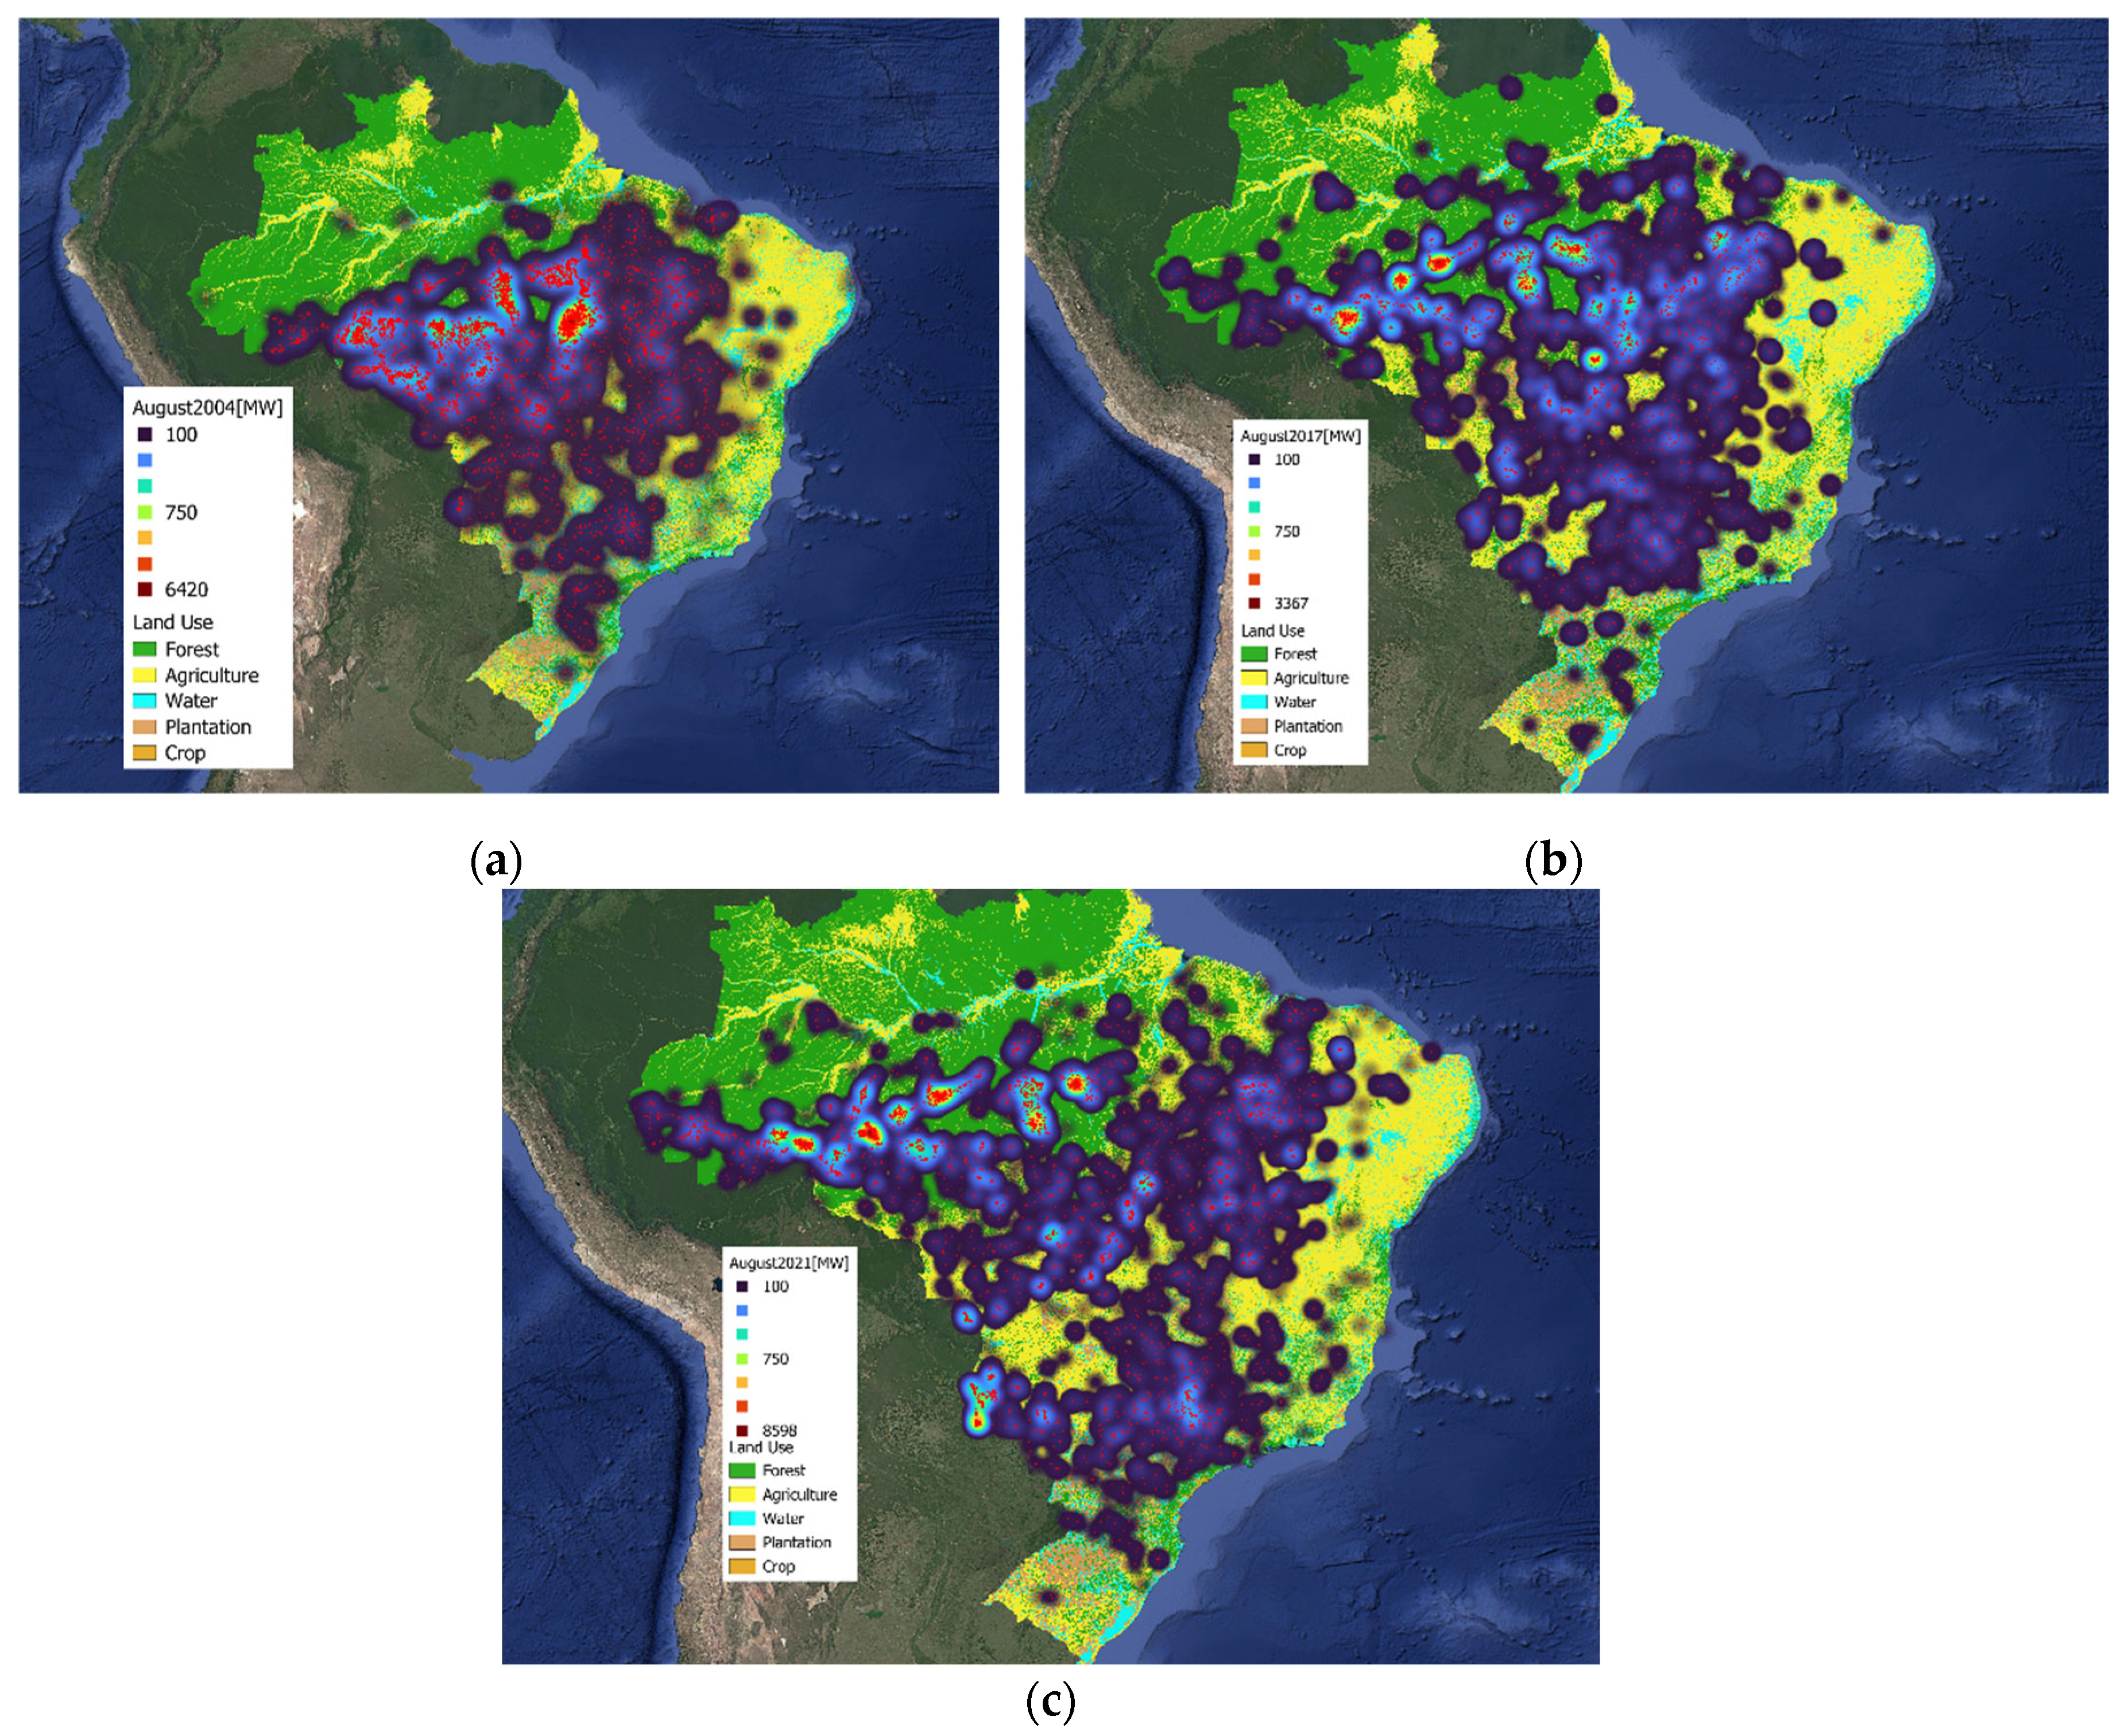
Figure 4.
Spatial distribution of fire activity in October for (a) 2004, (b) 2017 and (c) 2021 from FIRMS overlaid with MapBiomas land-cover classes.
Figure 4.
Spatial distribution of fire activity in October for (a) 2004, (b) 2017 and (c) 2021 from FIRMS overlaid with MapBiomas land-cover classes.
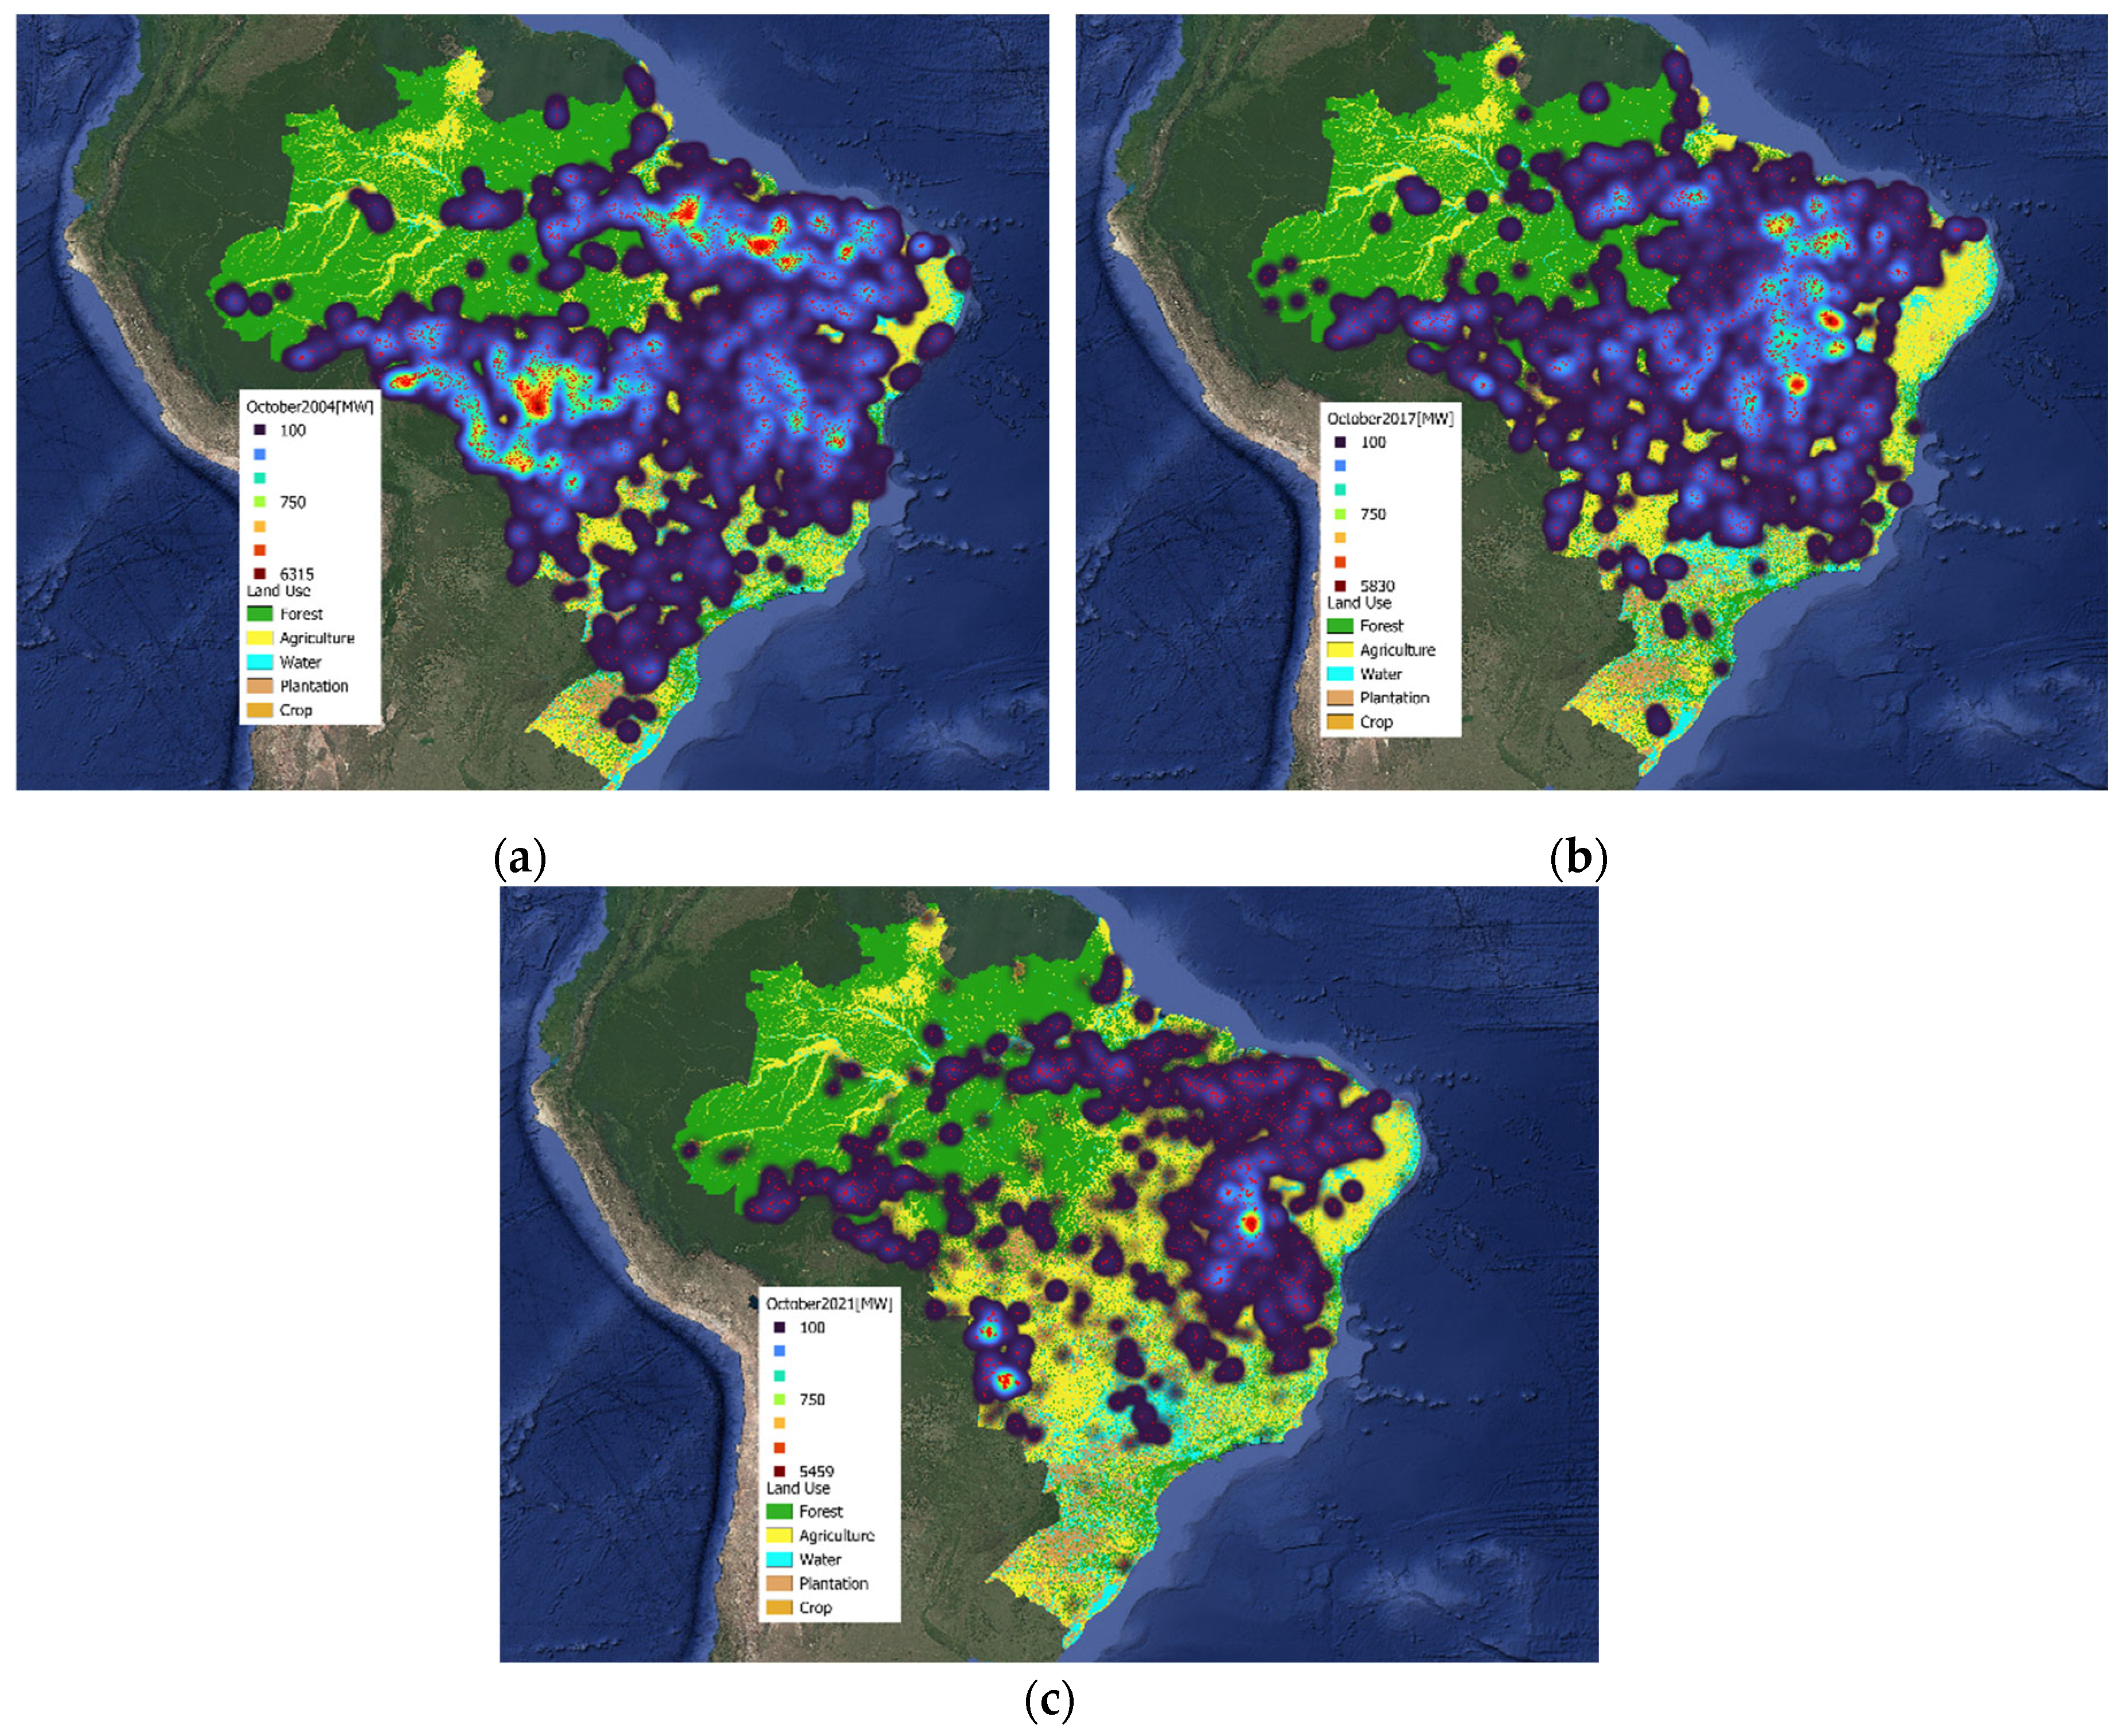
Figure 5.
Spatial distribution of fire activity in December for (a) 2017, (b) 2019 and (c) 2021 from FIRMS overlaid with MapBiomas land-cover classes.
Figure 5.
Spatial distribution of fire activity in December for (a) 2017, (b) 2019 and (c) 2021 from FIRMS overlaid with MapBiomas land-cover classes.
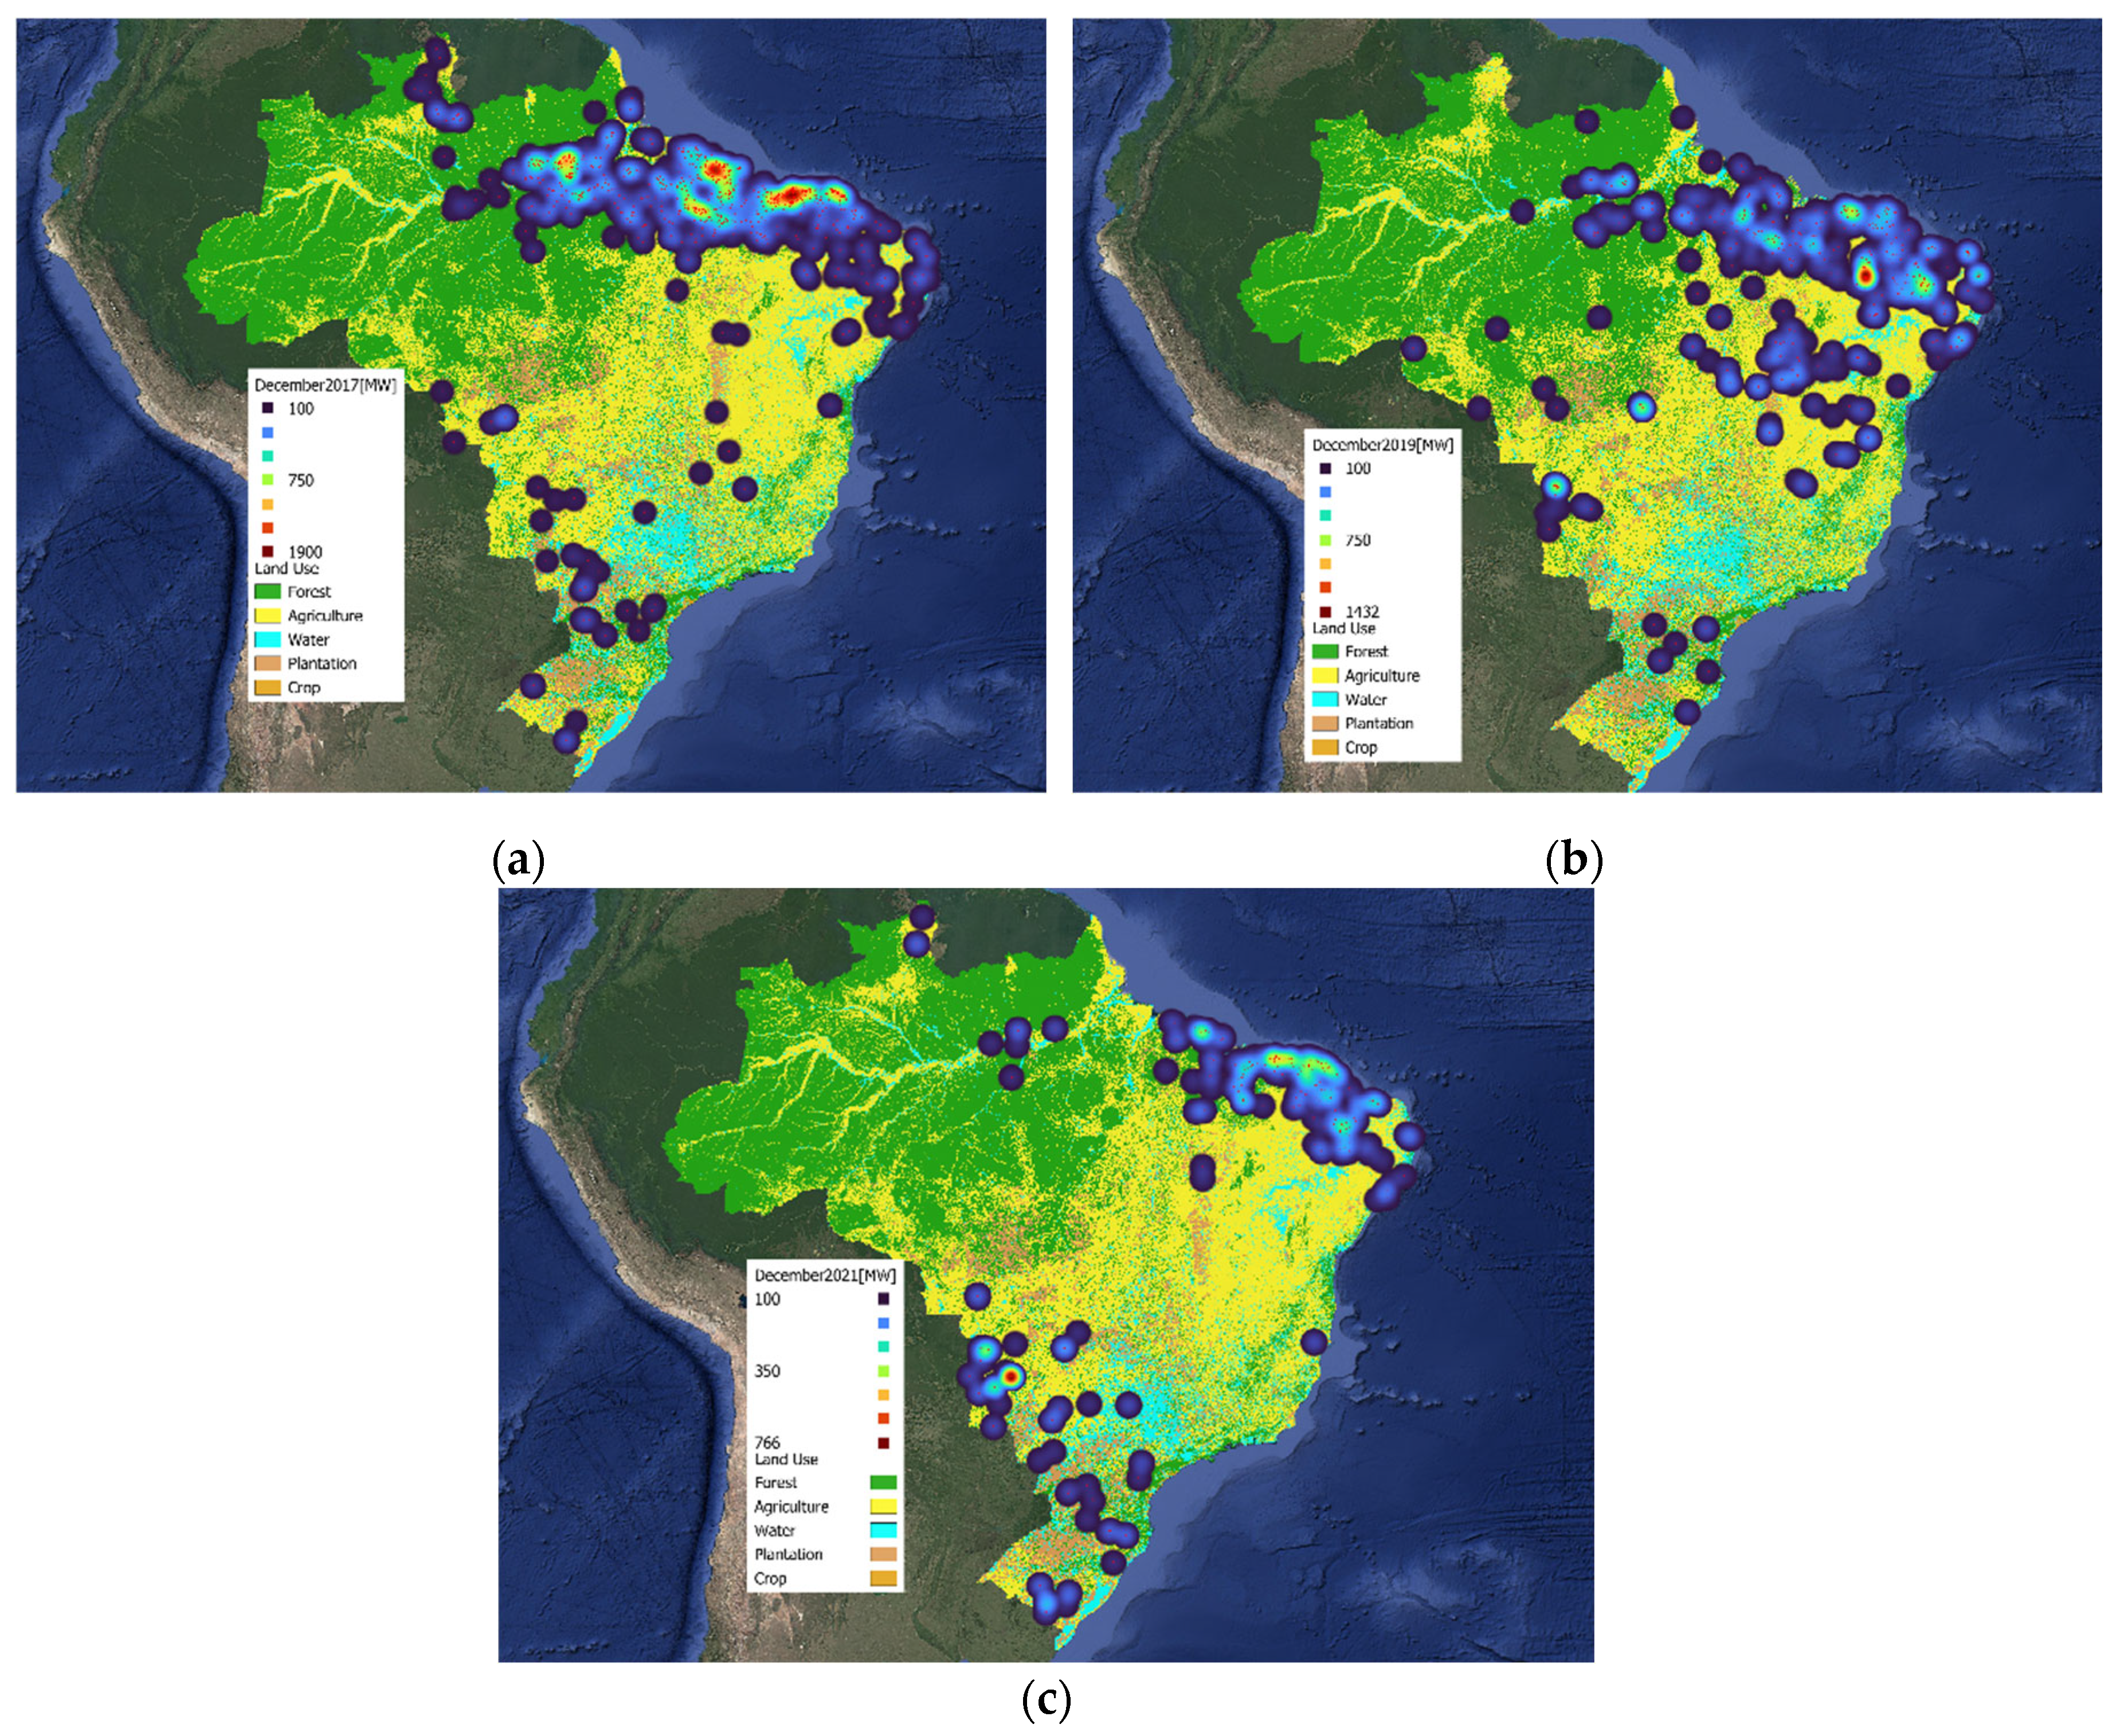
Figure 6.
Trend of yearly maximum FRP and annual mean values of FRP with relative distribution of standard deviation (MODIS)
Figure 6.
Trend of yearly maximum FRP and annual mean values of FRP with relative distribution of standard deviation (MODIS)
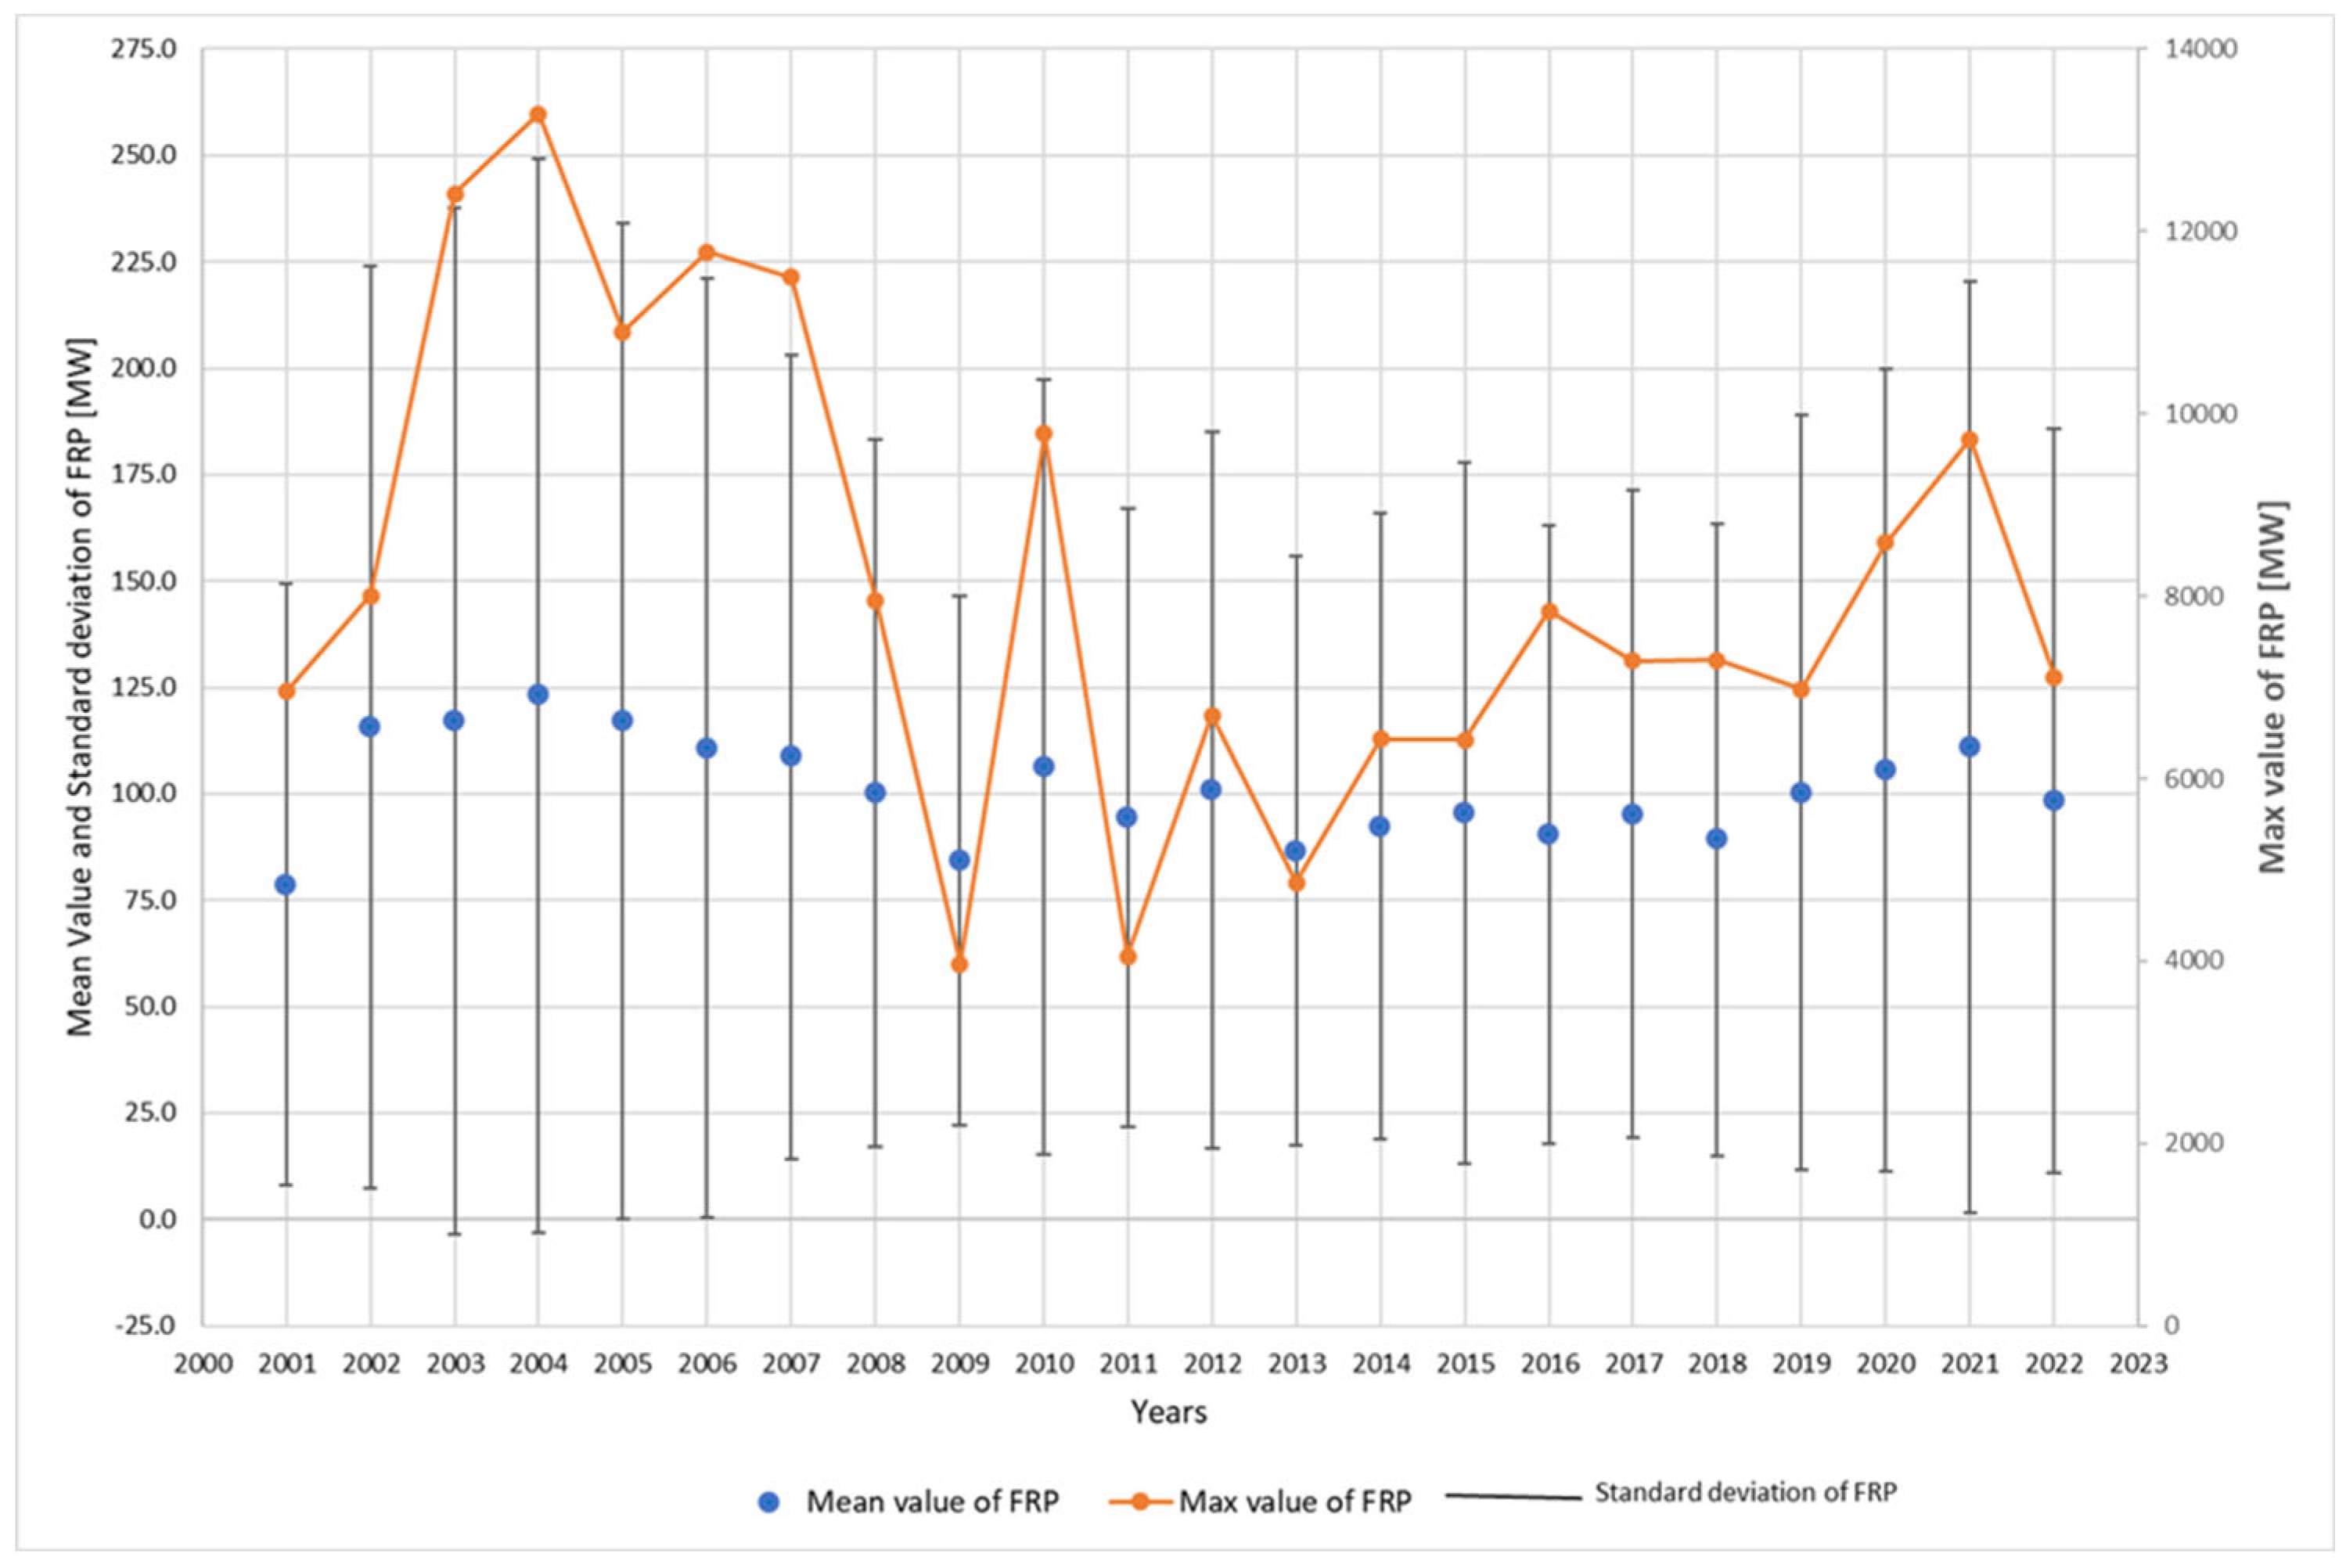
Figure 7.
Trend of yearly maximum FRP and annual mean values of FRP with relative distribution of standard deviation (VIIRS).
Figure 7.
Trend of yearly maximum FRP and annual mean values of FRP with relative distribution of standard deviation (VIIRS).
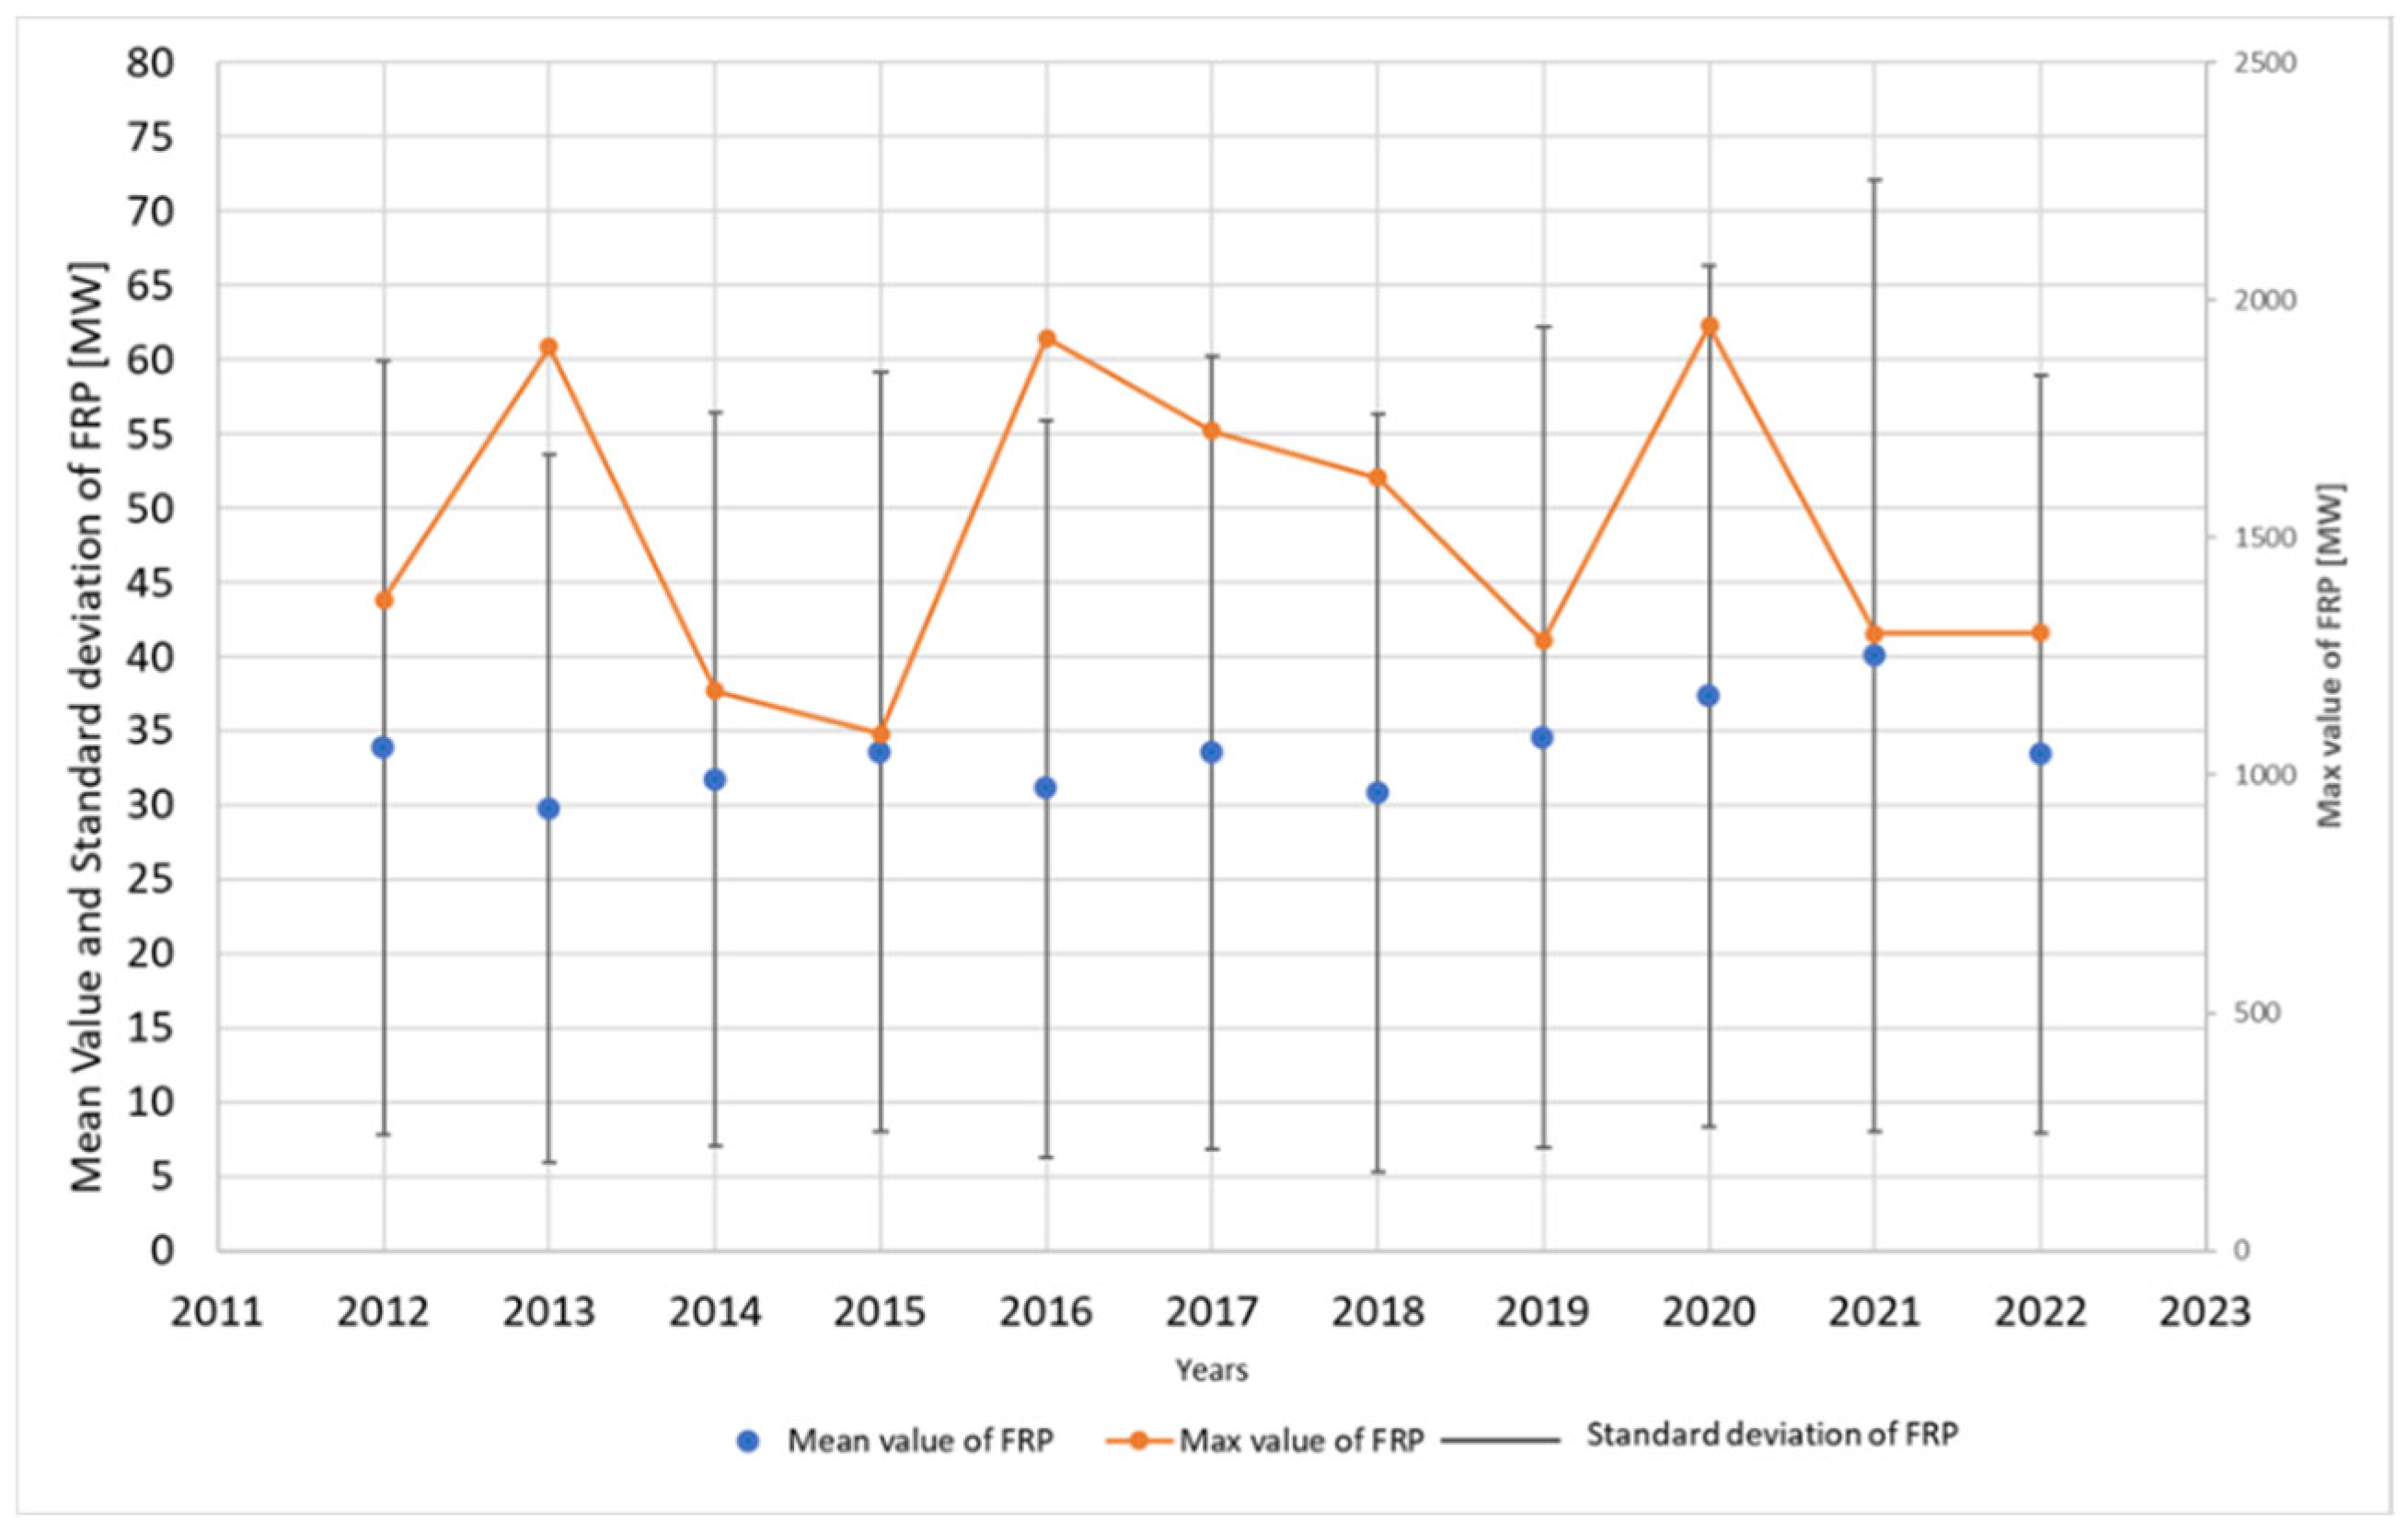
Figure 8.
Comparison of annual cumulative FRP derived from MODIS and VIIRS observations over the study area during the period 2012–2022.
Figure 8.
Comparison of annual cumulative FRP derived from MODIS and VIIRS observations over the study area during the period 2012–2022.
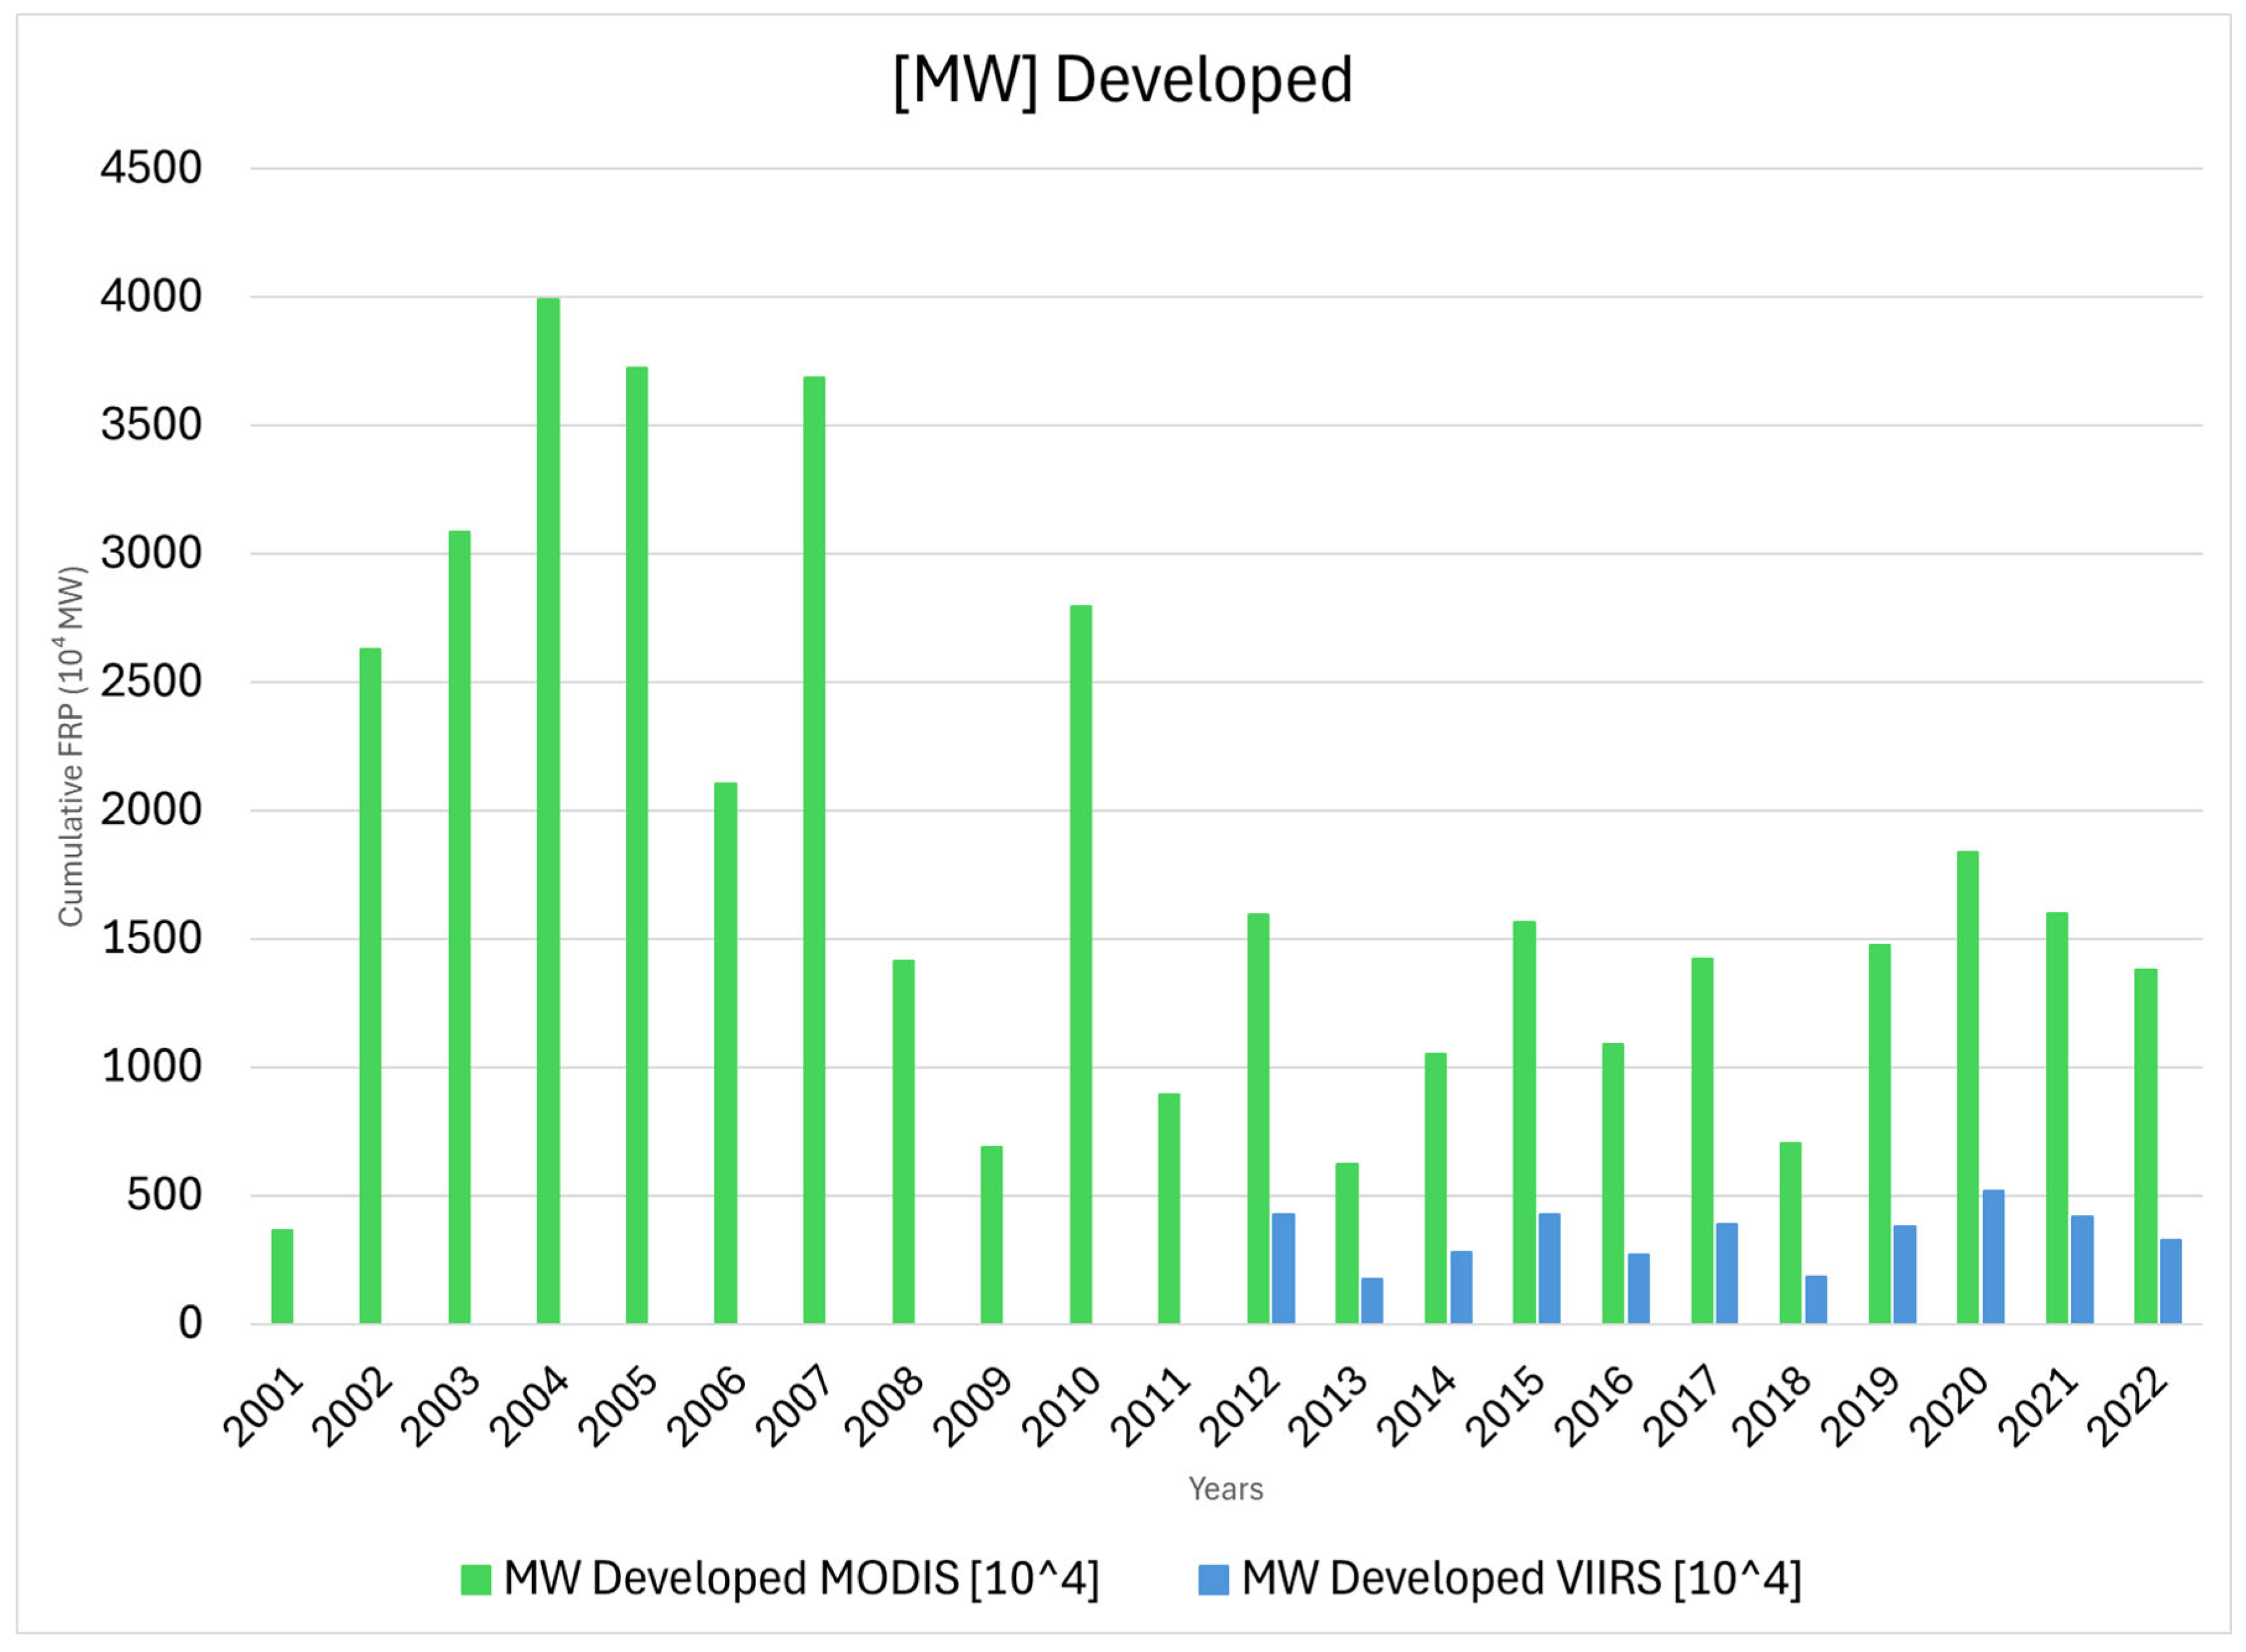
Figure 9.
Interannual variability in the number of fire events detected by MODIS and VIIRS from 2012 to 2022.
Figure 9.
Interannual variability in the number of fire events detected by MODIS and VIIRS from 2012 to 2022.
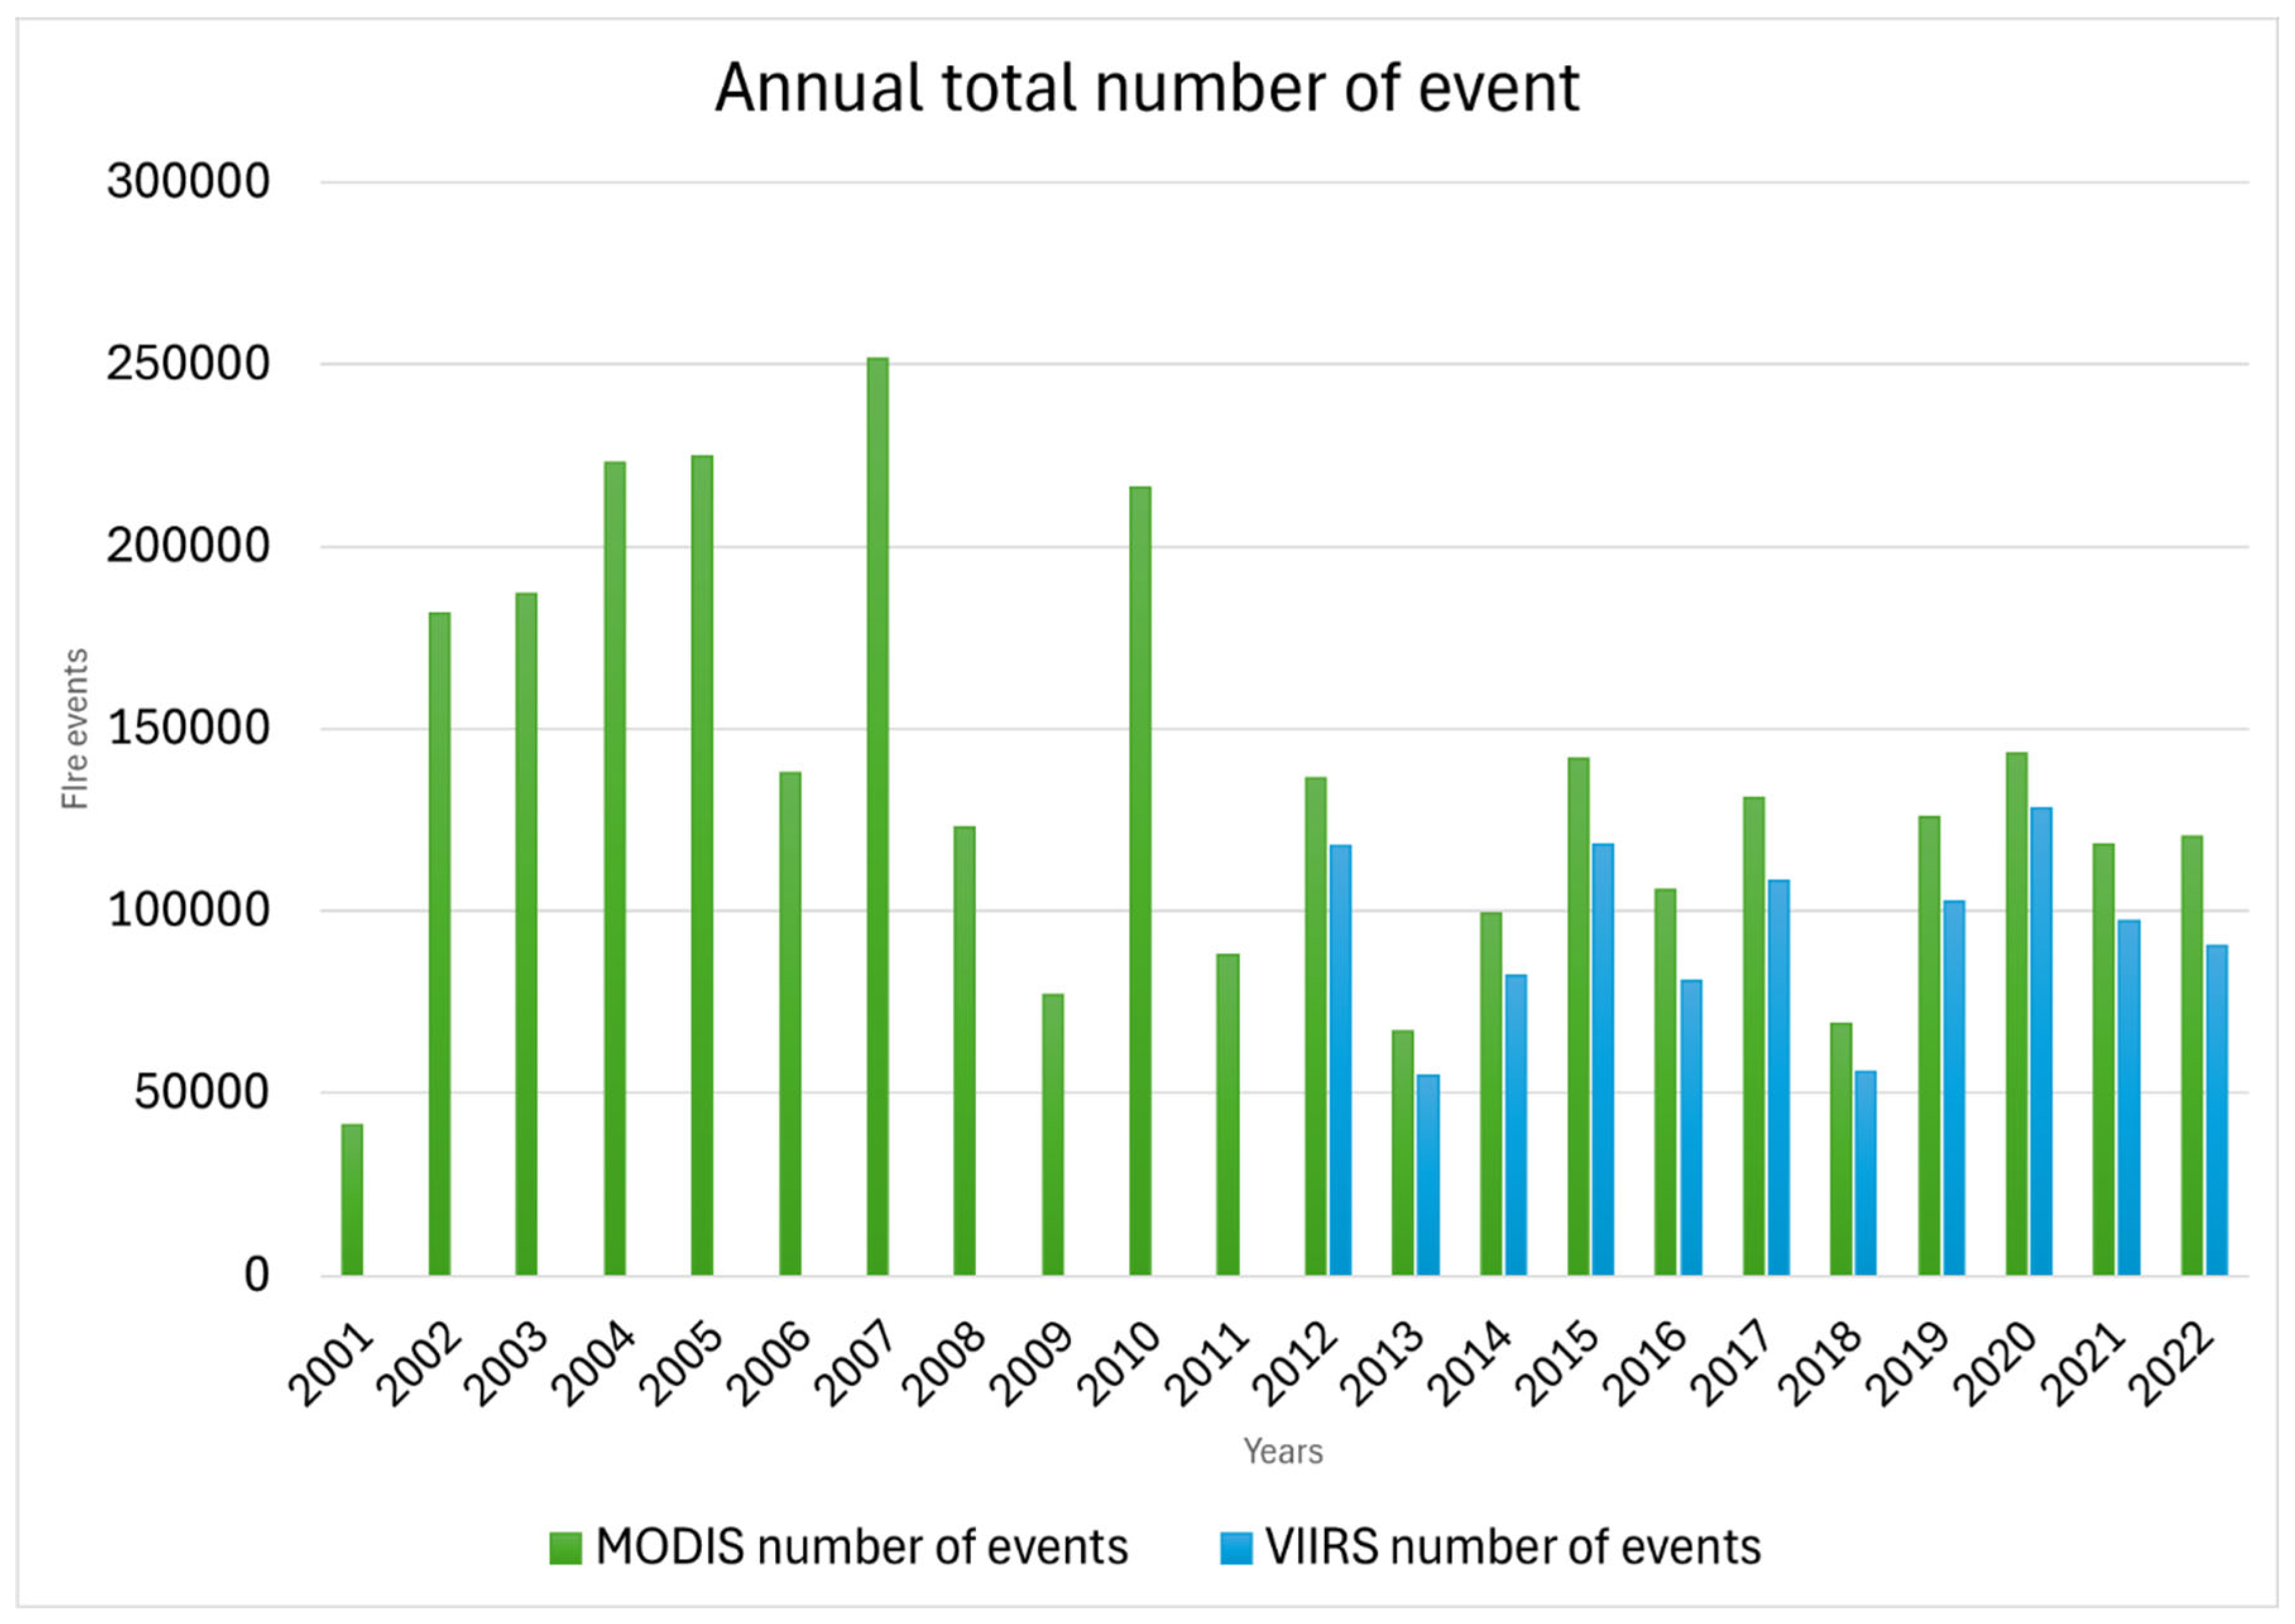
Figure 10.
Comparison between annual precipitation (left y axis) and maximum Fire Radiative Power (FRP) values (right axis) derived from MODIS (2001–2022) and VIIRS (2013–2022).
Figure 10.
Comparison between annual precipitation (left y axis) and maximum Fire Radiative Power (FRP) values (right axis) derived from MODIS (2001–2022) and VIIRS (2013–2022).
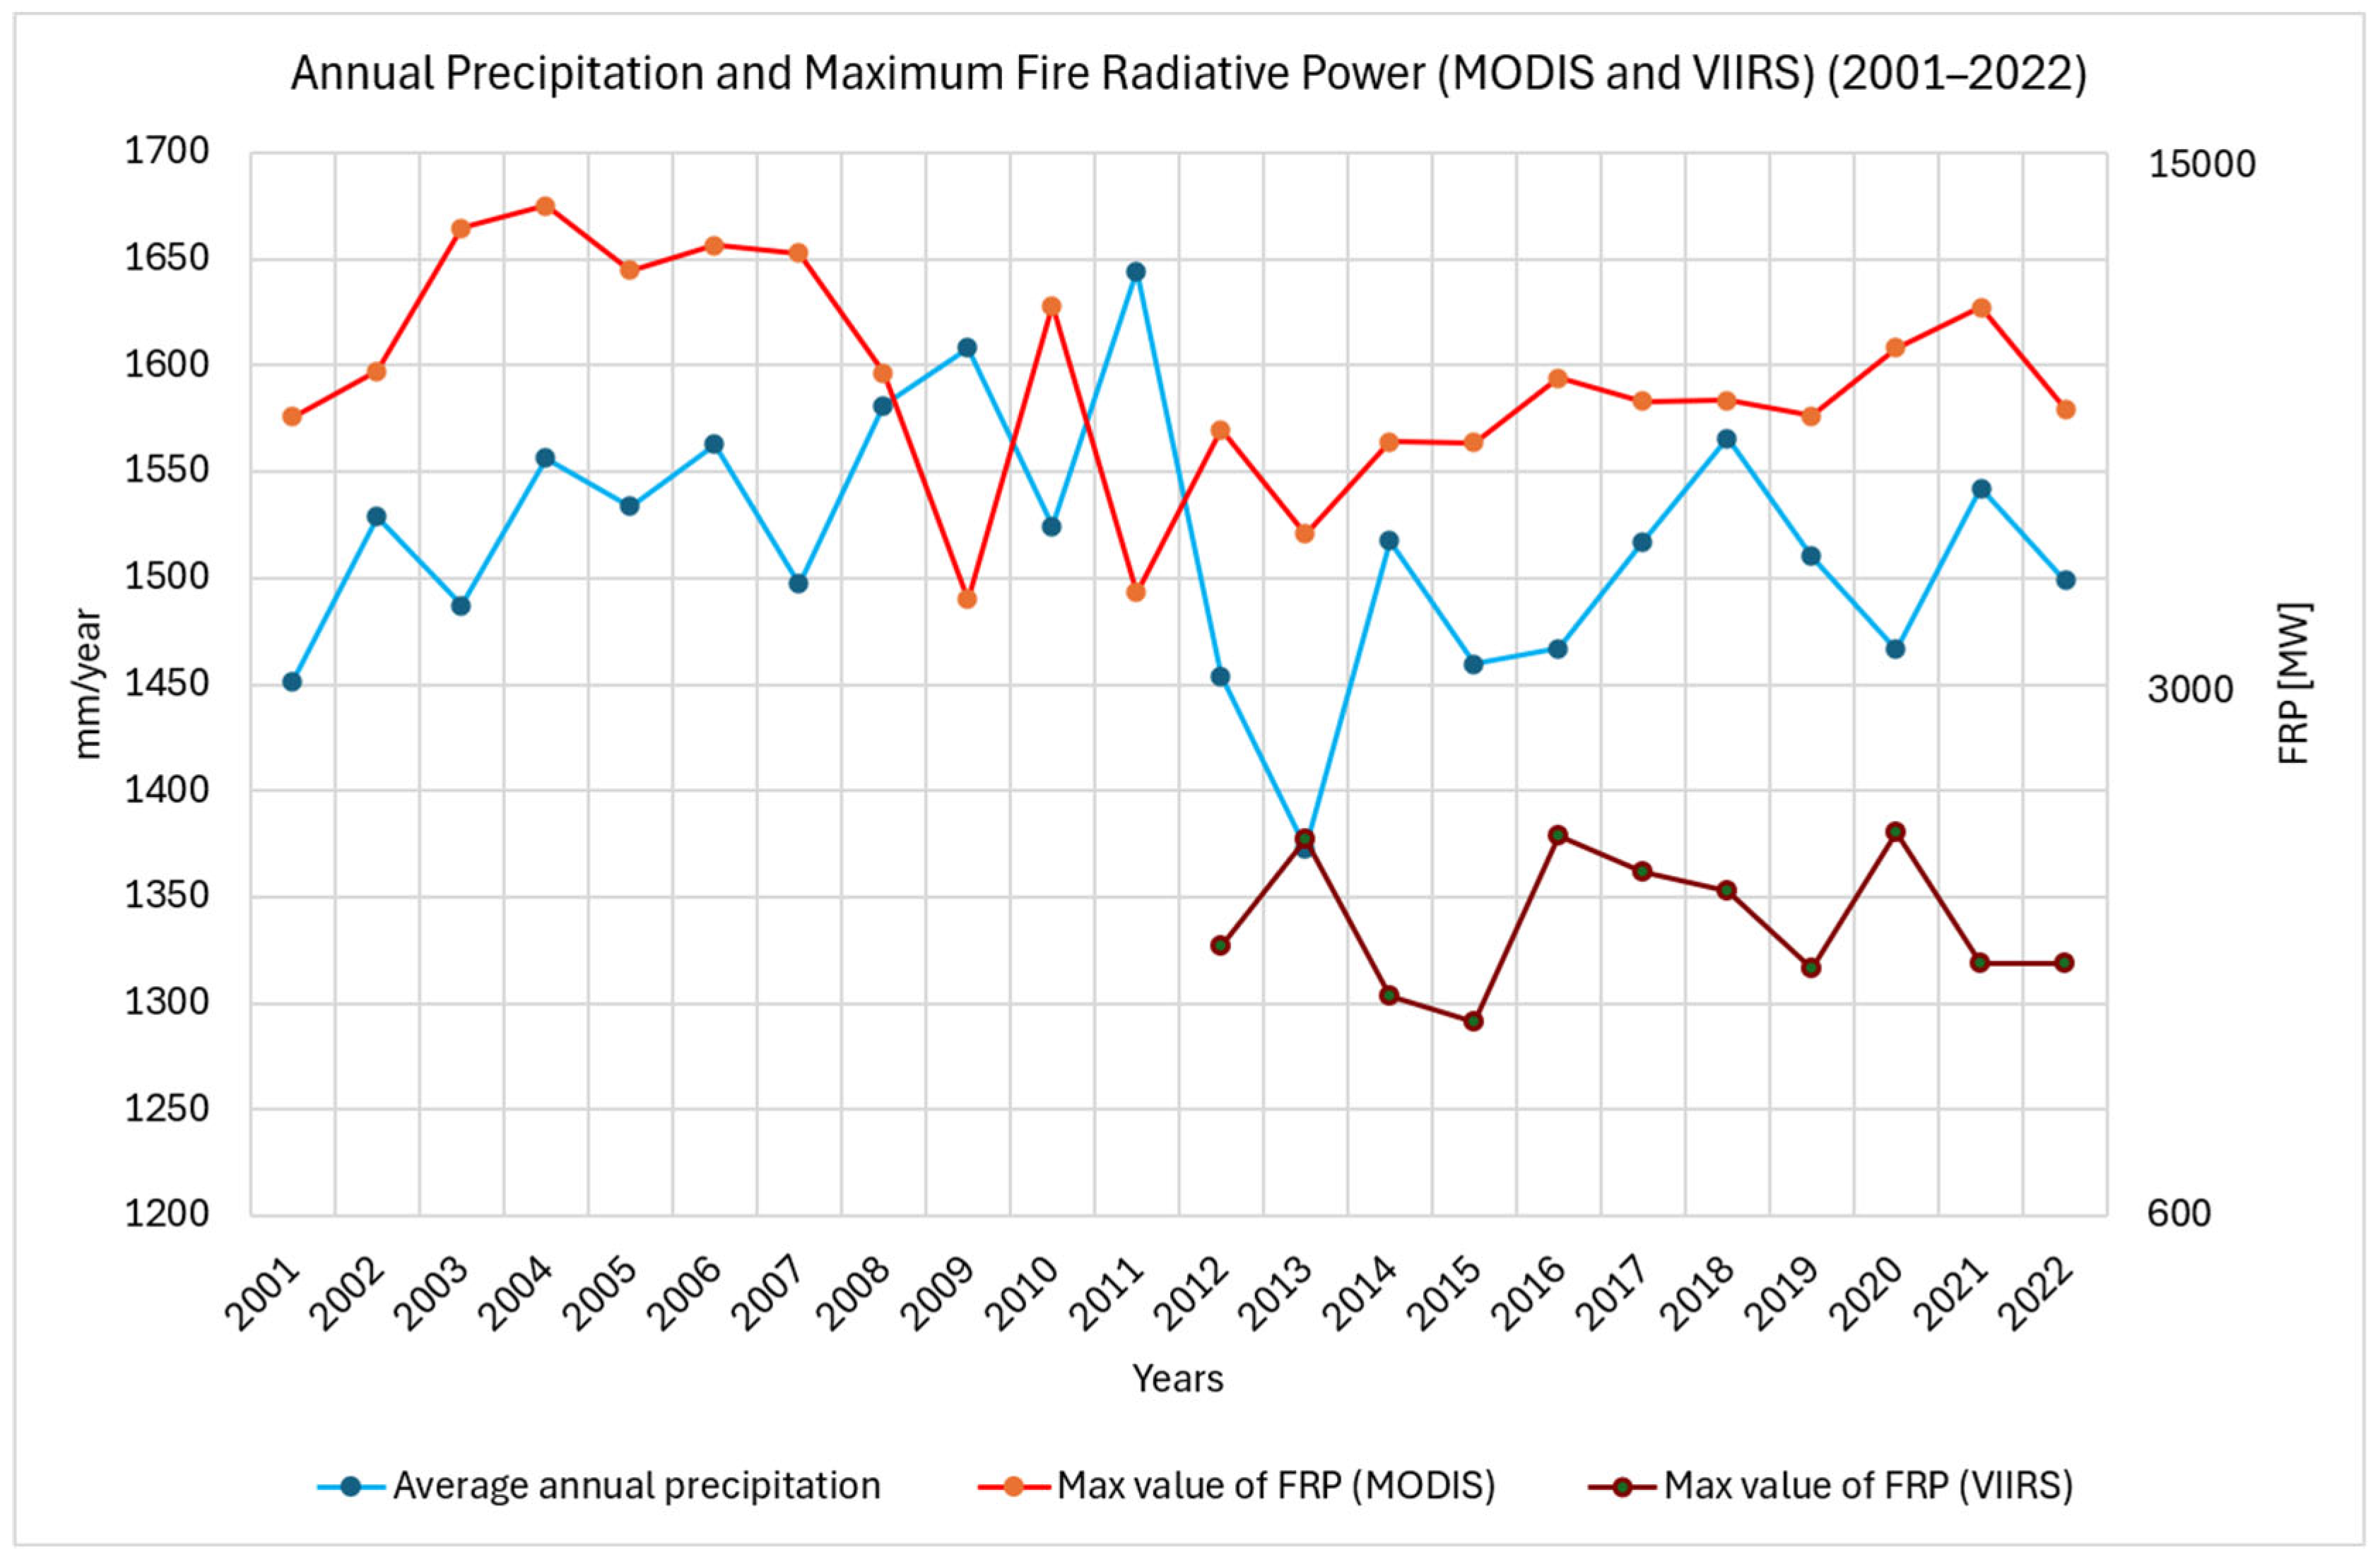
Figure 11.
Annual precipitation (left axis) compared with the total number of fire events detected by MODIS (2001–2022) and VIIRS (2013–2022).
Figure 11.
Annual precipitation (left axis) compared with the total number of fire events detected by MODIS (2001–2022) and VIIRS (2013–2022).
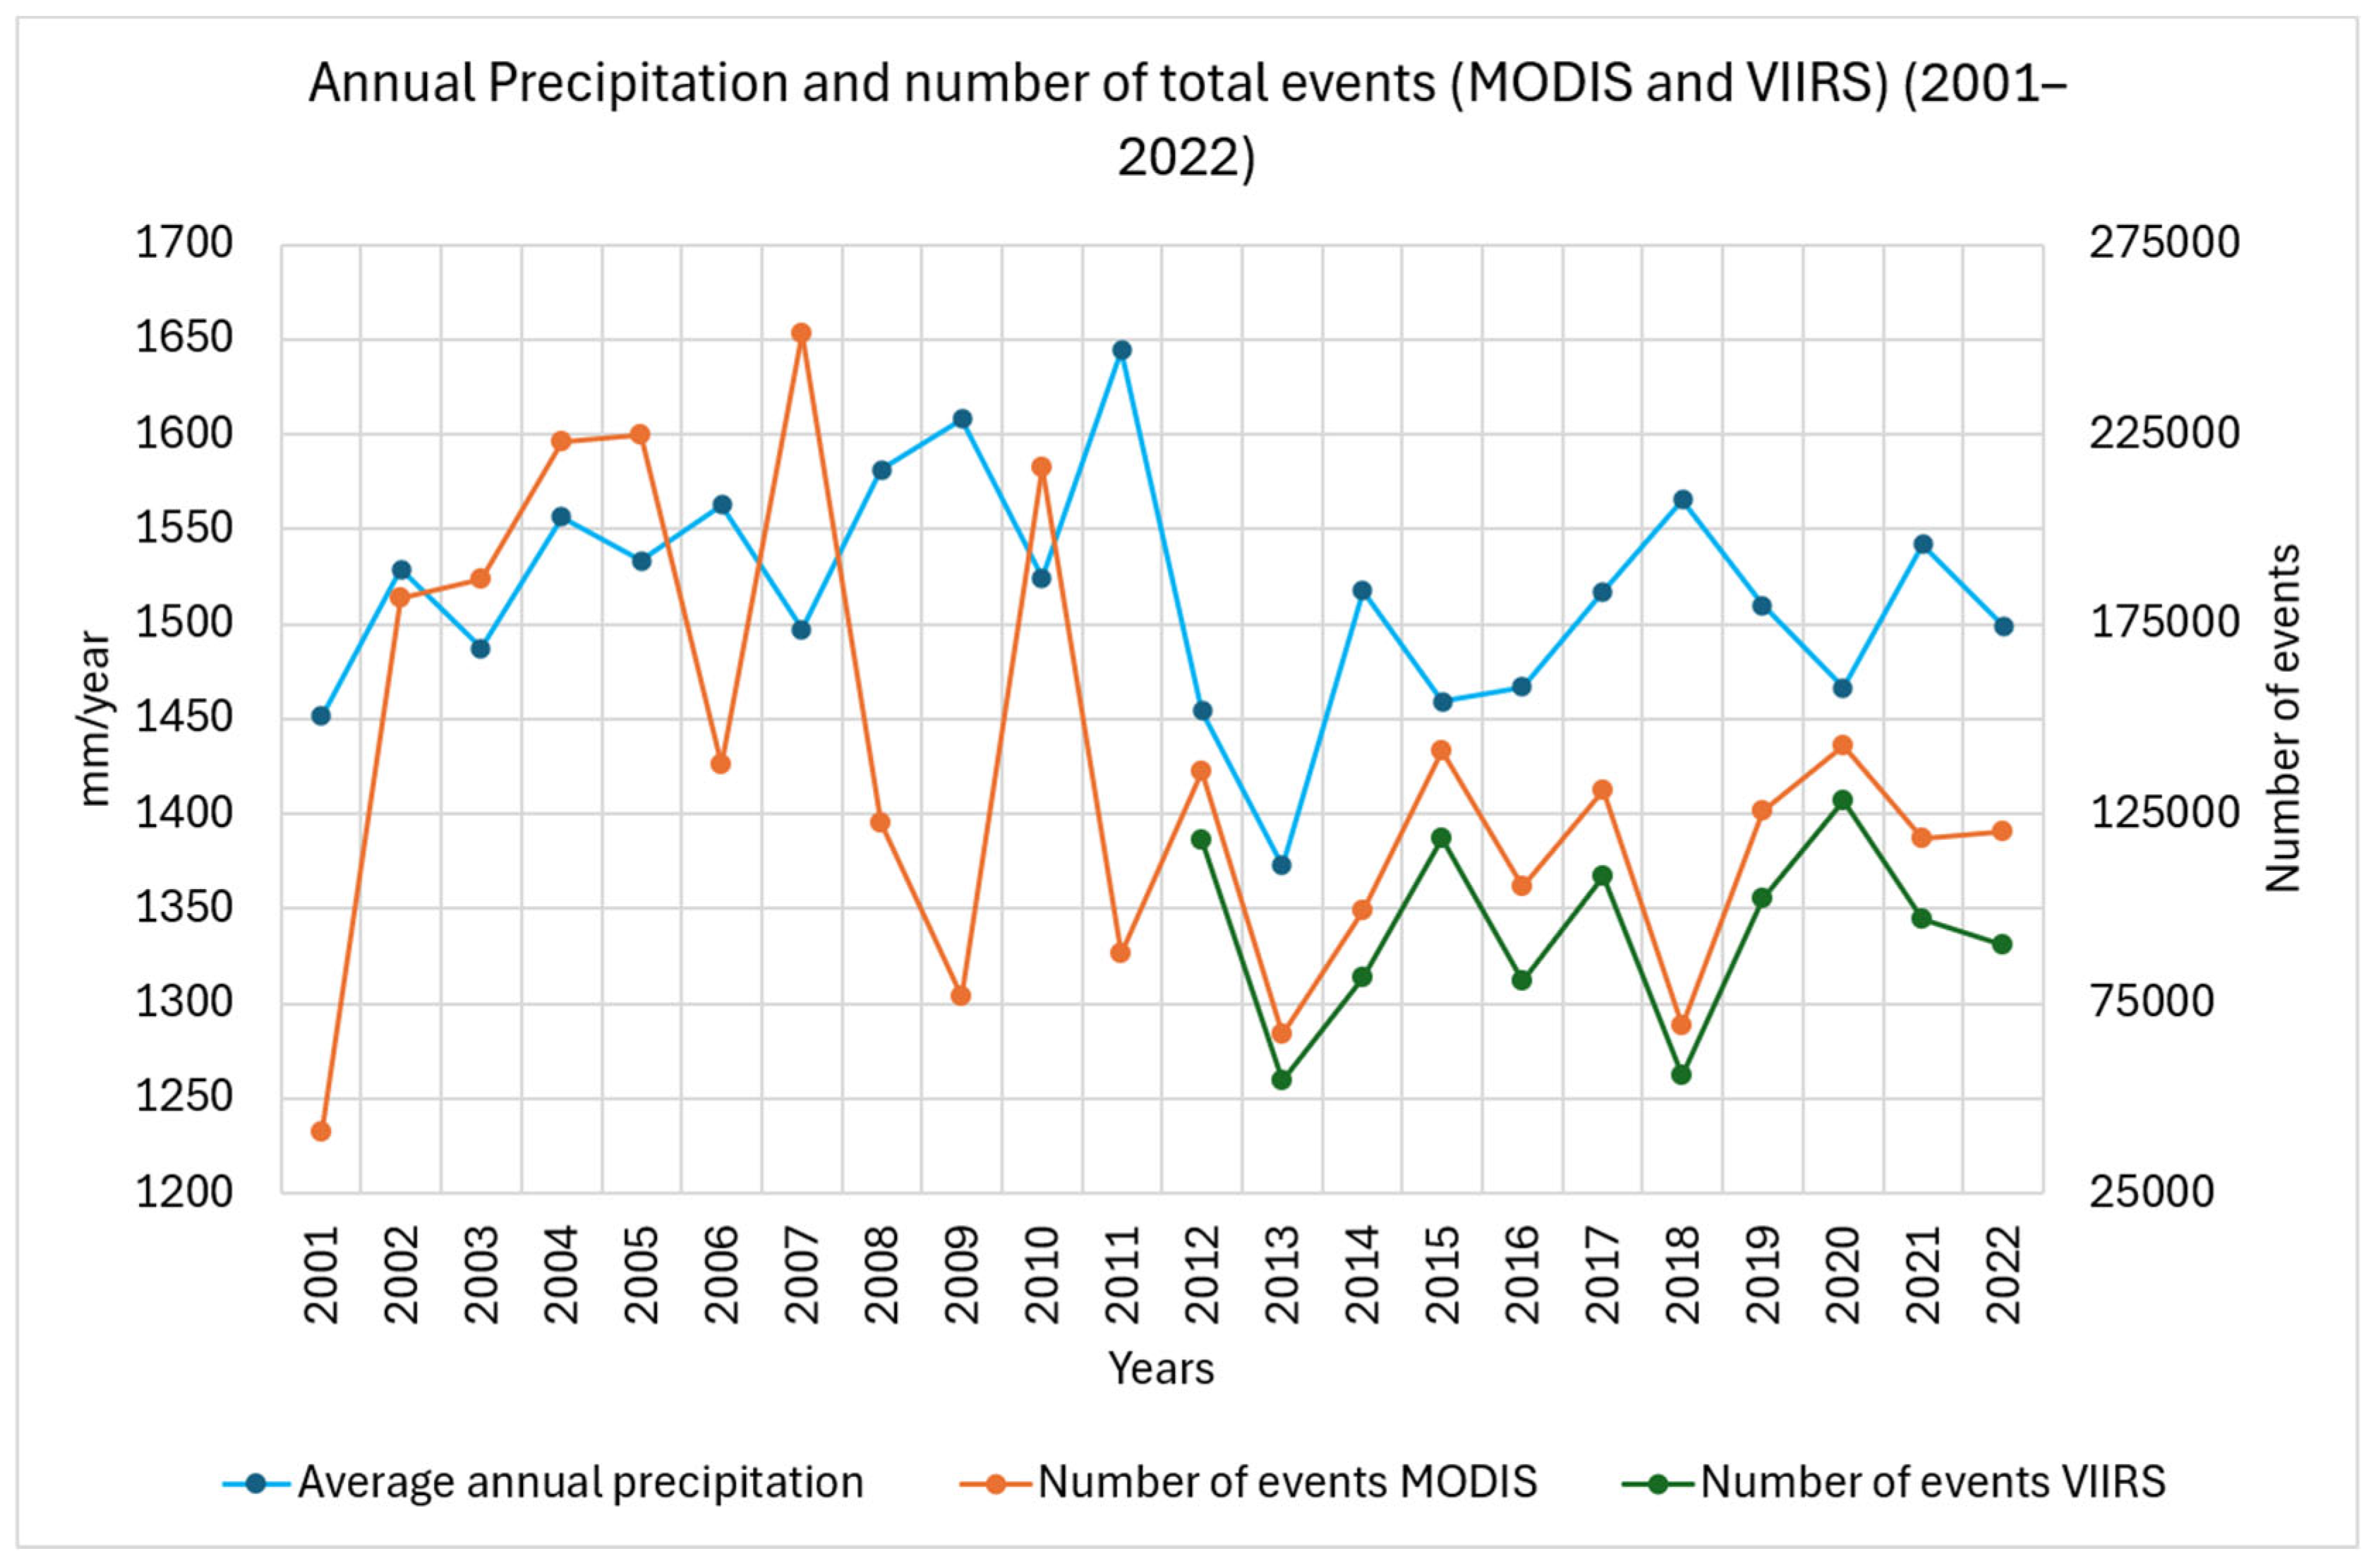

Table 1.
Time Periods analysed for each platform/sensor.
| Platform | Sensor | Launched | Data analysed |
| Terra | MODIS | 18/12/1999 | 01/01/2001 – 31/12/2022 |
| Aqua | MODIS | 04/05/2002 | 01/01/2001 – 31/12/2022 |
| SUOMI-NPP | VIIRS | 28/10/2011 | 01/01/2012 – 31/12/2022 |
Table 2.
Yearly number of fire events for each fire radiative power (FRP) class and the cumulative FRP (last column) for MODIS retrieval over the study area from 2001 to 2022.
Table 2.
Yearly number of fire events for each fire radiative power (FRP) class and the cumulative FRP (last column) for MODIS retrieval over the study area from 2001 to 2022.
| Years | Number of events | FRP classes | MW developed | |||||||||
|---|---|---|---|---|---|---|---|---|---|---|---|---|
| 0÷10 | 10÷20 | 20÷50 | 50÷80 | 80÷100 | 100÷200 | 200÷300 | 300÷700 | 700÷1000 | 1000÷MAX | [10^4] | ||
| 2001 | 41062 | 659 | 6604 | 16479 | 6730 | 2470 | 5311 | 1488 | 1224 | 143 | 122 | 364 |
| 2002 | 181656 | 1313 | 15887 | 65627 | 33040 | 13215 | 29819 | 10127 | 9808 | 1590 | 1871 | 2630 |
| 2003 | 186966 | 1154 | 16265 | 60164 | 34029 | 13640 | 30637 | 10369 | 9726 | 1634 | 1990 | 3086 |
| 2004 | 222935 | 1348 | 18870 | 79037 | 40313 | 16347 | 37470 | 12830 | 12632 | 2166 | 2701 | 3991 |
| 2005 | 224859 | 1963 | 20735 | 79934 | 40333 | 16221 | 37123 | 12833 | 12190 | 2003 | 2310 | 3723 |
| 2006 | 137997 | 970 | 11664 | 51592 | 25162 | 10194 | 22452 | 7233 | 6950 | 1062 | 1194 | 2103 |
| 2007 | 251476 | 2005 | 22479 | 90104 | 46330 | 18757 | 42099 | 14026 | 12761 | 1931 | 1873 | 3688 |
| 2008 | 122735 | 927 | 10340 | 46119 | 23083 | 9307 | 20242 | 6389 | 5343 | 726 | 647 | 1415 |
| 2009 | 76762 | 614 | 7065 | 32105 | 14524 | 5418 | 11280 | 3110 | 2420 | 316 | 211 | 688 |
| 2010 | 216295 | 1769 | 19101 | 77804 | 40343 | 16091 | 36408 | 12024 | 10732 | 1511 | 1355 | 2797 |
| 2011 | 88097 | 499 | 7758 | 34468 | 16765 | 6381 | 13872 | 4294 | 3531 | 465 | 361 | 893 |
| 2012 | 136253 | 1280 | 12509 | 50696 | 25442 | 9956 | 21986 | 7067 | 6086 | 897 | 780 | 1594 |
| 2013 | 66749 | 460 | 6195 | 27543 | 12811 | 4779 | 9790 | 2772 | 2133 | 292 | 229 | 621 |
| 2014 | 99431 | 783 | 9297 | 39124 | 18592 | 7294 | 15348 | 4628 | 3805 | 479 | 418 | 1051 |
| 2015 | 141753 | 2543 | 16346 | 53021 | 24966 | 9924 | 21145 | 6882 | 5894 | 864 | 755 | 1568 |
| 2016 | 105708 | 1359 | 11183 | 41269 | 19256 | 7416 | 15939 | 4708 | 4049 | 504 | 415 | 1091 |
| 2017 | 131240 | 1654 | 13637 | 48945 | 24027 | 9457 | 20684 | 6464 | 5599 | 729 | 540 | 1421 |
| 2018 | 69022 | 709 | 7222 | 27692 | 12580 | 4802 | 10158 | 3115 | 2418 | 330 | 274 | 702 |
| 2019 | 125854 | 1614 | 13572 | 46354 | 23025 | 8889 | 19505 | 6236 | 5522 | 831 | 807 | 1475 |
| 2020 | 143037 | 1627 | 14819 | 51368 | 25997 | 10446 | 22650 | 7595 | 7003 | 1042 | 1059 | 1836 |
| 2021 | 118365 | 1402 | 11887 | 42508 | 20950 | 8462 | 18926 | 6511 | 6219 | 914 | 1010 | 1598 |
| 2022 | 120335 | 1249 | 12927 | 45473 | 21992 | 8627 | 18173 | 5665 | 5074 | 756 | 756 | 1382 |
Table 3.
- Yearly number of fire events for each fire radiative power (FRP) class and the cumulative FRP (last column) for VIIRS retrievals over the study area from 2012 to 2022.
Table 3.
- Yearly number of fire events for each fire radiative power (FRP) class and the cumulative FRP (last column) for VIIRS retrievals over the study area from 2012 to 2022.
| Years | Number of events | FRP classes | MW developed | |||||||||
|---|---|---|---|---|---|---|---|---|---|---|---|---|
| 0÷10 | 10÷20 | 20÷50 | 50÷80 | 80÷100 | 100÷200 | 200÷300 | 300÷700 | 700÷1000 | 1000÷MAX | [10^4] | ||
| 2012 | 117847 | 23836 | 44270 | 31582 | 7152 | 2874 | 5880 | 1541 | 769 | 33 | 5 | 429 |
| 2013 | 54678 | 11775 | 21874 | 14398 | 2756 | 1052 | 2101 | 501 | 260 | 9 | 5 | 175 |
| 2014 | 82053 | 17191 | 31840 | 21798 | 4546 | 1756 | 3545 | 949 | 465 | 20 | 5 | 280 |
| 2015 | 118305 | 22929 | 45044 | 32187 | 7479 | 2777 | 5672 | 1536 | 722 | 33 | 5 | 428 |
| 2016 | 80778 | 16987 | 31734 | 21246 | 4526 | 1669 | 3428 | 791 | 426 | 17 | 13 | 270 |
| 2017 | 108370 | 21254 | 41429 | 29561 | 6667 | 2430 | 4997 | 1374 | 684 | 44 | 9 | 390 |
| 2018 | 55931 | 11847 | 22256 | 14699 | 3046 | 1062 | 2141 | 569 | 339 | 14 | 8 | 185 |
| 2019 | 102466 | 20236 | 38319 | 28191 | 6261 | 2380 | 4991 | 1342 | 787 | 44 | 7 | 380 |
| 2020 | 128228 | 23243 | 45601 | 36585 | 9050 | 3447 | 7298 | 1960 | 1076 | 61 | 9 | 516 |
| 2021 | 97286 | 17412 | 34228 | 27036 | 7005 | 2743 | 6026 | 1753 | 1084 | 54 | 15 | 418 |
| 2022 | 90583 | 17886 | 34319 | 24590 | 5682 | 2074 | 4369 | 1127 | 589 | 17 | 3 | 327 |
Disclaimer/Publisher’s Note: The statements, opinions and data contained in all publications are solely those of the individual author(s) and contributor(s) and not of MDPI and/or the editor(s). MDPI and/or the editor(s) disclaim responsibility for any injury to people or property resulting from any ideas, methods, instructions or products referred to in the content. |
© 2026 by the authors. Licensee MDPI, Basel, Switzerland. This article is an open access article distributed under the terms and conditions of the Creative Commons Attribution (CC BY) license (http://creativecommons.org/licenses/by/4.0/).
Copyright: This open access article is published under a Creative Commons CC BY 4.0 license, which permit the free download, distribution, and reuse, provided that the author and preprint are cited in any reuse.


