

Submitted:
17 February 2026
Posted:
27 February 2026
You are already at the latest version
Abstract
Background/Objectives: Infective endocarditis (IE) carries substantial mortality, particularly in middle-income settings where patient profiles and microbial ecology differ from those of cohorts used to derive international prognostic scores. Syndrome-specific, locally grounded decision aids for empirical therapy are also scarce. We aimed to identify predictors of in-hospital mortality, externally evaluate the RiskE and ICE scores, and construct a Bayesian weighted-incidence syndromic combination antibiogram (WISCA) for IE. Methods: We conducted a retrospective cohort study of consecutive adults with definite or possible IE admitted between January 2019 and January 2026. Candidate predictors were screened in two phases and a clinically specified model was estimated with maximum-likelihood and Firth penalization, with 1000-replicate bootstrap optimism correction. Discrimination was compared against RiskE and ICE using DeLong’s test and reclassification metrics. For empirical coverage, we built a WISCA using identified pathogens, reporting both non-Bayesian bootstrap estimates and Bayesian hierarchical partial-pooling estimates with species- and antibiotic-level random intercepts; analyses were also stratified by IE type. Results: In-hospital mortality was 22.9%. Septic shock (Firth OR 9.23, 95% CI 2.40–40.61) and acute heart failure (OR 10.01, 95% CI 2.78–41.07) were the strongest independent predictors; the final model achieved an AUC of 0.922 (optimism-corrected 0.908) and outperformed RiskE (AUC 0.598) and ICE (AUC 0.632). Bayesian WISCA ranked vancomycin + gentamicin and meropenem + gentamicin highest (both 87.0%); several β-lactam–based combinations provided comparably high coverage without requiring routine carbapenems. Coverage was consistently higher for community-acquired than healthcare-associated IE. Conclusions: A simple variable model provided strong, locally valid mortality prediction and substantially outperformed international scores in this hemodialysis-predominant cohort. Bayesian WISCA offers stable, institution-specific empirical coverage estimates that can support stewardship-oriented regimen selection; multicenter validation is warranted.
Keywords:
infective endocarditis
; mortality prediction
; in-hospital mortality
; weighted-incidence antibiogram
; Bayesian hierarchical model
; WISCA
1. Introduction
Infective endocarditis, encompassing all presentations and classifications, remains a significant contributor to global cardiovascular morbidity and mortality [1]. According to the most recent and comprehensive estimates, in 2023 there were approximately 2.34 million disability-adjusted life years (DALYs) and 86,200 deaths attributable to endocarditis worldwide. Infective endocarditis (IE) remains a life-threatening cardiovascular infection with persistently high mortality despite advances in diagnosis, antimicrobial therapy, and cardiac surgery [1]. A recent meta-analysis encompassing 133 studies and over 132,000 patients reported a global short-term mortality of 17%, with Latin America exhibiting the highest regional rate at 33% [2]. Beyond persistently high case-fatality, the absolute global burden of endocarditis continues to rise [3]. Using GBD 1990–2021 estimates, incident cases, deaths and DALYs increased substantially despite declining age-standardized rates, suggesting that population growth, ageing and expanding invasive interventions are key drivers, with a disproportionate burden in older adults and low- and middle-SDI settings [3].
The epidemiological landscape of IE has shifted substantially over the past two decades: in high-income countries (HICs), the typical patient is now elderly with degenerative valve disease or cardiac implantable devices, whereas in low- and middle-income countries (LMICs), younger patients with rheumatic heart disease (RHD) and healthcare-associated risk factors—particularly hemodialysis vascular access—represent an increasingly recognized phenotype [4,5]. Mexican single-center cohorts similarly suggest a high prevalence of healthcare-associated IE and substantial early mortality, reinforcing the need for locally derived prognostic and antimicrobial decision-support tools [6].
Numerous prognostic scores have been developed to predict mortality in IE, including the RiskE [7], ICE-PCS [8], among others. A systematic review identified over 16 published scores incorporating 4 to 18 variables across heterogeneous clinical domains [9]. However, nearly all were derived in European or North American cohorts with demographic profiles that differ markedly from those of LMICs. A recent meta-analysis of 12 scores across 15 validation studies found pooled AUCs ranging from 0.64 to 0.83 with considerable heterogeneity, and concluded that no single score has achieved consistent external validation across diverse populations [10]. However, the geographic transportability of prognostic scores in infective endocarditis is often limited by significant variations in local microbiology and clinical management thresholds, which can compromise their predictive performance in external cohorts, especially in Latin America [11].
Beyond mortality prediction, the selection of appropriate empirical antimicrobial therapy remains a critical challenge in IE management [12]. The high frequency of blood culture-negative IE reported in Latin America increases uncertainty in early management and heightens reliance on empiric regimens that must balance adequate coverage with antimicrobial stewardship [12]. ESC guidance emphasizes obtaining three sets of blood cultures before antibiotics and starting empiric intravenous therapy promptly, with rapid adaptation to targeted therapy once the causative pathogen and susceptibility are identified [13]. In real-world cohorts, unsuitable antibiotic therapy has been independently associated with higher in-hospital mortality, supporting the clinical value of tools that improve empiric regimen selection in IE [14].
The weighted-incidence syndromic combination antibiogram (WISCA) is a methodology that integrates local pathogen prevalence with organism-specific susceptibility to estimate the probability that a given antimicrobial regimen will cover the causative pathogen of a clinical syndrome [15]. While WISCA has been applied to several infectious syndromes, evidence in infective endocarditis remains scarce and largely limited to recent single-center experiences; to our knowledge, Bayesian WISCA frameworks and data from Latin America are still lacking[16,17,18]. Because syndrome- and strata-specific susceptibility estimates can be sparse, Bayesian implementations of WISCA allow principled borrowing of strength across strata and provide uncertainty quantification for regimen-level coverage estimates[19]. Given the diverse microbial ecology of IE—spanning staphylococci, streptococci, enterococci, gram-negative organisms, and fungi—a syndrome-specific weighted antibiogram could provide valuable guidance for empirical therapy selection, particularly in settings when a well-defined syndrome arises from heterogeneous etiologic agents across heterogeneous patient populations, within a locally specific resistance ecology that makes “one-size-fits-all” empiric regimens unreliable[19,20,21].
Taken together, the high regional mortality, frequent diagnostic uncertainty (including culture-negative IE), and locally variable pathogen distribution and resistance patterns underscore the need for (i) context-specific risk stratification and external validation of widely used prognostic scores, and (ii) quantitative decision-support for empiric therapy that is explicitly grounded in local microbiology. Therefore, we aimed to identify independent predictors of in-hospital mortality and develop an internally validated model, externally validate RISK-E and ICE scores in a Mexican cohort, and construct a Bayesian WISCA to inform empiric antimicrobial selection in IE.
2. Materials and Methods
2.1. Study Design, Setting, and Population
Hospital Civil de Guadalajara “Fray Antonio Alcalde” is a 1,000-bed public tertiary university hospital and the primary referral center for western Mexico. Patients with infective endocarditis (IE) at this institution exhibit a distinctive epidemiological profile characterized by younger age, a high prevalence of hemodialysis, and a predominance of healthcare-associated IE features that differ substantially from the populations in which international prognostic scores were originally derived. Accordingly, we conducted a single-center retrospective cohort study including all consecutive adult patients (≥18 years) with definite or possible IE according to the modified Duke criteria, diagnosed from January 2019 to January 2026. The study was approved by the institutional ethics committee (CEI 343/25, January 28, 2026) and classified as minimal-risk research, with a waiver of informed consent due to its retrospective design.
2.2. Data Collection and Variables
Clinical, microbiological, echocardiographic, and outcome data were extracted from electronic medical records into a standardized database comprising 161 variables. Variables were structured a priori into domains encompassing demographics (age, sex, BMI, Charlson comorbidity index), comorbidities (diabetes, chronic kidney disease, hepatopathy, active neoplasia, HIV with immunosuppression, intravenous drug use), healthcare-associated risk factors (prior endocarditis, prosthetic valve, central venous/Mahurkar catheter, cardiac implantable electronic device, hemodialysis), infective endocarditis (IE) classification (acquisition category, grouped acquisition, prosthetic vs. native valve, and affected side), microbiology (blood-culture positivity, pathogen group, and organism identification), echocardiography (LVEF and categories, vegetation characteristics including size, number, mobility, and thresholds >10 mm and >30 mm), complications (clinical and structural complications and total complication count), treatment (surgery and surgical indications, empirical regimen, and appropriateness of initial therapy), prognostic scores (RiskE [7]and ICE [9], and SOFA-2 Score [22] computed per published algorithms), and antimicrobial susceptibility.
Seven derived variables were created for the extended analysis: S. aureus as causative pathogen, culture-negative IE, left-sided IE, structural complication (abscess, perforation, fistula, or aneurysm), reduced LVEF (<50%), high comorbidity burden (Charlson ≥ 4), and absence of initial clinical suspicion of IE
2.3. Outcomes
The primary outcome was in-hospital all-cause mortality, defined as death from any cause during the index hospitalization; this endpoint was available for 96 of 97 patients (one missing value). Secondary outcomes comprised 30-day all-cause mortality (available for 86 of 97 patients) and embolic events. Exploratory outcomes included ICU admission, prolonged hospital stay (defined as exceeding the 90th percentile, >69 days), and a composite endpoint of complicated IE (septic shock, acute heart failure, embolism, or ICU admission).
2.4. Predictive Model Development
2.4.1. Variable Selection
Variable selection followed a two-phase strategy. In Phase 1, 27 candidate variables across nine clinical domains were screened using univariate logistic regression; variables with p < 0.20 (Hosmer–Lemeshow criterion) were retained as candidates [23]. In Phase 2, an extended bivariate analysis evaluated 35 additional variables, including the eight derived variables, using the same threshold. Quasi-complete separation was handled by reporting Fisher’s exact test p-values, and multilevel categorical variables were evaluated using likelihood ratio tests.
2.4.2. Model Specification
The final model was specified a priori based on three criteria: (1) representation of three independent clinical domains (hemodynamic: septic shock; anatomic: left-sided IE; cardiac complication: acute heart failure); (2) statistical significance in univariate analysis (all three p < 0.05); and (3) adherence to the events-per-variable (EPV) constraint (22 events / 3 predictors = EPV 7.3). Multicollinearity was assessed using variance inflation factors (VIF < 2 for all predictors).
2.4.3. Model Estimation and Penalization
The primary model was estimated using standard maximum likelihood logistic regression. Given the moderate EPV (7.3), Firth’s penalized logistic regression was performed as the primary sensitivity analysis to reduce small-sample bias [24]. Consistency between standard and Firth-penalized estimates was assessed by comparing odds ratios, confidence intervals, and p-values.
2.4.4. Confirmatory LASSO Analysis
A LASSO logistic regression (L1-penalized) was performed using 10-fold cross-validated glmnet on 18 candidate variables to assess the robustness of variable selection [25]. Results at both λmin and λ1SE were compared with the a priori model.
2.4.5. Internal Validation
Internal validation was performed using bootstrap optimism correction (1000 replicates) as described by Harrell [26]. In each replicate, the model was fit on a bootstrap sample and evaluated on both the bootstrap sample (apparent performance) and the original sample; optimism was estimated as the average difference. The corrected AUC was computed as AUCapparent − optimism. Model calibration was assessed using the Hosmer–Lemeshow goodness-of-fit test and bootstrap calibration plots (intercept and slope)[27].
2.5. External Validation of Prognostic Scores
The RiskE [7] and ICE [8] scores were calculated according to published algorithms. Discrimination was assessed using the area under the receiver operating characteristic curve (AUC-ROC). Head-to-head comparison of the local model against each score was performed using DeLong’s test for correlated ROC curves [28]. Reclassification improvement was quantified using net reclassification improvement (NRI) and integrated discrimination improvement (IDI) [29].
2.6. Bayesian Weighted-Incidence Antibiogram
2.6.1. Study Population and Pathogen Distribution
The WISCA analysis included all 68 patients with at least one identified pathogen from blood cultures or surgical specimens, after excluding culture-negative IE (n = 29). Unlike conventional antibiogram analyses that exclude non-bacterial isolates, patients with fungal infections were retained with all antibacterial susceptibilities set to zero, ensuring their prevalence was correctly captured in the weighted coverage calculation.
WISCA methodology integrates local pathogen prevalence with organism-specific antimicrobial susceptibility to estimate the probability that a given empirical antimicrobial regimen will provide adequate coverage for the causative pathogen of a clinical syndrome. For a two-drug combination of antimicrobials a and b, patient-level susceptibility was defined using OR logic: a patient was considered susceptible to the combination if susceptible to at least one component drug. A total of 54 regimens were evaluated: 20 monotherapies and 34 two-drug combinations.
Combinations were selected based on current IE treatment guidelines[30,31] and institutional prescribing patterns, encompassing beta-lactam + aminoglycoside, beta-lactam + glycopeptide/lipopeptide/oxazolidinone, and glycopeptide + aminoglycoside regimens commonly used in clinical practice. The weighted coverage for antimicrobial k is:
where is the prevalence of pathogen group j. Traditional WISCA used patient-level bootstrap (B = 2000) for 95% CIs.
2.6.2. Bayesian Hierarchical Model
To address the inherent sparsity of institution-level species–antimicrobial susceptibility data (23 species, many with 1–2 isolates), a Bayesian hierarchical logistic regression model was specified:
A Bayesian hierarchical logistic regression was specified:
with random effects:
Prior distributions were:
The model was fit using brms with cmdstanr (4 MCMC chains × 4000 iterations, 2000 warmup, NUTS, adapt_delta = 0.97). Convergence was assessed via < 1.01, ESS > 400, and zero divergent transitions and posterior predictive checks comparing observed and predicted susceptibility rates.
Bayesian WISCA coverage for each posterior draw s:
reported as posterior median with 95% highest density intervals (HDI).
Weighted coverage for each antimicrobial was computed as the prevalence-weighted sum of posterior susceptibility probabilities across pathogen groups, with 95% highest density intervals (HDI).
Partial pooling (shrinkage). A key advantage of the hierarchical structure is partial pooling: species with few observations are shrunk toward the global mean susceptibility, producing more stable and conservative estimates than raw proportions. The degree of shrinkage is governed by the estimated random-effect variance (σ_species^2) and the species-specific sample size.
2.6.3. Stratified Analysis
A second Bayesian hierarchical model incorporated IE type (community-acquired vs. healthcare-associated) as a fixed effect to estimate stratum-specific coverages:
where s denotes the IE type stratum. Between-stratum agreement was quantified using Pearson's correlation coefficient of posterior median coverages across all 54 regimens.
2.7. Statistical Analysis
Continuous variables were summarized as median (interquartile range [IQR]) or mean ± standard deviation as appropriate based on the Shapiro–Wilk test for normality. Categorical variables were expressed as absolute frequencies and percentages. Between-group comparisons used the Wilcoxon rank-sum test for continuous variables and the chi-squared test or Fisher's exact test for categorical variables. A two-sided significance level of α = 0.05 was used throughout. No correction for multiple comparisons was applied in the bivariate screening phase, consistent with the Hosmer–Lemeshow strategy of using a liberal threshold p < 0.20) for candidate identification, with subsequent validation through penalized methods and bootstrap internal validation.
Complete-case analysis (CCA) was used as the primary analytical approach, with MICE-based multiple imputation as a sensitivity analysis. Missing data mechanisms were evaluated using the Missing Completely at Random (MCAR) test of Little, missing data patterns were visualized using aggregation and combination plots, and the proportion of missing values was computed for each variable.
2.8. Software
All analyses were performed in R version 4.4.1 (R Foundation for Statistical Computing, Vienna, Austria). Key R packages included: tidyverse (v2.0) for data manipulation and visualization; readxl for Excel file import; gtsummary for publication-ready summary tables; pROC for ROC curve analysis and DeLong’s test; rms for regression modeling, bootstrap validation, calibration, and nomograms; logistf for Firth’s penalized logistic regression; glmnet for LASSO regression; mice for multiple imputation by chained equations; flextable and officer for Word document export; brms (v2.22) for Bayesian hierarchical models via Stan; cmdstanr as the Stan backend for MCMC sampling; HDInterval for highest density interval computation; bayesplot and posterior for MCMC diagnostics; and dcurves for decision curve analysis. The complete analysis pipeline is available from the corresponding author upon request.
3. Results
3.1. Study Population
Ninety-seven patients met inclusion criteria. The median age was 37 years (IQR 28–52; range 16–80), and 73 (75.3%) were male. The median Charlson comorbidity index was 2 (IQR 0–3). The most prevalent comorbidity was chronic kidney disease requiring hemodialysis (46/97, 47.4%), followed by central venous catheter (44/97, 45.4%), chronic kidney disease (43/97, 44.3%), recent hospitalization (43/97, 44.3%), and diabetes mellitus (24/97, 24.7%). Prosthetic valve IE accounted for 11.3% (11/97), and only 3.1% (3/97) reported intravenous drug use. In-hospital survival data were available for 96 patients. Table 1 summarizes the clinical characteristics stratified by in-hospital survival status.
Healthcare-associated IE predominated (52/97, 53.6%) over community-acquired IE (42/97, 43.3%). Native valve IE accounted for 88.7% (86/97). Left-sided IE was present in 49.5% (48/97) and right-sided in 46.4% (45/97), with 2.1% bilateral.
Clinical characteristics differed substantially between IE types: community-acquired IE was characterized by higher prevalence of Streptococcus spp. and left-sided involvement, while healthcare-associated IE was dominated by S. aureus, hemodialysis access (86.5% vs. 0%), and central venous catheter use. In-hospital mortality did not differ significantly between groups (28.6% vs. 17.3%; p = 0.220) (Supplementary Table S1).
3.2. Microbiology
Blood cultures were positive in 72.0% (67/93) of patients. Staphylococcus aureus was the most common pathogen (31/97, 32.0%), followed by culture-negative IE (29/97, 29.9%), Streptococcus spp. (13/97, 13.4%), gram-negative organisms (9/97, 9.3%), coagulase-negative staphylococci (8/97, 8.2%), fungi (4/97, 4.1%), and Enterococcus spp. (3/97, 3.1%). In-hospital mortality varied markedly by pathogen: Enterococcus 100% (3/3), fungi 50% (2/4), coagulase-negative staphylococci 50% (4/8), culture-negative 20.7% (6/29), Streptococcus 16.7% (2/12), S. aureus 12.9% (4/31), and gram-negatives 11.1% (1/9).
In-hospital mortality varied markedly across pathogen groups (Figure 2): Enterococcus spp. exhibited 100% mortality (3/3), fungi 50.0% (2/4), coagulase-negative staphylococci 50.0% (4/8), culture-negative IE 20.7% (6/29), Streptococcus spp. 16.7% (2/12), S. aureus 12.9% (4/31), and gram-negative organisms 11.1% (1/9). The overall association between pathogen group and mortality was statistically significant (likelihood ratio test p = 0.013). Notably, S. aureus mortality was paradoxically low (12.9%) compared with international reports of 20–40%, a finding attributable to the predominance of right-sided IE among S. aureus cases (58% right-sided), which carries inherently better prognosis.
The microbial ecology differed between IE types: Streptococcus spp. dominated community-acquired IE (11/24, 45.8%), while S. aureus dominated healthcare-associated IE (24/38, 63.2%), with a notable proportion of gram-negative organisms in the latter (8/38, 21.1%). The microbiological distribution, pathogen-specific in-hospital mortality, and microbial ecology by infective endocarditis type among culture-positive cases is depicted in Figure 1.
3.3. Echocardiography and Complications
Transthoracic or transesophageal echocardiography data were available for 94 of 97 patients (96.9%). Median left ventricular ejection fraction (LVEF) was 60% (IQR 55–63), with preserved function (LVEF >=50%) in 85.1% (80/94), moderately reduced function (40–49%) in 10.6% (10/94), and reduced function (<40%) in 4.3% (4/94). Vegetations were detected in 83.5% (81/97) of patients, with a median maximal dimension of 19 mm (IQR 13–24); vegetations exceeding 10 mm were observed in 85.2% (69/81) of those with measurable lesions. The median number of vegetations was 1 (range 1–3): 62 patients had a single vegetation, 17 had two, and 2 had three.
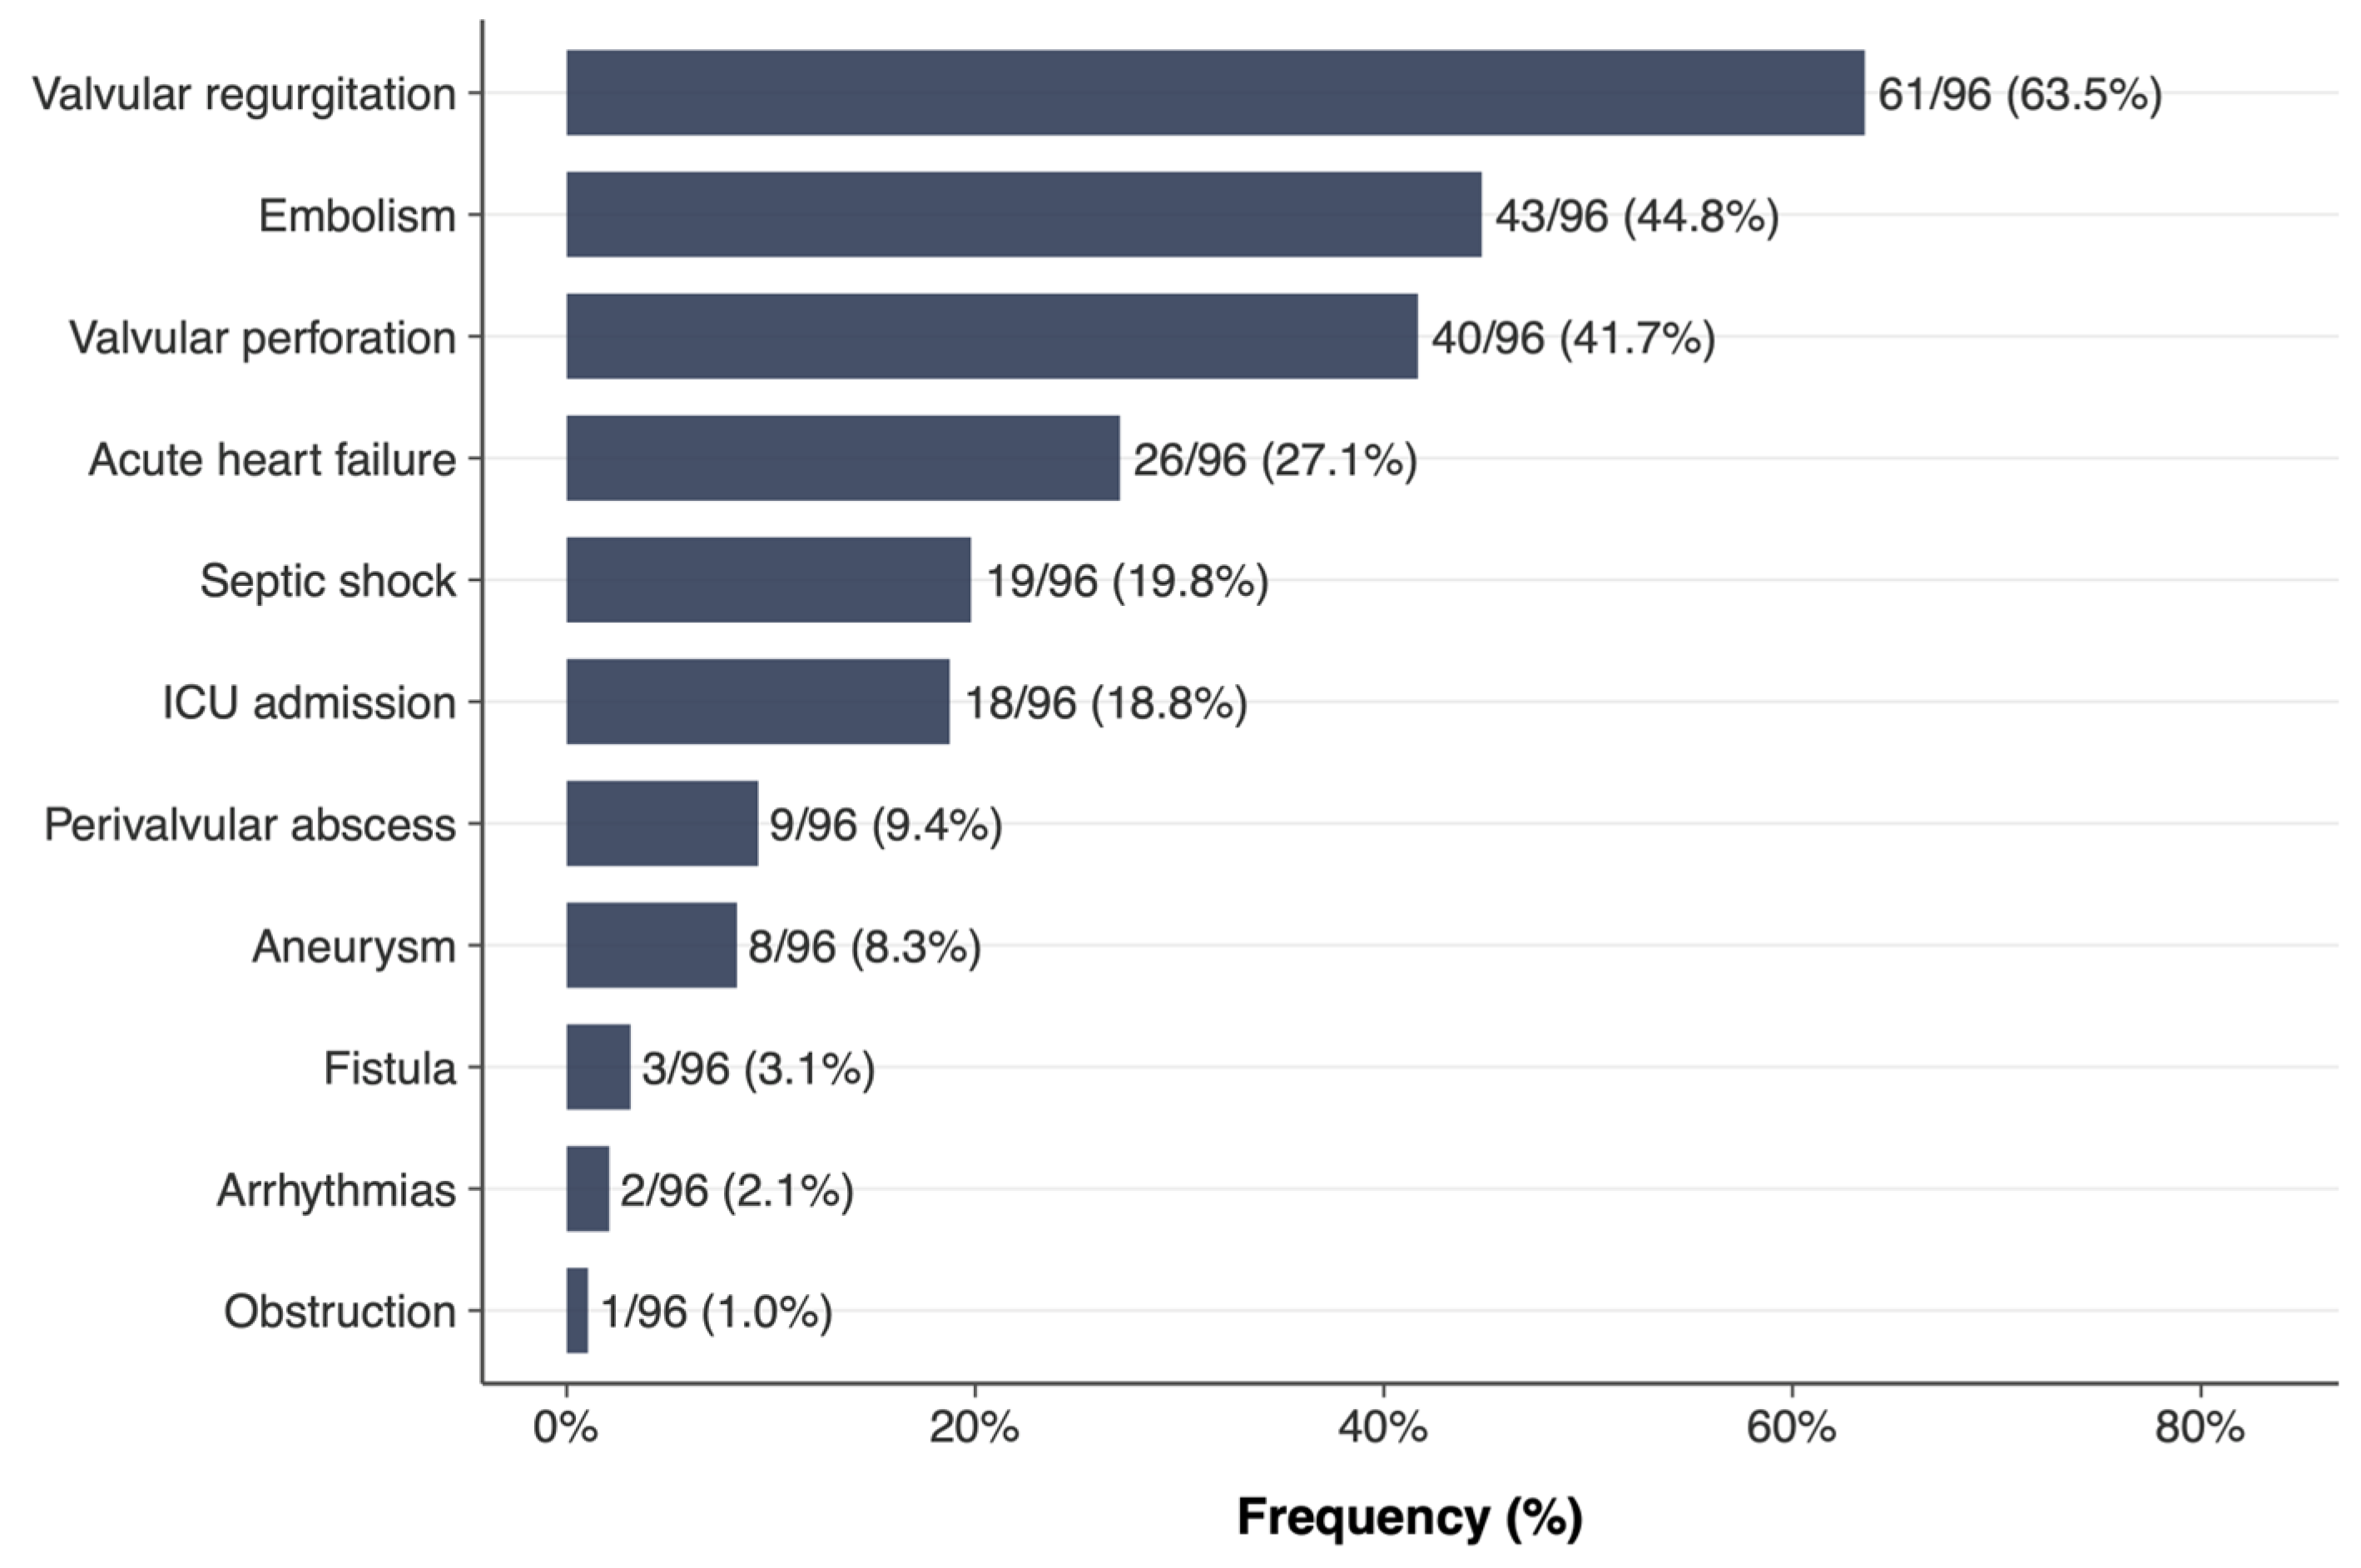
The most frequent complications (Figure 2) were valvular regurgitation (61/96, 63.5%), embolism (43/96, 44.8%), valvular perforation (40/96, 41.7%), acute heart failure (21/96, 21.9%), septic shock (19/96, 19.8%), and ICU admission (18/96, 18.8%). Less common complications included perivalvular abscess (9/96, 9.4%), aneurysm (8/96, 8.3%), fistula (3/96, 3.1%), arrhythmias (2/96, 2.1%), and obstruction (1/96, 1.0%). The median total number of complications was 2 (IQR 1–3).
Figure 2.
Complication Profile of Infective Endocarditis Cases.
3.4. Outcomes and Treatment
In-hospital mortality was 22.9% (22/96; 95% CI 15.0–32.6%), and 30-day all-cause mortality was 27.9% (24/86; 95% CI 18.8–38.6%). Surgical intervention was performed in 63.2% (60/95; 95% CI 52.6–72.8%) of patients; among those with a documented surgical indication, 100% (59/59) underwent surgery, indicating complete adherence to surgical guidelines. ICU admission occurred in 18.8% (18/96), and septic shock in 19.8% (19/96). Acute heart failure developed in 21.9% (21/96), and embolic events were documented in 44.8% (43/96). Median hospital stay was 34.5 days (IQR 25.8–50.3), with no significant difference between survivors (34 days, IQR 26–50) and non-survivors (36 days, IQR 21.5–51.5).
Prognostic scores differed between survivors and non-survivors: median RiskE was 9 points (IQR 0–9) in survivors vs. 9 (IQR 7–14) in non-survivors; median ICE score was 7 (IQR 5–9) vs. 9 (IQR 6–11); and median SOFA-2 score was 4 (IQR 0–4) vs. 3 (IQR 1–4). The ICE score was significantly higher in non-survivors (Wilcoxon p = 0.017), while RiskE showed a trend (p = 0.064) and SOFA-2 score was not significantly different (p = 0.146).
ICU admission occurred in 18.8% (18/96) of patients and was strongly associated with septic shock (Firth OR 7.03, 95% CI 1.99–25.90; p = 0.003) and acute heart failure (Firth OR 7.05, 95% CI 2.09–25.61; p = 0.002), with an exploratory model AUC of 0.874 (Supplementary Table S2). Prolonged hospitalization, defined as exceeding the 90th percentile (>69 days), occurred in 9.4% (9/96) of patients (Supplementary Table S3).
Prolonged hospitalization (>69 days; 90th percentile) was uncommon (9/96) and, in bivariate comparisons, was associated with female sex (55.6% vs. 21.8%; p = 0.041) and greater acute illness severity at presentation, reflected by higher SOFA-2 scores (median 4.0 [IQR 4.0–5.0] vs. 2.5 [0.0–4.0]; p = 0.017), whereas other baseline characteristics, IE classification variables, echocardiographic features, and management factors did not show statistically significant differences (Table S3).
In contrast, a composite endpoint of complicated IE (septic shock, acute heart failure, embolism, or ICU admission) was frequent (59/96) and was associated with older age (median 46.0 vs. 33.0 years; p = 0.039), community-acquired presentation (54.4% vs. 29.7%; p = 0.019), and—most strongly—left-sided involvement (67.8% vs. 21.6%; p < 0.001), alongside higher RiskE scores (median 9.0 [5.0–14.0] vs. 9.0 [0.0–9.0]; p = 0.039) and a markedly higher frequency of fulfilled surgical indication (88.5% vs. 48.1%; p < 0.001); mortality clustered in the complicated group (37.3% vs. 0%; p < 0.001) (Table S4).
In multivariable logistic regression models for secondary outcomes (Supplementary Table S5), ICU admission was independently associated with both septic shock and acute heart failure, with consistent effect sizes in standard GLM and Firth-penalized models (Firth OR 7.03, 95% CI 1.99–25.90; p = 0.003 and Firth OR 7.05, 95% CI 2.09–25.61; p = 0.002, respectively). For prolonged hospitalization (>69 days; P90), female sex and the presence of a central venous catheter/Mahurkar showed elevated odds (Firth OR 3.20 and 3.37, respectively), but neither reached conventional statistical significance (both p ≈ 0.10), consistent with limited power given the small number of events. For complicated IE, left-sided involvement emerged as the sole independent predictor, conferring a strong increase in risk (Firth OR 6.85, 95% CI 2.78–18.37; p < 0.001). Models were derived using bivariate screening (p < 0.20), backward AIC selection, and Firth penalization to mitigate small-sample bias
Empirical antimicrobial therapy was highly heterogeneous but predominantly centered on broad-spectrum β-lactam plus anti-MRSA coverage. The most frequently prescribed regimen was ceftriaxone + vancomycin (35/95, 36.8%), followed by ceftazidime + vancomycin (8/95, 8.4%) and ceftriaxone + linezolid (5/95, 5.3%); all other regimens were each used in ≤4.2% of cases, reflecting substantial variability in initial management. Combination regimens clearly predominated over monotherapy, and where crude outcomes were available, in-hospital mortality for the most common empirical combinations ranged from 12.5% to 20.0% (e.g., ceftriaxone + vancomycin: 6/35, 17.1%). Overall empirical therapy appropriateness was 83.6% (46/55 evaluable cases), with a median time to antimicrobial adjustment of 3.5 days (IQR 3–6.75). The complete list of empirical antimicrobial regimens prescribed is shown in Supplementary Table S6.
3.5. Predictive Model for In-Hospital Mortality
3.5.1. Bivariate Analysis
A comprehensive two-phase bivariate screening was performed to identify candidate predictors of in-hospital mortality. In Phase 1, 27 variables across nine original clinical domains (demographics, comorbidities, risk factors, IE classification, microbiology, echocardiography, complications, treatment, and prognostic scores) were evaluated using univariate logistic regression. In Phase 2, an additional 35 variables were screened, including eight derived variables (left-sided IE, S. aureus pathogen, high-risk pathogen, culture-negative IE, structural complication, reduced LVEF, high comorbidity burden, and absence of initial clinical suspicion) and variables not evaluated in Phase 1 (individual complications, clinical presentation features, biomarkers, temporal variables, and additional risk factors). Table 2 presents the bivariate screening organized by 16 clinical domains, an extended version of crude odds ratios for in-hospital mortality is depicted in supplementary table S7.
Of the 62 variables screened, 12 reached conventional statistical significance (p < 0.05) and 25 met the Hosmer–Lemeshow criterion for candidate retention (p < 0.20). The strongest bivariate associations with in-hospital mortality were observed for:
Hemodynamic and clinical complications: Septic shock exhibited the strongest crude association (OR 16.37, 95% CI 5.21–57.90, p < 0.001), followed by acute heart failure (OR 8.67, 95% CI 2.98–26.86, p < 0.001), and ICU admission (OR 5.00, 95% CI 1.67–15.35, p = 0.004). The composite variable of total complications per unit increment was also significant (OR 2.20, 95% CI 1.53–3.40, p < 0.001).
IE classification: Affected side was significantly associated with mortality (likelihood ratio test p = 0.005), with left-sided IE conferring substantially higher risk. IE type (community-acquired vs. healthcare-associated vs. nosocomial) also showed a significant global association (LRT p = 0.011). The derived variable left-sided IE as a binary predictor was significant (OR 3.24, 95% CI 1.14–9.86, p = 0.030).
Microbiology: Pathogen group was significantly associated with mortality (LRT p = 0.013). The derived variable high-risk pathogen (Enterococcus, fungi, or coagulase-negative staphylococci) showed a strong association (Fisher p = 0.001), although this was later found to be confounded by IE laterality.
Demographics: Age per year (OR 1.04, 95% CI 1.01–1.08, p = 0.005) and Charlson comorbidity index per point (OR 1.30, 95% CI 1.02–1.66, p = 0.032) were significant continuous predictors.
Prognostic scores: The ICE score was significant (OR 1.20 per point, 95% CI 1.04–1.42, p = 0.017), while RiskE showed a trend (OR 1.05, 95% CI 1.00–1.12, p = 0.064).
Structural and individual complications: Structural complication composite (Fisher p = 0.002), aneurysm (p = 0.013), and valvular compromise (p = 0.039) were significant. Vascular or immunological phenomena were also associated (p = 0.011).
Quasi-complete separation was observed for arrhythmias (2/2 patients with arrhythmias died; Fisher p = 0.051) and surgical indication (Fisher p = 0.002); crude odds ratios were not estimable for these variables. No comorbidities (diabetes, chronic kidney disease, hepatopathy, neoplasia, intravenous drug use), healthcare exposure variables (hemodialysis, central venous catheter), biomarkers (lactate, procalcitonin), or temporal variables (symptom duration, time to antimicrobial correction) were significantly associated with in-hospital mortality.
3.5.2. Multivariate Analysis
Two local predictive models were developed and compared head-to-head alongside international prognostic scores, following TRIPOD guidelines for transparent reporting[32].
Model 1 (Backward AIC). Backward stepwise selection by AIC from Phase 1 bivariate candidates retained four predictors—age, septic shock, acute heart failure, and surgery (4 predictors; EPV = 5.5). This model achieved an apparent AUC of 0.933 (95% CI, 0.88–0.99), with a bootstrap optimism-corrected AUC of 0.916.
Model 2 (Final Clinical Model). A clinically guided three-variable model incorporating septic shock, left-sided IE, and acute heart failure (3 predictors; EPV = 7.3) was selected as the final specification based on superior EPV, parsimony, and multi-domain clinical representation.
DeLong’s test showed no significant difference between Model 1 and Model 2 (z = −0.86, p = 0.388), supporting the selection of the more parsimonious Model 2 with equivalent discrimination and lower risk of overfitting. The final three-variable model and its Firth-penalized estimates are shown in Table 3.
Septic shock and acute heart failure were the strongest independent predictors of in-hospital mortality, with Firth-penalized ORs of 9.23 (95% CI, 2.40–40.61; p = 0.001) and 10.01 (95% CI, 2.78–41.07; p = 0.0004), respectively—each consistent with an approximately 10-fold increase in the odds of death. Left-sided IE showed a non-significant trend toward increased mortality (Firth OR 2.66; 95% CI, 0.62–12.68; p = 0.185) and was retained based on established prognostic relevance and contribution to multi-domain clinical representation.
Model 2 demonstrated excellent discrimination, with an apparent AUC of 0.922 (95% CI, 0.87–0.98). Internal validation using 1,000 bootstrap replicates yielded an optimism-corrected AUC of 0.908 (optimism = 0.014), indicating minimal overfitting. Additional performance metrics included an AIC of 64.8, Hosmer–Lemeshow p = 0.505, Nagelkerke pseudo-R2 = 0.583, and a Brier score of 0.092 (below the trivial Brier of 0.177), supporting adequate calibration and overall fit. Variance inflation factors were <2 for all predictors, excluding clinically meaningful multicollinearity.
Firth-penalized estimation produced the expected attenuation of odds ratios relative to maximum likelihood while preserving the direction and statistical significance of predictors, supporting robustness under an EPV of 7.3 (22 events / 3 predictors). In confirmatory regularization, LASSO at λ-1SE retained septic shock and acute heart failure as the only non-zero predictors; at λ-min, all three final model predictors were retained alongside additional variables, consistent with the core model structure. A comprehensive multi-model comparison including all fitted models, LASSO specifications, and international scores is provided in Supplementary Table S8.
Sensitivity analysis adding age as a fourth predictor (Model 2 + age) yielded a marginal increase in apparent AUC (0.937 vs 0.922), but the likelihood ratio test was marginally non-significant (p = 0.054). AIC improved by only 1.7 units (64.8 to 63.1), bootstrap optimism increased (0.014 to 0.017), and left-sided IE was destabilized (p = 0.182 to p = 0.062). EPV declined from 7.3 to 5.5, increasing overfitting risk; therefore, the three-variable model was retained as final.
3.5.3. Comparison with International Scores
The local model significantly outperformed both international prognostic scores (Table 4,Figure 3b). RiskE achieved an AUC of 0.598 (95% CI, approximately 0.45–0.74) and ICE an AUC of 0.632 (95% CI, approximately 0.49–0.77), both approaching non-discrimination and statistically indistinguishable (DeLong z = −0.55, p = 0.581). DeLong’s test confirmed that Model 2 significantly outperformed RiskE (z = 4.69, p < 0.0001) and ICE (z = 4.08, p < 0.0001), with absolute AUC differences of 0.324 and 0.290, respectively; Model 1 showed similar superiority (p < 0.0001 for both comparisons).
Net reclassification improvement supported superior reclassification by the local model (NRI vs RiskE = 0.761; 95% CI, 0.29–1.20; p = 0.001; NRI vs ICE = 0.978; 95% CI, 0.52–1.41; p < 0.0001). Integrated discrimination improvement was significant for both comparisons (IDI vs RiskE = 0.433, p < 0.001; IDI vs ICE = 0.404, p < 0.001), indicating improved separation of predicted probabilities between events and non-events.
The poor performance of international scores likely reflects population mismatch. RiskE was derived from left-sided IE patients undergoing cardiac surgery in Spanish centers, whereas 46.4% of the present cohort had right-sided IE. Neither score incorporates hemodialysis status, vascular access, or healthcare-associated IE—key determinants of risk in this setting. Concentrated score distributions (similar medians in survivors and non-survivors) further suggest limited ability to capture the principal axes of prognostic variability in this cohort.
Decision curve analysis indicated that the local model provided greater net clinical benefit than treat-all or treat-none strategies across threshold probabilities of approximately 5% to 50%, supporting potential clinical utility for risk-stratified decision-making (Figure 3c).
3.5.4. Secondary Model: 30-Day Mortality
The same three-predictor model applied to 30-day mortality (n = 86, 24 events, EPV 8.0) achieved an AUC of 0.899 (95% CI 0.83–0.97; optimism-corrected 0.888; Hosmer–Lemeshow p = 0.127), confirming the robustness of the predictors across time horizons.
3.5.5. Exploratory Model for Embolic Events
An exploratory predictive model for embolic events was developed as a secondary analysis. Among 93 evaluable patients, 42 (45.2%) experienced embolic events. Bivariate screening of 42 variables identified 11 candidates (p < 0.20), of which 5 reached conventional significance. The variable vascular/immunological phenomena was excluded due to definitional overlap with the outcome. Notably, vegetation characteristics—size >10 mm, mobility, and size >30 mm—were not significant predictors of embolism (all p > 0.25).
The final backward AIC model (Model E) and its Firth-penalized estimates are shown in Table 5.
3.6. Bayesian Weighted-Incidence Antibiogram
3.6.1. Global Results
Among the 54 evaluated regimens, the highest predicted coverages were achieved by combination therapies (Figure 4; Supplementary Table S9). In the Bayesian hierarchical WISCA, vancomycin + gentamicin and meropenem + gentamicin ranked first (both 87.0%; Table 3; Figure 4; Supplementary Table S9). Several β-lactam–based combinations achieved similarly high Bayesian coverage without requiring carbapenems, including ceftriaxone + gentamicin and ceftriaxone + vancomycin (both 85%), cefazolin + gentamicin (85%), and ampicillin/sulbactam + gentamicin (85%) (Figure 4; Supplementary Table S9).
Among monotherapies, tigecycline had the highest Bayesian coverage (86.9%, 95% HDI 80.5–92.8), followed by doxycycline (82.0%), gentamicin (80.7%), and vancomycin, linezolid, daptomycin, and ceftaroline (all ~80.6%) (Figure 4; Supplementary Table S9). Penicillin G had the lowest Bayesian coverage (37.5%) (Figure 4; Supplementary Table S9).
Non-Bayesian and Bayesian estimates showed only moderate concordance (r = 0.683), with differences consistent with partial pooling under sparse species–drug data. Specifically, the non-Bayesian WISCA tended to overestimate coverage for well-tested broad regimens (e.g., meropenem + vancomycin: 91.2% non-Bayesian vs. 86.9% Bayesian) and underestimate coverage for regimens with sparse susceptibility data (e.g., vancomycin + gentamicin: 70.6% vs. 87.0%; ampicillin/sulbactam + gentamicin: 64.7% vs. 85.2%; ampicillin + gentamicin: 61.8% vs. 85.0%) (Figure 4; Supplementary Table S9).
3.6.2. Stratified Analysis by IE Type
Bayesian hierarchical coverage was consistently higher for community-acquired IE across all regimens, whereas healthcare-associated IE exhibited a largely uniform downward shift (Figure 5; Supplementary Table S10). Top-ranked combinations reached 91.1% in community-acquired IE (e.g., vancomycin + gentamicin; meropenem + gentamicin), compared with 83.6–83.7% in healthcare-associated IE (Δ ≈ 7.4 percentage points) (Figure 5; Supplementary Table S10).
Notably, several narrower-spectrum β-lactam–based combinations maintained ≥89–90% coverage in community-acquired IE—ceftriaxone + vancomycin (90.2%), ceftriaxone + gentamicin (90.2%), cefazolin + vancomycin (89.0%), and ampicillin/sulbactam + gentamicin (90.2%)—while remaining ≥81–82% in healthcare-associated IE (Figure 5; Supplementary Table S10). In contrast, the non-Bayesian WISCA produced markedly lower and unstable stratum-specific point estimates for several community-acquired regimens (e.g., vancomycin + gentamicin 35.5% non-Bayesian vs. 91.1% Bayesian), illustrating the sensitivity of prevalence-weighted estimates to small stratum sizes and incomplete susceptibility testing (Figure 5; Supplementary Table S10). Despite absolute shifts in coverage, Bayesian stratum-specific rankings were essentially preserved (r = 0.999), supporting the interpretation that healthcare-associated IE reflects a broad susceptibility downshift rather than a qualitatively distinct resistance pattern.
4. Discussion
This study presents three main findings from a seven-year cohort of infective endocarditis (IE) patients at a Mexican tertiary university hospital. First, a parsimonious three-variable model comprising septic shock, left-sided IE, and acute heart failure demonstrated excellent discrimination for in-hospital mortality (AUC 0.922; optimism-corrected AUC 0.908), significantly outperforming the RiskE and ICE international prognostic scores. Second, the Bayesian hierarchical antibiogram with species-level random intercepts (23 species; 54 regimens) identified vancomycin + gentamicin and meropenem + gentamicin (both 87.0%) as the highest-coverage combination regimens, with tigecycline (86.9%) leading among monotherapies and an overall empirical appropriateness of 83.6%. Third, the cohort exhibited a distinctive epidemiological phenotype—young, hemodialysis-predominant, with paradoxically low S. aureus mortality—that challenges assumptions underlying European-derived risk stratification tools.
The in-hospital mortality of 22.9% falls at the lower end of the range reported for Latin America (22–49%) and below the regional pooled estimate of 33%[1,33]. Several converging factors likely explain this favorable outcome. First, the surgical intervention rate of 63.2%, with 100% fulfillment of documented surgical indications, substantially exceeds the 28–40% reported in LMIC series [34] and approaches rates in high-income specialized centers [35]. The survival benefit of early surgery in IE is well established [36], and high institutional adherence to surgical guidelines likely contributed to the relatively low mortality[37,38]. Second, the elevated proportion of right-sided IE (46.4%)—driven by the hemodialysis-predominant population—contributes favorably, as right-sided IE carries intrinsically lower mortality (8.9% in our cohort vs. 37.5% for left-sided) [39]. Third, the young age of the cohort (median 37 years vs. >60 years in European series) may confer a survival advantage[40].
The demographic profile of our cohort—young patients with healthcare-associated IE linked to hemodialysis vascular access—represents a distinct epidemiological phenotype that diverges from both the European/North American pattern (elderly patients with degenerative valves) and the classical LMIC pattern (young patients with rheumatic heart disease) [41,42,43]. This "hemodialysis-associated IE phenotype" has been increasingly recognized in Mexican centers and likely reflects the high burden of chronic kidney disease in the region combined with reliance on central venous catheters for hemodialysis access [6].
A notable finding was the paradoxically low S. aureus mortality (12.9%) compared with international reports of 20–40%[44,45]. Stratified analysis revealed that 58% of S. aureus cases involved right-sided IE, which carries inherently better prognosis regardless of the causative pathogen. Within left-sided IE, S. aureus mortality (18.2%) remained lower than non-S. aureus mortality (43.2%), possibly attributable to the high surgical rate in our institution. This finding has important methodological implications: the variable “high-risk pathogen” was excluded from the predictive model after demonstrating that its apparent prognostic effect was entirely confounded by IE laterality—a form of Simpson’s paradox[46]. This underscores the importance of careful stratified analysis before incorporating microbiological variables into predictive models in settings where pathogen distribution is strongly associated with IE laterality.
The poor discriminative performance of both RiskE (AUC 0.597) and ICE (AUC 0.632) in our cohort, with both scores statistically indistinguishable from chance, represents a clinically important finding. While these scores achieved AUCs of 0.76–0.82 in their derivation cohorts[7,8], their performance in external validations has been inconsistent. Across 12 published prognostic scores, pooled AUCs ranged from 0.64 to 0.83 with marked heterogeneity [10], and a systematic review concluded that no existing score comprehensively integrates clinical, microbiological, and echocardiographic data within the first 48–72 hours [9].
Multiple factors explain the score failure in our population. First, RiskE was derived exclusively from patients with left-sided IE undergoing cardiac surgery in Spanish centers [7], whereas 46.4% of our patients had right-sided IE. Second, neither score incorporates hemodialysis, vascular access type, or healthcare-associated IE status—variables that define the risk profile of our population. Third, the concentrated score distributions (median RiskE 9 points in both survivors and non-survivors) reflect the inability of these tools to capture the principal axes of prognostic variability in this population. These findings argue against uncritical adoption of European-derived prognostic scores in Latin American settings and support the TRIPOD recommendation for local model development and validation[32].
The exploratory embolism model yielded several noteworthy findings. Valvular regurgitation was the strongest predictor of embolic events (Firth OR 5.02, p = 0.001), consistent with evidence that hemodynamic turbulence from regurgitant flow may promote vegetation fragmentation and embolization [13,47]. Previous endocarditis was associated with reduced embolic risk (OR 0.16, p = 0.034), a finding that may reflect earlier clinical recognition and more aggressive initial management in patients with known prior IE, or alternatively, a survivor bias whereby patients who survived a previous episode may represent a more resilient subpopulation[48].
The absence of vegetation characteristics (size >10 mm, mobility) as significant predictors contrasts with the 2023 ESC guidelines, which emphasize vegetation size >10 mm as a major criterion for surgical intervention to prevent embolism[30]. However, our finding aligns with recent evidence suggesting that the predictive value of vegetation size is attenuated in cohorts with high rates of S. aureus IE, where embolism occurs early and often before echocardiographic evaluation [42]. In our cohort, the high prevalence of S. aureus (32%) and the large median vegetation size (19 mm) may have reduced the discriminative capacity of vegetation metrics. The moderate AUC of 0.737 (corrected 0.719) and excellent calibration (H-L p = 0.936) suggest that the model captures meaningful risk variation, though the exploratory nature and wide confidence intervals warrant cautious interpretation.
The WISCA analysis represents, to our knowledge, the first application of a Bayesian weighted-incidence antibiogram specifically for IE. The Bayesian approach offers several advantages over the traditional WISCA: (1) partial pooling through hierarchical random effects mitigates the instability of estimates for rare pathogen-antibiotic combinations; (2) posterior distributions provide credible intervals that more accurately reflect uncertainty than bootstrap confidence intervals; and (3) the framework naturally handles the sparse susceptibility data common in institution-level antibiograms [16,17,19,20].
Our WISCA results highlight how inference changes when moving from a non-Bayesian prevalence-weighted approach to a Bayesian hierarchical framework in the presence of institution-level sparsity (Figure 4 and Figure 5; Supplementary Tables S9–S10). The non-Bayesian WISCA is highly sensitive to small denominators within species–drug cells and to incomplete susceptibility testing, which can yield unstable and occasionally counterintuitive stratum-specific estimates—most evident in the community-acquired stratum (Figure 5; Supplementary Table S10). By contrast, hierarchical partial pooling stabilizes coverage by borrowing strength across species and antibiotics, and provides calibrated uncertainty through posterior credible intervals (Figure 4 and Figure 5; Supplementary Tables S9–S10). The substantial bidirectional shrinkage between traditional and Bayesian estimates (r = 0.683) highlights the value of hierarchical modeling in settings with sparse species-level susceptibility data: traditional WISCA overestimated coverage for well-tested regimens while underestimating it for those with fewer observations[16].
From an antimicrobial stewardship perspective, a clinically actionable insight is that ≥80% predicted coverage can be achieved with regimens that do not necessarily require the broadest-spectrum agents (Figure 4; Supplementary Table S9). In community-acquired IE, several lower-spectrum β-lactam–based combinations reached ~89–90% Bayesian coverage—particularly ceftriaxone + vancomycin and ceftriaxone + gentamicin (~90%) and cefazolin + vancomycin (~89%)—approaching carbapenem-containing combinations (~91%) (Figure 5; Supplementary Table S10). This pattern supports a stewardship-oriented strategy in which, when community acquisition is likely and local risk factors for resistant Gram-negative pathogens are absent, ceftriaxone- or cefazolin-based combinations plus targeted Gram-positive coverage may offer high predicted coverage while reducing selective pressure associated with routine carbapenem use.
Although tigecycline ranked highly in terms of predicted coverage, its role in infective endocarditis is inherently limited. Tigecycline achieves relatively low serum concentrations due to its extensive tissue distribution, raising concerns about adequate bactericidal activity in endovascular infections [49]. Moreover, pooled analyses have reported an excess mortality signal associated with tigecycline use in serious infections [50]. Accordingly, its performance in the present analysis should be interpreted as reflecting high in vitro coverage rather than endorsement as a stewardship-preferred empiric option for endocardial infection.
This study has several limitations. First, its retrospective, single-center design introduces potential selection and information bias, and the results reflect the specific epidemiological profile of one institution. Second, the sample size (97 patients, 22 events) limits the number of predictors to three (EPV 7.3), and confidence intervals are wide; however, Firth penalization and bootstrap validation mitigate overfitting concerns. Third, the absence of external validation means the model’s performance in independent populations is unknown. Fourth, the 29.9% rate of culture-negative IE may underestimate pathogen-specific contributions and limits the WISCA sample size. Finally, the WISCA results apply to our institution’s microbial ecology and may not be generalizable to centers with different pathogen distributions.
Multicenter validation of the local predictive model across Mexican and Latin American hospitals is the immediate priority. Development of a regional prognostic score incorporating hemodialysis status and vascular access type could improve risk stratification in LMIC populations. Serial WISCA monitoring would enable tracking of temporal trends in antimicrobial coverage, and molecular characterization of culture-negative IE episodes could improve etiological precision.
5. Conclusions
In this seven-year cohort from a Mexican referral university hospital, infective endocarditis was characterized by a young, hemodialysis-associated phenotype with substantial right-sided involvement and an in-hospital mortality of 22.9%. A parsimonious three-variable model—septic shock and acute heart failure as dominant predictors, with left-sided IE contributing clinically meaningful anatomic context—showed excellent discrimination after internal validation (AUC 0.922; optimism-corrected 0.908) and clearly outperformed the RiskE and ICE international scores, underscoring limited transportability of European/North American-derived tools to Latin American settings with different case-mix and management thresholds. Complementing risk stratification, a Bayesian hierarchical WISCA provided institution-specific, uncertainty-aware estimates of empirical regimen coverage under sparse species–drug susceptibility data, with well-calibrated convergence diagnostics. Combination regimens achieved the highest predicted coverages (vancomycin + gentamicin and meropenem + gentamicin, 87.0%), while several stewardship-favorable β-lactam–based combinations without routine carbapenem use maintained high predicted coverage (e.g., ceftriaxone + vancomycin and ceftriaxone + gentamicin, ~85%), and community-acquired IE consistently showed higher predicted coverage than healthcare-associated IE. Although tigecycline ranked highly by in vitro coverage, its pharmacologic limitations and prior safety signals warrant interpreting this as a coverage signal rather than an empiric recommendation for endovascular infection. These findings support a dual decision-support approach—early bedside risk estimation plus locally grounded Bayesian WISCA guidance for empiric therapy—while emphasizing the need for multicenter external validation and periodic recalibration as local epidemiology and resistance patterns evolve.
Supplementary Materials
The following supporting information can be downloaded at the website of this paper posted on Preprints.org, Figure S1: Markov chain Monte Carlo convergence diagnostics for the Bayesian weighted-incidence antibiogram models; Table S1: Clinical characteristics stratified by IE type (community-acquired vs. healthcare-associated); Table S2: Clinical characteristics by ICU admission; Table S3: Clinical characteristics by prolonged hospital stay (>69 days, 90th percentile); Table S4: Clinical characteristics by complicated IE (septic shock, acute heart failure, embolism, or ICU admission); Table S5: Multivariable logistic regression models for secondary outcomes; Table S6: Empirical antimicrobial regimens prescribed in infective endocarditis (n = 95); Table S7: Extended univariate analysis—crude odds ratios for in-hospital mortality; Table S8: Multi-model comparison for in-hospital mortality prediction; Table S9: Combined global WISCA: non-Bayesian and Bayesian empirical coverage estimates for 54 antimicrobial regimens in infective endocarditis; Table S10: Stratified WISCA by IE type: non-Bayesian and Bayesian empirical coverage estimates (community-acquired vs. healthcare-associated infective endocarditis); Table S11: Convergence diagnostics for all parameters of the Bayesian WISCA hierarchical models..
Author Contributions
Author Contributions: Conceptualization, J.B.-R., J.C.D.A.-J. and I.E.G.-P.; methodology, J.B.-R., J.C.D.A.-J. and J.E.H.-D.R.; software, J.B.-R.; validation, I.E.G.-P., J.E.H.-D.R., J.C.D.A.-J. and J.B.-R.; formal analysis, J.B.-R. and J.C.D.A.-J.; investigation, I.E.G.-P., J.E.H.-D.R., D.E.O.-S., C.G.-P., T.M.-A. and V.S.-B.; resources, J.E.H.-D.R., C.G.-P. and T.M.-A.; data curation, I.E.G.-P., D.E.O.-S., V.S.-B. and J.B.-R.; writing—original draft preparation, J.B.-R., I.E.G.-P. and J.C.D.A.-J.; writing—review and editing, I.E.G.-P., J.E.H.-D.R., D.E.O.-S., C.G.-P., T.M.-A., V.S.-B., J.C.D.A.-J. and J.B.-R.; visualization, J.B.-R. and D.E.O.-S.; supervision, J.E.H.-D.R., J.C.D.A.-J. and J.B.-R.; project administration, J.B.-R. and J.E.H.-D.R. All authors have read and agreed to the published version of the manuscript.
Funding
This research received no external funding.
Institutional Review Board Statement
The study was conducted in accordance with the Declaration of Helsinki, and approved by the Ethics Committee (Comité de Ética en Investigación) of the Antiguo Hospital Civil de Guadalajara “Fray Antonio Alcalde” (protocol code CEI 343/25; date of approval: 28 January 2026).
Informed Consent Statement
Patient consent was waived due to the retrospective design and minimal risk nature of the study, and because all data were analyzed in anonymized/de-identified form.
Data Availability Statement
The de-identified dataset supporting the findings of this study to reproduce the results and figures, is publicly available in Zenodo at DOI: [PEGAR_DOI_DE_ZENODO_AQUÍ]..
Acknowledgments
The authors have no acknowledgments to report.
Conflicts of Interest
The authors declare no conflicts of interest.
Abbreviations
The following abbreviations are used in this manuscript:
| Abbreviation | Definition |
| AHA | American Heart Association |
| AIC | Akaike Information Criterion |
| AUC | Area Under the Curve |
| AUC-ROC | Area Under the Receiver Operating Characteristic Curve |
| BMI | Body Mass Index |
| CCA | Complete-Case Analysis |
| CEI | Comité de Ética en Investigación |
| CI | Confidence Interval |
| CLSI | Clinical and Laboratory Standards Institute |
| CVC | Central Venous Catheter |
| DALY | Disability-Adjusted Life Year |
| EPV | Events per Variable |
| ESC | European Society of Cardiology |
| ESS | Effective Sample Size |
| GBD | Global Burden of Disease |
| HDI | Highest Density Interval |
| HIV | Human Immunodeficiency Virus |
| ICU | Intensive Care Unit |
| ICE | International Collaboration on Endocarditis score |
| IDI | Integrated Discrimination Improvement |
| IE | Infective Endocarditis |
| IQR | Interquartile Range |
| LASSO | Least Absolute Shrinkage and Selection Operator |
| LMIC | Low- and Middle-Income Countries |
| LRT | Likelihood Ratio Test |
| LVEF | Left Ventricular Ejection Fraction |
| MACE | Major Adverse Cardiac Events |
| MCAR | Missing Completely at Random |
| MCMC | Markov Chain Monte Carlo |
| M39 | CLSI document M39 |
| NE | Not Estimable |
| NRI | Net Reclassification Improvement |
| NUTS | No-U-Turn Sampler |
| OR | Odds Ratio |
| R-hat | Potential Scale Reduction Factor (R-hat) |
| RHD | Rheumatic Heart Disease |
| ROC | Receiver Operating Characteristic |
| RiskE | Risk-Endocarditis (RISK-E) score |
| SD | Standard Deviation |
| SOFA-2 | Sequential Organ Failure Assessment-2 |
| WISCA | Weighted-Incidence Syndromic Combination Antibiogram |
References
- Global Burden of Cardiovascular Diseases and Risks 2023 Collaborators Global, Regional, and National Burden of Cardiovascular Diseases and Risk Factors in 204 Countries and Territories, 1990-2023. J. Am. Coll. Cardiol. 2025, 86, 2167–2243. [CrossRef]
- Tzoumas, A.; Sagris, M.; Xenos, D.; Ntoumaziou, A.; Kyriakoulis, I.; Kakargias, F.; Liaqat, W.; Nagraj, S.; Patel, R.; Korosoglou, G.; et al. Epidemiological Profile and Mortality of Infective Endocarditis Over the Past Decade: A Systematic Review and Meta-Analysis of 133 Studies. Am. J. Cardiol. 2025, 244, 67–88. [Google Scholar] [CrossRef]
- Feng, J.; Liu, P.; Li, H.; Chen, H.; Shen, Q.; Liu, H.; Hu, J. Global, Regional, and National Burden of Endocarditis, 1990−2021: A Systematic Analysis of the GBD 2021 Study. BMC Cardiovasc. Disord. 2025, 25, 561. [Google Scholar] [CrossRef]
- Li, M.; Kim, J.B.; Sastry, B.K.S.; Chen, M. Infective Endocarditis. Lancet 2024, 404, 377–392. [Google Scholar] [CrossRef] [PubMed]
- Mutagaywa, R.K.; Vroon, J.C.; Fundikira, L.; Wind, A.M.; Kunambi, P.; Manyahi, J.; Kamuhabwa, A.; Kwesigabo, G.; Chamuleau, S.A.J.; Cramer, M.J.; et al. Infective Endocarditis in Developing Countries: An Update. Front. Cardiovasc. Med. 2022, 9, 1007118. [Google Scholar] [CrossRef] [PubMed]
- Ruiz-Beltran, A.M.; Barron-Magdaleno, C.; Ruiz-Beltran, S.M.; Sánchez-Villa, J.D.; Orihuela-Sandoval, C.; Oseguera-Moguel, J.; Payro-Ramírez, G.; Ruiz-Beltran, A.M.; Barron-Magdaleno, C.; Ruiz-Beltran, S.M.; et al. Infective Endocarditis: 10-Year Experience in a Non-Cardiovascular Center. Arch. Cardiol. México 2022, 92, 5–10. [Google Scholar] [CrossRef]
- Olmos, C.; Vilacosta, I.; Habib, G.; Maroto, L.; Fernández, C.; López, J.; Sarriá, C.; Salaun, E.; Di Stefano, S.; Carnero, M.; et al. Risk Score for Cardiac Surgery in Active Left-Sided Infective Endocarditis. Heart 2017, 103, 1435–1442. [Google Scholar] [CrossRef] [PubMed]
- Park, L.P.; Chu, V.H.; Peterson, G.; Skoutelis, A.; Lejko-Zupa, T.; Bouza, E.; Tattevin, P.; Habib, G.; Tan, R.; Gonzalez, J.; et al. Validated Risk Score for Predicting 6-Month Mortality in Infective Endocarditis. J. Am. Heart Assoc. 2016, 5, e003016. [Google Scholar] [CrossRef]
- Rizzo, V.; Salmasi, M.Y.; Sabetai, M.; Primus, C.; Sandoe, J.; Lewis, M.; Woldman, S.; Athanasiou, T. Infective Endocarditis: Do We Have an Effective Risk Score Model? A Systematic Review. Front. Cardiovasc. Med. 2023, 10. [Google Scholar] [CrossRef] [PubMed]
- Agrawal, A.; Arockiam, A.D.; Dahdah, J.E.; Honnekeri, B.; Schleicher, M.; Shekhar, S.; Haroun, E.; Witten, J.; Majid, M.; Pettersson, G.; et al. Comparisons of Risk Scores for Infective Endocarditis Surgery: A Meta-Analysis. Angiology 2025, 77, 176–185. [Google Scholar] [CrossRef]
- Mikus, E.; Sangiorgi, D.; Calvi, S.; Fiorentino, M.; Tenti, E.; Dalle Mura, F.; Savini, C. Enhanced Risk Stratification in Infective Endocarditis Surgery: A Comprehensive External Validation of All Available Mortality Prediction Scores. Clin. Epidemiol. 2025, 17, 1087–1097. [Google Scholar] [CrossRef]
- Urina-Jassir, M.; Jaimes-Reyes, M.A.; Martinez-Vernaza, S.; Quiroga-Vergara, C.; Urina-Triana, M. Clinical, Microbiological, and Imaging Characteristics of Infective Endocarditis in Latin America: A Systematic Review. Int. J. Infect. Dis. 2022, 117, 312–321. [Google Scholar] [CrossRef]
- Delgado, V.; Ajmone Marsan, N.; de Waha, S.; Bonaros, N.; Brida, M.; Burri, H.; Caselli, S.; Doenst, T.; Ederhy, S.; Erba, P.A.; et al. 2023 ESC Guidelines for the Management of Endocarditis. Eur. Heart J. 2023, 44, 3948–4042. [Google Scholar] [CrossRef]
- Peláez Ballesta, A.I.; García Vázquez, E.; Gómez Gómez, J. Infective Endocarditis Treated in a Secondary Hospital: Epidemiological, Clinical, Microbiological Characteristics and Prognosis, with Special Reference to Patients Transferred to a Third Level Hospital. Rev. Espanola Quimioter. Publicacion Of. Soc. Espanola Quimioter. 2022, 35, 35–42. [Google Scholar] [CrossRef]
- Hebert, C.; Ridgway, J.; Vekhter, B.; Brown, E.C.; Weber, S.G.; Robicsek, A. Demonstration of the Weighted-Incidence Syndromic Combination Antibiogram: An Empiric Prescribing Decision Aid. Infect. Control Hosp. Epidemiol. 2012, 33, 381–388. [Google Scholar] [CrossRef]
- Briseno-Ramírez, J.; Gómez-Quiroz, A.; Avila-Cardenas, B.B.; De Arcos-Jiménez, J.C.; Perales-Guerrero, L.; Andrade-Villanueva, J.F.; Martínez-Ayala, P. Development of a Weighted-Incidence Syndromic Combination Antibiogram (WISCA) to Guide Empiric Antibiotic Treatment for Ventilator-Associated Pneumonia in a Mexican Tertiary Care University Hospital. BMC Infect. Dis. 2025, 25, 307. [Google Scholar] [CrossRef]
- Gómez-Quiroz, A.; Avila-Cardenas, B.B.; De Arcos-Jiménez, J.C.; Perales-Guerrero, L.; Martínez-Ayala, P.; Briseno-Ramirez, J. The Clinical Implications of Inappropriate Therapy in Community-Onset Urinary Tract Infections and the Development of a Bayesian Hierarchical Weighted-Incidence Syndromic Combination Antibiogram. Antibiotics 2025, 14, 187. [Google Scholar] [CrossRef] [PubMed]
- Indrawati, L.; Sugianli, A.K.; Prakoso, B.J.; Gunawan, A.; Soerarso, R.; Soesanto, A.M.; Dewi, A.D. Antibiotic Susceptibility among Infective Endocarditis Population: Syndromic Antibiogram Evaluation at Indonesian National Cardiovascular Center. Indones. J. Clin. Pathol. Med. Lab. 2024, 31, 72–78. [Google Scholar] [CrossRef]
- Barbieri, E.; Bottigliengo, D.; Tellini, M.; Minotti, C.; Marchiori, M.; Cavicchioli, P.; Gregori, D.; Giaquinto, C.; Da Dalt, L.; Donà, D. Development of a Weighted-Incidence Syndromic Combination Antibiogram (WISCA) to Guide the Choice of the Empiric Antibiotic Treatment for Urinary Tract Infection in Paediatric Patients: A Bayesian Approach. Antimicrob. Resist. Infect. Control 2021, 10, 74. [Google Scholar] [CrossRef] [PubMed]
- Liberati, C.; Donà, D.; Maestri, L.; Petris, M.G.; Barbieri, E.; Gallo, E.; Gallocchio, J.; Pierobon, M.; Calore, E.; Zin, A.; et al. Application of the Weighted-Incidence Syndromic Combination Antibiogram (WISCA) to Guide the Empiric Antibiotic Treatment of Febrile Neutropenia in Oncological Paediatric Patients: Experience from Two Paediatric Hospitals in Northern Italy. Ann. Clin. Microbiol. Antimicrob. 2024, 23, 16. [Google Scholar] [CrossRef] [PubMed]
- Salm, J.; Ikker, F.; Noory, E.; Beschorner, U.; Kramer, T.S.; Westermann, D.; Zeller, T. Weighted-Incidence Syndromic Combination Antibiogram (WISCA) to Support Empirical Antibiotic Therapy Decisions in Infected Ischemic Leg Ulcers—A Feasibility Study. J. Clin. Med. 2024, 13. [Google Scholar] [CrossRef]
- Ranzani, O.T.; Singer, M.; Salluh, J.I.F.; Shankar-Hari, M.; Pilcher, D.; Berger-Estilita, J.; Coopersmith, C.M.; Juffermans, N.P.; Laffey, J.; Reinikainen, M.; et al. Development and Validation of the Sequential Organ Failure Assessment (SOFA)-2 Score. JAMA 2025, 334, 2090–2103. [Google Scholar] [CrossRef] [PubMed]
- Model-Building Strategies and Methods for Logistic Regression - 2013 - Wiley Series in Probability and Statistics - Wiley Online Library. Available online: https://onlinelibrary.wiley.com/doi/10.1002/9781118548387.ch4 (accessed on 16 February 2026).
- FIRTH, D. Bias Reduction of Maximum Likelihood Estimates. Biometrika 1993, 80, 27–38. [Google Scholar] [CrossRef]
- Tibshirani, R. Regression Shrinkage and Selection Via the Lasso. J. R. Stat. Soc. Ser. B Methodol. 1996, 58, 267–288. [Google Scholar] [CrossRef]
- Harrell, F.E.; Lee, K.L.; Mark, D.B. Multivariable Prognostic Models: Issues in Developing Models, Evaluating Assumptions and Adequacy, and Measuring and Reducing Errors. Stat. Med. 1996, 15, 361–387. [Google Scholar] [CrossRef]
- Hosmer, D.W.; Lemesbow, S. Goodness of Fit Tests for the Multiple Logistic Regression Model. Commun. Stat. - Theory Methods 1980, 9, 1043–1069. [Google Scholar] [CrossRef]
- DeLong, E.R.; DeLong, D.M.; Clarke-Pearson, D.L. Comparing the Areas under Two or More Correlated Receiver Operating Characteristic Curves: A Nonparametric Approach. Biometrics 1988, 44, 837–845. [Google Scholar] [CrossRef]
- Pencina, M.J.; D’Agostino, R.B.; D’Agostino, R.B.; Vasan, R.S. Evaluating the Added Predictive Ability of a New Marker: From Area under the ROC Curve to Reclassification and Beyond. Stat. Med. 2008, 27, 157–172; discussion 207-212. [Google Scholar] [CrossRef]
- Delgado, V.; Ajmone Marsan, N.; de Waha, S.; Bonaros, N.; Brida, M.; Burri, H.; Caselli, S.; Doenst, T.; Ederhy, S.; Erba, P.A.; et al. 2023 ESC Guidelines for the Management of Endocarditis. Eur. Heart J. 2023, 44, 3948–4042. [Google Scholar] [CrossRef] [PubMed]
- Baltimore, R.S.; Gewitz, M.; Baddour, L.M.; Beerman, L.B.; Jackson, M.A.; Lockhart, P.B.; Pahl, E.; Schutze, G.E.; Shulman, S.T.; Willoughby, R.; et al. Infective Endocarditis in Childhood: 2015 Update: A Scientific Statement From the American Heart Association. Circulation 2015, 132, 1487–1515. [Google Scholar] [CrossRef]
- Collins, G.S.; Reitsma, J.B.; Altman, D.G.; Moons, K.G.M. Transparent Reporting of a Multivariable Prediction Model for Individual Prognosis or Diagnosis (TRIPOD): The TRIPOD Statement. BMJ 2015, 350, g7594. [Google Scholar] [CrossRef]
- Arias, C.A.; Reyes, J.; Carvajal, L.P.; Rincon, S.; Diaz, L.; Panesso, D.; Ibarra, G.; Rios, R.; Munita, J.M.; Salles, M.J.; et al. A Prospective Cohort Multicenter Study of Molecular Epidemiology and Phylogenomics of Staphylococcus Aureus Bacteremia in Nine Latin American Countries. Antimicrob. Agents Chemother. 2017, 61, e00816-17. [Google Scholar] [CrossRef]
- Mutagaywa, R.K.; Vroon, J.C.; Fundikira, L.; Wind, A.M.; Kunambi, P.; Manyahi, J.; Kamuhabwa, A.; Kwesigabo, G.; Chamuleau, S.A.J.; Cramer, M.J.; et al. Infective Endocarditis in Developing Countries: An Update. Front. Cardiovasc. Med. 2022, 9, 1007118. [Google Scholar] [CrossRef] [PubMed]
- Chu, V.H.; Park, L.P.; Athan, E.; Delahaye, F.; Freiberger, T.; Lamas, C.; Miro, J.M.; Mudrick, D.W.; Strahilevitz, J.; Tribouilloy, C.; et al. Association between Surgical Indications, Operative Risk, and Clinical Outcome in Infective Endocarditis: A Prospective Study from the International Collaboration on Endocarditis. Circulation 2015, 131, 131–140. [Google Scholar] [CrossRef]
- Kang, D.-H.; Kim, Y.-J.; Kim, S.-H.; Sun, B.J.; Kim, D.-H.; Yun, S.-C.; Song, J.-M.; Choo, S.J.; Chung, C.-H.; Song, J.-K.; et al. Early Surgery versus Conventional Treatment for Infective Endocarditis. N. Engl. J. Med. 2012, 366, 2466–2473. [Google Scholar] [CrossRef] [PubMed]
- Mejia, O.A.V.; de Mendonça, F.C.C.; Sampaio, L.A.B.N.; Galas, F.R.B.G.; Pontes, M.F.; Caneo, L.F.; Dallan, L.R.P.; Lisboa, L.A.F.; Ferreira, J.F.M.; Dallan, L.A. de O.; et al. Adherence to the Cardiac Surgery Checklist Decreased Mortality at a Teaching Hospital: A Retrospective Cohort Study. Clinics 2022, 77, 100048. [Google Scholar] [CrossRef]
- Chirillo, F.; Scotton, P.; Rocco, F.; Rigoli, R.; Borsatto, F.; Pedrocco, A.; De Leo, A.; Minniti, G.; Polesel, E.; Olivari, Z. Impact of a Multidisciplinary Management Strategy on the Outcome of Patients with Native Valve Infective Endocarditis. Am. J. Cardiol. 2013, 112, 1171–1176. [Google Scholar] [CrossRef]
- Chahoud, J.; Sharif Yakan, A.; Saad, H.; Kanj, S.S. Right-Sided Infective Endocarditis and Pulmonary Infiltrates: An Update. Cardiol. Rev. 2016, 24, 230–237. [Google Scholar] [CrossRef] [PubMed]
- Durante-Mangoni, E.; Bradley, S.; Selton-Suty, C.; Tripodi, M.-F.; Barsic, B.; Bouza, E.; Cabell, C.H.; Ramos, A.I. de O.; Fowler, V.; Hoen, B.; et al. Current Features of Infective Endocarditis in Elderly Patients: Results of the International Collaboration on Endocarditis Prospective Cohort Study. Arch. Intern. Med. 2008, 168, 2095–2103. [Google Scholar] [CrossRef]
- Olmos, C.; Vilacosta, I.; Fernández-Pérez, C.; Bernal, J.L.; Ferrera, C.; García-Arribas, D.; Pérez-García, C.N.; San Román, J.A.; Maroto, L.; Macaya, C.; et al. The Evolving Nature of Infective Endocarditis in Spain: A Population-Based Study (2003 to 2014). J. Am. Coll. Cardiol. 2017, 70, 2795–2804. [Google Scholar] [CrossRef]
- Murdoch, D.R.; Corey, G.R.; Hoen, B.; Miró, J.M.; Fowler, V.G.; Bayer, A.S.; Karchmer, A.W.; Olaison, L.; Pappas, P.A.; Moreillon, P.; et al. Clinical Presentation, Etiology, and Outcome of Infective Endocarditis in the 21st Century: The International Collaboration on Endocarditis-Prospective Cohort Study. Arch. Intern. Med. 2009, 169, 463–473. [Google Scholar] [CrossRef] [PubMed]
- Toyoda, N.; Chikwe, J.; Itagaki, S.; Gelijns, A.C.; Adams, D.H.; Egorova, N.N. Trends in Infective Endocarditis in California and New York State, 1998-2013. JAMA 2017, 317, 1652–1660. [Google Scholar] [CrossRef]
- Tong, S.Y.C.; Davis, J.S.; Eichenberger, E.; Holland, T.L.; Fowler, V.G. Staphylococcus Aureus Infections: Epidemiology, Pathophysiology, Clinical Manifestations, and Management. Clin. Microbiol. Rev. 2015, 28, 603–661. [Google Scholar] [CrossRef]
- Bai, A.D.; Lo, C.K.L.; Komorowski, A.S.; Suresh, M.; Guo, K.; Garg, A.; Tandon, P.; Senecal, J.; Del Corpo, O.; Stefanova, I.; et al. Staphylococcus Aureus Bacteraemia Mortality: A Systematic Review and Meta-Analysis. Clin. Microbiol. Infect. Off. Publ. Eur. Soc. Clin. Microbiol. Infect. Dis. 2022, 28, 1076–1084. [Google Scholar] [CrossRef]
- Blyth, C.R. On Simpson’s Paradox and the Sure-Thing Principle. J. Am. Stat. Assoc. 1972, 67, 364–366. [Google Scholar] [CrossRef]
- Li, M.; Kim, J.B.; Sastry, B.K.S.; Chen, M. Infective Endocarditis. The Lancet 2024, 404, 377–392. [Google Scholar] [CrossRef]
- Miller, D.P.; Gomberg-Maitland, M.; Humbert, M. Survivor Bias and Risk Assessment. Eur. Respir. J. 2012, 40, 530–532. [Google Scholar] [CrossRef] [PubMed]
- Rubino, C.M.; Bhavnani, S.M.; Forrest, A.; Dukart, G.; Dartois, N.; Cooper, A.; Korth-Bradley, J.; Ambrose, P.G. Pharmacokinetics-Pharmacodynamics of Tigecycline in Patients with Community-Acquired Pneumonia. Antimicrob. Agents Chemother. 2012, 56, 130–136. [Google Scholar] [CrossRef]
- Prasad, P.; Sun, J.; Danner, R.L.; Natanson, C. Excess Deaths Associated with Tigecycline after Approval Based on Noninferiority Trials. Clin. Infect. Dis. Off. Publ. Infect. Dis. Soc. Am. 2012, 54, 1699–1709. [Google Scholar] [CrossRef]
Figure 1.
Comprehensive microbiological profile of infective endocarditis (N = 97). (A) Blood culture results: 70.1% culture-positive (n = 68) and 29.9% culture-negative (n = 29). (B) Pathogen group distribution among culture-positive isolates (n = 68), showing S. aureus predominance (45.6%). (C) Species-level breakdown: 23 distinct species identified across six pathogen groups, color-coded by group. (D) In-hospital mortality by pathogen group (lollipop plot), highlighting the highest mortality in Enterococcus spp. (100%) and fungi (50%) and the paradoxically low S. aureus mortality (12.9%). (E) Microbial ecology stratified by IE type (community-acquired vs. healthcare-associated), illustrating the dominance of Streptococcus spp. in community-acquired and S. aureus in healthcare-associated IE. (F) Antibiotic susceptibility heatmap (percent susceptible) for 10 key antimicrobials by pathogen group, derived from the weighted-incidence antibiogram susceptibility matrix.
Figure 1.
Comprehensive microbiological profile of infective endocarditis (N = 97). (A) Blood culture results: 70.1% culture-positive (n = 68) and 29.9% culture-negative (n = 29). (B) Pathogen group distribution among culture-positive isolates (n = 68), showing S. aureus predominance (45.6%). (C) Species-level breakdown: 23 distinct species identified across six pathogen groups, color-coded by group. (D) In-hospital mortality by pathogen group (lollipop plot), highlighting the highest mortality in Enterococcus spp. (100%) and fungi (50%) and the paradoxically low S. aureus mortality (12.9%). (E) Microbial ecology stratified by IE type (community-acquired vs. healthcare-associated), illustrating the dominance of Streptococcus spp. in community-acquired and S. aureus in healthcare-associated IE. (F) Antibiotic susceptibility heatmap (percent susceptible) for 10 key antimicrobials by pathogen group, derived from the weighted-incidence antibiogram susceptibility matrix.
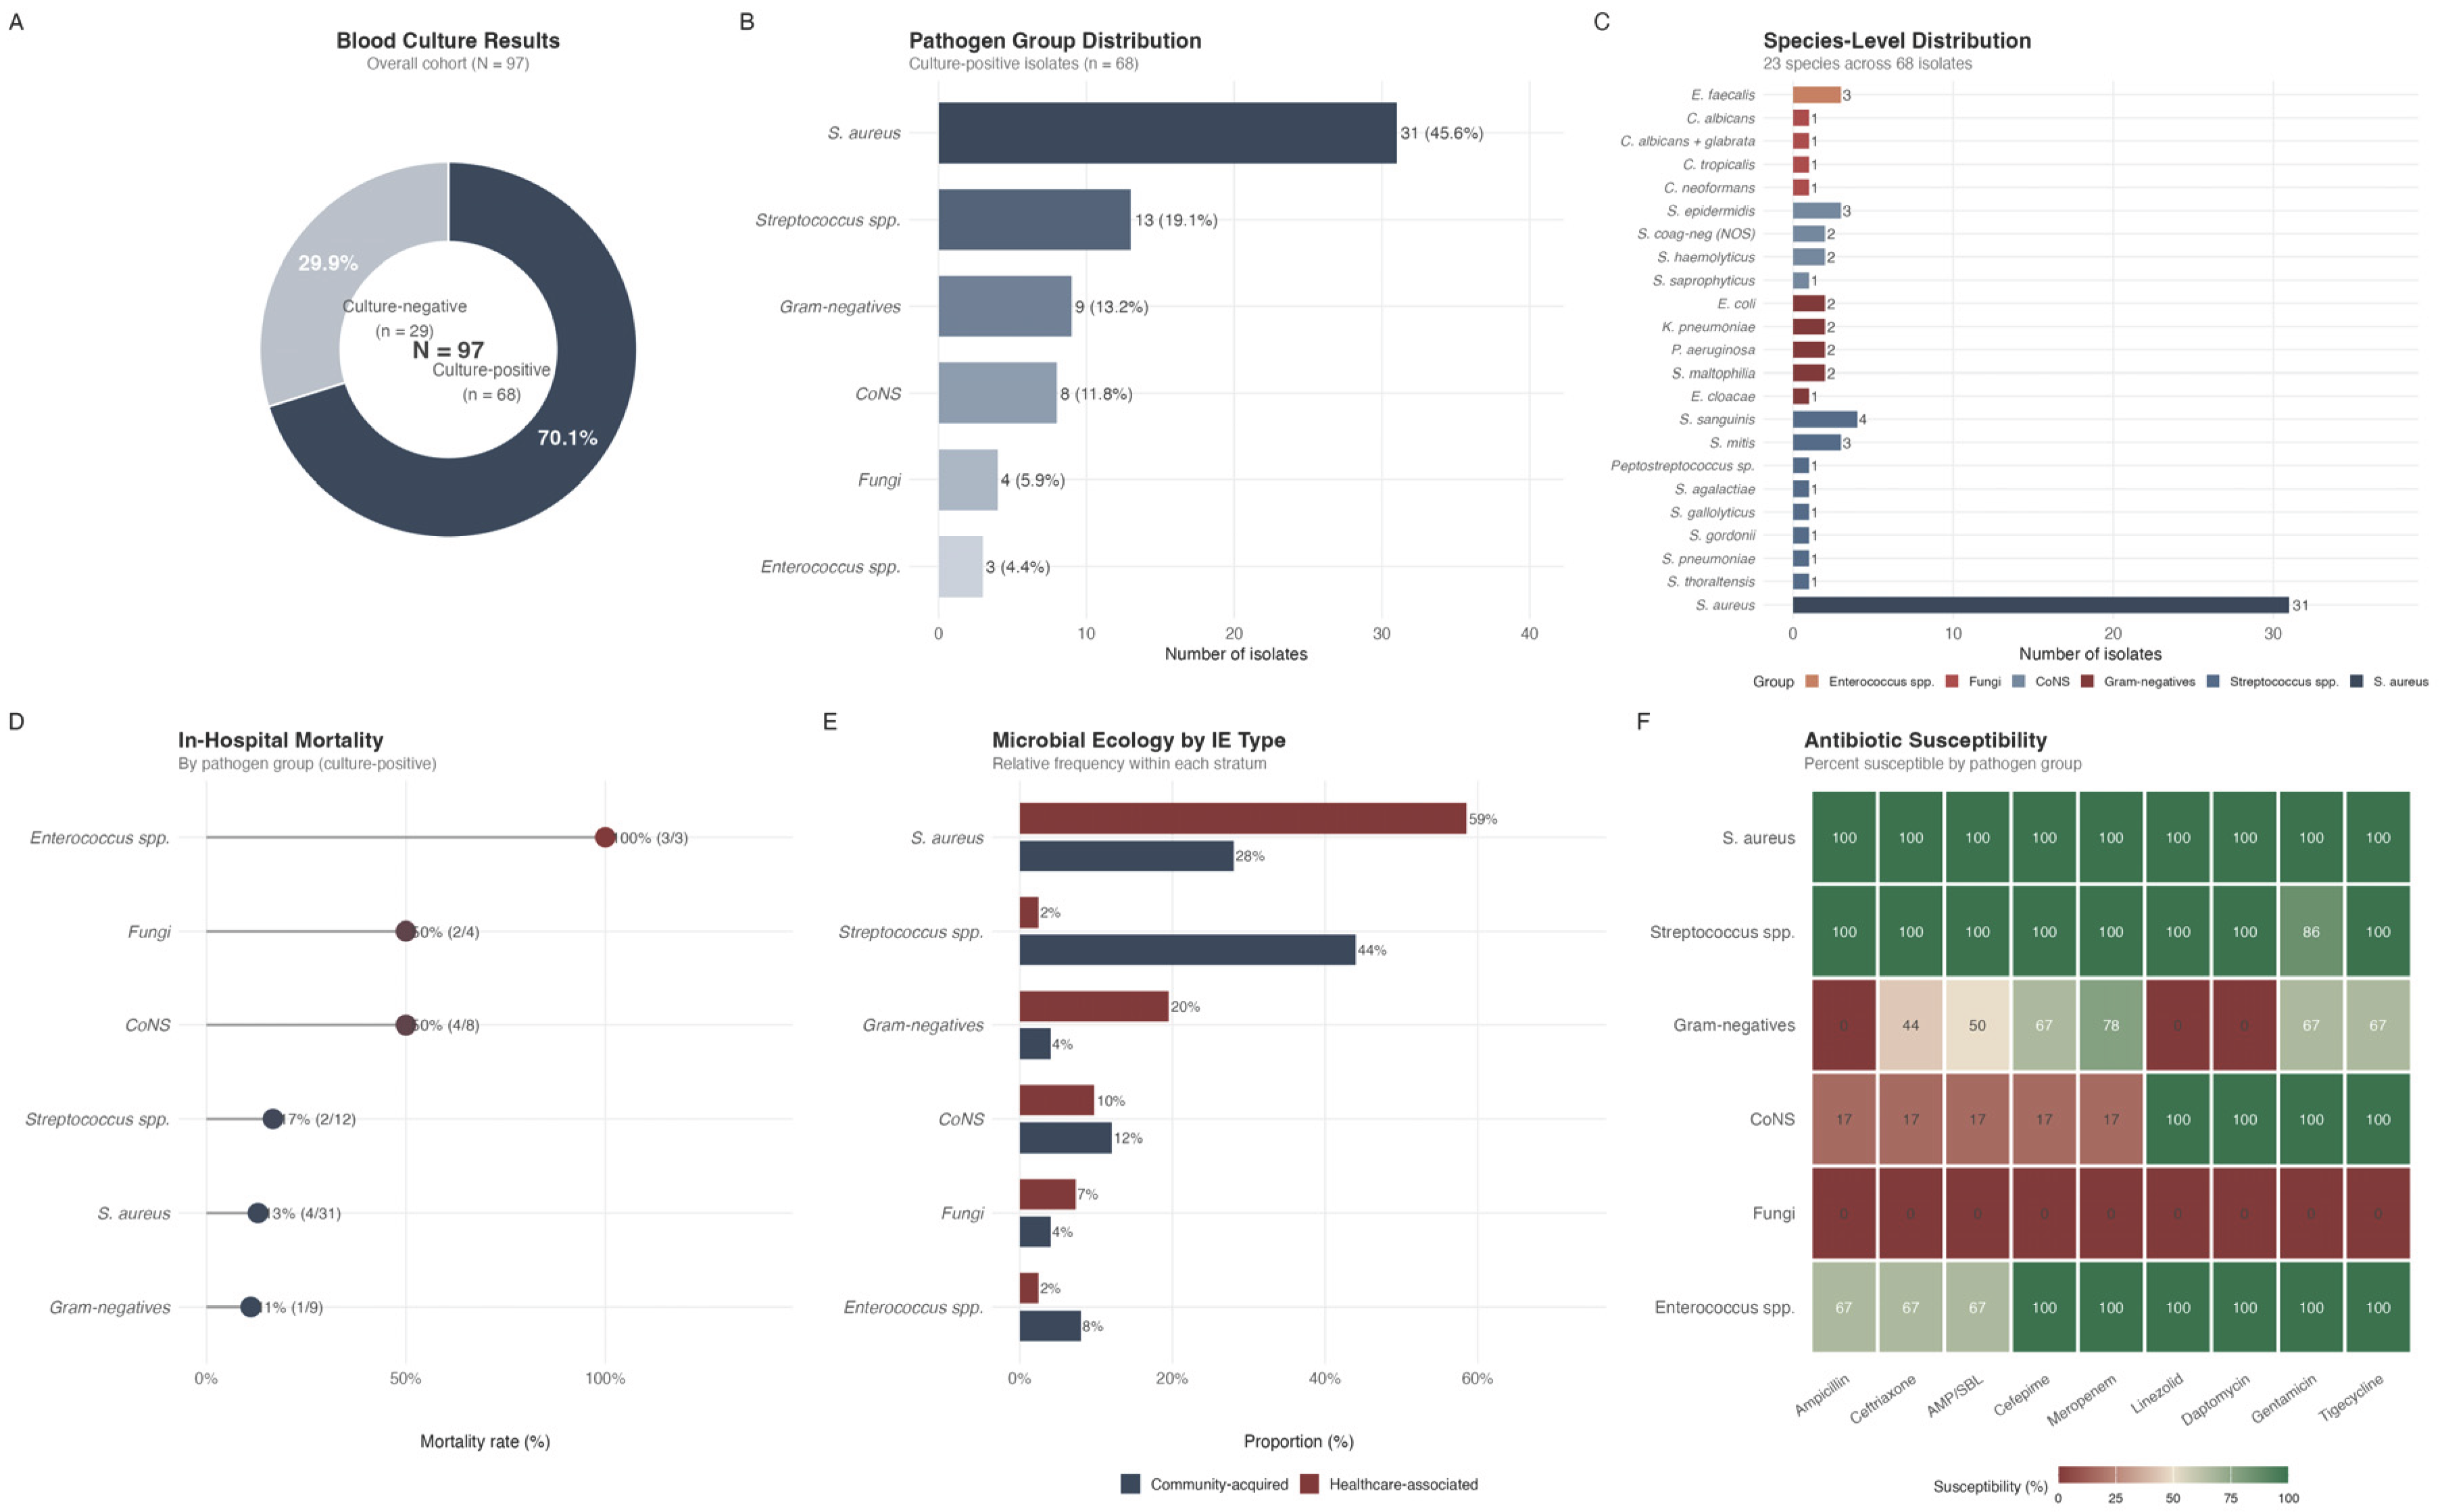
Figure 3.
Predictive performance of local and international models for in-hospital mortality in infective endocarditis. (a) Receiver operating characteristic curves for all evaluated models; the final three-variable model (Model 2) is highlighted. (b) Forest plot of area under the curve with 95% confidence intervals, ordered by discriminative performance; vertical dashed lines indicate non-discrimination (0.5) and acceptable discrimination (0.7) thresholds. (c) Decision curve analysis comparing the net clinical benefit of Model 2 and Model 1 against default strategies (treat all, treat none) across threshold probabilities of 0–60%.
Figure 3.
Predictive performance of local and international models for in-hospital mortality in infective endocarditis. (a) Receiver operating characteristic curves for all evaluated models; the final three-variable model (Model 2) is highlighted. (b) Forest plot of area under the curve with 95% confidence intervals, ordered by discriminative performance; vertical dashed lines indicate non-discrimination (0.5) and acceptable discrimination (0.7) thresholds. (c) Decision curve analysis comparing the net clinical benefit of Model 2 and Model 1 against default strategies (treat all, treat none) across threshold probabilities of 0–60%.
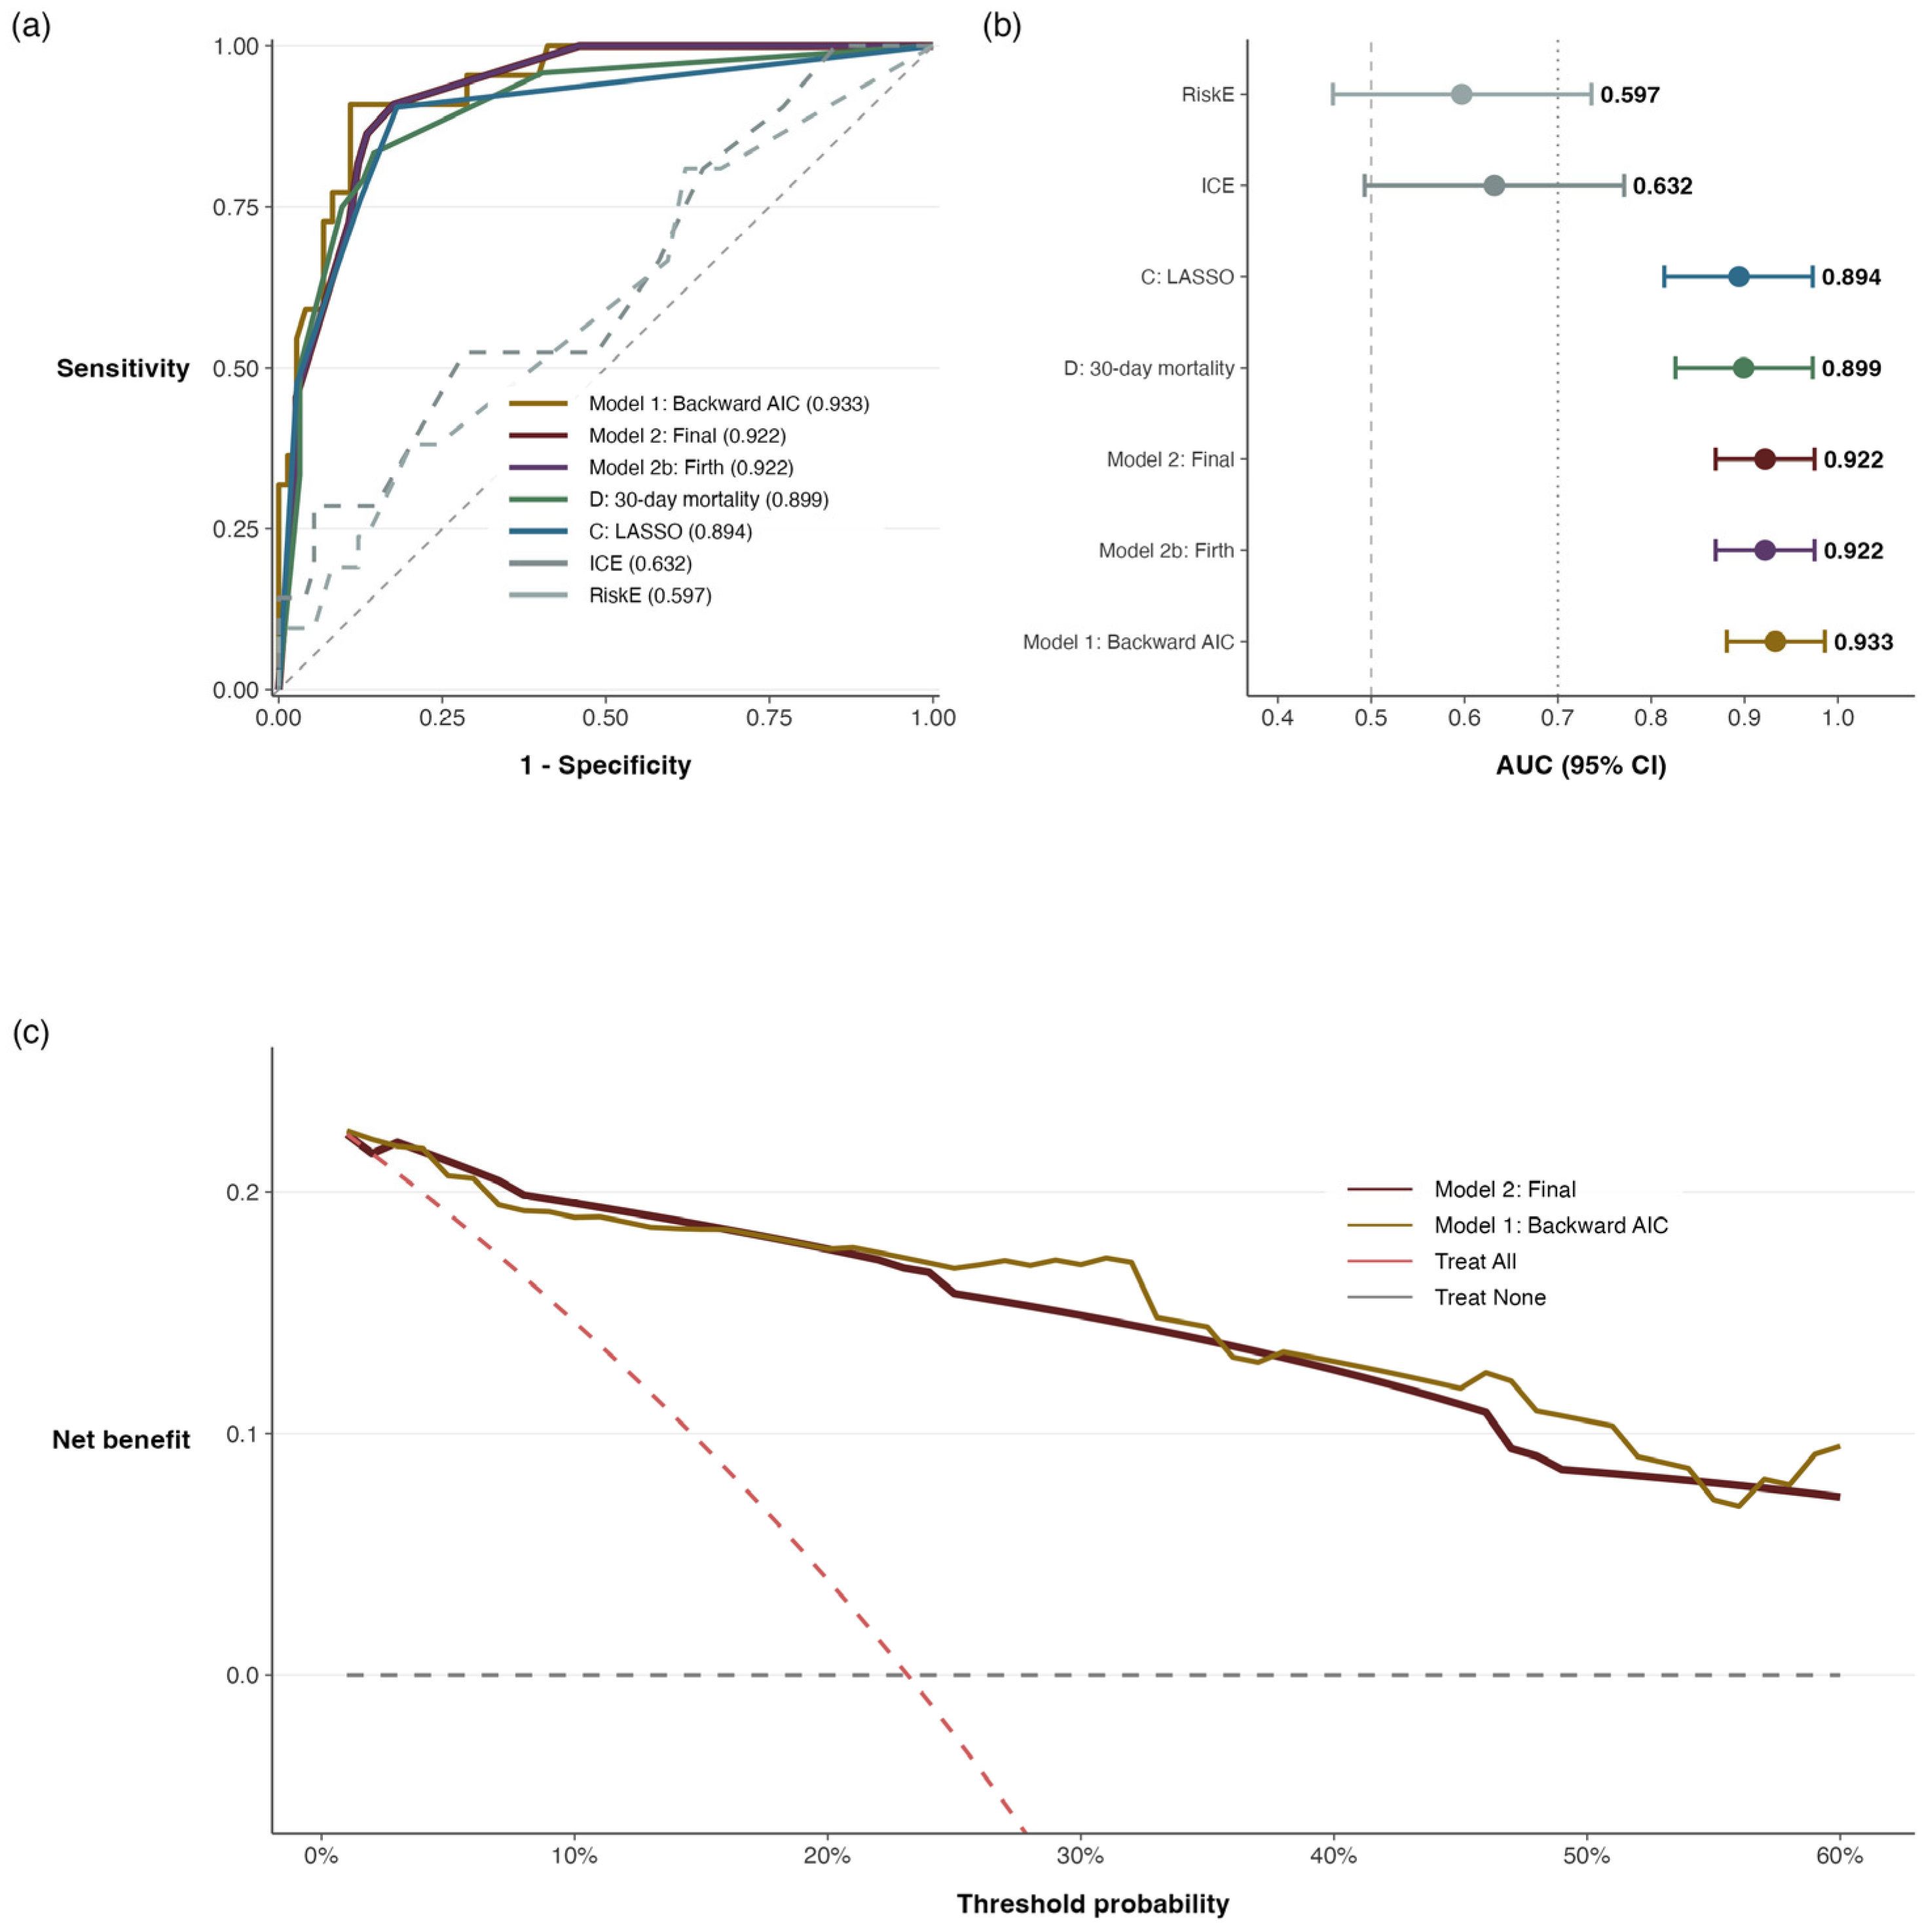
Figure 4.
Bayesian weighted-incidence syndromic combination antibiogram (WISCA) for infective endocarditis. Forest plot displaying posterior median coverage (%) with 95% highest density intervals for 54 antimicrobial regimens (20 monotherapies and 34 combinations), stratified by regimen type. Diamonds indicate non-hierarchical WISCA point estimates. The dashed vertical line denotes the 80% coverage threshold recommended by CLSI M39. The Bayesian hierarchical model included species-level (n = 23) and antibiotic-level (n = 20) random intercepts fitted with 4 MCMC chains of 4,000 iterations each (n = 68 isolates; seed 2026).
Figure 4.
Bayesian weighted-incidence syndromic combination antibiogram (WISCA) for infective endocarditis. Forest plot displaying posterior median coverage (%) with 95% highest density intervals for 54 antimicrobial regimens (20 monotherapies and 34 combinations), stratified by regimen type. Diamonds indicate non-hierarchical WISCA point estimates. The dashed vertical line denotes the 80% coverage threshold recommended by CLSI M39. The Bayesian hierarchical model included species-level (n = 23) and antibiotic-level (n = 20) random intercepts fitted with 4 MCMC chains of 4,000 iterations each (n = 68 isolates; seed 2026).
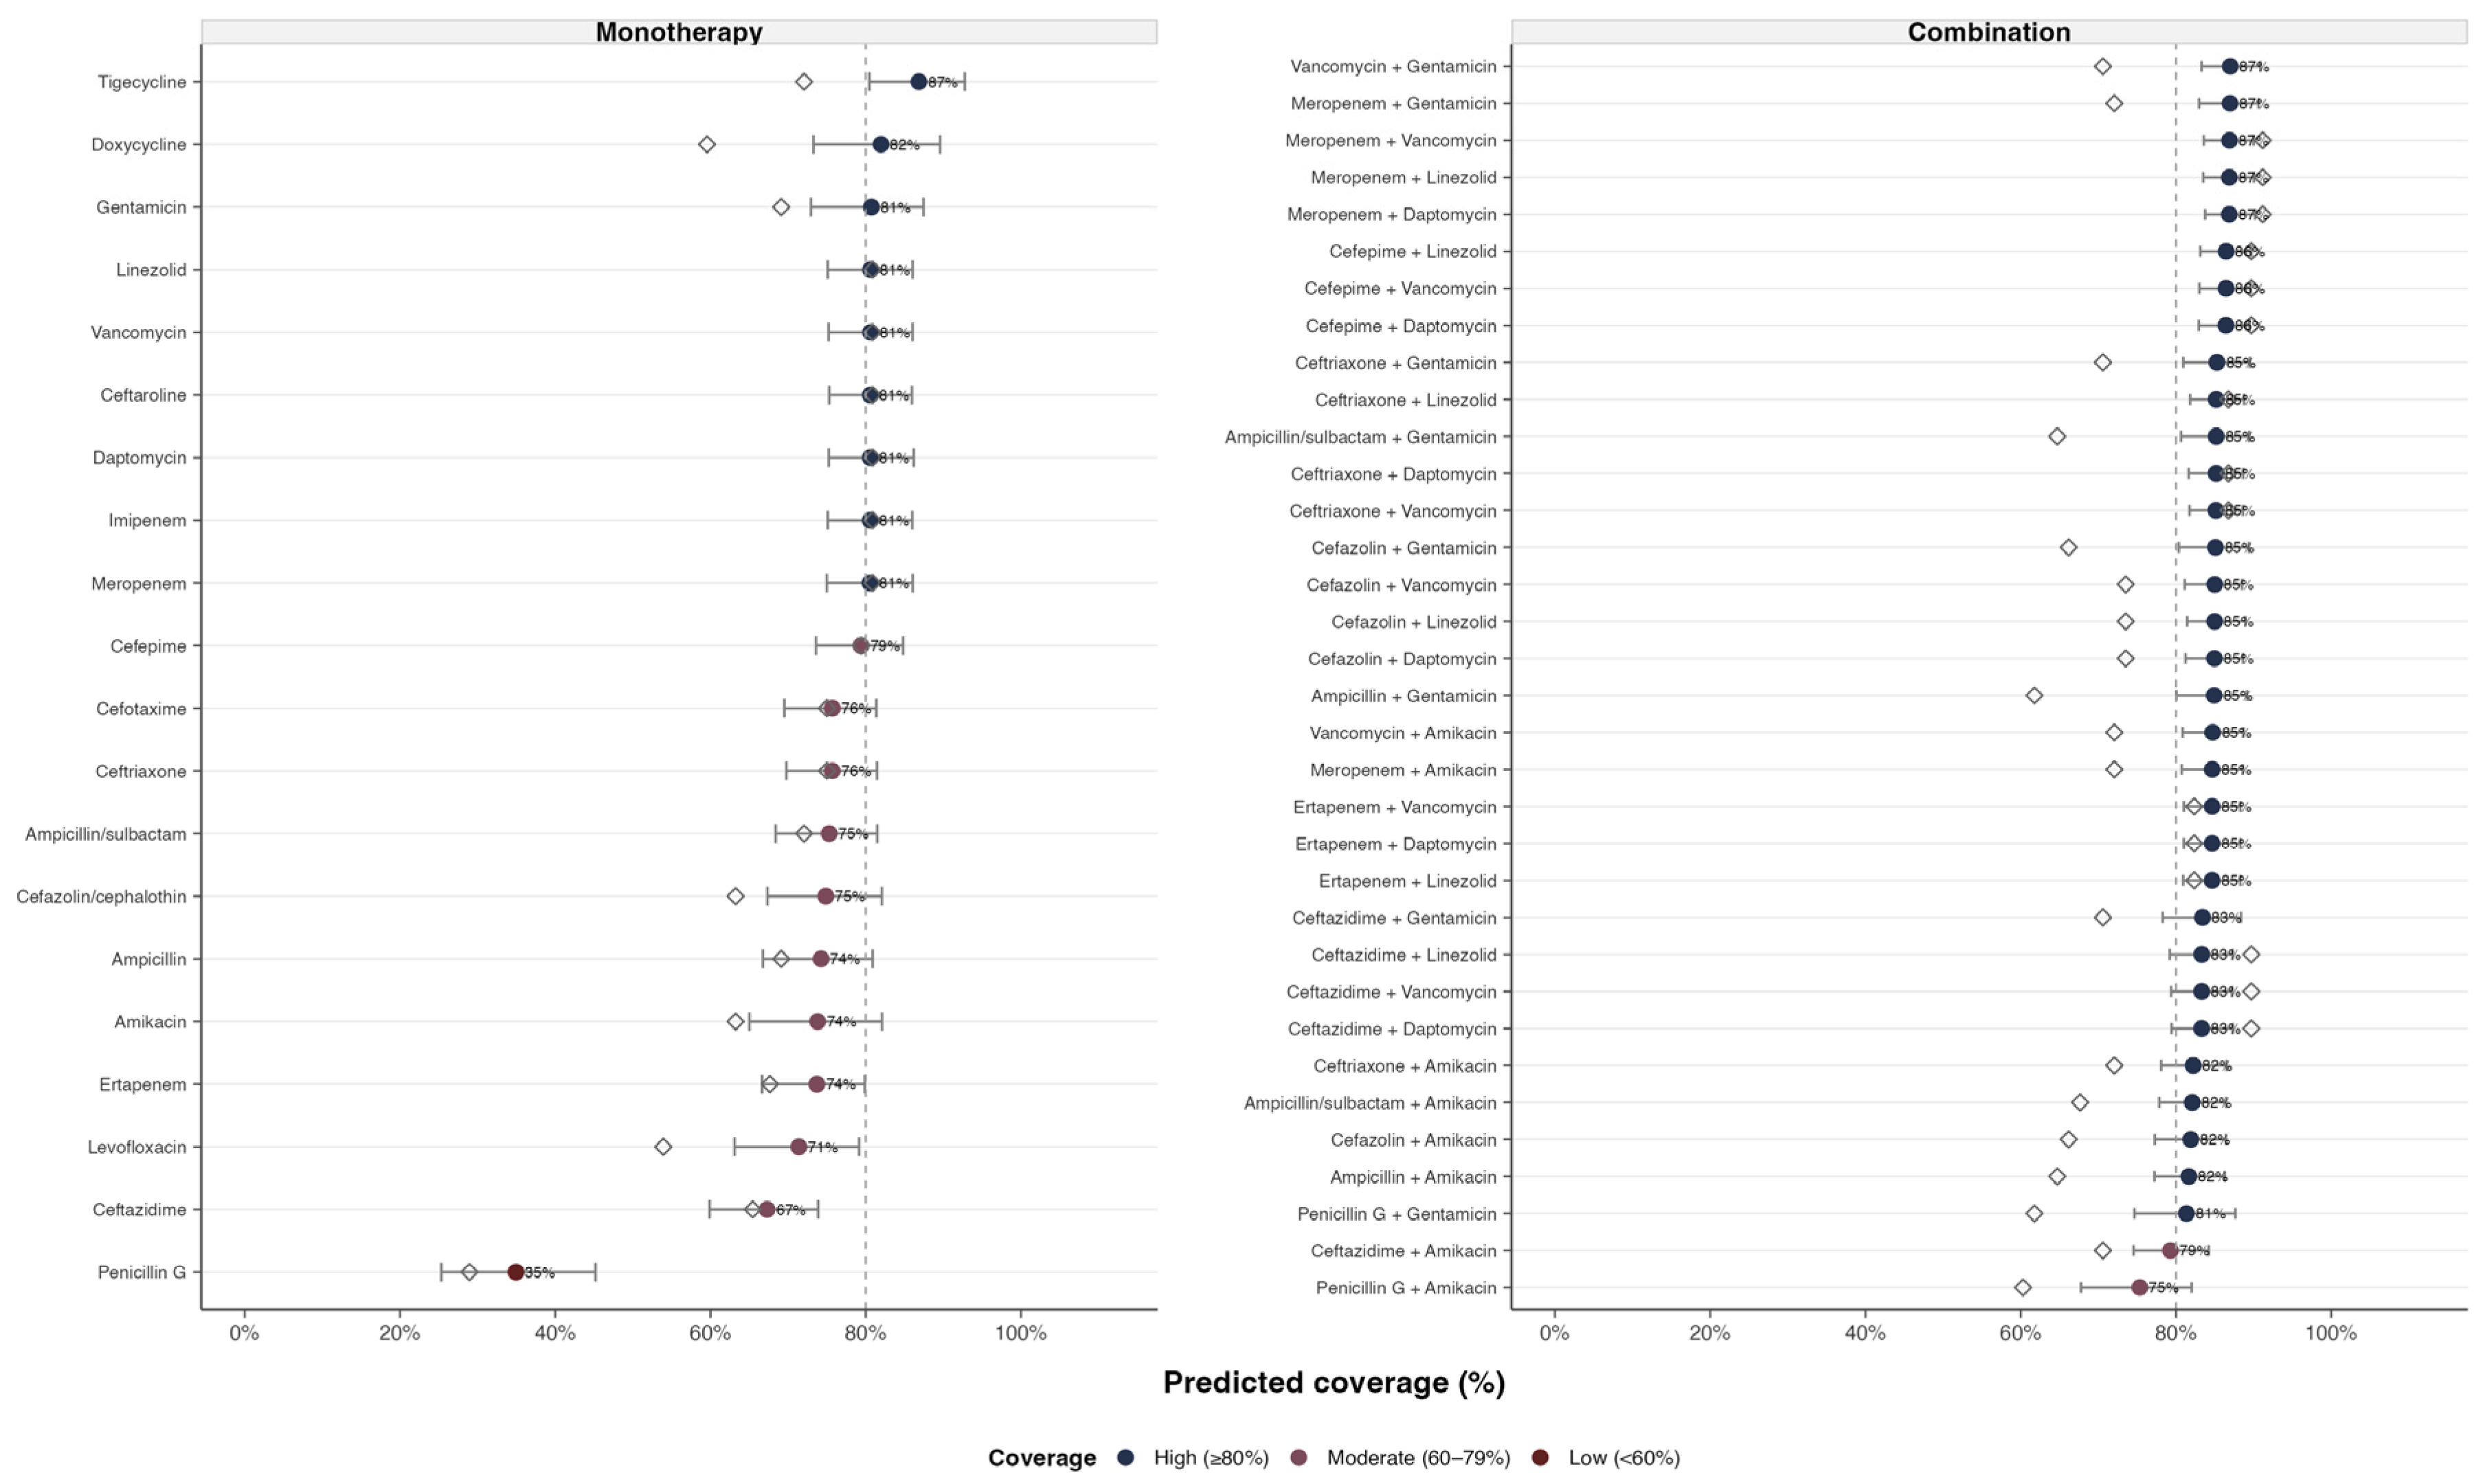
Figure 5.
Stratified Bayesian WISCA by infective endocarditis type. Posterior median coverage (%) with 95% highest density intervals for 54 antimicrobial regimens, faceted by community-acquired (n = 25 isolates) and healthcare-associated IE (n = 41 isolates). Diamonds indicate non-hierarchical WISCA estimates. Coverage was consistently higher for community-acquired IE across all regimens, with a near-perfect rank correlation between strata (r = 0.999), reflecting a uniform downward susceptibility shift in healthcare-associated IE rather than a differential resistance pattern.
Figure 5.
Stratified Bayesian WISCA by infective endocarditis type. Posterior median coverage (%) with 95% highest density intervals for 54 antimicrobial regimens, faceted by community-acquired (n = 25 isolates) and healthcare-associated IE (n = 41 isolates). Diamonds indicate non-hierarchical WISCA estimates. Coverage was consistently higher for community-acquired IE across all regimens, with a near-perfect rank correlation between strata (r = 0.999), reflecting a uniform downward susceptibility shift in healthcare-associated IE rather than a differential resistance pattern.
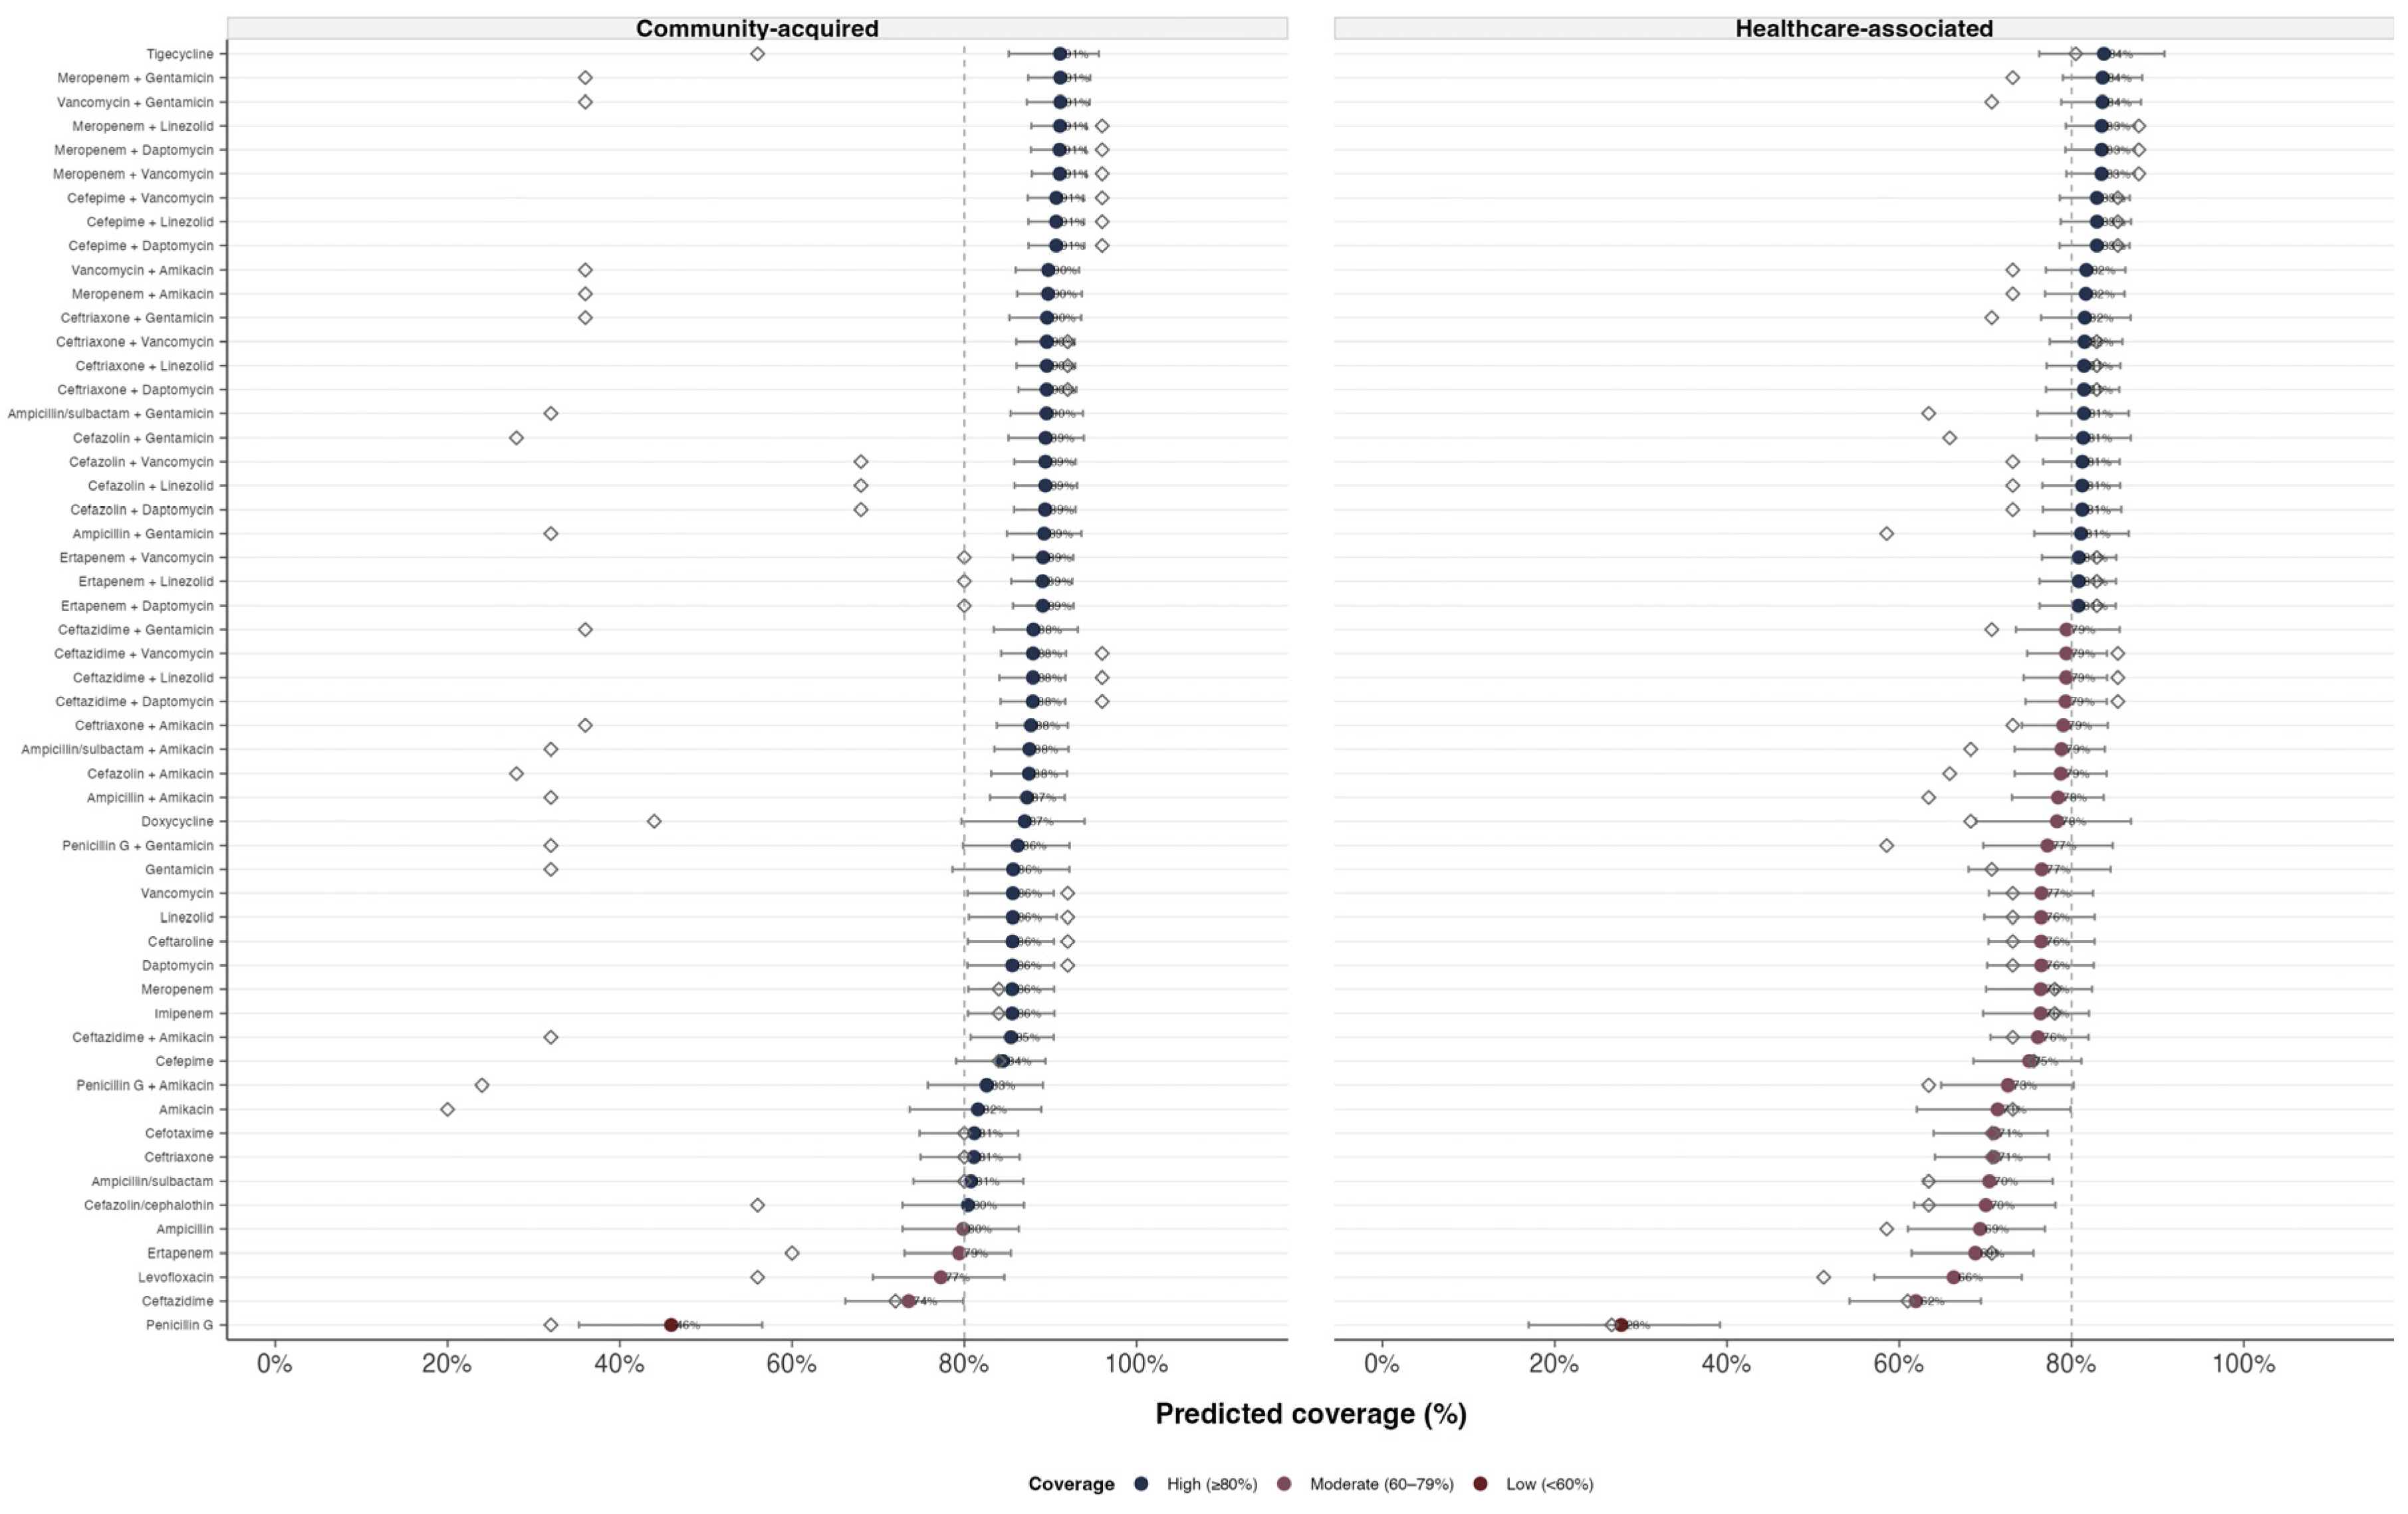

Table 1.
Clinical characteristics stratified by in-hospital survival status.
| Variable | Total (N=96)1 |
Survivor N = 741 |
Death N = 221 |
p-value2 |
|---|---|---|---|---|
| Age (years) | 0.002 | |||
| Median (Q1, Q3) | 37.5 (28.0, 52.5) | 34.0 (25.0, 50.0) | 50.5 (37.0, 66.0) | |
| Sex | 0.411 | |||
| Male | 72 (75.0%) | 57 (77.0%) | 15 (68.2%) | |
| BMI (kg/m2) | 0.006 | |||
| Median (Q1, Q3) | 23.7 (21.5, 27.0) | 22.9 (21.1, 25.7) | 26.9 (23.8, 28.4) | |
| Charlson Comorbidity Index | 0.010 | |||
| Median (Q1, Q3) | 2.0 (0.5, 3.0) | 2.0 (0.0, 2.0) | 3.0 (2.0, 4.0) | |
| Diabetes mellitus | 24 (25.0%) | 17 (23.0%) | 7 (31.8%) | 0.411 |
| Chronic kidney disease | 43 (44.8%) | 35 (47.3%) | 8 (36.4%) | 0.466 |
| Liver disease | 2 (2.1%) | 2 (2.7%) | 0 (0.0%) | >0.999 |
| Active neoplasm | 1 (1.0%) | 1 (1.4%) | 0 (0.0%) | >0.999 |
| HIV with immunosuppression | 0 (0.0%) | 0 (0.0%) | 0 (0.0%) | >0.999 |
| Intravenous drug use | 3 (3.1%) | 3 (4.1%) | 0 (0.0%) | >0.999 |
| Previous endocarditis | 7 (7.3%) | 5 (6.8%) | 2 (9.1%) | 0.658 |
| Prosthetic valve | 11 (11.5%) | 8 (10.8%) | 3 (13.6%) | 0.710 |
| CVC or Mahurkar catheter | 44 (45.8%) | 36 (48.6%) | 8 (36.4%) | 0.340 |
| Cardiac electronic device | 5 (5.3%) | 5 (6.8%) | 0 (0.0%) | 0.583 |
| Hemodialysis | 46 (47.9%) | 37 (50.0%) | 9 (40.9%) | 0.478 |
| Recent hospitalization (3 months) | 43 (44.8%) | 30 (40.5%) | 13 (59.1%) | 0.148 |
| IE type | 0.013 | |||
| Community-acquired | 42 (44.7%) | 30 (41.1%) | 12 (57.1%) | |
| Healthcare-associated | 50 (53.2%) | 43 (58.9%) | 7 (33.3%) | |
| Nosocomial | 2 (2.1%) | 0 (0.0%) | 2 (9.5%) | |
| Prosthetic vs. native IE | 0.710 | |||
| Native | 85 (88.5%) | 66 (89.2%) | 19 (86.4%) | |
| Prosthetic | 11 (11.5%) | 8 (10.8%) | 3 (13.6%) | |
| Affected side | 0.003 | |||
| Left | 48 (50.0%) | 30 (40.5%) | 18 (81.8%) | |
| Right | 45 (46.9%) | 41 (55.4%) | 4 (18.2%) | |
| Bilateral | 2 (2.1%) | 2 (2.7%) | 0 (0.0%) | |
| Unclassified | 1 (1.0%) | 1 (1.4%) | 0 (0.0%) | |
| Positive blood cultures | 65 (71.4%) | 49 (70.0%) | 16 (76.2%) | 0.784 |
| Pathogen group | 0.010 | |||
| Staphylococcus aureus | 31 (32.3%) | 27 (36.5%) | 4 (18.2%) | |
| Streptococcus spp. | 12 (12.5%) | 10 (13.5%) | 2 (9.1%) | |
| Enterococcus spp. | 3 (3.1%) | 0 (0.0%) | 3 (13.6%) | |
| Coagulase-negative staphylococci | 8 (8.3%) | 4 (5.4%) | 4 (18.2%) | |
| Gram-negative organisms | 9 (9.4%) | 8 (10.8%) | 1 (4.5%) | |
| Fungi | 4 (4.2%) | 2 (2.7%) | 2 (9.1%) | |
| Culture-negative | 29 (30.2%) | 23 (31.1%) | 6 (27.3%) | |
| LVEF (%) | 0.566 | |||
| Median (Q1, Q3) | 60.0 (55.0, 63.0) | 60.0 (54.0, 63.0) | 59.5 (55.5, 64.0) | |
| LVEF (category) | 0.865 | |||
| Preserved (>=50%) | 80 (85.1%) | 62 (83.8%) | 18 (90.0%) | |
| Moderately reduced (40-49%) | 10 (10.6%) | 8 (10.8%) | 2 (10.0%) | |
| Reduced (<40%) | 4 (4.3%) | 4 (5.4%) | 0 (0.0%) | |
| Maximum vegetation dimension (mm) | 0.601 | |||
| Median (Q1, Q3) | 19.0 (13.0, 24.0) | 19.0 (15.0, 24.0) | 17.0 (12.0, 28.0) | |
| Vegetation >10 mm | 69 (85.2%) | 53 (84.1%) | 16 (88.9%) | >0.999 |
| Number of vegetations | 0.424 | |||
| 1 | 62 (76.5%) | 46 (73.0%) | 16 (88.9%) | |
| 2 | 17 (21.0%) | 15 (23.8%) | 2 (11.1%) | |
| 3 | 2 (2.5%) | 2 (3.2%) | 0 (0.0%) | |
| Embolism | 43 (44.8%) | 30 (40.5%) | 13 (59.1%) | 0.148 |
| Acute heart failure | 26 (27.1%) | 9 (12.2%) | 17 (77.3%) | <0.001 |
| Septic shock | 19 (19.8%) | 6 (8.1%) | 13 (59.1%) | <0.001 |
| Arrhythmias | 2 (2.1%) | 0 (0.0%) | 2 (9.1%) | 0.051 |
| ICU admission | 18 (18.8%) | 9 (12.2%) | 9 (40.9%) | 0.005 |
| Total complications | <0.001 | |||
| Median (Q1, Q3) | 2.0 (1.0, 3.0) | 2.0 (0.0, 3.0) | 4.0 (2.0, 5.0) | |
| SOFA-2 score | 0.556 | |||
| Median (Q1, Q3) | 3.0 (0.0, 4.0) | 4.0 (0.0, 4.0) | 3.0 (1.0, 4.0) | |
| RiskE score (points) | 0.161 | |||
| Median (Q1, Q3) | 9.0 (0.0, 13.0) | 9.0 (0.0, 9.0) | 9.0 (7.0, 14.0) | |
| ICE score (points) | 0.064 | |||
| Median (Q1, Q3) | 7.0 (5.0, 9.0) | 7.0 (5.0, 9.0) | 9.0 (6.0, 11.0) | |
| Surgical indication | 59 (74.7%) | 39 (66.1%) | 20 (100.0%) | 0.002 |
| Surgery performed | 60 (63.2%) | 49 (67.1%) | 11 (50.0%) | 0.207 |
| Surgical indication fulfilled | 59 (63.4%) | 48 (67.6%) | 11 (50.0%) | 0.204 |
| Hospital stay (days) | 0.930 | |||
| Median (Q1, Q3) | 35.0 (25.0, 51.0) | 34.0 (26.0, 50.0) | 36.0 (19.0, 52.0) |
1n (%). 2Wilcoxon rank sum test; Fisher's exact test.
Table 2.
Bivariate screening of candidate predictors for in-hospital mortality, organized by 16 clinical domains (n = 96, 22 events). Crude odds ratios with 95% confidence intervals from univariate logistic regression. Multilevel categorical variables: global p-value from likelihood ratio test. NE: not estimable due to quasi-complete separation. Bold: p < 0.05. 62 variables screened in two phases.
Table 2.
Bivariate screening of candidate predictors for in-hospital mortality, organized by 16 clinical domains (n = 96, 22 events). Crude odds ratios with 95% confidence intervals from univariate logistic regression. Multilevel categorical variables: global p-value from likelihood ratio test. NE: not estimable due to quasi-complete separation. Bold: p < 0.05. 62 variables screened in two phases.
| Domain | Variables screened | Notable significant associations (p < 0.05) | Candidates retained (p < 0.20) |
|---|---|---|---|
| Demographics | 4 | Age per year (OR 1.04, 95% CI 1.01–1.08, p = 0.005); Charlson per point (OR 1.30, 95% CI 1.02–1.66, p = 0.032) | 2 |
| Comorbidities | 6 | None | 0 |
| Risk factors | 5 | None | 1 (recent hospitalization, p = 0.129) |
| IE classification | 4 | Affected side (LRT p = 0.005); IE type (LRT p = 0.011) | 3 |
| Microbiology | 2 | Pathogen group (LRT p = 0.013) | 1 |
| Echocardiography | 5 | Total complications per unit (OR 2.20, 95% CI 1.53–3.40, p < 0.001) | 1 |
| Complications | 5 | Septic shock (OR 16.37, 95% CI 5.21–57.90, p < 0.001); acute heart failure (OR 8.67, 95% CI 2.98–26.86, p < 0.001); ICU admission (OR 5.00, 95% CI 1.67–15.35, p = 0.004) | 4 |
| Treatment | 3 | None | 2 (surgery OR 0.49, p = 0.148; indication fulfilled OR 0.48, p = 0.138) |
| Prognostic scores | 3 | ICE score per point (OR 1.20, 95% CI 1.04–1.42, p = 0.017) | 3 (ICE, RiskE p = 0.064, SOFA-2 p = 0.146) |
| Derived variables | 8 | Left-sided IE (OR 3.24, 95% CI 1.14–9.86, p = 0.030); high-risk pathogen (p = 0.001); structural complication (p = 0.002) | 4 |
| Individual complications | 7 | Aneurysm (p = 0.013); valvular compromise (p = 0.039) | 3 |
| Clinical presentation | 4 | Vascular/immunological phenomena (p = 0.011) | 1 |
| Biomarkers | 2 | None | 0 |
| Temporal variables | 3 | None | 0 |
| Treatment/microbiology | 4 | None | 0 |
| Additional risk factors | 7 | None | 0 |
| Total | 62 | 25 |
Table 3.
Adjusted odds ratios by model.
| Model | Predictor | OR (95% CI) | p |
|---|---|---|---|
| Model 1: Backward AIC (4 vars) | Age (years) | 1.05 (1.00–1.11) | 0.049 |
| Septic shock | 4.29 (0.91–22.98) | 0.072 | |
| Acute heart failure | 45.58 (8.42–462.31) | 0.0001 | |
| Surgery | 0.28 (0.04–1.60) | 0.173 | |
| Model 2: Final (3 vars) | Septic shock | 11.14 (2.67–55.52) | 0.002 |
| Left-sided IE | 2.93 (0.62–15.92) | 0.182 | |
| Acute heart failure | 12.11 (3.12–55.72) | 0.0006 | |
| Model 2b: Firth (3 vars) | Septic shock | 9.23 (2.40–40.61) | 0.001 |
| Left-sided IE | 2.66 (0.62–12.68) | 0.185 | |
| Acute heart failure | 10.01 (2.78–41.07) | 0.0004 | |
| Model D: 30-day mortality | Septic shock | 9.14 (2.07–47.90) | 0.005 |
| Left-sided IE | 3.38 (0.83–15.36) | 0.094 | |
| Acute heart failure | 7.31 (1.91–30.15) | 0.004 | |
| Model E: Embolism | Valvular regurgitation | 5.38 (2.08–15.12) | 0.001 |
| Prior antibiotic use | 0.40 (0.11–1.28) | 0.135 | |
| Previous endocarditis | 0.11 (0.01–0.77) | 0.055 | |
| Valvular regurgitation | 5.02 (1.98–13.72) | 0.001 | |
| Prior antibiotic use | 0.43 (0.13–1.31) | 0.14 |
OR, odds ratio; CI, confidence interval; IE, infective endocarditis; EPV, events per variable. Model 1, backward AIC from Phase 1 candidates (4 predictors; EPV = 5.5). Model 2 (final), clinical model from Phase 2 extended screening (3 predictors; EPV = 7.3). Model 2b, Firth-penalized estimates for the same 3 predictors. Model D, the same 3 predictors applied to 30-day all-cause mortality (n = 86; 24 events; EPV = 8.0). Model E, embolism model derived after univariate screening and backward AIC (complete-case n = 93; 42 events; EPV = 14.0; Table S-Embolism); Model E-Firth, Firth-penalized estimates for the same predictors. Model 2 was retained as final based on parsimony, higher EPV, stability (reduced separation risk), clinical rationale for left-sided IE, and non-significant AUC difference versus Model 1 (DeLong p = 0.388).
Table 4.
Comparison of discriminative performance: local model vs. international scores.
| Comparison | AUC 1 | AUC 2 | ΔAUC | DeLong z | p |
|---|---|---|---|---|---|
| Model 2 vs. Model 1 | 0.922 | 0.933 | −0.011 | −0.86 | 0.388 |
| Model 2 vs. RiskE | 0.922 | 0.598 | 0.324 | 4.69 | <0.0001 |
| Model 2 vs. ICE | 0.922 | 0.632 | 0.29 | 4.08 | <0.0001 |
| Model 1 vs. RiskE | 0.933 | 0.598 | 0.335 | 5.1 | <0.0001 |
| Model 1 vs. ICE | 0.933 | 0.632 | 0.301 | 4.52 | <0.0001 |
| RiskE vs. ICE | 0.598 | 0.632 | −0.034 | −0.55 | 0.581 |
Table 5.
Exploratory logistic regression model for embolic events (n = 93, 42 events).
| Predictor | GLM OR (95% CI) | p | Firth OR (95% CI) | Firth p |
|---|---|---|---|---|
| Valvular regurgitation | 5.38 (2.08–15.12) | 0.001 | 5.02 (1.98–13.72) | 0.001 |
| Prior antibiotic use | 0.40 (0.11–1.28) | 0.135 | 0.43 (0.13–1.31) | 0.140 |
| Previous endocarditis | 0.11 (0.01–0.77) | 0.055 | 0.16 (0.02–0.88) | 0.034 |
Model performance: AUC 0.737 (95% CI 0.64–0.83); optimism-corrected AUC 0.719 (optimism 0.017, B = 1000); EPV 14.0; Hosmer–Lemeshow p = 0.936. A clinical a priori model (IE type + left-sided IE + vegetation >10 mm) achieved a lower AUC of 0.663 (optimism-corrected 0.626); DeLong comparison was non-significant (z = −1.23, p = 0.218).
Disclaimer/Publisher’s Note: The statements, opinions and data contained in all publications are solely those of the individual author(s) and contributor(s) and not of MDPI and/or the editor(s). MDPI and/or the editor(s) disclaim responsibility for any injury to people or property resulting from any ideas, methods, instructions or products referred to in the content. |
© 2026 by the authors. Licensee MDPI, Basel, Switzerland. This article is an open access article distributed under the terms and conditions of the Creative Commons Attribution (CC BY) license (http://creativecommons.org/licenses/by/4.0/).
Copyright: This open access article is published under a Creative Commons CC BY 4.0 license, which permit the free download, distribution, and reuse, provided that the author and preprint are cited in any reuse.