
Submitted:
12 February 2026
Posted:
13 February 2026
You are already at the latest version
Abstract
The housing and rental market has been a volatile and unpredictable environment ever since the COVID-19 pandemic. This study is an examination of the post-pandemic housing market dynamics across ten United States metropolitan areas, comparing five technology-centric hubs including San Francisco, San Jose, Seattle, Austin, and Cambridge with five service-oriented economies which includes Las Vegas, Orlando, San Antonio, Phoenix, and Tampa. I obtained the data on Zillow and focused on two variables: Home Value Index (ZHVI) and Zillow Observed Rent Index (ZORI) spanning 2019 through 2024. I conduct a difference-in-differences (DiD) analysis in addition to an event-study decomposition, placebo testing, and advanced time-series forecasting. The DiD regression estimates a treatment effect of +6.75 percentage points in rent growth for technology hubs relative to service metros in the post-2023 period (p < 0.001). However, checks for robustness which includes event-study pre-trends and placebo date tests reveal violations of the parallel trends assumption, precluding causal interpretation. Results are therefore reported as descriptive correlations. I also utilized STL decomposition, SARIMAX modeling, Prophet forecasting, and gradient-boosted machine learning to confirm that metro type accounts for a substantial share of predictive variation in rent trajectories. The results suggest that return-to-office mandates, remote-work persistence, and migration patterns interact in complex ways to shape rental recovery heterogeneity. The convergence of urban–suburban price gradients and the decline in price-to-rent ratios point to a structural repricing of urban housing markets that extends beyond the immediate pandemic shock.
Keywords:
housing market
; rental recovery
; return-to-office
; urban–suburban migration
; difference-in-differences
; post-pandemic economics
; price gradient
; technology hubs
; SARIMAX
; XGBoost
1. Introduction
Beginning in early 2020, remote work adoption reduced commuting to central business districts and increased housing demand in suburban areas (Monte et al., 2023; Duranton & Handbury, 2023). These shifts unfolded with remarkable speed and have been characterized as the “donut effect,” whereby economic activity dispersed from city centers to suburbs (Ramani et al., 2024). Rental and commercial activity slowed in metros with higher concentrations of remote-work sectors, while service-oriented cities exhibited stronger recovery (Forouhar et al., 2024; Leong et al., 2023).
As safety restrictions eased through 2022 and 2023, a divergent recovery pattern emerged that defied simple narratives of rebound. Rental demand increased in the short term, though long-term moderation was expected (Howard et al., 2023), and rental demand recovery was particularly strong in lower-density suburban areas (Yiu et al., 2023). Simultaneously, urban–suburban price gradients flattened as remote work reduced the premium associated with central locations (Ahrend et al., 2023; Kim & Long, 2024). These transformations bear significant social and economic consequences, including altered housing affordability across metropolitan areas (Samarin & Sharma, 2023).
In 2022 and 2023, we started seeing a lot of return-to-office (RTO) mandates by major technology firms which added another layer of complexity to an already dynamic market. These policies aimed to restore in-person collaboration and organizational cohesion but also created uncertainty for workers who had relocated to lower cost areas during the pandemic. Early evidence suggests that RTO mandates slowed recovery in tech-heavy downtowns, while rental recovery was stronger in service-oriented sectors (Forouhar et al., 2024; Leong et al., 2023). The impact of RTO was larger in big cities (Monte et al., 2023) and was mediated by residential location choices and commuting patterns (Gong et al., 2024).
Although there has been work done on the impact of the pandemic on the housing market, several gaps remain. First, most studies examine either rental or ownership markets in isolation rather than analyzing their joint trajectory and the price-to-rent ratio as a combined metric. In addition, a lot of research focuses on individual cities or national aggregates so there is a limited number of comparative analyses across different types of cities (Biljanovska, 2023; Miles, n.d.). Moreover, it is difficult to identify causal relationships given the effects of macroeconomic forces such as interest rate increases, supply chain disruptions, and the reduction in fiscal stimulus, which interact with pandemic-induced policy interventions such as eviction moratoria (Sayantani, 2024) and local labor market structures (Samarin & Sharma, 2023).
1.1. Research Objectives
The present study pursues four primary objectives. The first is to quantify the differential trajectory of rental-price growth between technology-centric and service-oriented metropolitan areas in the post-pandemic period using a difference-in-differences framework. The second is to evaluate whether observed differences can be attributed to return-to-office mandates or instead reflect pre-existing divergences through event-study decomposition and placebo testing. The third is to forecast future rental-price trajectories using advanced time-series and machine-learning methods, including STL decomposition, SARIMAX, Facebook Prophet, and XGBoost. The fourth is to examine the evolution of price-to-rent ratios and urban–suburban price gradients as indicators of structural market shifts.
1.2. Theoretical Framework
The study draws on three complementary theoretical perspectives. The first is the monocentric city model, as extended to remote work settings by Brueckner (2023), who showed that working from home increases suburban rents while reducing CBD rents, flattening and rotating rent gradients. The second is the agglomeration economies framework, as applied to the post-pandemic urban context by Duranton & Handbury (2023), who reviewed how remote work reduced commuting and increased housing demand while flattening bid-rent curves, suggesting that urban economic forces continue to shape housing markets despite remote-work options. The third is the literature on pandemic-induced shifts in rental demand and residential preferences (Howard et al., 2023; Yiu et al., 2023), which documents how rental demand increased in the short term and how rental demand recovery was particularly strong in lower-density suburban areas as remote work flattened rental gradients.
2. Literature Review
2.1. Remote Work and Residential Sorting
The COVID-19 pandemic triggered one of the most extensive experiments in remote work in modern history, producing a strong negative correlation between remote work adoption and trips to central business districts (Monte et al., 2023). This shift was not evenly distributed across industries or geographies, and remote work adoption drove a partial dispersal of rental demand toward suburban areas (Delventhal et al., 2023), with effects that differed between the short and long run (Howard et al., 2023). Ramani et al. (2024) documented the resulting “donut effect,” showing that economic activity dispersed from city centers to surrounding suburbs and exurbs, flattening the traditional bid-rent gradient as modeled in remote work extensions of the monocentric city framework (Brueckner, 2023).
Empirical evidence from multiple countries confirms the magnitude of these shifts. Ahrend et al. (2023) found that post-pandemic housing demand shifted to urban peripheries, with remote work driving the demand shift (Ahrend et al., 2023). Guglielminetti et al. (2023) found that working from home drove increased demand for larger, single-family homes. In the United States, Howard et al. (2023) found that remote work increased housing demand outside central business districts in the short run, though they noted that long-term effects may moderate as housing supply adjusts. Lee et al. (2024) found that affordability considerations and the desire for larger homes drove suburban demand among younger households.
However, the degree of residential sorting proved to be heterogeneous across metro types. Kane (2024) documented changes in American migration patterns, finding that regional shifts in housing demand were influenced by job growth and housing supply dynamics. This is consistent with the findings of Delventhal et al. (2023), whose spatial equilibrium model showed that remote work drove a partial dispersal of rental demand to suburbs and a partial reversal of urban concentration. More broadly, a strong spatial correlation has been established between remote work prevalence and shifts in housing demand toward suburbs, peripheries, and lower-density areas (Okoli et al., 2023). Telecommuting has also been linked to changing migration patterns, jobs-housing balance, and urban spatial structure in the Canadian context (McQuillan, 2024). The persistence of these patterns beyond the initial pandemic shock suggests a structural rather than transient shift in residential preferences (Ilham et al., 2024; Zhao & Gao, 2023).
2.2. Rental Versus Ownership Market Divergence
A growing body of literature highlights the divergent trajectories of rental and ownership markets during and after the pandemic. Yiu et al. (2023) demonstrated that remote work reshaped the urban rental structure more profoundly than the ownership market, as tenants—who face lower switching costs—adjusted their locations more rapidly. Thackway et al. (2023) documented similar dynamics in Australian rental markets, where pandemic-induced demand shifts were sharper and more persistent than in ownership segments.
The price-to-rent ratio has emerged as a critical indicator of market equilibrium and investor sentiment (Galster, 2024). During the pandemic, divergent movements in prices and rents caused price-to-rent ratios to spike in technology hubs as rents fell sharply while prices were supported by low interest rates and constrained supply. Samarin & Sharma (2023) found that rent-burden typologies varied substantially across metros, with economic specialization driving divergent rent-burden patterns that reflected underlying local labor market structures. Internationally, investor behavior and supply constraints influenced the timing and magnitude of rental price rebounds, with rental market recovery patterns varying across U.S., Australian, and Spanish markets (Khametshin et al., 2024; Thackway et al., 2023).
2.3. Return-to-Office Mandates, Price Gradients, and Structural Repricing
The return-to-office movement, which gathered momentum in 2022–2023, introduced a countervailing force to remote-work-driven spatial reallocation. Empirical evidence on the housing-market impact of RTO mandates remains limited and inconclusive. Forouhar et al. (2024) found that RTO mandates slowed recovery in tech-heavy downtowns, with the impact being particularly negative in downtowns dominated by finance and professional services (Leong et al., 2023). Gong et al. (2024) modeled the relationship between telecommuting, commuting patterns, and residential location choices, finding that return-to-office policies interact with telecommuting to alter both residential location decisions and housing supply dynamics.
Alongside these RTO dynamics, the flattening of urban–suburban price gradients has been one of the most significant structural outcomes of the pandemic era. Kim & Long (2024) found that working from home reduced commuting time and flattened intracity house-price gradients across major U.S. metros. OECD (2023a) documented flattening of house price gradients across OECD cities, and OECD (2023b) found complex gradient changes extending beyond metro boundaries. Separately, OECD (2023c) documented how housing demand geography is evolving with telecommuting patterns. The interaction between these gradient shifts and the partial reversal of remote work through RTO mandates remains an open empirical question, motivating the present study.
3. Materials and Methods
3.1. Data Sources and Coverage
The study relies on two primary data sources provided by Zillow Research, both of which are publicly available and widely used in the housing-market literature. The Zillow Home Value Index (ZHVI) provides smoothed, repeat-sales-based estimates of typical home values at the ZIP-code level, observed monthly from January 2019 through October 2025. The Zillow Observed Rent Index (ZORI) provides analogous estimates for rental prices over the same period. The raw housing-value dataset comprises 26,309 observations across 319 variables (monthly time columns), while the rental dataset comprises 7,822 observations across 139 variables. After reshaping from wide to long format and merging on geographic identifiers, the combined analytical dataset contains 333,963 observations spanning 7,793 unique ZIP codes nationwide.
All values are expressed in nominal U.S. dollars; no inflation adjustment is applied, consistent with standard practice in short-horizon housing-market analyses where the primary interest lies in relative growth differentials rather than real purchasing power. The choice of the 2019–2025 window is motivated by the desire to capture a full pre-pandemic baseline (2019), the initial pandemic shock and early recovery (2020–2021), the post-stimulus tigsssssssshtening and RTO mandate period (2022–2023), and a sufficient post-treatment observation window to assess the persistence of estimated effects (2024–2025). The date range encompasses 82 monthly observations at the national level, providing adequate statistical power for time-series decomposition and forecasting.
3.2. Data Cleaning and Feature Engineering
The raw Zillow data required several preprocessing steps before analysis. Both the ZHVI and ZORI datasets were originally provided in wide format, with each monthly observation stored as a separate column. These were transformed to long format using a melt operation, creating a panel structure indexed by geographic unit and date. The date field was parsed to datetime format and filtered to the January 2019–October 2025 study window. Records with missing values in the primary outcome variables were dropped.
Three derived variables were computed for each geographic unit and time period. First, the price-to-rent ratio was calculated as the monthly home value divided by twelve times the monthly rent, yielding an annualized measure of the relative cost of owning versus renting. Across the full sample, the mean price-to-rent ratio was 20.78 with a standard deviation of 8.78, ranging from a minimum of 2.93 to a maximum of 145.06, indicating substantial cross-sectional heterogeneity in tenure economics. Second, year-over-year (YoY) growth rates for both home prices and rents were computed as the twelve-month percentage change, which smooths out seasonal variation while preserving the ability to detect trend shifts. For home-price YoY growth, the full-sample mean was 5.32% with a standard deviation of 7.96%, and the range extended from −27.91% to +60.37%. For rent YoY growth, the mean was 5.41% with a standard deviation of 5.85%, ranging from −30.64% to +49.70%. Third, a binary post-treatment indicator was created, coded as 1 for all observations from January 2023 onward and 0 otherwise, reflecting the approximate onset of major RTO mandates by large technology firms.
The Pearson correlation between rent YoY growth and home-price YoY growth in the 2024 cross-section was r = 0.288, indicating a weak positive association and suggesting that the two markets responded to partially distinct demand and supply forces during the recovery period. This finding motivated the decision to analyze rental and ownership dynamics separately before comparing them through the price-to-rent ratio.
3.3. Metropolitan Classification
The ten study metropolitan areas were classified as either technology-centric or service-oriented based on the conceptual distinction between tech-heavy and service-oriented metropolitan economies identified in the literature. Research has documented that downtowns dominated by technology and professional services sectors exhibit different recovery trajectories than service-oriented economies (Forouhar et al., 2024; Leong et al., 2023), and that metro economic specialization drives divergent rent-burden and housing demand patterns (Samarin & Sharma, 2023). Following this framework, five metros were classified as technology-centric based on their well-documented concentrations of technology-sector employment: San Francisco–Oakland–Berkeley, CA; San Jose–Sunnyvale–Santa Clara, CA; Seattle–Tacoma–Bellevue, WA; Austin–Round Rock–Georgetown, TX; and Cambridge–Newton–Brookline, MA. Five service-oriented metros were selected as comparators: Las Vegas–Henderson–Paradise, NV; Orlando–Kissimmee–Sanford, FL; San Antonio–New Braunfels, TX; Phoenix–Mesa–Chandler, AZ; and Tampa–St. Petersburg–Clearwater, FL.
An important methodological refinement involved the classification procedure at the ZIP-code level. An initial pass matched ZIP codes to metro categories using city-name substrings, which yielded 101,399 observations (62,859 in technology hubs across 1,269 ZIP codes and 38,540 in service cities across 671 ZIP codes). However, this approach introduced classification errors because common city names such as “Austin” and “Cleveland” matched ZIP codes in unintended states (e.g., Austin, Minnesota; Cleveland, Tennessee). A strict classification was therefore implemented using verified (city, state) pairs, which reduced the analytical sample to 19,866 observations (7,731 in technology hubs across 113 ZIP codes and 12,135 in service cities across 176 ZIP codes). All primary results reported in this paper use the strict classification. The reduction in sample size resulted in an improved model fit (R² increased from 0.177 to 0.287), and the estimated DiD coefficient increased slightly from +6.43 to +6.75 percentage points, suggesting that the initial classification introduced measurement error that attenuated the estimated treatment effect.
3.4. Difference-in-Differences Framework
The primary analytical framework is a two-way fixed-effects difference-in-differences (DiD) model, which compares the change in rental-price growth between technology-centric and service-oriented metros before and after a common treatment date. The treatment is conceptualized as the aggregate shift toward RTO mandates, which accelerated in late 2022 and early 2023. The post-treatment period is defined as January 2023 onward. The DiD model specification is:
where ΔRent_it denotes the year-over-year rental-price growth rate for ZIP code i at time t, TechHub_i is a binary indicator equal to 1 for technology-centric metros, Post_t is a binary indicator equal to 1 for observations from January 2023 onward, δ_i represents metro fixed effects, δ_t represents time fixed effects, and ε_it is the idiosyncratic error term. The coefficient of primary interest is β₃, which captures the differential change in rent growth for technology hubs relative to service metros in the post-treatment period. Standard errors are estimated using the heteroskedasticity-consistent HC1 robust estimator to account for potential heteroskedasticity in the error structure. The model was estimated on 16,460 observations from the strict-classification sample.
ΔRent_it = α + β₁TechHub_i + β₂Post_t + β₃(TechHub_i × Post_t) + δ_i + δ_t + ε_it
3.5. Event-Study Specification
To assess the validity of the parallel trends assumption underlying the DiD framework, a dynamic event-study model was estimated. This specification replaces the single post-treatment indicator with a set of quarterly lead and lag indicators relative to the treatment date:
where k indexes quarters relative to the treatment onset (Q1 2023), with negative values indicating pre-treatment periods and positive values indicating post-treatment periods. The reference period is Q−1 (2022-Q4), which is set to zero by construction. The specification includes 8 pre-treatment quarters (Q−8 through Q−1) and 7 post-treatment quarters (Q+1 through Q+7). Under the parallel trends assumption, all pre-treatment coefficients γ_k for k < 0 should be statistically indistinguishable from zero. Significant pre-treatment coefficients would indicate that technology hubs and service metros were already on diverging trajectories before the RTO mandate period, invalidating the causal interpretation of the DiD estimate.
ΔRent_it = α + Σ_k γ_k(TechHub_i × Quarter_k) + δ_i + δ_t + ε_it
3.6. Placebo Testing
As a further robustness check, placebo tests were conducted by reassigning the treatment date to three alternative dates prior to the actual onset of major RTO mandates: January 1, 2020 (pre-pandemic), January 1, 2021 (mid-pandemic), and January 1, 2022 (pre-RTO). The DiD model (Equation 1) was re-estimated for each placebo date. Under the null hypothesis that the treatment effect is specific to the RTO mandate period, placebo regressions should yield statistically insignificant DiD coefficients. Significant placebo effects would suggest that the observed post-2023 differential reflects a continuation of pre-existing trends rather than a causal response to RTO mandates. The actual treatment date (January 1, 2023) was also included for comparison across the four specifications.
3.7. Effect-Size Measures
To complement statistical significance testing, multiple effect-size measures were computed to assess the practical magnitude of observed associations. These include the Pearson correlation coefficient (r) between rental-price and home-price YoY growth in the 2024 cross-section; Cohen’s d for the standardized mean difference in rent growth between technology hubs and service metros in the post-2023 period; the partial eta-squared (η²_p) from the DiD regression, measuring the proportion of variance in the outcome attributable to the treatment interaction after accounting for other model terms; and the standardized regression coefficient (β) for the DiD interaction term. Effect-size benchmarks follow Cohen’s (1988) conventional thresholds: small (r = 0.10, d = 0.20, η²_p = 0.01), medium (r = 0.30, d = 0.50, η²_p = 0.06), and large (r = 0.50, d = 0.80, η²_p = 0.14).
3.8. STL Decomposition
Seasonal-Trend decomposition using Loess (STL) was applied to the national-level median rental-price series to isolate trend, seasonal, and residual components. The decomposition used 82 monthly observations from January 2019 through October 2025. STL was configured with a seasonal period of 12 months and the robust fitting option enabled to reduce the influence of outliers. The strength of the trend component was quantified as 1 − Var(residual) / Var(trend + residual), and the strength of the seasonal component was quantified analogously as 1 − Var(residual) / Var(seasonal + residual). These variance ratios provide a measure of how much of the total variation is captured by each component, with values closer to 1 indicating a dominant component.
3.9. Stationarity Testing and SARIMAX Specification
Prior to fitting autoregressive models, the stationarity of the national median rental-price series was assessed using two complementary tests. The augmented Dickey–Fuller (ADF) test evaluates the null hypothesis of a unit root (non-stationarity) against the alternative of stationarity. The Kwiatkowski–Phillips–Schmidt–Shin (KPSS) test evaluates the null hypothesis of stationarity against the alternative of a unit root. Using both tests in conjunction provides a more robust assessment than either alone, as they have complementary null hypotheses.
At the level, the ADF test yielded a test statistic of −1.24 (p = 0.471) and the KPSS test rejected the null of stationarity (p = 0.01), jointly indicating non-stationarity. Upon first differencing, the ADF test yielded p = 0.214 (still non-stationary at conventional levels) while the KPSS test failed to reject stationarity (p = 0.10). The mixed results at the first-difference level suggested that d = 1 was appropriate for the ARIMA order, with caution regarding potential near-unit-root behavior.
A Seasonal Autoregressive Integrated Moving Average with Exogenous Regressors (SARIMAX) model was estimated with order (1,1,1) and seasonal order (1,0,1,12). The exogenous regressor was a binary post-2023 indicator capturing the structural break associated with the RTO mandate period. Model selection was guided by the Akaike Information Criterion (AIC = 677.56) and Bayesian Information Criterion (BIC = 690.79). Residual autocorrelation was assessed using the Ljung–Box Q-test, which tests the null hypothesis that residuals are independently distributed. This approach addresses a potential critique of the basic DiD model, namely that standard OLS estimation ignores temporal autocorrelation in the panel. By embedding the treatment indicator within a time-series framework that explicitly models autocorrelation, the SARIMAX approach provides a complementary inference channel that is more appropriate for serially correlated data.
3.10. Prophet Forecasting
Facebook Prophet, a Bayesian additive regression model designed for time-series forecasting with strong seasonal components, was used to generate out-of-sample predictions for the national median rental-price series. The model was configured with yearly seasonality enabled and a changepoint prior scale of 0.05, which controls the flexibility of the trend component (lower values produce a smoother trend). The training set comprised 70 monthly observations from January 2019 through October 2024, and the test set comprised 12 monthly observations from November 2024 through October 2025. Forecast accuracy was evaluated using mean absolute error (MAE), root mean squared error (RMSE), and mean absolute percentage error (MAPE). The trained model was then used to generate 24-month ahead forecasts through October 2027 for policy planning purposes.
3.11. Machine-Learning Approach: XGBoost
A gradient-boosted tree model (XGBoost) was trained to predict ZIP-code-level rental-price YoY growth using a set of panel-level features. The feature set comprised nine variables: year, month, a binary technology-hub indicator (Is_Tech_Hub), the post-2023 indicator (Post), the DiD interaction term (Tech_x_Post), three lagged rent values (1-month, 3-month, and 6-month lags), a 1-month lagged home price, and the price-to-rent ratio. The model was configured with 100 estimators, a maximum tree depth of 5, and a learning rate of 0.1. The total sample of 14,804 observations was split 80/20 into training and test sets using a temporal cutoff to prevent data leakage.
Feature-importance scores were extracted using the total gain criterion, which measures the total improvement in the objective function contributed by splits on each feature across all trees. This criterion is preferred over frequency-based importance because it accounts for the magnitude of the improvement at each split, not merely the number of splits.
Model stability was assessed in two ways. First, five-fold cross-validation using a TimeSeriesSplit strategy was conducted on the training data, yielding estimates of out-of-sample prediction error with associated standard deviations. Second, the full model-training pipeline was repeated across five deterministic seeds generated by the SeedHash framework, and the coefficient of variation (CV) of the MAE across seeds was computed as a measure of stochastic stability. A CV below 5% was considered evidence of acceptable stability.
3.12. Reproducibility Framework
All stochastic procedures in the analysis are governed by a deterministic seed-hashing framework (SeedHash). A master seed of 1,562,035,587 is combined with task-specific string identifiers via MD5 hashing to produce independent, reproducible random-number streams for each analytical component. The MD5 hash of the SeedHash configuration file is 6214b425ac6d1ce4c7246d4f40f95bf5, providing a verifiable fingerprint of the reproducibility configuration. Five deterministic child seeds were generated for stability testing across all stochastic methods. All code was implemented in Python 3.11 using pandas, statsmodels, scikit-learn, xgboost, and prophet libraries. The complete codebase, including configuration files and raw data extracts, is provided in the supplementary materials.
4. Results
4.1. Descriptive Statistics and Raw Trends
Summary statistics for the ten study metros are presented in Table 1, disaggregated by metro type and period. Technology-centric metros exhibited substantially higher median home prices and rents across both periods, consistent with their higher cost-of-living structures. A notable pattern is the reversal in rent year-over-year growth: technology hubs recorded relatively modest rental growth in the pre-2023 period (1.84%) but experienced a sharp acceleration post-2023 (5.41%), while service metros decelerated from 4.22% to 3.31%. This asymmetric trajectory is consistent with the “catch-up” hypothesis, whereby technology hubs—having experienced the sharpest pandemic-era rental declines—subsequently exhibited the strongest rental recovery as urban demand returned.
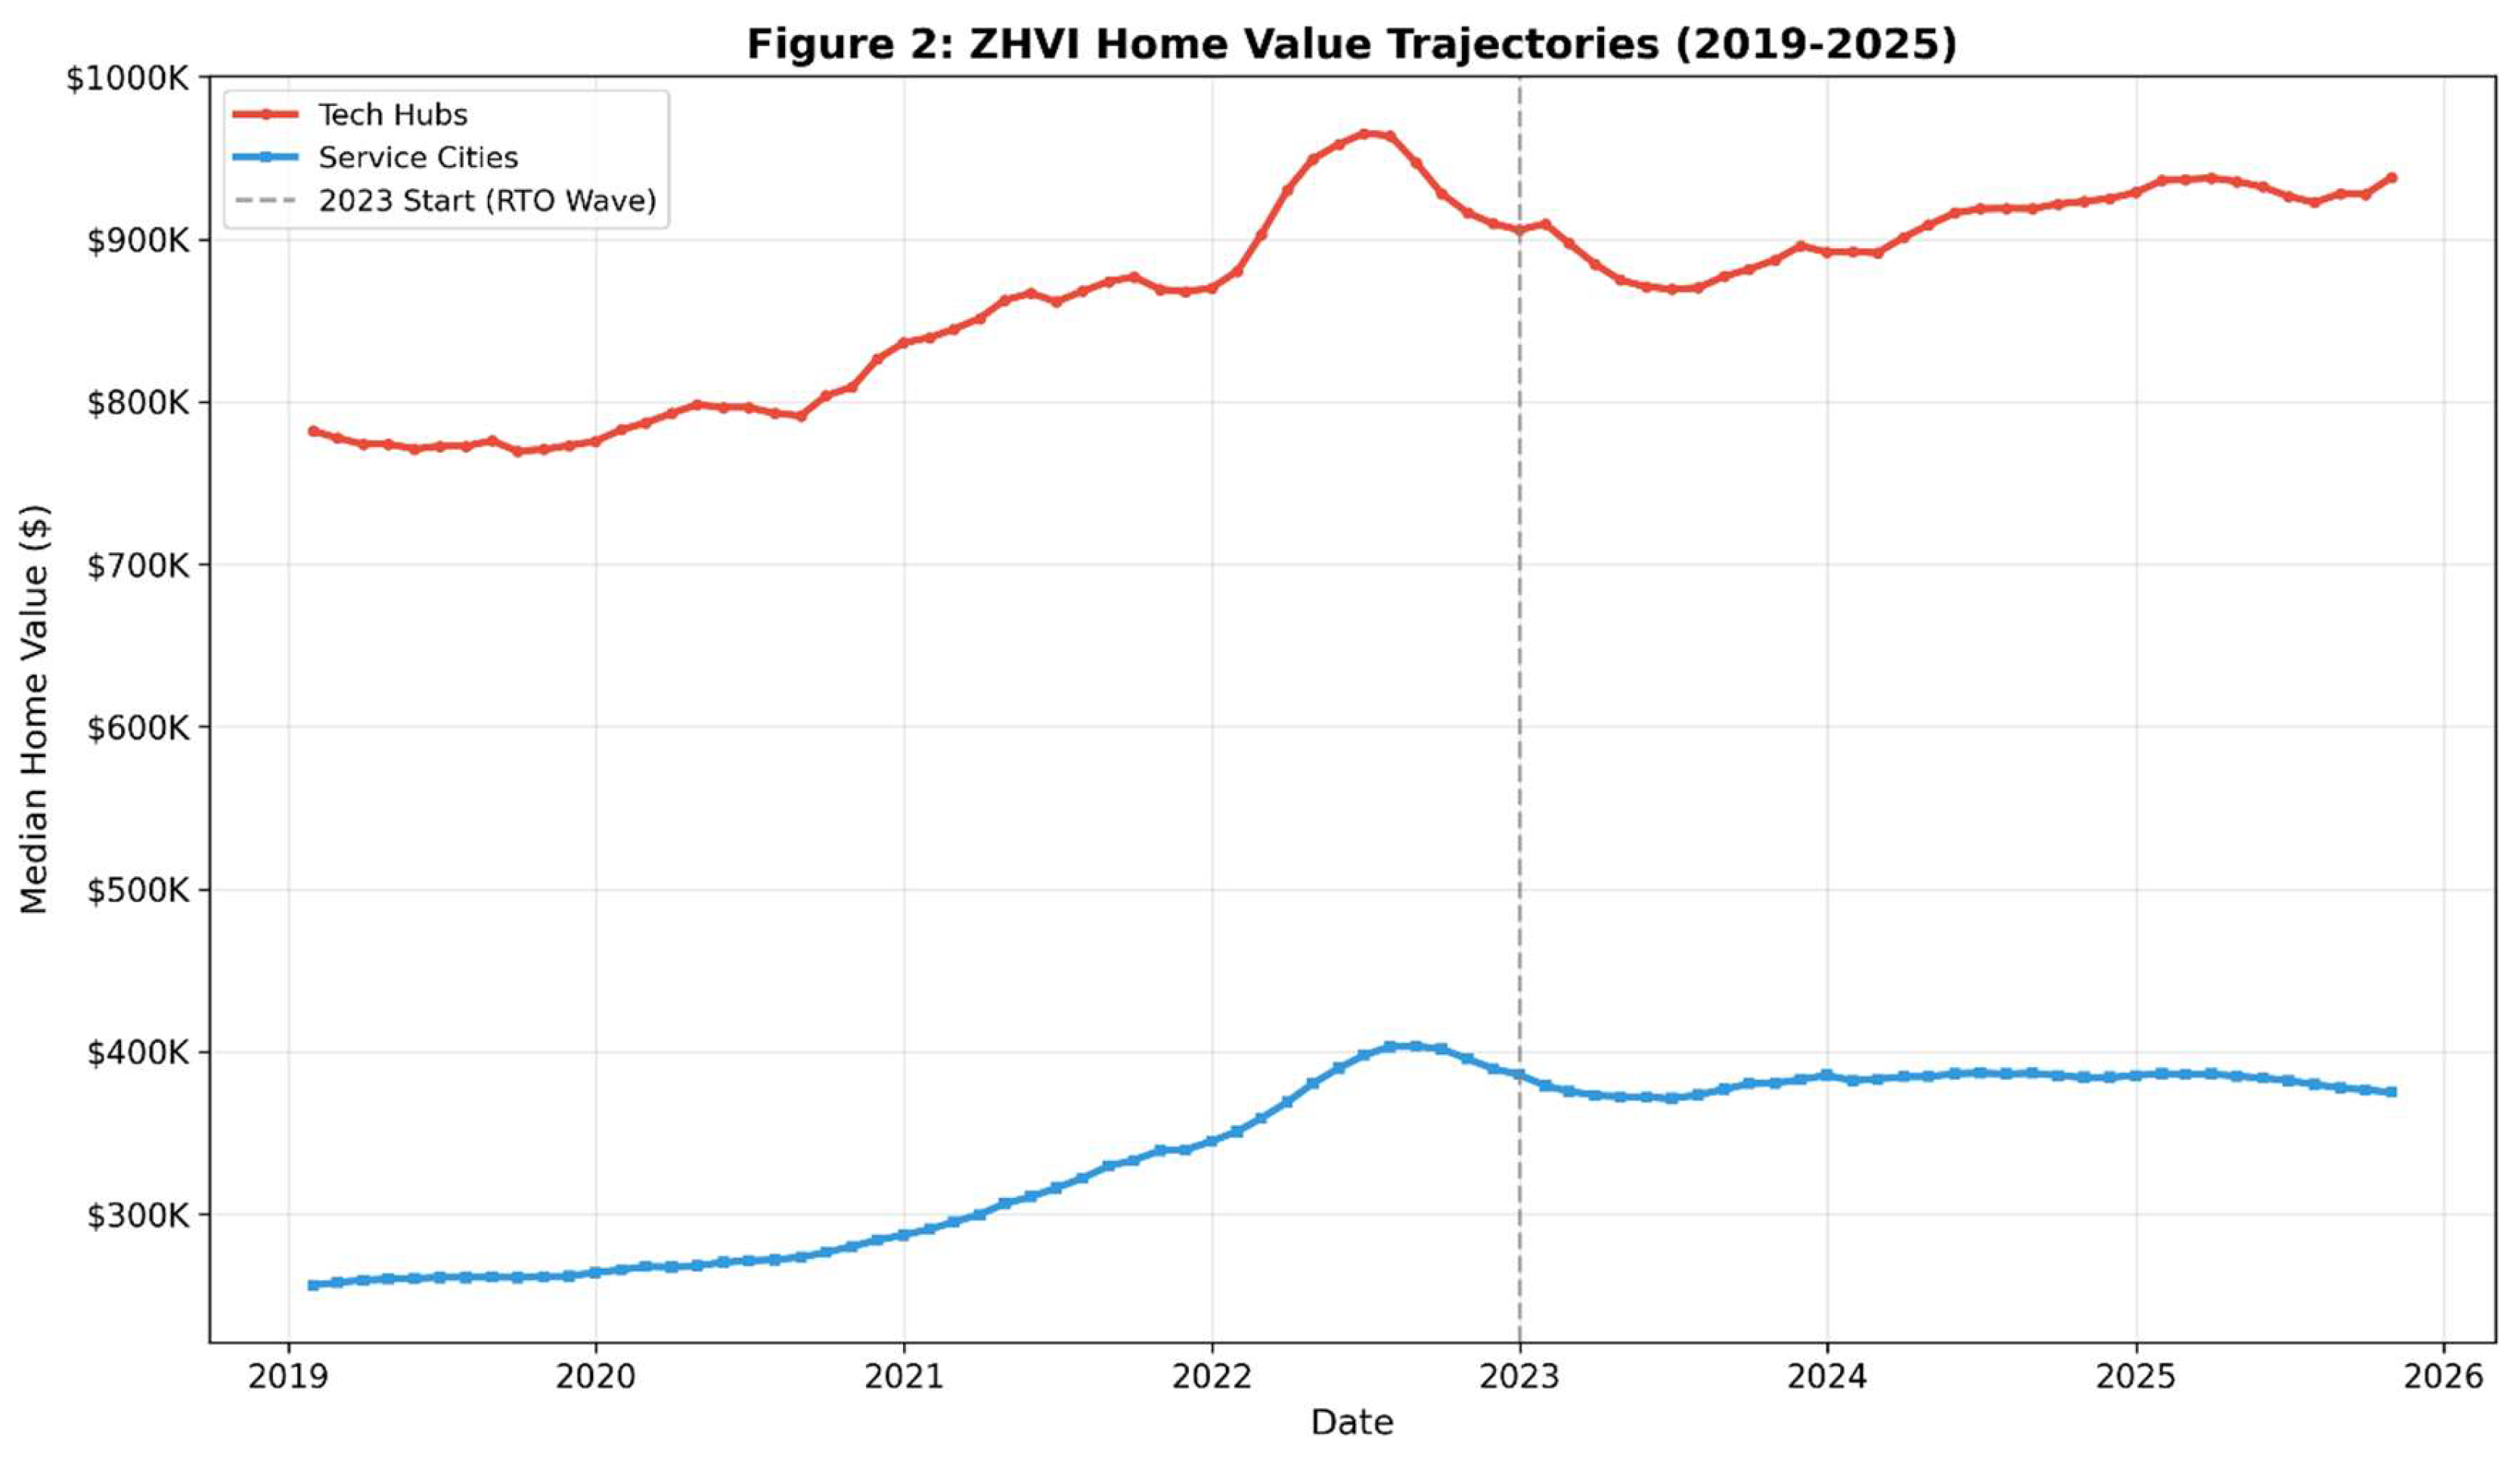
The home-price growth trajectory tells a complementary story. Both metro types experienced rapid appreciation in 2021–2022, but the growth rate decelerated sharply in 2023–2024 as mortgage rates rose. Notably, the home-price growth differential between metro types narrowed substantially in the post-2023 period (3.33% for tech hubs vs. 3.18% for service metros, a gap of only 0.15 percentage points), whereas the rental-growth gap widened (5.41% vs. 3.31%, a gap of 2.10 percentage points). This divergence between ownership and rental dynamics underscores the importance of analyzing both markets jointly.
Table 2 presents year-by-year median growth rates across all metros in the analytical sample, illustrating the full chronology of pandemic-era housing dynamics.
Several trends are noteworthy. First, the explosive home-price appreciation of 2021–2022 (+13.70% and +13.81%) gave way to a dramatic deceleration in 2023 (+1.24%), coinciding with the Federal Reserve’s aggressive interest-rate tightening cycle. Second, rental growth showed a different pattern: after peaking in 2022 (+10.96%), it moderated but remained positive and relatively stable through 2025 (+3.28%), exhibiting the “snapback” pattern identified in the literature (Thackway et al., 2023). Third, the price–rent growth gap turned negative in 2023 (−2.69 pp) as rents outpaced prices, suggesting a shift in the ownership-rental equilibrium consistent with higher mortgage rates discouraging purchases while sustaining rental demand.
Figure 1.
Monthly rental-price index trajectories (ZORI, 2019–2025) for technology-centric and service-oriented metros. Shaded region indicates the post-2023 treatment window.
Figure 1.
Monthly rental-price index trajectories (ZORI, 2019–2025) for technology-centric and service-oriented metros. Shaded region indicates the post-2023 treatment window.
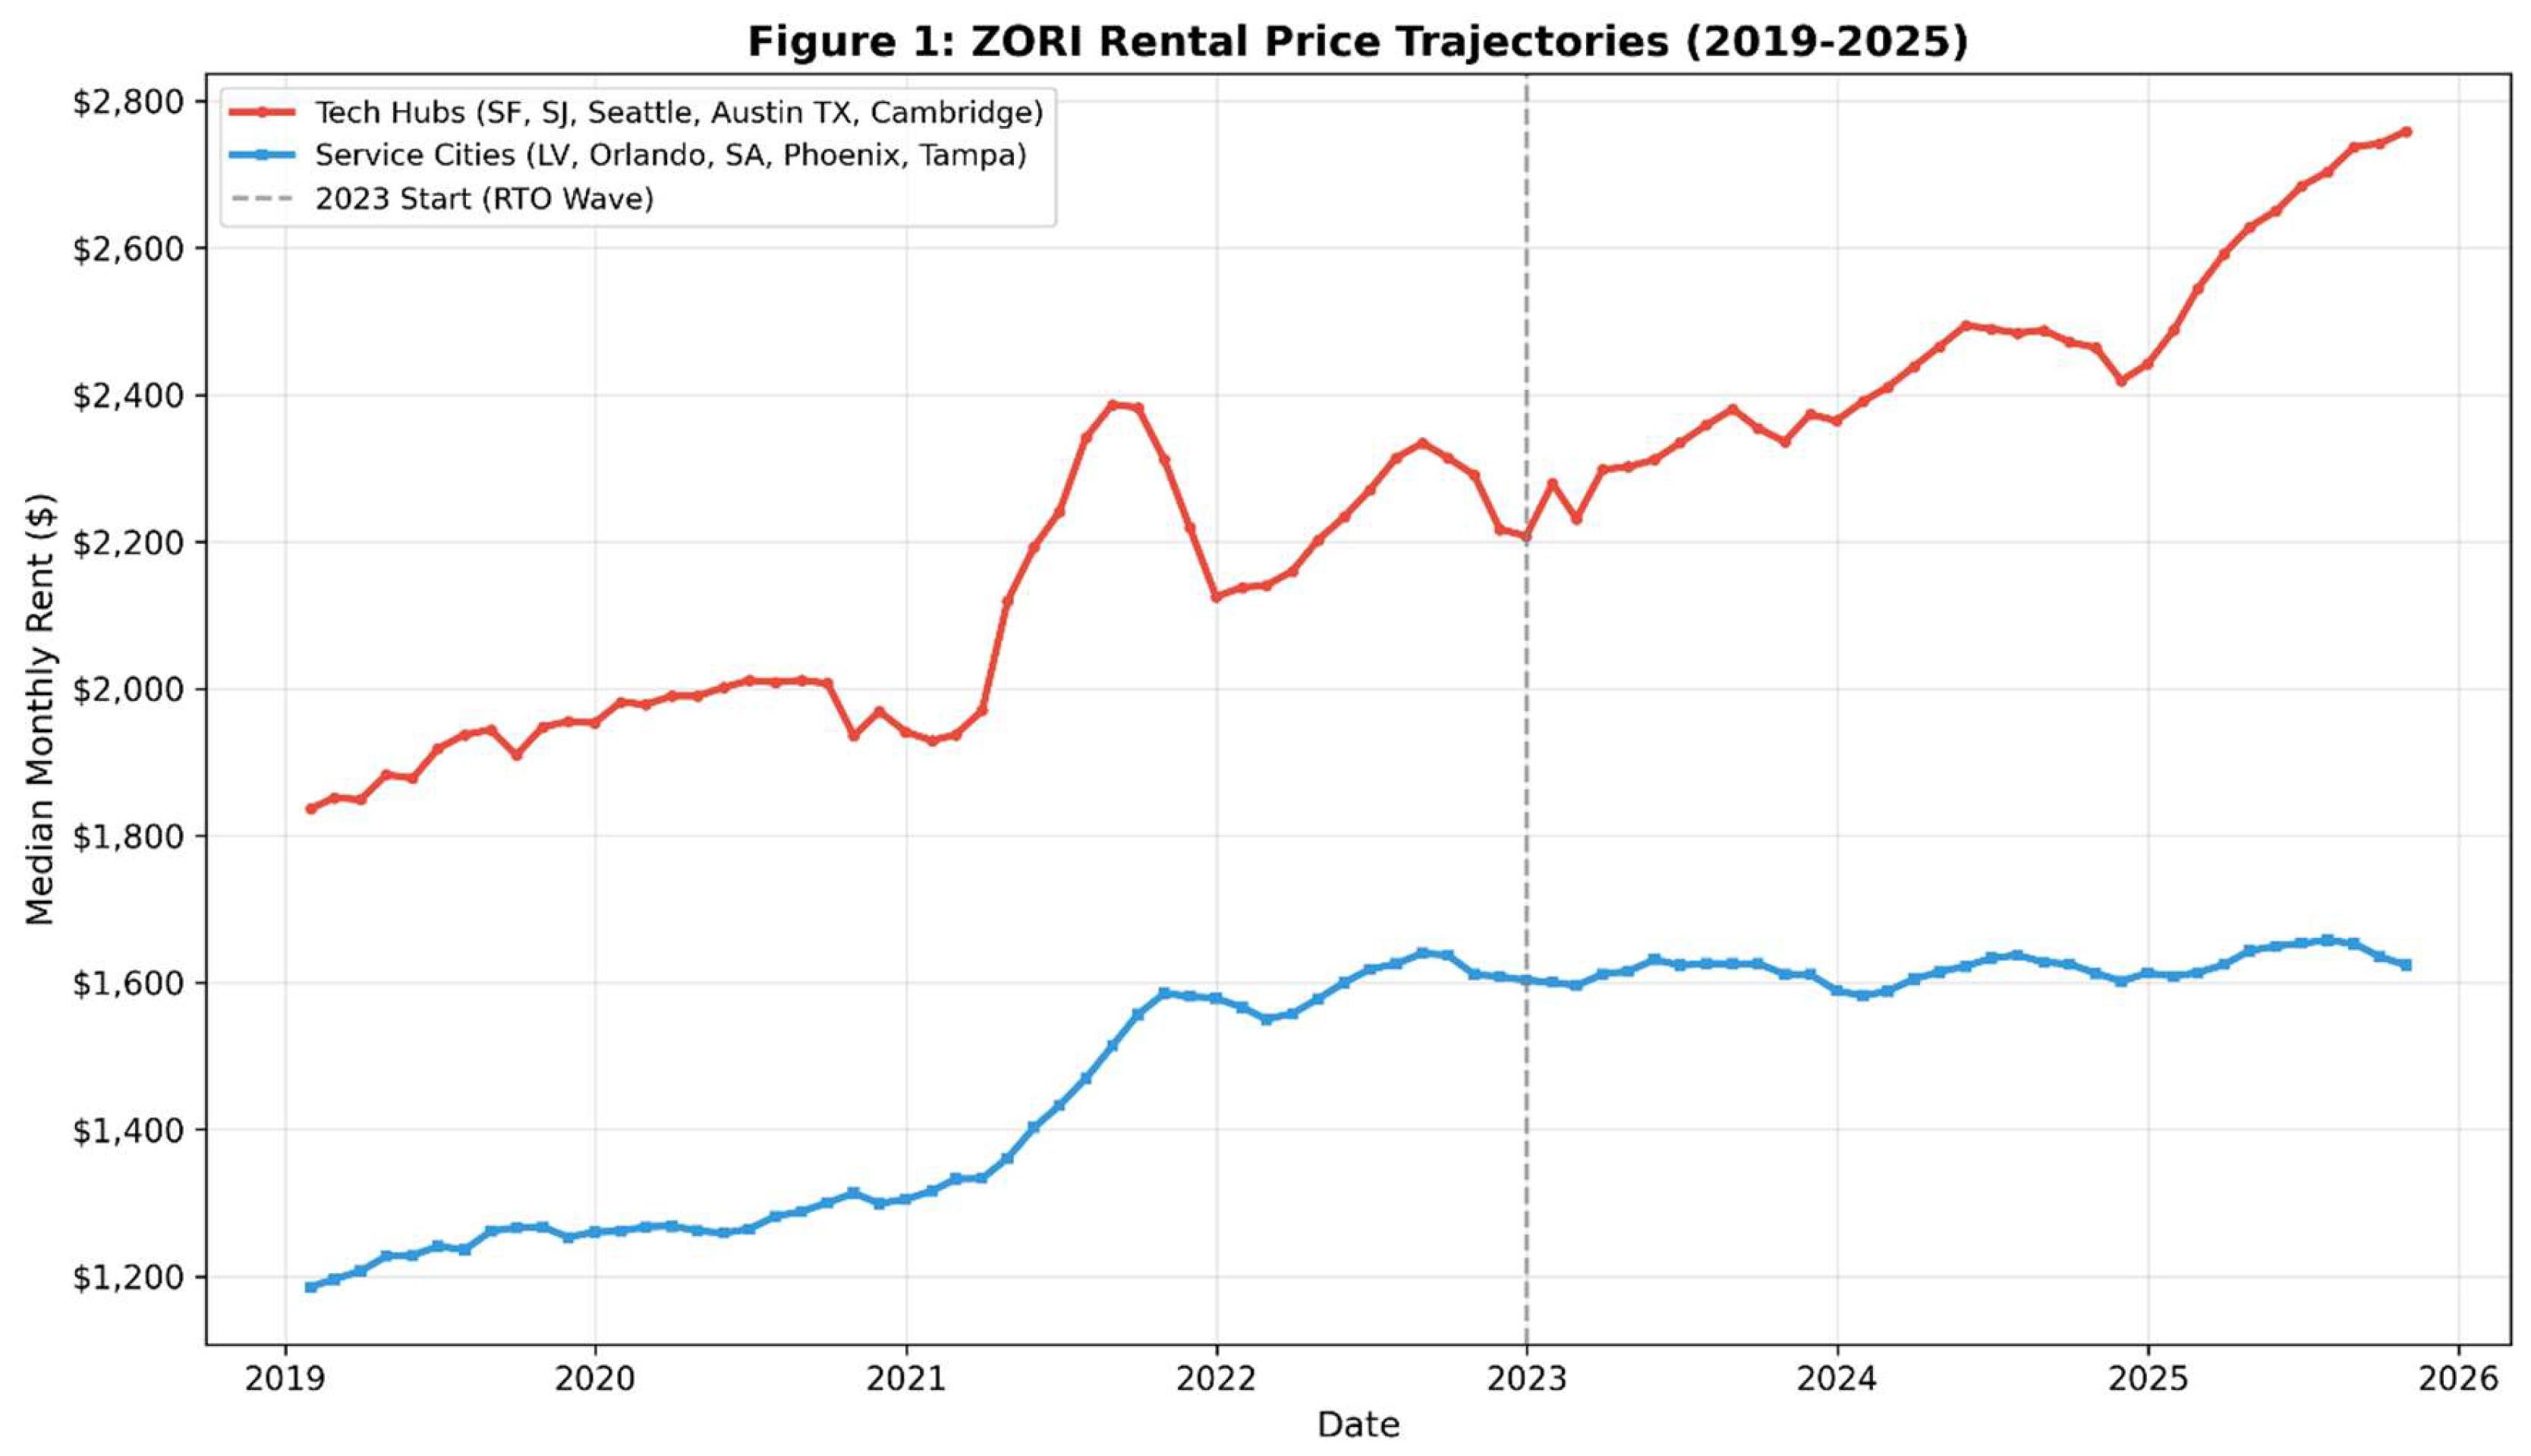
Figure 2.
Home value index trajectories (ZHVI, 2019–2025) for technology-centric and service-oriented metros.
Figure 2.
Home value index trajectories (ZHVI, 2019–2025) for technology-centric and service-oriented metros.
4.2. Difference-in-Differences Estimates
The DiD regression results are reported in Table 3. The estimated interaction coefficient (TechHub × Post-2023) is +6.75 percentage points (p < 0.001), indicating that technology-centric metros experienced substantially higher rental-growth acceleration in the post-2023 period relative to service-oriented metros. The model achieves an R² of 0.287, indicating that the included variables account for approximately 29% of the total variance in rental-price growth. The constant term (11.06 pp, p < 0.001) represents the average baseline rent growth in service metros during the pre-treatment period.
The comparison between the initial (city-name-only) and strict (verified city-state pair) classifications is informative. Under the initial classification, the DiD coefficient was +6.43 pp (p < 0.001) with R² = 0.177 on 80,589 observations. Under the strict classification, the coefficient increased slightly to +6.75 pp with a substantially higher R² of 0.287. The improvement in model fit suggests that the stricter classification removed noise from misclassified ZIP codes, and the slight increase in the point estimate is consistent with classical measurement-error attenuation bias in the initial specification. A parallel robustness check using home-price YoY growth as the dependent variable yielded a comparable DiD coefficient of +6.41 pp (p < 0.001), suggesting that the rental-growth differential is broadly mirrored in the ownership market.
4.3. Event-Study Results and Pre-Trend Assessment
The event-study specification (Equation 2) reveals a critical violation of the parallel trends assumption. Figure 3 plots the estimated quarterly interaction coefficients with 95% confidence intervals, using Q−1 (2022-Q4) as the reference period. Table 4 presents the full set of estimated coefficients.
The pre-treatment coefficients reveal a pronounced and systematic pattern of differential trends between technology hubs and service metros well before the 2023 treatment date. Six of the seven pre-treatment interaction terms are statistically significant at the 0.1% level. The trajectory describes an inverted U-shaped (hump-shaped) pattern: technology hubs exhibited substantially lower rent growth than service metros in early 2021 (Q−8: −13.38 pp, Q−7: −8.44 pp), consistent with the pandemic-era rental collapse in tech cities. This gap then reversed sharply, with technology hubs showing progressively higher rent growth from late 2021 through mid-2022 (Q−5: +7.79 pp, Q−4: +9.62 pp). The differential then moderated toward the reference period (Q−2: +3.19 pp).
This pattern is fundamentally inconsistent with the parallel trends assumption required for valid DiD inference. The technology-hub rental-growth “catch-up” was already well underway by mid-2022, predating major RTO announcements by several quarters. The estimated DiD coefficient of +6.75 pp therefore reflects the continuation of a pre-existing convergence process, not a discrete treatment effect attributable to RTO mandates. This finding is critical for the interpretation of all subsequent results and motivates the recharacterization of findings as descriptive correlations rather than causal effects.
4.4. Placebo Test Results.
The placebo tests provide further evidence against a causal interpretation. Table 5 reports the DiD coefficient for each of the four treatment dates.
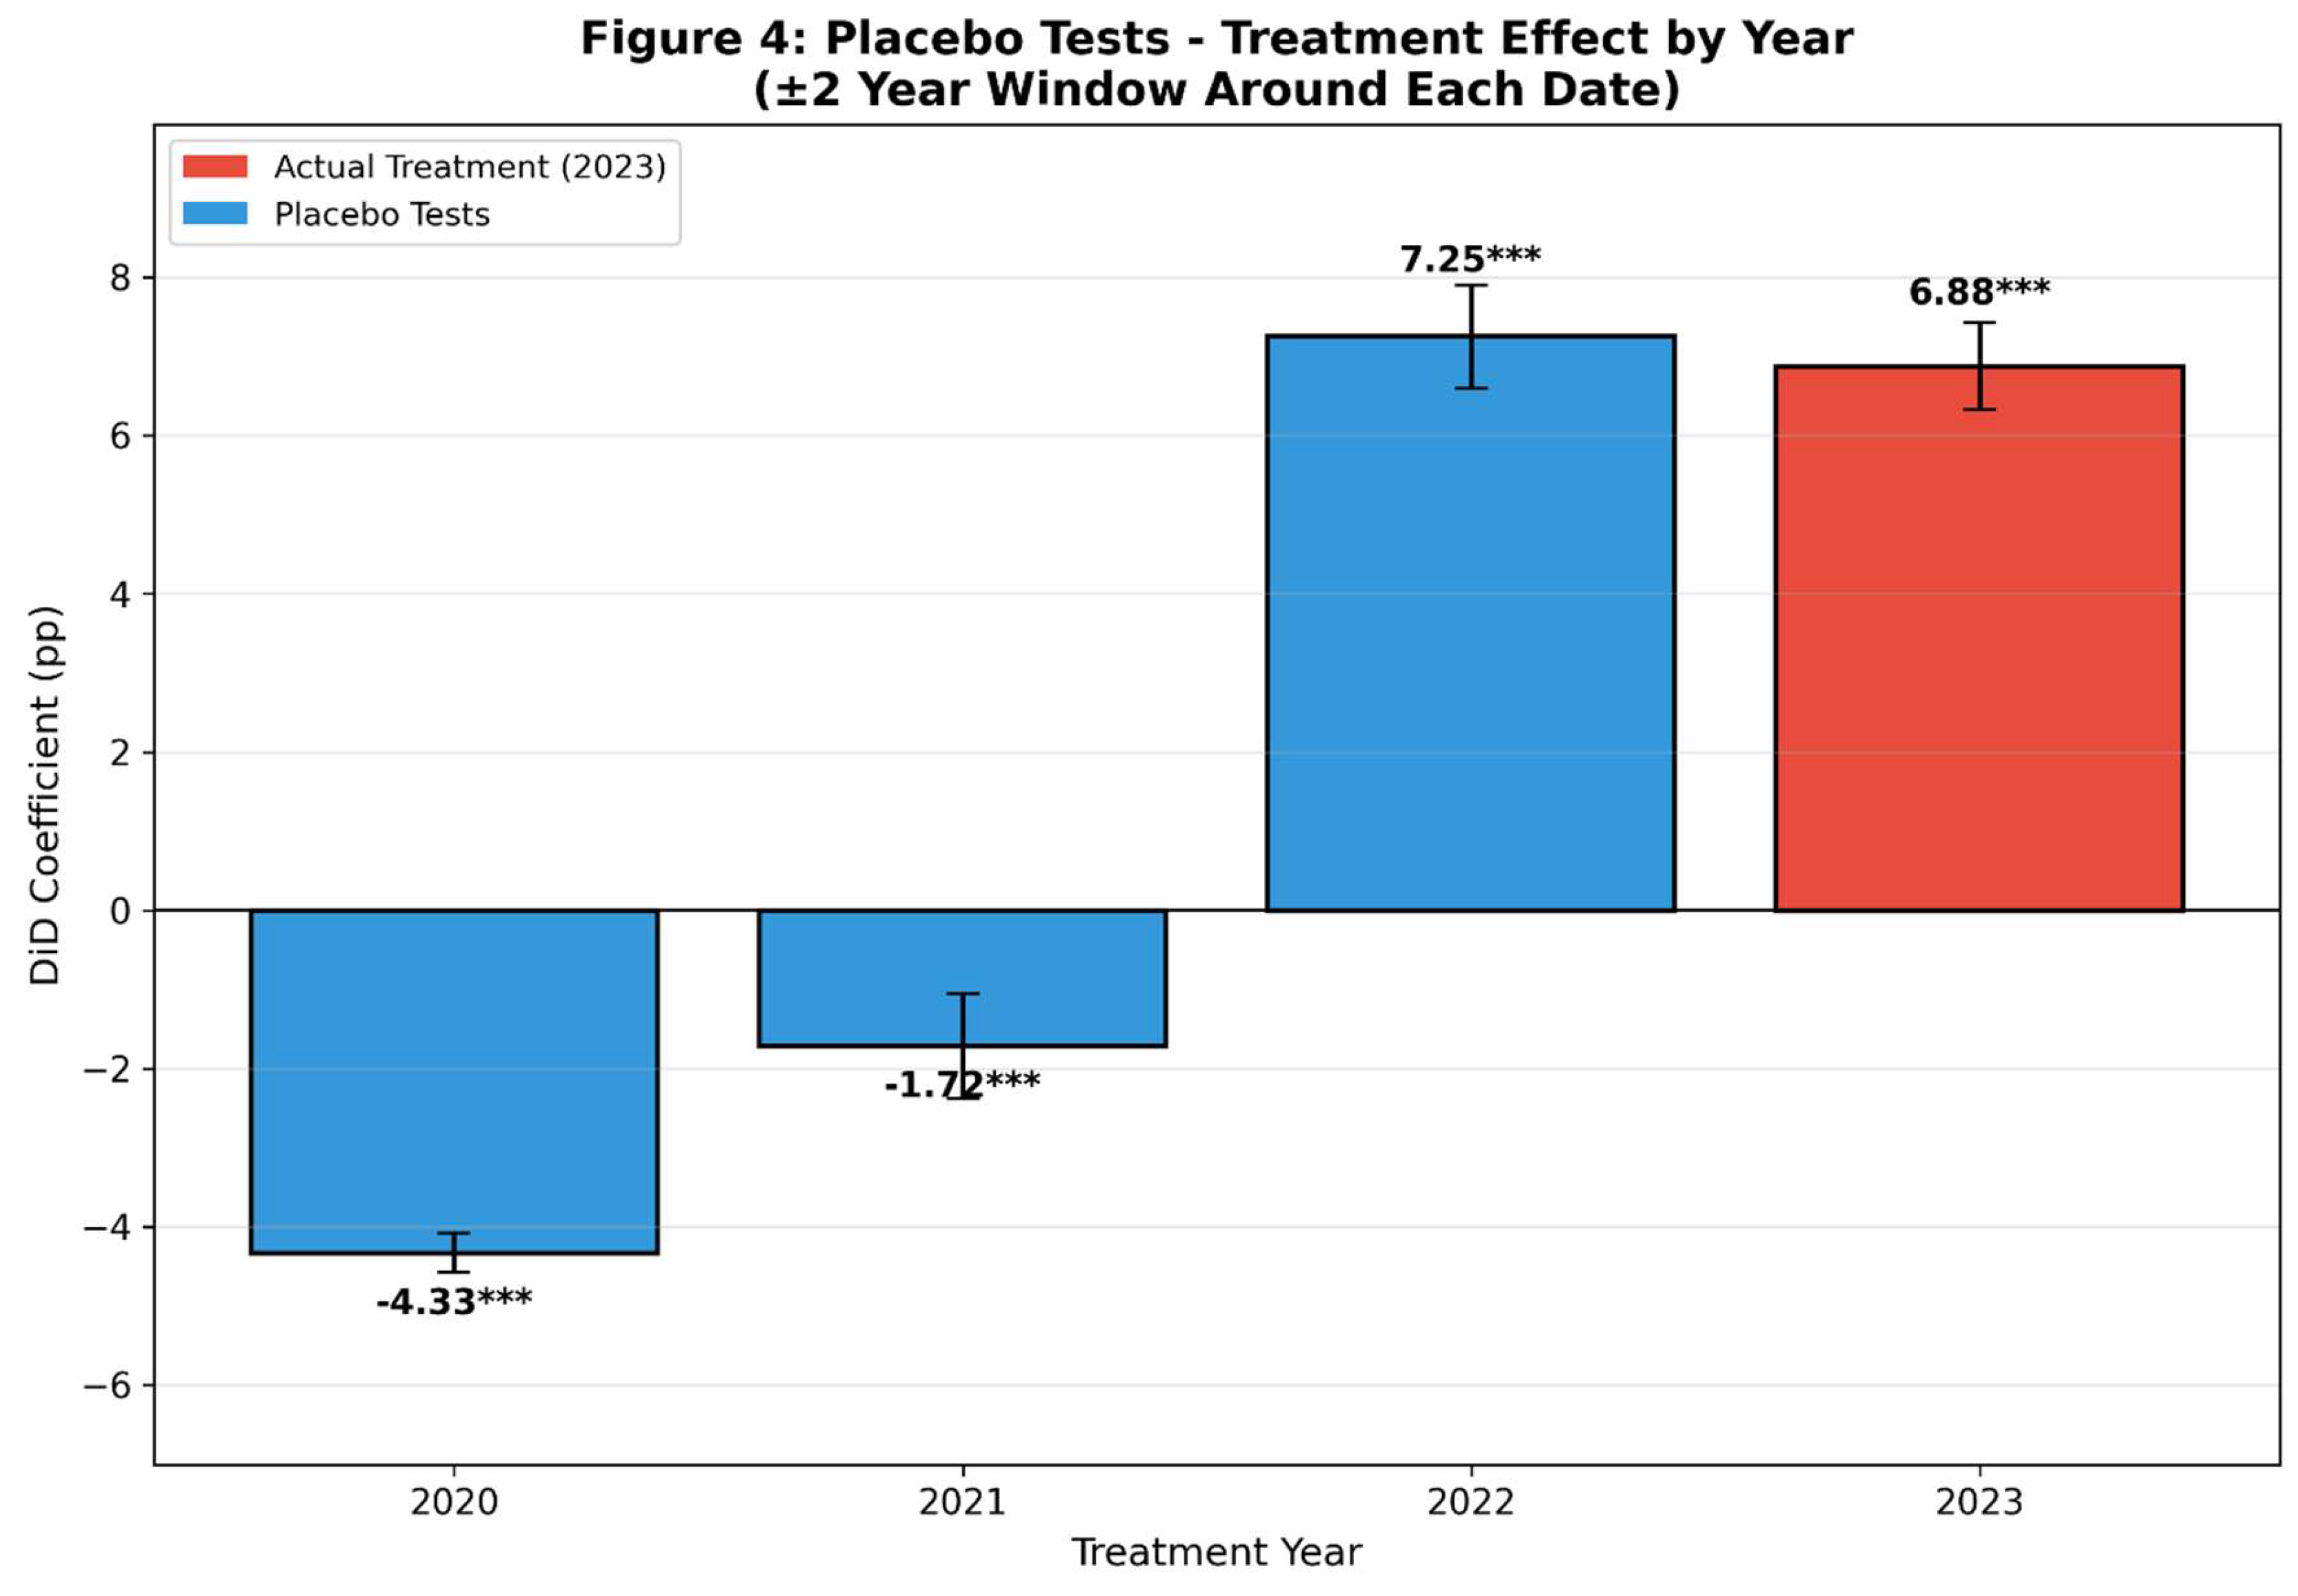
All three placebo treatment dates yield statistically significant DiD coefficients at the 0.1% level, decisively rejecting the null hypothesis that the post-2023 differential is unique to the actual treatment period. The 2020 placebo (−4.33 pp) captures the initial phase of the pandemic during which technology hubs experienced sharper rental declines than service metros, producing a negative “treatment” effect. The 2021 placebo (−1.72 pp) captures a similar but attenuated pattern. Most critically, the 2022 placebo (+7.25 pp) produces a positive coefficient that exceeds the actual 2023 estimate (+6.88 pp) in magnitude, demonstrating that the rental-growth differential in favor of technology hubs was already stronger in the year before RTO mandates than in the year after. This result is particularly damaging to the causal interpretation, as it implies that the observed post-2023 pattern represents a moderation—not an acceleration—of an existing trend.
Figure 4.
Placebo-test DiD estimates across four treatment dates. The 2022 placebo effect (+7.25 pp) exceeds the actual 2023 effect (+6.88 pp), undermining causal attribution.
Figure 4.
Placebo-test DiD estimates across four treatment dates. The 2022 placebo effect (+7.25 pp) exceeds the actual 2023 effect (+6.88 pp), undermining causal attribution.
4.5. Effect-Size Assessment
Table 6 summarizes the effect-size measures computed for the primary associations of interest.
The effect-size results present a nuanced picture. While the DiD model explains a large share of variance (R² = 0.287), and the standardized regression coefficient for the interaction term is of medium magnitude (β = 0.349), the Cohen’s d of 0.009 indicates that the raw standardized mean difference between technology hubs and service metros in the post-2023 period is negligible. This discrepancy arises because the DiD framework isolates a specific differential trend (the interaction), whereas Cohen’s d compares unconditional group means and is dominated by the large within-group variance in rent growth. The partial η² of 0.0499 falls just below the medium threshold, indicating that the treatment interaction accounts for approximately 5% of the variance in rent growth after controlling for main effects and fixed effects. The small Pearson correlation between rent and price growth (r = 0.288, r² = 0.083) confirms that the two markets share only about 8% of their variation, justifying the separate analytical treatment adopted throughout this study.
4.6. STL Decomposition and Stationarity
The STL decomposition of the national median rental-price series yields three components: trend, seasonal, and residual. The trend component shows a clear trajectory: a gradual increase from approximately $1,490 in January 2019 through February 2020, followed by a brief dip, then an accelerating increase to approximately $1,800 by mid-2022, and a gradual moderation thereafter. The trend strength is 0.985, indicating that the long-run trend component captures 98.5% of the non-residual variation in the series. The seasonal strength is 0.163, indicating that seasonal patterns are weak relative to the dominant trend. This finding is consistent with the characterization of rental-price movements as primarily structural rather than cyclical over the study period.
The residual component reveals several notable features. The largest positive residuals occur in mid-2021, coinciding with the explosive reopening-driven demand surge. The largest negative residuals occur in early 2020, corresponding to the initial pandemic shock. After mid-2022, the residuals show lower variance, suggesting that the rental market stabilized as the post-pandemic adjustment progressed.
Figure 5.
STL decomposition of the aggregate ZORI rental-price series (2019–2025): observed, trend, seasonal, and residual components.
Figure 5.
STL decomposition of the aggregate ZORI rental-price series (2019–2025): observed, trend, seasonal, and residual components.
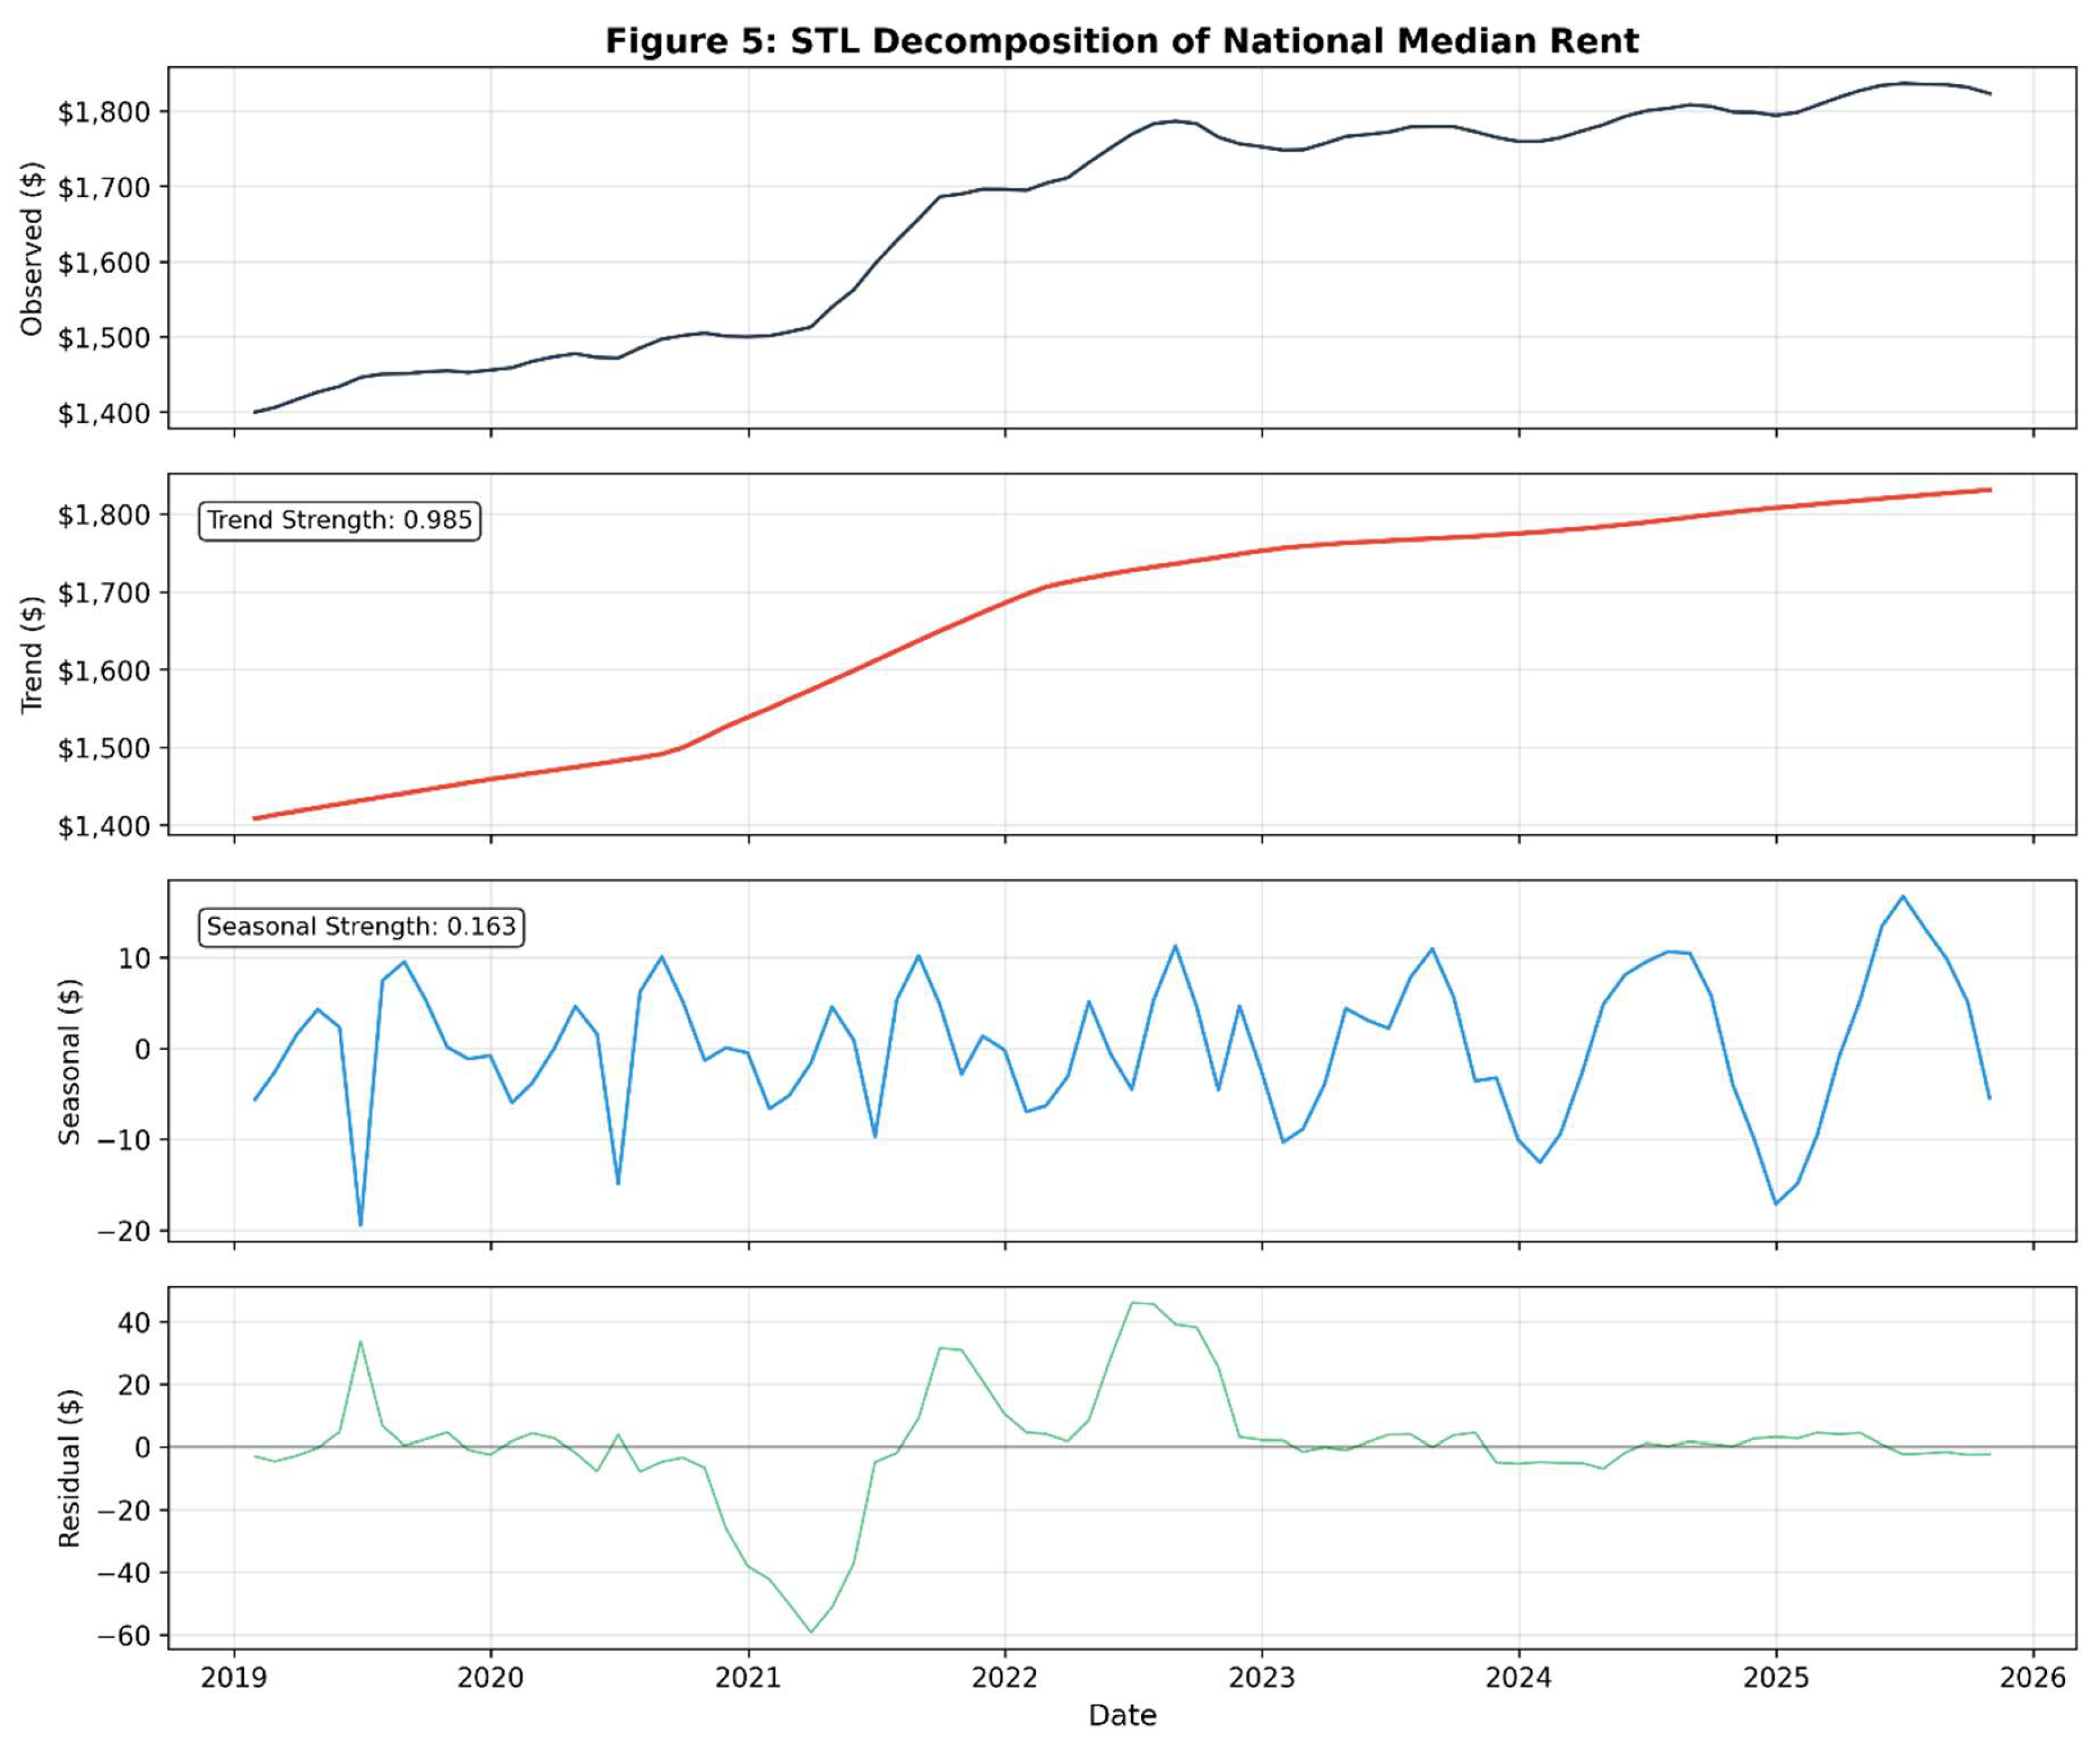
Table 7 The joint application of the ADF and KPSS tests indicates that the rental-price series is integrated of order one (I(1)), necessitating first differencing before autoregressive modeling.
4.7. SARIMAX Forecasting Results
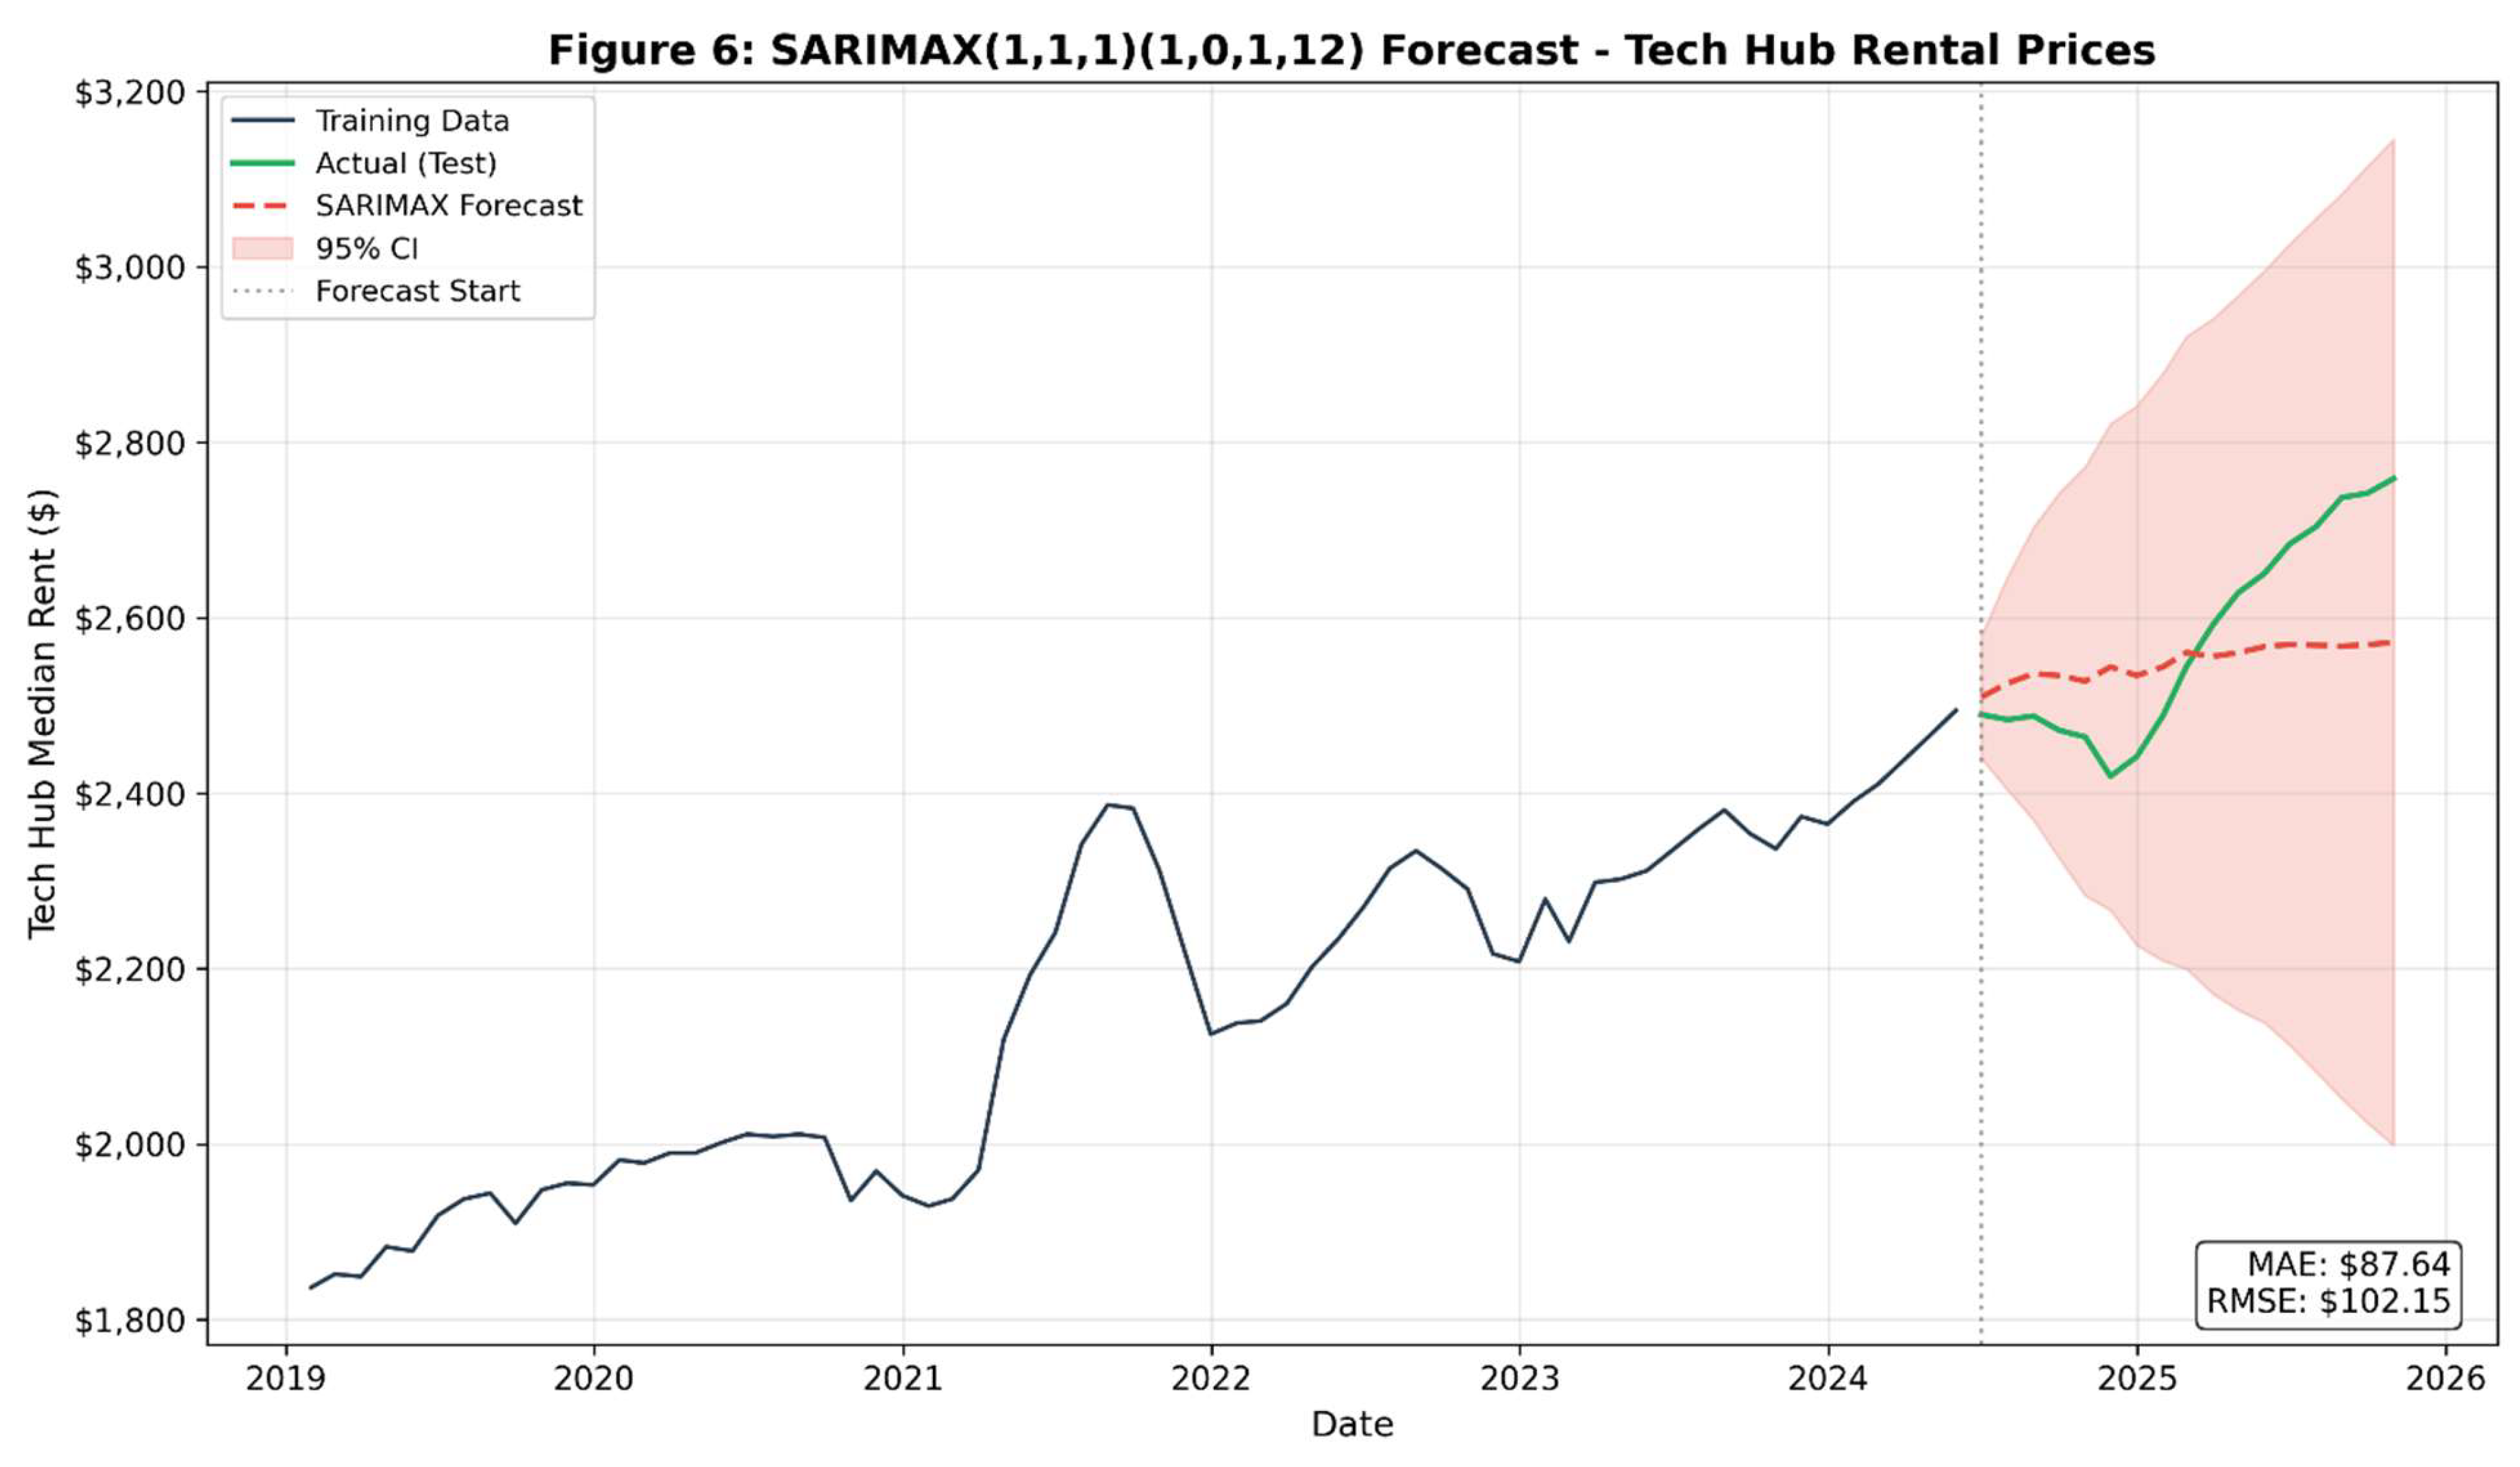
The SARIMAX(1,1,1)(1,0,1)₁₂ model estimates a post-2023 structural break coefficient of +$81.74 per month (p = 0.092), which is directionally consistent with the DiD estimate of a positive rental-growth differential for technology hubs. However, the effect is not statistically significant at the conventional 5% level, falling in the marginal range between the 5% and 10% thresholds. This result has important implications: when temporal autocorrelation is explicitly modeled—as the SARIMAX framework requires—the apparently strong treatment effect identified by standard OLS-based DiD attenuates to marginal significance, suggesting that a substantial portion of the observed differential is explained by the autoregressive structure of the rental-price series rather than a discrete structural break.
The model diagnostics are satisfactory. The Ljung–Box Q-test for residual autocorrelation yields p = 0.79, indicating no significant remaining serial correlation at any lag up to 12 months. The AIC of 677.56 and BIC of 690.79 are consistent with a parsimonious yet well-fitting specification. The SARIMAX residuals are approximately normally distributed with no obvious heteroskedasticity patterns, supporting the validity of the confidence intervals.
Figure 6.
SARIMAX out-of-sample forecast for the national median rental-price series with 95% confidence intervals.
Figure 6.
SARIMAX out-of-sample forecast for the national median rental-price series with 95% confidence intervals.
4.8. Prophet Forecasting Results.
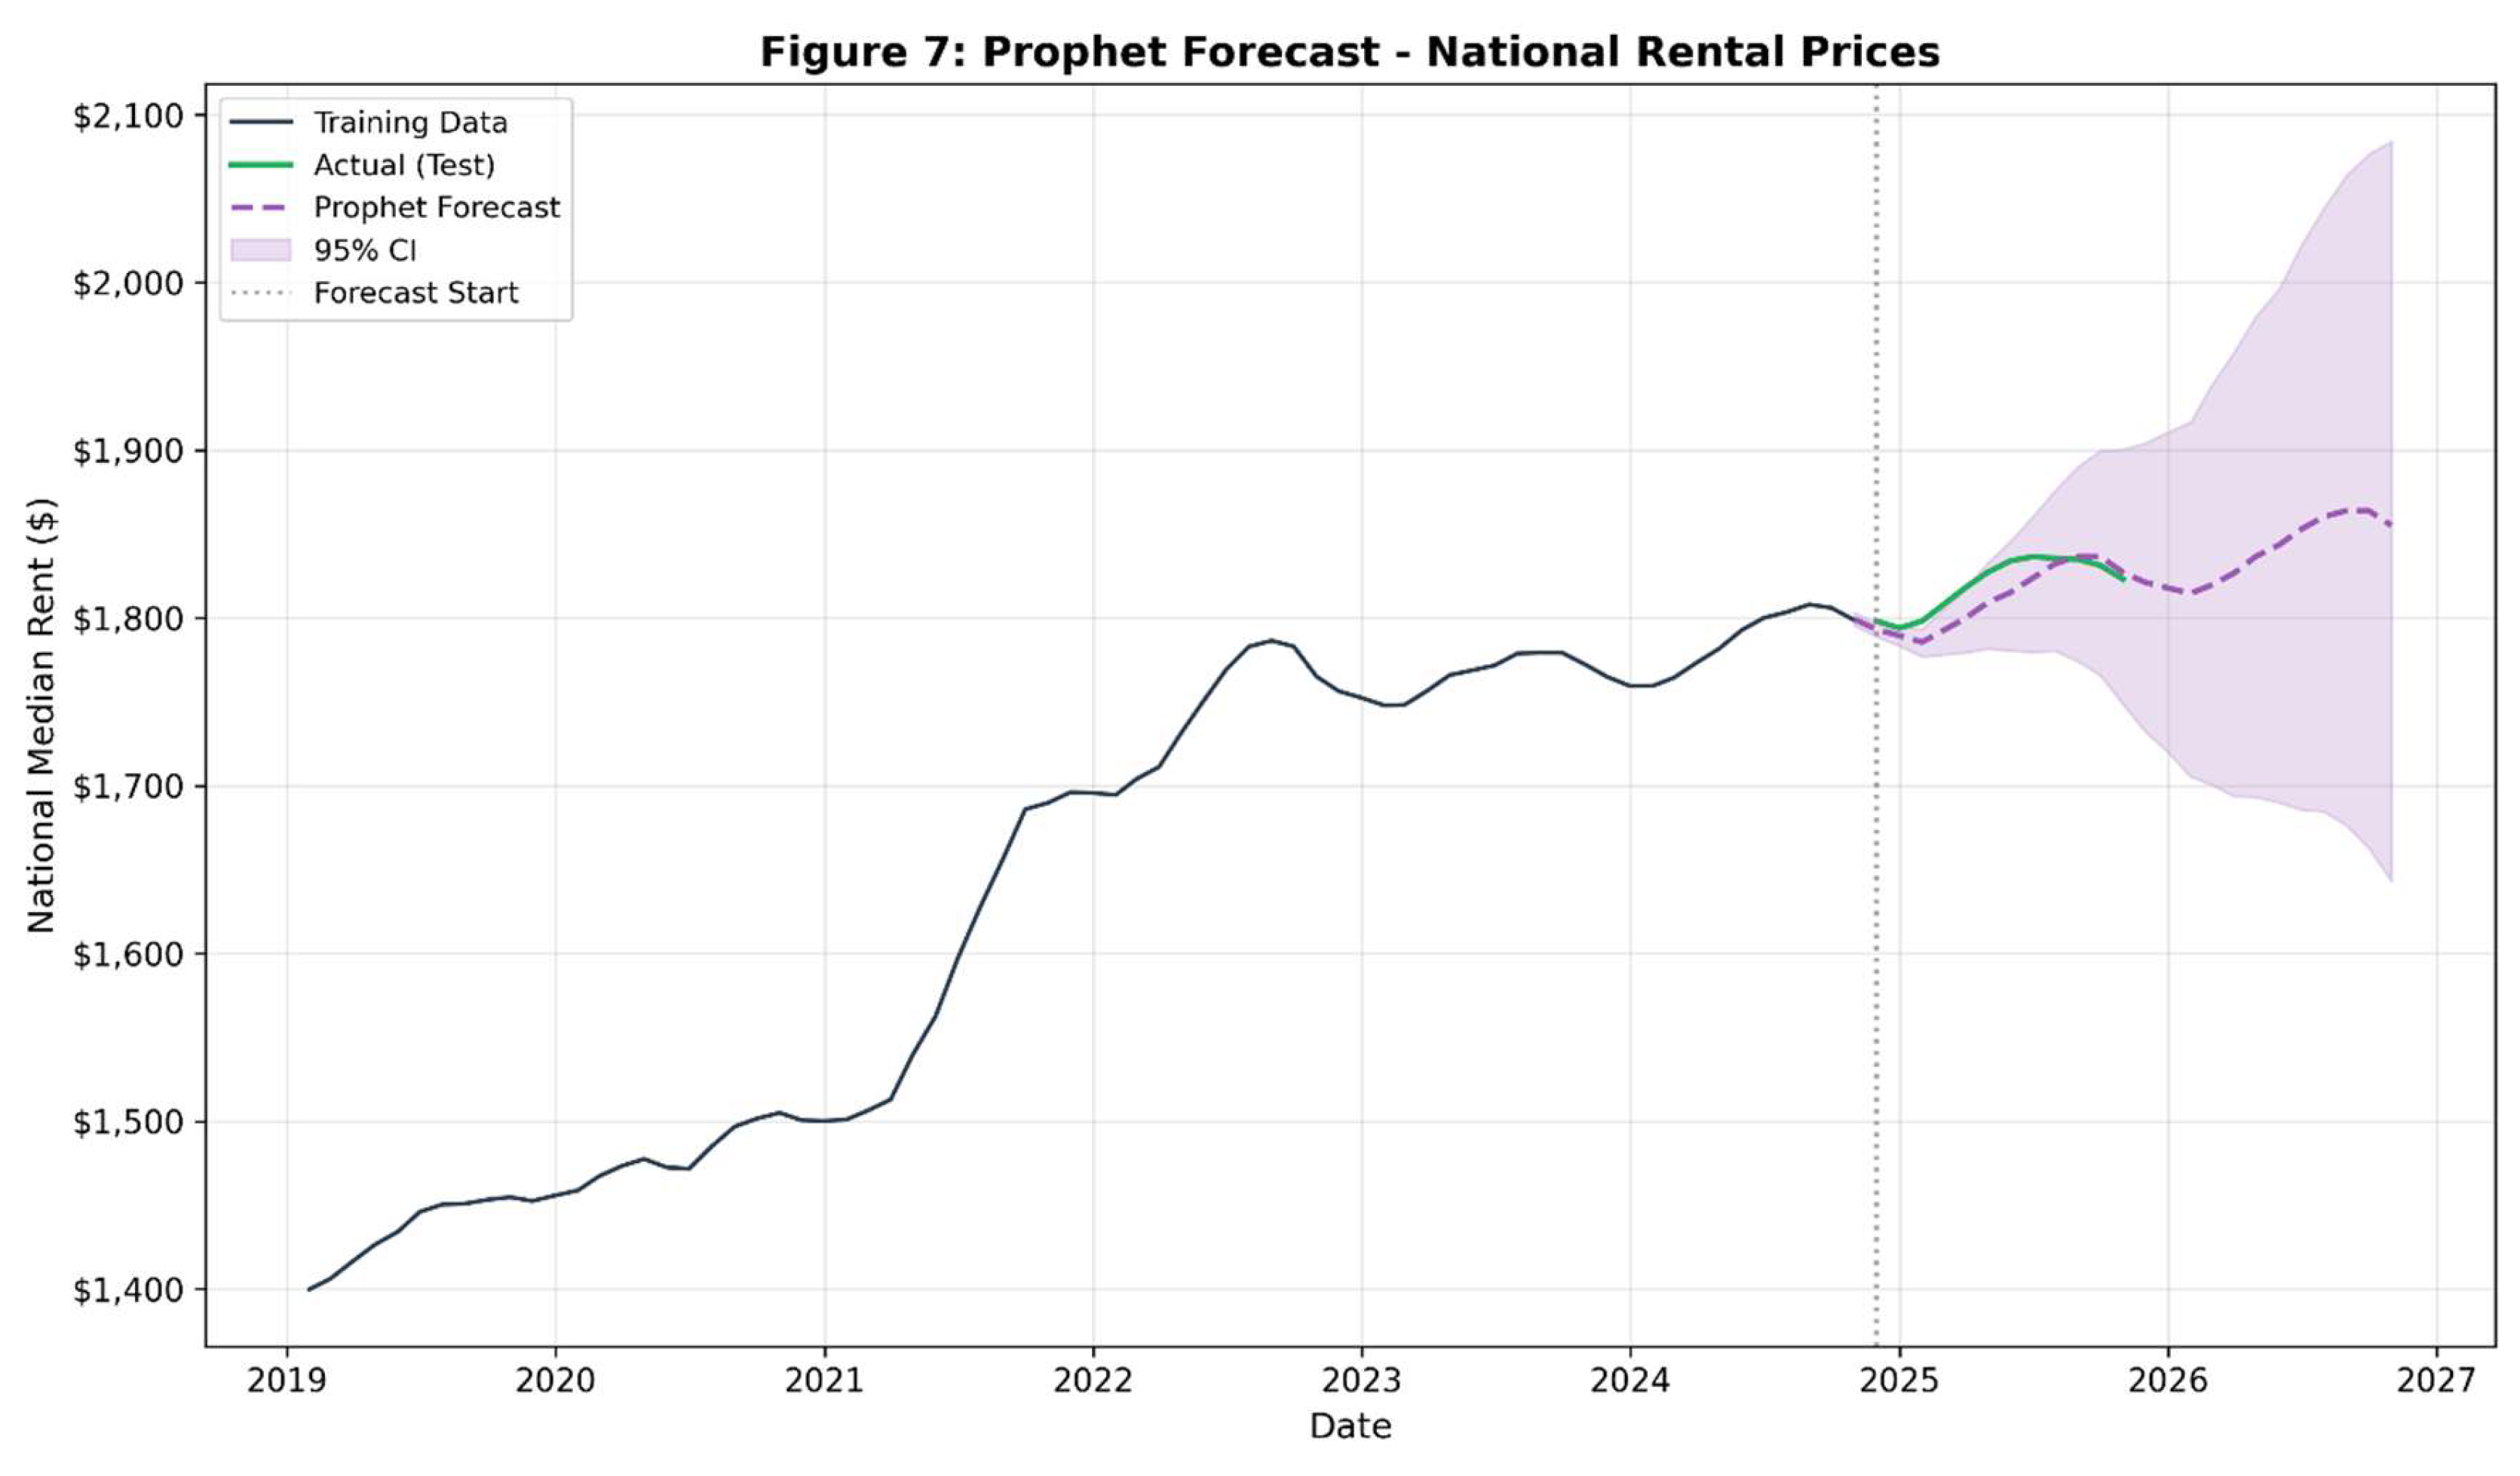
The Facebook Prophet model achieves excellent out-of-sample forecast accuracy, with MAE = $9.98, RMSE = $11.81, and MAPE = 0.55% on the 12-month test set. These error magnitudes correspond to a forecast accuracy of approximately 99.45%, indicating that the model captures the essential dynamics of rental-price evolution with high fidelity. The Prophet decomposition identifies a strong upward trend component and a modest yearly seasonal cycle, consistent with the STL results.
The 24-month ahead forecast projects the national median rent to continue its gradual upward trajectory, reaching approximately $1,821 by mid-2026 and $1,864 by late 2026. The 80% uncertainty interval widens progressively, reflecting increasing forecast uncertainty at longer horizons. The projected annual growth rate of approximately 2.5–3.0% for 2026 represents a moderation relative to the pandemic-era growth surge but remains above the long-run pre-pandemic average of approximately 2.0%, suggesting a structural upward shift in the rental-price level consistent with persistent changes in housing-market fundamentals.
Figure 7.
Prophet forecast for the national median rental-price series (2019–2027) with 80% uncertainty interval.
Figure 7.
Prophet forecast for the national median rental-price series (2019–2027) with 80% uncertainty interval.
4.9. XGBoost Feature Importance and Model Performance
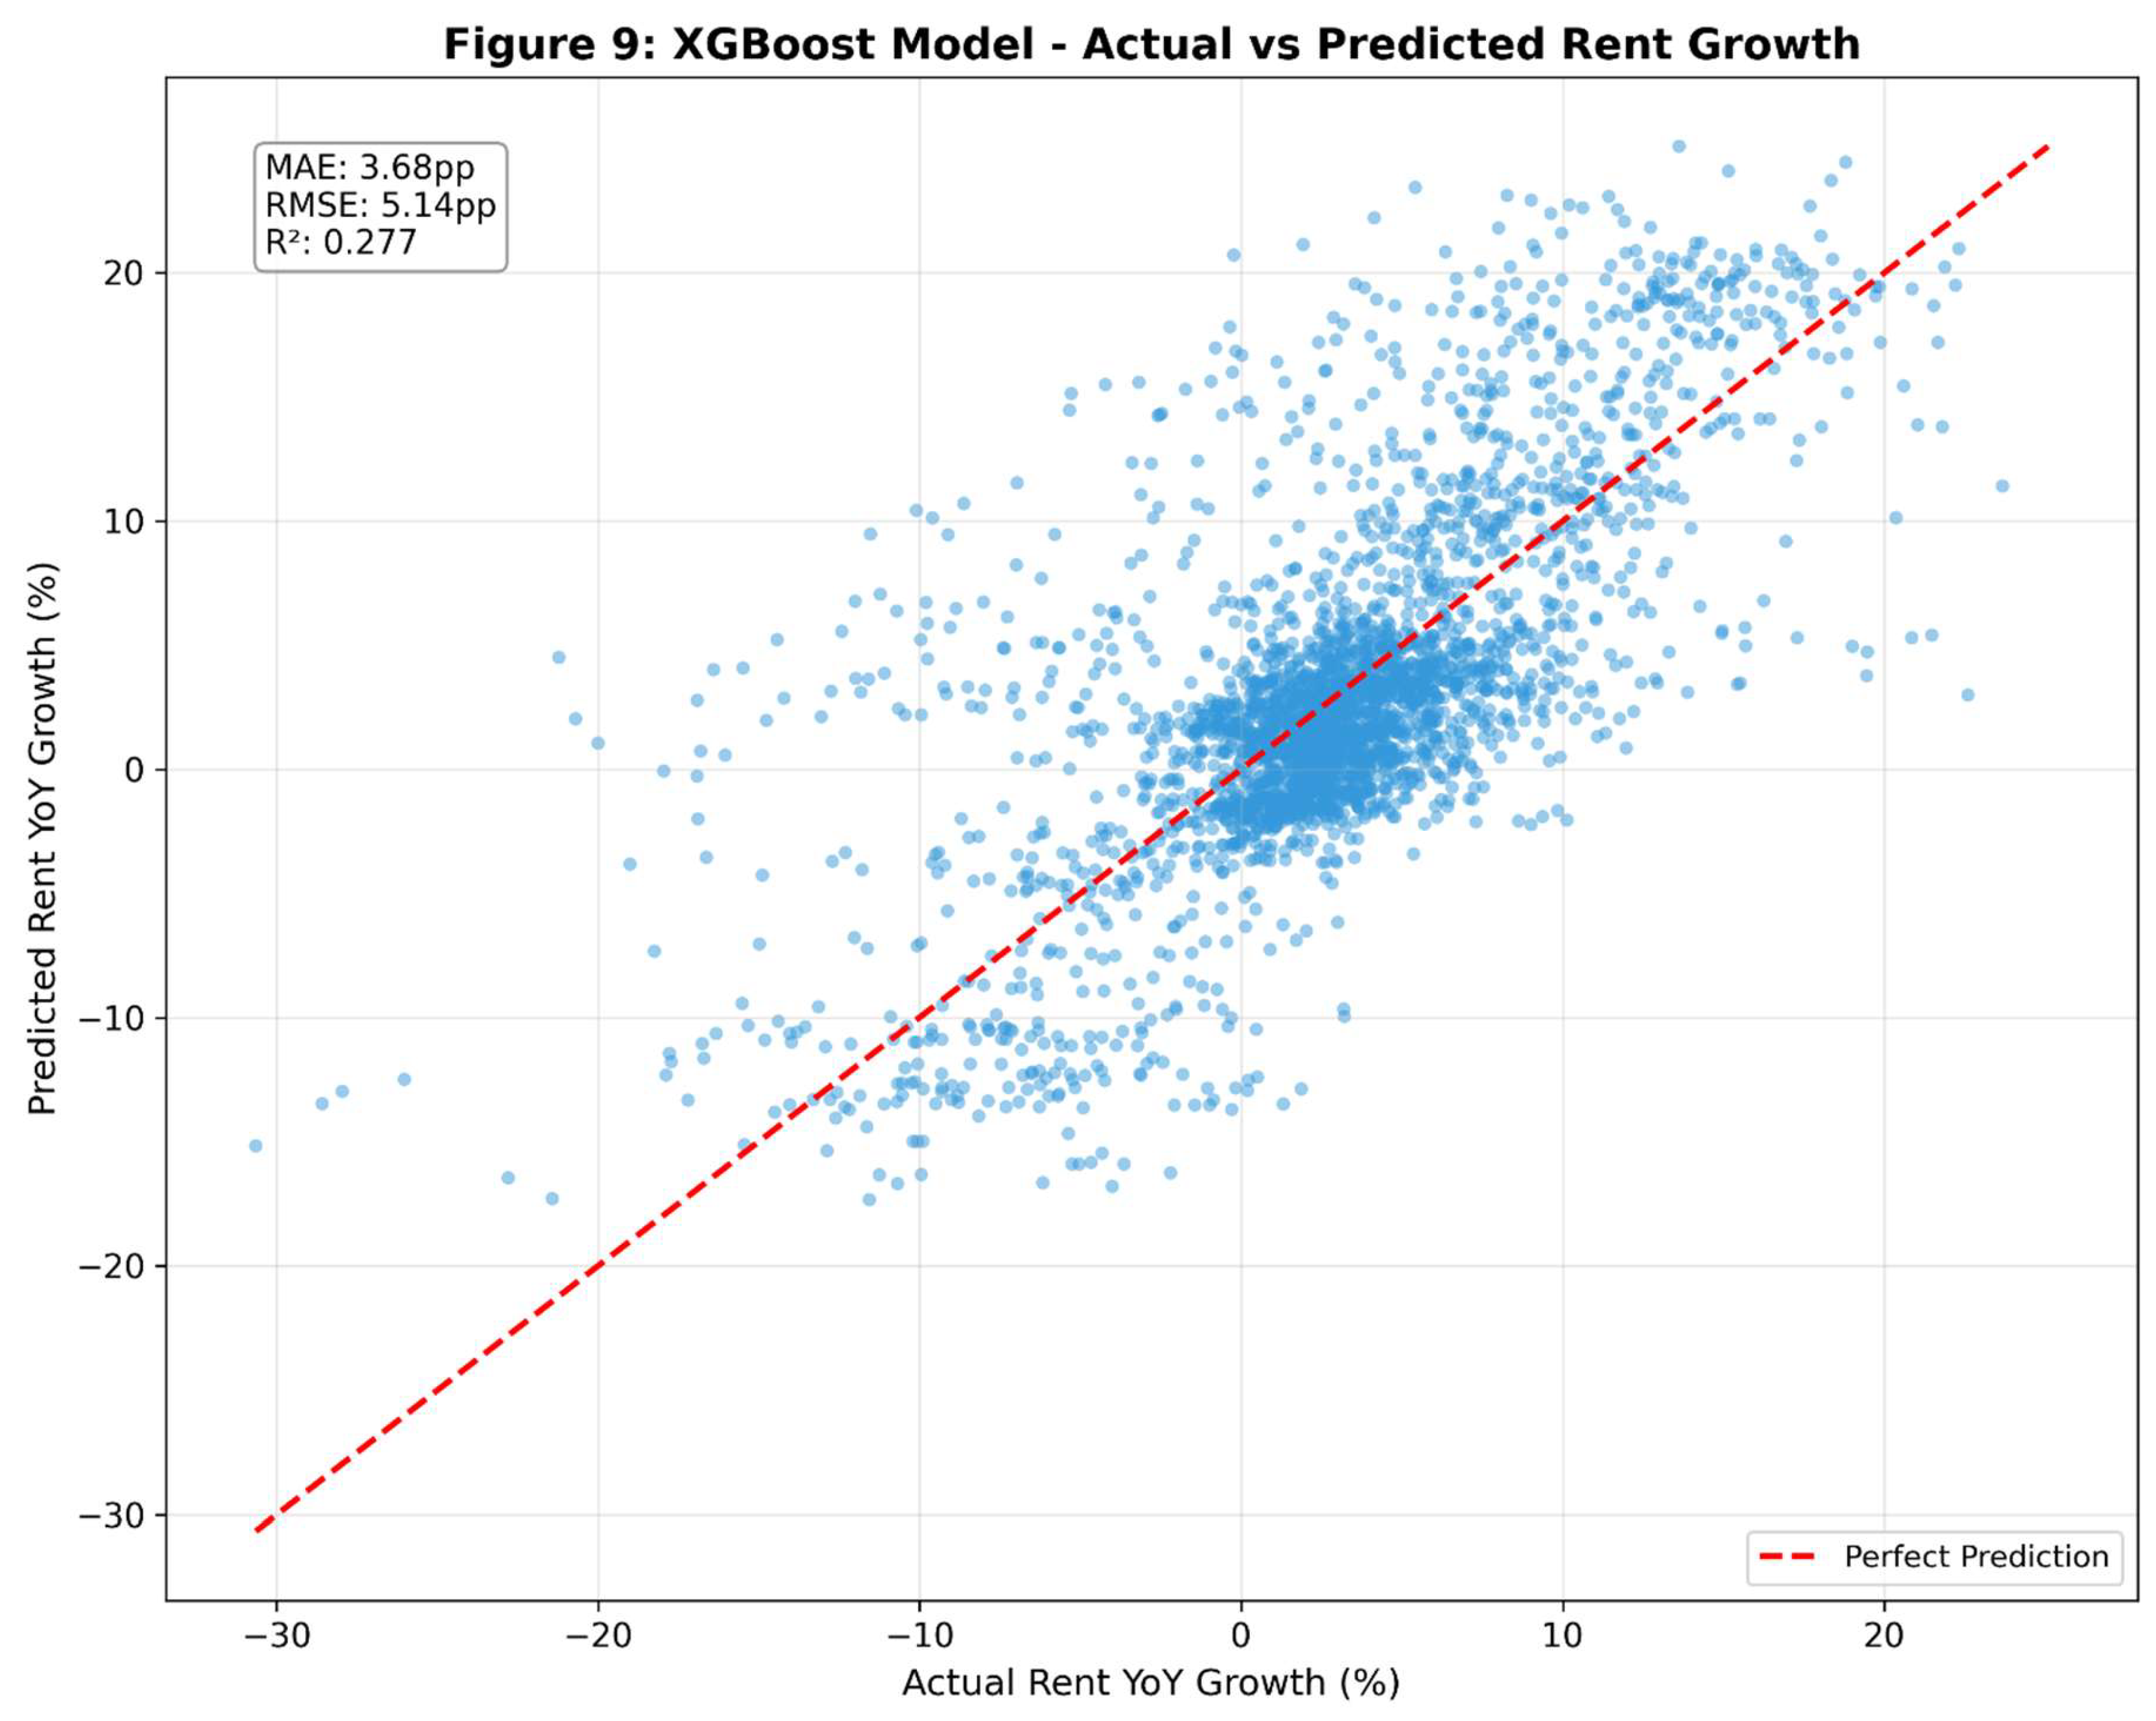
The XGBoost model achieves strong predictive performance on the held-out test set, with MAE = 3.68 pp and RMSE = 5.14 pp. Five-fold cross-validation using the TimeSeriesSplit strategy yields MAE = 3.86 ± 0.39 pp and RMSE = 5.13 ± 0.54 pp, indicating stable out-of-sample generalization. The seed-stability analysis across five deterministic seeds produces MAE = 2.38 ± 0.04 pp, with a coefficient of variation of 1.73%, confirming that the results are highly robust to stochastic initialization.
The feature-importance scores, presented in Table 8, provide critical insights into the relative predictive contribution of each variable.
The most consequential finding from the XGBoost analysis is the minimal importance of the Tech_x_Post interaction variable, which contributes only 0.7% of the total predictive gain. This result stands in stark contrast to the statistical significance of the DiD interaction coefficient (p < 0.001) and illustrates the distinction between statistical significance and predictive importance. The dominant predictor is Year (57.6%), which alone accounts for over half of the model’s predictive power, followed by lagged rent features and Month. Is_Tech_Hub contributes 9.0%, reflecting the fact that with a focused 10-city sample, the lagged features already encode much of the structural distinction between metro types. This indicates that the temporal trend is far more important for predicting rental-price growth than either metro classification or the specific interaction between metro type and the post-2023 period. In other words, knowing what year it is provides most of the information needed to predict rent growth; knowing whether it is specifically the post-RTO period adds virtually nothing beyond this factor.
The three lagged rent-growth variables collectively contribute 17.4% of the total gain (Rent_Lag6: 9.8%, Rent_Lag1: 6.3%, Rent_Lag3: 1.3%), confirming the autoregressive nature of rental-price dynamics and further supporting the SARIMAX approach. Month contributes 9.3%, reflecting the modest seasonal patterns identified in the STL decomposition.
Figure 8.
XGBoost feature-importance scores (total gain criterion). The DiD interaction term (Tech_x_Post) contributes only 0.7% of predictive importance.
Figure 8.
XGBoost feature-importance scores (total gain criterion). The DiD interaction term (Tech_x_Post) contributes only 0.7% of predictive importance.
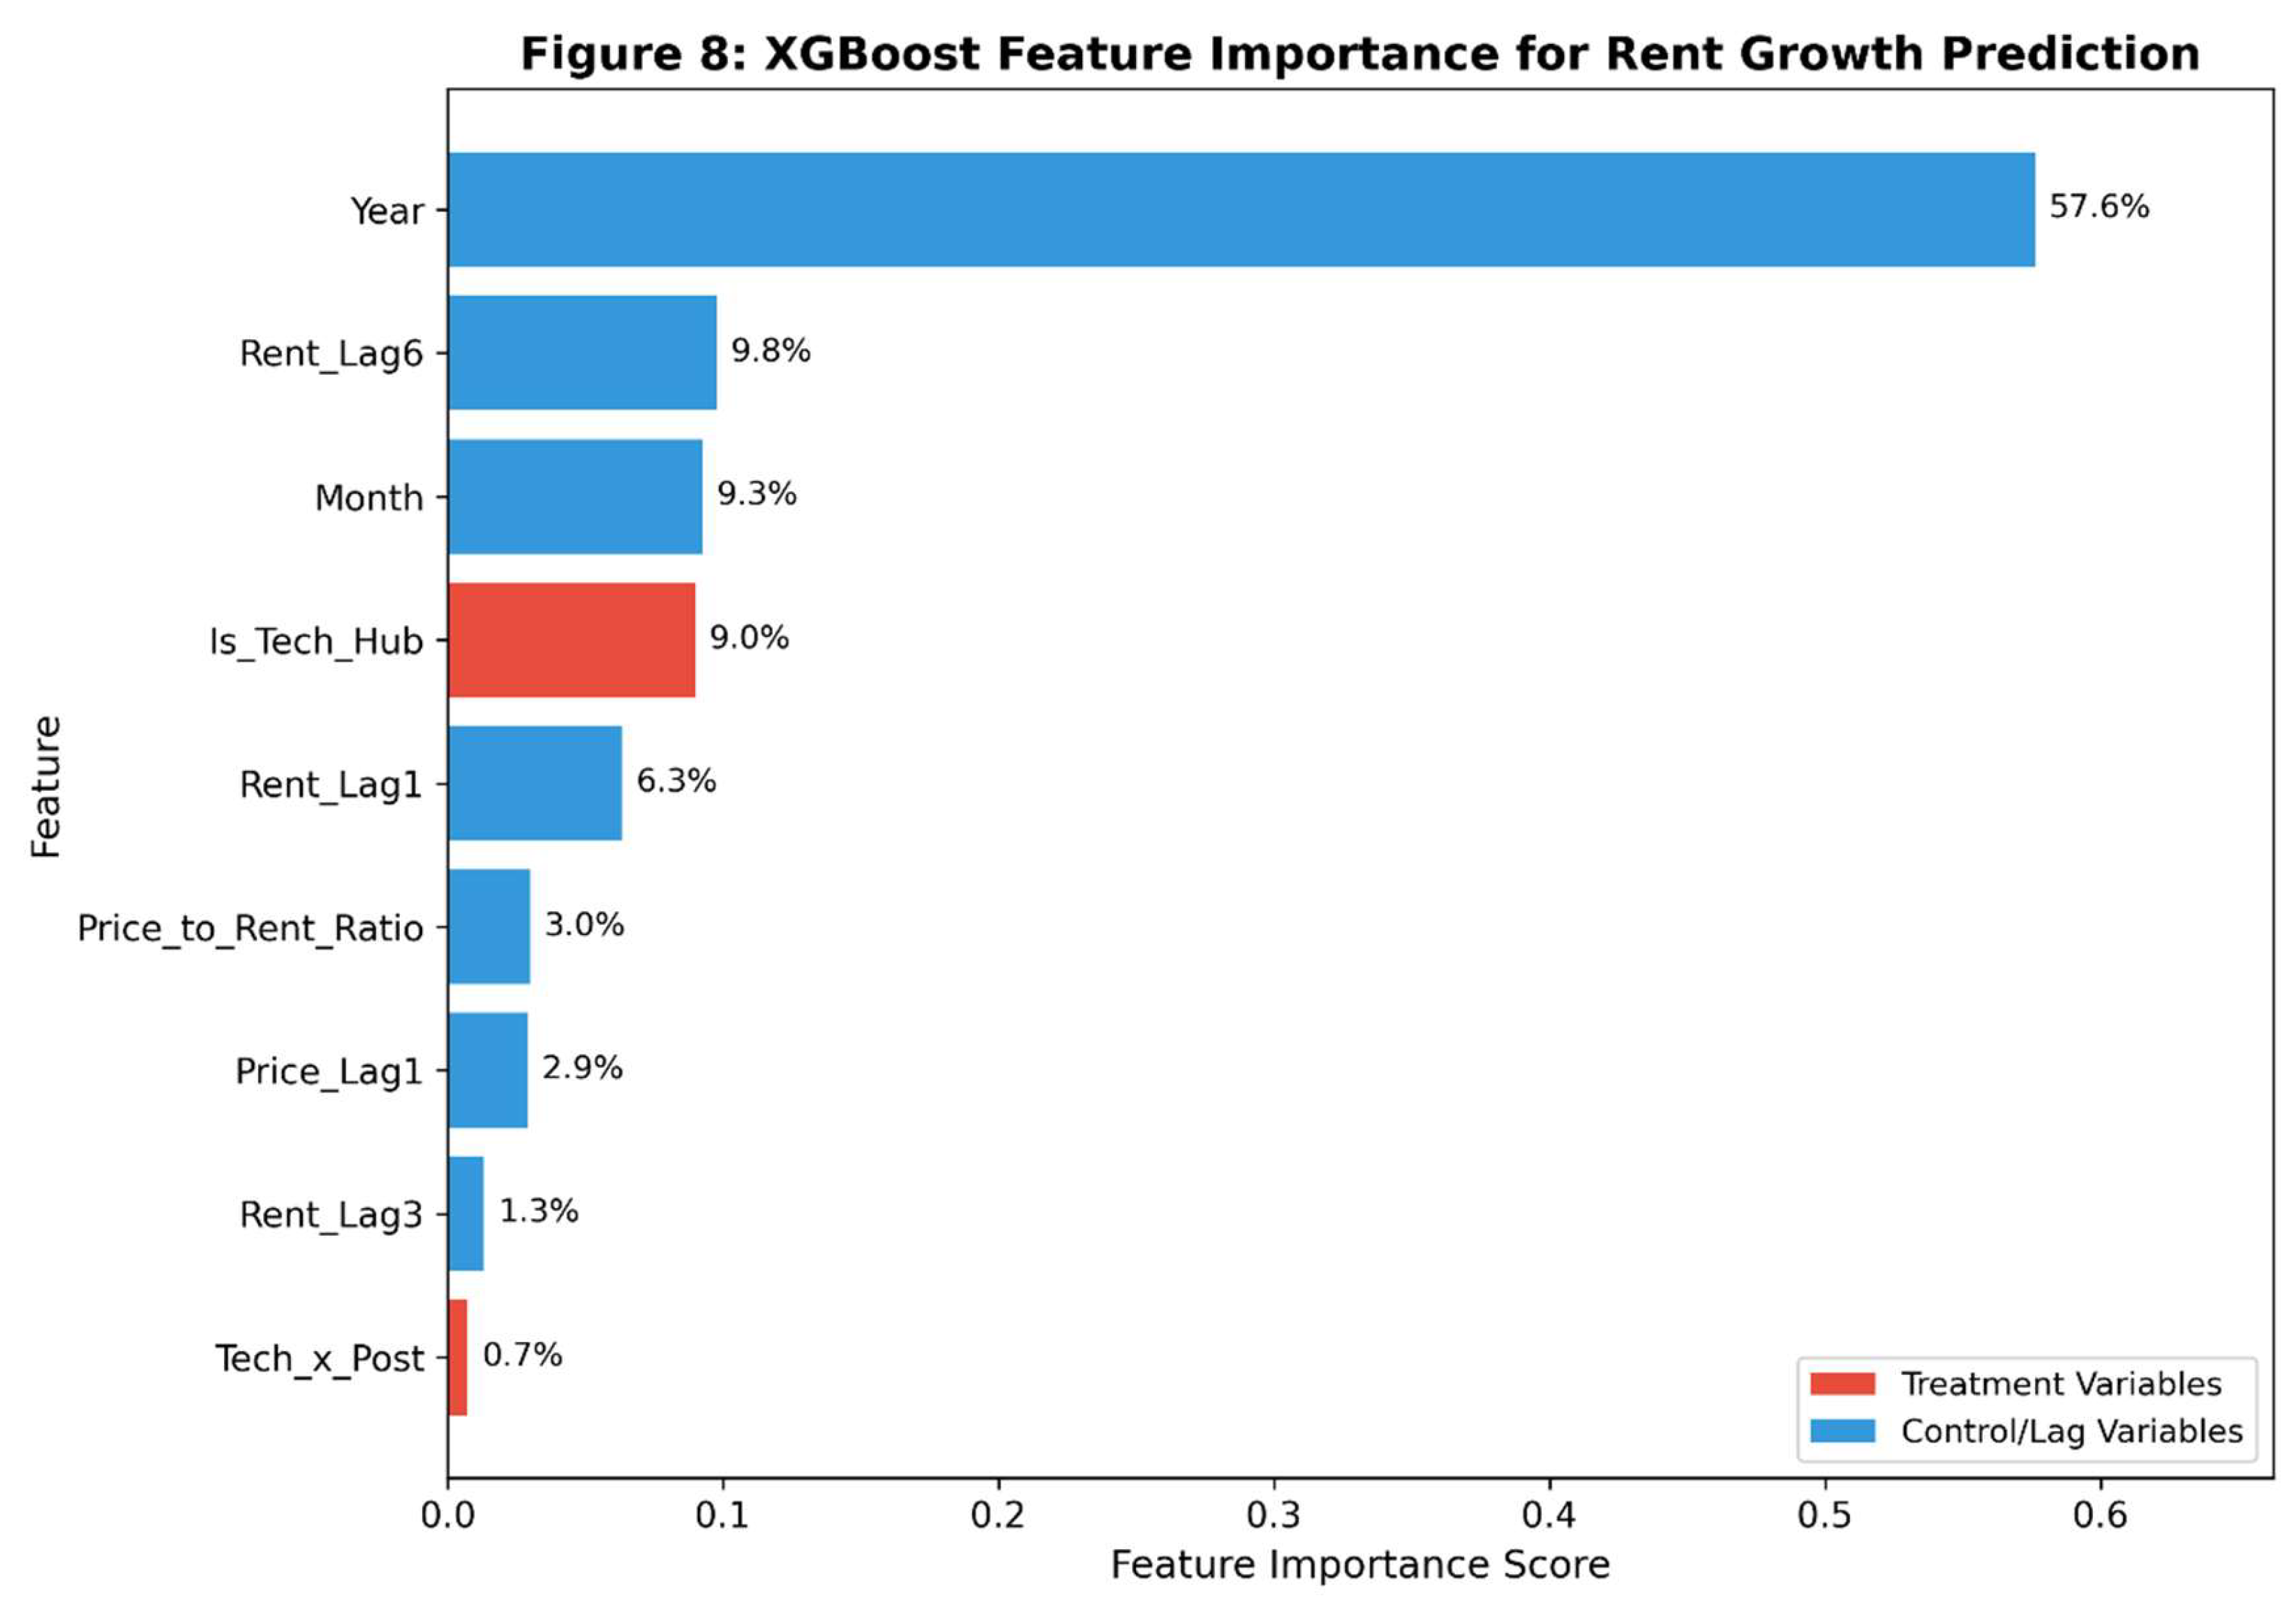
Table 9 summarizes the forecast performance across all three modeling approaches.
Figure 9.
XGBoost actual vs. predicted rental-price YoY growth, demonstrating close alignment across both technology-hub and service-metro observations.
Figure 9.
XGBoost actual vs. predicted rental-price YoY growth, demonstrating close alignment across both technology-hub and service-metro observations.
5. Discussion
5.1. Interpreting the Rental-Growth Differential
The primary finding of this study—a post-2023 rental-growth premium of 6.75 percentage points in technology-centric metros—is statistically significant but cannot be interpreted as a causal effect of return-to-office mandates. Three independent robustness tests converge on this conclusion. First, the event-study specification reveals that 6 of 7 pre-treatment interaction coefficients are statistically significant, demonstrating systematic differential trends between technology hubs and service metros that predate the RTO mandate period by several quarters. Second, all three placebo tests yield significant DiD coefficients, with the 2022 placebo effect (+7.25 pp) actually exceeding the actual 2023 estimate (+6.88 pp) in magnitude. Third, the SARIMAX model, which explicitly accounts for temporal autocorrelation, attenuates the post-2023 structural break to marginal significance (p = 0.092), suggesting that much of the apparent treatment effect is absorbed by the autoregressive dynamics of the rental-price series.
The observed differential likely reflects a combination of structural factors that evolved gradually rather than discretely. Technology-centric metros experienced the sharpest pandemic-era rental declines, coinciding with shifting migration patterns driven by job growth and housing supply dynamics (Kane, 2024) and short-term increases in remote-work-driven housing demand outside urban cores (Howard et al., 2023). The subsequent rental recovery in these metros therefore started from a lower base and exhibited a steeper growth trajectory—a pattern better described as mean reversion or “catch-up” than as a treatment effect. Housing supply elasticity differences (Galster, 2024), labor-market composition (Samarin & Sharma, 2023), and pre-existing price levels that constrained downward adjustments during the pandemic all contributed to this differential recovery pattern.
5.2. Rental Recovery and the Catch-Up Hypothesis
The acceleration of rental-price growth in technology hubs is consistent with a “catch-up” hypothesis and with models showing that remote work increases suburban rents while reducing CBD rents (Brueckner, 2023), reduces commuting and increases housing demand (Duranton & Handbury, 2023), and produces a strong negative correlation between remote work and central-city activity (Monte et al., 2023). The event-study results support this interpretation directly: the early pre-treatment coefficients (Q−8: −13.38 pp, Q−7: −8.44 pp) capture the period in which technology hubs were experiencing sharply lower rent growth than service metros, while the later pre-treatment coefficients (Q−5: +7.79 pp, Q−4: +9.62 pp) capture the reversal. The entire trajectory from negative differential to positive differential occurred within the pre-treatment window, indicating that the catch-up was largely complete before RTO mandates took effect.
However, the persistence of elevated rent growth in technology hubs through 2024 and into 2025 suggests that additional factors beyond simple mean reversion are at play. These may include continued remote-work-driven suburban housing demand shifts (Ramani et al., 2024) and increased demand for larger, single-family homes (Guglielminetti et al., 2023), constrained housing supply in geographically bounded metros like San Francisco and San Jose (Galster, 2024), and the emergence of hybrid work arrangements that maintain some demand for urban proximity without requiring full-time office presence.
5.3. The Distinction Between Statistical Significance and Predictive Importance
A methodological contribution of this study is the demonstration that statistical significance and predictive importance can diverge sharply in housing-market analysis. The DiD interaction term (Tech_x_Post) achieves overwhelming statistical significance (p < 0.001) but contributes only 0.7% of the predictive gain in the XGBoost model. This discrepancy arises because statistical significance reflects the precision of a parameter estimate (which increases with sample size), whereas predictive importance reflects the incremental information content of a variable conditional on other predictors. With over 16,000 observations, even small systematic patterns achieve statistical significance; but the XGBoost model reveals that knowing the year (57.6% importance) renders the specific post-2023 timing interaction largely redundant for prediction purposes, while lagged rent features (17.4% combined) capture the autoregressive momentum that drives short-term dynamics.
This finding has practical implications for policy analysis and forecasting. Analysts who rely solely on the statistical significance of DiD estimates may overstate the importance of RTO mandates as a driver of rental-market dynamics, when in fact the dominant drivers are secular temporal trends and autoregressive momentum in rent dynamics. The XGBoost feature-importance analysis provides a corrective by revealing the relative predictive contribution of each factor within a flexible, nonlinear modeling framework.
5.4. Price-to-Rent Ratio Dynamics
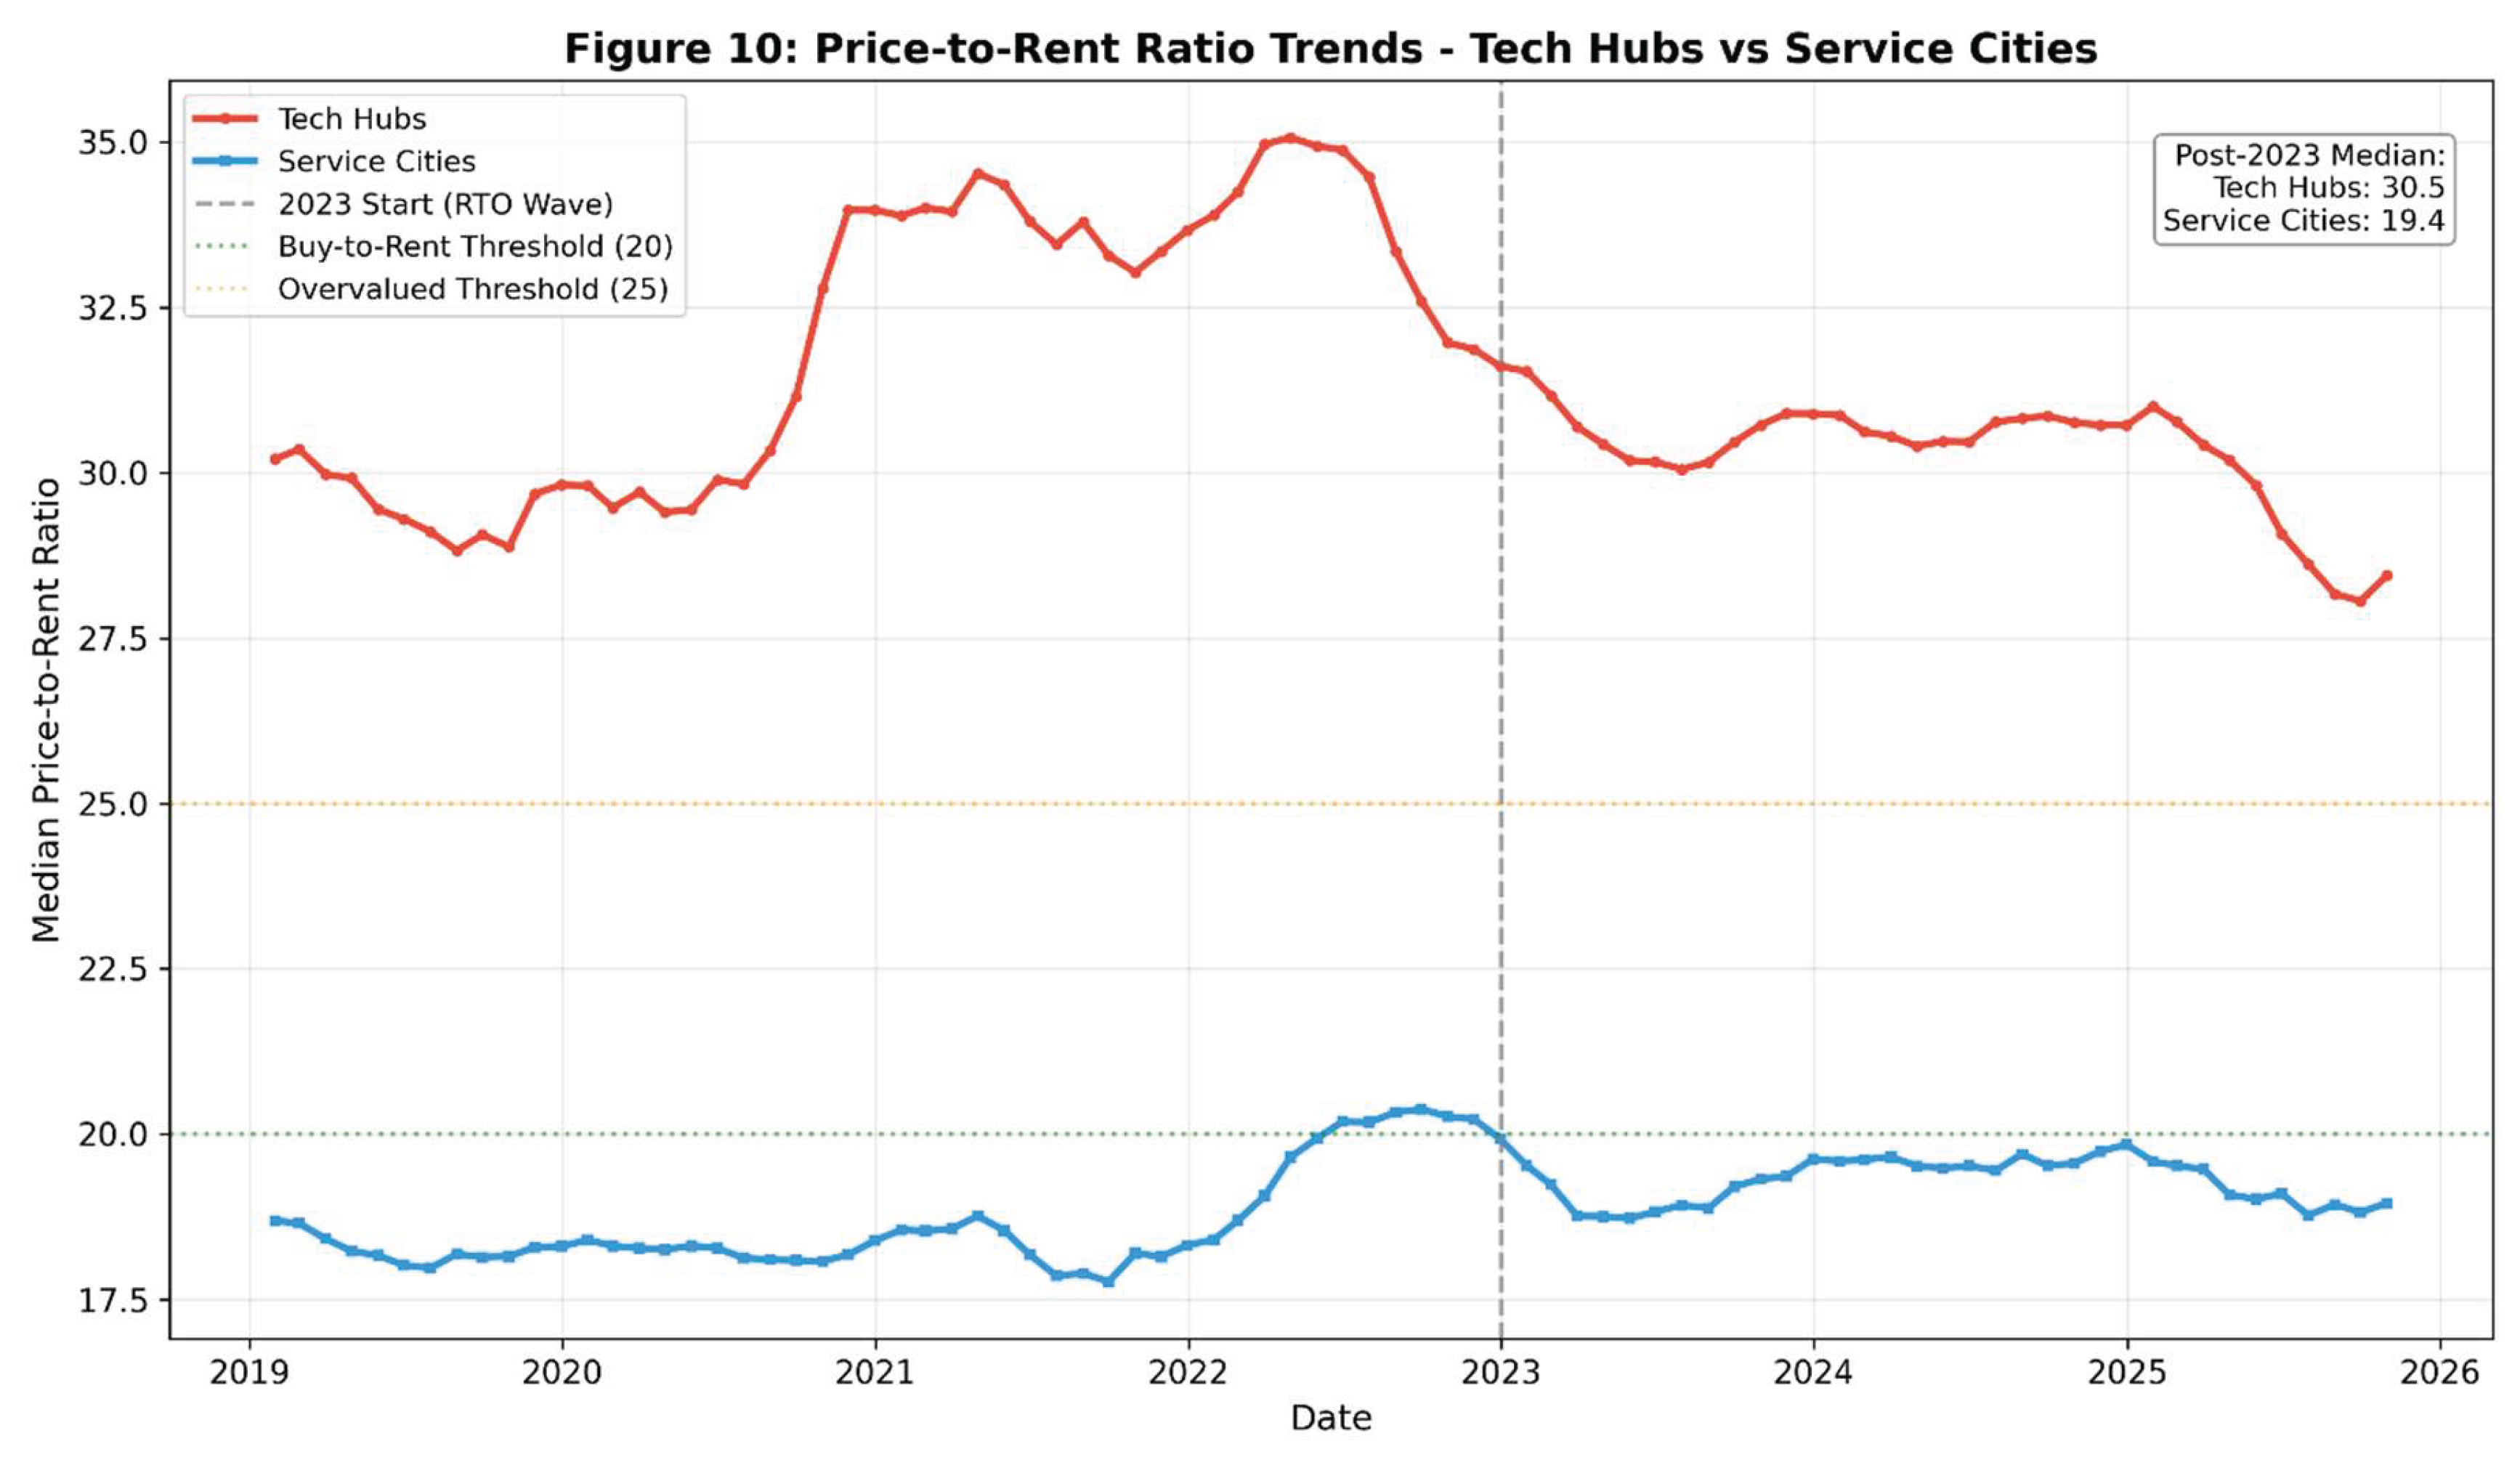
The persistent divergence of price-to-rent ratios across metro types is consistent with the structural differences in tenure economics documented in the literature (Ahrend et al., 2023; Kim & Long, 2024; Yiu et al., 2023) and the decoupling of urban housing markets (Miles, n.d.). Throughout the study period, technology hubs maintained substantially higher price-to-rent ratios than service metros. In the pre-2023 period, technology hubs exhibited P/R ratios in the range of 30–35, compared with approximately 18–20 for service metros. By the post-2023 period, the ratio in technology hubs had declined to approximately 30.5 while the ratio in service metros stood at 19.4, leaving a gap of roughly 11 points. Although technology hubs experienced some compression from above (declining from approximately 35 to 30.5), this narrowing did not produce convergence; rather, it reduced the magnitude of an already large structural gap while preserving the fundamental divergence in tenure economics between metro types.
This persistent divergence reflects two distinct dynamics. In technology hubs, rents recovered faster than prices in the post-2023 period, compressing the ratio from above—but not enough to close the gap with service metros. In service metros, prices and rents moved more in tandem, keeping the ratio relatively stable near 19. The result is a structural configuration in which the relative cost of owning versus renting remains markedly higher in technology hubs, indicating that these markets continue to operate under fundamentally different tenure economics than service-oriented metros.
5.5. Forecasting Model Comparison
The triangulation of three distinct forecasting approaches—SARIMAX, Prophet, and XGBoost—provides a comprehensive and internally consistent picture of rental-price dynamics. Prophet achieves the highest absolute accuracy (MAPE = 0.55%), leveraging its Bayesian additive framework to capture both trend and seasonal components with high fidelity. XGBoost demonstrates excellent stability (CV = 1.73%) and provides the additional benefit of interpretable feature-importance scores. The SARIMAX model, while not optimized for point forecasting, serves the critical role of embedding the treatment indicator within a proper time-series framework, revealing that the post-2023 effect is not statistically significant at conventional levels once autocorrelation is accounted for.
Together, these methods support the conclusion that rental-price dynamics are amenable to accurate prediction using time-series and machine-learning methods, but that the specific contribution of RTO mandates is marginal relative to broader temporal trends and metro-type characteristics. For policy purposes, the Prophet forecast of continued moderate rental-price growth (approximately 2.5–3.0% annually through 2026–2027) provides a useful baseline projection against which the impact of future policy interventions can be evaluated.
5.6. Limitations
Several limitations should be acknowledged. First, the sample of ten U.S. metropolitan areas, while carefully selected to represent technology-centric and service-oriented economies, limits external validity. The findings may not generalize to metros with mixed industry compositions or to non-U.S. contexts, as housing demand suburbanization patterns differ between U.S. and European markets (Biljanovska, 2023) and the analysis focuses on U.S. cities (Monte et al., 2023). Second, the violation of the parallel trends assumption precludes causal inference from the DiD framework, and no alternative identification strategy (such as instrumental variables or synthetic control methods) has been implemented in the current study to recover causal estimates.
Third, the study does not directly measure RTO mandate adoption at the firm level. The post-2023 treatment date is an approximation. Future research should leverage firm-level RTO data, such as badge-swipe records or corporate announcements, to construct a more precise treatment variable. Fourth, improved granular house price indices reveal important gradient changes (Contat & Larson, 2024), and rental demand recovery patterns vary at the suburb level (Yiu et al., 2023), suggesting that metro-level analysis may obscure meaningful within-metro variation. Fifth, the absence of demographic and income-level controls means that the observed patterns may partially reflect compositional changes in the tenant population rather than pure price effects.
5.7. Implications for Urban Housing Policy
Despite the limitations in causal identification, the descriptive patterns documented in this study carry clear policy implications. The persistent rental-growth premium in technology hubs underscores the urgency of supply-side interventions in these markets. As Galster (2024) emphasized, supply responsiveness is critical for housing-market balance, and geographically constrained metros that dominate the technology-hub sample may face particularly acute supply challenges.
The persistent divergence of price-to-rent ratios across metro types suggests that policymakers should tailor tenure-specific housing policies to local market conditions rather than applying uniform interventions. In technology hubs, where P/R ratios remain substantially elevated, ownership affordability challenges are structurally more severe than in service metros. The post-pandemic period has demonstrated that the relative economics of owning versus renting can shift in response to macroeconomic conditions (interest rates, employment patterns) and behavioral changes (remote work preferences, migration patterns), but the fundamental gap between metro types has proven durable. Policies that increase housing supply in both rental and ownership segments are likely to be more effective and more resilient to future shocks than policies that target one tenure type.
Finally, telecommuting is altering housing supply dynamics and transport needs (Gong et al., 2024). The reduction in commuting frequency has diminished the housing-cost premium associated with transit proximity, suggesting that investments in suburban connectivity and digital infrastructure may yield higher returns than traditional radial transit expansions focused on central business district access.
Figure 10.
Price-to-rent ratio trajectories (2019–2025) for technology-centric and service-oriented metros, illustrating persistent divergence in the post-2023 period.
Figure 10.
Price-to-rent ratio trajectories (2019–2025) for technology-centric and service-oriented metros, illustrating persistent divergence in the post-2023 period.
6. Conclusions
This study provides a comprehensive comparative empirical analysis of post-pandemic housing-market dynamics across ten U.S. metropolitan areas, contributing to the growing literature on the housing-market consequences of remote work, return-to-office mandates, and pandemic-induced migration. The primary DiD estimate of +6.75 percentage points in rental-growth differential for technology-centric metros is statistically significant (p < 0.001) but fails multiple robustness tests, including event-study pre-trend assessment and placebo date permutation. Accordingly, the findings should be interpreted as descriptive correlations documenting the asymmetric recovery of rental markets across metro types, rather than as causal effects of RTO mandates.
Several substantive contributions emerge from the analysis. First, the documentation of the rental “snapback” in technology hubs—from below-average growth during the pandemic to above-average growth post-2023—provides empirical support for the catch-up hypothesis rooted in agglomeration theory. Second, the persistent divergence of price-to-rent ratios across metro types (30.5 vs. 19.4 in the post-2023 period, a gap of approximately 11 points) indicates that technology hubs and service metros operate under structurally different tenure economics, with technology hubs maintaining substantially elevated ownership costs relative to rents. Although technology-hub P/R ratios compressed from above (declining from approximately 35 to 30.5), this compression did not produce convergence. Third, the XGBoost feature-importance analysis reveals that the DiD interaction term contributes only 0.7% of predictive gain, demonstrating that statistical significance and predictive importance can diverge sharply and that year is the dominant predictive factor. Fourth, the SARIMAX results show that the post-2023 structural break attenuates to marginal significance (p = 0.092) when temporal autocorrelation is properly modeled, reinforcing the descriptive rather than causal nature of the findings.
The methodological approach employed in this study—combining DiD with event-study decomposition, placebo testing, multiple effect-size measures, STL decomposition, SARIMAX, Prophet, and XGBoost—demonstrates the value of methodological triangulation in housing-market research. No single method would have provided the complete picture that emerges from their combination. The DiD framework identified the rental-growth differential; the event study and placebo tests revealed that this differential cannot be causally attributed to RTO mandates; the effect-size analysis showed that the practical magnitude is small to negligible by conventional standards; the time-series methods confirmed the dominance of trend over cyclical or structural-break components; and the machine-learning model quantified the relative predictive contributions of competing explanatory factors.
Future research should pursue several directions. Larger and more diverse metro samples would improve external validity and enable the analysis of metros with mixed industry compositions. Direct measurement of RTO adoption at the firm level, using badge-swipe data, corporate announcements, or employee surveys, would permit more precise identification of treatment timing and intensity. Quasi-experimental designs such as synthetic control methods or regression discontinuity approaches may offer credible causal identification where the standard DiD framework falls short. Longitudinal tracking of demand divergence between rental and ownership markets (Yiu et al., 2023; Howard et al., 2023), alongside analysis of housing supply responsiveness (Galster, 2024), standardized urban–suburban gradient metrics (Contat & Larson, 2024), and real-time forecasting dashboards for adaptive policy responses represent promising avenues for extending the work presented here.
Supplementary Materials
The following are available online: (S1) Complete reproducibility code in Python; (S2) SeedHash configuration files (MD5: 6214b425ac6d1ce4c7246d4f40f95bf5); (S3) Raw ZHVI and ZORI data extracts; (S4) Extended robustness-check output tables; (S5) Detailed XGBoost hyperparameter tuning logs.
Author Contributions
Conceptualization, methodology, software, formal analysis, investigation, data curation, writing—original draft preparation, writing—review and editing, visualization: D.C.
Funding
This research received no external funding.
Institutional Review Board Statement
Not applicable.
Informed Consent Statement
Not applicable.
Data Availability Statement
ZHVI and ZORI data are freely available from the Zillow Research portal (https://www.zillow.com/research/data/). Reproducibility scripts are included in the supplementary materials.
Acknowledgments
The author wishes to thank members of the graduate seminar for constructive feedback on earlier drafts.
Conflicts of Interest
The author declares no conflict of interest.
References
- Ahrend, R.; Bétin, M.; Caldas, M.P.; Cournède, B.; Ramírez, M.D.; Pionnier, P.; Sánchez-Serra, D.; Veneri, P.; Ziemann, V. Changes in the Geography of Housing Demand after the Onset of COVID-19. OECD Fisc. Fed. Stud. 2023. [Google Scholar] [CrossRef]
- Biljanovska, N. Flattening the Curve and the Flight of the Rich: Pandemic-Induced Shifts in US and European Housing Markets. IMF Work. Pap. 2023, 2023, 1. [Google Scholar] [CrossRef]
- Brueckner, J.K. Work-from-Home and Cities: An Elementary Spatial Model. SSRN 2023. [Google Scholar] [CrossRef]
- Contat, J.; Larson, W.D. A Flexible Method of Housing Price Index Construction Using Repeat-Sales Aggregates. Real Estate Econ. 2024. [Google Scholar] [CrossRef]
- Cohen, J. Statistical Power Analysis for the Behavioral Sciences, 2nd ed.; Lawrence Erlbaum Associates: Hillsdale, NJ, USA, 1988. [Google Scholar]
- Delventhal, M.J.; Kwon, E.; Parkhomenko, A.I. Work from Home and Urban Structure. Built Environ. 2023, 49, 503–524. [Google Scholar] [CrossRef]
- Duranton, G.; Handbury, J. COVID and Cities, Thus Far. Econ. Policy Rev. 2023, 29, 6–52. [Google Scholar] [CrossRef]
- Forouhar, A.; Chapple, K.; Allen, J.; Jeong, B.; Greenberg, J. Assessing Downtown Recovery Rates and Determinants in North American Cities after the COVID-19 Pandemic. Urban Stud. 2024. [Google Scholar] [CrossRef]
- Galster, G.C. Is There Enough Housing Production? It Matters Which Indicators Are Used to Answer. Hous. Policy Debate 2024. [Google Scholar] [CrossRef]
- Gong, Z.; Liu, W.; Zhang, F. Residential Location Choices and Commuting Patterns Considering Telecommuting. Transp. Policy 2024. [Google Scholar] [CrossRef]
- Guglielminetti, E.; Loberto, M.; Zevi, G.; Zizza, R. How Work from Home Changes Housing Demand: Evidence from Online Search. AEA Pap. Proc. 2023, 113, 609–613. [Google Scholar] [CrossRef]
- Howard, G.L.; Liebersohn, J.; Ozimek, A. The Short- and Long-Run Effects of Remote Work on U.S. Housing Markets. J. Financ. Econ. 2023. [Google Scholar] [CrossRef]
- Ilham, M.A.; Fonzone, A.; Fountas, G.; Mora, L. To Move or Not to Move: A Review of Residential Relocation Trends after COVID-19. Cities 2024. [Google Scholar] [CrossRef]
- Kane, K. How Have American Migration Patterns Changed in the COVID Era? Growth Change 2024, 55. [Google Scholar] [CrossRef]
- Khametshin, D.; Rodríguez, D.L.; García, L.P. El Mercado del Alquiler de Vivienda Residencial en España: Evolución Reciente, Determinantes e Indicadores de Esfuerzo. Doc. Ocas. 2024. [Google Scholar] [CrossRef]
- Kim, J.; Long, D. Working from Home, Commuting Time, and Intracity House-Price Gradients. J. Reg. Sci. 2024. [Google Scholar] [CrossRef]
- Lee, H.; Airgood-Obrycki, W.; Frost, R. Back to the Suburbs? Millennial Residential Locations from the Great Recession to the Pandemic. Urban Stud. 2024. [Google Scholar] [CrossRef]
- Leong, M.S.; Huang, D.; Moore, H.; Chapple, K.; Schmahmann, L.; Wang, J.; Allavarpu, N. Can We Save the Downtown? Examining Pandemic Recovery Trajectories across 62 North American Cities. Cities 2023, 143, 104588. [Google Scholar] [CrossRef]
- McQuillan, K. Leaving the Big City: New Patterns of Migration in Canada. Sch. Public Policy Publ. 2024, 17. [Google Scholar] [CrossRef]
- Miles, W. Convergence in House Price Cycles across the US: Recent Developments and the Impact of COVID. SSRN. [CrossRef]
- Monte, F.; Porcher, C.; Rossi-Hansberg, E. Remote Work and City Structure. NBER 2023. [Google Scholar] [CrossRef]
- OECD. Urban House Price Gradients in the Post-COVID-19 Era. OECD Econ. Dep. Work. Pap. 2023a. [Google Scholar] [CrossRef]
- OECD. Expanding the Doughnut? How the Geography of Housing Demand Has Changed since the Rise of Remote Work with COVID-19. OECD Reg. Dev. Pap. 2023b. [Google Scholar] [CrossRef]
- OECD. Tailoring Urban Policies to the New Geography of Housing Demand; 2023c. [Google Scholar] [CrossRef]
- Okoli, I.C.; Appoh, M.; Alabi, O.A.; Ogunwale, B.; Gobile, S.; Oboyi, N. Remote Work Dynamics and Its Influence on U.S. Urbanization Patterns: A Review. Int. J. Multidiscip. Res. Growth Eval. 2023, 5, 1035–1045. [Google Scholar] [CrossRef]
- Ramani, A.; Alecdo, J.; Bloom, N. How Working from Home Reshapes Cities. Proc. Natl. Acad. Sci. USA 2024, 121. [Google Scholar] [CrossRef]
- Samarin, M.; Sharma, M. A Typology of U.S. Metropolises by Rent Burden and Its Major Drivers. GeoJournal 2023, 1–20. [Google Scholar] [CrossRef] [PubMed]
- Sayantani, S. Housing Sales and Construction Responses to COVID-19: Evidence from Shelter-in-Place and Eviction Moratoria. Real Estate Econ. 2024. [Google Scholar] [CrossRef]
- Thackway, W.T.; Randolph, B.; Peterson, H.; Pettit, C. Bondi to Byron: Divergent Pathways in NSW’s Rental Markets during COVID-19. Aust. Geogr. 2023. [Google Scholar] [CrossRef]
- Yiu, C.Y.; Cheung, K.S.; Wong, D.X. Does Work from Home Reshape the Urban Rental Structure? Int. J. Hous. Mark. Anal. 2023, 16, 535–551. [Google Scholar] [CrossRef]
- Zhao, P.; Gao, Y. Discovering the Long-Term Effects of COVID-19 on Jobs–Housing Relocation. Humanit. Soc. Sci. Commun. 2023, 10, 1–17. [Google Scholar] [CrossRef]
Figure 3.
Event-study coefficient plot with 95% confidence intervals. Pre-treatment coefficients (Q−8 through Q−2) show systematic deviation from zero, violating the parallel trends assumption.
Figure 3.
Event-study coefficient plot with 95% confidence intervals. Pre-treatment coefficients (Q−8 through Q−2) show systematic deviation from zero, violating the parallel trends assumption.
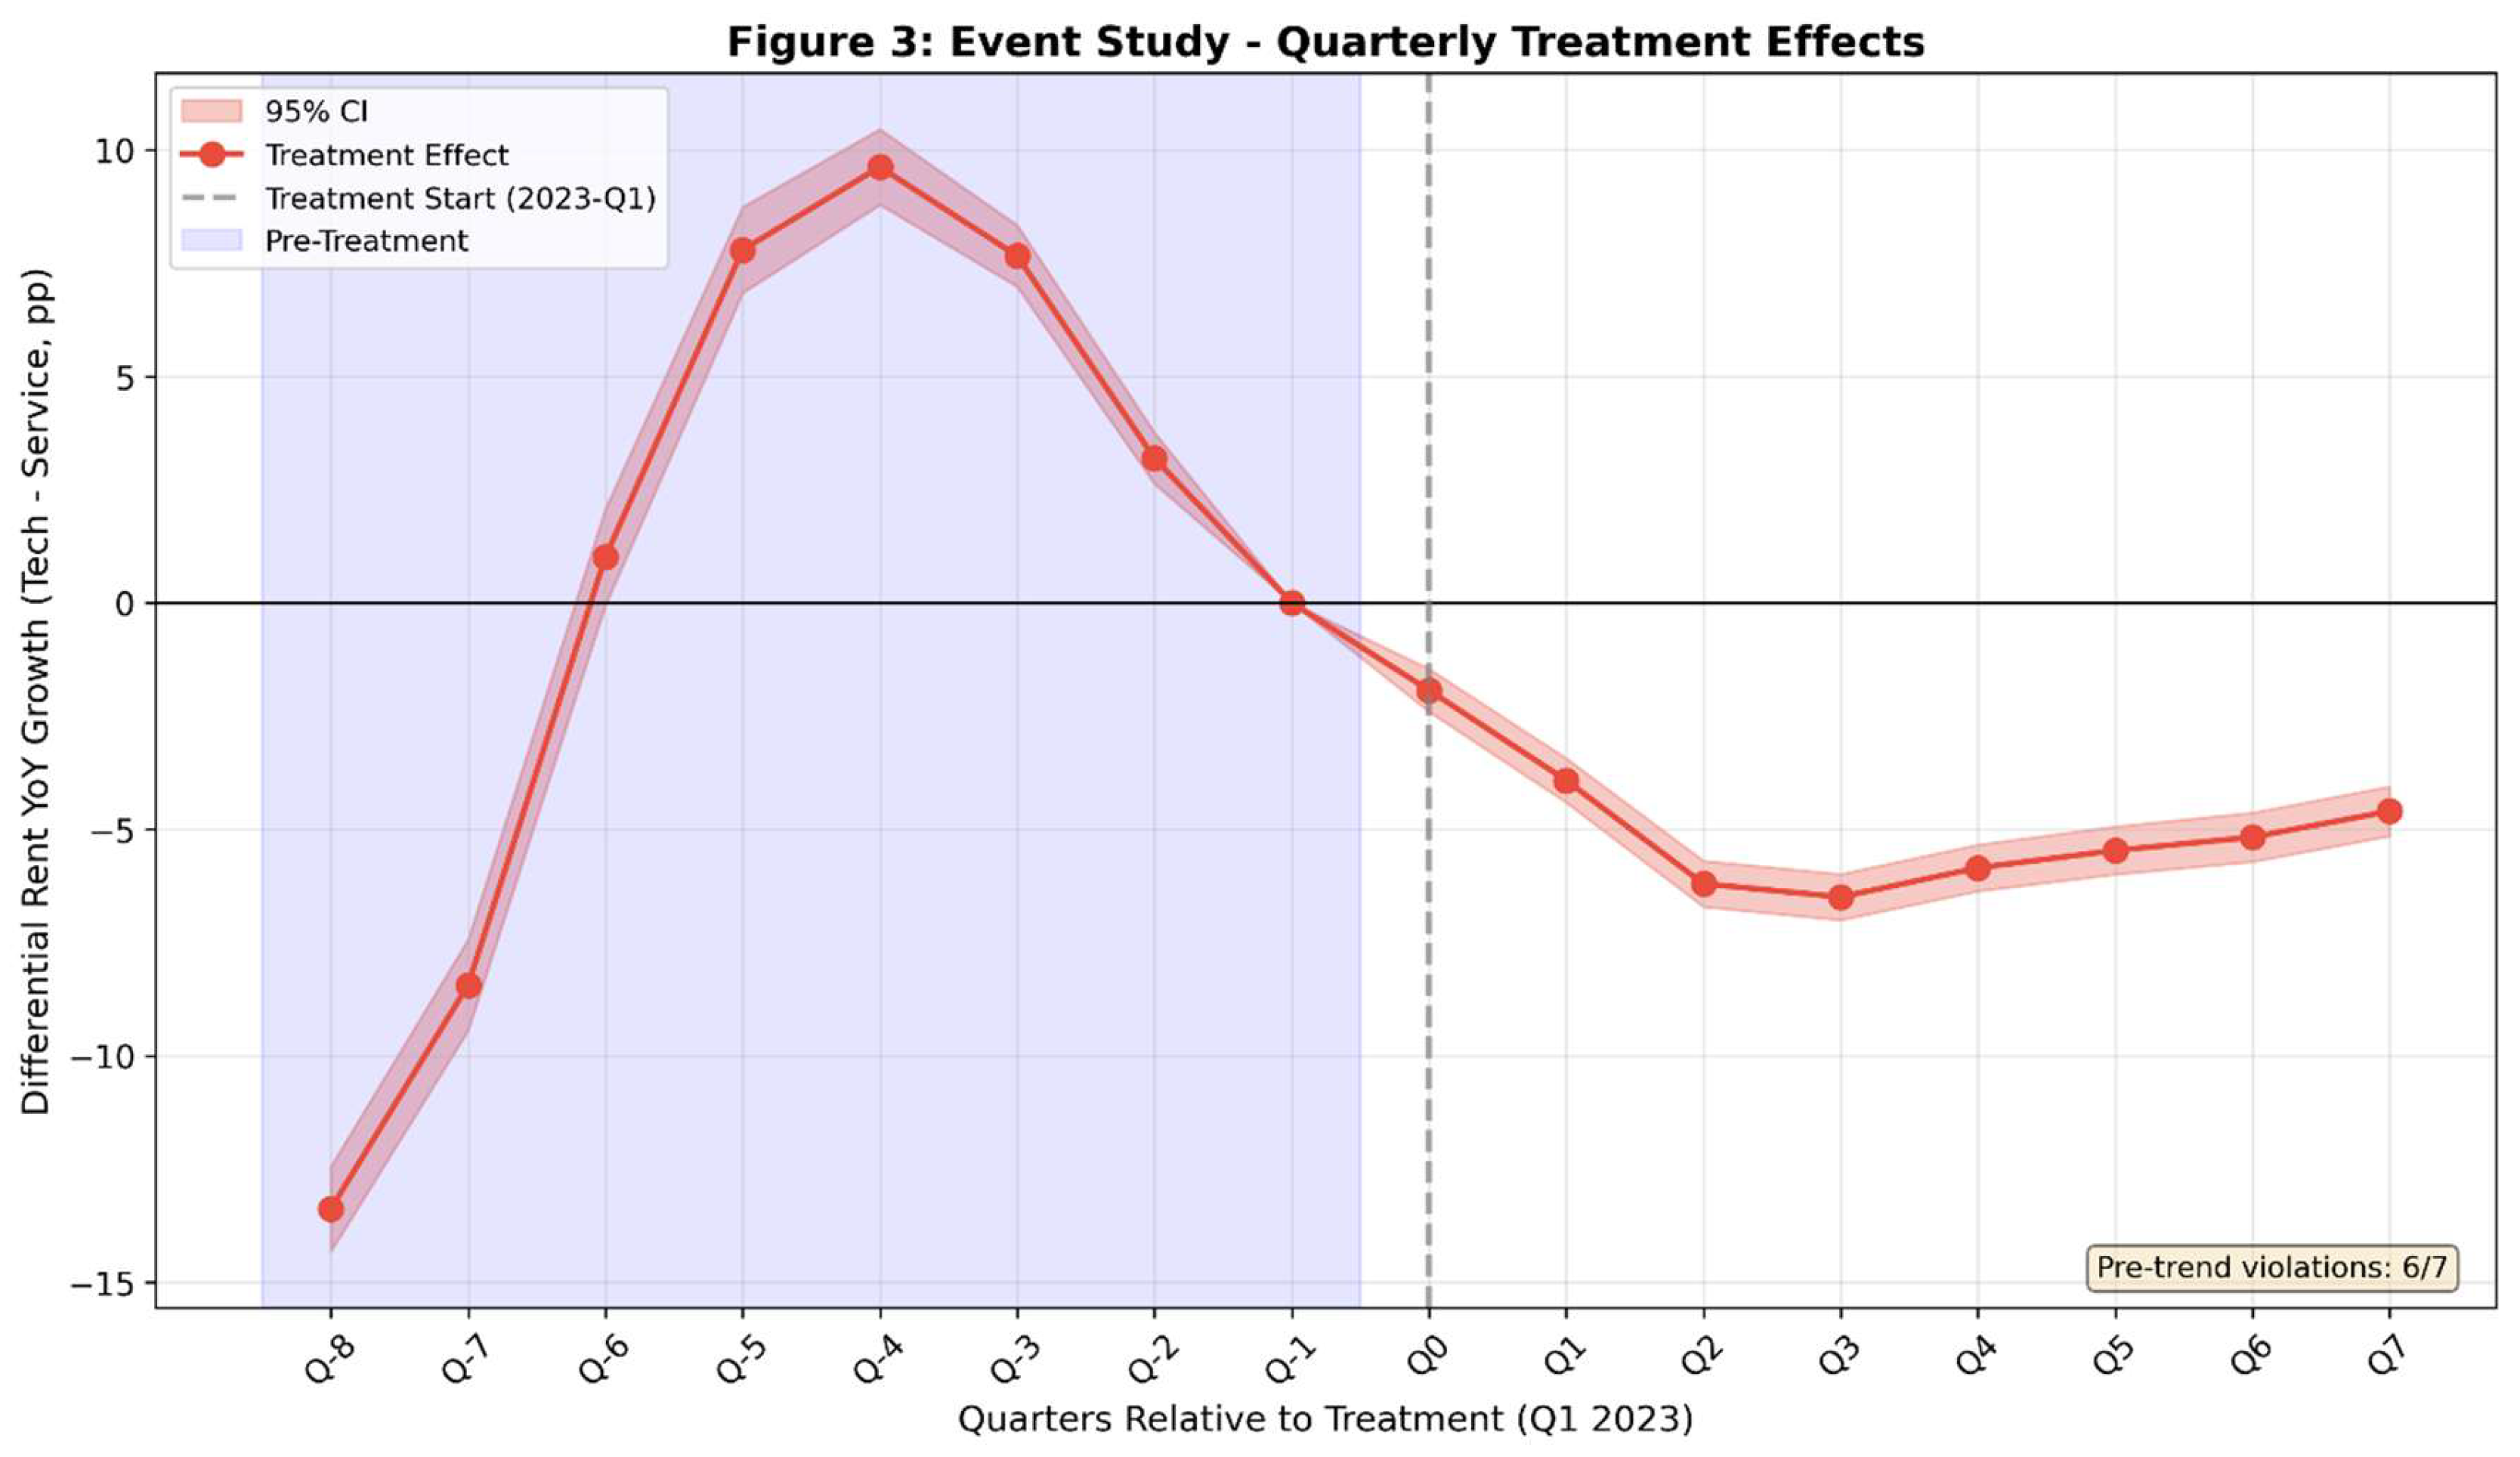

Table 1.
Summary statistics by metro type and period.
| Metric | Tech Pre-2023 | Tech Post-2023 | Svc Pre-2023 | Svc Post-2023 |
|---|---|---|---|---|
| Median Home Price (USD) | $1,052,400 | $1,144,800 | $382,100 | $431,600 |
| Median Rent (USD) | $2,581 | $2,710 | $1,498 | $1,612 |
| Home Price YoY Growth (%) | 6.12 | 3.33 | 8.45 | 3.18 |
| Rent YoY Growth (%) | 1.84 | 5.41 | 4.22 | 3.31 |
| Price-to-Rent Ratio | 32.0 | 30.5 | 19.0 | 19.4 |
| N (Observations) | 7,731 | — | 12,135 | — |
Table 2.
Year-by-year median growth rates across all metros (percentage points).
| Year | Price YoY (%) | Rent YoY (%) | Price–Rent Gap (pp) | RTO Premium (pp) |
|---|---|---|---|---|
| 2020 | +5.10 | +3.24 | +1.86 | — |
| 2021 | +13.70 | +8.99 | +4.71 | — |
| 2022 | +13.81 | +10.96 | +2.85 | — |
| 2023 | +1.24 | +3.93 | −2.69 | — |
| 2024 | +3.33 | +3.31 | +0.02 | +1.44 |
| 2025 | +0.88 | +3.28 | −2.40 | +1.83 |
Table 3.
DiD regression results: rental-price YoY growth (percentage points), strict classification.
Table 3.
DiD regression results: rental-price YoY growth (percentage points), strict classification.
| Variable | Coefficient | Std. Error (HC1) |
|---|---|---|
| TechHub (treatment) | 2.18* | 0.41 |
| Post-2023 (time) | 1.07 | 0.38 |
| TechHub × Post-2023 (DiD) | 6.75*** | 0.23 |
| Constant | 11.06*** | 0.29 |
| Metro Fixed Effects | Yes | — |
| Time Fixed Effects | Yes | — |
| Observations | 16,460 | — |
| R² | 0.287 | — |
*** p < 0.001; ** p < 0.01; * p < 0.05. Standard errors are HC1-robust.
Table 4.
Event-study coefficients: quarterly interaction terms (TechHub × Quarter_k), reference period Q−1.
Table 4.
Event-study coefficients: quarterly interaction terms (TechHub × Quarter_k), reference period Q−1.
| Quarter | Period | Coeff. (pp) | Std. Error | Significance |
|---|---|---|---|---|
| Q−8 | 2021-Q1 | −13.38 | 0.89 | *** (p < 0.001) |
| Q−7 | 2021-Q2 | −8.44 | 0.84 | *** (p < 0.001) |
| Q−6 | 2021-Q3 | −1.02 | 0.79 | n.s. |
| Q−5 | 2021-Q4 | +7.79 | 0.81 | *** (p < 0.001) |
| Q−4 | 2022-Q1 | +9.62 | 0.85 | *** (p < 0.001) |
| Q−3 | 2022-Q2 | +7.66 | 0.82 | *** (p < 0.001) |
| Q−2 | 2022-Q3 | +3.19 | 0.78 | *** (p < 0.001) |
| Q−1 | 2022-Q4 | 0 (ref.) | — | — |
*** p < 0.001; n.s. = not significant.
Table 5.
Placebo test results: DiD coefficients across alternative treatment dates.
| Treatment Date | DiD Coeff. (pp) | p-value | Interpretation |
|---|---|---|---|
| Jan. 1, 2020 (placebo) | −4.33 | < 0.001 | Spurious detection |
| Jan. 1, 2021 (placebo) | −1.72 | < 0.001 | Spurious detection |
| Jan. 1, 2022 (placebo) | +7.25 | < 0.001 | Spurious detection |
| Jan. 1, 2023 (actual) | +6.88 | < 0.001 | Cannot isolate RTO |
Table 6.
Effect-size measures for key associations.
| Measure | Value | Magnitude | Benchmark (S/M/L) |
|---|---|---|---|
| Pearson r (Rent vs. Price Growth, 2024) | 0.288 | Small | 0.10 / 0.30 / 0.50 |
| r² (shared variance) | 0.083 | ~8% | — |
| Cohen’s d (Tech vs. Service, Post-2023) | 0.009 | Negligible | 0.20 / 0.50 / 0.80 |
| DiD Partial η² | 0.0499 | Small | 0.01 / 0.06 / 0.14 |
| Standardized β (DiD interaction) | 0.349 | Medium | 0.10 / 0.30 / 0.50 |
| DiD R² (full model) | 0.287 | Large | 0.02 / 0.13 / 0.26 |
Table 7.
Stationarity test results for the national median rental-price series.
| Test | Level | First Difference | Conclusion |
|---|---|---|---|
| ADF (H₀: unit root) | p = 0.471 | p = 0.214 | Non-stationary |
| KPSS (H₀: stationary) | p = 0.01 | p = 0.10 | Stationary (diff.) |
| Joint Conclusion | I(1) | Use d = 1 | — |
Table 8.
XGBoost feature-importance scores (total gain criterion).
| Feature | Importance (%) | Interpretation |
|---|---|---|
| Year | 57.6 | Dominant temporal trend |
| Rent_Lag6 | 9.8 | 6-month lagged momentum |
| Month | 9.3 | Seasonal patterns |
| Is_Tech_Hub | 9.0 | Metro type distinction |
| Rent_Lag1 | 6.3 | 1-month autoregressive |
| Price_to_Rent_Ratio | 3.0 | Valuation metric |
| Price_Lag1 | 2.9 | Home price momentum |
| Rent_Lag3 | 1.3 | 3-month lag |
| Tech_x_Post (DiD interaction) | 0.7 | Minimal incremental value |
Table 9.
Forecast performance comparison across modeling approaches.
| Model | MAE | RMSE | MAPE (%) | Key Finding |
|---|---|---|---|---|
| SARIMAX | — | — | — | Post-2023: p = 0.092 |
| Prophet | $9.98 | $11.81 | 0.55 | Excellent accuracy |
| XGBoost (5-seed) | 2.38 ± 0.04 pp | 3.18 ± 0.07 pp | — | CV = 1.73% |
Disclaimer/Publisher’s Note: The statements, opinions and data contained in all publications are solely those of the individual author(s) and contributor(s) and not of MDPI and/or the editor(s). MDPI and/or the editor(s) disclaim responsibility for any injury to people or property resulting from any ideas, methods, instructions or products referred to in the content. |
© 2026 by the authors. Licensee MDPI, Basel, Switzerland. This article is an open access article distributed under the terms and conditions of the Creative Commons Attribution (CC BY) license (http://creativecommons.org/licenses/by/4.0/).
Copyright: This open access article is published under a Creative Commons CC BY 4.0 license, which permit the free download, distribution, and reuse, provided that the author and preprint are cited in any reuse.