
Submitted:
26 January 2026
Posted:
27 January 2026
You are already at the latest version
Abstract
As oil and gas development increasingly targets low and ultra-low permeability reservoirs, conventional recovery techniques often prove insufficient for mobilizing residual oil. Surfactant flooding, a key chemical enhanced oil recovery (EOR) technology, thus requires careful system optimization and mechanistic investigation. This study focuses on low-permeability reservoirs in the Changqing Oilfield, evaluating three surfactant systems—YHS-Z1 (a 7:3 mass ratio blend of hydroxypropyl sulfobetaine and cocamide, YHS-Z2 (a polyether carboxylate, a nonionic-anionic composite) and a middle-phase microemulsion system (Heavy alkylbenzene sulfonate and hydroxysulfobetaine were combined with a mass ratio of 7:3)—through a series of experiments including interfacial tension measurement, contact angle analysis, static and dynamic oil displacement tests, as well as emulsion transport/retention index assessments, to comprehensively characterize their oil displacement properties. Based on the experimental data, five machine learning models—Linear Regression, Support Vector Regression, XGBoost, Gradient Boosting Regression, and Random Forest—were constructed and comparatively analyzed for their predictive performance. The results demonstrate that the Random Forest (RF) model achieved the optimal prediction performance (MAE = 2.8007%, MAPE = 7.4107%, R² = 0.0454). Further analysis using the SHAP algorithm revealed that the retention index is the primary global factor (accounting for 49.79% of the variance), while significant intergroup differences exist in the primary factors across different surfactant systems. Concurrently, single-factor and multi-factor sensitivity analyses were conducted to elucidate synergistic effects and threshold behaviors among parameters. The optimal parameter combination, identified via a random search method, achieved a predicted recovery ratio of 45.61%, representing a 6.57% improvement over the highest experimental value. This study demonstrates that machine learning methods can effectively identify the dominant factors in oil displacement and enable synergistic parameter optimization, thereby providing a theoretical foundation for the efficient development of surfactant flooding in low-permeability reservoirs.
Keywords:
low permeability reservoir
; surfactant flooding
; random forest algorithm
; main controlling factors
1. Introduction
Low-permeability tight oil reservoirs represent a critical component of global unconventional oil and gas resources, and their cost-effective development is of great significance for ensuring energy security.According to International Energy Agency statistics, the global recoverable resources of low-permeability tight oil reservoirs exceed 400 billion barrels, accounting for approximately 30% of the world’s total crude oil resources (Healy R N et al., 1975). In China, low-permeability tight oil resources are widely distributed, with substantial reserves discovered in basins such as Ordos, Songliao, Junggar, and Sichuan, demonstrating huge development potential (Jia C et al., 2016). However, such reservoirs generally exhibit characteristics including fine pore throats, low permeability, and poor connectivity, leading to unsatisfactory performance in traditional water flooding development, with the average crude oil recovery factor typically below 15% (Lake L W et al., 2014).
Surfactant flooding is a core technology in chemical flooding. It offers significant advantages for enhancing recovery rates in low-permeability tight reservoirs. Its effectiveness stems from synergistic mechanisms, including ultra-low interfacial tension, wetting reversal, and emulsification transport (Sheng J J et al., 2015).In recent years, researchers have developed various novel surfactant systems. These systems are tailored to the unique characteristics of low-permeability reservoirs. For the ultra-low permeability reservoirs in the Jiyuan area of the Ordos Basin, Liu X et al. (2024) conducted a systematic evaluation. They focused on the interfacial activity, emulsification capacity, and wettability modification ability of stearamide-based bio-nano surfactants. Through oil displacement experiments with different reservoir cores, they clarified the factors influencing surfactant displacement efficiency. They also demonstrated the synergistic interaction between wettability and emulsification.Pal et al. (2018) synthesized twin surfactants. These surfactants showed outstanding performance in achieving ultra-low interfacial tension. They could also transform rock wettability from neutral to hydrophilic. Shaikhah et al. (2024) carried out a systematic review of recent advances in bio-surfactants for enhanced oil recovery. Their review covered production strategies, characterization methods for action mechanisms, and application advantages and disadvantages. They also introduced optimization concepts such as hydrophilic-lipophilic deviation (HLD) to guide molecular design.Kamal et al. (2017) provided another systematic review. They pointed out that the final oil displacement effect is determined by multiple factors. These factors include interfacial tension, the degree of wettability modification, emulsion stability, and migration and retention behavior within porous media.The investigation of surfactant interfacial behavior in porous media has long been a key focus in this field. Standnes et al. (Standnes D C et al., 2000) experimentally confirmed that surfactants can alter rock wettability from oil-wet to neutral-wet or water-wet, thereby enhancing microscopic displacement efficiency. The study by Ahmadi et al. further demonstrated that in low-permeability tight reservoirs, the transport and retention behavior of surfactants decisively influences macroscopic oil displacement performance. Zhang et al. (Zhang J et al., 2012) developed a novel formulation composed of anionic and nonionic surfactants and found that higher salinity environments facilitated further interfacial tension reduction, providing new insights for optimizing surfactant concentration in high-salinity reservoirs. Moreover, the stability of emulsified phases and their transport capability within pore throats have also been identified as key factors affecting the oil displacement outcome (Hou J et al., 2005).
Regarding research on adaptability in low-permeability reservoirs, Hirasaki et al. (Hirasaki G J et al., 2011) systematically summarized recent advances in surfactant flooding, with particular emphasis on application challenges under complex reservoir conditions. Ahmadi and Shadizadeh (Ahmadi M A et al. 2013) investigated the implementation of natural surfactants in aqueous solutions for EOR applications, conducting core flooding experiments to evaluate the effectiveness of the introduced surfactants as EOR agents in carbonate reservoirs. They found that the interfacial tension of the surfactants plays a decisive role in the oil displacement outcome. Ramatou et al. (Ramatou I I et al., 2024), combining phase behavior design with pore-scale visualization, differentiated the combined chemical and mechanical mechanisms and directly visualized the oil displacement process by Winsor III microemulsions, providing new insights for advancing EOR applications at the field scale.
However, complex relationships exist between the aforementioned key parameters and the recovery ratio, making it difficult for traditional prediction models based on linear assumptions to accurately describe these complexities. Ahmadi et al. (Ahmadi M A et al., 2015) demonstrated that numerical models considering capillary pressure effects still have significant limitations in low-permeability reservoirs. Taber et al. (1997) established screening criteria for EOR technologies as early as 1997. Most traditional methods rely on empirical models or numerical simulations, but they exhibit evident shortcomings in prediction accuracy—such as high dependence on experimental data and long calculation time.Wang et al. (Wang D et al., 2009), in their study of the Daqing Oilfield, indicated that improving sweep efficiency is crucial for enhancing oil recovery, but this requires more accurate predictive models.
With the advancement of artificial intelligence technology, machine learning offers a new approach to addressing this challenge. Tariq et al. (Tariq Z et al., 2021) systematically reviewed the application of machine learning in petroleum engineering, pointing out the significant potential of ML techniques for solving problems in nearly all areas of the oil and gas industry. Mohaghegh (Mohaghegh S D, 2005) pioneered the introduction of intelligent data analysis methods into petroleum engineering, laying the foundation for subsequent research. In chemical flooding prediction, Teixeira and Secchi (Teixeira A F et al., 2019) proposed using machine learning models, specifically artificial neural networks, to represent the nonlinear dynamic behavior of reservoirs. The proposed method was applied to data generated by a synthetic reservoir simulation model, showing promising results. Wu et al. (Wu D et al., 2025) applied a two-step algorithm combining hyperparameter optimization and reconstruction to predict chemical flooding oil/water relative permeability, achieving superior accuracy compared to traditional methods.
In recent years, more advanced machine learning algorithms have been introduced into the field. Cheraghi et al. (Cheraghi Y et al., 2021) compared the performance of various machine learning algorithms for EOR prediction, screening applicable ML models and validating their reliability. Ahmadi et al. (Bian X Q et al., 2016) utilized Support Vector Machines to establish a prediction model for minimum miscibility pressure, providing a new method for chemical flooding optimization. Meng et al. (Meng S et al., 2024) applied machine learning to predict the performance of CO2 flooding in low-permeability reservoirs, validating the applicability of data-driven models in complex reservoirs. Chaikine et al. (Chaikine I A et al., 2021) developed a production prediction model for fractured horizontal wells based on machine learning methods, demonstrating its potential for practical production forecasting.
Regarding in-depth research on surfactant flooding mechanisms, Alvarado and Manrique (Alvarado V et al., 2010)provided a systematic update reviewing EOR technologies, emphasizing the need for surfactant formulation optimization. Talebian et al. (Talebian S H et al., 2014) investigated foam-assisted EOR techniques, offering new perspectives for surfactant application under complex conditions. Zhou et al. (Zhou W et al., 2019) experimentally studied the oil displacement effectiveness of surfactants in ultra-low permeability reservoirs, screening polymers suitable for low-permeability, high-salination formations and identifying surfactants with good performance, compatibility, and low cost. Furthermore, Sheng (Sheng J J, 2010) systematically analyzed the mechanisms of chemical EOR, providing a comprehensive theoretical framework for surfactant selection.
Nevertheless, existing research still has the following shortcomings: Firstly, systematic experimental data for specific surfactant systems tailored to low-permeability tight reservoirs are relatively scarce. Secondly, when constructing predictive models, key characteristics such as surfactant emulsion transport and retention behavior are not comprehensively considered. Additionally, comparative studies on different machine learning algorithms for predicting surfactant flooding performance are not yet in-depth. In response, this study focuses on typical low-permeability tight reservoirs. Through systematic experimental testing, it acquires multidimensional performance parameters for three surfactant systems: YHS-Z1, YHS-Z2, and a middle-phase microemulsion. A dataset containing seven key features, such as interfacial tension, contact angle, and emulsion transport index, is constructed. The predictive performances of five machine learning algorithms—Linear Regression, Random Forest, Gradient Boosting, Support Vector Regression, and XGBoost—are systematically compared. The aim is to establish accurate predictive models linking surfactant performance parameters with the recovery ratio, providing theoretical foundation and practical guidance for technical decision-making regarding surfactant flooding in low-permeability tight reservoirs.The research results not only fill the gap in the study of surfactant flooding mechanisms in low-permeability reservoirs but also provide a reliable technical means for optimizing surfactant formulation and injection parameters, which is of great significance for promoting the efficient development of low-permeability oil resources and ensuring energy supply stability.
2. Experiment and Simulation
2.1. Experimental Materials
The crude oil used in the experiments was obtained from the Changqing Oilfield, with its key properties summarized in Table 1.
The crude oil sample comprised 61.21% saturates, 14.77% aromatics, 6.27% asphaltenes, and 8.08% resins. The mineralization of the formation water was 24.6 g/L, was classified as the Na₂SO₄ type, exhibited a pH of 8.15, and its detailed ionic composition is provided in Table 2.
This study focuses on identifying the dominant factors influencing the enhanced oil recovery (EOR) performance of three distinct surfactant systems.Among them, “YHS-Z1” features hydroxypropyl sulfobetaine as its primary agent and Cocamide as its auxiliary agent, with a mass ratio of 7:3, forming an amphoteric-ionic + nonionic composite formulation. “YHS-Z2” primarily consists of polyether carboxylate, a nonionic-7 anionic composite surfactant; The medium-phase microemulsion is a stable system formed by “water-surfactant-auxiliary agent,” appearing as an oily liquid at room temperature. Its main agent is heavy alkylbenzene sulfonate with hydroxysulfobetaine as the auxiliary agent, in a mass ratio of 7:3. The molecular structures of the compounds contained in the above chemical formulations are shown in Figure 1. Considering the impact of concentration variations on the solution’s performance characteristics, the prepared formation water solution was adjusted to common field operation concentrations of 0.05%, 0.1%, 0.15%, 0.2%, and 0.25%.
The specific cores employed in the experiment were supplied by Changqing Oilfield’s First Oil Production Plant. This batch of cores, classified as feldspathic sandstone, is visually presented in Figure 2. Prior to experimentation, the cores were subjected to oil-washing treatment using xylene, followed by drying. The porosity and permeability of the cores were measured using an overburden pore-permeability instrument. The core length and dry weight were recorded. Subsequently, the cores were saturated with formation water for 48 hours, after which the wet weight was measured to calculate the effective porosity. The corresponding data are summarized in Table 3.
The emulsion migration index/retention index test utilized artificial cores with physical properties closely resembling natural cores, featuring a permeability of 50 × 10-3μm2。.
2.2. Interfacial Tension Measurement
The interfacial tension between crude oil and surfactant solutions at varying concentrations, as well as formation water, was measured using a TX-500C spinning drop tensiometer (manufactured by Beijing Shengwei Jiye Technology Co., Ltd., with a measurement range of 10-5 to 102 mN/m). Prior to testing, the chemical agents and crude oil were preheated in an oven. The experiment was conducted at a set temperature of 63℃. The instrument was operated at a rotational speed of 6000 rpm for 45 minutes before image capture commenced to calculate interfacial tension values. Equilibrium was deemed achieved when three consecutive measurements showed dimensional differences less than 0.01 readings, at which point the readings were recorded.
2.3. Contact Angle Measurement
This study employed an advanced static/dynamic contact angle analyzer (manufactured by Shanghai Solon Information Technology Co., Ltd., measurement range: 0°-100°, accuracy: ±0.1°) to measure the contact angles of different concentrations of chemical solutions and formation water on rock surfaces, with a specific focus on investigating the effect of middle-phase microemulsion on rock wettability. Prior to testing, the chemical solutions were preheated to 63 ℃. The sessile drop method was adopted for the measurements: after polishing the rock surface to a smooth finish, a 4 μL droplet was dispensed using the instrument’s automatic dispensing system. Images were captured after the droplet stabilized, and each droplet was measured three times to minimize experimental error. The final contact angle value was taken as the average of the three repeated measurements.
2.4. Static Oil Washing Experiment
The ability of different surfactants to actively strip crude oil was evaluated through a crude oil-rock separation test. To simulate the wettability and oil-saturated state of the reservoir, representative quartz sand, with a composition closely matching that of the reservoir, was used. The static oil-washing efficiency of each chemical solution was tested across five increasing concentrations. The specific experimental procedure was as follows:
(1)Dry the washed quartz sand and mix it with crude oil at a ratio of 6:1 to form oil sands, then age the mixture at 63℃ for 24 hours.
(2)Upon completion of the aging process, approximately m₁ = 15 g of the oil-sand (containing 2.14 g of crude oil) was accurately weighed and placed into individual plastic tubes. A middle-phase microemulsion solution was then added to each tube at a solution-to-oil-sand mass ratio of 2:1. This procedure was repeated to prepare mixtures of the same oil-sand with five different chemical solution concentrations. All plastic tubes were subsequently placed in a constant-temperature oven and maintained at 63℃ for 24 hours.
After this incubation period, the mixtures in the tubes were filtered. The separated oil-sand was collected and transferred to an oven for 24 hours of drying. The mass of the dried oil-sand together with the centrifuge tube was recorded as m₂. The static oil displacement efficiency was calculated using Equation 1.
……………………(1)
In the equation, η is the static oil separation efficiency, %; m0 is the mass of the centrifuge tube, g; p is the oil content,%()。
2.5. Dynamic Washing Oil Experiment
The experimental procedure for the dynamic oil displacement test is outlined as follows:
1.The natural core plugs were cleaned and dried.
2.The core was placed in a core holder and preheated to 63 °C. Confining pressure was applied, maintained approximately 2 MPa above the injection pressure. Crude oil was injected at a constant rate of 0.05mL/min to saturate the core. The volume of water displaced was measured using a graduated cylinder at the outlet until no more water production was observed, at which point injection was stopped. The total volume of displaced water equated to the volume of oil saturating the core. The oil-saturated core was then aged for 24 hours at the reservoir temperature.
3.The displacement fluid was switched to formation water and injected at a rate of 0.05 mL/min. The prepared formation water was continuously injected until the water cut at the outlet exceeded 98%. Throughout this process, the volumes of oil produced, water produced, and total liquid produced at the outlet were recorded. The oil recovery curve was plotted based on the data.
4.Steps 1-3 were repeated, replacing the displacement fluid with different concentrations of surfactant solutions.
2.6. Emulsification Migration/Retention Index Experiment
Artificial cores with pore-throat characteristics comparable to those of the low-permeability tight reservoirs in the Changqing Oilfield were selected to conduct core flooding experiments. These tests aimed to investigate the oil-water migration behaviors within low-permeability cores under different chemical flooding systems, using the Emulsification Migration Index and Retention Index as key metrics. The study focused on analyzing the retention characteristics of emulsified droplets in pores and their influence law of the occurrence state of residual oil, thereby revealing the synergistic regulation mechanism of emulsification strength-water flooding parameters. The specific experimental procedure was as follows:
The experimental setup was assembled as illustrated in Figure 3. Components including a constant-rate pump, identical piston containers (pre-filled and purged with formation water, experimental oil, and chemical flooding solutions), a pressure monitoring system, a core holder, pipeline, and valves were connected and placed inside a constant-temperature oven. The system was maintained at reservoir temperature for over 3 hours to allow the formation water to adequately saturate the core and to ensure the entire core assembly reached a uniform experimental temperature.
Two constant-rate pumps were started and maintained at a unified flow rate of 0.05 mL/min. Once the oil-water ratio flowing from the vent valve stabilized, the core inlet and outlet valves were opened while the vent valve was closed. This allowed 0.75 PV of experimental oil and 0.75 PV of formation water to be co-injected into the core simultaneously, each at a rate of 0.05 mL/min.
The pressure reading from the pressure sensor was recorded after every 0.25 PV of experimental oil injected. The average pressure during the injection from 0.5 PV to 0.75 PV of experimental oil was calculated and denoted as pwo.
The outlet valve of the piston container filled with the chemical flooding system solution was opened, while the outlet valve of the container filled with formation water was closed. This enabled the simultaneous co-injection of 5 PV of experimental oil and 5 PV of the chemical flooding system solution into the core, each at a rate of 0.05 mL/min.
The pressure reading was recorded after every 0.25 PV of experimental oil injected. The average pressure during the injection from 4.5 PV to 5 PV of experimental oil was calculated and denoted as pem.
The outlet valve of the piston container filled with formation water was opened, and the outlet valve of the container holding the chemical flooding system solution was closed. This allowed 1.5 PV of experimental oil and 1.5 PV of formation water to be co-injected into the core simultaneously, each at a rate of 0.05 mL/min.
The pressure reading was recorded after every 0.25 PV of experimental oil injected. The average pressure during the injection from 1 PV to 1.5 PV of experimental oil was calculated and denoted as pewo.
The emulsion migration index was calculated using Equation (1):
.................................................(1)
Where:
Tei——Emulsion transport index;
pwo——The average pressure of oil-water two-phase flow, MPa.
pem——Emulsion seepage average pressure, MPa.
μs——Apparent viscosity of chemical flooding system solution at target reservoir temperature,mPa·s.
μw——Apparent viscosity of formation water at target reservoir temperature, mPa·s.
The emulsion retention index is calculated according to Equation (2) :
(2)
In the formula:
Rei—Emulsion retention index.
pewo—The average pressure of oil-water two-phase seepage after emulsion formation, MPa.
3. Model Construction
3.1. Construction of Machine Learning Model Framework
In this paper, five classical regression models are selected, covering linear, nonlinear and ensemble learning types. The core principles and applicable scenarios of each model are as follows. The reliability and generalization of prediction results are ensured by multi-model comparison.
(1)Data and Preprocessing
①Data Set Construction
In the experiment, three chemical agents (YHS-Z1, YHS-Z2, medium-phase microemulsion) were used as the research objects. Each chemical agent was set up with 5 concentration gradients of 0.05 ~ 0.25, and 3 parallel experiments were carried out for each gradient. Finally, 15 groups of effective samples were screened (excluding outliers). The data set contains two modules : ‘ input feature-target variable ‘ :
Input characteristics (7 items) : reagent type (categorical variables, coded as 1,2,3), concentration (%), wetting angle (°), interfacial tension (mN/m), static oil washing efficiency (%), emulsification rate, migration index and retention index ;
The target variable (1 item) : natural core recovery (%), which is directly measured by core displacement experiment to reflect the final mining effect of chemical agent.
②Data pre-processing
In order to eliminate the influence of dimensional differences on model training, the continuous features (concentration, wetting angle, etc.) are normalized by standardization. The formula is as follows :
Where x is the original feature value, μis the feature mean, and σ is the feature standard deviation. For the categorical variable (Reagent Type), one-hot encoding was applied to convert it into numerical data, ensuring model recognition. Simultaneously, box plots were used to detect outliers, and three samples exceeding 1.5 times the interquartile range were removed, ultimately retaining 15 valid datasets for model training.
(2)Model Training and Evaluation Process
①Data Splitting:The dataset was divided into a training set (10 groups) and a test set (5 groups) in a 7:3 ratio. The training set was used for model parameter fitting, while the test set validated the model’s generalization ability to prevent overfitting.
②Model Training: Initial parameters were set for each of the five models (e.g., the number of trees in RF was set to 100; the RBF kernel parameter in SVR was set to 0.1). Iterative training was performed using the training set, and parameters were adjusted via 5-fold cross-validation (e.g., the learning rate for GBR was optimized to 0.05).
③Performance Evaluation: Four commonly used metrics for regression tasks were employed to quantify model performance. The formulas for these metrics are as follows:
Mean Absolute Error (MAE):Reflects the average absolute deviation between predicted and true values:
MAE =
Mean Absolute Percentage Error (MAPE):A dimensionless metric that quantifies the relative percentage of prediction errors (%):
MAPE =
Root Mean Square Error (RMSE):Sensitive to larger errors, representing the square root of the average squared deviations:
RMSE =
Coefficient of Determination (R²):Measures the goodness-of-fit of the model to the data. A value closer to 1 indicates a better fit:
In the formula:
is the number of test samples.
is the real recovery.
is predict recovery.
is average of real recovery.
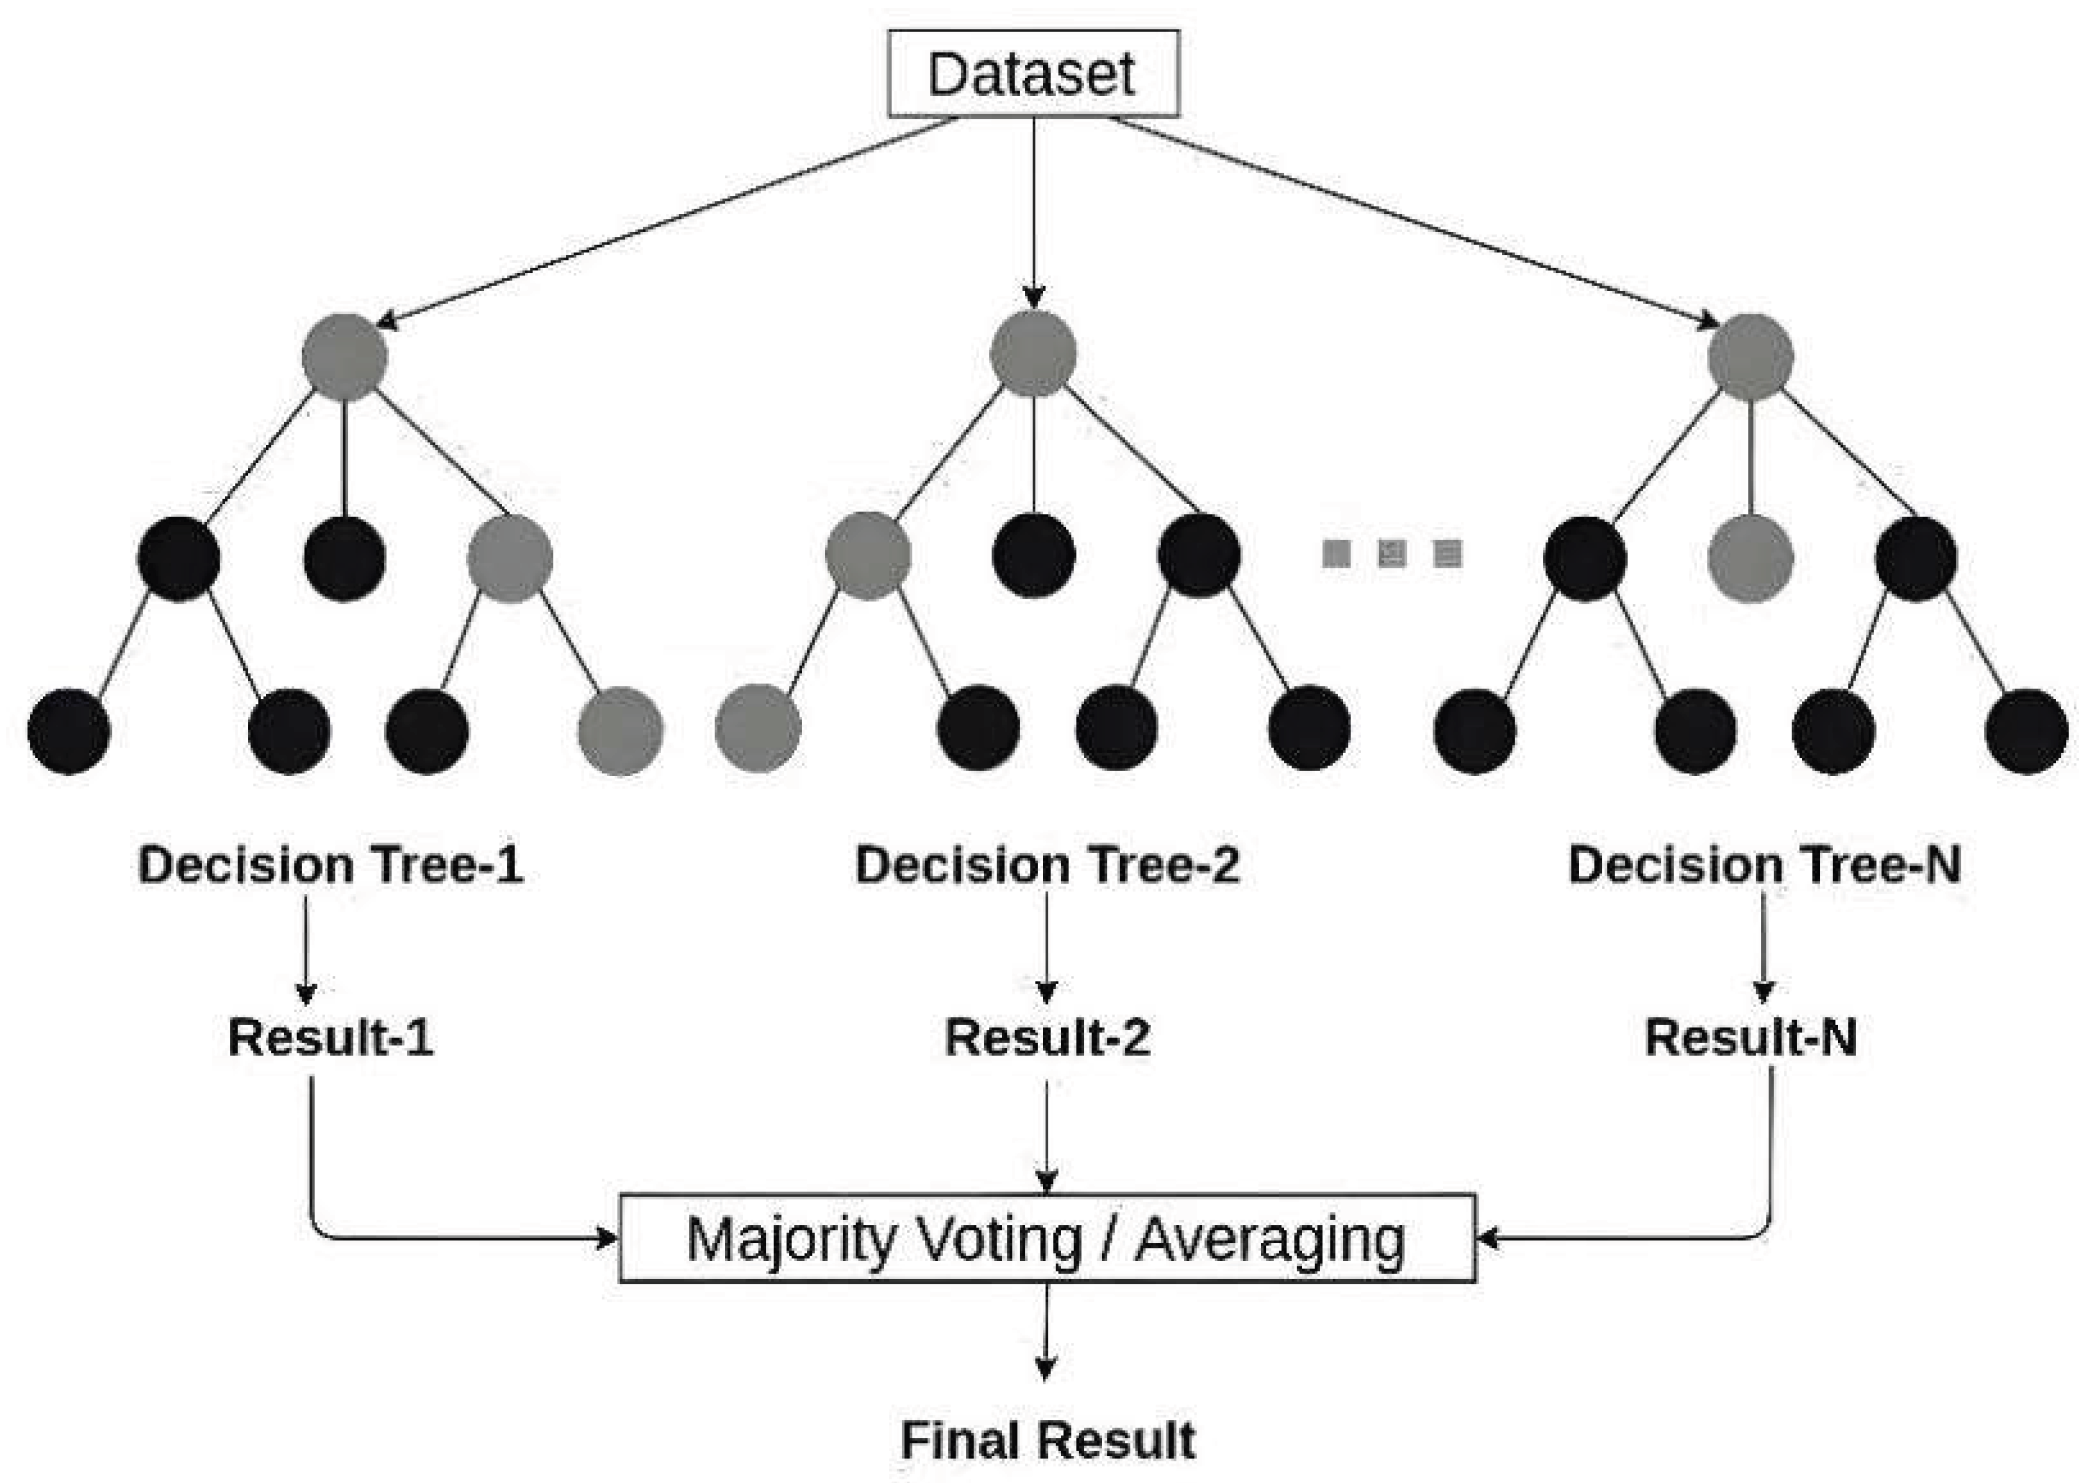
Figure 4.
Random forest prediction flow chart.
3.2. Feature Importance Analysis Based on SHAP Algorithm
The SHAP (SHapley Additive exPlanations) algorithm was employed. Based on the Shapley value from cooperative game theory, it quantifies the contribution of each feature to the prediction outcome. The global importance ranking of features was obtained by calculating the mean absolute value of the SHAP values across all samples. The formula is as follows:
In the formula:
:The SHAP value of the feature i.
:The complete set of all features.
:The subset of features excluding feature i.
:The total number of features.
:The model’s predicted output when using only the feature subset S.
:The model’s predicted output after adding feature i to the subset S.
Combination coefficient is used to distribute the contribution weight of all subsets fairly.
4. Results and Discussion
4.1. Study on Surfactant Flooding Characteristic Parameters of Low Permeability Reservoir
Figure 5 illustrates the wettability alterations of three distinct surfactants with increasing concentration.
As shown in Figure 5, all three surfactants demonstrate a consistent trend of decreasing contact angle with increasing concentration from 0.05% to 0.25%, though significant differences exist in their wettability alteration capabilities and characteristics. The middle-phase microemulsion exhibits the most effective wettability modification, attributable to the synergistic adsorption between heavy alkylbenzene sulfonate and hydroxysulfobetaine. YHS-Z2 maintains consistently low contact angles, indicating stable wettability improvement due to the uniform adsorption film formed by its polyether segments. YHS-Z1 shows a fluctuating decline in contact angle, resulting from localized aggregation of zwitterionic molecules creating heterogeneous adsorption, yet still achieves an overall transition from weakly oil-wet to weakly water-wet conditions.The fundamental mechanism enabling these surfactants to alter rock wettability lies in their amphiphilic molecular structures. The hydrophilic groups competitively adsorb with silicon-oxygen bonds on rock surfaces and hydrophobic sites of feldspar minerals, gradually displacing crude oil molecules adhered to the rock surface. This process enhances the rock’s affinity for water phase wetting. Increasing surfactant concentration further amplifies this effect by increasing the adsorption capacity and coverage of amphiphilic molecules on the rock surface, thereby strengthening the water-wetting modification.
Figure 6 depicts the variation in oil-water interfacial tension with increasing concentration for three different surfactants.
As observed in Figure 6, as the concentration of the three surfactants—YHS-Z1, YHS-Z2, and the middle-phase microemulsion—increases from low to high, the oil-water interfacial tension exhibits a continuous decline, gradually plateauing in the later stages. The control group (formation water) exhibited a high oil-water interfacial tension of 54 mN/m. In contrast, the addition of any of the three surfactants led to a sharp reduction in IFT, with higher concentrations resulting in lower values. Ultimately, all systems achieved ultra-low interfacial tension below 0.02 mN/m, with the middle-phase microemulsion showing the most significant reduction.This behavior is attributed to the amphiphilic structure shared by all three surfactant molecules. At the oil-water interface, their hydrophobic tails orient towards the oil phase and their hydrophilic heads towards the water phase. This interfacial adsorption disrupts the original force balance between oil and water molecules, weakening the intermolecular attractions and thereby reducing the interfacial tension. As concentration increases, more surfactant molecules accumulate at the interface, further packing into the interfacial layer and “diluting” the molecular resistance across it, leading to a continued decrease in IFT. The eventual plateau arises from the interfacial adsorption approaching a saturated state.
Figure 7 demonstrates the variation in static oil displacement efficiency with increasing concentration for the three different surfactants.
As shown in Figure 7, the static oil displacement efficiency of all three surfactants increases as their concentration rises from 0.05% to 0.25%. YHS-Z2 demonstrates the optimal performance, maintaining efficiency above 82% across the entire concentration range. This is attributed to the uniform adsorption film formed by its nonionic-anionic composite polyether carboxylate structure, which effectively weakens the molecular interactions between crude oil and the quartz sand surface, reduces adhesion resistance, and regulates surface hydrophilicity. The middle-phase microemulsion exhibits the most significant improvement in static efficiency with increasing concentration, due to the synergistic adsorption of heavy alkylbenzene sulfonate and hydroxulfobetaine enhancing the coverage of amphiphilic molecules. This progressively shifts the rock surface from oil-wet to water-wet, improving active displacement capability. YHS-Z1 shows relatively lower and more fluctuating static efficiency, resulting from localized aggregation of zwitterionic molecules leading to heterogeneous adsorption. Nevertheless, its betaine groups still achieve crude oil displacement through competitive adsorption.
Figure 8 presents the dynamic oil displacement efficiency of the three different surfactants as a function of increasing concentration.
As shown in Figure 8, the dynamic oil displacement efficiency of all three surfactants exhibits a continuous increasing trend with rising concentration, significantly outperforming the control group (formation water dynamic efficiency of 25.85%). The middle-phase microemulsion demonstrates the best performance, with its enhanced displacement effect on core crude oil becoming more pronounced at higher concentrations. This superiority stems from its more effective alteration of rock surface wettability and greater reduction of oil-water interfacial tension at elevated concentrations. These improved interfacial properties substantially weaken crude oil adhesion on pore surfaces, reducing both “pore throat resistance” and “interfacial resistance,” thereby facilitating crude oil stripping and transport under displacement pressure. YHS-Z2 shows a more gradual increase in dynamic efficiency, as the steric hindrance of its polyether chains, while maintaining emulsion stability, provides weaker interfacial activity compared to the middle-phase microemulsion, resulting in limited reduction of flow resistance. YHS-Z1 exhibits the lowest dynamic displacement efficiency due to its relatively poor interfacial tension reduction capability and insufficient control over emulsion stability by the zwitterionic-nonionic composite system, which restricts crude oil transport efficiency.
Overall, static oil displacement efficiency serves as the foundation for dynamic displacement. All three surfactants enhance efficiency through the synergistic mechanism of “wettability alteration-interfacial tension reduction.” However, the middle-phase microemulsion achieves the optimal balance between static and dynamic efficiency at high concentrations, leveraging the superior interfacial properties and emulsion transport advantages of its composite system.
Figure 9 presents the variations in transport index and retention index for the three different surfactants with increasing concentration.
As shown in Figure 9, the emulsion transport index of all three surfactants exhibits a continuous increasing trend with rising concentration, while the retention index shows a consistent decreasing pattern. Higher concentrations result in significantly enhanced emulsion transport indices, indicating improved passage capability of emulsion droplets through rock pores.
The increase in surfactant concentration enhances their adsorption density at the oil-water interface. This elevated adsorption density contributes to improved emulsion transport through two primary mechanisms: First, the substantial reduction in interfacial tension (as previously demonstrated in interfacial tension measurements showing a continuous decrease with concentration) promotes the formation of finer, more uniformly distributed emulsion droplets from crude oil, thereby enhancing their mobility through porous media (manifested as an increase in the transport index). Second, the formation of a compact, high-strength interfacial film effectively suppresses droplet coalescence, emulsion breakdown, and mechanical entrapment at pore throats, significantly reducing emulsion retention tendency (reflected in the decreasing retention index).
Among the three systems, the middle-phase microemulsion achieves the highest transport index and the lowest retention index at 0.25% concentration. This superior performance originates from the stable middle-phase microemulsion structure formed by the composite system (heavy alkylbenzene sulfonate and hydroxysulfobetaine). This unique structure provides ultra-low interfacial tension and optimal phase behavior characteristics, enabling minimal flow resistance and maximum transport efficiency of emulsions through pore spaces. Consequently, it maintains excellent transport capacity while minimizing retention losses within the porous medium.
4.2. Study on the Main Controlling Factors of Surfactant Flooding in Low Permeability Reservoirs Based on Random Forest Algorithm
The MAE, MAPE, RMSE, and R² of the five models were calculated using the test set, with the results presented in the table below, enabling a clear comparison of error distribution and stability across the models.
As observed in Table 4, the Random Forest (RF) model demonstrates the best performance: it achieves the lowest values in MAE (2.8007%), MAPE (7.4107%), and RMSE (3.3111%) among all five models, and its R²(0.0454) is the only non-negative value. This indicates that the RF model provides the highest prediction accuracy for recovery factor and can better capture the nonlinear relationship between parameters and recovery. In contrast, the linear model performs poorly: the R² of Linear Regression (LR) is -0.2086, suggesting its inability to capture the nonlinear associations between parameters and recovery, thereby validating the necessity of employing nonlinear models for recovery factor prediction. Ensemble models show significant advantages: the three ensemble models—RF, GBR, and XGBoost—all exhibit superior error metrics compared to LR and SVR, indicating that model ensemble strategies can effectively reduce prediction bias from individual models and enhance generalization capability.
At the global level (across all samples), the ranking of feature importance and their corresponding contribution percentages are summarized in the table below. These results can be intuitively corroborated by the visualizations in Figure 11 and Figure 12, which illustrate the contribution of each feature.

Table 5.
Feature Importance (SHAP) - Overall ranking.
| Factors | Importance of SHAP | Proportion of impact(%) |
| Retention Index | 1.8689 | 49.79 |
| Emulsification Rate | 0.4019 | 10.71 |
| Transport Index | 0.3852 | 10.26 |
| Static Oil Displacement Efficiency (%) | 0.3689 | 9.83 |
| Interfacial Tension (mN/m) | 0.3099 | 8.26 |
| Concentration (%) | 0.2911 | 7.76 |
| Contact Angle (°) | 0.1280 | 3.41 |
The Retention Index emerged as the dominant global controlling factor, contributing nearly 50% to the model’s output. This indicates that the degree of chemical retention within core pores directly determines crude oil transport efficiency. . Insufficient retention leads to an inadequate effective chemical concentration, whereas excessive retention may cause pore blockage; both scenarios result in reduced oil recovery. The Emulsification Rate and Transport Index were identified as secondary factors, collectively accounting for approximately 21% of the total impact. The emulsification rate reflects the ability of chemicals to disperse crude oil, while the transport index characterizes the flow behavior of the chemical–oil system. Both are key parameters influencing oil recovery. In contrast, the Contact Angle demonstrated the least influential effect with merely 3.41% contribution, suggesting that under the experimental conditions, chemical-induced wettability alteration contributed less to recovery improvement compared to retention, emulsification, and transport mechanisms.
Due to differences in their compositional makeup, YSH-Z1, YSH-Z2, and the middle-phase microemulsion (ME) were divided into two groups: Z1Z2 (including YSH-Z1 and YSH-Z2) and ME. Feature importance was calculated separately for each group to explore inter-group variations. Using SHAP values, the relative contribution of each feature was calculated as its percentage of the total SHAP importance across all features, according to the formula:Contribution (%) = (SHAP importance of the feature / Total SHAP importance of all features) × 100%.The proportions of each feature were visualized using bar charts to identify the main controlling factors. As shown in Figure 13–Figure 16, these results reveal differences in the action mechanisms of the various chemical agents.
Figure 13.
Feature Importance (SHAP) - Group Z1Z2.
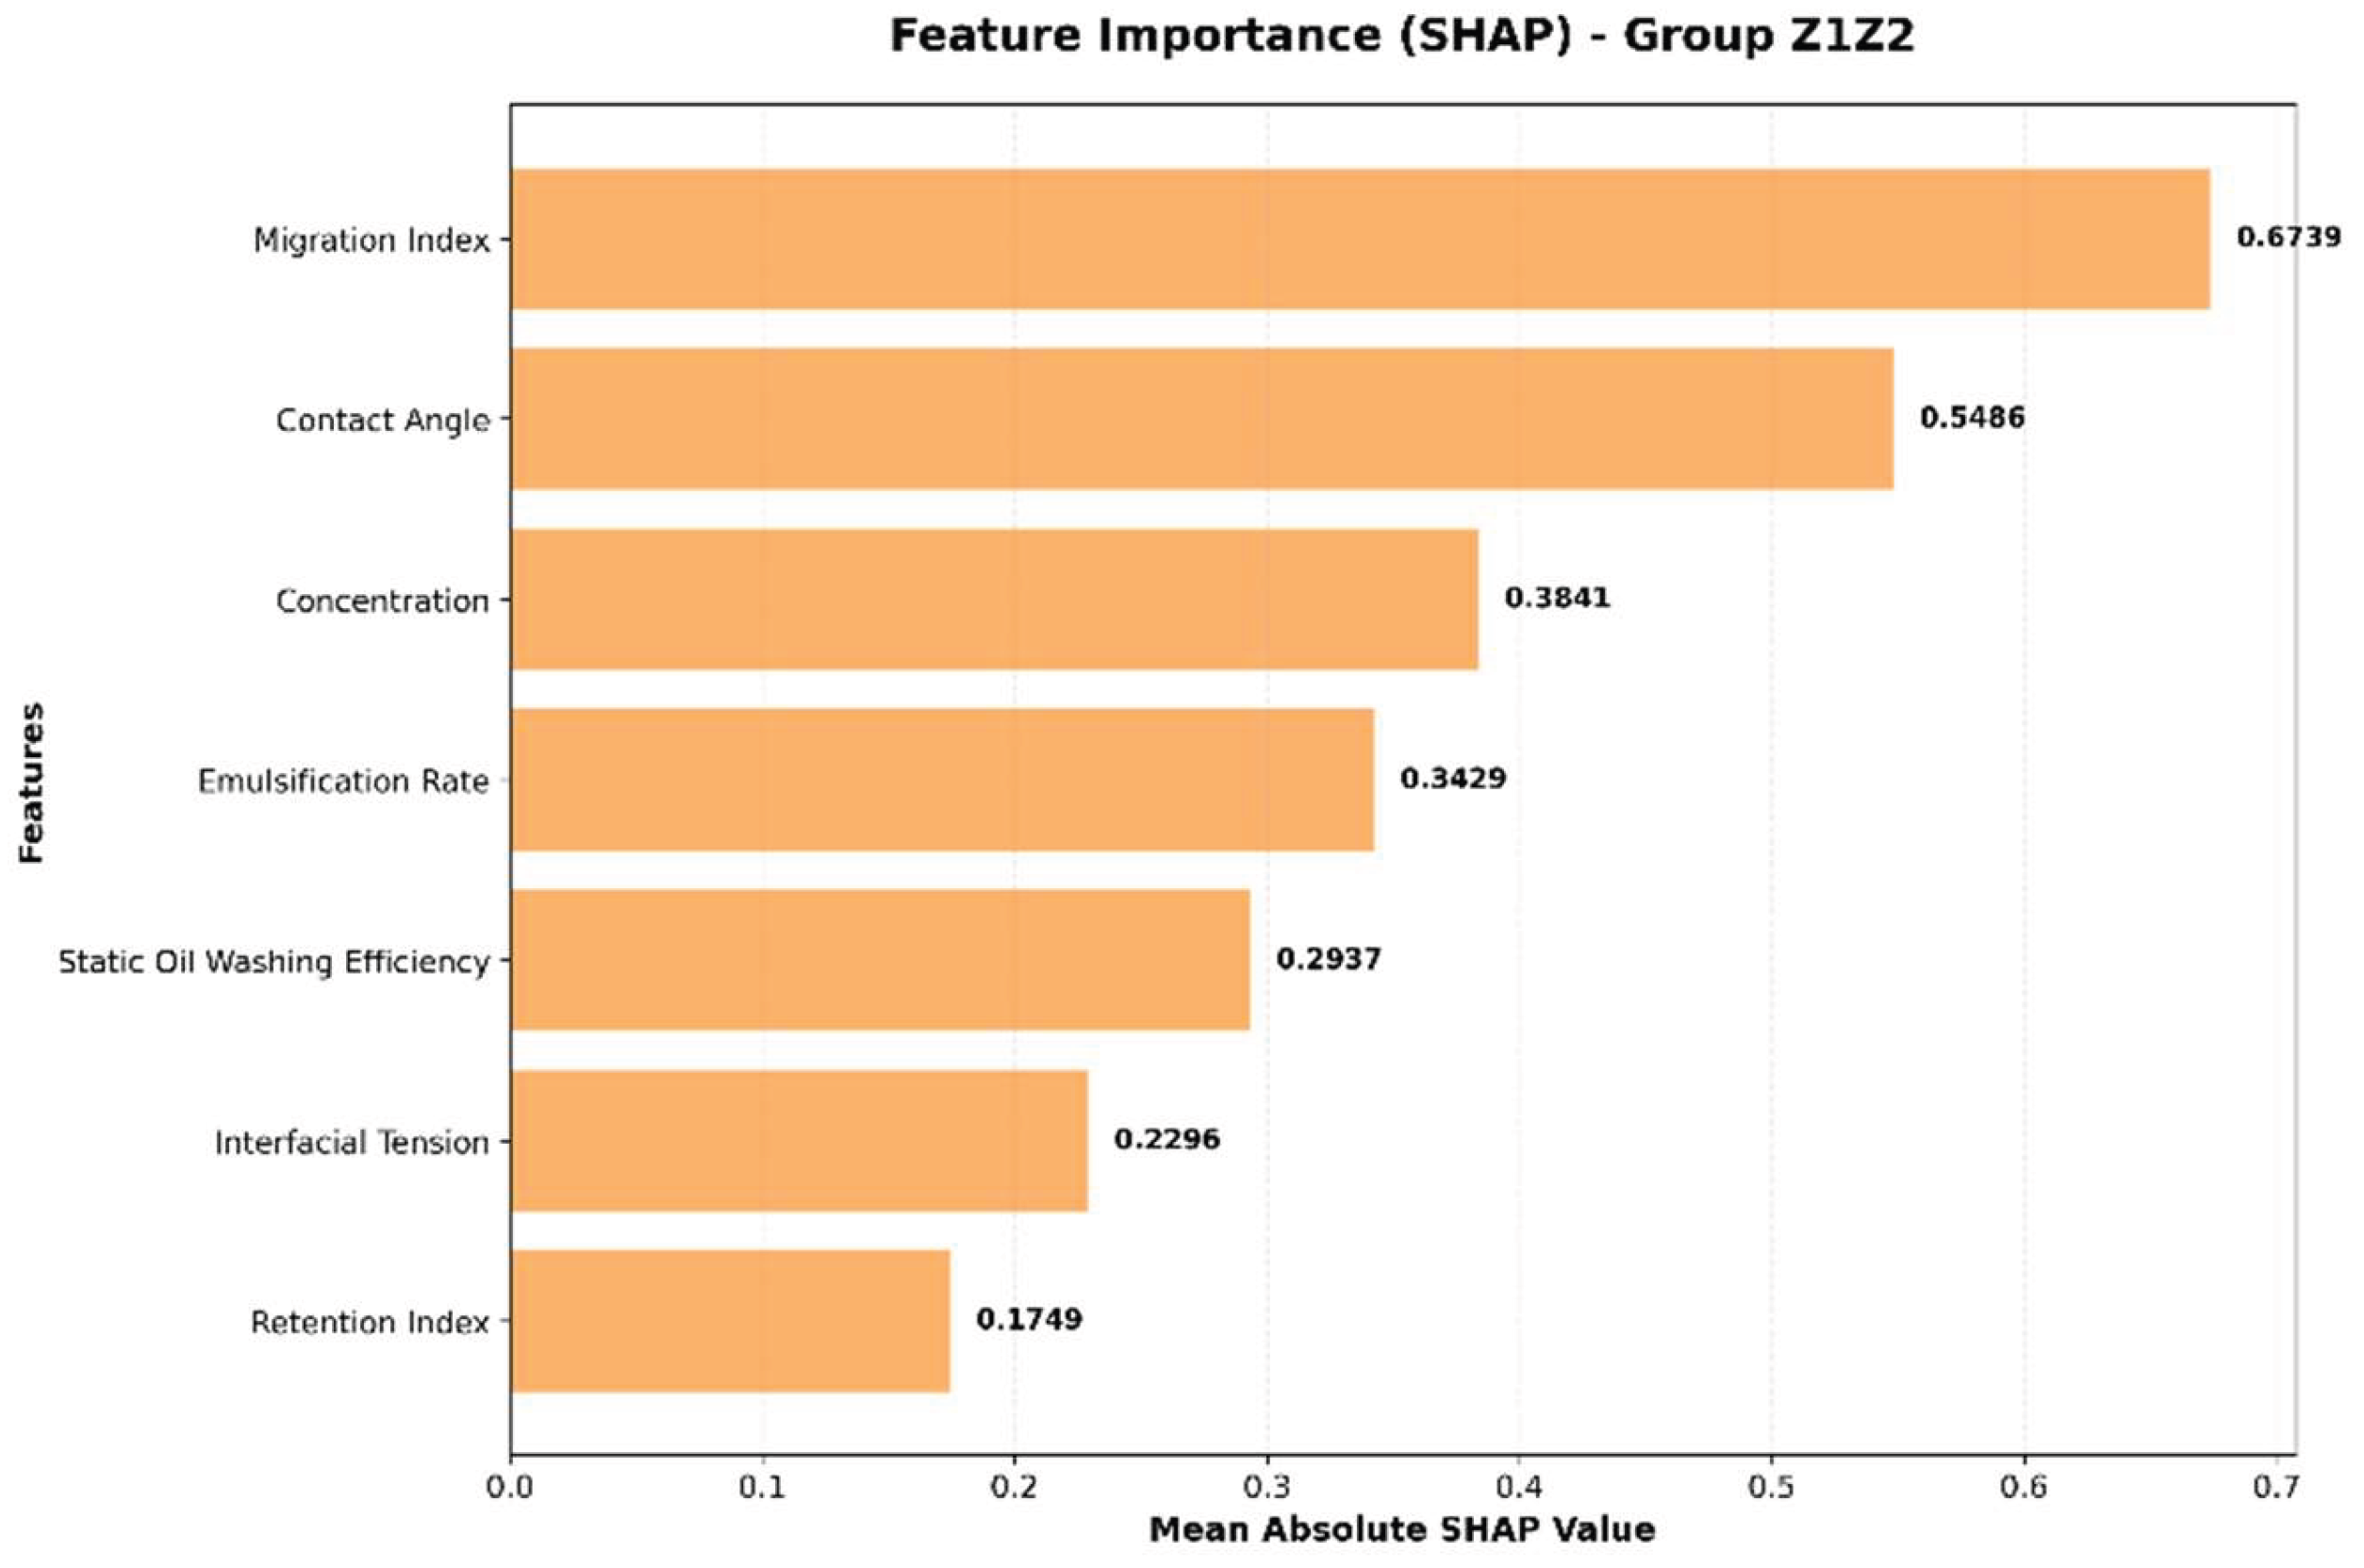
Figure 14.
Feature Importance (SHAP) -Group ME.
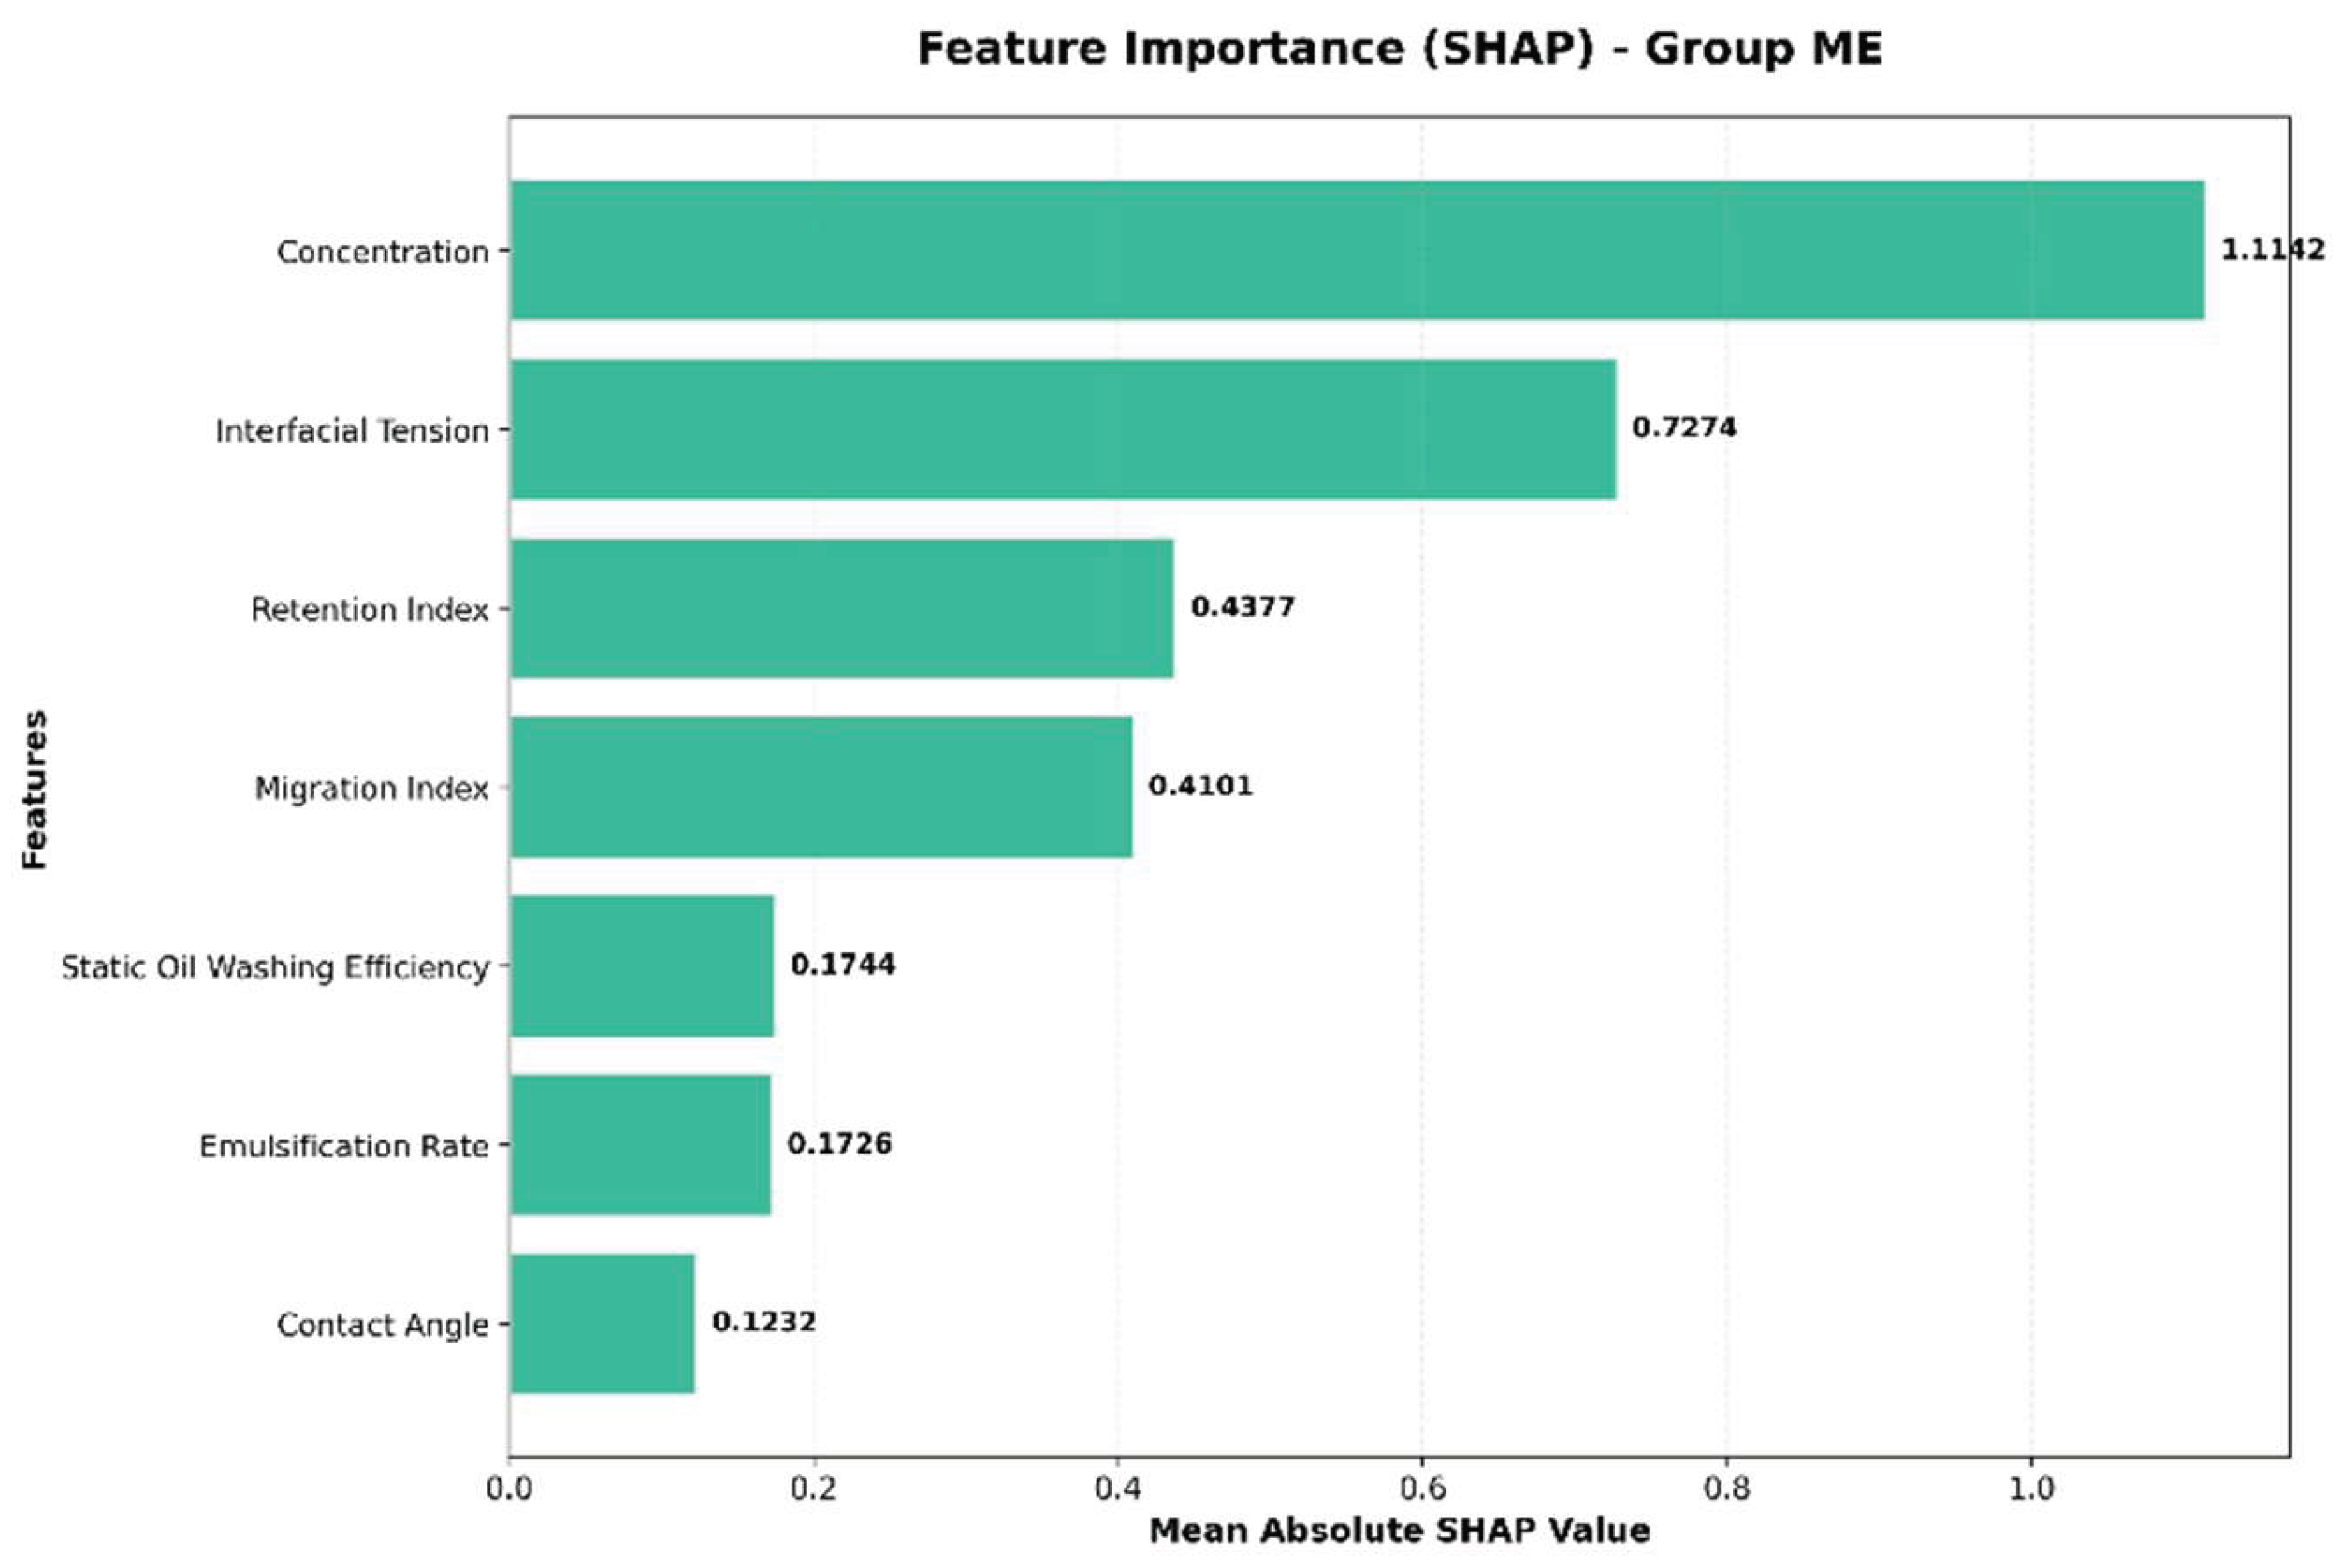
Figure 15.
Dominant Factors -Group Z1Z2 (SHAP-based).
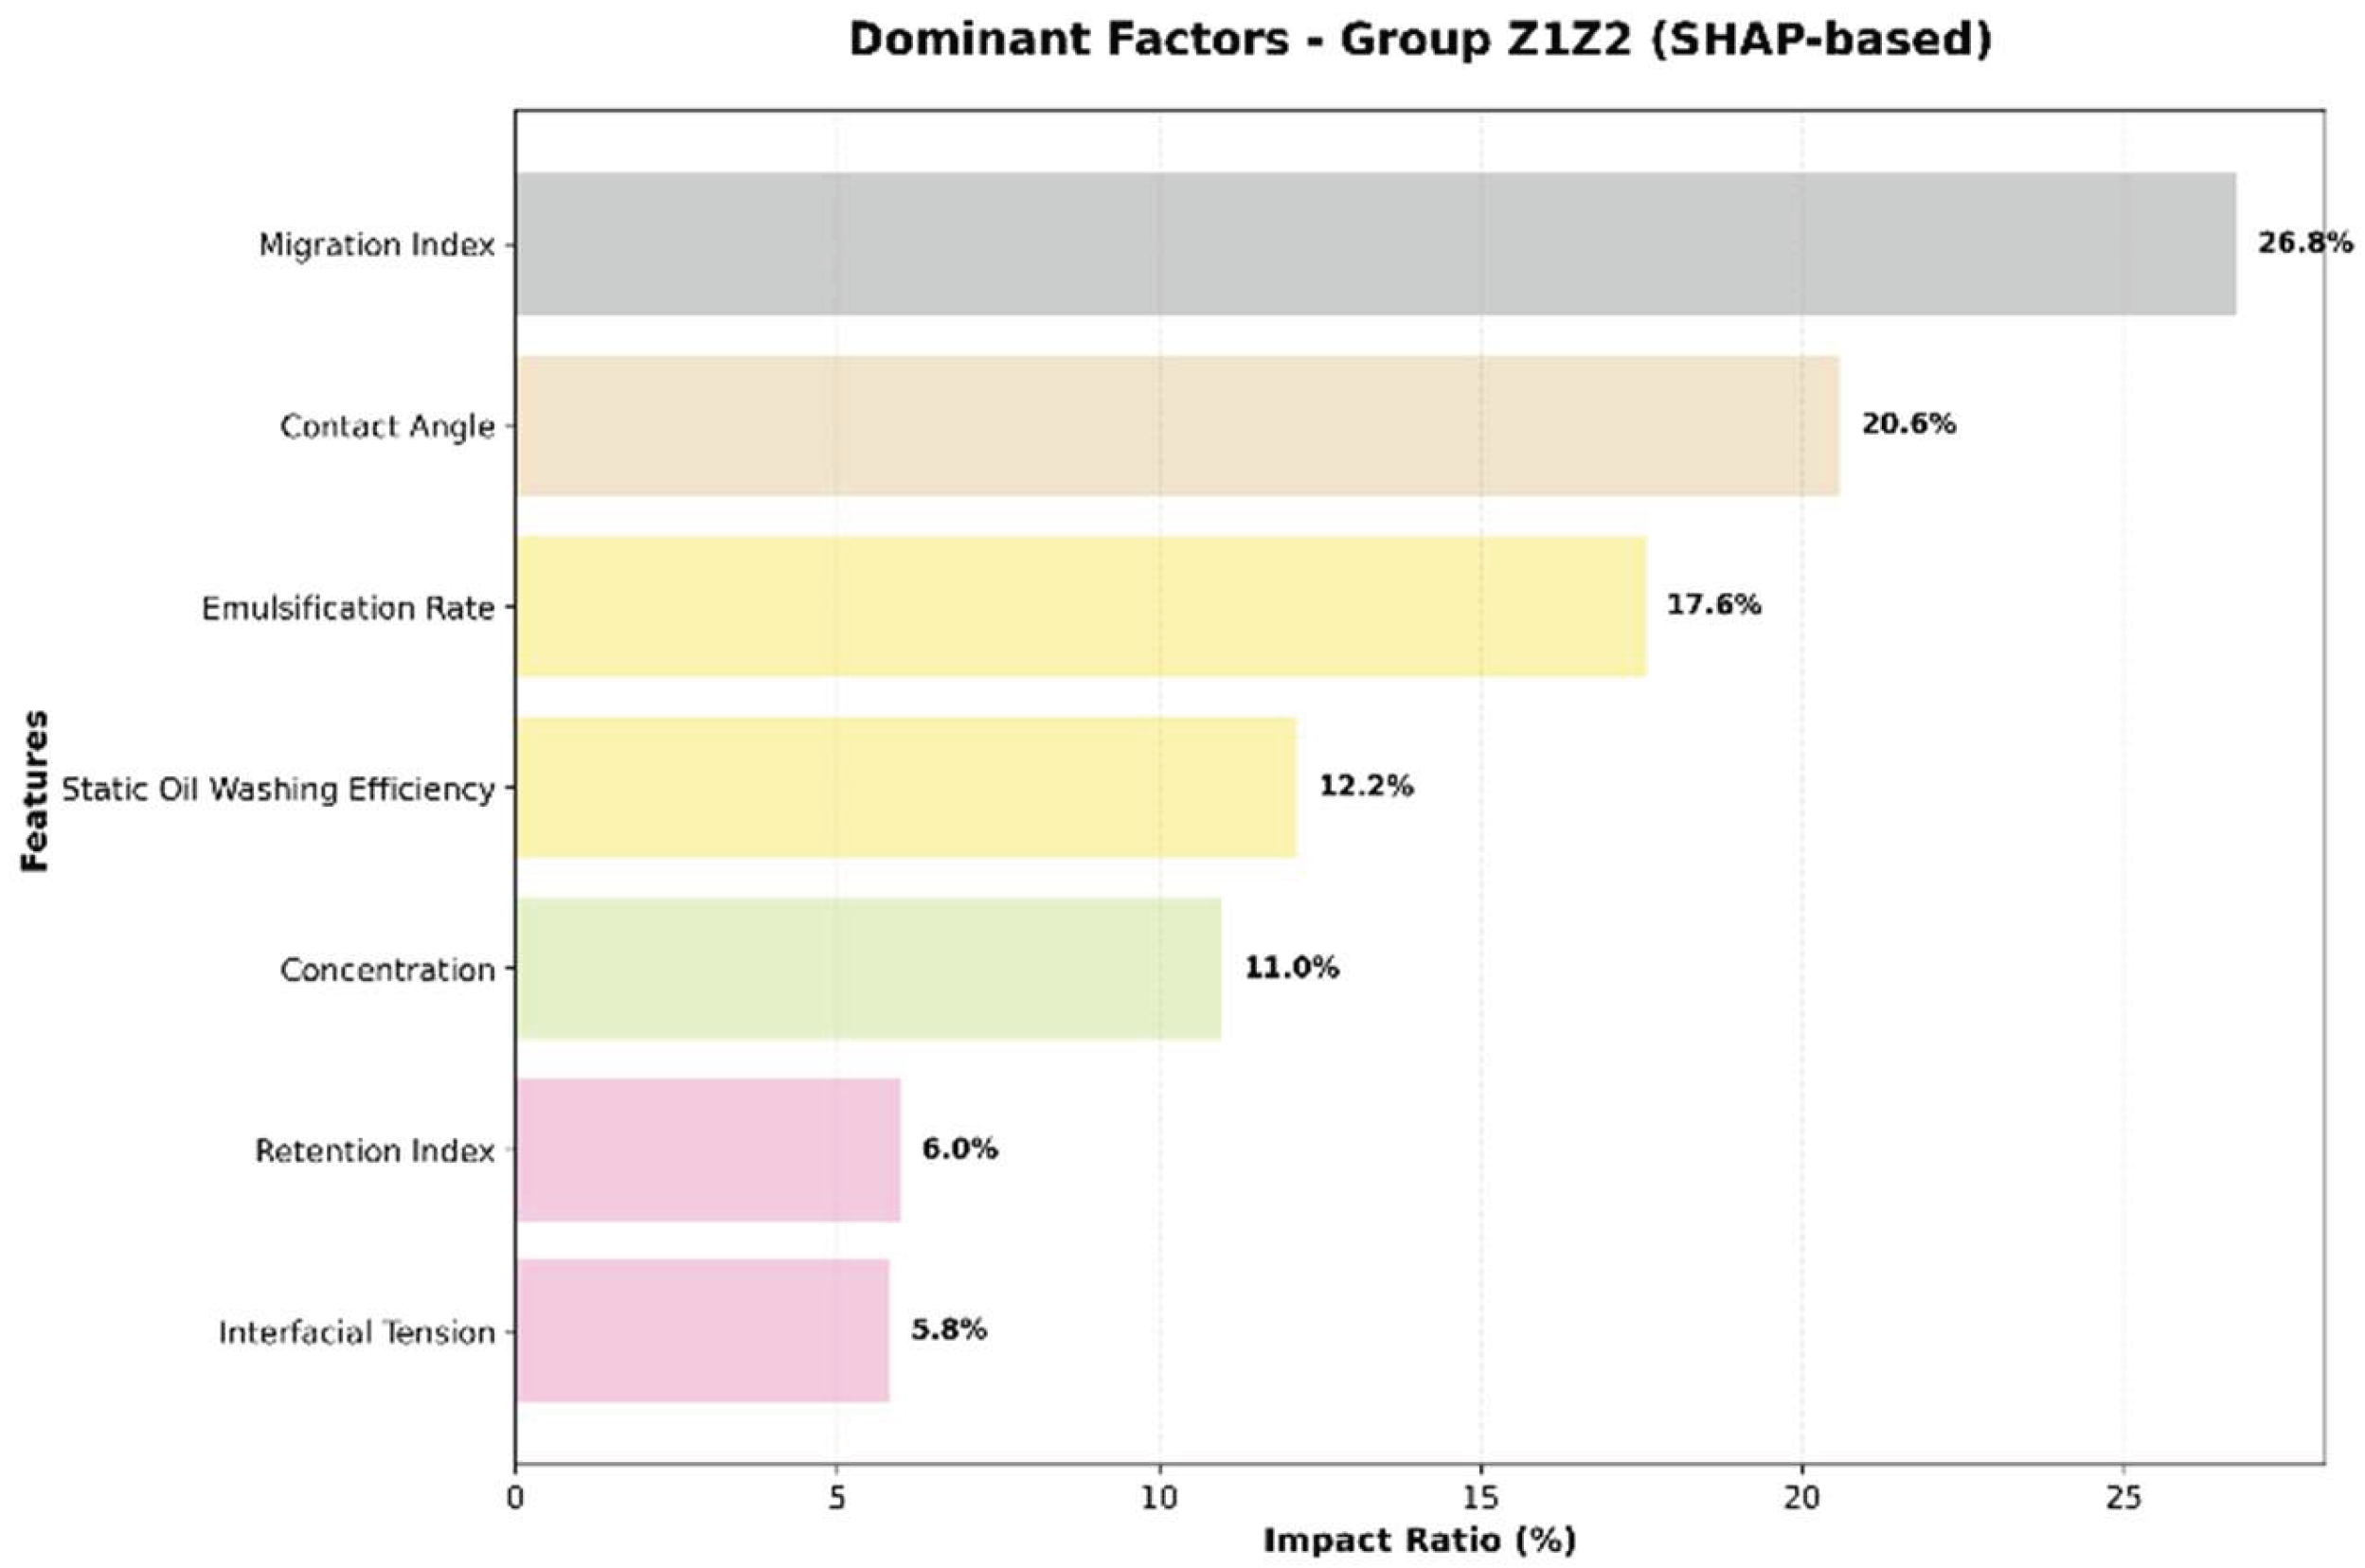
Figure 16.
Dominant Factors -Group ME (SHAP-based).
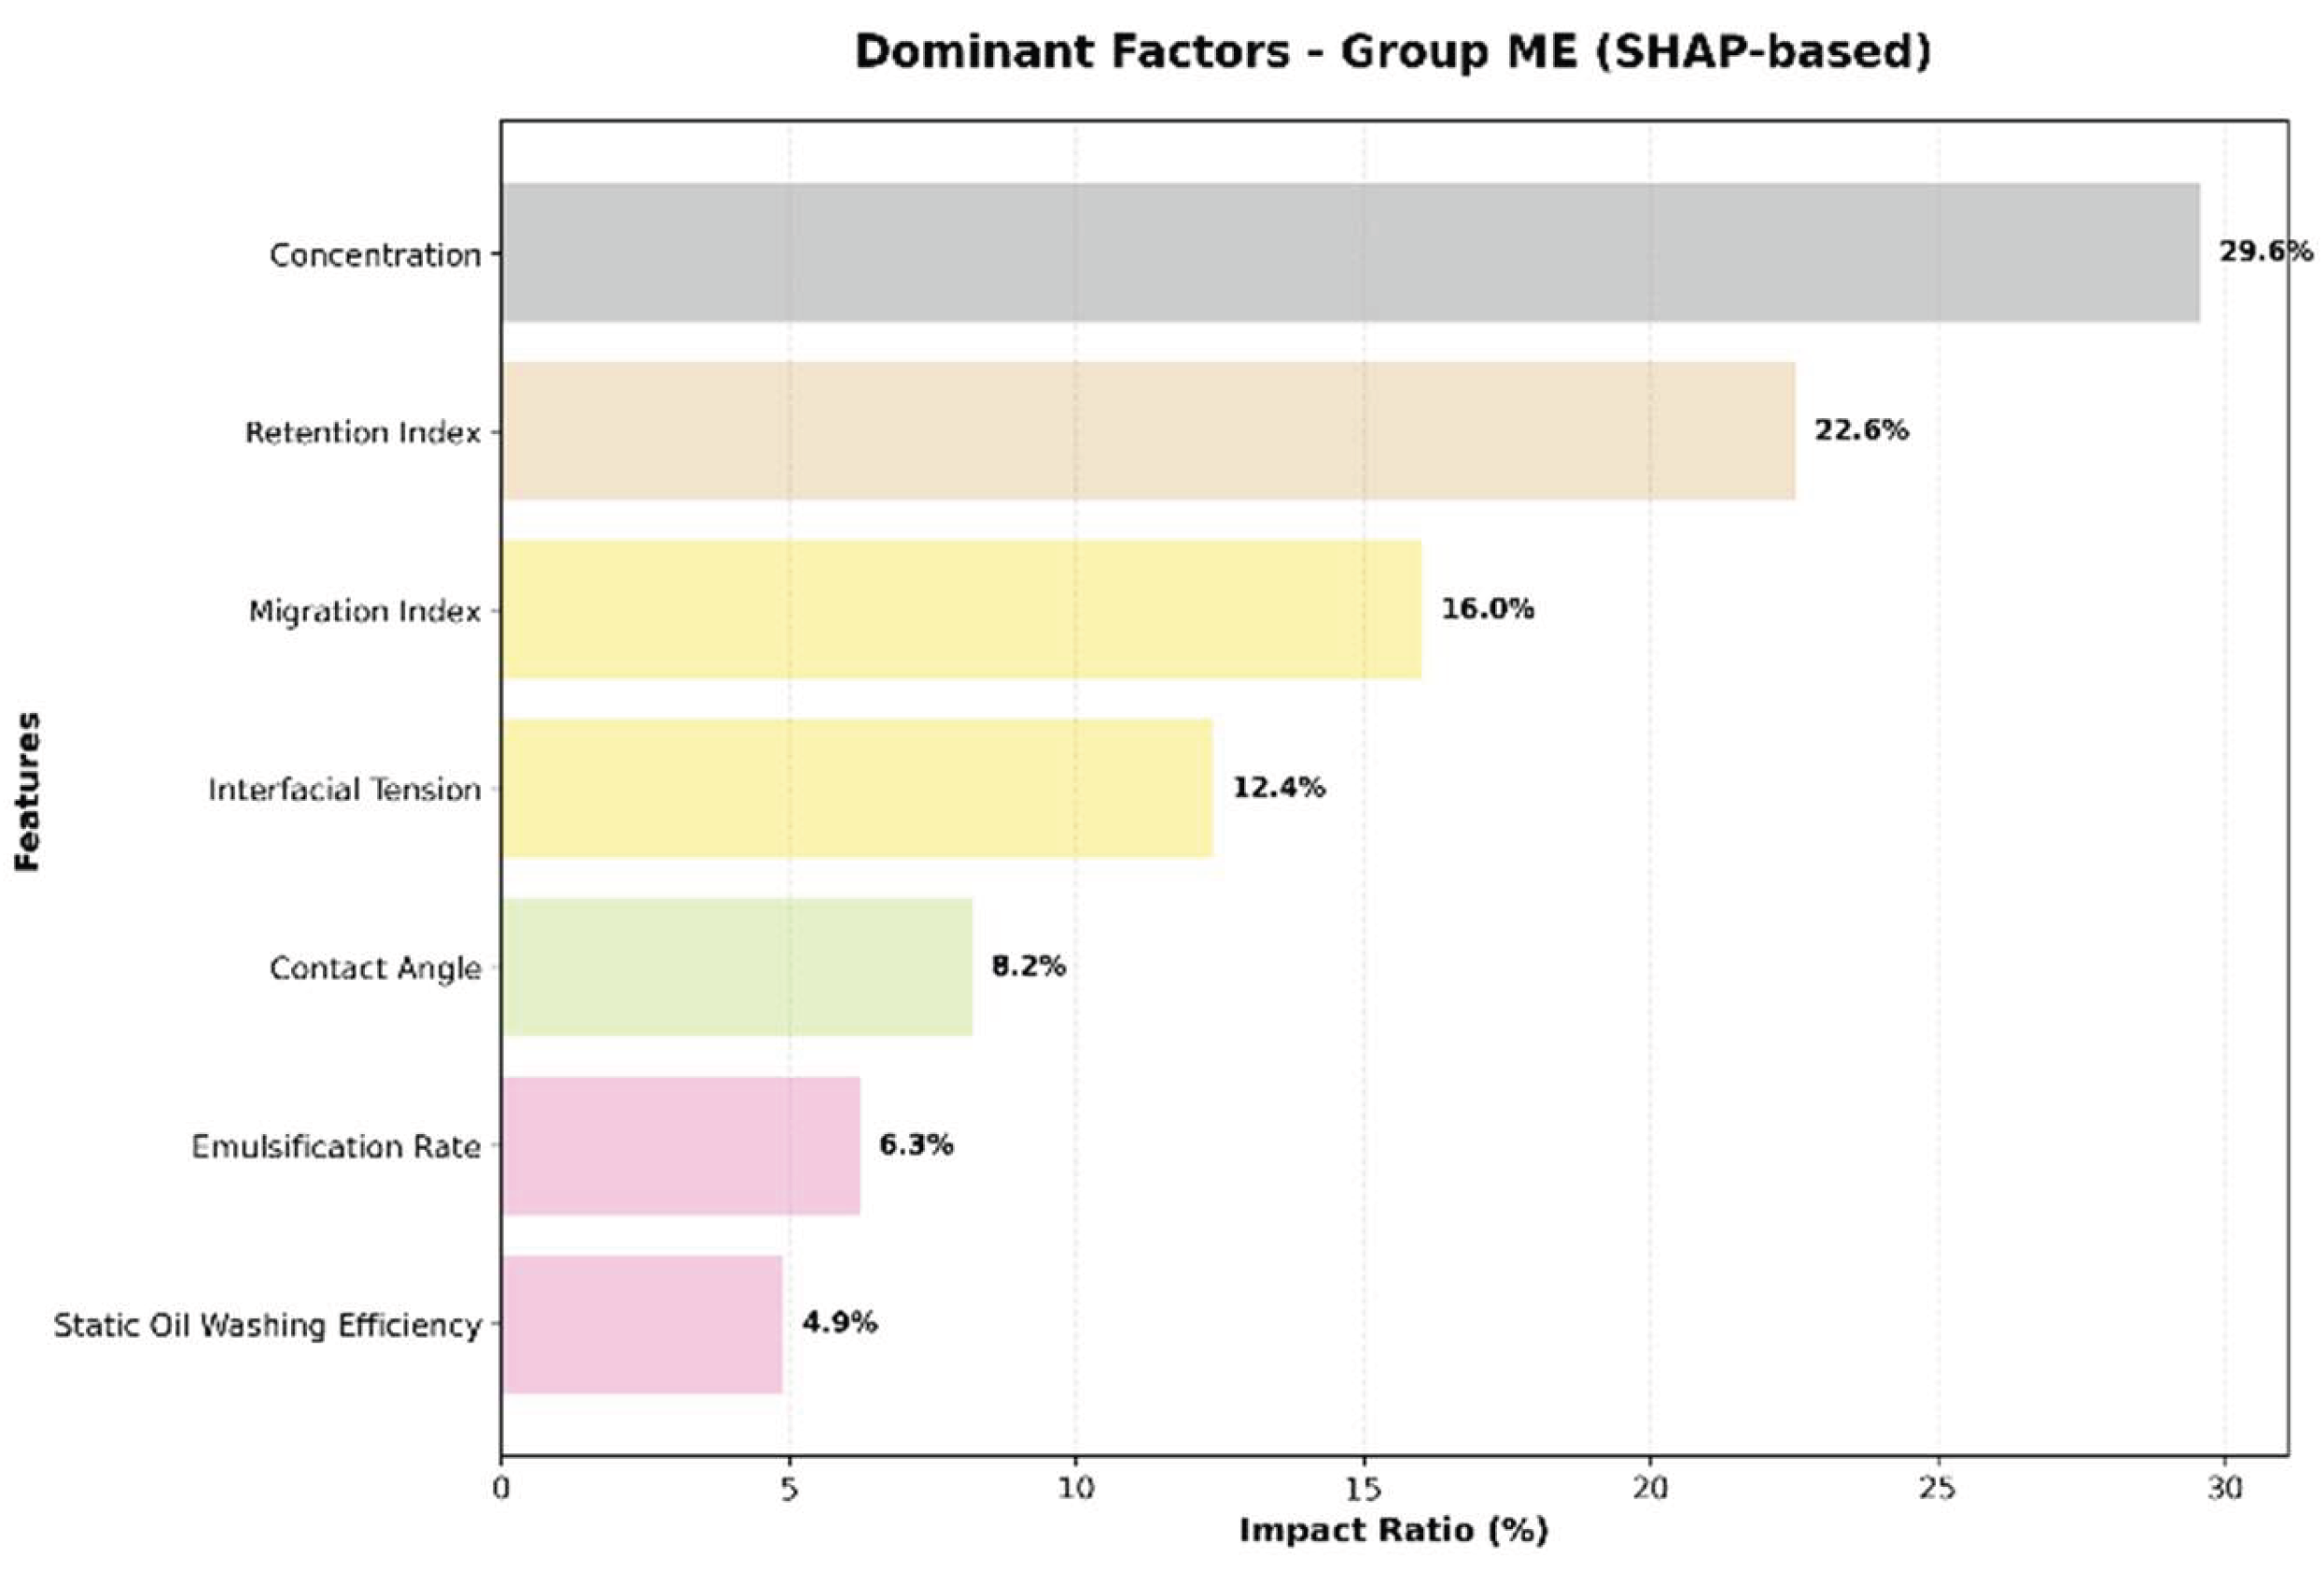
Z1Z2 Group: The Transport Index (26.78%) and Contact Angle (20.60%) were identified as the most influential factors, suggesting that YSH-Z1 and YSH-Z2 primarily improve oil recovery by enhancing fluid mobility and modifying rock wettability, while concentration played a relatively minor role (11.01%).ME Group: In contrast, concentration (29.59%) and Retention Index (22.55%) were the dominant factors, indicating that the middle-phase microemulsion’s effectiveness is highly dependent on concentration. Low concentrations result in insufficient interfacial activity, while high concentrations may cause retention-induced pore blockage, highlighting the need for precise concentration control.
The chemical concentration was fixed at the optimal value of 0.2258%, determined via grid search across the range of 0.05–0.25% using random forest (RF) predictions. For the remaining features, 50 uniformly distributed sampling points were generated within their experimental ranges, and the corresponding recovery factors were predicted. Response curves showing the relationship between each feature and recovery were plotted, as shown in Figure 17.
Figure 17.
OFAT Sensitivity Analysis.
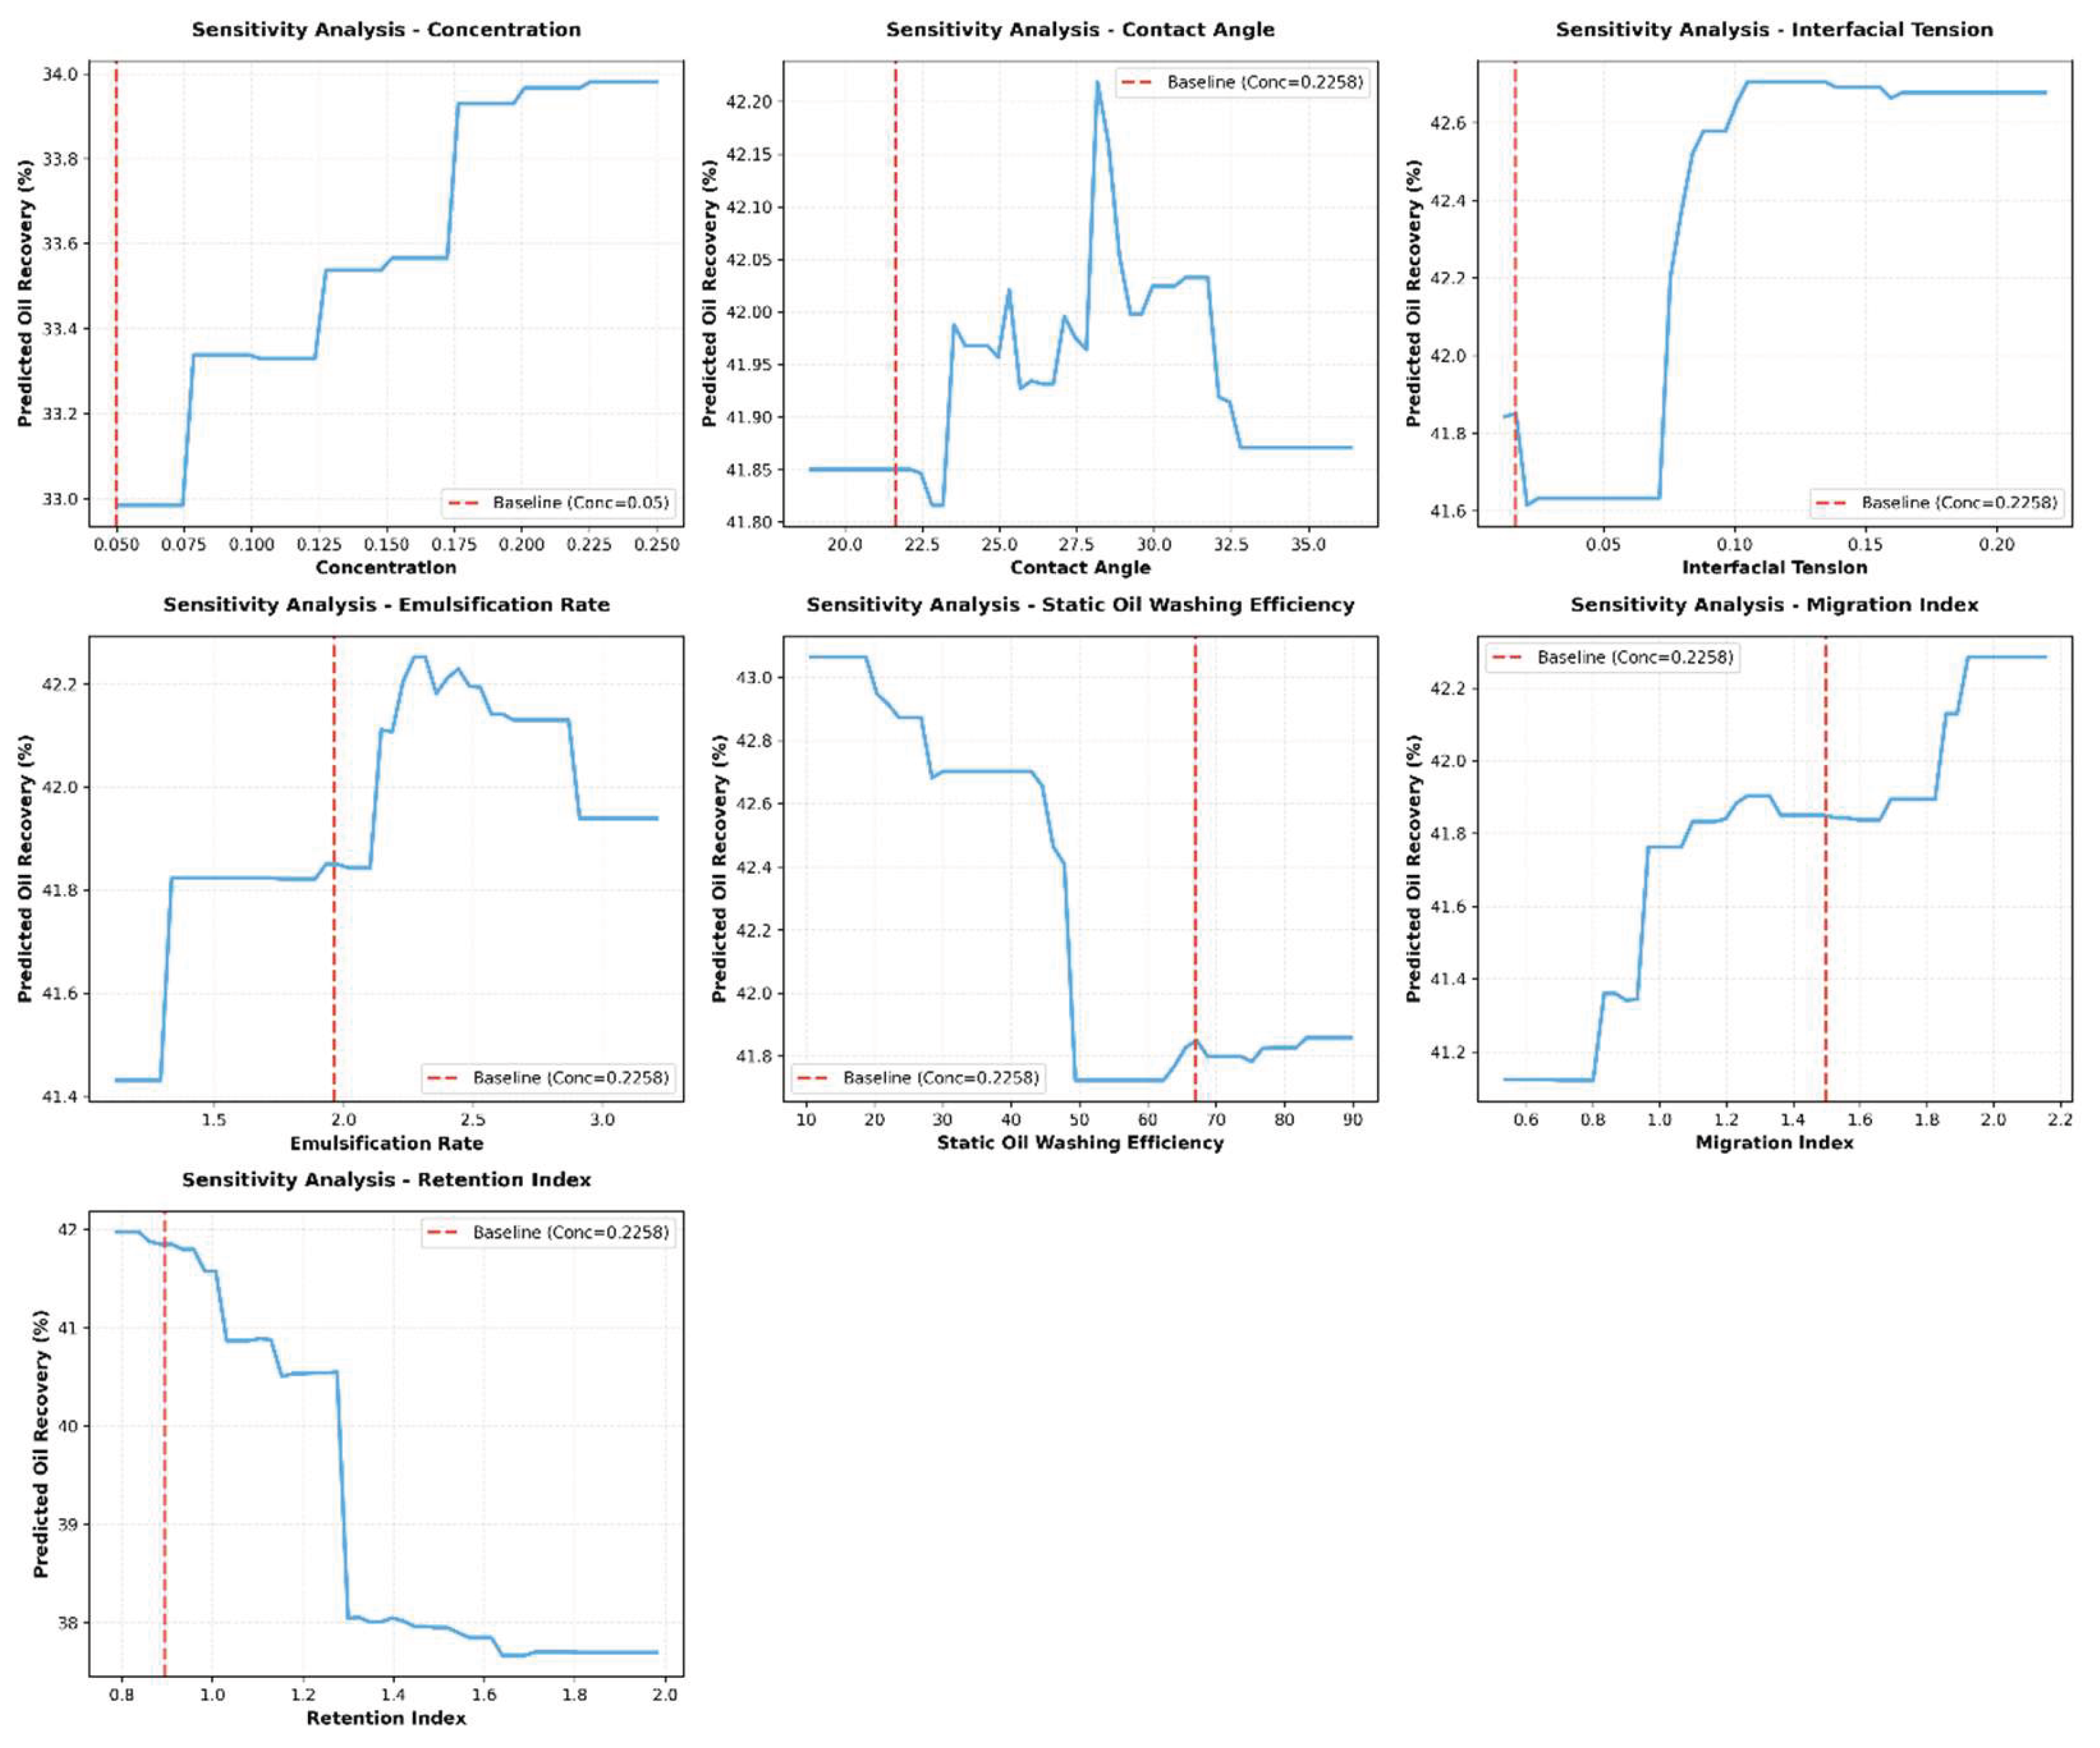
Retention Index: Within 0.8–1.0, recovery increased linearly with higher retention, but plateaued beyond 1.0, suggesting that moderate retention enhances efficiency, while excessive retention provides no further benefit.
Emulsification Rate: Recovery peaked at values between 2.0 and 3.0, with rates of 42.5–43%, while values outside this range led reduced efficiency.
Interfacial Tension: Recovery increased as tension decreased from 0.05 to 0.15 mN/m, but declined at higher values, consistent with the notion that lower interfacial tension enhances oil mobilization, although excessively low values may cause over-emulsification and impair flow.
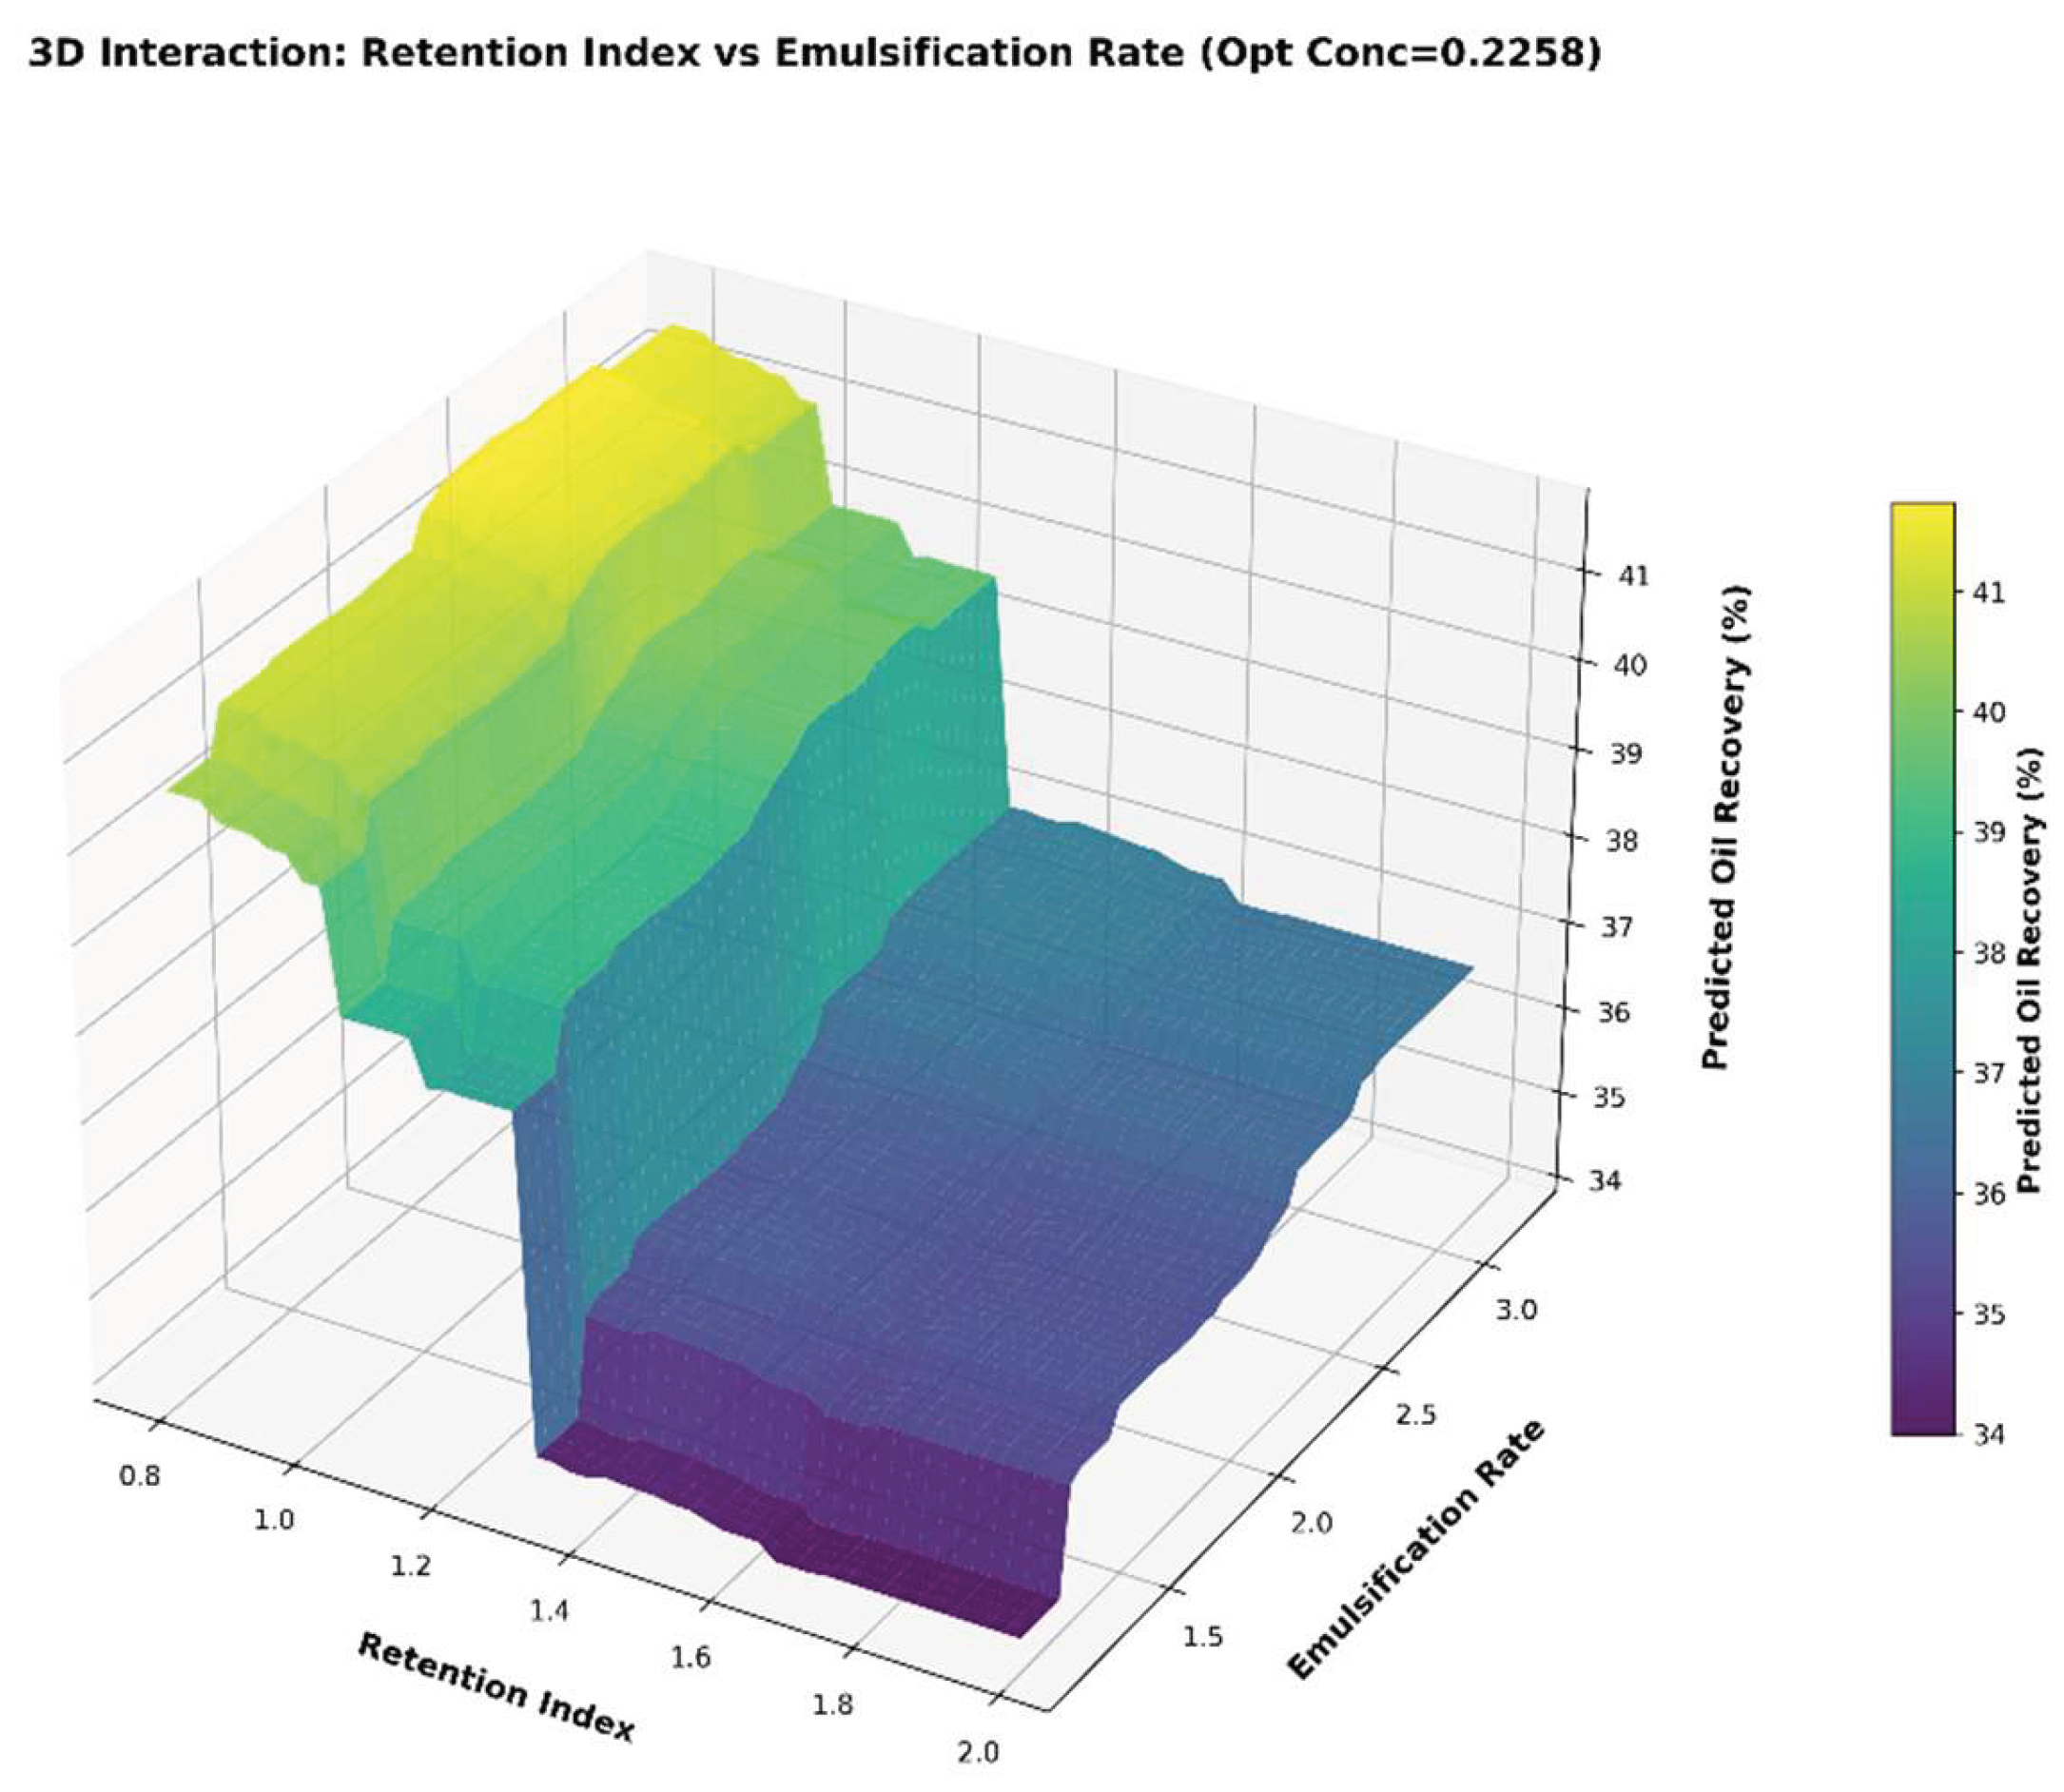
The two most influential features—Retention Index and Emulsification Rate—were selected to construct a parameter grid, and a 3D interaction plot was generated (Figure 17).
The results indicate that the recovery factor peaked at 43.0–43.5% when the Retention Index was between 0.8 and 1.0 and the Emulsification Rate ranged from 2.5 to 3.0. This highlights a synergistic interaction between the two factors: moderate retention extends the chemical agent’s residence time, while a high emulsification rate enhances crude oil dispersion. Together, these effects led to a significant improvement in oil recovery.
In contrast, recovery remained below 41.0% when the Retention Index exceeded 1.2 or the Emulsification Rate fell below 1.5, even when the other parameter was optimized. These findings underscore the importance of synergistic optimization across multiple parameters, demonstrating that optimizing a single factor alone is insufficient to achieve maximum recovery.
Figure 18.
Multifactor Interaction Analysis.
Based on the results of the Random Forest (RF) model and sensitivity analysis, appropriate ranges were established for each feature (e.g., concentration: 0.05%–0.25%; contact angle: 20–60°).A random search approach was used to generate 20,000 parameter combinations. The recovery factor for each combination was predicted using the RF model, and the parameter set yielding the highest predicted recovery was selected. The results are shown in Table 6, the distribution of the optimal parameter set can be analyzed
Figure 19.
Distribution of Top 100 Optimal Combinations. (Retention Index vs Emulsification Rate).
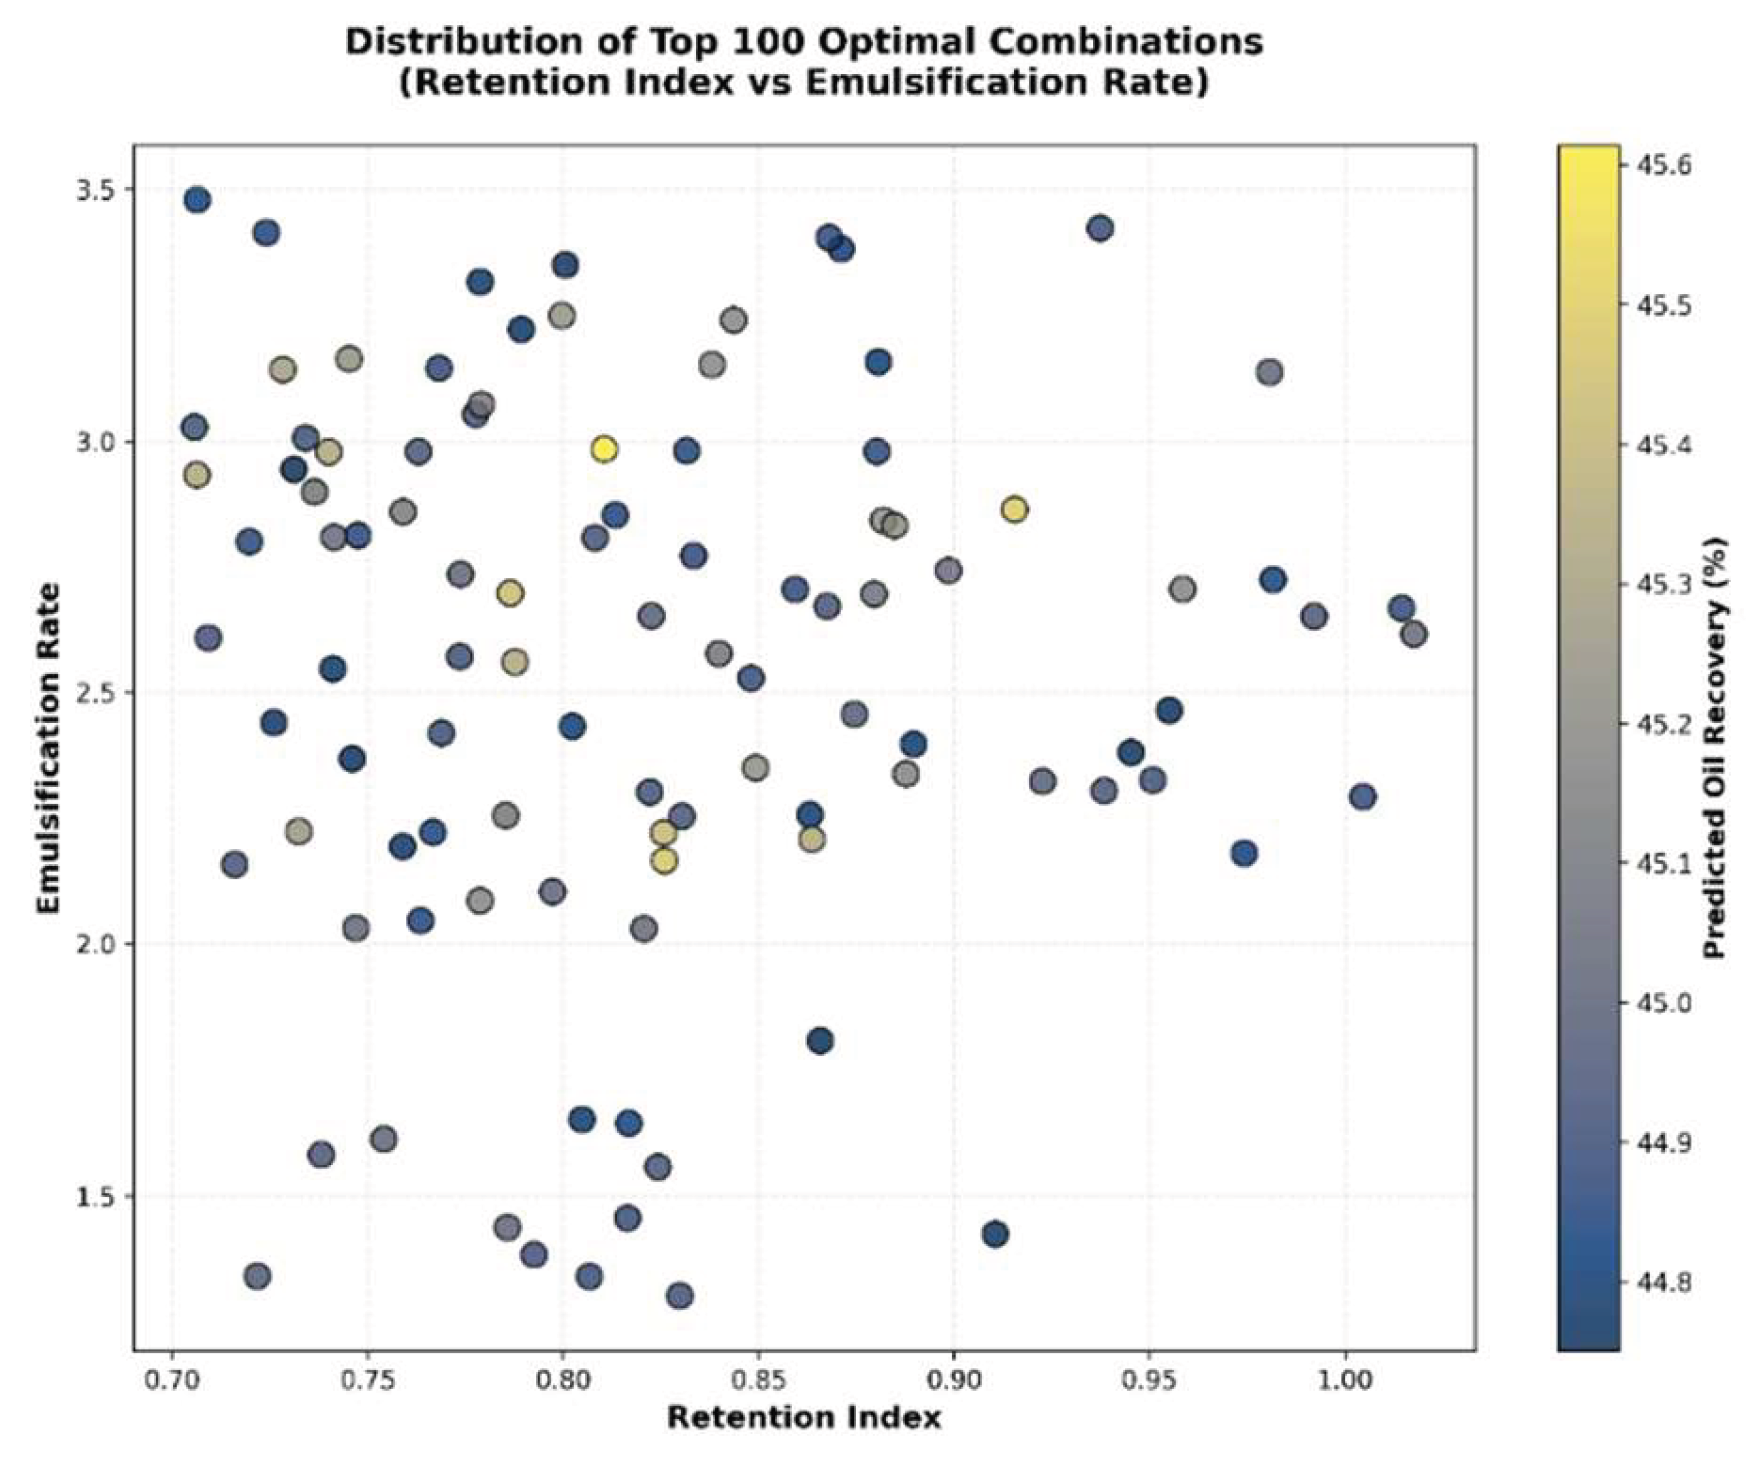
To validate the predictive accuracy of the algorithm, a field test was conducted in Block X of the Changqing Oilfield. The recovery factor increased from 39% to 45%, confirming the accuracy of the algorithm’s predictions and demonstrating its practical utility in field applications.
5. Conclusion
1.The Random Forest (RF) model outperforms Linear Regression, Support Vector Regression, XGBoost, and Gradient Boosting Regression in recovery prediction. With the lowest MAE (2.8007%), MAPE (7.4107%), RMSE (3.3111%), and the only non-negative R² (0.0454), it effectively captures the nonlinear relationships between input parameters and recovery, making it the optimal model for natural core recovery prediction.
2.Feature importance varies globally and across surfactant groups. Globally, the Retention Index is the dominant factor (49.79% contribution), directly determining crude oil transport efficiency. For the Z1Z2 group (YHS-Z1 and YHS-Z2), the Transport Index (26.78%) and Contact Angle (20.60%) are key, while the middle-phase microemulsion (ME) group is most influenced by Concentration (29.59%) and Retention Index (22.55%), requiring targeted optimization strategies.
3.Both single and combined parameters exhibit threshold and synergistic effects on recovery. For example, the Retention Index enhances recovery linearly within 0.8–1.0 but plateaus beyond 1.0, and the Emulsification Rate peaks at 2.0–3.0. Their synergistic optimization (Retention Index: 0.8–1.0, Emulsification Rate: 2.5–3.0) achieves the best recovery, highlighting the necessity of multi-parameter coordination.
4.The optimal parameter combination identified via random search (Concentration: 0.2925%, Contact Angle: 28.2338°, Interfacial Tension: 0.1140 mN/m, etc.) predicts a recovery rate of 45.61%, a 6.57% improvement over the highest experimental value. This provides a quantitative basis for surfactant formulation adjustment and field application.
Practically, the optimal parameter combination and key controlling factors identified can directly guide surfactant formulation adjustment and injection scheme optimization in low-permeability reservoir development, reducing field trial-and-error costs. Future research will incorporate fracture-related parameters into the RF model and expand the study scope to reservoirs with different geological characteristics, further improving the technology’s adaptability and accuracy.
Acknowledgments
We acknowledge the financial support from the Major National Science and Technology Program for Oil and Gas (Grant No. 2025ZD1405400).
References
- Ahmadi, M A; Shadizadeh, S R. Implementation of a high-performance surfactant for enhanced oil recovery from carbonate reservoirs[J]. Journal of Petroleum Science and Engineering 2013, 110, 66–73. [Google Scholar] [CrossRef]
- Ahmadi, M A; Bahadori, A; Shadizadeh, S R. A rigorous model to predict the amount of surfactant required for desired recovery in surfactant flooding process[J]. Fuel 2015, 139, 421–428. [Google Scholar]
- Alvarado, V; Manrique, E. Enhanced oil recovery: An update review[J]. Energies 2010, 3(9), 1529–1575. [Google Scholar] [CrossRef]
- Bian, X Q; Han, B; Du, Z M; et al. Integrating support vector regression with genetic algorithm for CO2-oil minimum miscibility pressure (MMP) in pure and impure CO2 streams[J]. Fuel 2016, 182, 550–557. [Google Scholar] [CrossRef]
- Chaikine, I A; Gates, I D. A machine learning model for predicting multi-stage horizontal well production[J]. Journal of Petroleum Science and Engineering 2021, 198, 108133. [Google Scholar] [CrossRef]
- Cheraghi, Y; Kord, S; Mashayekhizadeh, V. Application of machine learning techniques for selecting the most suitable enhanced oil recovery method; challenges and opportunities[J]. Journal of Petroleum Science and Engineering 2021, 205, 108761. [Google Scholar] [CrossRef]
- Gandomkar, A; Kharrat, R; Motealleh, M; et al. An experimental investigation of foam for gas mobility control in a low-temperature fractured carbonate reservoir[J]. Petroleum science and technology 2012, 30(10), 976–985. [Google Scholar] [CrossRef]
- Hirasaki, G J; Miller, C A; Puerto, M. Recent advances in surfactant EOR[J]. SPE Journal 2011, 16(4), 889–907. [Google Scholar] [CrossRef]
- Hou, J; Liu, Z; Zhang, S; et al. The role of viscoelasticity of alkali/surfactant/polymer solutions in enhanced oil recovery[J]. Journal of Petroleum Science and Engineering 2005, 47(3-4), 219–235. [Google Scholar] [CrossRef]
- International Energy Agency. World Energy Outlook 2023[R]; IEA Publications: Paris, 2023. [Google Scholar]
- Jia, C; Zou, C; Li, J; et al. Evaluation criteria, major types, characteristics and resource prospects of tight oil in China[J]. Petroleum Research 2016, 1(1), 1–9. [Google Scholar] [CrossRef]
- Kamal, M S; Hussein, I A; Sultan, A S. Review on surfactant flooding: phase behavior, retention, IFT, and field applications[J]. Energy & Fuels 2017, 31(8), 7701–7720. [Google Scholar]
- Lake, L W; Johns, R T; Rossen, W R; et al. Fundamentals of Enhanced Oil Recovery[M]; Society of Petroleum Engineers: Richardson, Texas, 2014. [Google Scholar]
- Liu, X; Li, C; Zhang, Y; et al. Research on Surfactant Flooding Technology for Ultra-Low Permeability Reservoirs, Ordos Basin[C]//International Field Exploration and Development Conference; Springer Nature Singapore: Singapore; Volume 2024, pp. 1345–1363.
- Motealleh, M; Kharrat, R; Gandomkar, A; et al. An experimental study on the applicability of water-alternating-CO2 injection in the secondary and tertiary recovery in one Iranian reservoir[J]. Petroleum science and technology 2012, 30(24), 2571–2581. [Google Scholar] [CrossRef]
- Meng, S; Fu, Q; Tao, J; et al. Predicting CO2-EOR and storage in low-permeability reservoirs with deep learning-based surrogate flow models[J]. Geoenergy Science and Engineering 2024, 233, 212467. [Google Scholar] [CrossRef]
- Mohaghegh, S D. Recent developments in application of artificial intelligence in petroleum engineering[J]. Journal of Petroleum Technology 2005, 57(4), 86–91. [Google Scholar] [CrossRef]
- Pal, N; Saxena, N; Mandal, A. Studies on the physicochemical properties of synthesized tailor-made gemini surfactants for application in enhanced oil recovery[J]. Journal of Molecular Liquids 2018, 258, 211–224. [Google Scholar] [CrossRef]
- Ramatou, I I; Liu, Z; Li, Y; et al. Pore-scale Mechanisms of Microemulsion Driven Residual Oil in surfactant flooding systems: Phase behavior, Micromodel Visualization, and oil recovery[J]. In Micromodel Visualization, and oil recovery.
- Sheng, J J. Modern Chemical Enhanced Oil Recovery: Theory and Practice[M]; Elsevier, 2010. [Google Scholar]
- Sheng, J J. Status of surfactant EOR technology[J]. Petroleum 2015, 1(2), 97–105. [Google Scholar] [CrossRef]
- Shaikhah, D; Loise, V; Angelico, R; et al. New trends in biosurfactants: from renewable origin to green enhanced oil recovery applications[J]. Molecules 2024, 29(2), 301. [Google Scholar] [CrossRef] [PubMed]
- Standnes, D C; Austad, T. Wettability alteration in chalk: 2. Mechanism for wettability alteration from oil-wet to water-wet using surfactants[J]. Journal of Petroleum Science and Engineering 2000, 28(3), 123–143. [Google Scholar] [CrossRef]
- Taber, J J; Martin, F D; Seright, R S. EOR screening criteria revisited-Part 1: Introduction to screening criteria and enhanced recovery field projects[J]. SPE Reservoir Engineering 1997, 12(3), 189–198. [Google Scholar] [CrossRef]
- Talebian, S H; Masoudi, R; Tan, I M; et al. Foam assisted CO2-EOR: A review of concept, challenges, and future prospects[J]. Journal of Petroleum Science and Engineering 2014, 120, 202–215. [Google Scholar] [CrossRef]
- Tariq, Z; Aljawad, M S; Hasan, A; et al. A systematic review of data science and machine learning applications to the oil and gas industry[J]. Journal of Petroleum Exploration and Production Technology 2021, 11(12), 4339–4374. [Google Scholar] [CrossRef]
- Teixeira, A F; Secchi, A R. Machine learning models to support reservoir production optimization[J]. IFAC-PapersOnLine 2019, 52(1), 498–501. [Google Scholar] [CrossRef]
- Wu, D; Xue, X; Zhou, L. Improving the robustness of tree-based prediction model of oil/water relative permeability through hyperparameter optimization and re-ensemble algorithm[J]. Fuel 2025, 385, 134146. [Google Scholar] [CrossRef]
- Wang, D; Zhang, J; Wang, G; et al. Sweep improvement options for the Daqing oil field[J]. SPE Reservoir Evaluation & Engineering 2009, 12(1), 25–34. [Google Scholar]
- Zhang, J; Zhang, G; Ge, J; et al. Laboratory studies of depressurization with a high concentration of surfactant in low-permeability reservoirs[J]. Journal of dispersion science and technology 2012, 33(11), 1589–1595. [Google Scholar] [CrossRef]
- Zhou, W; Zhang, J; Zhang, L; et al. Experimental study on surfactant flooding in ultra-low permeability reservoirs[J]. Petroleum Science and Technology 2019, 37(5), 518–524. [Google Scholar]
Figure 1.
Molecular structure of chemical agents.
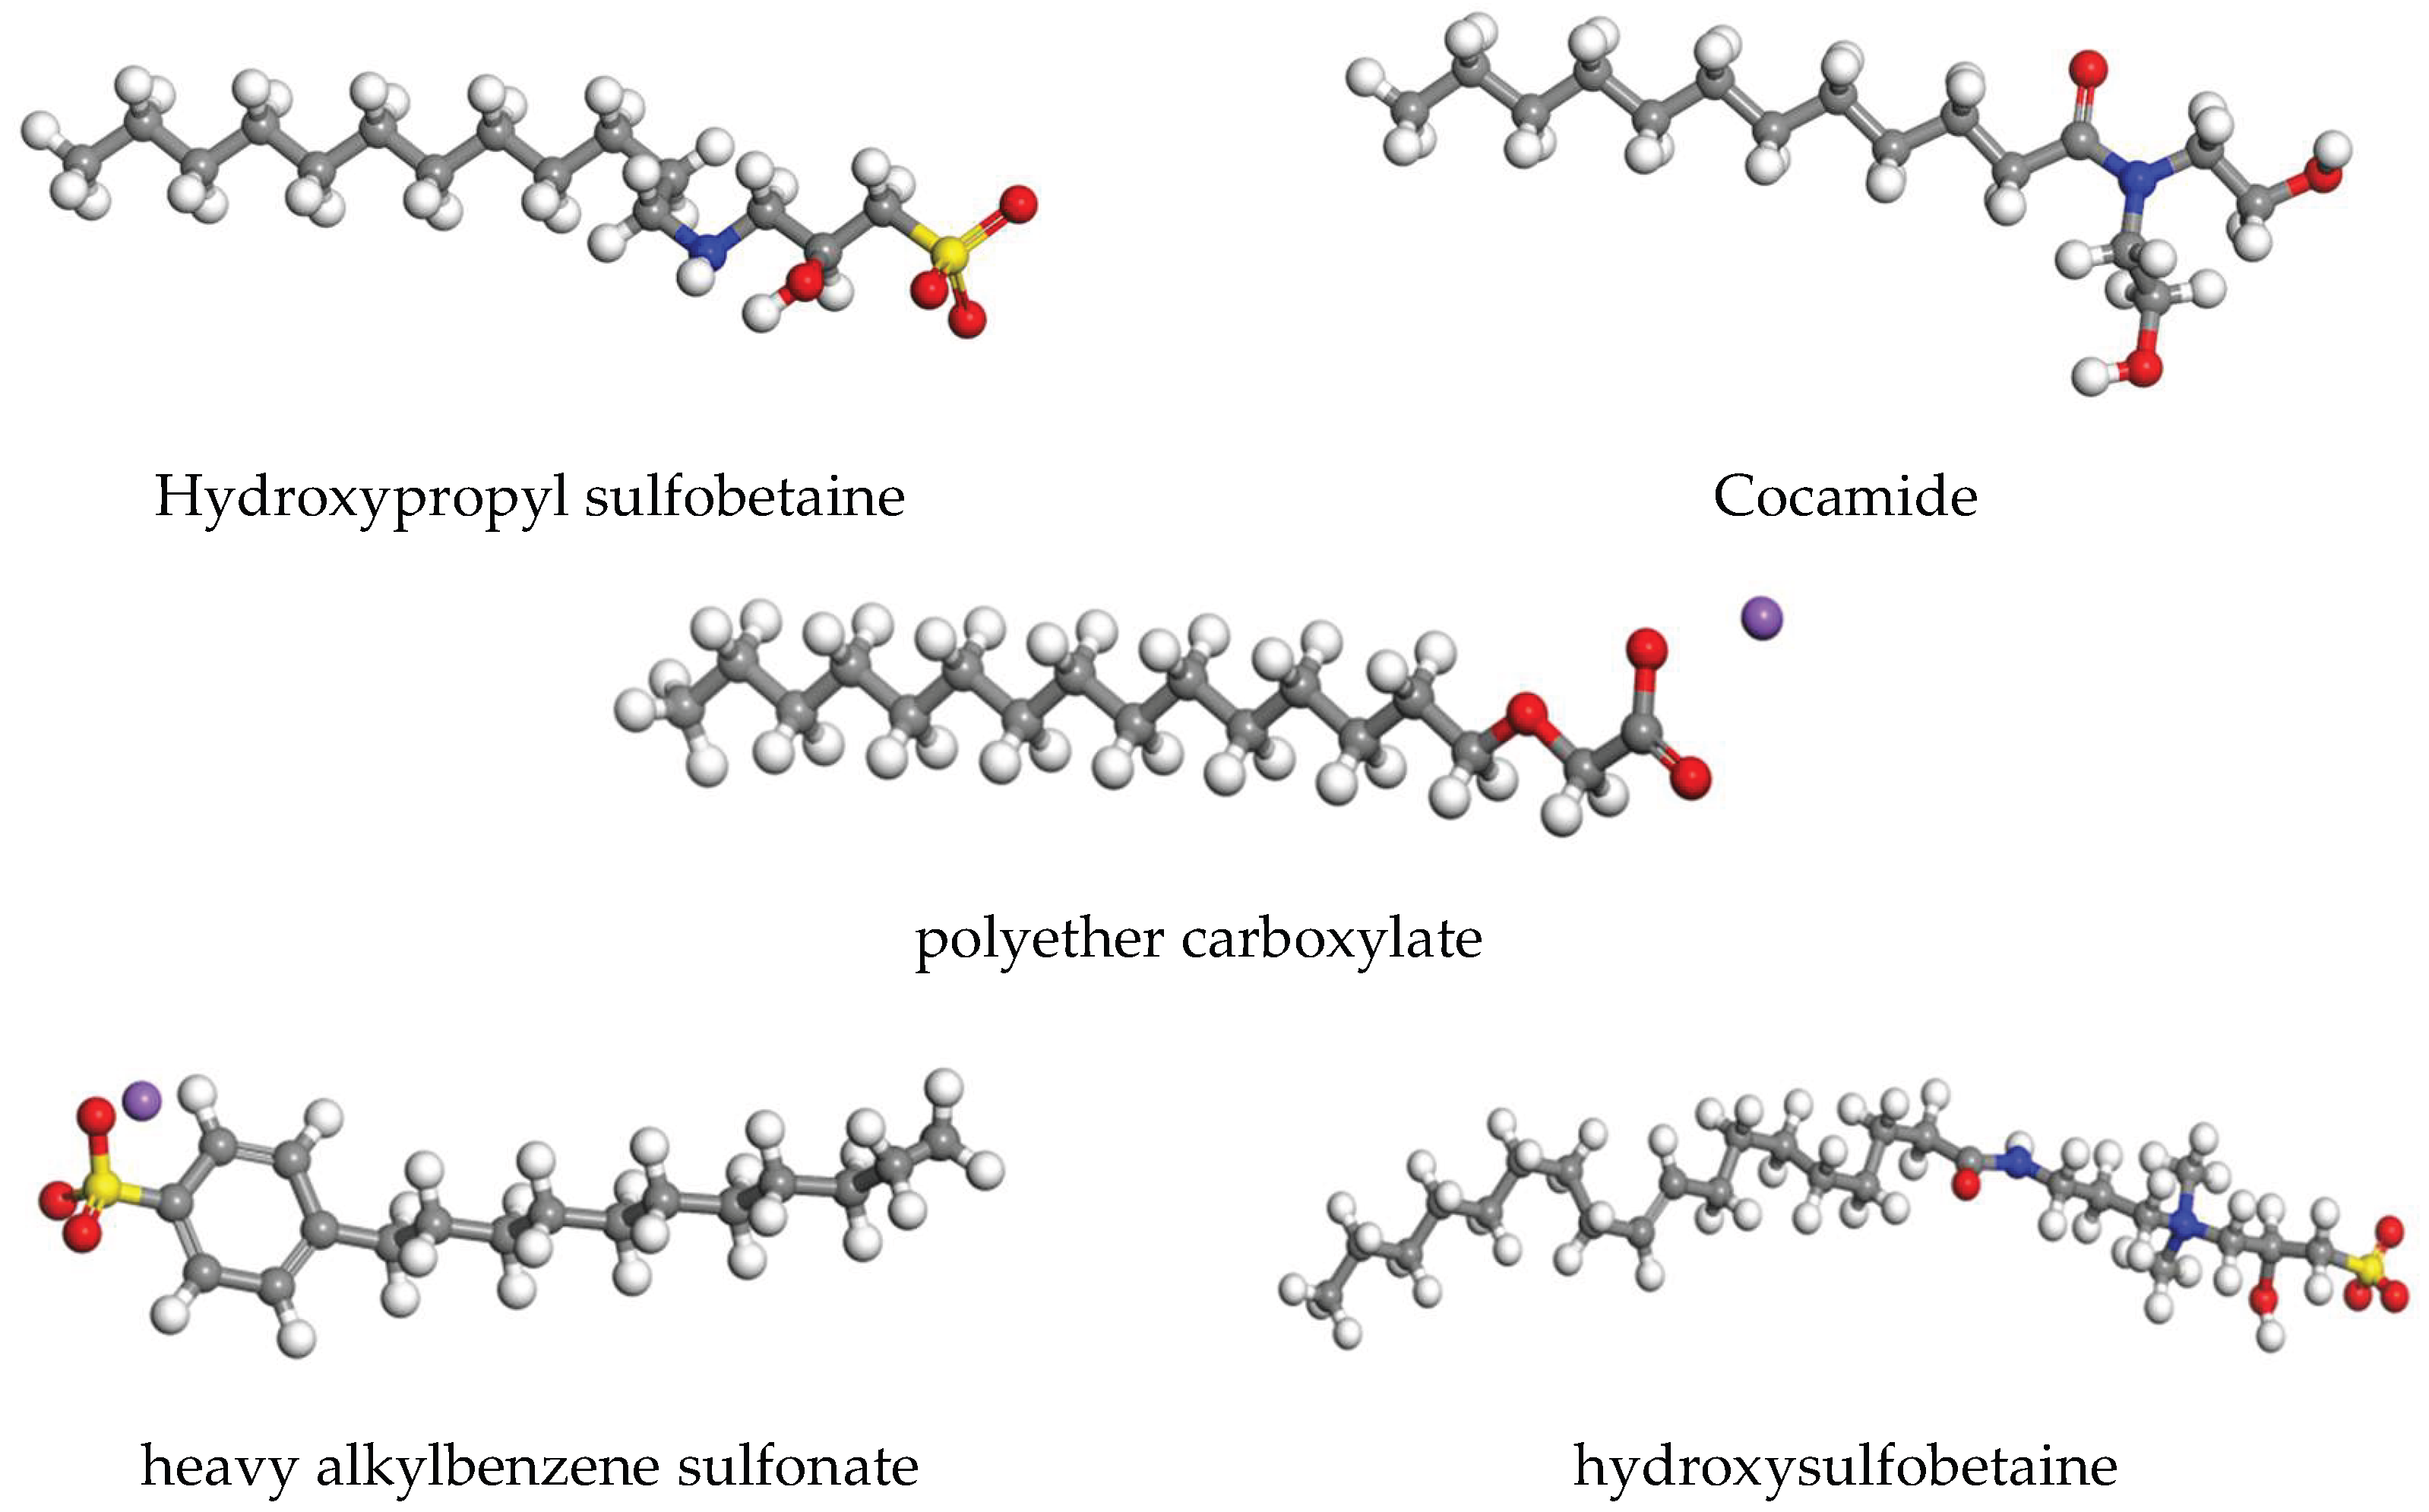
Figure 2.
Core sample diagram.
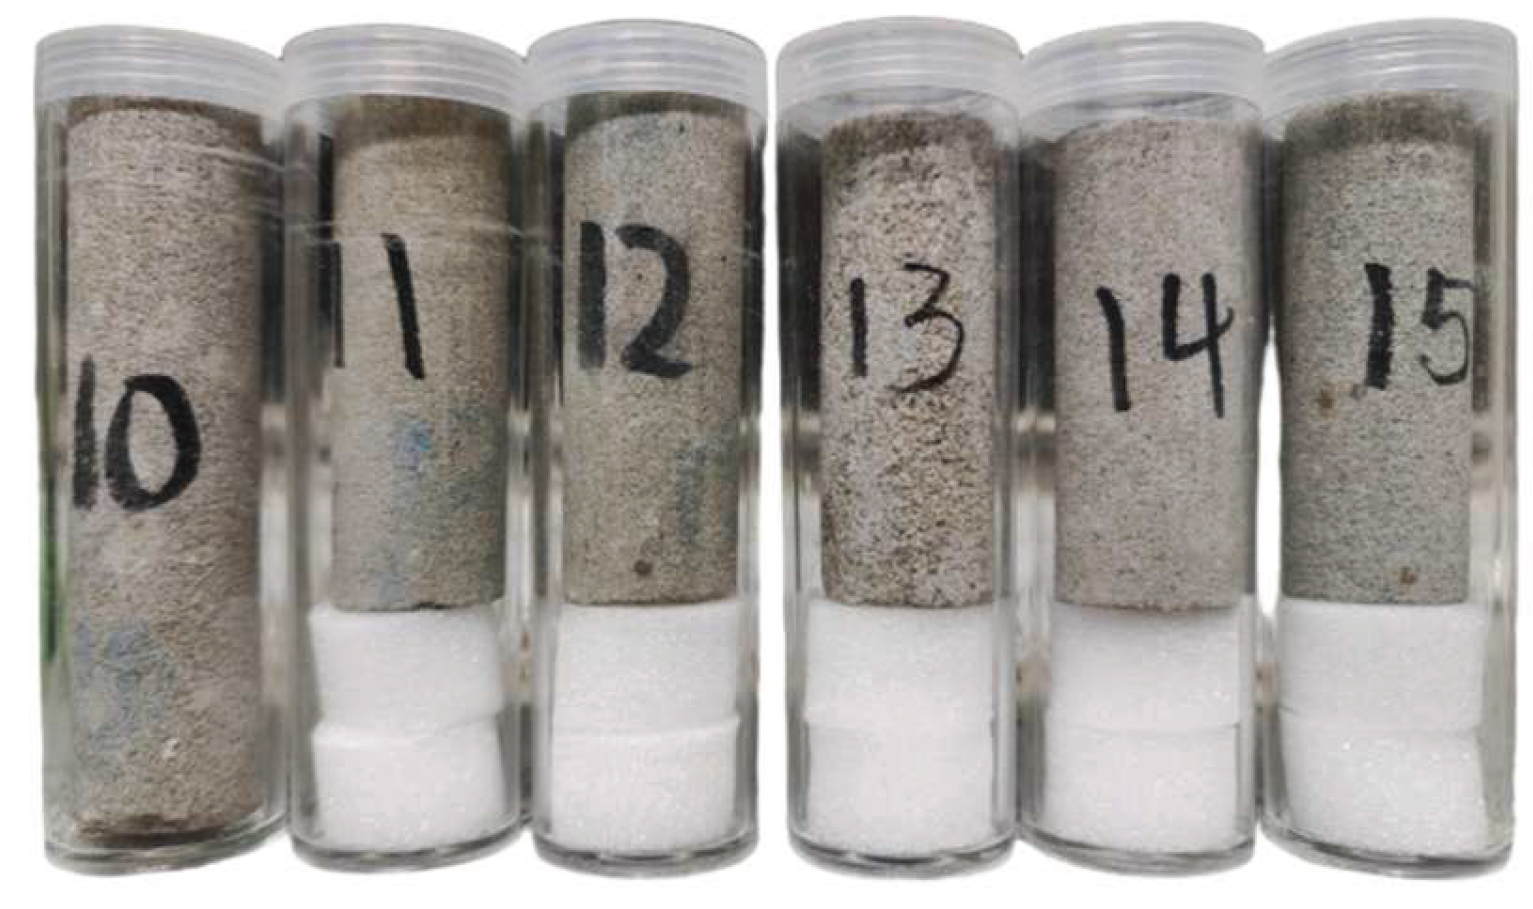
Figure 3.
3. Emulsification migration index device diagram.
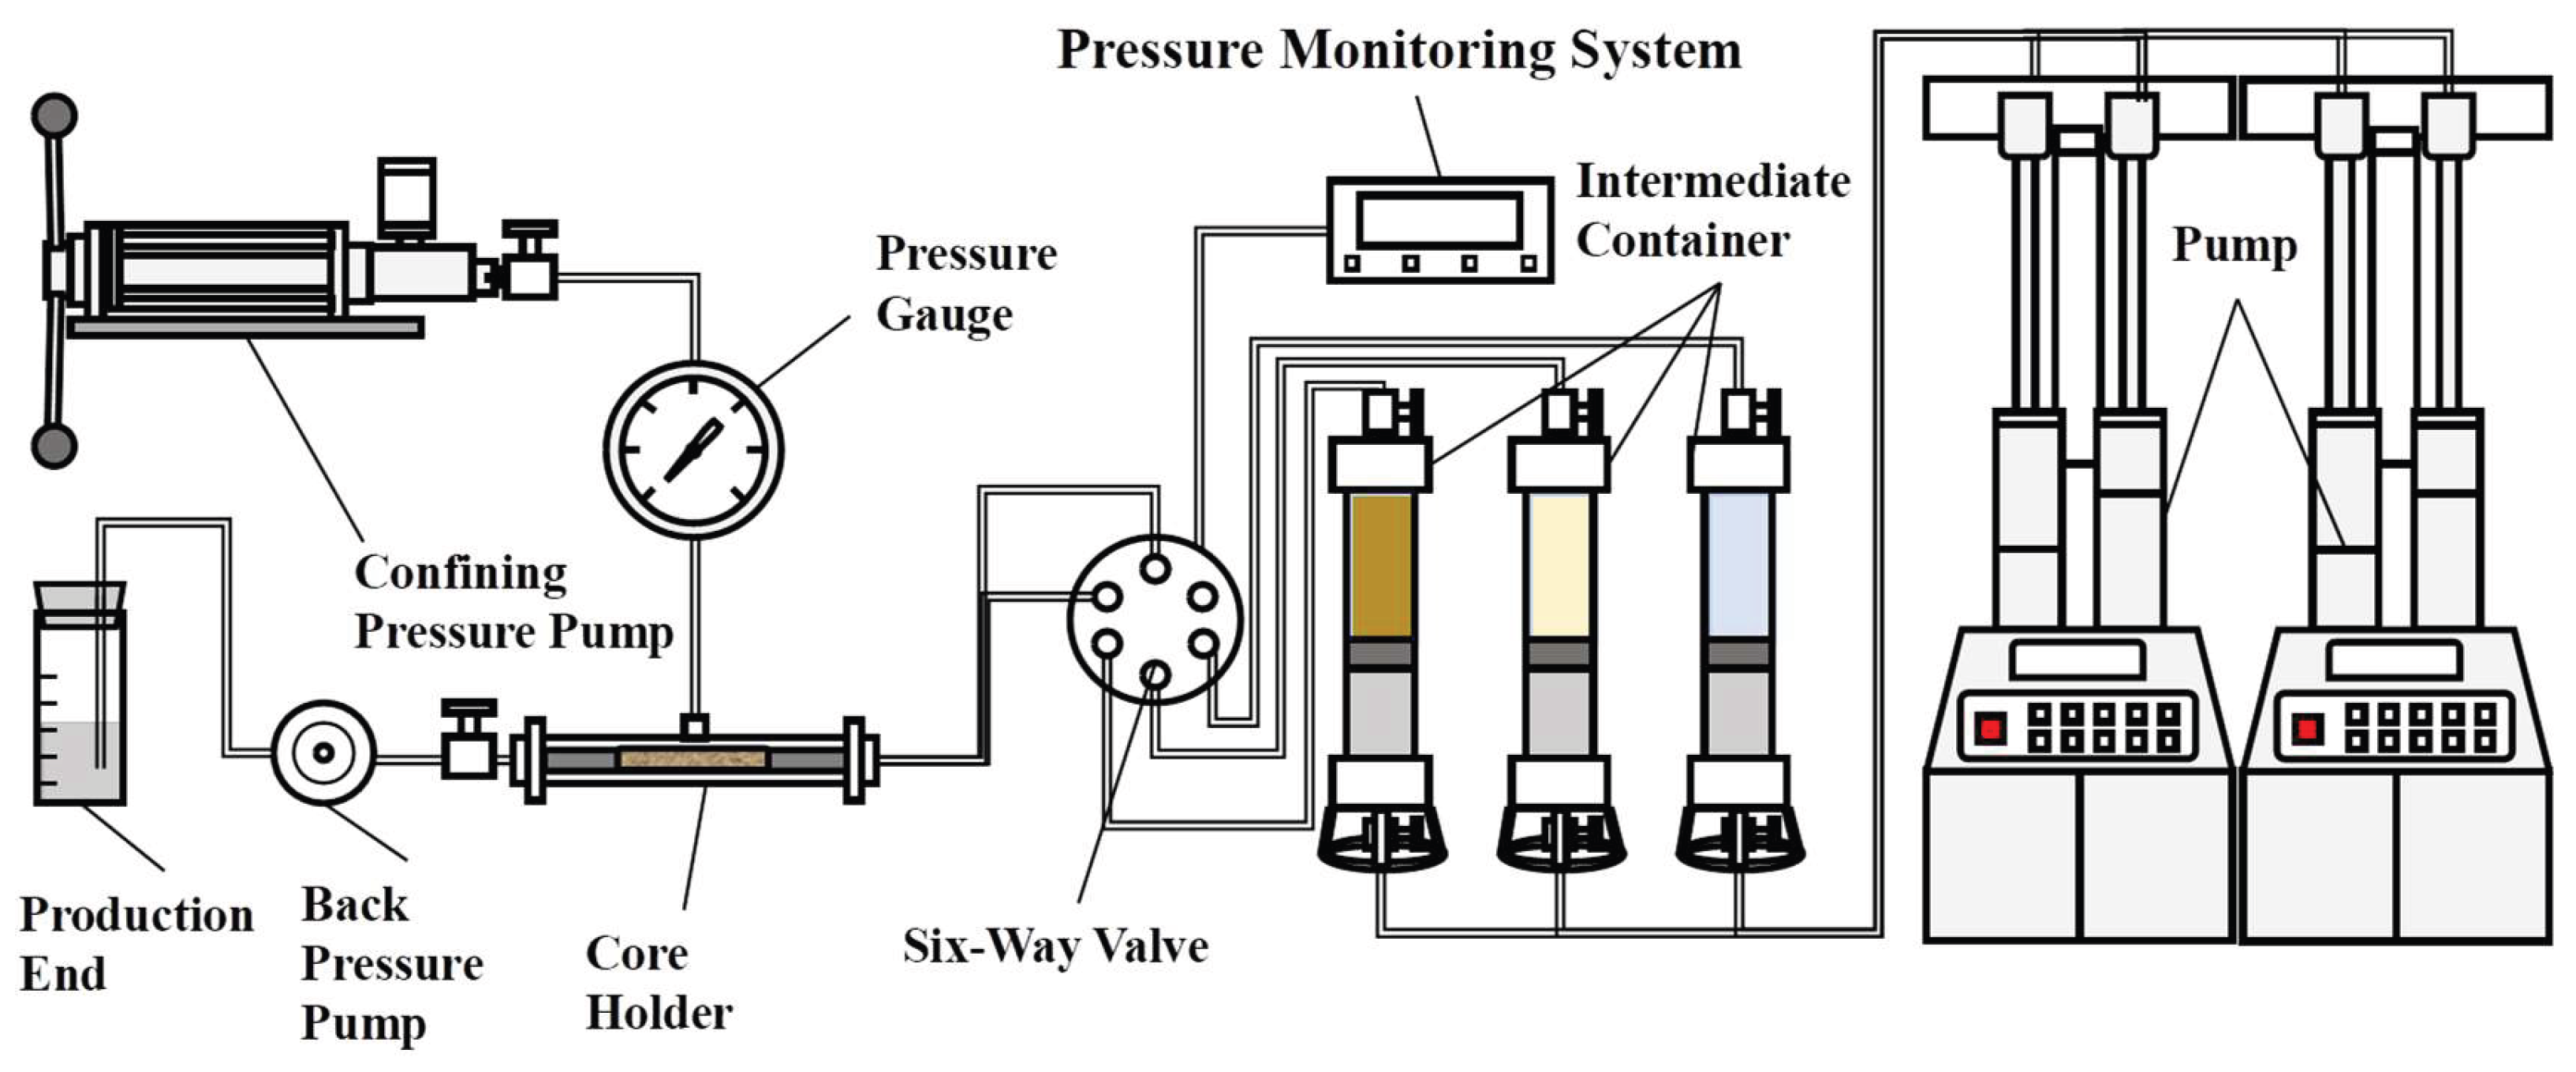
Figure 5.
Wettability change.
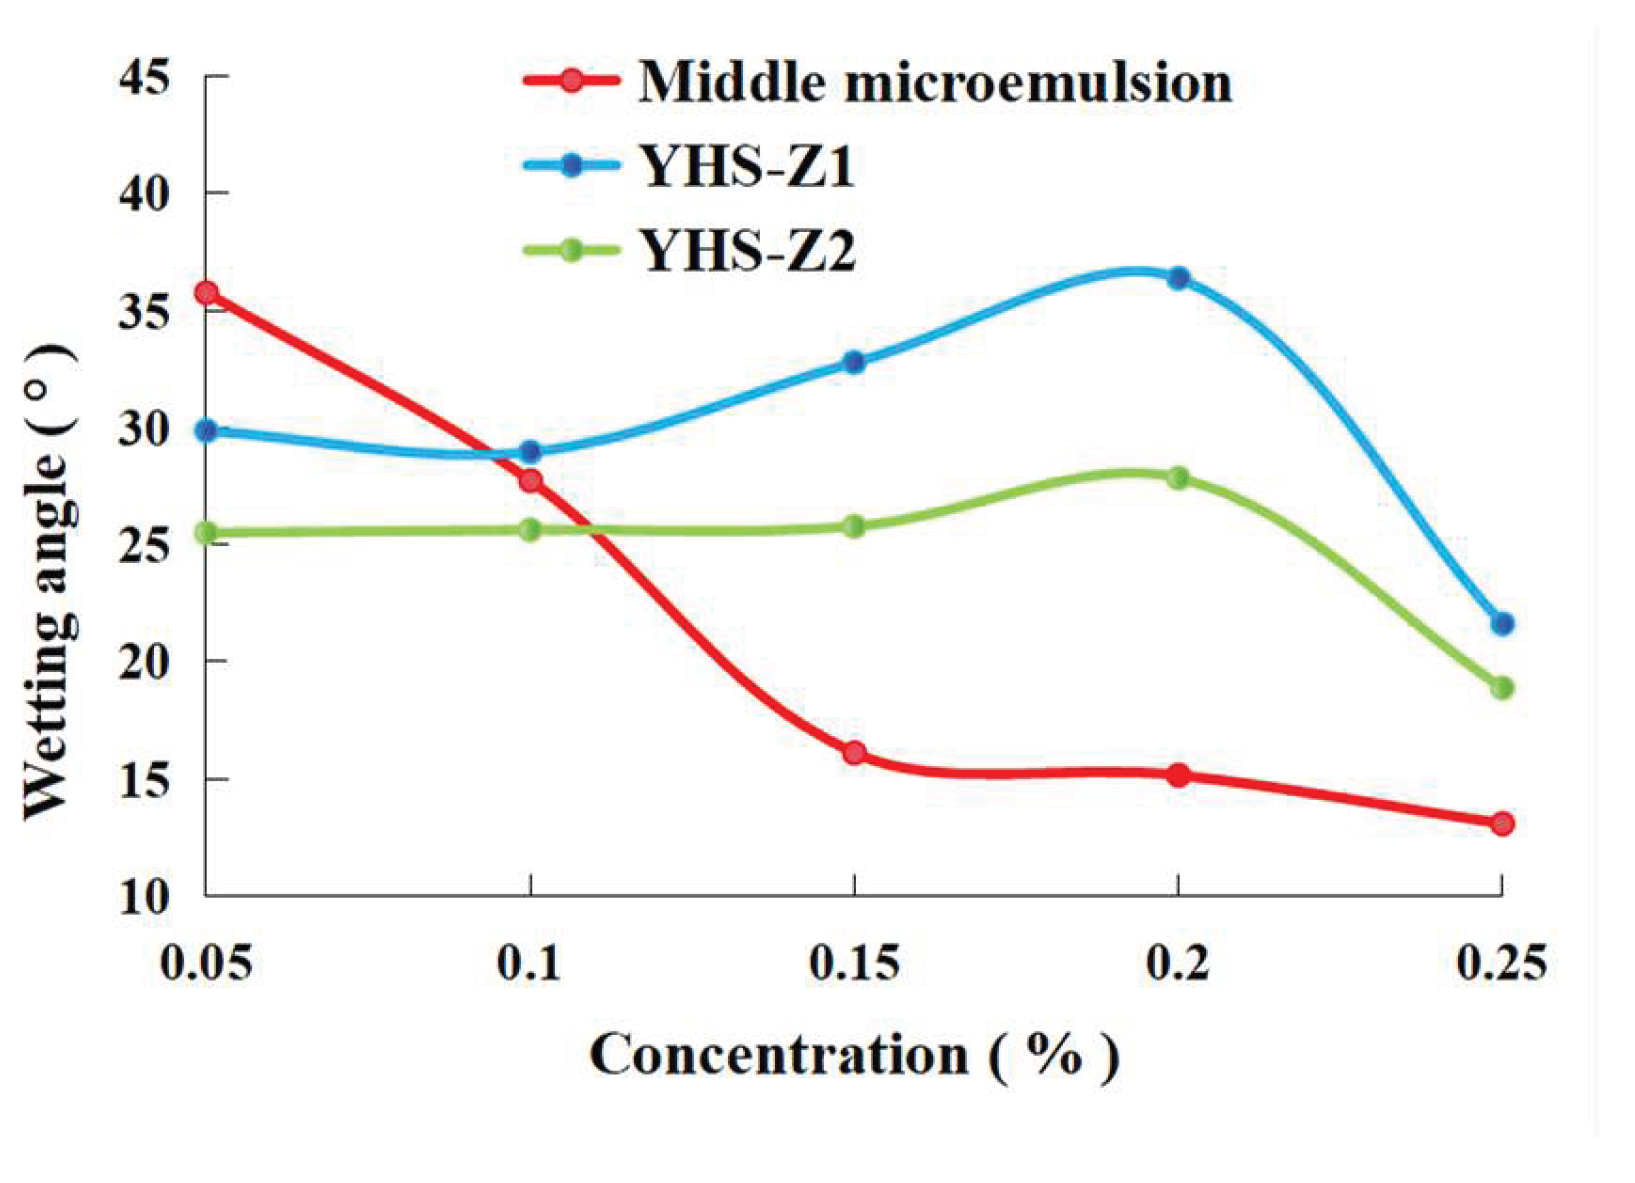
Figure 6.
Change of interfacial tension.
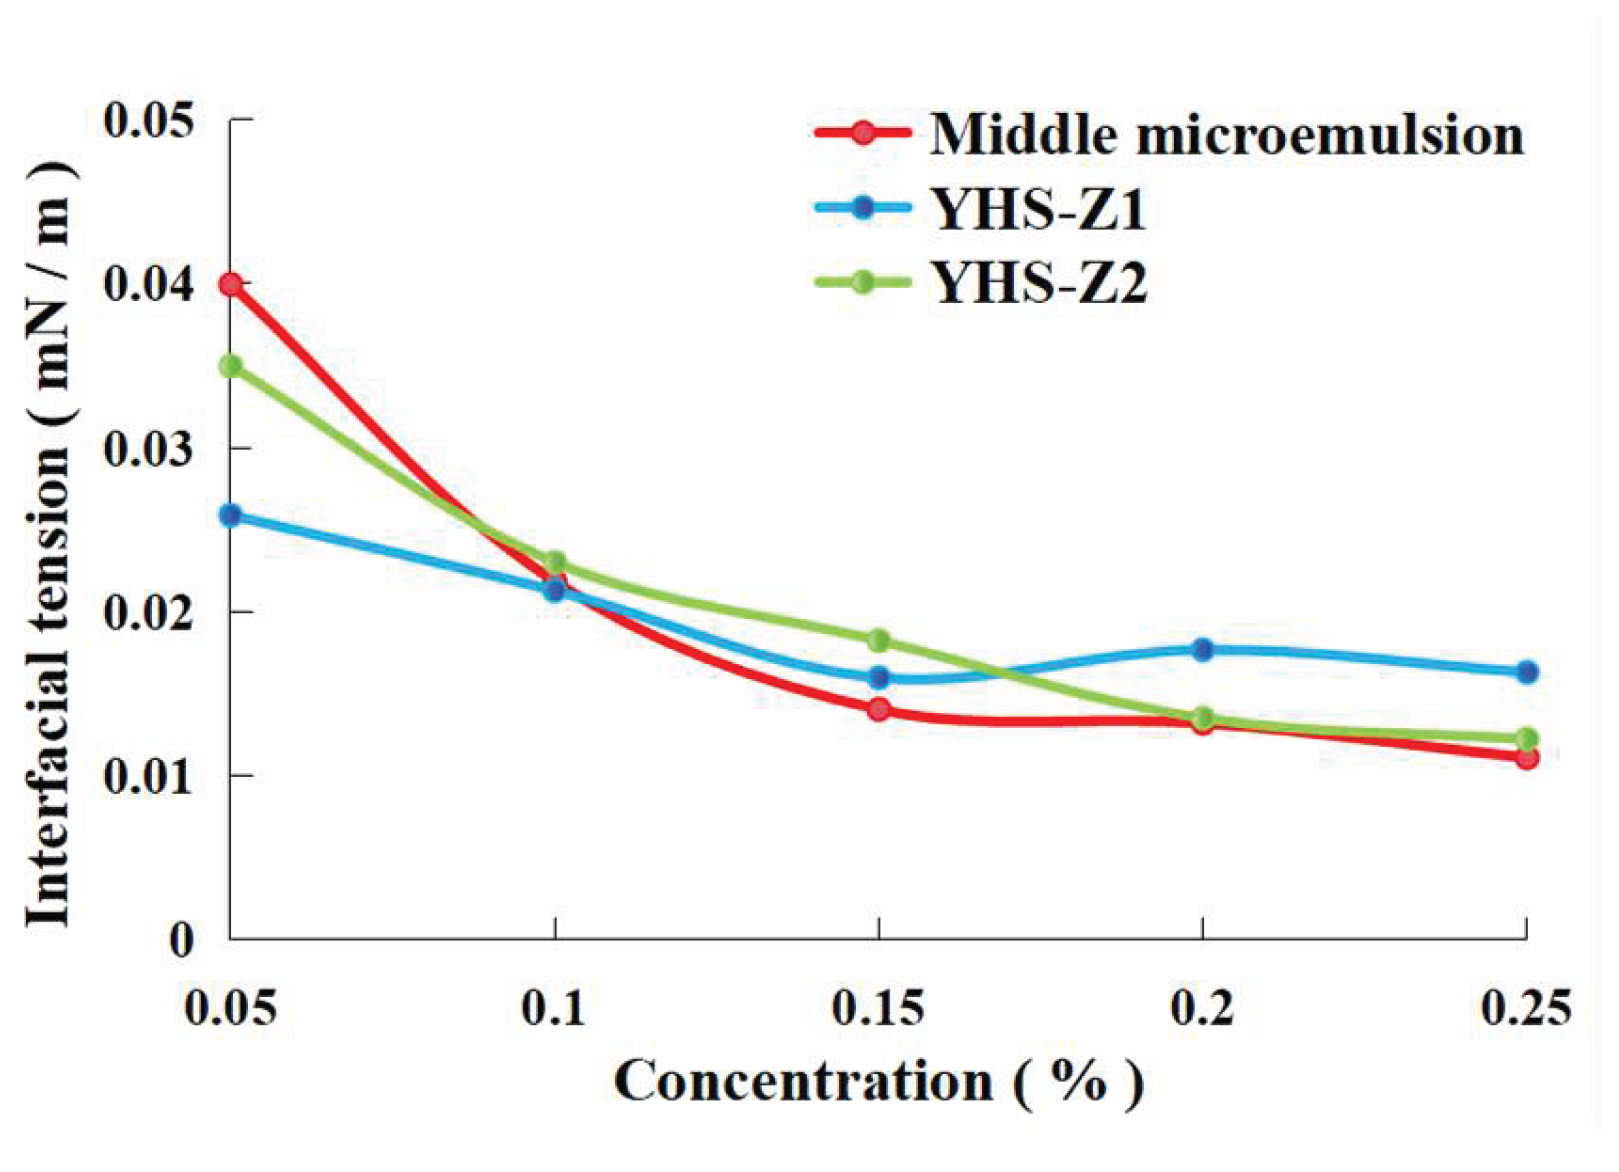
Figure 7.
Static oil washing efficiency.
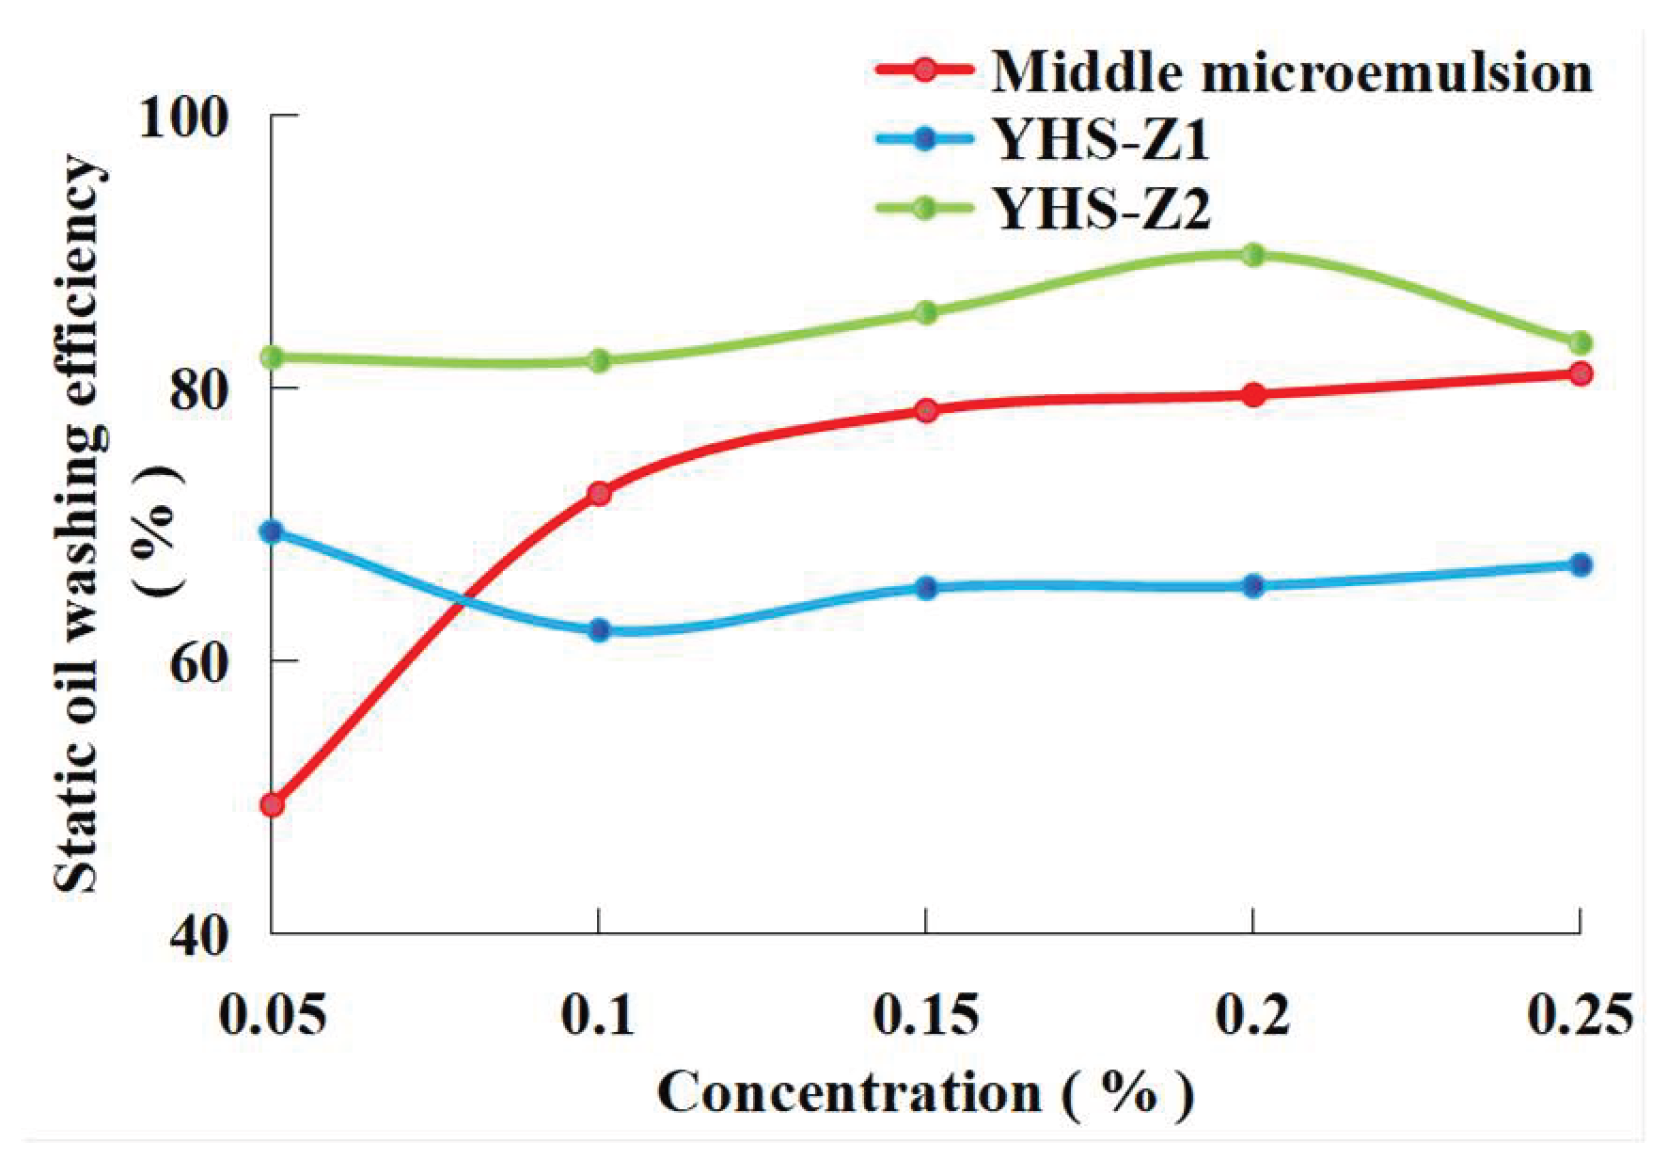
Figure 8.
Dynamic oil washing efficiency.
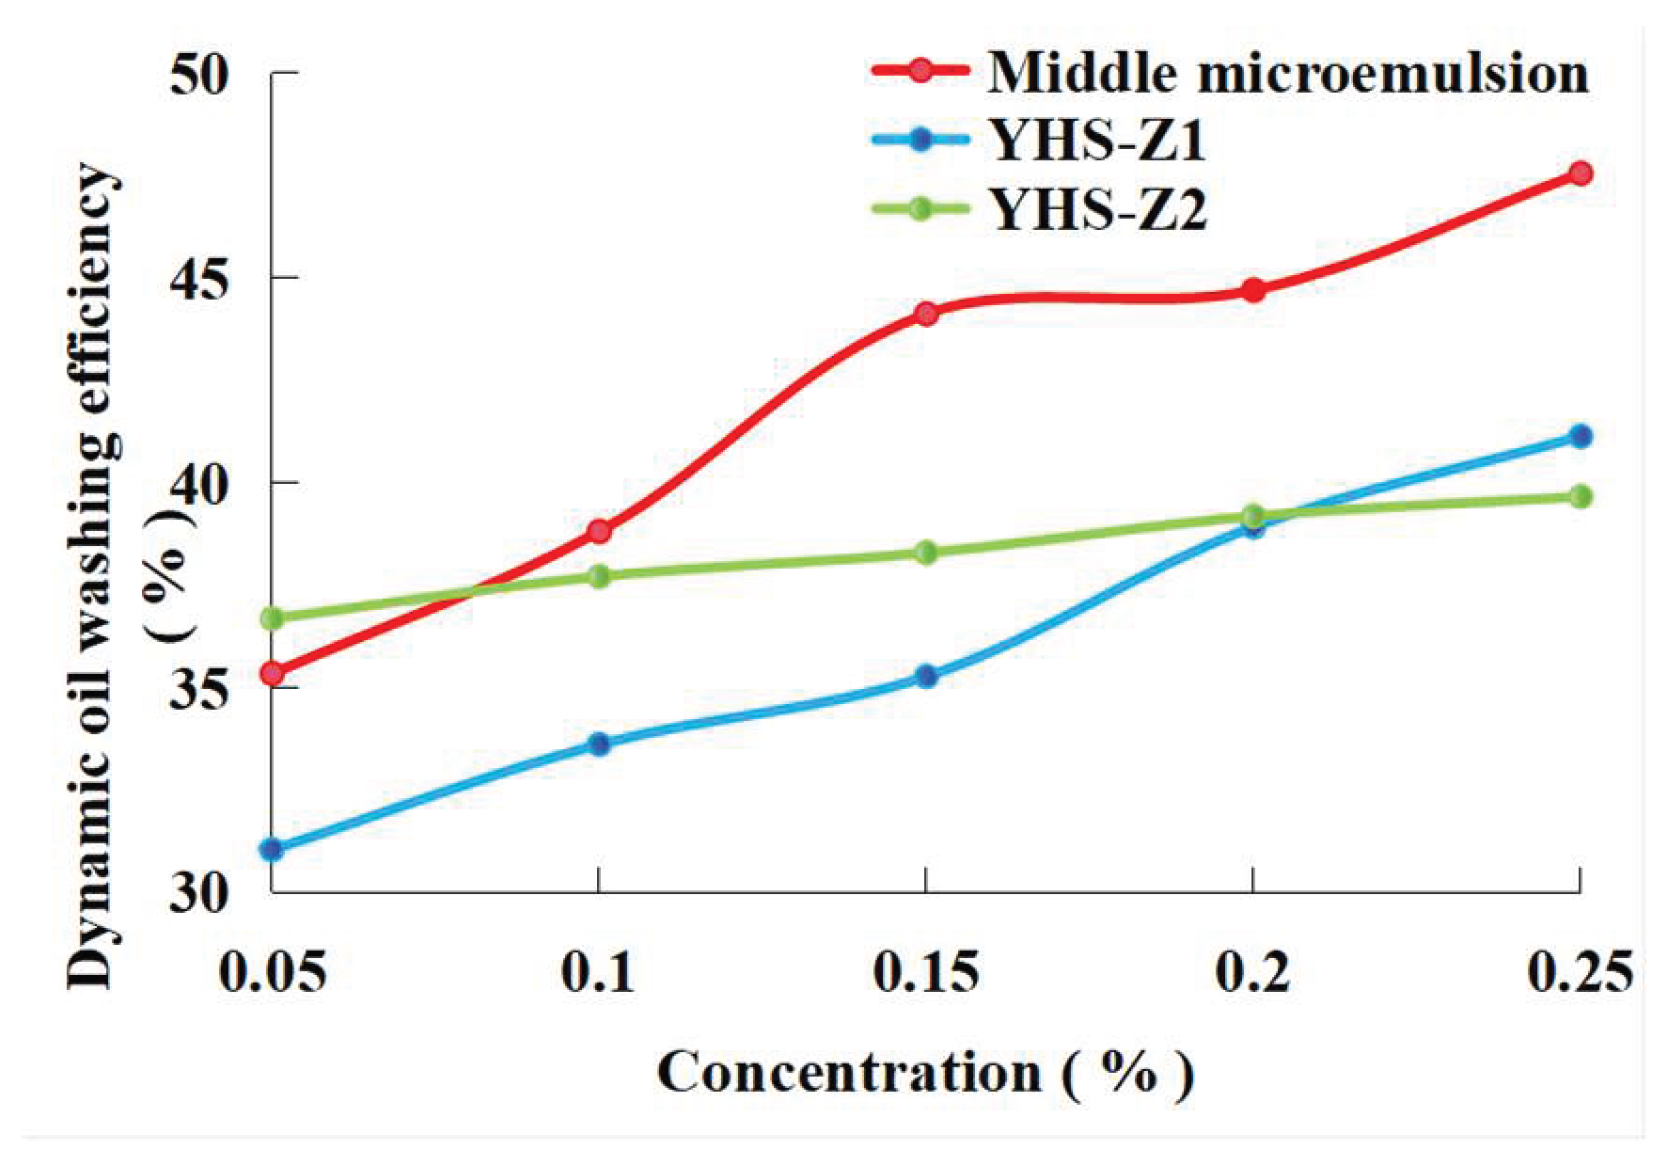
Figure 9.
The change of emulsification migration / retention index of three different surfactants with the increase of concentration.
Figure 9.
The change of emulsification migration / retention index of three different surfactants with the increase of concentration.
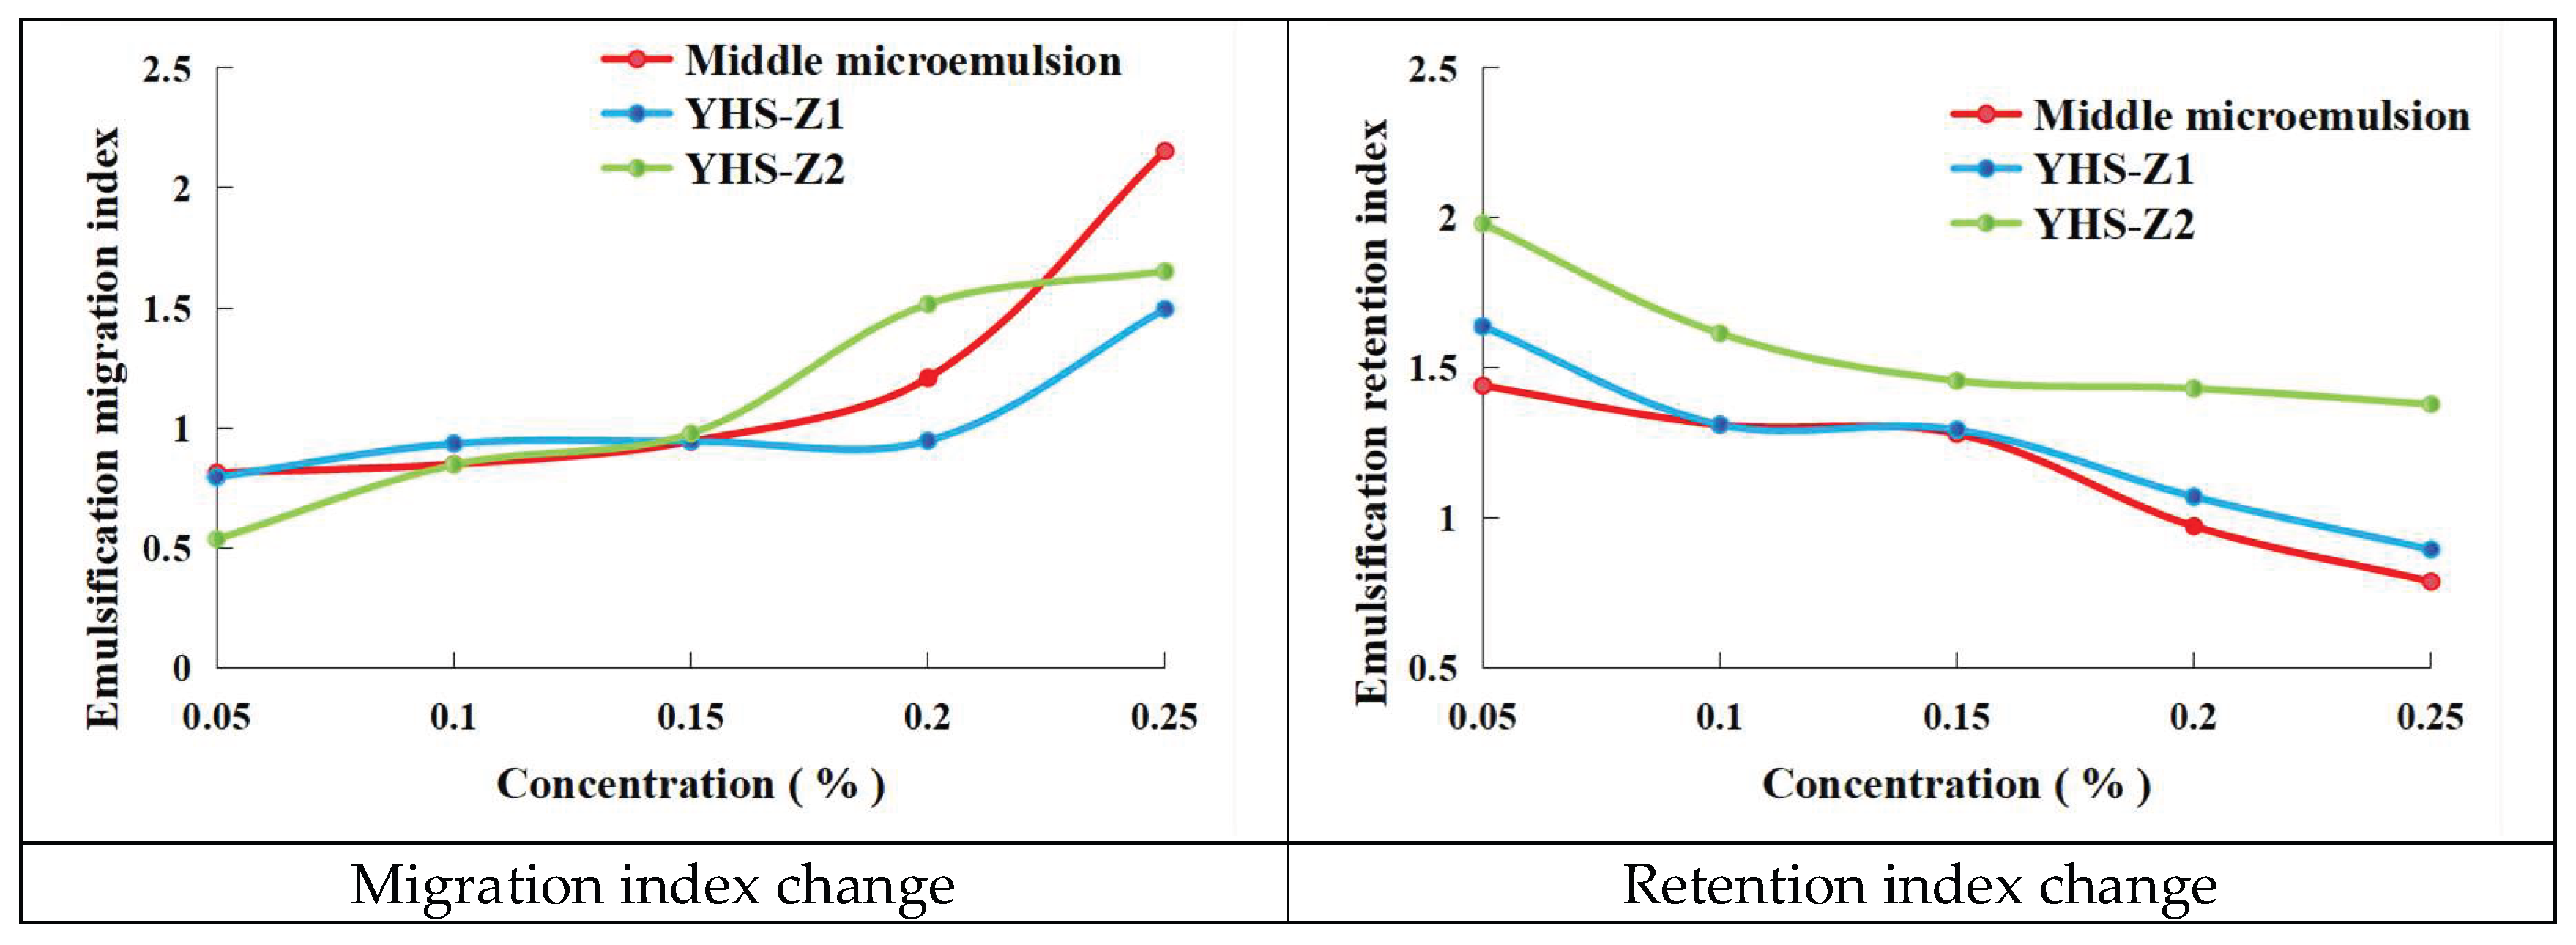
Figure 11.
Feature Importance (SHAP) - Overall.
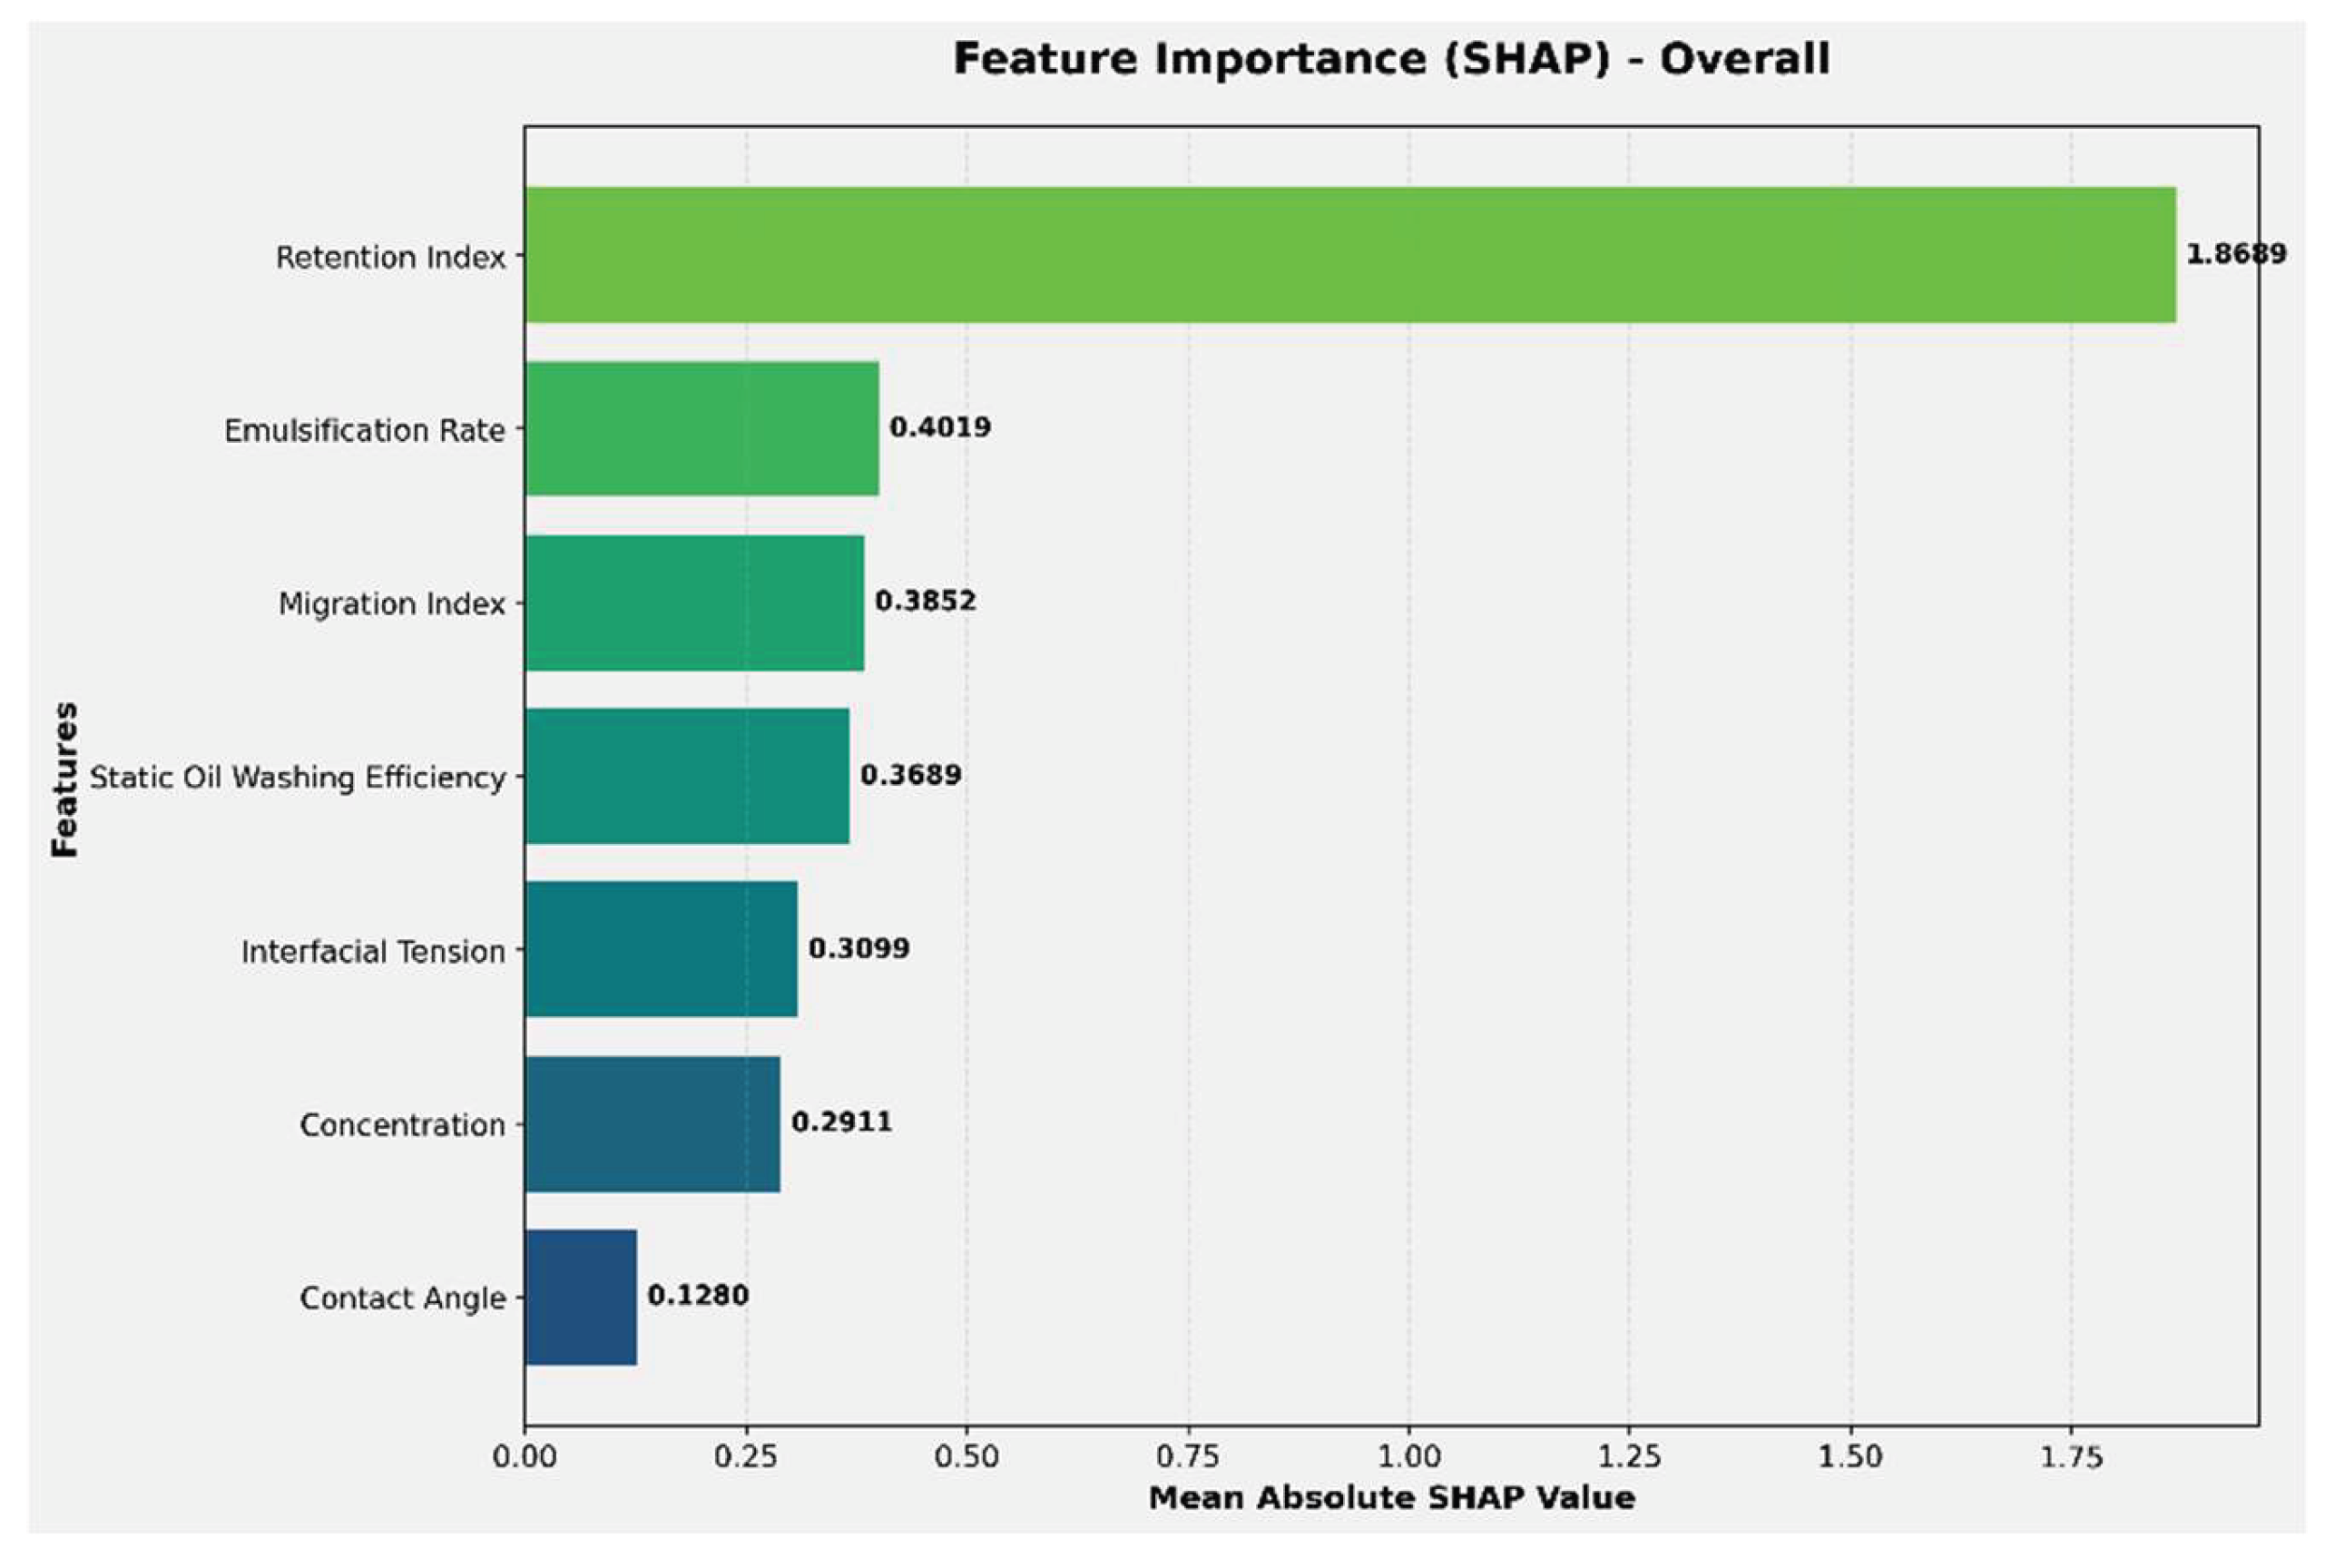
Figure 12.
Dominant Factors for Oil Recovery(SHAP-based).
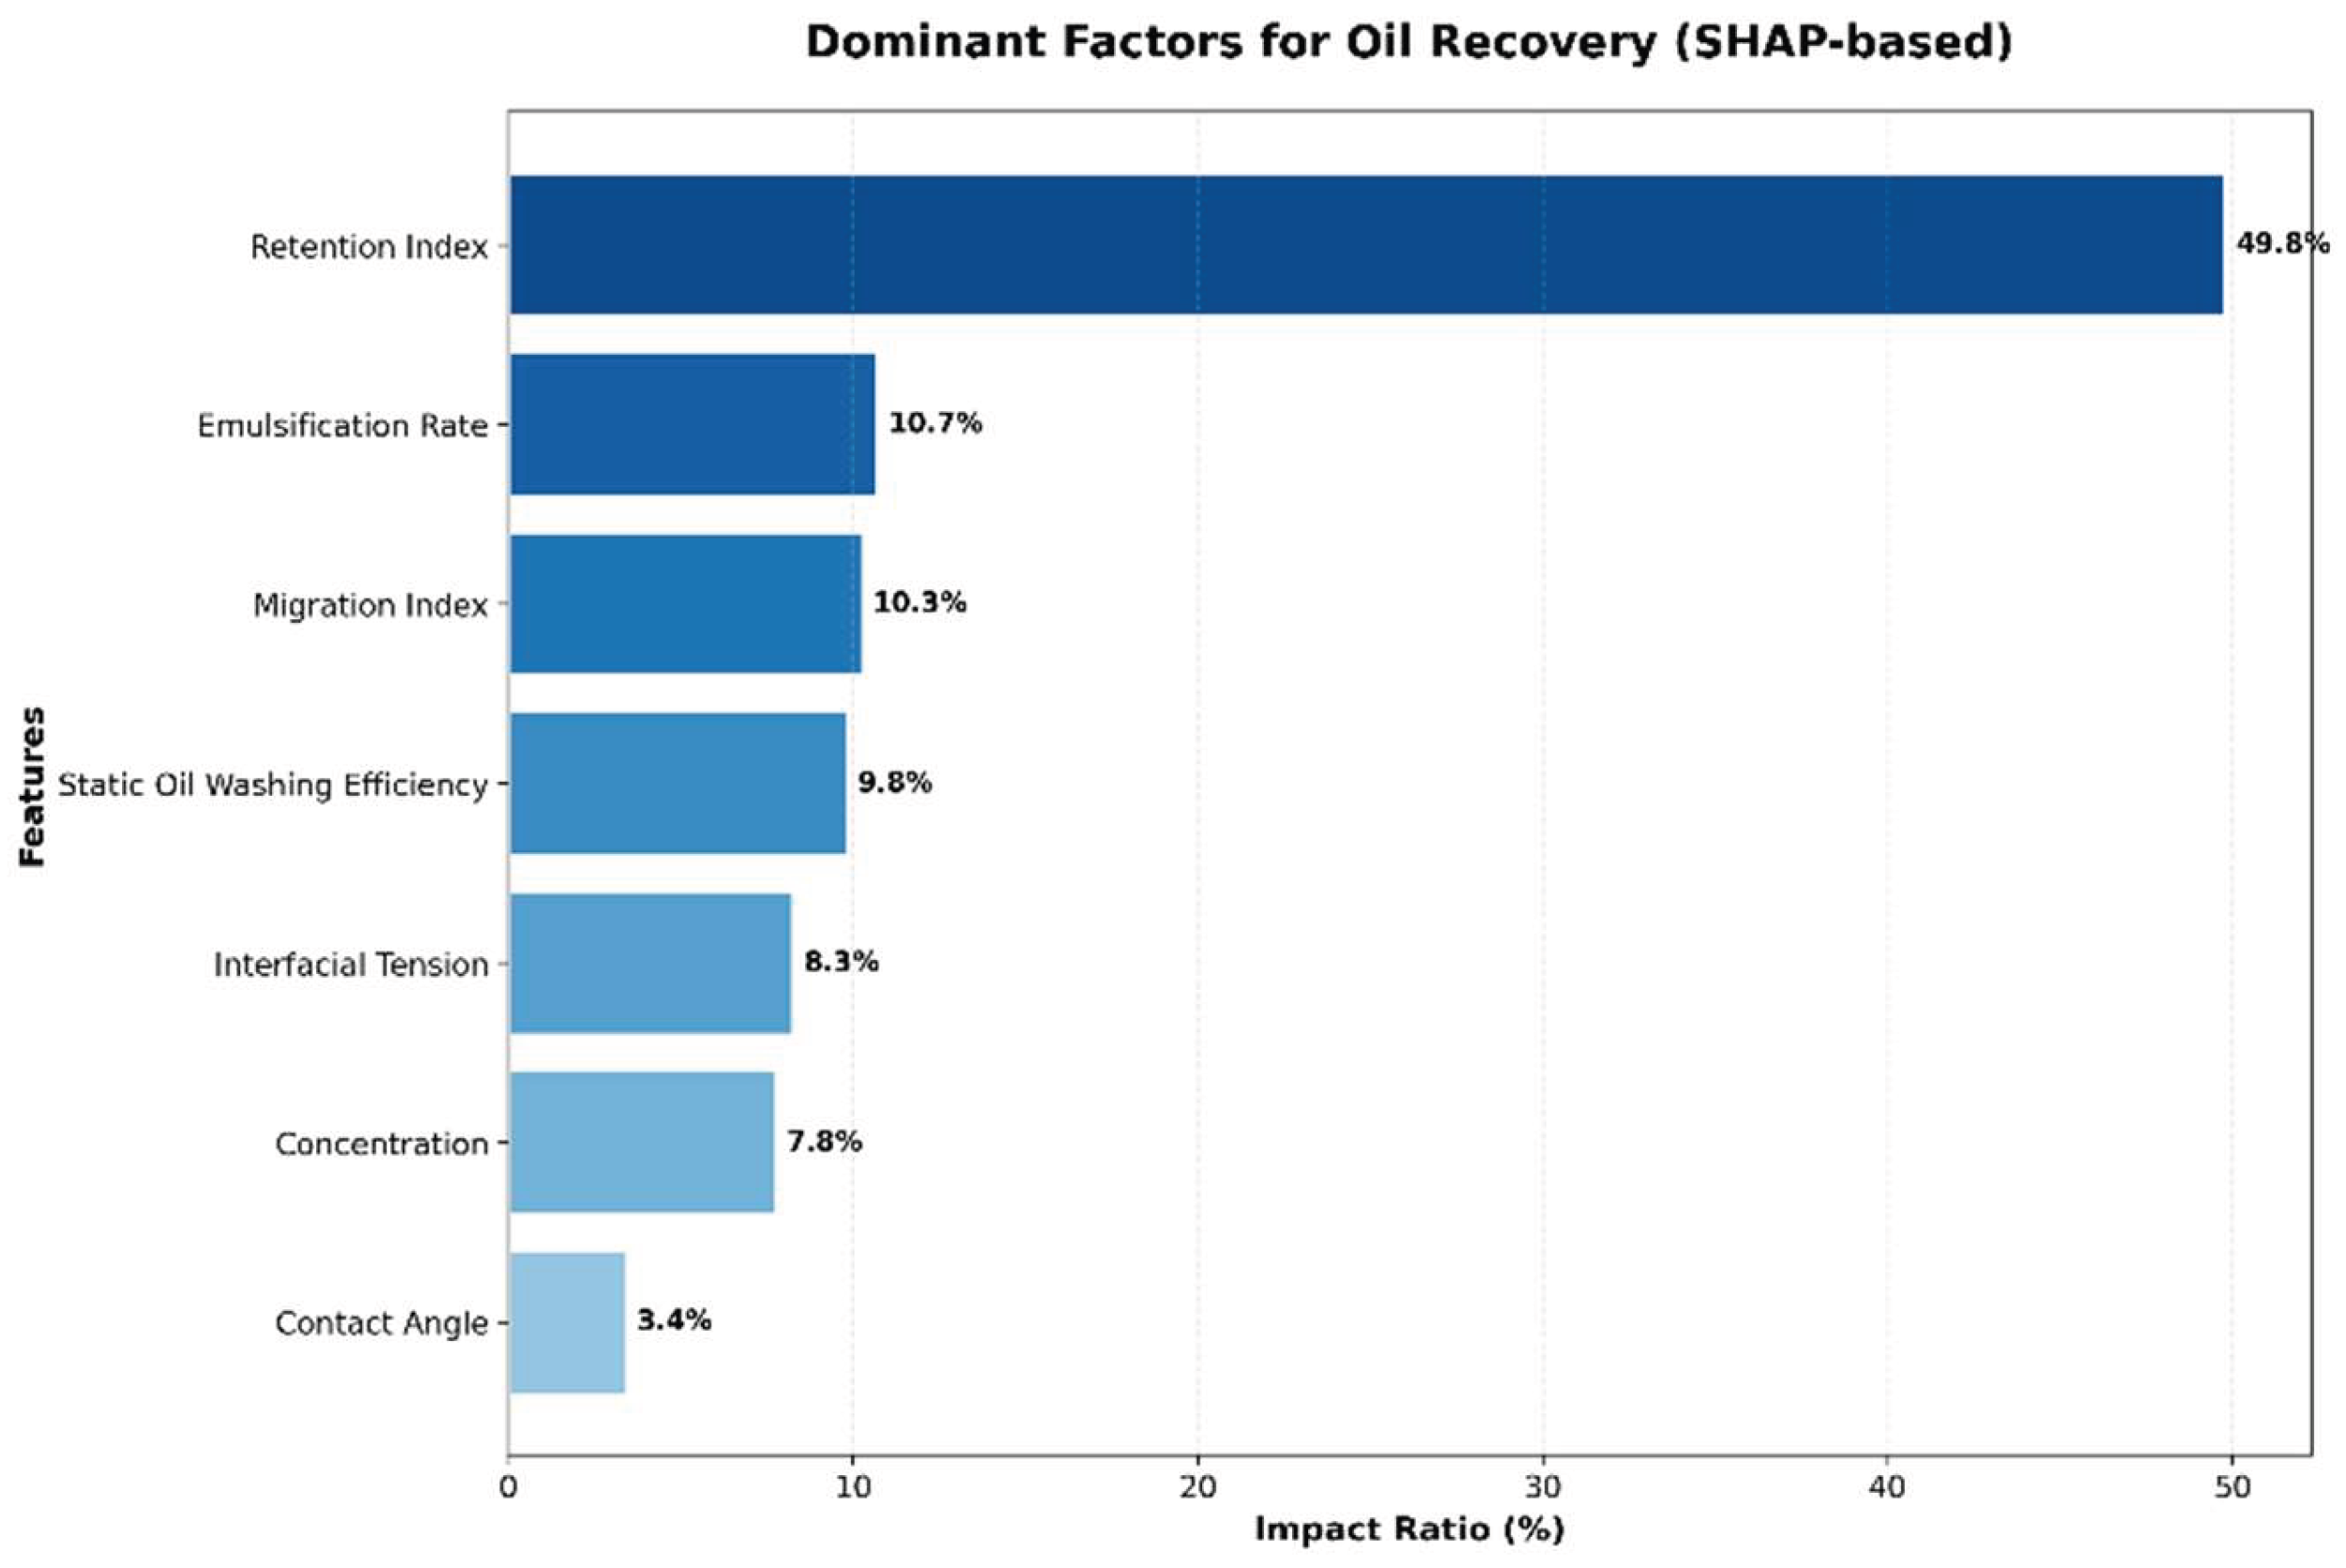
Table 1.
Characteristics of oil.
| Project | Value |
| viscosity(63℃,mPa·s) | 4.97 |
| original gas oil ratio(m3/t) | 8.2 |
| density(g/cm3) | 0.853 |
| saturated hydrocarbon(%) | 61.21 |
| aromatic hydrocarbon(%) | 14.77 |
| Non-hydrocarbon content(%) | 8.08 |
| asphaltene(%) | 6.27 |
Table 2.
Simulate the ion content of formation water.
| water source | Na++K+ (mg/L) |
Ca2+ (mg/L) |
Mg2+ (mg/L) |
CL- (mg/L) |
SO42- (mg/L) |
HCO3- (mg/L) |
mineralization(g/L) | water type |
| original formation water | 7465 | 566 | 266 | 7077 | 7120 | 1638 | 24.6 | Na2SO4 |
Table 3.
Core physical property data table.
| Core ID | Dimensions | Permeability(×10-3μm2) | Porosity(%) |
| 10 | ɸ25mm×98mm | 9.29 | 12.92 |
| 11 | ɸ25mm×75mm | 11.967 | 13.69 |
| 12 | ɸ25mm×72mm | 13.275 | 12.58 |
| 13 | ɸ25mm×65mm | 14.293 | 10.10 |
| 14 | ɸ25mm×66mm | 14.071 | 8.41 |
| 15 | ɸ25mm×67mm | 8.227 | 11.275 |
Table 4.
Comparative analysis of model performance.
| Model | MAE | MAPE(%) | RMSE | R² |
| linear regression (LR) | 3.1706 | 7.8886 | 3.9221 | -0.2086 |
| support vector regression(SVR) | 3.3215 | 8.6585 | 4.2563 | -0.3976 |
| XGBoost | 3.0416 | 7.9228 | 3.5291 | -0.1334 |
| gradient boosting regression(GBR) | 3.0622 | 8.1429 | 3.5975 | -0.3129 |
| random forest(RF) | 2.8007 | 7.4107 | 3.3111 | 0.0454 |
Table 6.
Optimal Parameter Data.
| Factor | value |
| Concentration (%) | 0.2925 |
| Contact Angle (°) | 28.2338 |
| Interfacial Tension (mN/m) | 0.1140 |
| Static Oil Displacement Efficiency (%) | 16.4859 |
| Emulsification Rate | 2.9834 |
| Transport Index | 2.4314 |
| Retention Index | 0.8105 |
| Predicted Recovery Factor (%) | 45.61% |
Disclaimer/Publisher’s Note: The statements, opinions and data contained in all publications are solely those of the individual author(s) and contributor(s) and not of MDPI and/or the editor(s). MDPI and/or the editor(s) disclaim responsibility for any injury to people or property resulting from any ideas, methods, instructions or products referred to in the content. |
© 2026 by the authors. Licensee MDPI, Basel, Switzerland. This article is an open access article distributed under the terms and conditions of the Creative Commons Attribution (CC BY) license (http://creativecommons.org/licenses/by/4.0/).
Copyright: This open access article is published under a Creative Commons CC BY 4.0 license, which permit the free download, distribution, and reuse, provided that the author and preprint are cited in any reuse.


