
Submitted:
23 January 2026
Posted:
26 January 2026
You are already at the latest version
Abstract
In caving mining, irregular large top coal blocks formed due to overburden pressure and gravity often obstruct the drawing mouth, reducing efficiency, yet studies on their crush-ing characteristics remain limited. This study aims to investigate how fracture modes and geometry affect the fragmentation behavior of such coal blocks. Uniaxial compression tests were conducted on irregular top coal samples from a Gansu mine, with numerical simulations employed to analyze the influence of microscopic parameters. Results indi-cate that among four fracture modes, multi-peak and flat coal blocks exhibit better frag-mentation but higher crushing strength, while single-peak and blade-shaped blocks break unevenly with lower strength. Numerical simulations reveal that porosity affects both crushing strength and fracture direction concentration; elastic modulus influences break-ing time; bond stress impacts strength and breaking time; and loading rate alters crushing characteristics. The findings provide a basis for optimizing caving parameters and pre-venting blockages, contributing to improved mining efficiency.
Keywords:
irregular top coal block
; particle breakage
; fractal dimension
; Weibull distribution
; numerical simulation
1. Introduction
The improvement in the mining efficiency of fully mechanized top-coal caving mining depends on the full breakage of the top-coal block, and its degree of breakage is the key index for evaluating the breakage effect. Realizing good top-coal crushing is the basic premise for achieving a higher top-coal recovery rate. However, irregular geometry is an important factor that leads to the complexity of top coal block breaking behavior, and the fractal distribution in the Weibull distribution provides a new method for the quantitative analysis of irregular top coal block breaking behavior and characteristics. In this study, the fractal theory, Weibull statistical distribution, and fracture behavior were combined to provide a new perspective for revealing the fracture mechanism of irregular top coal blocks.
In the classification of rock breakage morphology, Wang et al. [1] conducted uniaxial compression tests on 920 groups of rockfill particles and divided the breakage modes of rockfill particles into single-, double-, and multi-stress peak breakage curves. Chen Huodong [2] et al. in order to explore the breaking law of calcareous sand particles, conducted uniaxial compression tests on calcareous sand particles with different particle sizes through a self-made single particle compression instrument, and learned that calcareous sand particles will produce three breaking forms. Shen Jiawei [3] et al. pointed out through uniaxial compression test of calcareous sand that the fragmentation modes of calcareous sand particles mainly include the following three types: single crack, cross crack and arch crack. In order to explore the crushing strength of calcareous particles under static load, Jiang Mingjing [4] and others used a high-precision uniaxial tester to test the South China Sea calcareous sand with different particle sizes and shapes, and the force-displacement curves of particles can be divided into three types: “hardening” type; “Softening” type; “Flat” type.
In a study on rock crushing strength, Hu et al. [5] found that the crushing strength of soft rock is lower than that of hard rock, and its average Weibull modulus is 1.48. The particle shape and size play major roles in the crushing mode and crushing strength of soft rocks, respectively. The relationship between shape and crushing strength can be quantified using the size effect formula. Mi Xiaofei [6] used Weibull and Logistic probability distribution models to fit the strength distribution of particles with different particle sizes, compared the differences between them, and derived a particle strength model considering the size effect. Chen Jing [7] et al. studied the size effect of ballast with different particle sizes through splitting and large-scale monotone triaxial tests, and found that compared with single-grade ballast, non-uniformly graded aggregates showed better performance in terms of shear strength, peak friction angle, modulus corresponding to 50% strength, and volume expansibility.
In the aspect of numerical simulation of rock fragmentation, Ling [8] used discrete element numerical simulation method to simulate the mechanical behavior of carbonaceous mudstone particles in the process of fragmentation and found that the shear strength of mudstone particles is directly related to the content of coarse particles; there are a large number of force chains around coarse grains to form skeleton force chains, and the relative fragmentation rate of mudstone is positively correlated with confining pressure and coarse grains content. Zhang Yanan [9] found that the bond strength between sub-particles is the main factor affecting the peak breaking strength of particles, which increases linearly with the increase of strength. Wang Xuejun [10] in order to more truly reflect the influence of particle shape characteristics on its crushing behavior. By combining the discrete element bonded block model (BBM) with three-dimensional scanning technology, he put forward a refined geometric reconstruction method of railway ballast particles was proposed, the influence of particle shape and local edges and corners on contact force distribution, crack initiation and propagation mechanism was analyzed, key modeling parameters were determined, and a reliable numerical tool was provided for the study of the crushing mechanism of ballast particle materials. Jin Aibing [11] proposed a numerical method using breakable Voronoi block model (BVBM) to simulate the crushing process of single particle under compressive load. It was found that many parameters, such as particle size, loading rate, softening tensile strength coefficient, softening coefficient, and BVBM model scale, influenced the crushing behavior, and the value range of meso-parameters suitable for single particle modeling was determined.
Although the above research has made remarkable progress, most of them are ideal model materials or irregular rock sample particles, and there is a lack of research on the fragmentation mechanism of irregular top coal blocks under compression. Based on the abovementioned multidimensional analysis and comprehensive consideration, this study aims to investigate the mechanical behavior of irregular top coal blocks during the crushing process. The fractal distribution reflects the characteristics of coal breaking, whereas the Weibull distribution reflects the strength characteristics of coal. The factors affecting the two distributions were analyzed, the size effect formulas of the two distributions were calculated, and the applicability of the size effect formulas was compared. Finally, combined with numerical simulation, the influence of microscopic parameters on the coal breaking behavior was illustrated.
2. Materials and Methods
A total of 255 test samples were selected from a coal mine in Gansu Province and categorized into five size groups based on particle diameter: 10-20mm, 20-30mm, 30-40mm, 40-50mm, and 50-60mm. After classification, each coal block was sealed for preservation.
The top coal block was scanned using a SHINING 3D laser scanner. The instrument collected surface data of the top coal block. The laser scanned the object surface at a preset frequency, recording the 3D coordinates of each reflected point. Point cloud data was generated based on these coordinate points. Graphic software processed the point cloud data. Any unscanned areas were rescanned to ensure the completeness of the top coal block’s 3D image. A 3D model was ultimately generated and imported into numerical simulation software for microscopic research.
Fractal distribution statistics are applied to assess coal block fragmentation, while Weibull distribution is used to evaluate coal block strength. Size effect formulas under both distributions are calculated to compare their differences.
3. Coal block Crushing Test and Influencing Factors of Fractal Distribution
3.1. Analysis of Uniaxial Crushing Test Results of Coal Block
A total of 255 test materials provided by a coal mine in Lanzhou were divided into five particle size groups according to their particle sizes: 10-20 mm, 20-30 mm, 30-40 mm, 40-50 mm, and 50-60 mm. Because the shape of a coal block is not completely regular and the surface is uneven, it is difficult to accurately define its size using the concept of “diameter.” According to reference [12], the geometric characteristics of top coal block can be described by elongation (IE) and flattening (IF). These two parameters are widely used as a classification basis in engineering surveys and other fields, particularly in distinguishing the morphology of particulate matter, which can be used to quantify the degree of deviation from a sphere. The index calculation formula (1) is as follows.
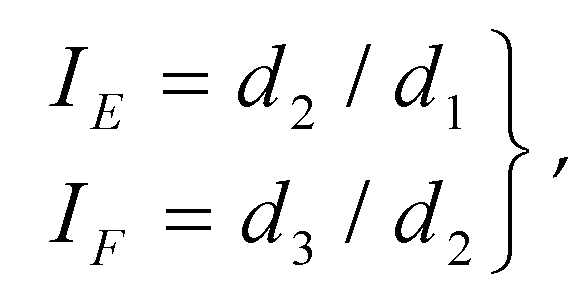
Where: d1 is the maximum size of the object in any direction, that is, the longest distance between two points of the object; Make a plane perpendicular to d1 through the midpoint of the longest distance d1, and find the maximum object size on this plane, that is, d2; d3 is the size of the object in the direction perpendicular to d2 on the plane determining d2.
According to the above classification, the 255 irregular coal blocks selected in the test were divided into four categories: flat, spherical, blade-shaped, and columnar. As shown in Figure 1, the test top coal blocks were mainly flat and blade-shaped, and the number of spherical blocks increased slightly with increasing particle size. After classification, each coal block was sealed and stored. Because of the large number of samples, only a few samples are shown in Figure 2.
According to the test results, the types of coal block breakage can be divided into the following: multi-peak curve before the main peak, multi-peak curve after the main peak, parallel peak curve, and single-peak curve.
The load-displacement curve of a coal block with a multi-peak curve failure mode in front of the main peak exhibits unique characteristics owing to the diversity of its shapes during compression. Before the highest peak appears, the curve records several increasing sub-peaks. This is because when the upper loading plate first contacts the edges and corners of the top coal block, it will crush it (forming the first crack corresponding to the No.1 peak); however, the main body of the coal block can still bear a large load without cracking, and the second and third cracks appear one after another under continuous displacement (forming the subsequent No.2 peak). When these cracks connect with each other and gradually develop into penetrating fracture surfaces, the overall failure of the structure occurs (forming peak 3).
In the initial stage of loading, the load of the coal block with a multi-peak curve failure mode after the main peak showed a linear growth trend. At this stage, the top coal block will form cracks through the coal body, and the load-displacement curve will respond at the same time, and the main peak, namely No.1 peak, will appear; with the continuous increase of vertical displacement, fine cracks gradually appear around the main cracks, and gradually expand and penetrate each other. After the main peak, the curve becomes a step-like slow downward trend and forms corresponding peaks 2 and 3. Finally, the coal blocks were broken into block units of similar size.
The load-displacement curve of the coal block in the parallel peak-to-peak curve breaking mode has several close peaks in the loading process, and the coal block does not break immediately and can still bear a certain load. With the increase in vertical displacement, many similar main cracks appear in the coal body, which gradually develop and penetrate each other, and finally lead to the coal body breaking into block units with large size differences, accompanied by some pulverized coal produced by angular grinding
The load-displacement curve of a coal block with a single-peak curve fracture mode shows an approximate linear growth at the beginning of loading, quickly reaches the main peak, and then exhibits split failure. This failure mode releases an obvious burst sound, cracks appear preferentially in the geometric center area and expand rapidly, penetrate the coal body, and the load drop exceeds 50%, which eventually leads to the breakage of the sample and the formation of several sub-coal blocks with similar volumes, showing a typical brittle failure mode. Images of the four breaking modes are shown in Figure 3.
3.2. Influence of Different Crushing Modes on Fractal Distribution of Coal Blocks
In the 1970s, Mandelbrot proposed that fractal theory is defined as a rough or broken geometric shape, and its local and integral volume has self-similarity. The fractal dimension can be obtained by a uniaxial compression crushing test, and the fractal dimensions obtained by the crushing test of the same material with different particle sizes are different. According to fractal theory, fractal dimension [13,14] can be obtained by the following formula (2).
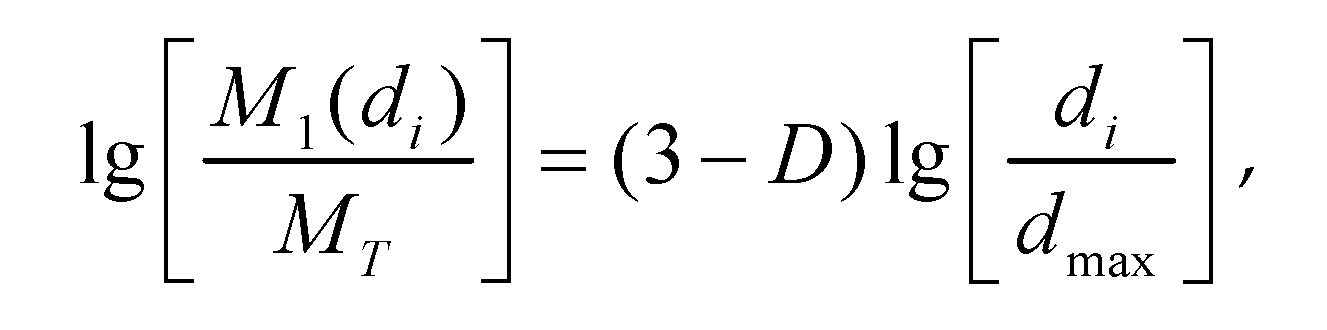
Where: M1(di) the mass of coal fragments larger than a certain particle size di; MT is the total mass of coal blocks; The slope of fitting line in double logarithmic coordinate system is 3-D.
To explore the influence of different crushing modes on the fractal distribution of coal blocks, the coal blocks with five particle size groups of 10~20mm, 20~30mm, 30~40mm, 40~50mm and 50~60mm were classified according to the crushing modes, and their fractal dimensions were calculated. The calculated fitting curves are shown in Figure 4. The fitting formula and fractal dimension are listed in Table 1.
As shown in Table.1, the particle size distribution manifests a fractal pattern in the double logarithmic coordinate system. The slopes of the fitting curves for the four fracturing modes (multi-peak type before peak, multi-peak type after peak, single peak type and parallel peak type) are similar, indicating comparable distribution structures. It is evident that the goodness of fit (R2) of multi-peak type and parallel peak type before peak is higher, indicating that the coal block is more thoroughly broken and more closely aligned with fractal law under these two modes. The fractal dimension D corresponding to each particle size group (10~60mm) ranges from 1.94 to 2.11, with the average fractal dimension of the multi-peak type being the highest (D=2.048). The findings indicate that the fractal dimension is influenced by the fracturing mode, and the fractal dimension of the multi-peak type before the peak is higher, which can more accurately reflect the particle size distribution characteristics after crushing.
3.3. Influence of Different Geometric Shapes on Fractal Distribution of Coal Blocks
In order to explore the hypothesis that different shapes have an influence on fractal distribution, the coal blocks in five particle size groups are classified according to geometric shapes and counted. The number of spherical and columnar coal blocks is small, the fitting results are accidental, so only the influence of blade shape and flat shape on fractal distribution is counted. Now, the fractal distribution and fitting curve of blade shape and flat shape of coal blocks in each particle size group are drawn into the following Figure 5, and the fitting formula and fractal dimension are recorded in Table 2.
As demonstrated in Figure 5 and Table 2, the particle size distribution curve obtained from screening test of irregular coal blocks with the same particle size group, according to blade shape and flat shape, is depicted in the double logarithmic coordinate system. This representation unveils a discernible law. Within the same particle size group, the fitting curves of the two shapes are found to be nearly parallel, and the data points of each group are distributed on both sides of the fitting line, thereby meeting fractal distribution. The R2 value of flat-fitting curve is typically larger than that of leaf-fitting curve. This indicates that flat coal is more thoroughly fractured than leaf coal, which is consistent with the fractal distribution. The fractal dimension ranges of flat and leaf shapes in coal block groups measuring between 10 and 20 mm, between 20 and 30 mm, between 30 and 40 mm, between 40 and 50 mm, and between 50 and 60 mm are 2.02 to 2.09 and 1.96 to 2.09, respectively. Within the same particle size group, the order of fractal dimension from large to small is as follows: flat > leaf-shaped. However, there is negligible little difference between flat fractal dimension D and leaf-shaped fractal dimension D.
In summary, the fractal dimension of coal blocks is influenced by the geometric shape. In the same conditions, flat and blade-shaped coal blocks are more fully broken, and the fractal dimension D fitted according to their fractal distribution curves is more accurate.
3.4. Size Effect Formula of Fractal Distribution
The crushing strength proposed by Xu Yongfu in the single particle crushing experiment is formula (3).
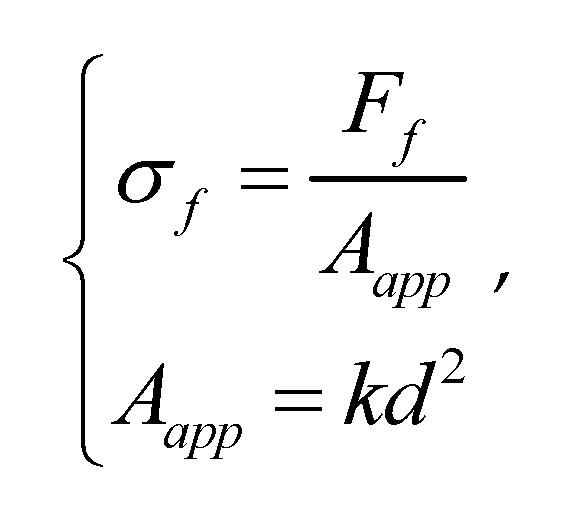
Where: σf it is the crushing strength of coal blocks; Ff is pressure; Aapp is the cross-sectional area of coal block perpendicular to the direction of pressure application; k is a shape parameter; d is Section dimensions.
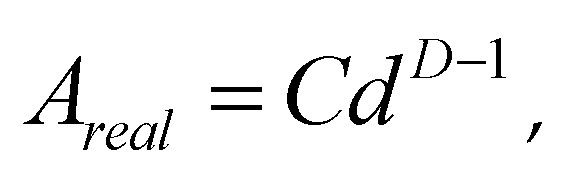
The fractal dimension of coal block in three-dimensional space is D. The fractal dimension in two-dimensional plane is D-1, The cross-sectional area of any section with a size of d in a two-dimensional plane is formula (4).
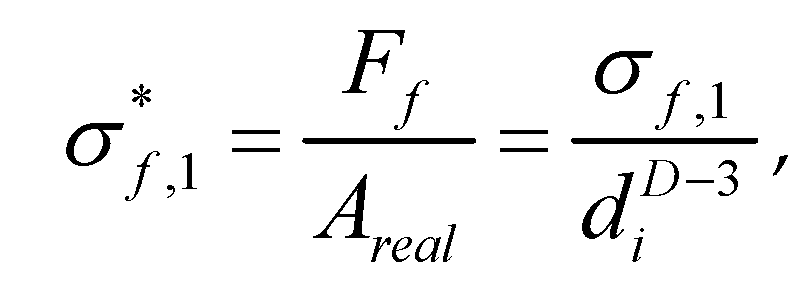
The crushing strength for eliminating defects such as small cracks in coal blocks is defined as the inherent strength of coal blocks, and the inherent strength is a fixed value, and its calculation formula (5) is as follows: σ*f.1.
The intrinsic crushing strength is a constant, which represents the average of the intrinsic strength of a single coal block, namely formula (6): σ*f
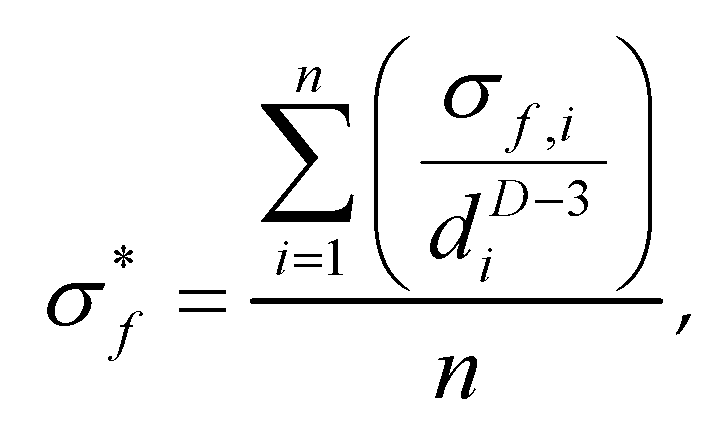
Where: n it is the total number of coal blocks, which σf,i is the crushing strength of coal blocks with diameter d.
The relationship between coal crushing strength and its size is as follows formula (7).
Combined with formula (6), calculate the intrinsic strength of coal as formula (8).
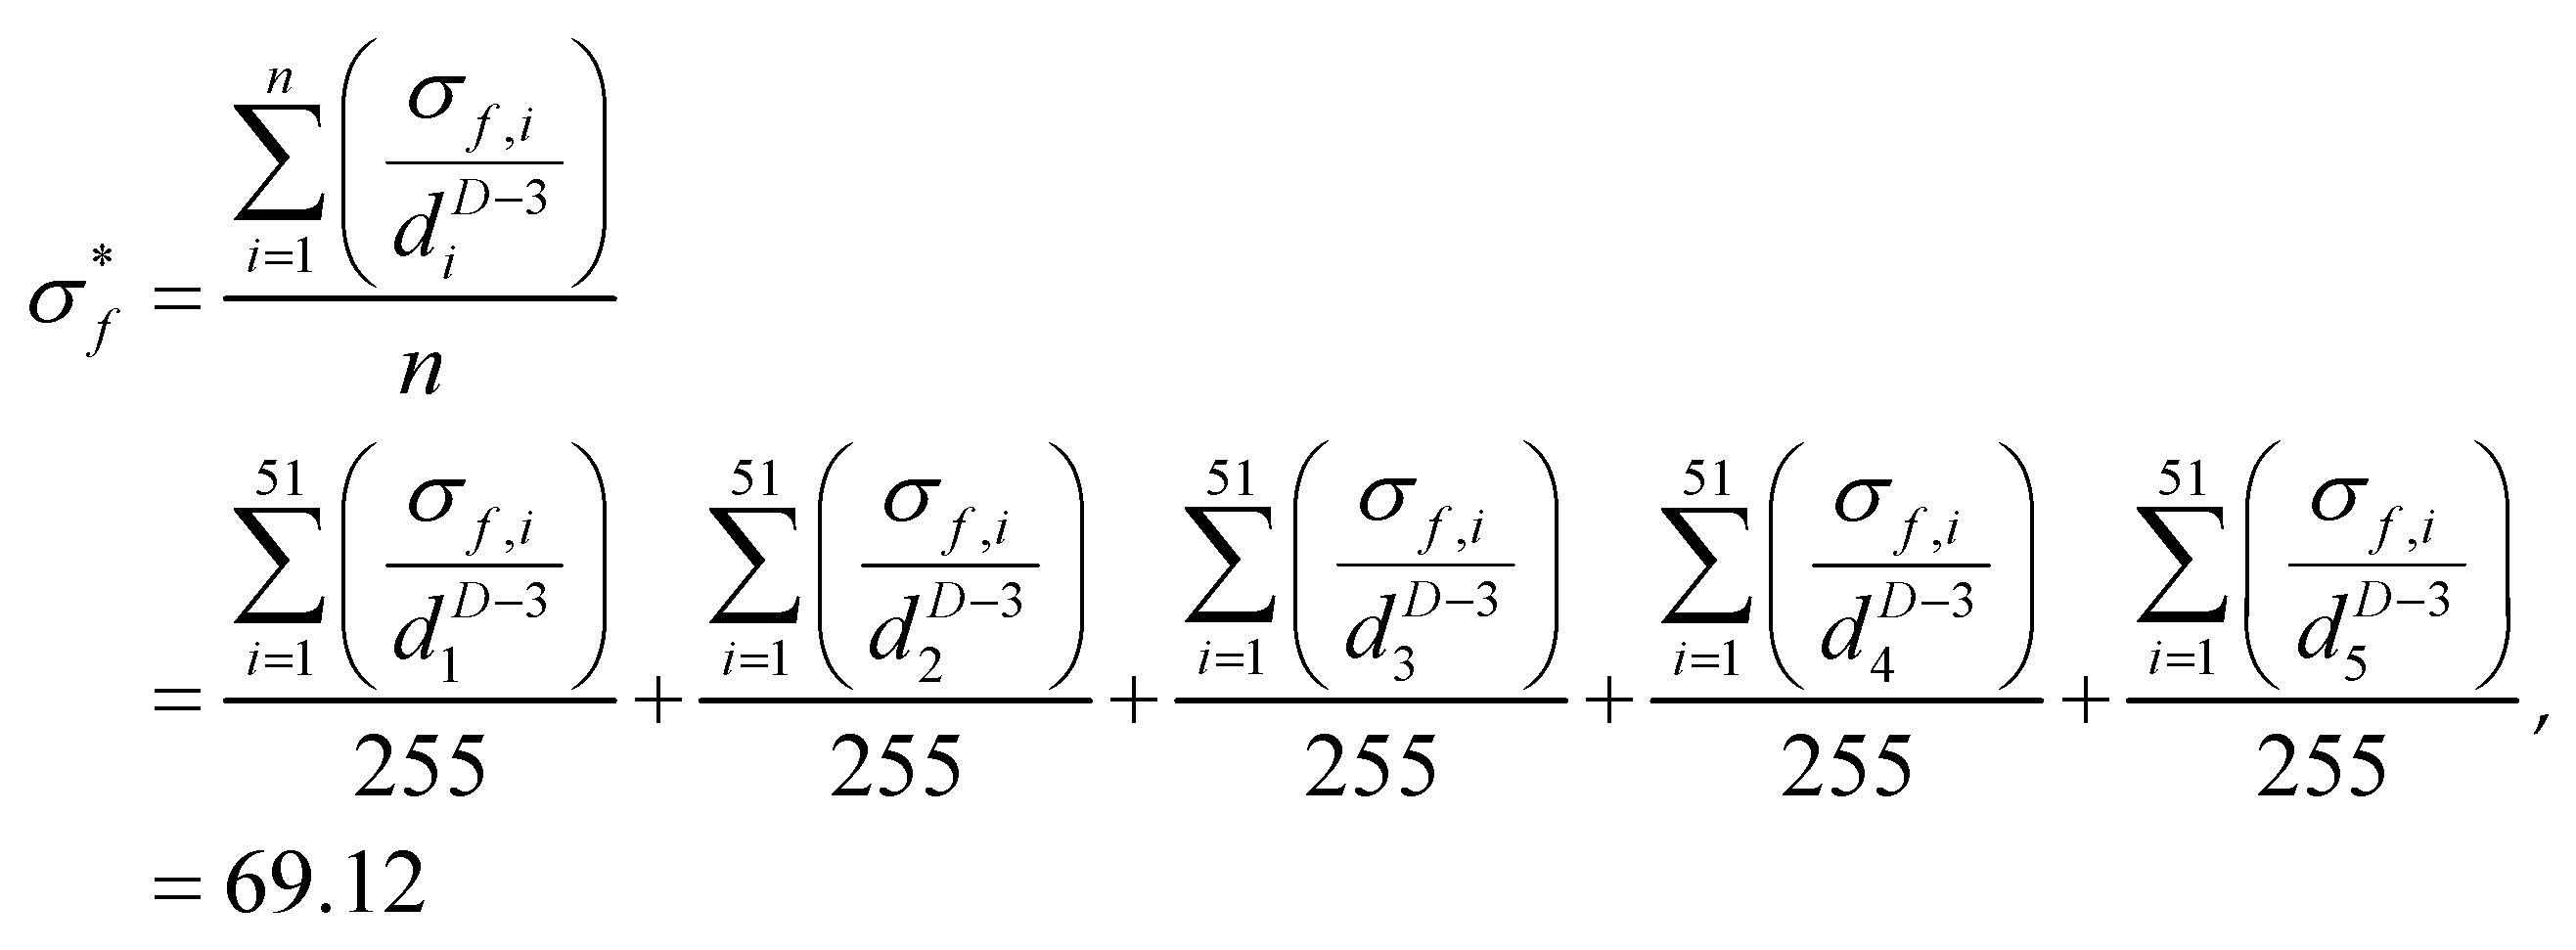
Where: d1 d2 d3 d4 d5 are the average values of five particle size groups: 10-20mm, 20-30mm, 30-40mm, 40-50mm and 50-60mm; The fractal dimension D=2.05; Quantity of coal blocks taken is n=255.
The relationship between coal crushing strength and volume is shown in formula (9).
4. Weibull Distribution and Size Effect Formula of Coal Block Crushing Strength
4.1. Influence of Different Crushing on Weibull Distribution of Coal Blocks
Calculate Weibull distribution of coal block according to formula (10).
Where;Ps is the probability that coal blocks are not broken under a certain characteristic stress; σ0 is the characteristic stress when the probability of unbroken coal is 37%, and it is the intercept between fitting line and x axis in double logarithmic coordinate system; m is Weibull modulus reflecting the discrete degree of crushing strength of coal, the larger it is, the more uniform the coal is, the smaller the discrete degree of strength is, and it is the slope of fitting line in double logarithmic coordinate system.
In order to explore the influence of different breaking modes on the Weibull distribution of coal blocks, a total of five groups of coal blocks were classified according to breaking modes. The groups comprised 10-20mm, 20-30mm, 30-40mm, 40-50mm and 50-60mm coal blocks, respectively. The Weibull distribution of each group was then calculated. The specific fitting curves and calculation results are displayed in Figure 6 and Table 3.
As demonstrated in Figure 6 and Table 3, it is evident that the fitting outcomes for each particle size group are superior, and the data distribution of each sample exhibits approximate linearity. It is evident that there are discernible laws that govern the distribution characteristics of material strength, which correspond to distinct crushing modes. Within the same particle size group, Weibull modulus m and characteristic stress σ0 exhibit the same order of magnitude: parallel peak type > multi-peak type before peak > multi-peak type after peak > single peak type. The higher m value of parallel peak briquette indicates that its internal strength distribution is more concentrated and its defects are fewer in number, thus resulting in enhanced crushing resistance. Conversely, the lower m value of coal blocks in other modes signifies that their strength is distributed more diffusely, exhibiting a greater prevalence of internal defects, and consequently, an increased propensity to fracture when subjected to stress. Furthermore, an inverse correlation is observed between the characteristic stress and the coal particle size, suggesting that the latter is a significant factor influencing the crushing behavior.
4.2. Influence of Different Geometric Shapes on Weibull Distribution of Coal Blocks
In order to explore the influence of different geometric shapes on the Weibull distribution of coal blocks, a five-groups of coal blocks with grain sizes of 10~20mm, 20~30mm, 30~40mm, 40~50mm and 50~60mm are classified according to geometric shapes (leaf shape and flat shape) and their Weibull distribution is calculated in turn. The specific fitting curves and calculation results are shown in Figure 7.
As demonstrated in Figure 7 and Table 4, it is evident that the geometry of coal blocks exerts a substantial influence on their strength, Weibull distribution, and crushing behavior. It is evident that, under equivalent particle size conditions, the Weibull modulus and characteristic stress of flat coal blocks are greater than those of blade coal blocks. It is evident that an elevated M value signifies that the strength distribution of flat coal is more concentrated and that there is a reduced prevalence of defects. Consequently, it is challenging to break under stress. Conversely, the M value of blade-shaped coal block is lower, which reflects its scattered strength distribution, numerous internal defects and a higher probability of breakage under load. The difference of characteristic stress, denoted here by σ0, further confirms that flat coal blocks have higher overall strength.
4.3. Size Effect Formula of Weibull Distribution
On the formula (11) of Weibull distribution and particle size. According to McDowell [15].
Where: σ0 is the characteristic stress; λ is a material parameter; d is the particle size; m is Weibull modulus.
Ovalle [16] proposed the particle self-similarity coefficient n based on formula (11) as formula (12).
Where is the geometric shape parameter n.
The main difference between the two formulas is that formula (11) fits quartz sand well but feldspar sandstone poorly. Formula (12) solves the above problems after introducing geometric parameters, so this paper adopts formula (12), and the Figure 8 shows the size utility fitting curve of Weibull distribution of coal blocks.
The size effect formula of Weibull distribution strength of coal block is as formula (13)
Comparing formula (8) with formula (13), it is found that the fractal dimension reaches 2.60 when the coal block is fully broken, so the fractal distribution size effect formula can be used. The Weibull distribution size effect formula can be used to avoid the influence of fractal dimension D when the coal block is not fully broken, so as to better calculate the crushing strength of large-size coal blocks.
5. Numerical Simulation of Irregular Coal Block and Influence of Parameters
5.1. Influence of Different Porosity on Coal Fragmentation Behavior
In order to explore the influence of different porosity on coal crushing, the porosity is divided into three groups: low porosity group (3%,7%), medium porosity group (10%,14%) and high porosity group (20%,24%). The uniaxial compression numerical simulation of samples with different porosity is carried out by using numerical simulation software, and the crushing strength-displacement curve is shown in Figure 9 and Figure 10.
As demonstrated in Figure 9 and Figure 10, a negative correlation exists between porosity and crushing strength, indicating that as porosity increases, coal blocks exhibit diminished bearing capacity. Low-porosity coal demonstrates a propensity for brittle failure, resulting in a reduction in crack density and a subsequent sharp rise in the curve. In contrast, high-porosity coal exhibits ductile behavior, characterized by a proliferation of cracks distributed over a wider range. Consequently, the curve for high-porosity coal displays a gentle incline. It is evident that the porosity of a material influences its fracture direction, with lower porosity resulting in a more concentrated fracture pattern, characterized by a limited number of dominant directions. Conversely, higher porosity leads to a less concentrated fracture pattern, with cracks occurring at a broader range of angles.
5.2. Influence of Different Elastic Modulus on Crushing Behavior of Coal Lump
In order to study the influence of different elastic modulus on coal crushing behavior, the elastic modulus is divided into 6 groups: 3GPa, 3.5GPa, 4GPa, 4.5GPa, 5GPa and 5.5GPa, and the numerical simulation test is carried out. The test results are shown in Figure 11 and Figure 12.
According to Figure.11 and Figure.12, it can be obtained that (1)The force-displacement curve is in the elastic stage, and the slope of the curve increases with the increase of elastic modulus; The peak breaking stress will decrease with the increase of elastic modulus, because the smaller elastic modulus makes the coal block have stronger toughness and slightly stronger deformation ability when bearing pressure, which leads to the increase of breaking stress. (2) With the increase of elastic modulus, the crushing quantity of coal block shows an overall increasing trend; The crushing quantity ranges from 818~842 at lower modulus of elasticity (3GPa~4GPa) to 858~897 at higher modulus of elasticity (4.5GPa~5.5GPa), which indicates that the high modulus of elasticity coal will produce more crushing under loading. (3) The green sector is widely distributed at low elastic modulus and concentrated at high elastic modulus, which indicates that with the increase of elastic modulus, the crushing range of coal blocks will change from dispersion to concentration, and strengthen in the dominant crushing direction.
5.3. Influence of Different Bonding Stresses on Coal Fragmentation Behavior
In order to study the influence of different bonding stresses on the crushing behavior of coal blocks, the bonding stresses are divided into 2.05MPa, 2.25MPa, 2.45MPa, 2.65MPa and 2.85MPa. The specific test results are shown in Figure 13 and Figure 14.
The numerical simulation results indicate that: (1) An increase in bonding stress results in an increase in the crushing strength of coal blocks. (2) The higher the bond stress, the later the curve enters the sudden drop trend, indicating that the coal block is harder at this time. As the magnitude of bond stress increases, the degree of coal block crushing decreases. In the presence of varying bond stresses, the direction of fracture exhibits heterogeneity. However, it has been observed that as the bond stress magnitude increases, the proportion of fractures occurring in multiple directions decreases.
5.4. Influence of Different Loading Rates on Coal Crushing Behavior
In order to study the influence of different loading speeds on coal crushing behavior, the loading speeds are divided into 0.04mm/s, 0.07mm/s, 0.1mm/s, 0.3mm/s, 0.6mm/s and 0.9mm/s. The specific test results are shown in Figure 15 and Figure 16.
According to Figure 15 and Figure 16, it can be seen that (1) the higher the loading speed, the higher the peak breaking stress of the force-displacement curve, and the sudden drop trend of the post-peak curve is more and more gentle. (2) With the increase of loading velocity, the number of cracks increases in turn. The number of cracks increases about 32% when loading velocity is 0.9 mm/s compared with 0.04 mm/s, and the spatial distribution of cracks is more dispersed at high loading velocity. (3) The crushing mode under low-speed loading is mainly a single main crack and a few branches, and the fragments are mainly large in size; The high-speed loading crushing modes are mostly multi-main cracks and dense branches, and the fragments are smaller in size, more uneven in distribution and higher in crushing efficiency.
6. Discussion
The present study employs uniaxial crushing tests to explore the crushing mode of irregular coal blocks. The fractal distribution and Weibull distribution are used to summarize the breaking behavior and breaking strength law of coal blocks, calculate the size effect formula of coal blocks under the two distributions, explain the applicable conditions of the formula and explore the influence of other factors on the two distributions; Finally, numerical simulation software is employed to simulate the influence of different microscopic factors on coal fragmentation behavior. The following specific conclusions can be drawn:
(1) The phenomenon of irregular coal block breakage can be categorized into four distinct types: multi-peak type before main peak, multi-peak type after main peak, parallel peak type, and single peak type. The slope of the fitting curves of fractal distribution is nearly equivalent, suggesting that their structures are analogous. The fractal dimension closer to 2.60 is more representative, suggesting that the fractal distribution of coal blocks is influenced by the fractal mode and geometric shape.
(2) In Weibull distribution, the structure of coal block with parallel peak type is the most uniform and compact, while the structure with single peak type is the most uneven and the fracture probability is the highest. The Weibull modulus and characteristic stress of flat coal block are higher than that of blade coal block, which shows that the internal strength distribution of flat coal block is more concentrated and there are fewer defects, so it is not easy to break under stress. Fractal distribution can be used to calculate the size effect formula when the coal block is fully broken (the classification dimension is close to 2.60), and Weibull distribution can be used to calculate when the coal block is not fully broken.
(3) In the numerical simulation, porosity affects the crushing strength of coal block and the concentration of fracture direction; The elastic modulus affects the breaking time of coal block, and the bond stress affects the breaking strength and breaking time of coal block; The loading speed affects the crushing characteristics (brittle failure and shaping failure) of coal blocks.
Author Contributions
Guo Yan-hua: Conceptualization, methodology, formal analysis, supervision. Zhang Yan-jie: Conceptualization, investigation, validation, methodology, Writing-original. Han Xian-gang: Conceptualization, methodology, funding acquisition. Zhu Chi: Data curation, Software. Chen Xiao-meng: Software. Wang Teng-jiao: Methodology.
Funding
The authors are grateful for the financial support received from the study was supported by National Natural Science Foundation (52074100, 52474128).
Data Availability Statement
The datasets used and analyzed during the current study available from the corresponding author on reasonable request.
Conflicts of Interest
The authors declare that they have no potential conflicts of interest with respect to the research, authorship, and/or publication of this article.
References
- WANG Kejian, JIA Yvfeng, et al. Study on crushing characteristics of rockfill based on single particle compression test [J]. People’s Yangtze River, 2020, 51 (03): 160-166+212.
- CHEN Huodong, WEI Houzhen, FENG Zheng, et al. Study on crushing strength and crushing form of calcareous sand particles [J]. Geotechnical Foundation, 2018, 32 (06): 637-641.
- SHEN Jiawei, ZHOU Bo, FU Ru, KU Quan, WANG Huabin, et al. Experimental study on single particle breaking strength and mode of calcareous sand [J]. Rock and Soil Mechanics, 2022, 43 (S1): 312-320.
- JIANG Mingjing, YANG Kaixin, CHEN Youliang, et al. Experimental study on single particle fragmentation of calcareous sand in South China Sea [J]. Journal of Hunan University (Natural Science Edition), 2018, 45 (S1): 150-155.
- HU Jin-fang, YANG Qigui, XIONG Kun, et al. Experimental study on crushing characteristics of soft rock damming particles [J]. Rock and Soil Mechanics, 2024, 45 (S1): 359-370.
- MI Xiaofei, CHI Shichun. Research on Scale Effect of Rockfill Partial Strength [J]. Journal of Water Resources and Architectural Engineering, 2019, 17 (04): 182-187+197.
- CHEN Jing, LIU Yangzepeng, HU Qihang, et al. Effects of Particle Size and Grading on the Breakage of Railway Ballast: Laboratory Testing and Numerical Modeling [J]. Sustainability, 2023, 15 (23).
- YANG Qiyi, WEN Wei, ZENG Ling, et al. Research on the dynamic resilience characters of carbonaceous mudstone soil-rock mixture under wet-dry cycles [J]. Bulletin of Engineering Geology and the Environment, 2024, 83 (7).
- ZHANG Yanan. Study on Macro-mesoscopic Mechanical Properties of Single Particle Crushing [D]. Wuhan University, 2019.
- WANG Xuejun, HAN Xiongyang, et al. Ballast part modeling method based on Rblock and DEM numerical simulation of single particle crushing [J]. Construction and Building Materials, 2025, 474141052-141052.
- JIN Aibing, et al. Numeral modeling of the crushing characters of single ore particle based on breakable Voronoi block model [J]. Powder Technology, 2024, 445120114-120114.
- ZINGG T. Beitrag Zur Schotter Analyse [D]. [S.1.]: ETH Zurich, 1935.
- MANDELBROT B B. The fractal geometry of nature [M]. San Franciso: W.H. Freeman, 1983.
- XIE Heping. Fractal geometry and its application to rock and soil materials [J]. Chinese Journal of Geotechnical Engineering, 1992, 14 (1): 14-24.
- MCDOWELL G R, AMON A. The application of Weibull statistics to the fraction of soil parts [J]. Soils and Foundations, 2000, 40 (5): 133-141.
- OVALLE C, FROSSARD E, DANO C, et al. The effect of size on the strength of coarse rock aggregates and large rockfill samples through experiential data [J]. Acta Mechanica, 2014, 225: 2199-2216. [CrossRef]
Figure 1.
Classification Diagram of Four Shapes and Size Fractions.
Figure 2.
Sample Diagram Showing Partial Particle Size Ranging from 40 to 50 mm.
Figure 3.
Curves Plot of Four Fragmentation Modes.
Figure 4.
Fractal Distribution Curves of Coal Lumps under Different Fragmentation Modes.
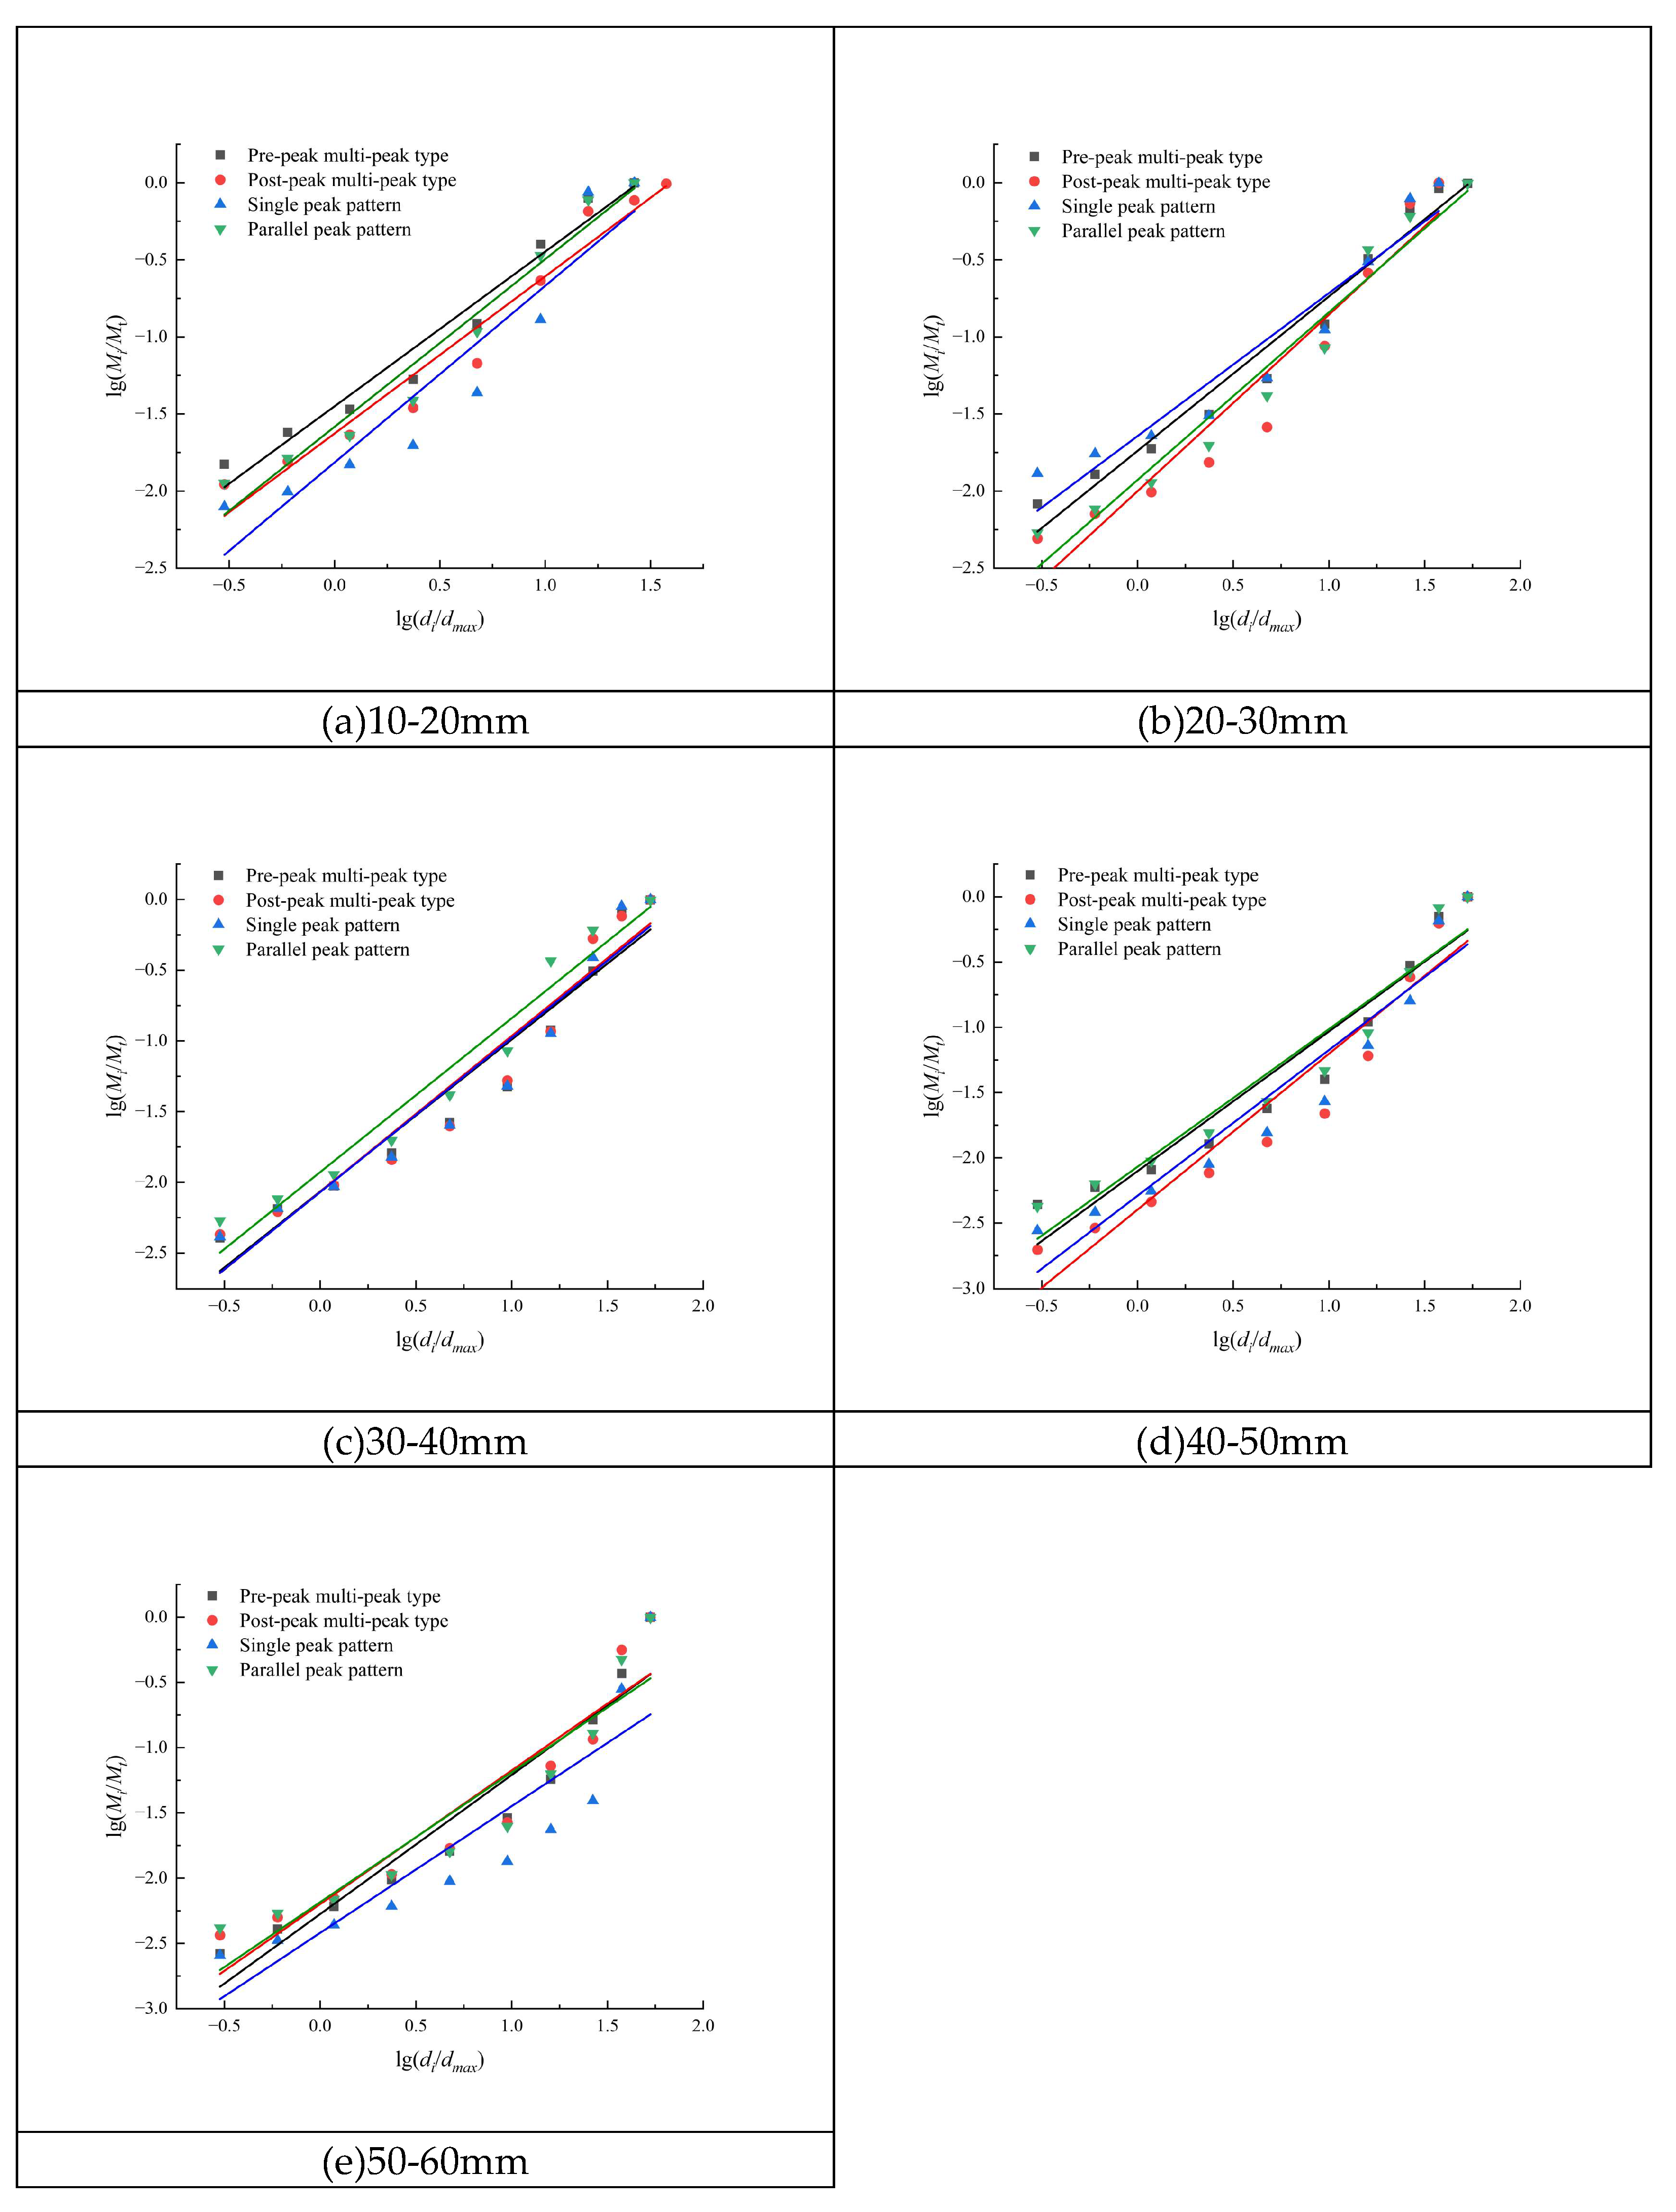
Figure 5.
Fractal Distribution Curves of Coal Lumps with Different.
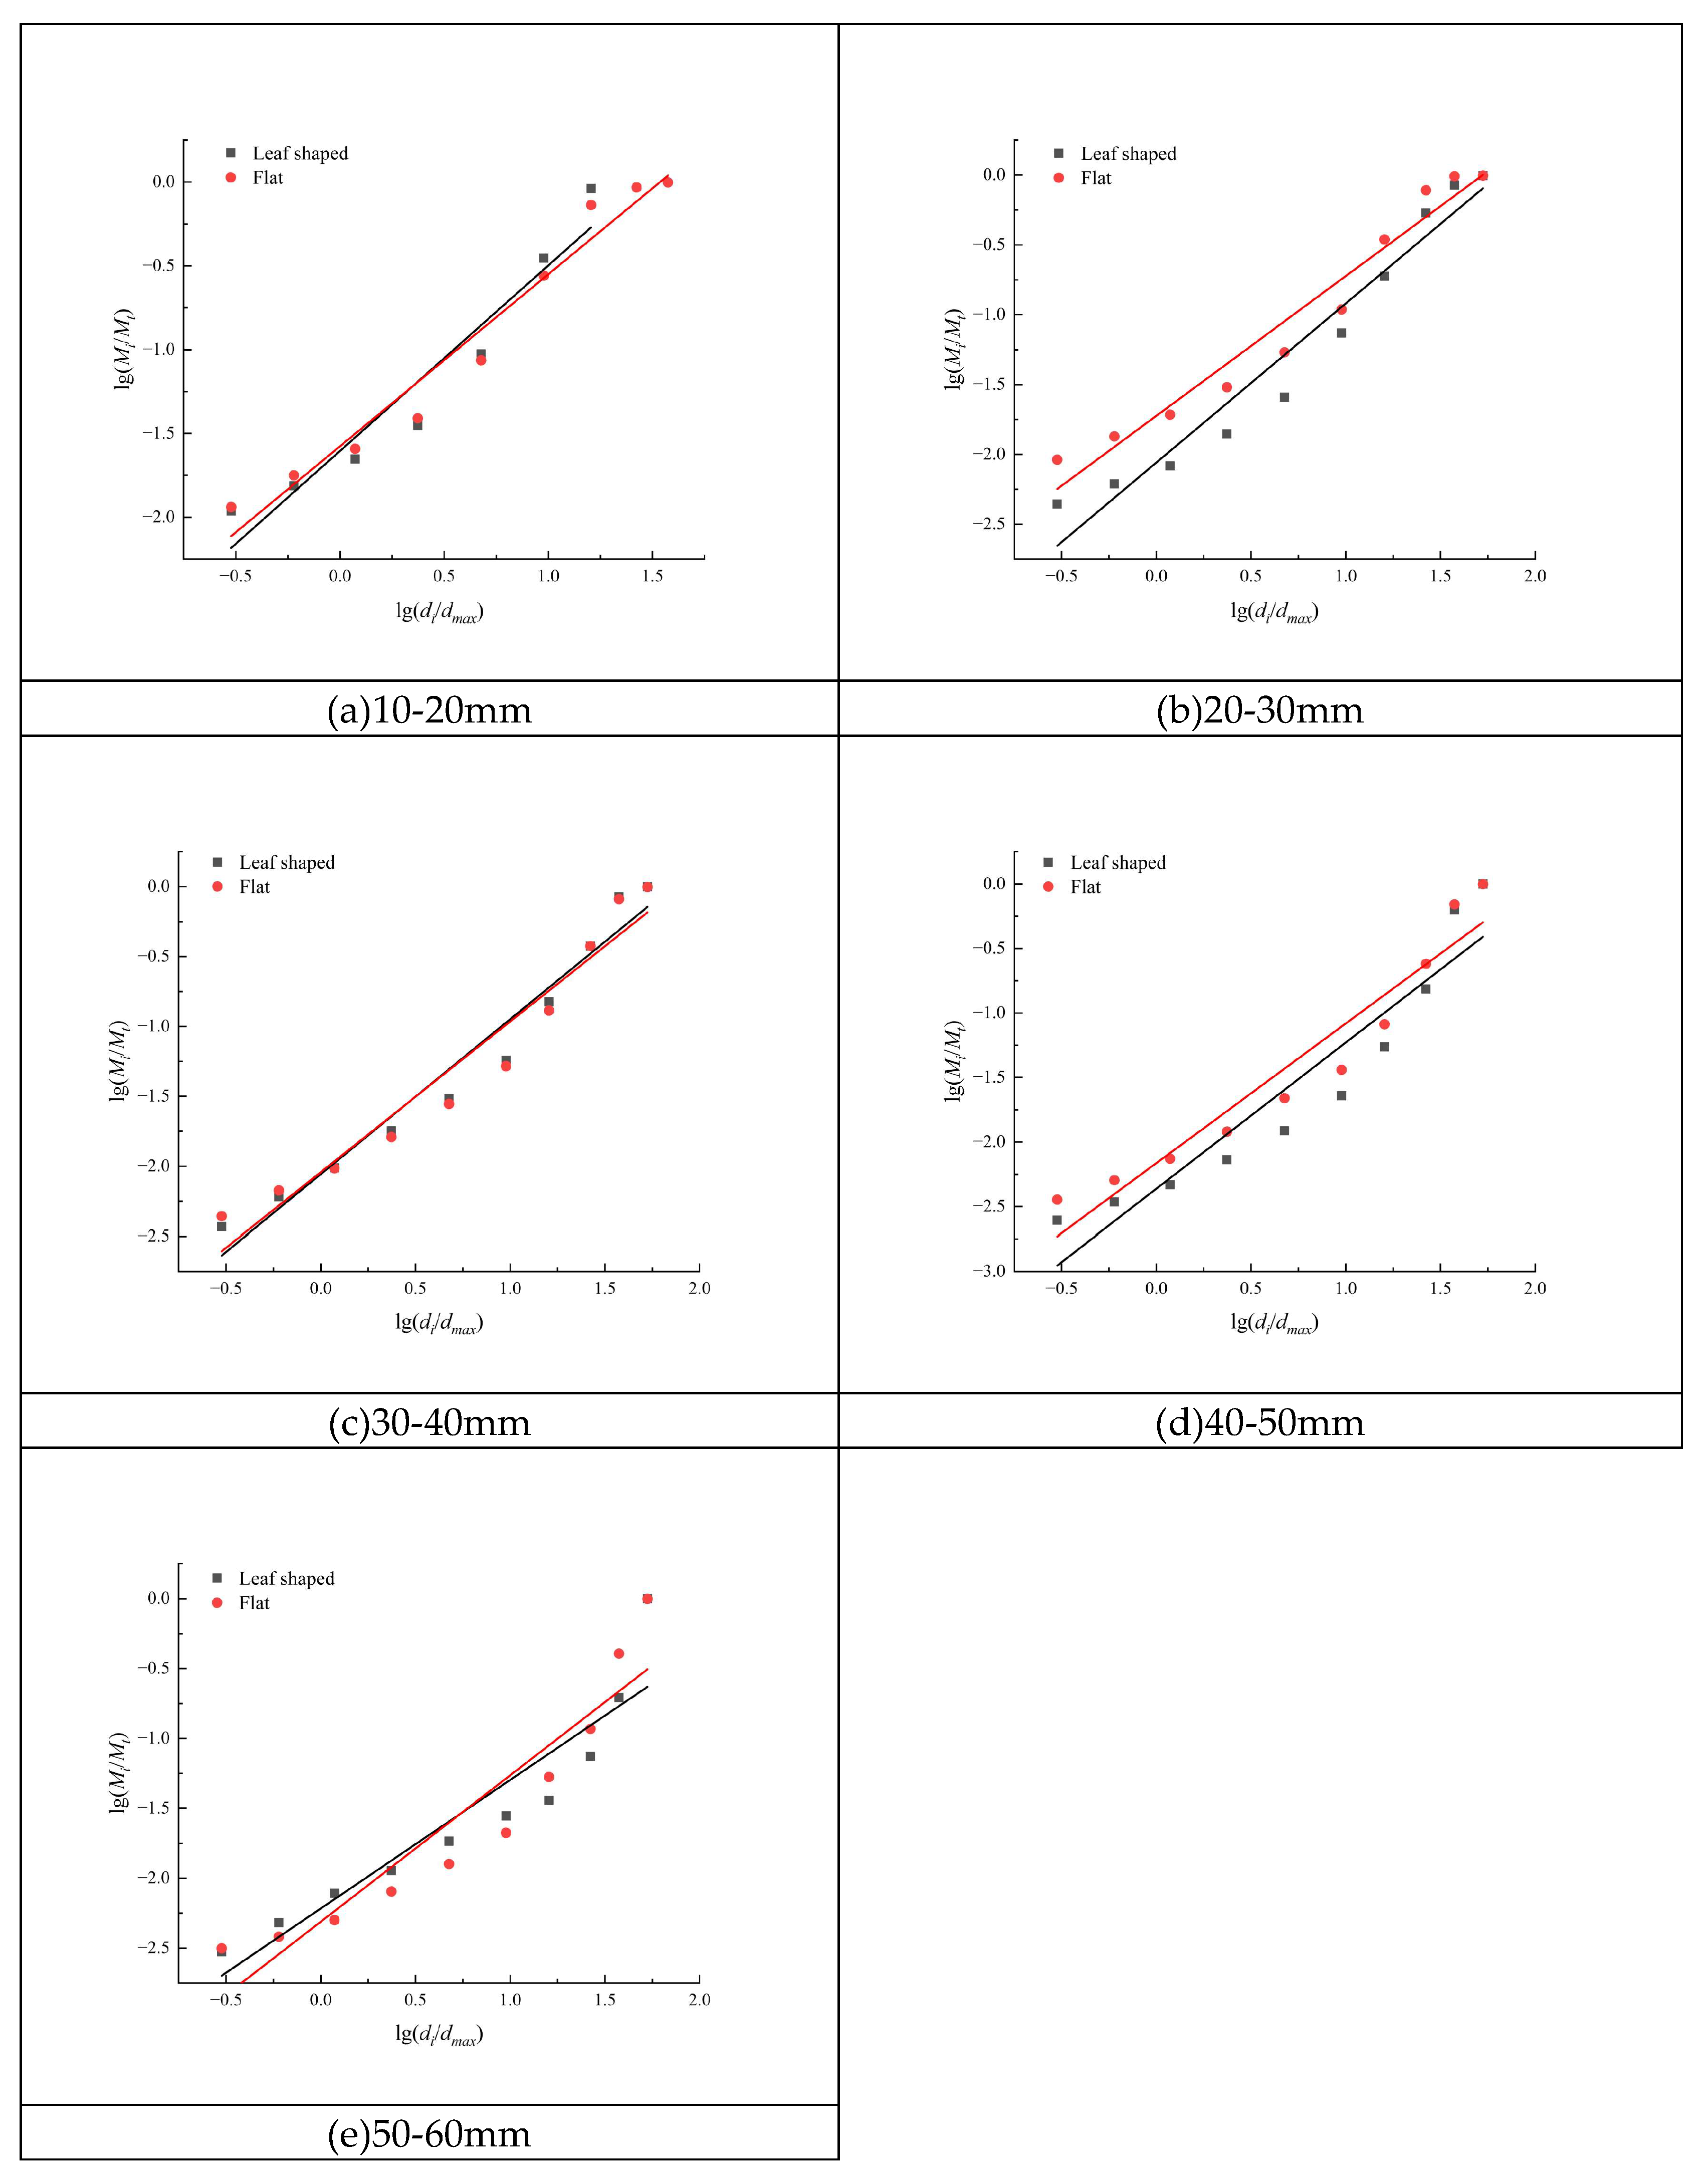
Figure 6.
Curves of Weibull Distribution for Coal Lumps under Different Fragmentation Modes.
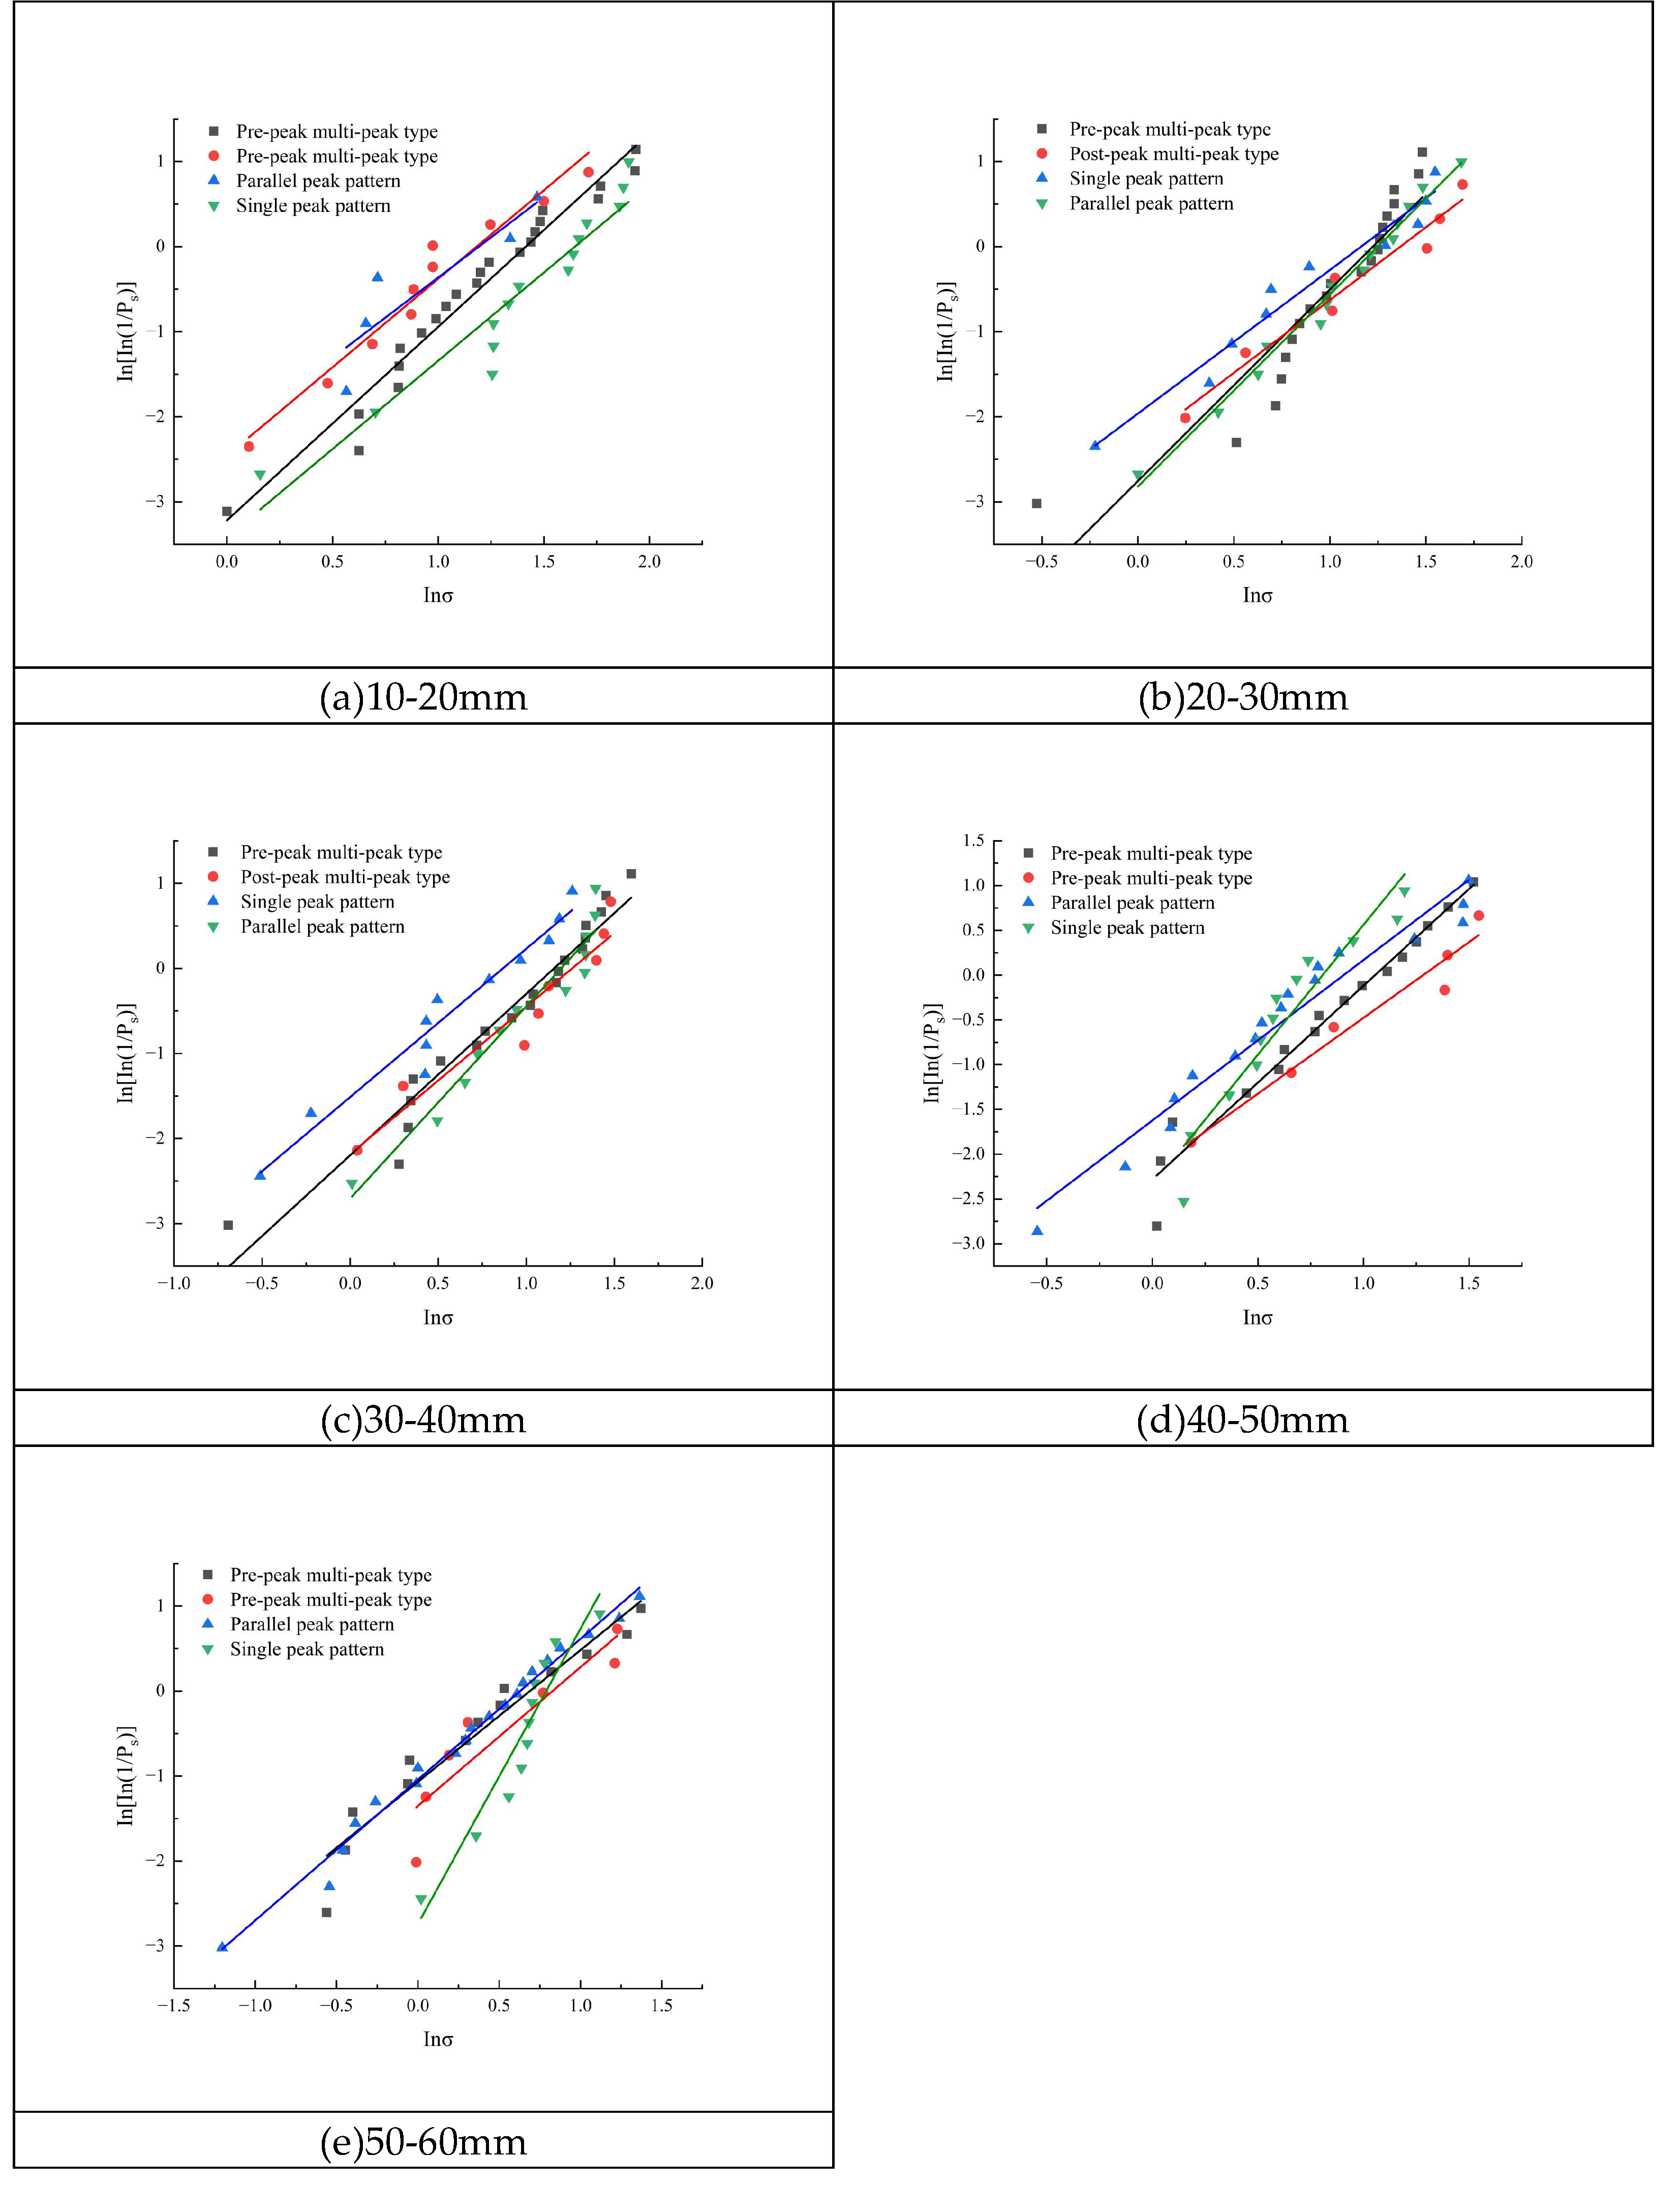
Figure 7.
Weibull Distribution Curves of Coal Lumps under Different Geometric Shapes.
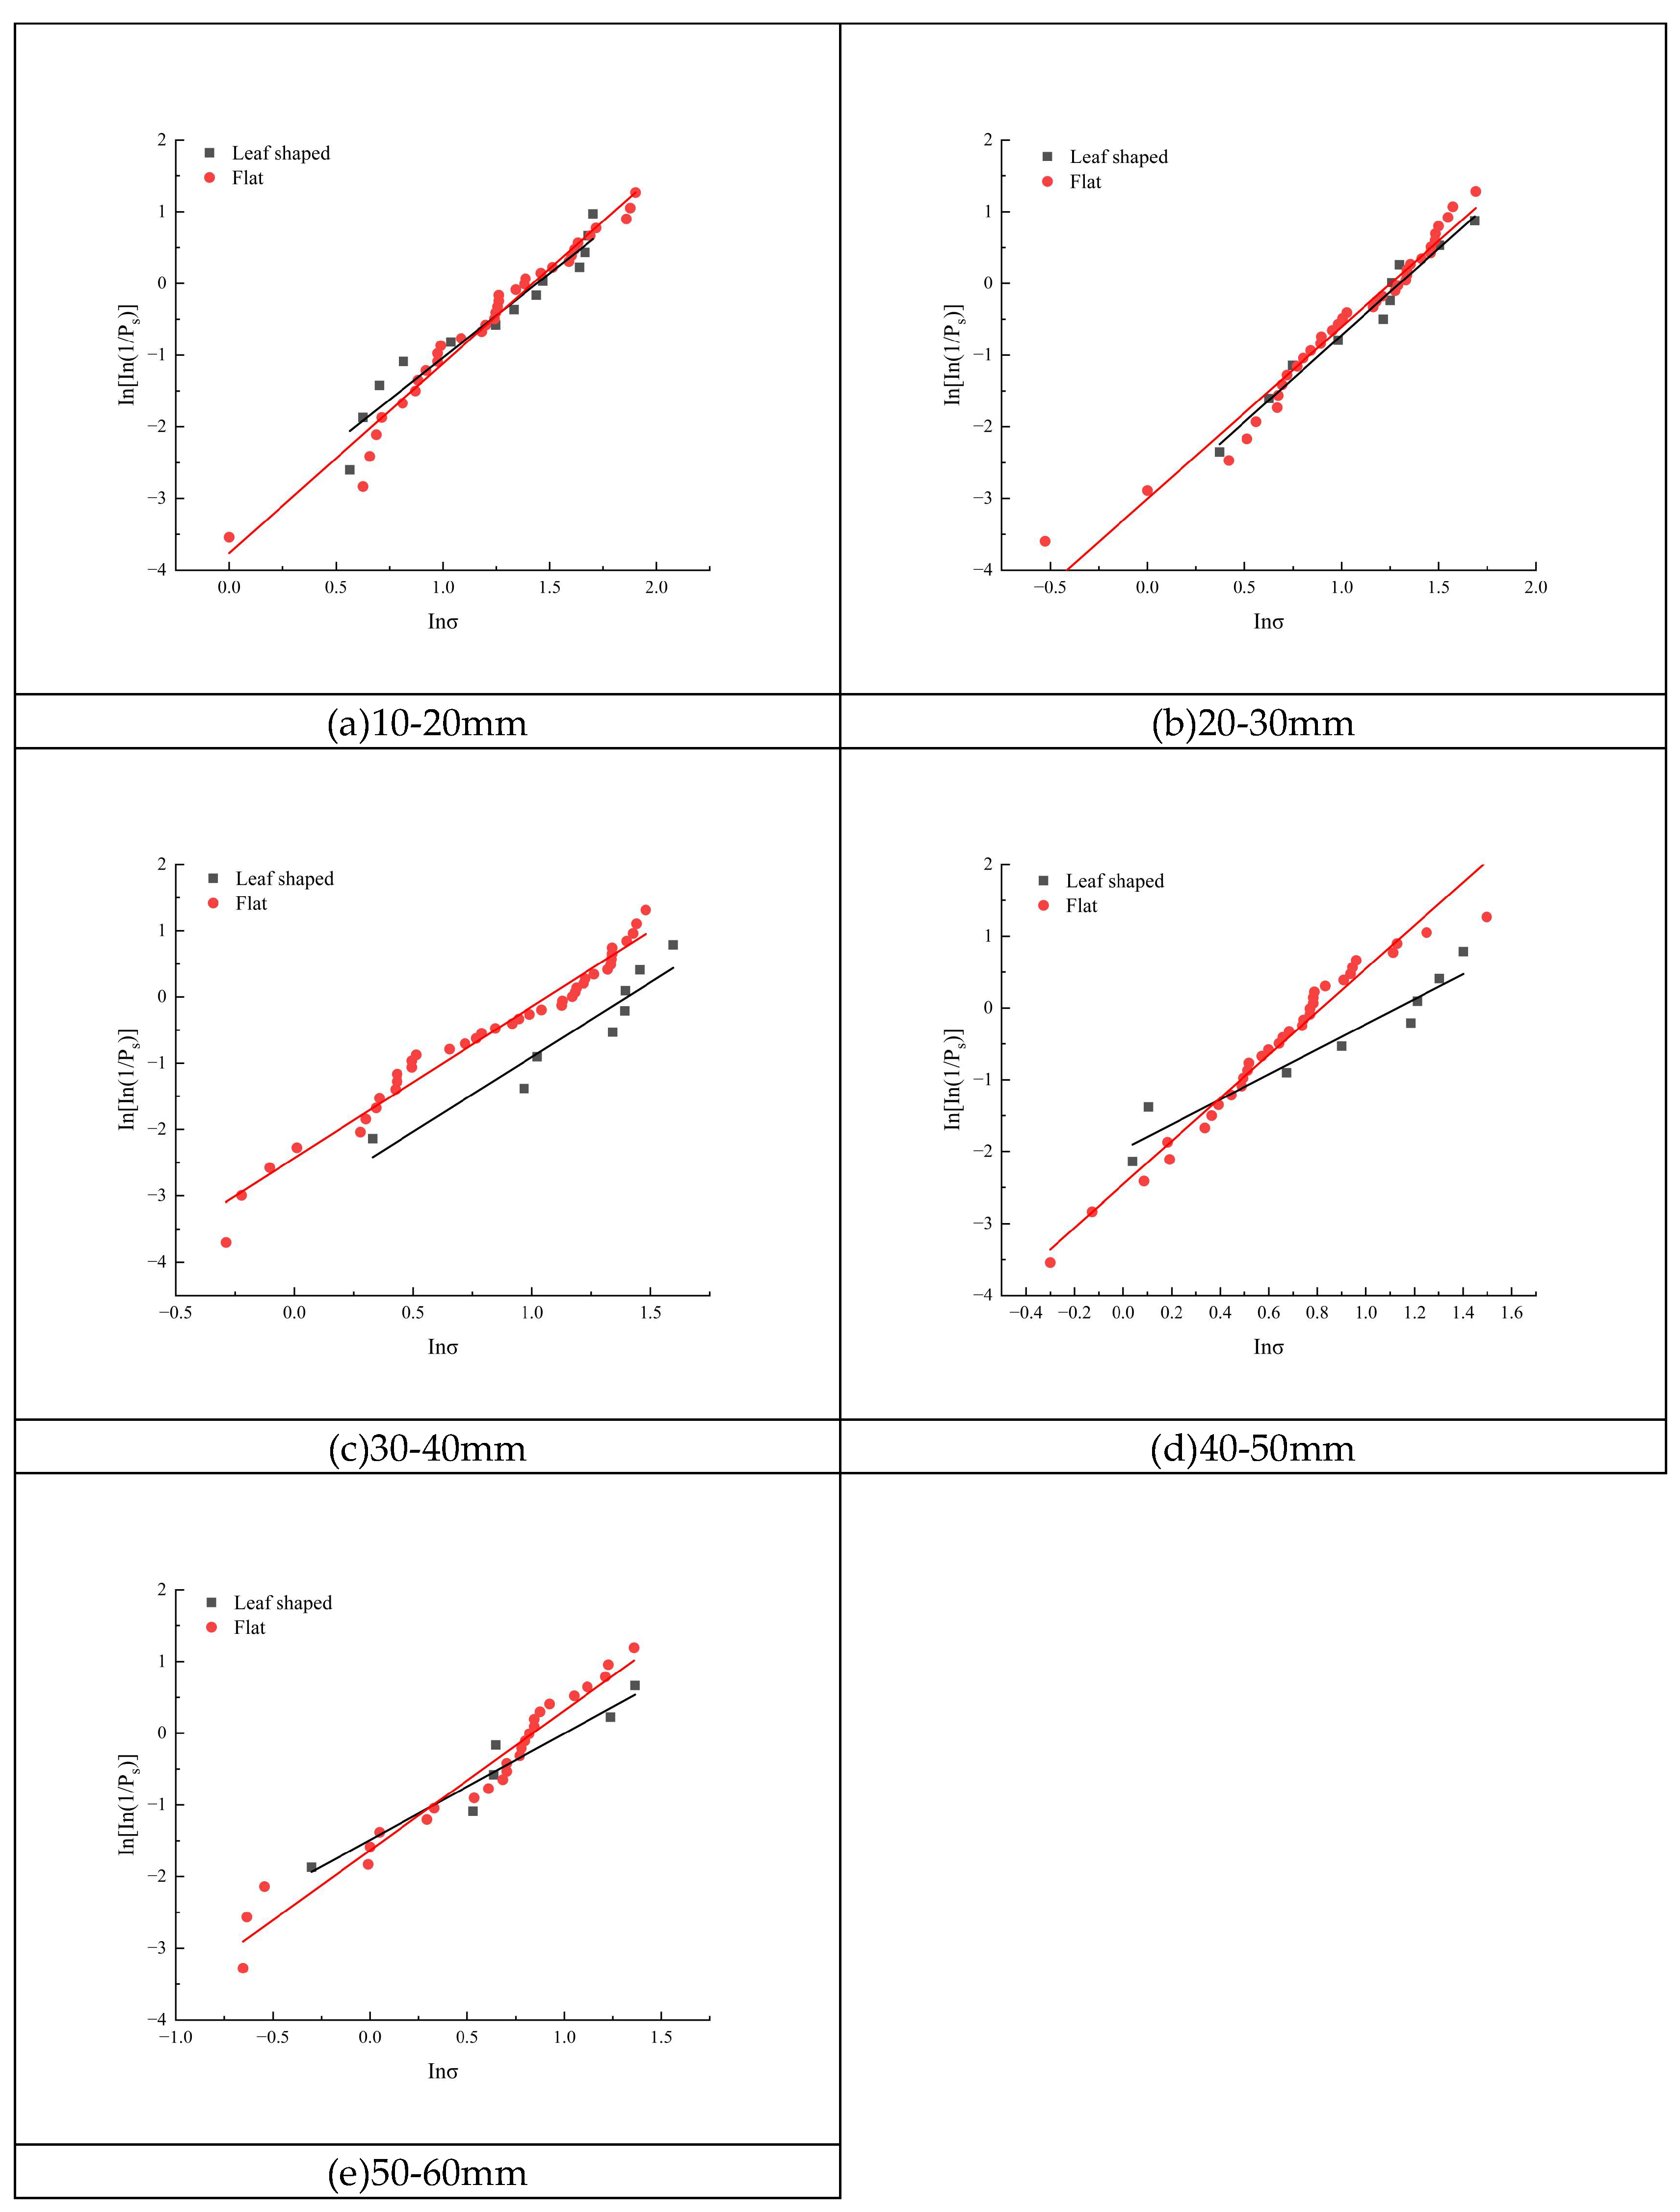
Figure 8.
Size Effect on Coal Lump Strength based on Weibull Distribution.

Figure 9.
Coal Lump Crushing Strength and Displacement Curve under Different Porosity.

Figure 10.
Fracture Distribution Rose Diagrams at Various Porosity Levels.
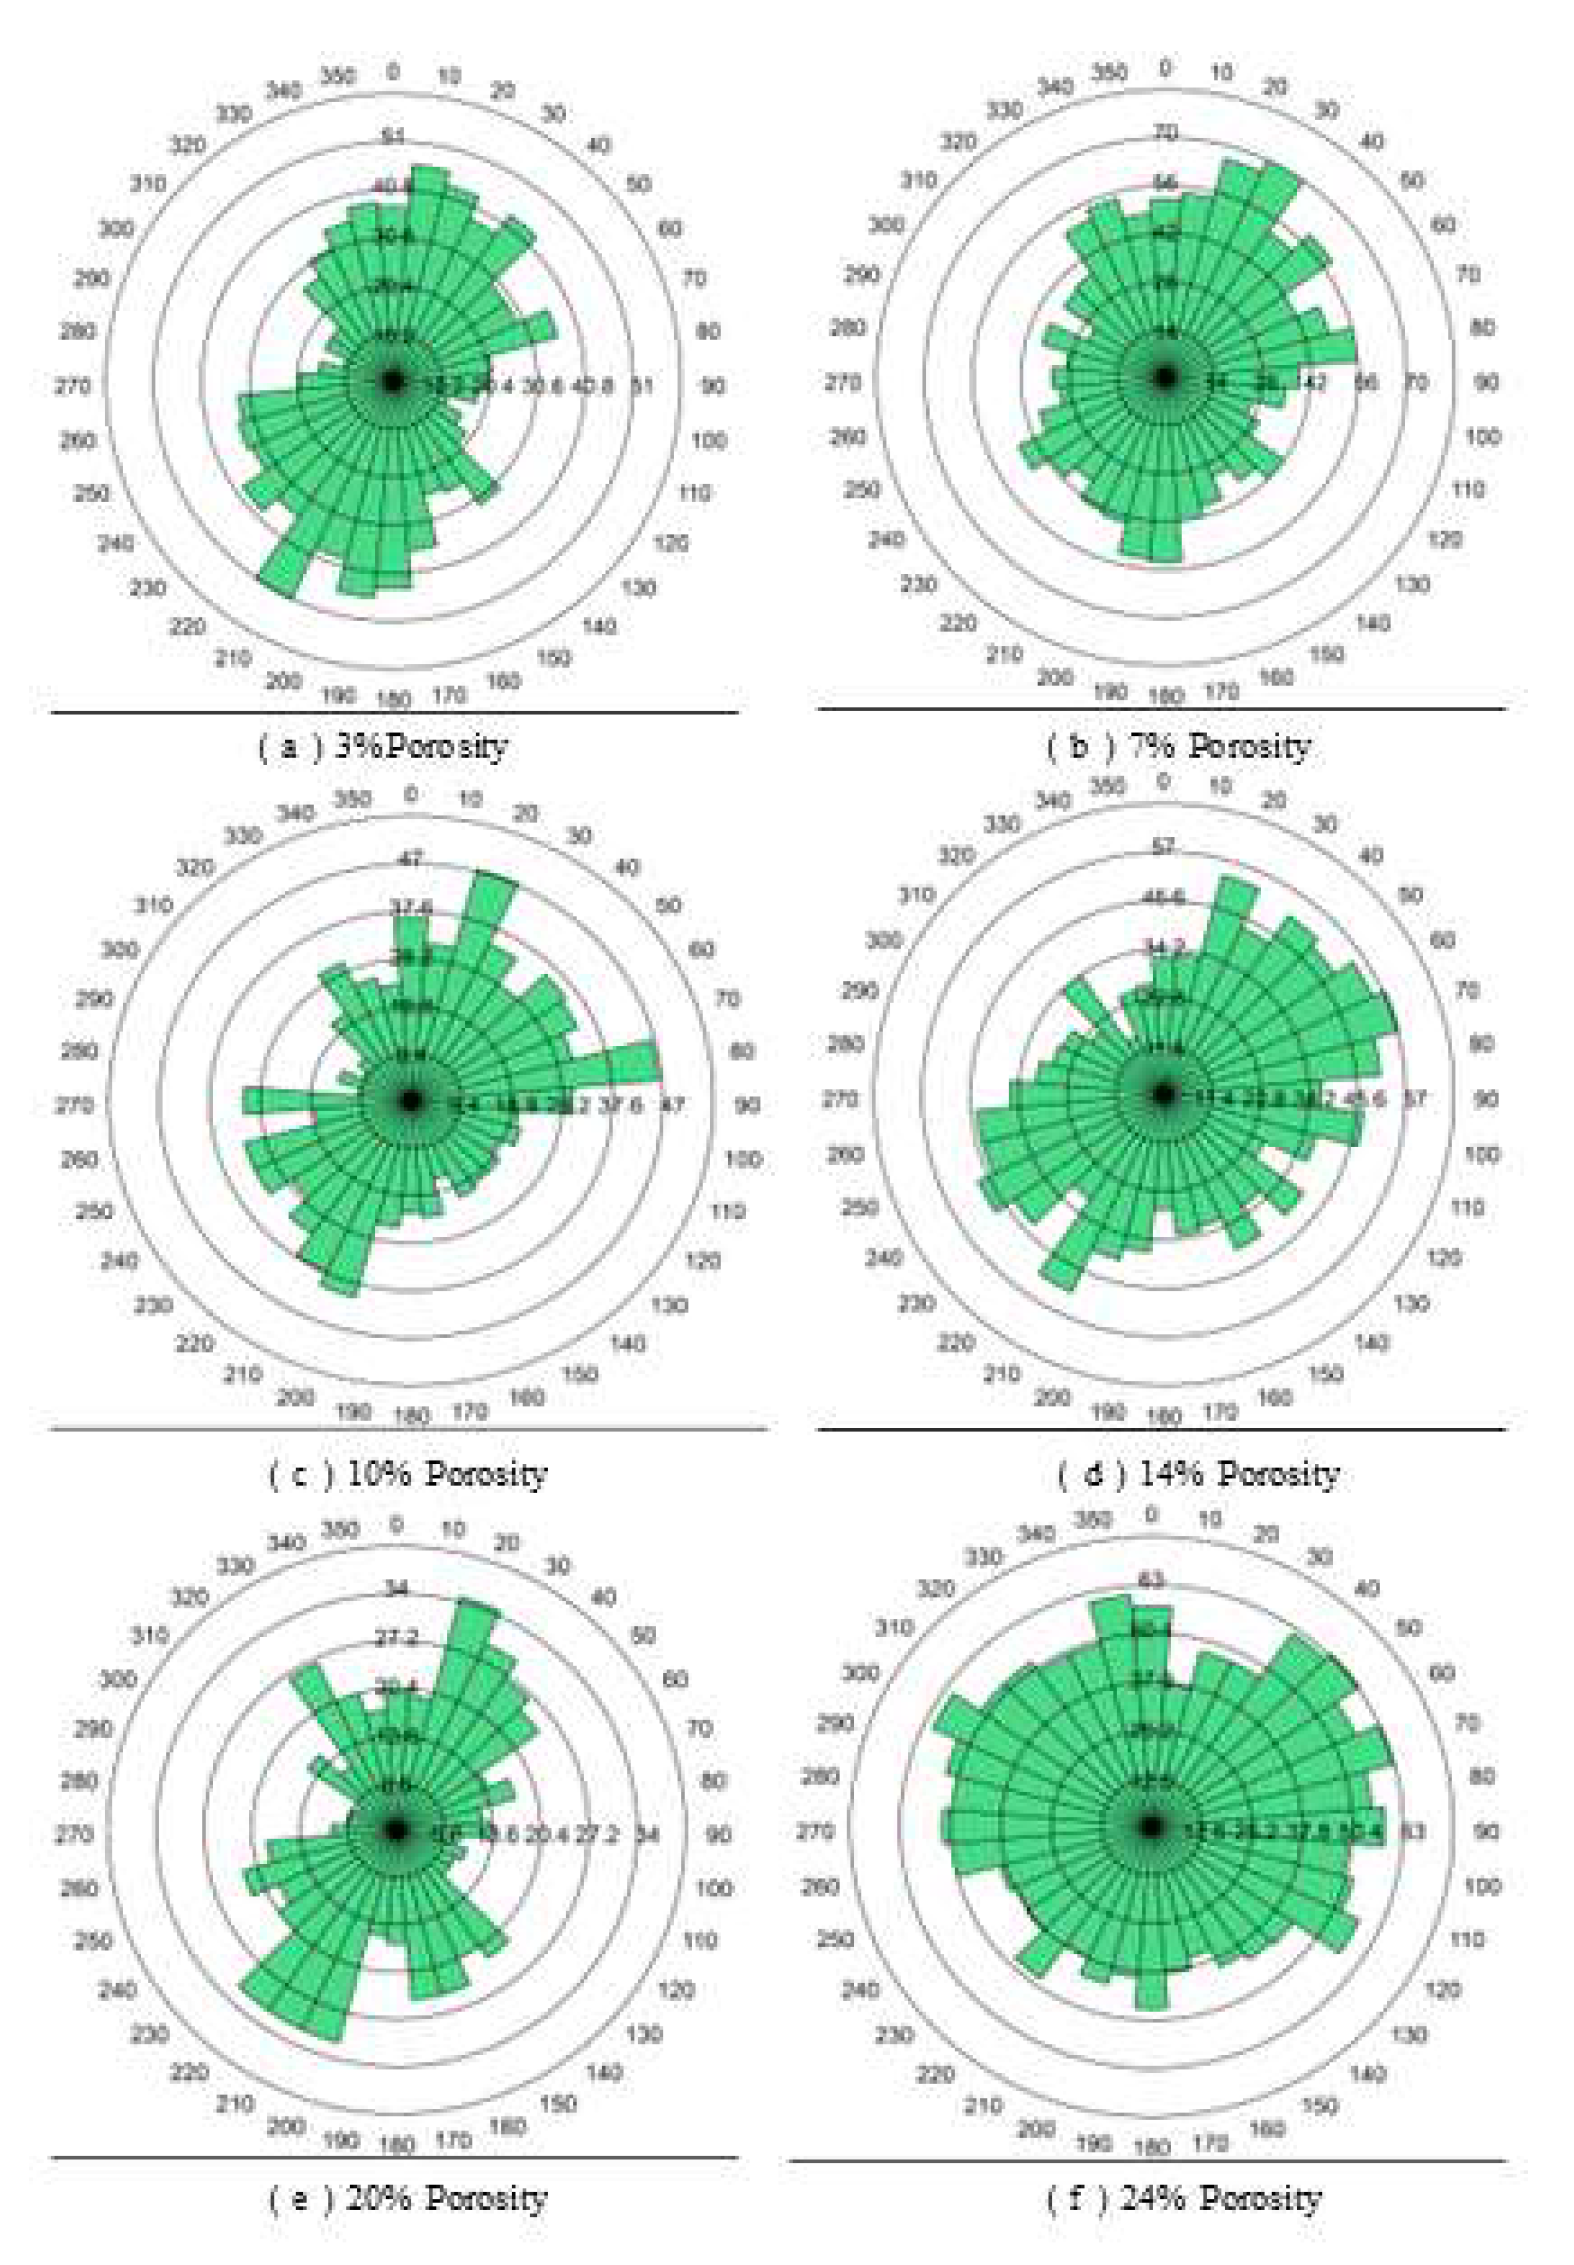
Figure 11.
Curves of Different Elastic Moduli.
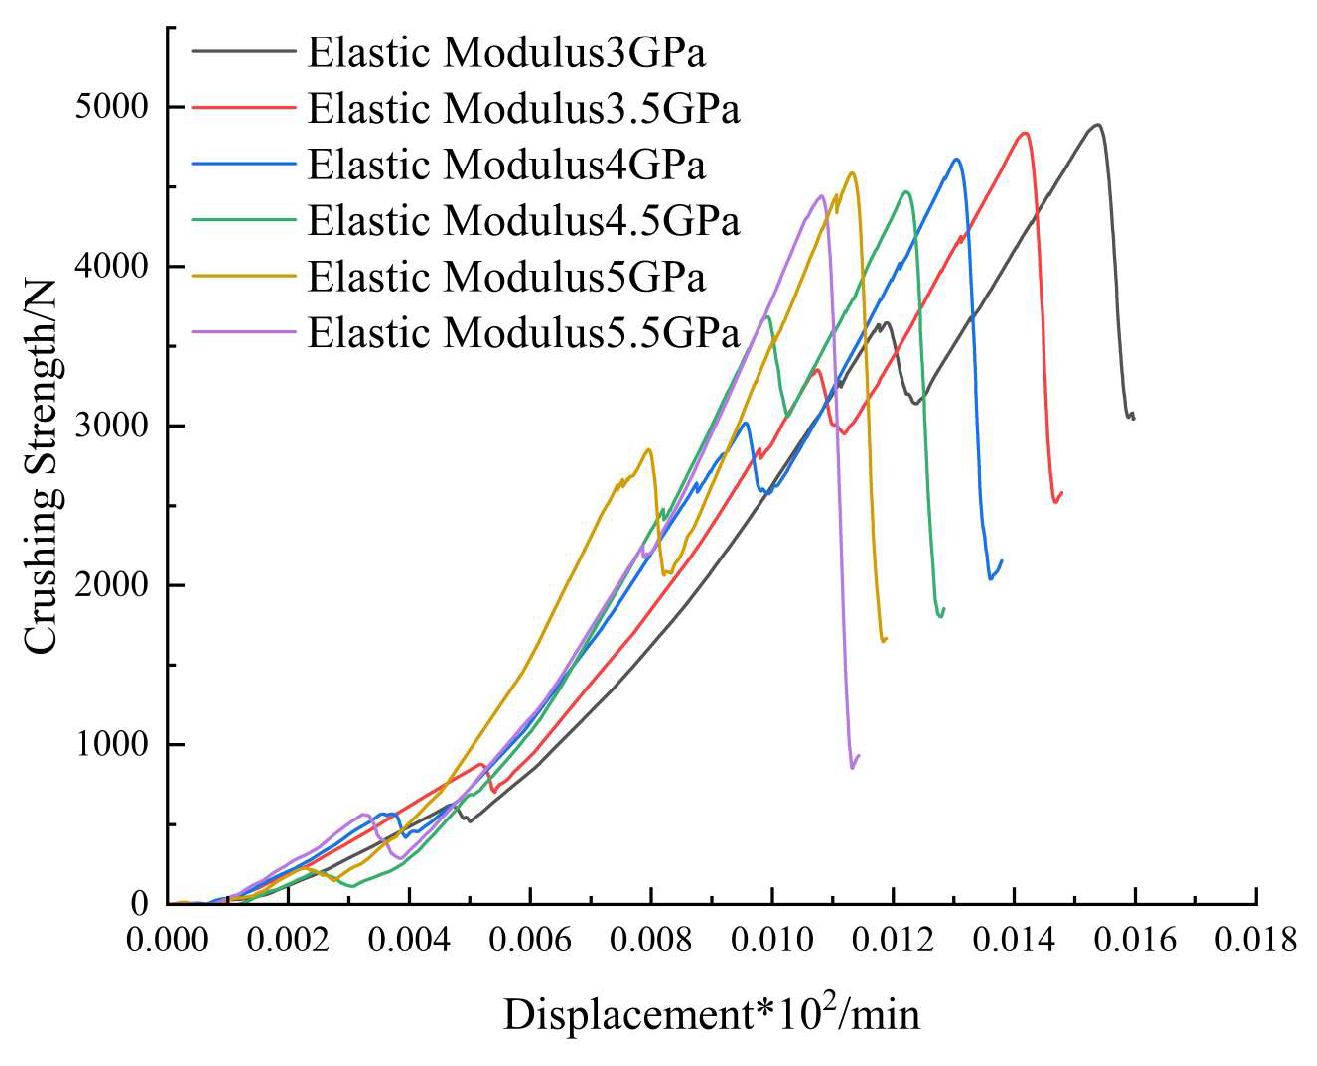
Figure 12.
Rose Diagram of Crack Distribution in Coal Lumps under Different Elastic Moduli.
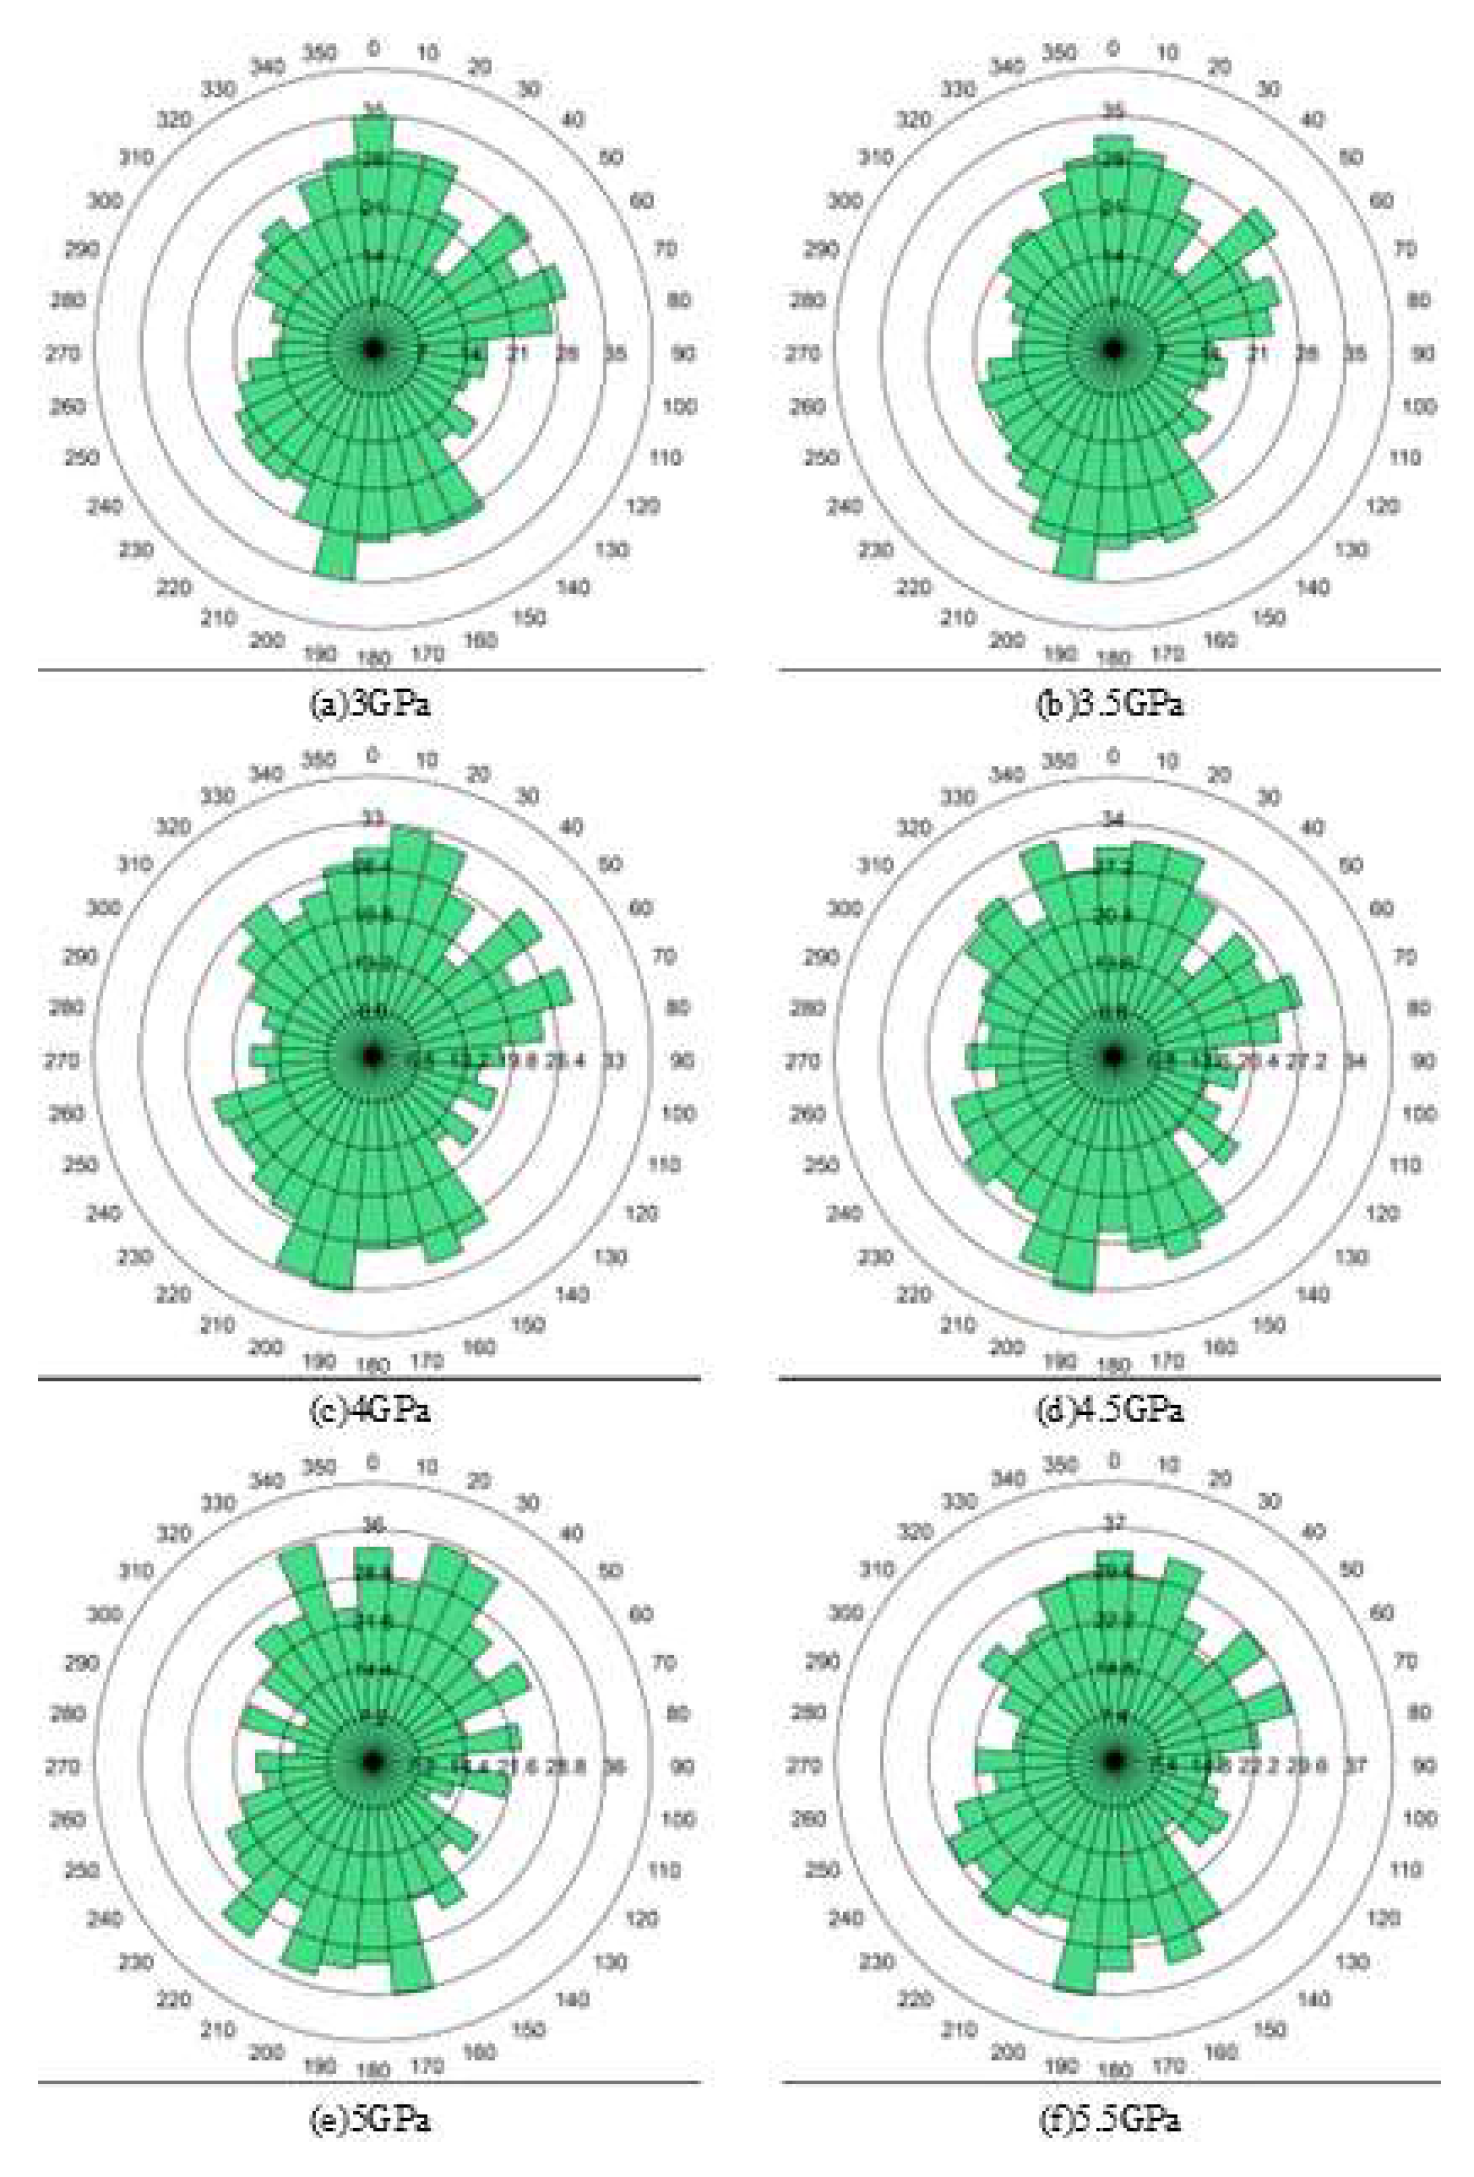
Figure 13.
Curves under Different Cohesive Stresses.
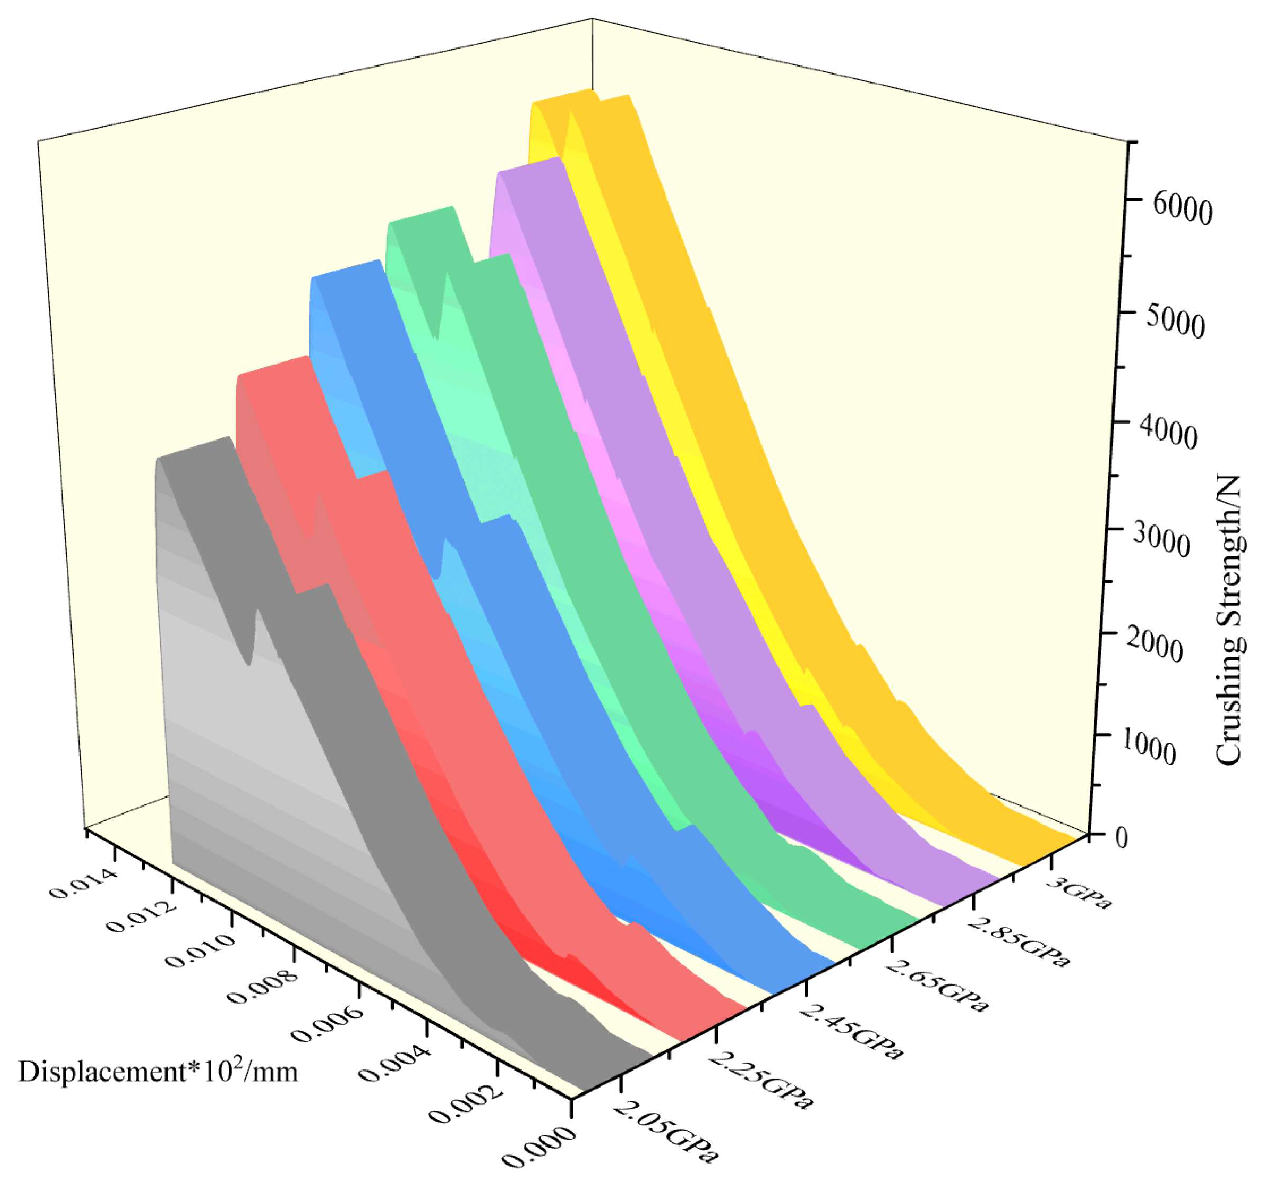
Figure 14.
Rose Diagram of Crack Distribution in Coal Lumps under Different Cohesive Stresses.
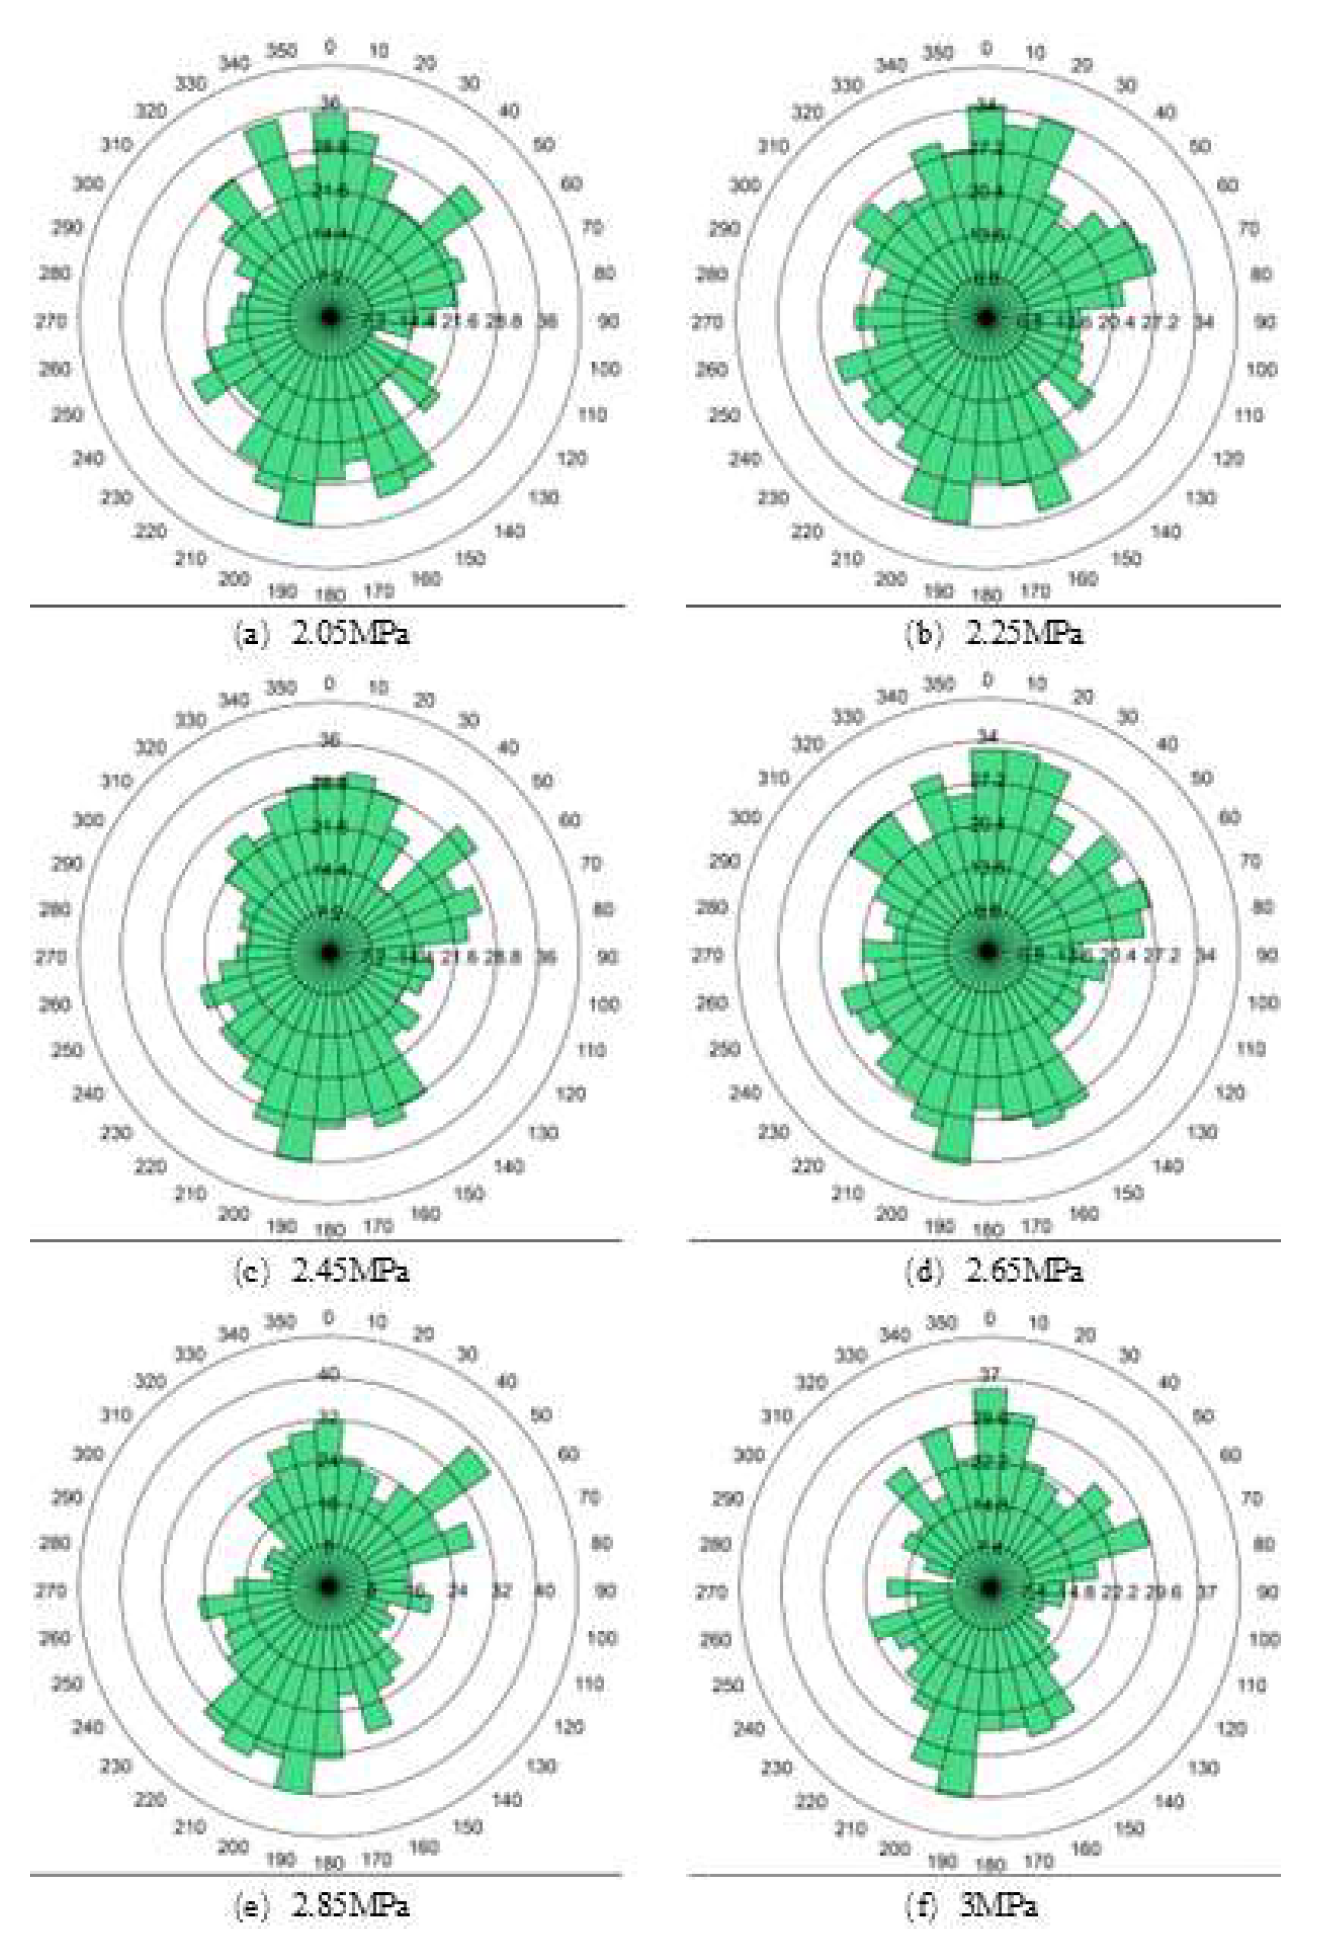
Figure 15.
Curves under Different Loading Rates.
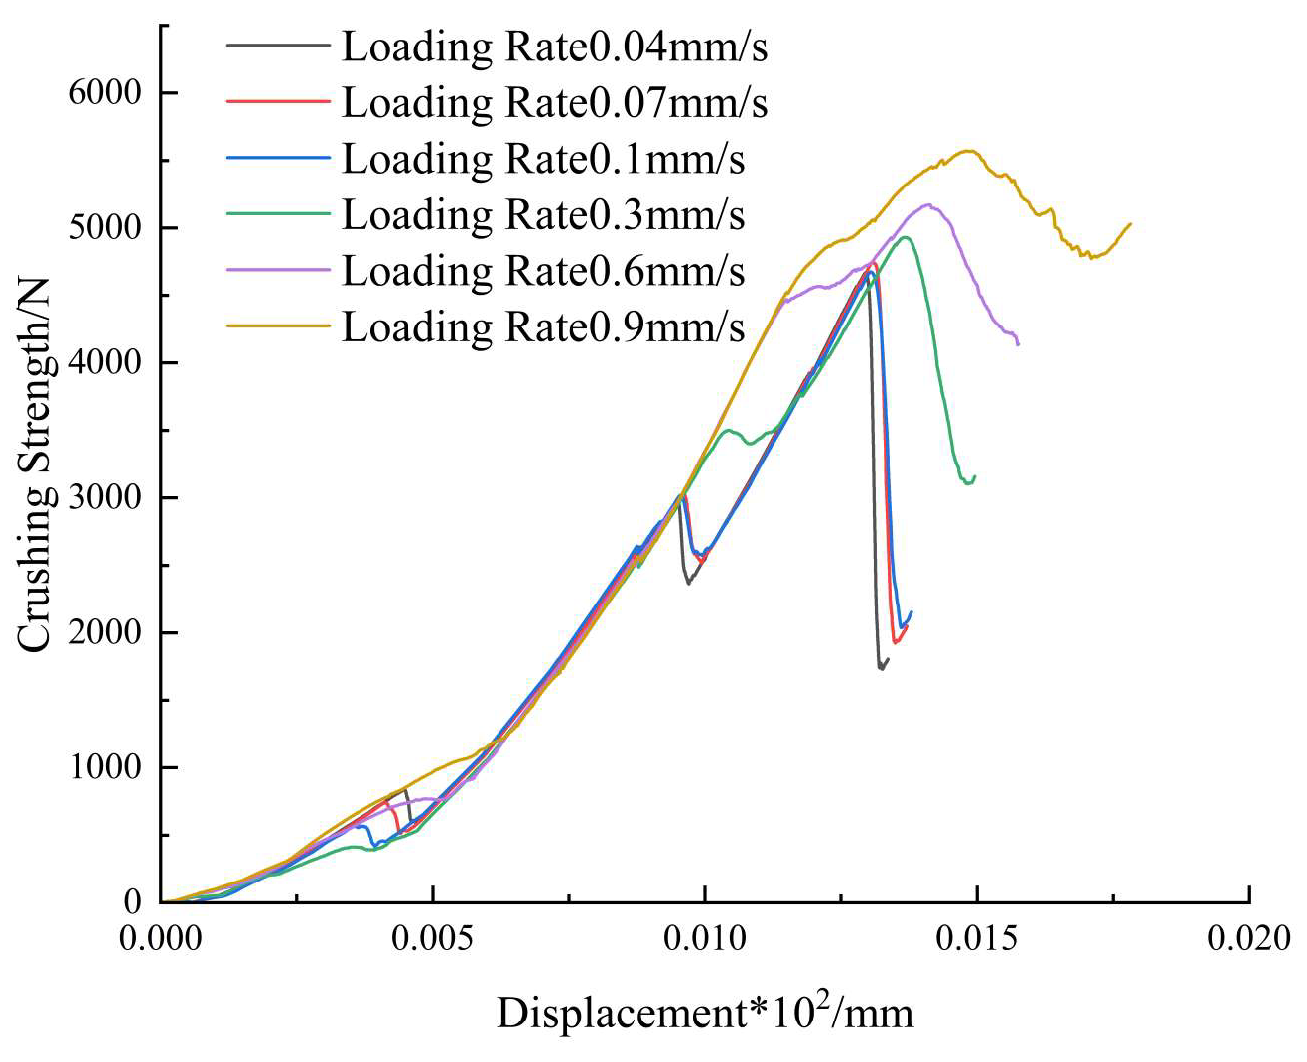
Figure 16.
Rose Diagram of Crack Distribution in Coal Lumps under Different Loading Rates.
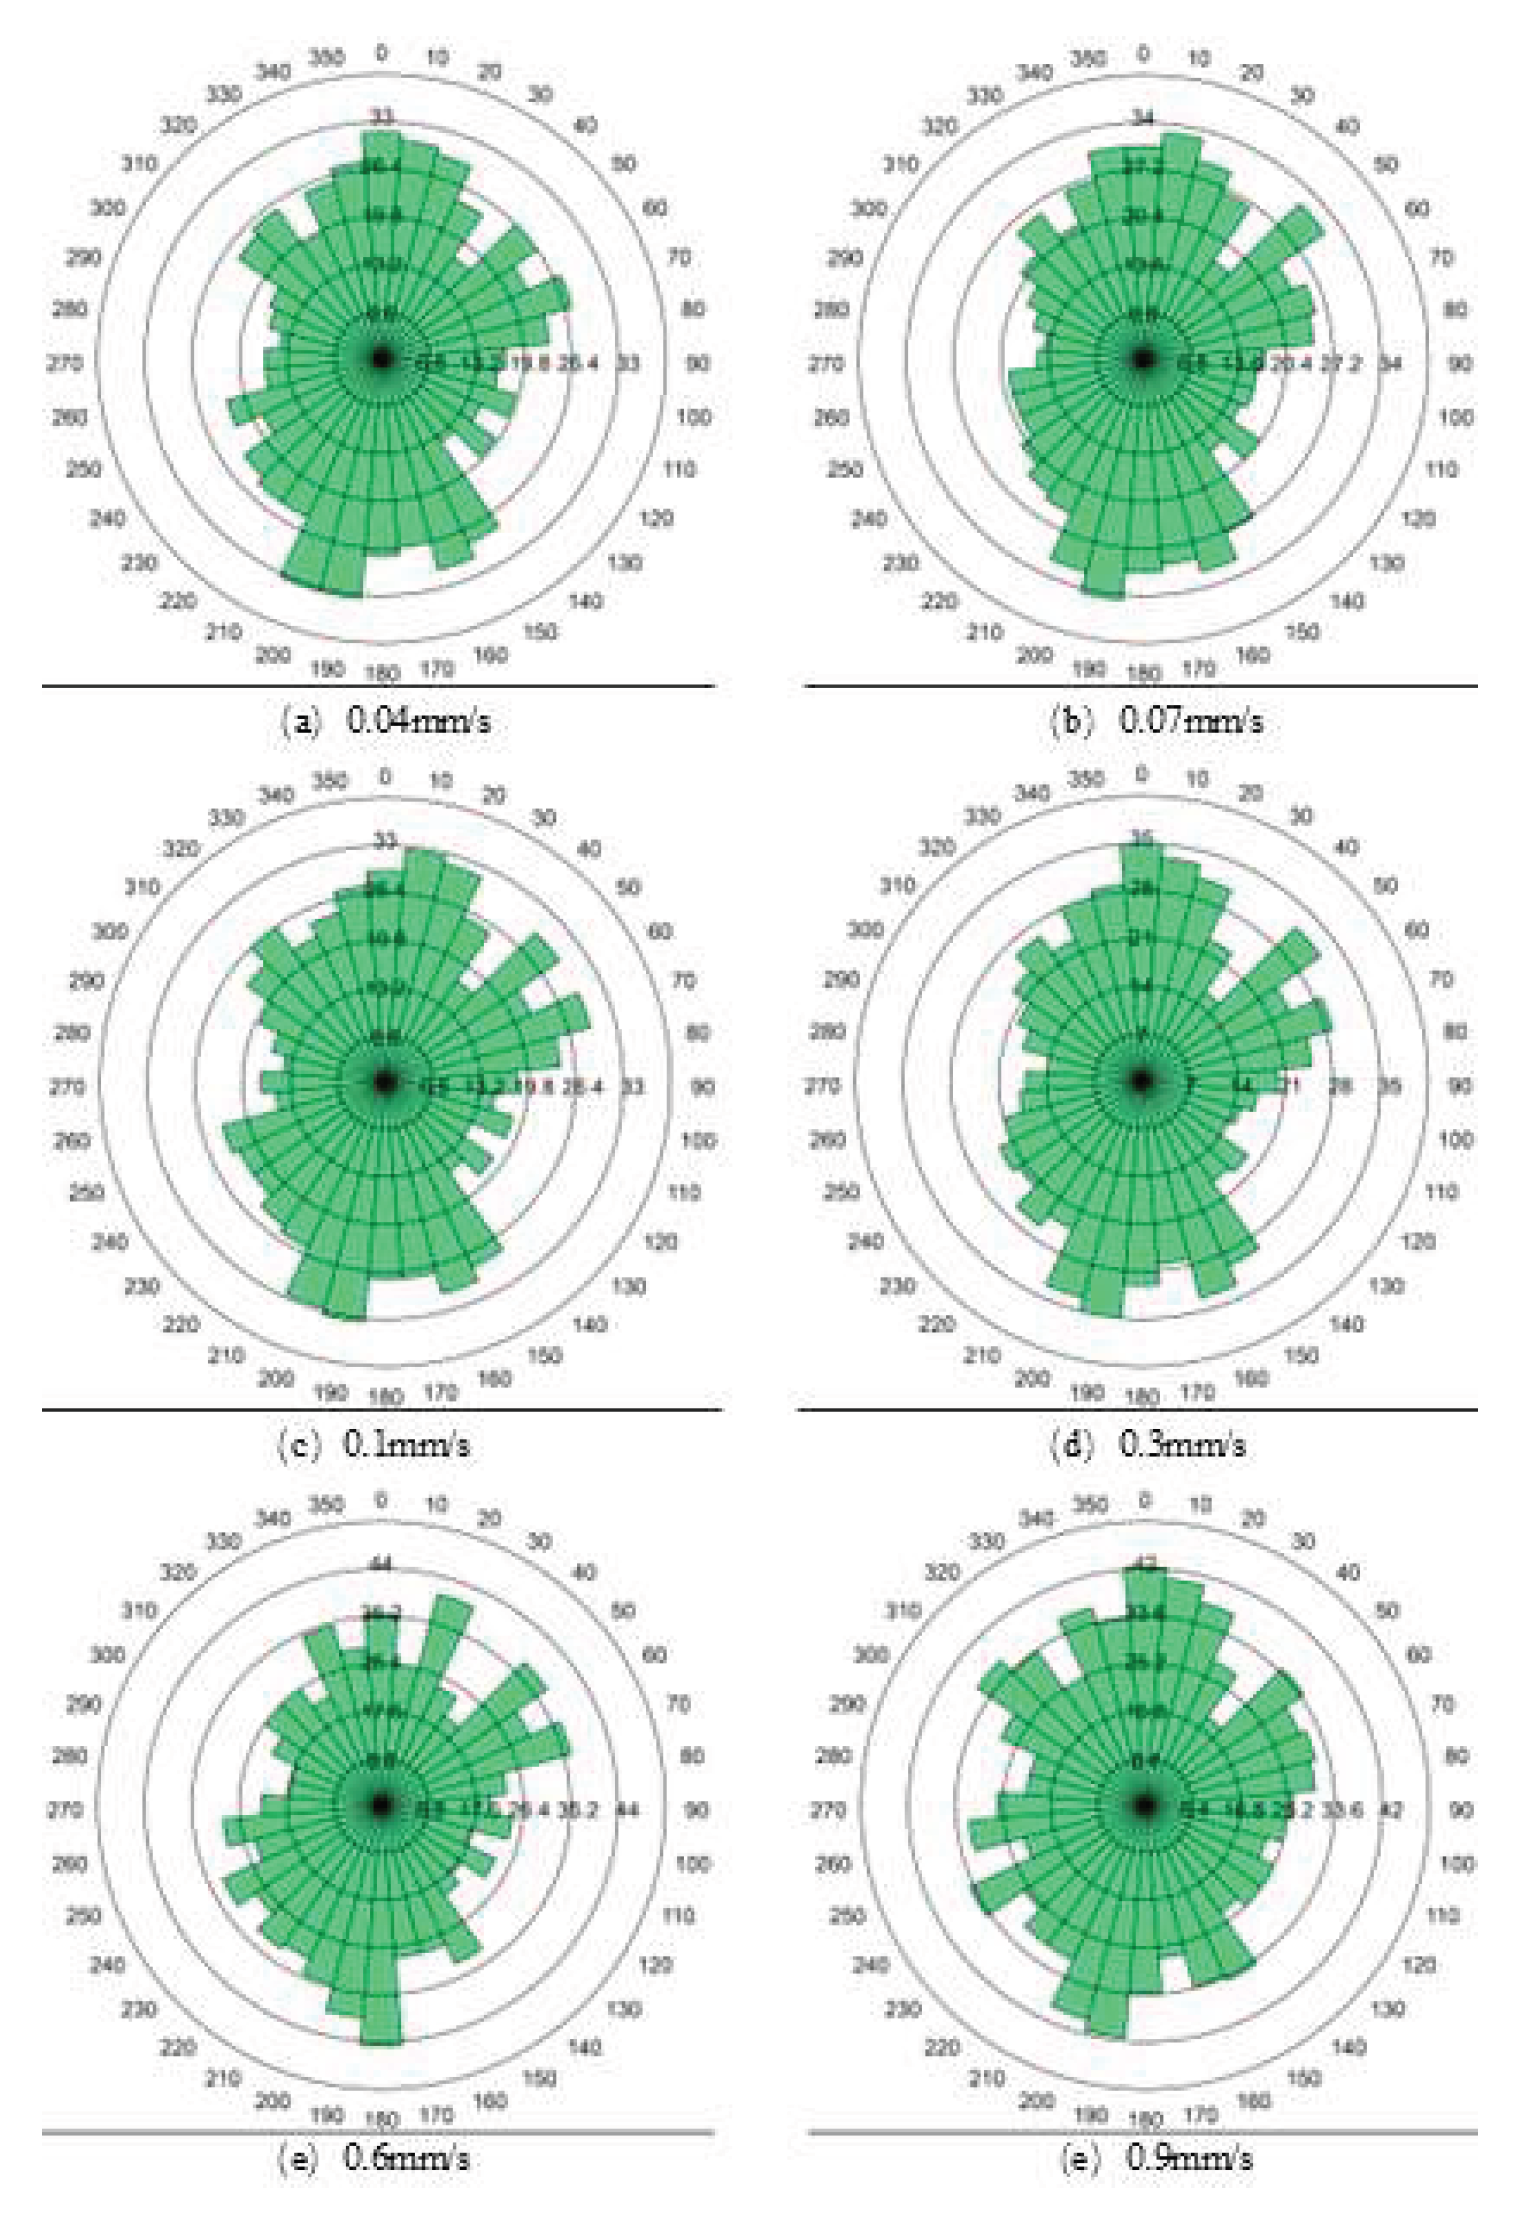

Table 1.
Fitting Statistics of the Fractal Distribution for Coal Lumps under Different Fragmentation Modes.
Table 1.
Fitting Statistics of the Fractal Distribution for Coal Lumps under Different Fragmentation Modes.
|
Particle size/mm |
Fragmentation mode Fitting result |
Pre-peak multi-peak type | Post-peak multi-peak type |
Single peak pattern |
Parallel peak pattern |
| 10-20 | Linear fitting formula | y=0.93x-1.44 | y=0.94x-1.62 | y=0.98x-1. 81 | y=2x-1.58 |
| R2 | 0.96 | 0.95 | 0.89 | 0.96 | |
| Slope alpha | 0.93 | 0.94 | 0.98 | 1 | |
| Fractal dimension D | 2.07 | 2.06 | 2.02 | 2 | |
| 20-30 | Linear fitting formula | y=0.94x-1.73 | y=1.03x-2 | y=0.92x-1.64 | y=x-1.92 |
| R2 | 0.97 | 0.93 | 0.92 | 0.96 | |
| Slope alpha | 0.94 | 1.03 | 0.92 | 1 | |
| Fractal dimension D | 2.06 | 1.97 | 2.08 | 2 | |
| 30-40 | Linear fitting formula | y=0.98x-2. 06 | y=x-2.06 | y=0.99x-2.06 | y=x-1.92 |
| R2 | 0.94 | 0.93 | 0.93 | 0.95 | |
| Slope alpha | 0.98 | 1 | 0.99 | 1 | |
| Fractal dimension D | 2.02 | 2 | 2.01 | 2 | |
| 40-50 | Linear fitting formula | y=0.96x-2.10 | y=1.06x-2.39 | y=1.11x-2.29 | y=0.95x-2.06 |
| R2 | 0.92 | 0.91 | 0.91 | 0.93 | |
| Slope alpha | 0.96 | 1.06 | 0.99 | 0.95 | |
| Fractal dimension D | 2.04 | 1.94 | 2.01 | 2.05 | |
| 50-60 | Linear fitting formula | y=0.96x-2.27 | y=0.89x-2.19 | y=0.97x-2.41 | y=0.99x-2.18 |
| R2 | 0.92 | 0.87 | 0.79 | 0.87 | |
| Slope alpha | 0.95 | 0.89 | 0.97 | 0.99 | |
| Fractal dimension D | 2.05 | 2.11 | 2.03 | 2.01 |
Table 2.
Fitting Statistics of the Fractal Distribution for Coal Lumps with Different Shapes.
| Particle size/mm |
Fragmentation mode Fitting result |
Leaf shaped | Flat |
| 10-20 | Linear fitting formula | y=2.03x-1.6 | y=0.95x-1.57 |
| R2 | 0.92 | 0.96 | |
| Slope alpha | 0.97 | 0.95 | |
| Fractal dimension D | 2.03 | 2.05 | |
| 20-30 | Linear fitting formula | y=1.04x-2.05 | y=0.93x-1.72 |
| R2 | 0.95 | 0.95 | |
| Slope alpha | 1.04 | 0.93 | |
| Fractal dimension D | 1.96 | 2.07 | |
| 30-40 | Linear fitting formula | y =1.03x-2.05 | y=0.98x-2.04 |
| R2 | 0.96 | 0.94 | |
| Slope alpha | 1.03 | 0.98 | |
| Fractal dimension D | 1.97 | 2.02 | |
| 40-50 | Linear fitting formula | y=0.99x-2.36 | y =0.98x-2.16 |
| R2 | 0.89 | 0.92 | |
| Slope alpha | 0.99 | 0.98 | |
| Fractal dimension D | 2.01 | 2.02 | |
| 50-60 | Linear fitting formula | y=0.91x-2.21 | y=0.91x-2.31 |
| R2 | 0.87 | 0.88 | |
| Slope alpha | 0.91 | 0.91 | |
| Fractal dimension D | 2.09 | 2.09 |
Table 3.
Statistical Table of Weibull Distribution Parameters by Fragmentation Mode.
| Particle size/mm | Fragmentation mode | Fitting result | Weibull modulus m | Characteristic stress σ0 | R2 |
| 10-20mm | Pre-peak multi-peak type | y=2.18x-3.21 | 2.18 | 3.21 | 0.96 |
| Post-peak multi-peak type | y=2.08x-2.45 | 2.08 | 2.45 | 0.95 | |
| Single peak pattern | y=1.88x-2.25 | 1.88 | 2.25 | 0.80 | |
| Parallel peak pattern | y=2.25x-3.41 | 2.25 | 3.41 | 0.91 | |
| 20-30mm | Pre-peak multi-peak type | y=2.05x-2.75 | 2.05 | 2.75 | 0.86 |
| Post-peak multi-peak type | y=1.70x-2.33 | 1.70 | 2.33 | 0.96 | |
| Single peak pattern | y=1.68x-1.96 | 1.68 | 1.96 | 0.96 | |
| Parallel peak pattern | y=2.18x-2.81 | 2.18 | 2.81 | 0.98 | |
| 30-40mm | Pre-peak multi-peak type | y=2x-2.19 | 2.00 | 2.19 | 0.95 |
| Post-peak multi-peak type | y=1.93x-2.18 | 1.93 | 2.18 | 0.92 | |
| Single peak pattern | y=1.74x-1.51 | 1.74 | 1.70 | 0.95 | |
| Parallel peak pattern | y=2.08x-2.70 | 2.08 | 2.70 | 0.94 | |
| 40-50mm | Pre-peak multi-peak type | y=1.93x-2.02 | 1.93 | 2.02 | 0.96 |
| Post-peak multi-peak type | y=2.35x-2.41 | 1.87 | 1.96 | 0.93 | |
| Single peak pattern | y=2.11x-1.76 | 1.79 | 1.62 | 0.95 | |
| Parallel peak pattern | y=2.62x-2.53 | 2.62 | 2.53 | 0.91 | |
| 50-60mm | Pre-peak multi-peak type | y=1.67x-1.14 | 1.67 | 1.14 | 0.93 |
| Post-peak multi-peak type | y=1.63x-1.13 | 1.63 | 1.13 | 0.84 | |
| Single peak pattern | y=1.61x-1.11 | 1.61 | 1.04 | 0.98 | |
| Parallel peak pattern | y=3.10x-2.48 | 3.10 | 2.48 | 0.90 |
Table 4.
Weibull Distribution Parameters Across Size Fractions by Shape.
| Particle size/mm | Fragmentation mode | Fitting result | Weibull modulus m | Characteristic stress σ0 | R2 |
| 10-20 | Pre-peak multi-peak type | y=2.18x-3.21 | 2.18 | 3.21 | 0.96 |
| Post-peak multi-peak type | y=2.08x-2.45 | 2.08 | 2.45 | 0.95 | |
| Single peak pattern | y=1.88x-2.25 | 1.88 | 2.25 | 0.80 | |
| Parallel peak pattern | y=2.25x-3.41 | 2.25 | 3.41 | 0.91 | |
| 20-30 | Pre-peak multi-peak type | y=2.05x-2.75 | 2.05 | 2.75 | 0.86 |
| Post-peak multi-peak type | y=1.70x-2.33 | 1.70 | 2.33 | 0.96 | |
| Single peak pattern | y=1.68x-1.96 | 1.68 | 1.96 | 0.96 | |
| Parallel peak pattern | y=2.18x-2.81 | 2.18 | 2.81 | 0.98 | |
| 30-40 | Pre-peak multi-peak type | y=2x-2.19 | 2.00 | 2.19 | 0.95 |
| Post-peak multi-peak type | y=1.93x-2.18 | 1.93 | 2.18 | 0.92 | |
| Single peak pattern | y=1.74x-1.51 | 1.74 | 1.70 | 0.95 | |
| Parallel peak pattern | y=2.08x-2.70 | 2.08 | 2.70 | 0.94 | |
| 40-50 | Pre-peak multi-peak type | y=1.93x-2.02 | 1.93 | 2.02 | 0.96 |
| Post-peak multi-peak type | y=2.35x-2.41 | 1.87 | 1.96 | 0.93 | |
| Single peak pattern | y=2.11x-1.76 | 1.79 | 1.62 | 0.95 | |
| Parallel peak pattern | y=2.62x-2.53 | 2.62 | 2.53 | 0.91 | |
| 50-60 | Pre-peak multi-peak type | y=1.67x-1.14 | 1.67 | 1.14 | 0.93 |
| Post-peak multi-peak type | y=1.63x-1.13 | 1.63 | 1.13 | 0.84 | |
| Single peak pattern | y=1.61x-1.11 | 1.61 | 1.04 | 0.98 | |
| Parallel peak pattern | y=3.10x-2.48 | 3.10 | 2.48 | 0.90 |
Disclaimer/Publisher’s Note: The statements, opinions and data contained in all publications are solely those of the individual author(s) and contributor(s) and not of MDPI and/or the editor(s). MDPI and/or the editor(s) disclaim responsibility for any injury to people or property resulting from any ideas, methods, instructions or products referred to in the content. |
© 2026 by the authors. Licensee MDPI, Basel, Switzerland. This article is an open access article distributed under the terms and conditions of the Creative Commons Attribution (CC BY) license (http://creativecommons.org/licenses/by/4.0/).
Copyright: This open access article is published under a Creative Commons CC BY 4.0 license, which permit the free download, distribution, and reuse, provided that the author and preprint are cited in any reuse.


