3. Results
3.1. Cohort Characteristics
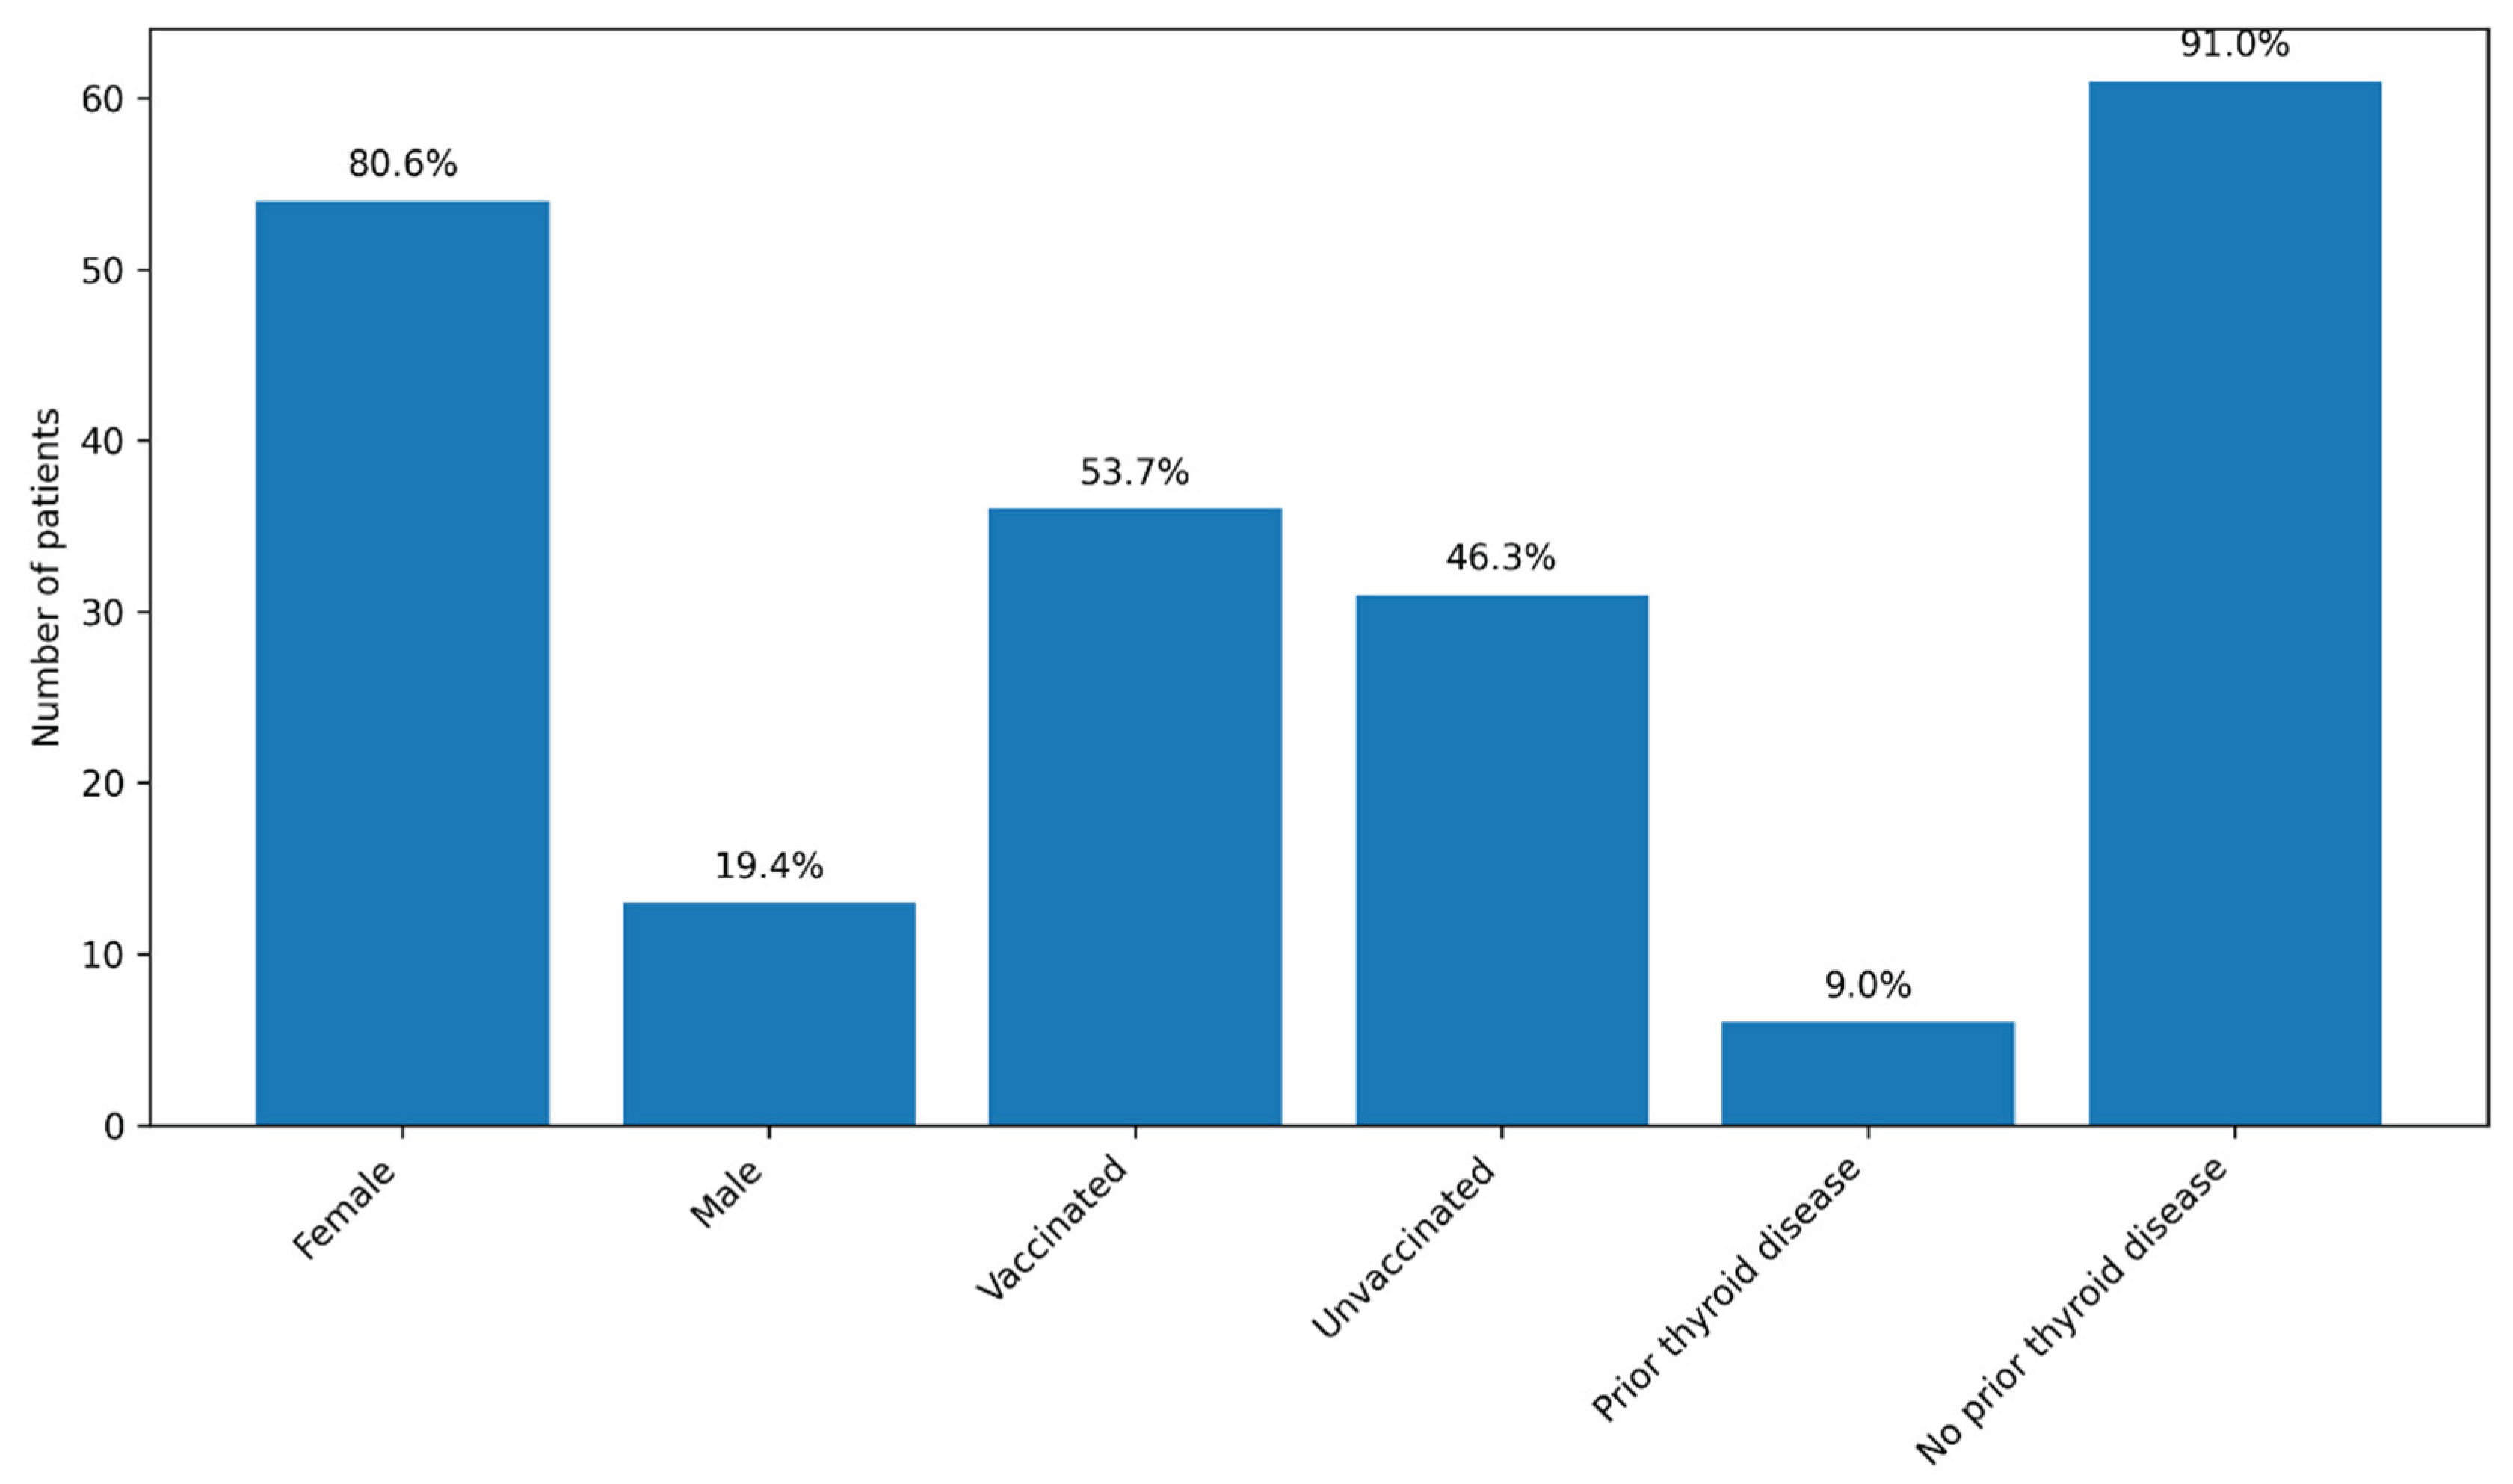
A total of 71 patients were initially enrolled in the study, including 55 women (77.5%) and 16 men (22.5%). Recruitment was conducted continuously between December 2022 and September 2024, with patients enrolled during hospitalization for COVID-19 at the Brașov Clinical Hospital of Pneumology and Infectious Diseases. During the follow-up period, four patients were lost: one female patient died due to an accidental cause, one patient subsequently diagnosed with lung cancer did not attend further visits, and two patients were lost to follow-up after the 3-month evaluation. The final cohort included 67 patients, predominantly female (54 patients; 80.6%). The median age was 54 years (range: 25–78 years).
Approximately half of the patients (36; 53.7%) had been vaccinated against SARS-CoV-2 prior to the index COVID-19 episode, most commonly with the Pfizer–BioNTech vaccine (two or three doses), while three patients had received the Johnson & Johnson vaccine. Most patients (59; 88.1%) had no known history of thyroid disease. Six patients (9%) reported pre-existing thyroid conditions, mainly autoimmune thyroiditis or thyroid nodules; none were receiving thyroid hormone replacement therapy or antithyroid medication at the time of enrolment. No consistent sex-related patterns in thyroid outcomes were evident during follow-up; given the marked female predominance of the cohort, sex was therefore reported descriptively and not included as a primary variable in subsequent analyses.
Figure 1.
Baseline characteristics of the cohort (n = 67). Legend: The graph illustrates the distribution of patients according to sex, SARS-CoV-2 vaccination status, and the presence of known pre-existing thyroid disease. Values are expressed as the number of patients, with the corresponding percentages displayed above each bar. Most patients were female (80.6%), more than half were vaccinated (53.7%), and known pre-existing thyroid disease was uncommon (9.0%).
3.2. Severity of Acute COVID-19 and Administered Treatments
Severe forms of COVID-19 were uncommon in the cohort, with only three patients (4.5%) presenting with severe pulmonary involvement. Eleven patients (16.4%) experienced moderate disease, while nine patients (13.4%) had mild clinical forms. Interstitial radiological changes were relatively frequent, being observed in 34 patients (50.7%), whereas ground-glass opacities were less commonly reported. Nine patients (13.4%) had normal chest radiography or computed tomography findings. Acute respiratory failure was documented in eight patients (11.9%), all of whom required supplemental oxygen therapy; however, none of the patients required non-invasive ventilation.
Table 2.
Clinical Severity and Respiratory/Radiologic Features in the Study Cohort.
Table 2.
Clinical Severity and Respiratory/Radiologic Features in the Study Cohort.
| Severity Category |
Number (%) |
| Severe disease |
3 (4.5%) |
| Moderate disease |
11 (16.4%) |
| Mild disease |
9 (13.4%) |
| Interstitial radiologic changes |
34 (50.7%) |
| Normal imaging |
9 (13.4%) |
| Acute respiratory failure |
8 (11.9%) |
Antiviral therapy was administered in 39 patients (58.2%), most commonly remdesivir (24 patients), followed by favipiravir (7 patients), nirmatrelvir/ritonavir (6 patients), and molnupiravir (2 patients). Systemic corticosteroid therapy was used in 23 patients (34.3%), predominantly dexamethasone. Approximately half of the cohort (34 patients; 50.7%) received prophylactic or therapeutic anticoagulation, mainly with enoxaparin. One patient was treated with tocilizumab.
Table 3.
Treatments Administered During the Acute COVID-19 Phase.
Table 3.
Treatments Administered During the Acute COVID-19 Phase.
| Treatment |
Received n (%) |
Not received n (%) |
| Antiviral therapy (any) |
39 (58.2%) |
28 (41.8%) |
| Remdesivir |
24 (35.8%) |
43 (64.2%) |
| Favipiravir |
7 (10.4%) |
60 (89.6%) |
| Nirmatrelvir/ritonavir |
6 (9.0%) |
61 (91.0%) |
| Molnupiravir |
2 (3.0%) |
65 (97.0%) |
| Corticosteroids (any) |
23 (34.3%) |
44 (65.7%) |
| Anticoagulation |
34 (50.7%) |
33 (49.3%) |
| Tocilizumab |
1 (1.5%) |
66 (98.5%) |
3.3. Correlations Between Inflammatory, Biochemical, and Coagulation Markers at Baseline
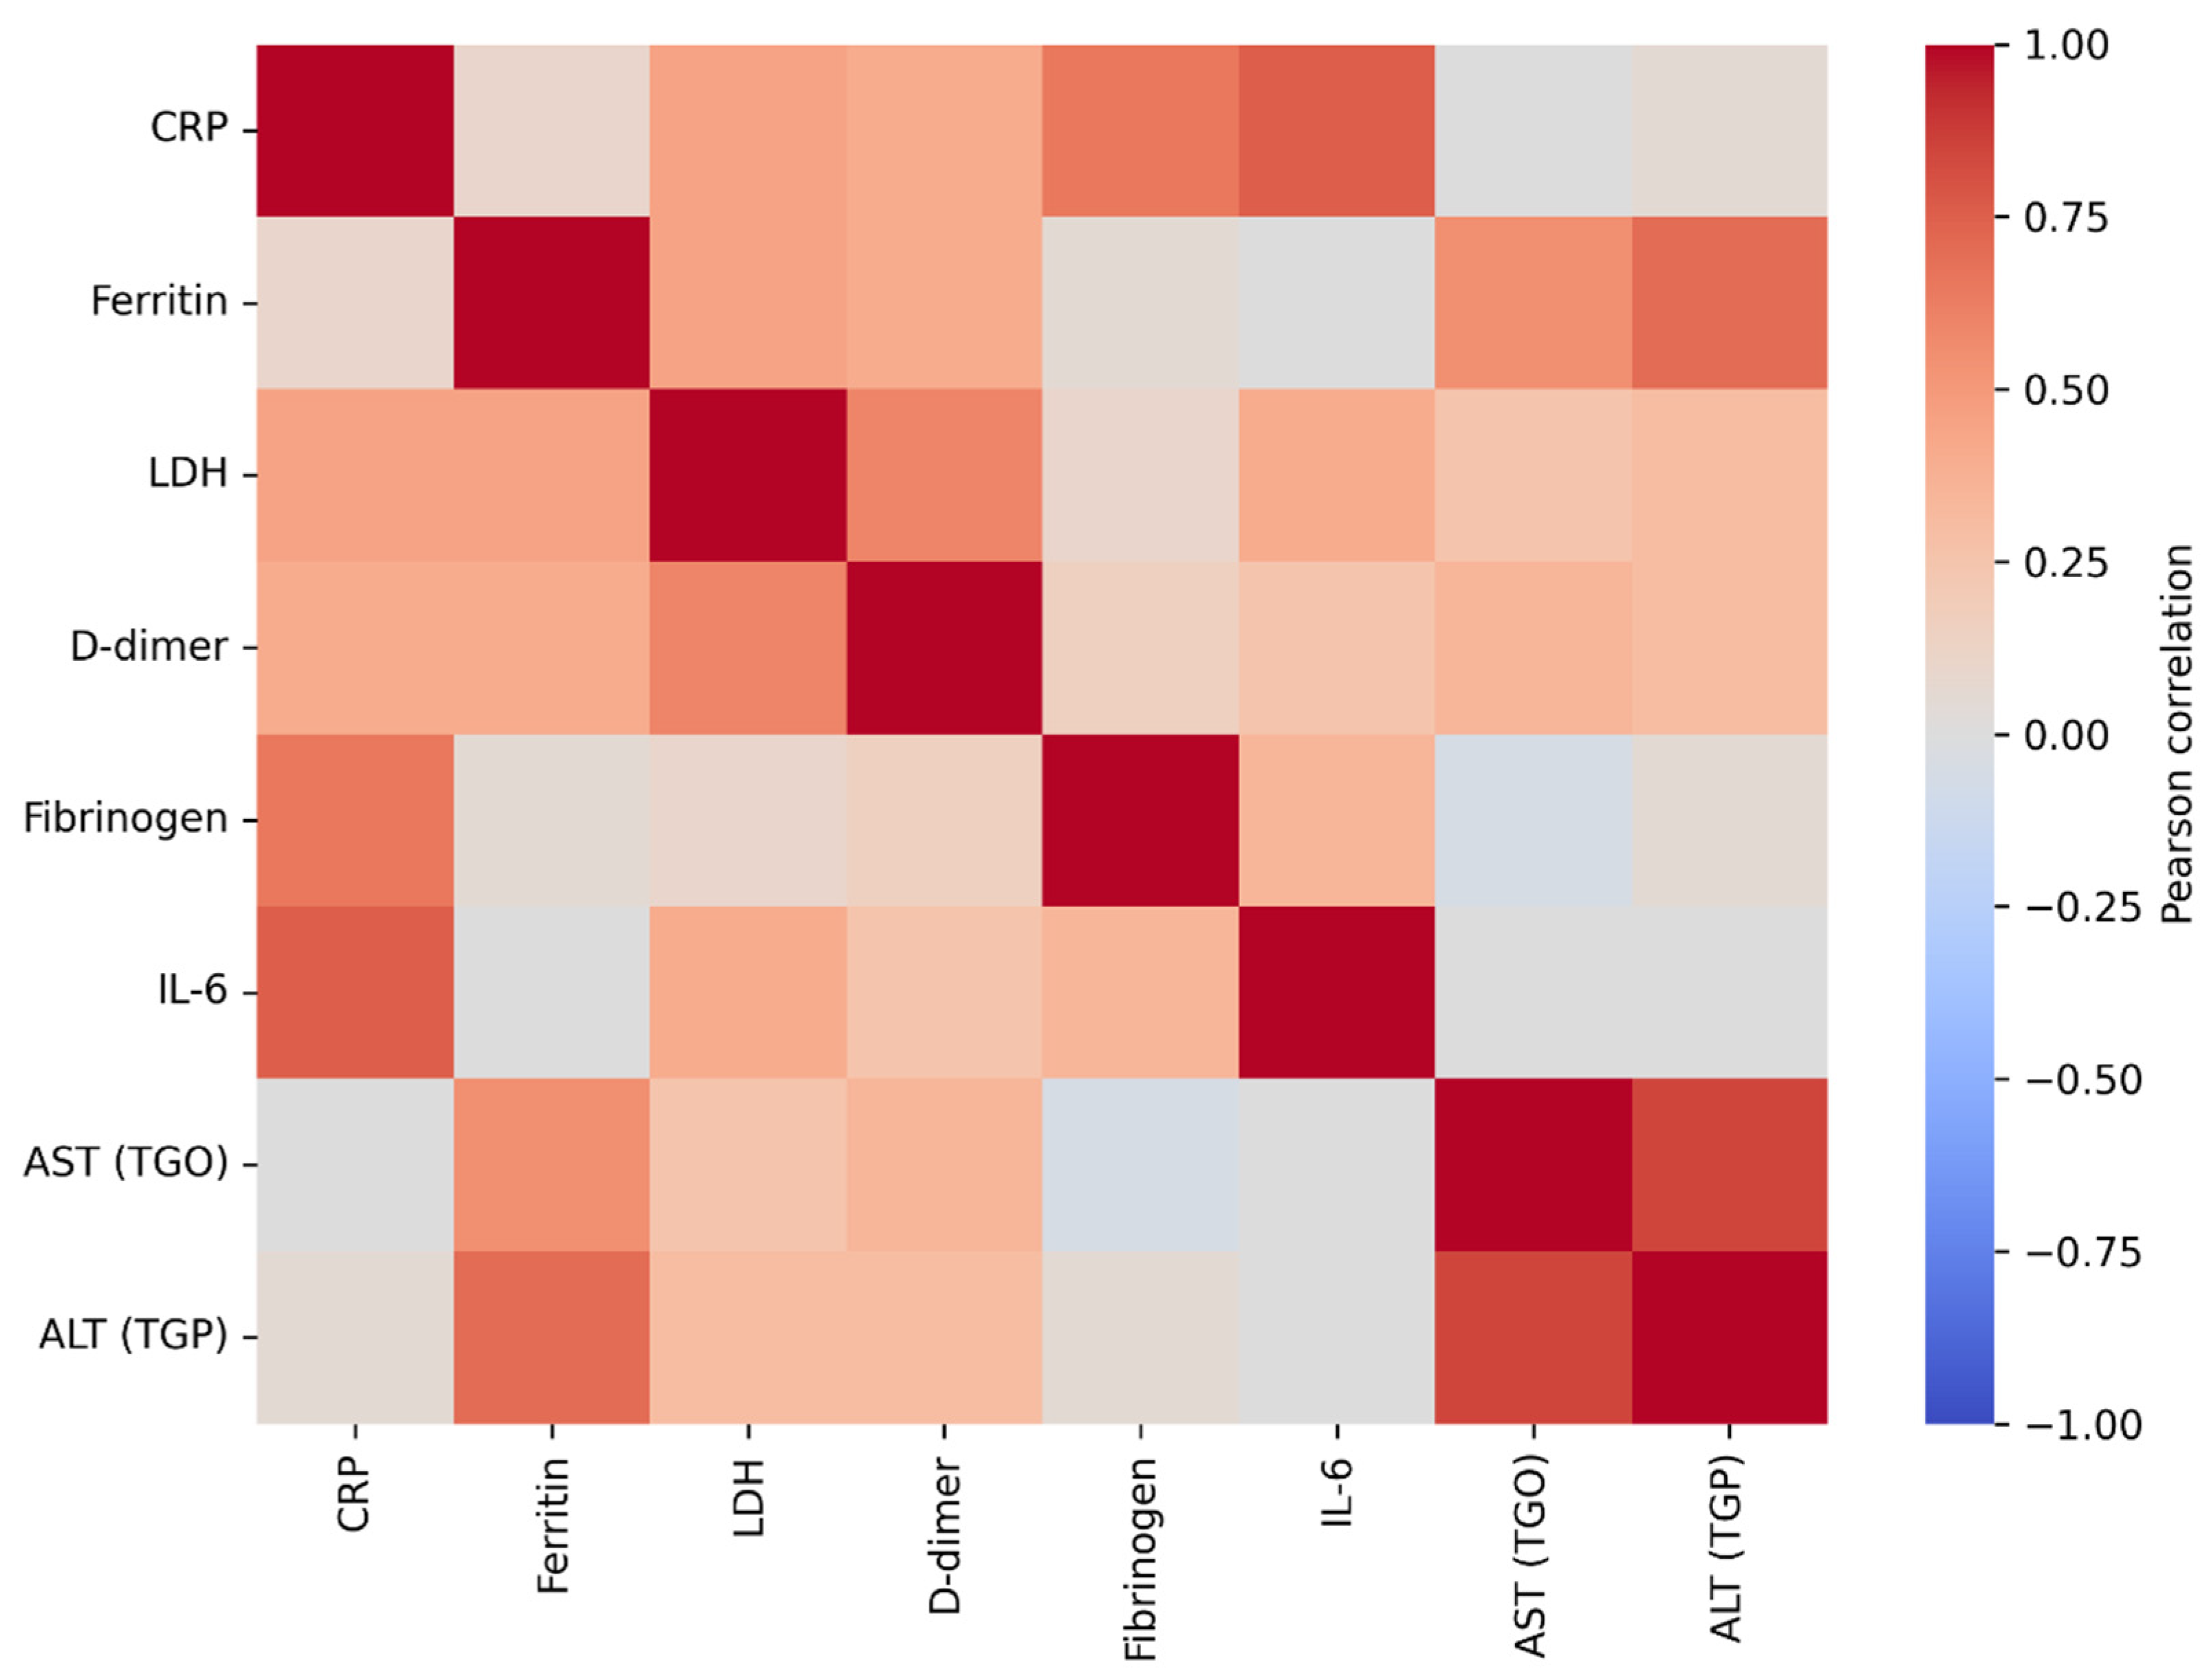
The correlation analysis of baseline laboratory parameters revealed a coherent post–COVID-19 systemic profile, characterized by interrelationships among inflammatory markers, indices of tissue injury, and coagulation activation. Hepatic transaminases (AST and ALT) showed the strongest association (r = 0.894, p < 0.001), consistent with hepatic involvement in the early post-infectious period. Ferritin correlated significantly with ALT (r = 0.739, p < 0.001) and AST (r = 0.598, p < 0.001), in line with its role as an acute-phase reactant and a marker of systemic inflammation. LDH, an indicator of cellular injury that often rises in inflammatory states, was also associated with markers of coagulation activation; specifically, LDH correlated with D-dimer levels (r = 0.639, p < 0.001), suggesting that greater tissue injury may coexist with a prothrombotic milieu. Classical inflammatory markers (ESR, CRP, and fibrinogen) were strongly correlated with one another (r = 0.654–0.671, all p < 0.001), indicating coordinated acute-phase activation at the time of study inclusion.
Overall, this pattern of correlations supports the biological plausibility of the dataset and places thyroid dysfunction within a broader multisystemic context, in which inflammatory, hepatic, and coagulation-related processes are interconnected during post–COVID-19 recovery. This systemic background is relevant for the interpretation of thyroid-related changes observed in subsequent analyses, suggesting that post-viral thyroid dysfunction may represent one component of a more complex, multisystem inflammatory process.
Figure 2.
Pearson correlation heatmap of baseline inflammatory and related laboratory marker. Legend: The figure illustrates the strength and direction of linear associations between inflammatory markers (CRP, ESR, fibrinogen, IL-6) and biochemical parameters (ferritin, LDH, D-dimer, AST, ALT). Red colors indicate positive correlations, whereas blue colors indicate negative correlations, with color intensity reflecting the magnitude of the correlation coefficient (r). Very strong correlations are observed between hepatic transaminases (AST–ALT), as well as between CRP–IL-6, LDH–D-dimer, and ferritin–ALT, suggesting a coherent inflammatory and cytolytic profile at baseline in patients with COVID-19.
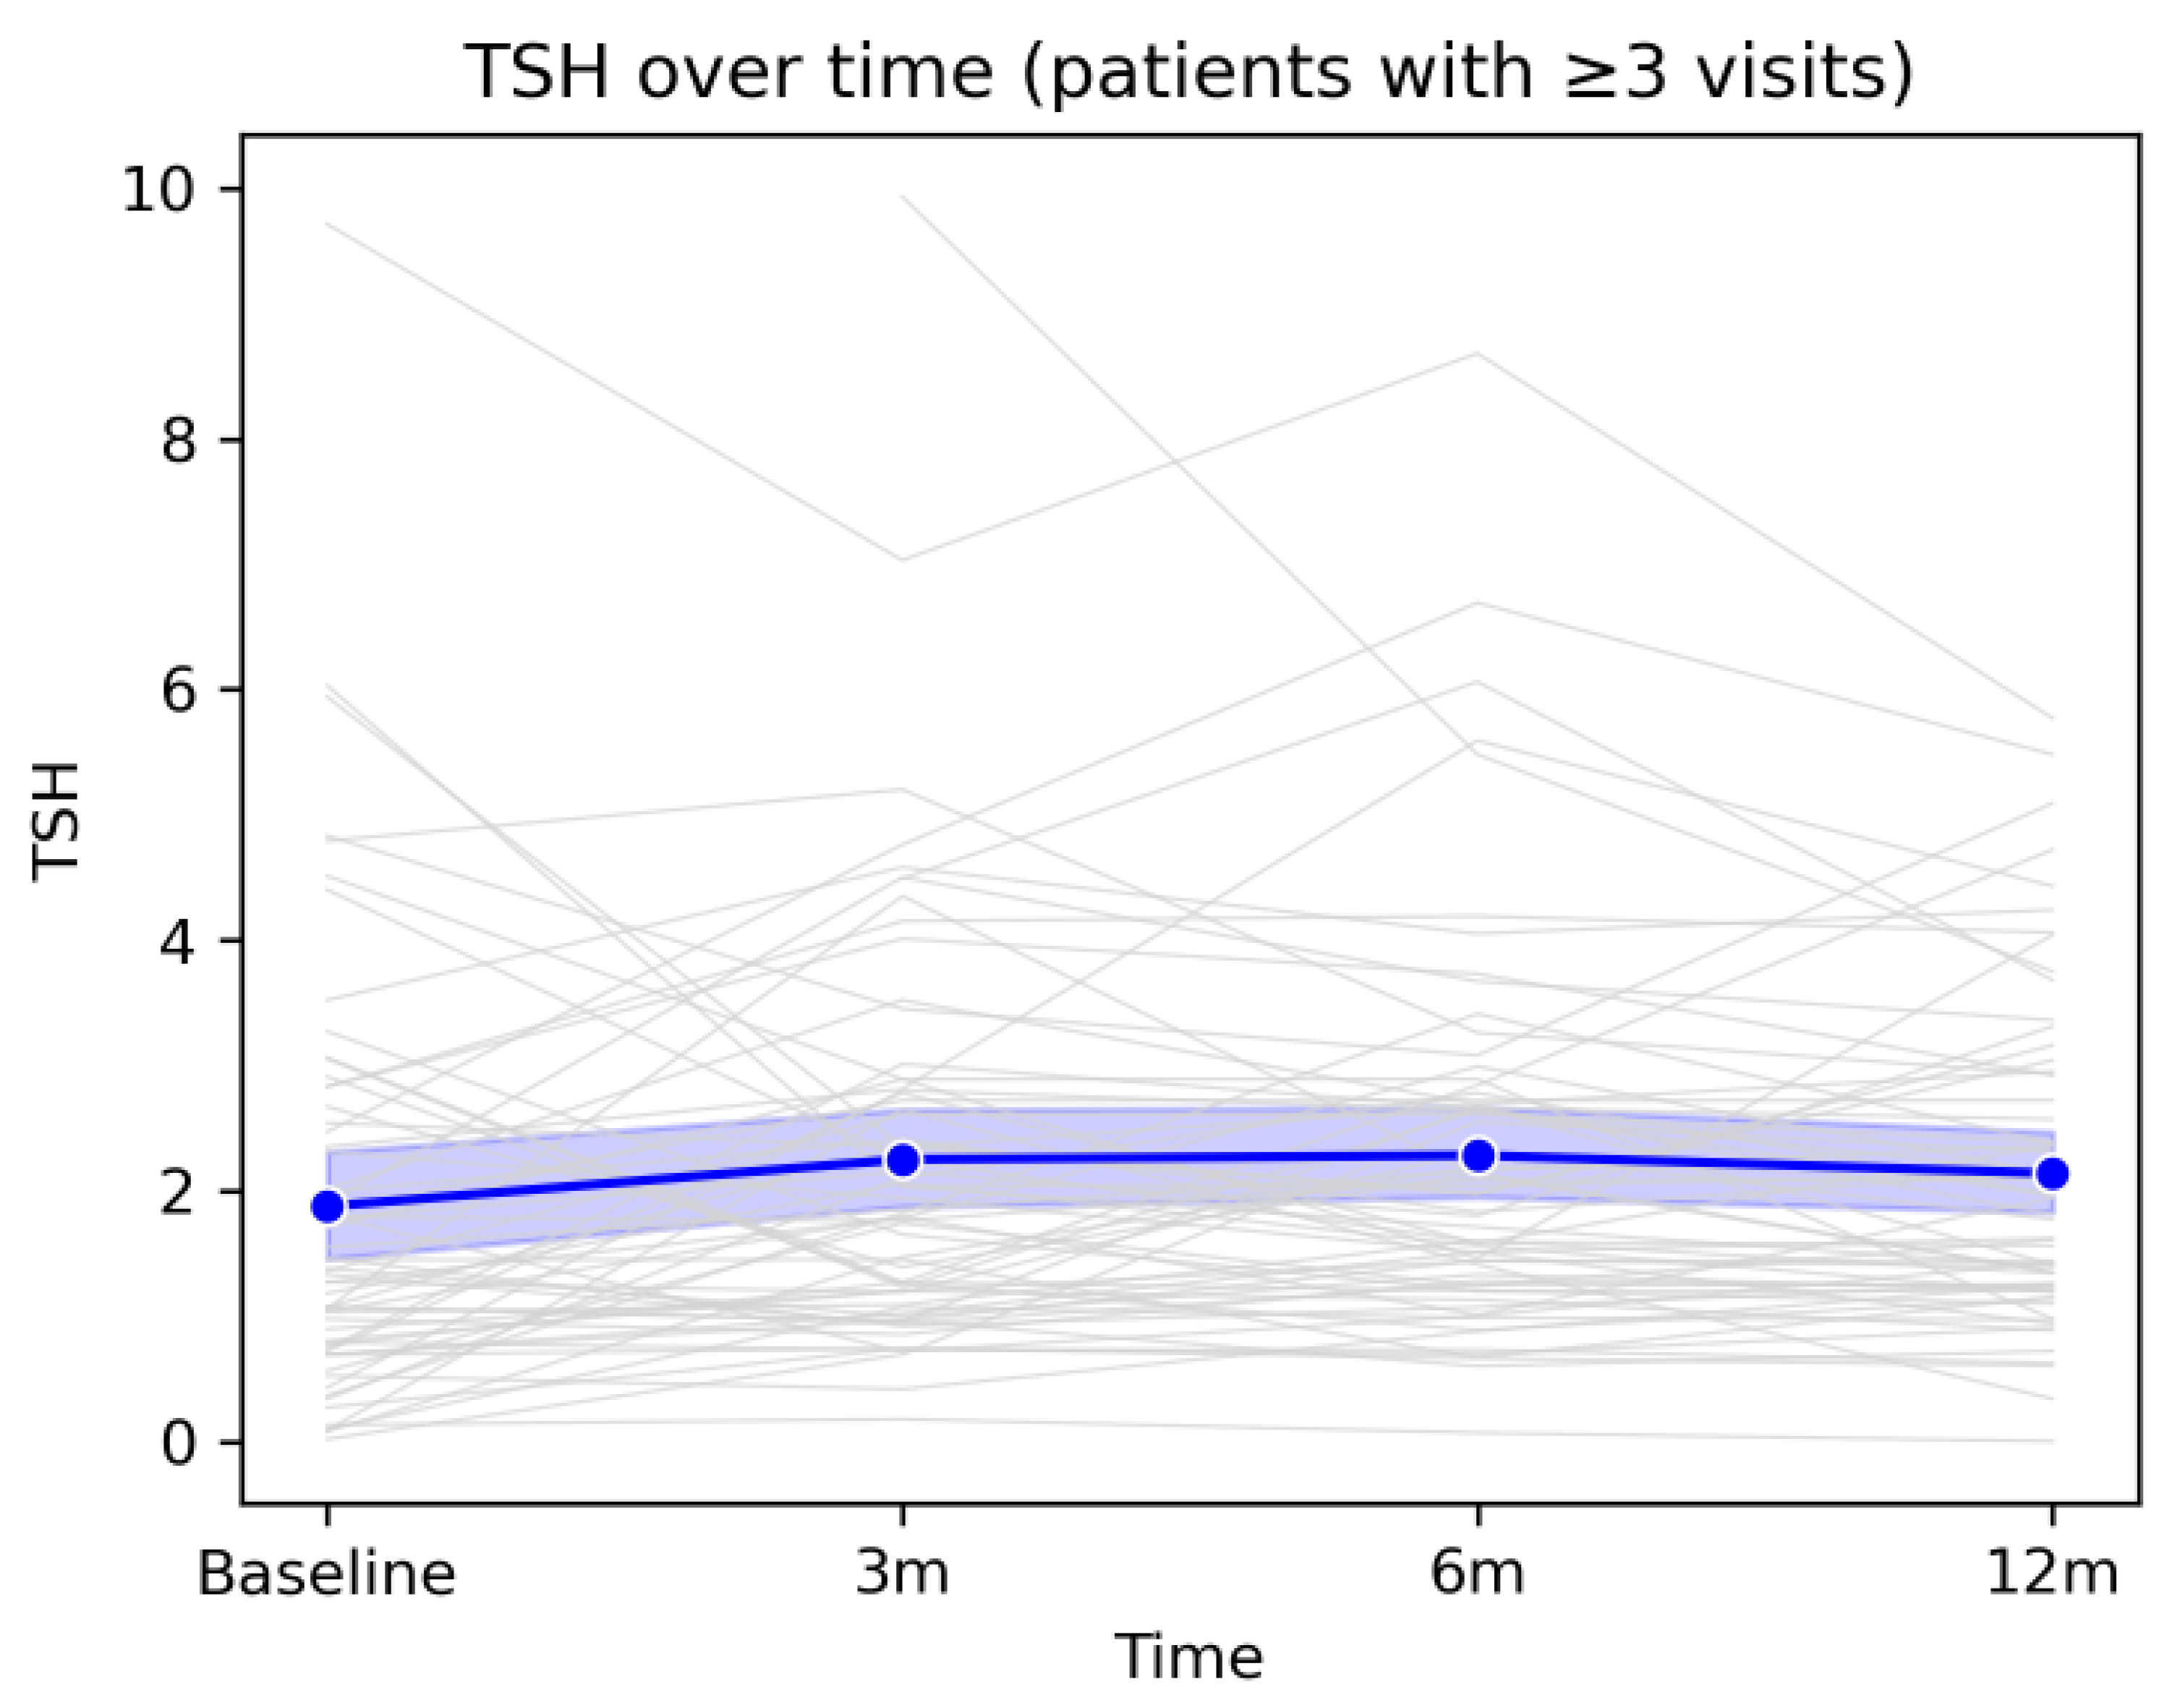
3.4. Longitudinal Time Course of Thyroid Hormones (TSH, FT4, FT3)
The longitudinal analysis of the three thyroid hormones revealed an overall pattern of gradual stabilization of thyroid function over the 12-month follow-up period after COVID-19 infection. Although individual hormone levels varied considerably among patients, as reflected by divergent individual trajectories, the mean evolution of the cohort followed a coherent and predictable pattern. TSH showed a mild increase at the 3- and 6-month assessments, followed by a tendency to return toward baseline values at 12 months, without major population-level fluctuations. FT4 exhibited a moderate decline during the early post-infectious period, likely reflecting the resolution of inflammatory processes and post-viral adaptive responses, followed by a gradual return toward baseline values by the end of follow-up. Similarly, FT3 showed a slight increase at 3 months, followed by a progressive decrease up to 12 months, suggesting a medium-term metabolic re-equilibration process.Taken together, these trajectories indicate that, although a subset of patients experienced transient hormonal deviations or isolated episodes of thyroid dysfunction, the overall trend was one of spontaneous normalization, without evidence of progression toward persistent or severe thyroid dysfunction at the cohort level. These findings support the concept that post-COVID thyroid alterations, when present, are predominantly mild, dynamic, and self-limited, and are integrated into a broader process of systemic recovery following viral infection.
Overall, mean TSH values remained within the reference range throughout the entire follow-up period, with a slight upward trend between baseline and the 6-month visit, followed by a modest decline at 12 months. Individual fluctuations were frequent but did not follow a uniform pattern indicative of sustained thyroid dysfunction at the group level. This evolution suggests that, despite notable interindividual variability, the average thyroid function of the cohort remained relatively stable during the first year after COVID-19, further supporting the transient nature of most observed thyroid-related changes.
Figure 3.
Longitudinal evolution of TSH levels during 12-month follow-up. Legend: Evolution of TSH values over the 12-month follow-up period in patients with at least three study visits. Grey lines represent individual trajectories, while the blue line depicts the cohort mean with the corresponding 95% confidence interval. A moderate degree of inter-individual variability is observed, alongside an overall tendency toward stabilization of TSH values by the end of the follow-up period.
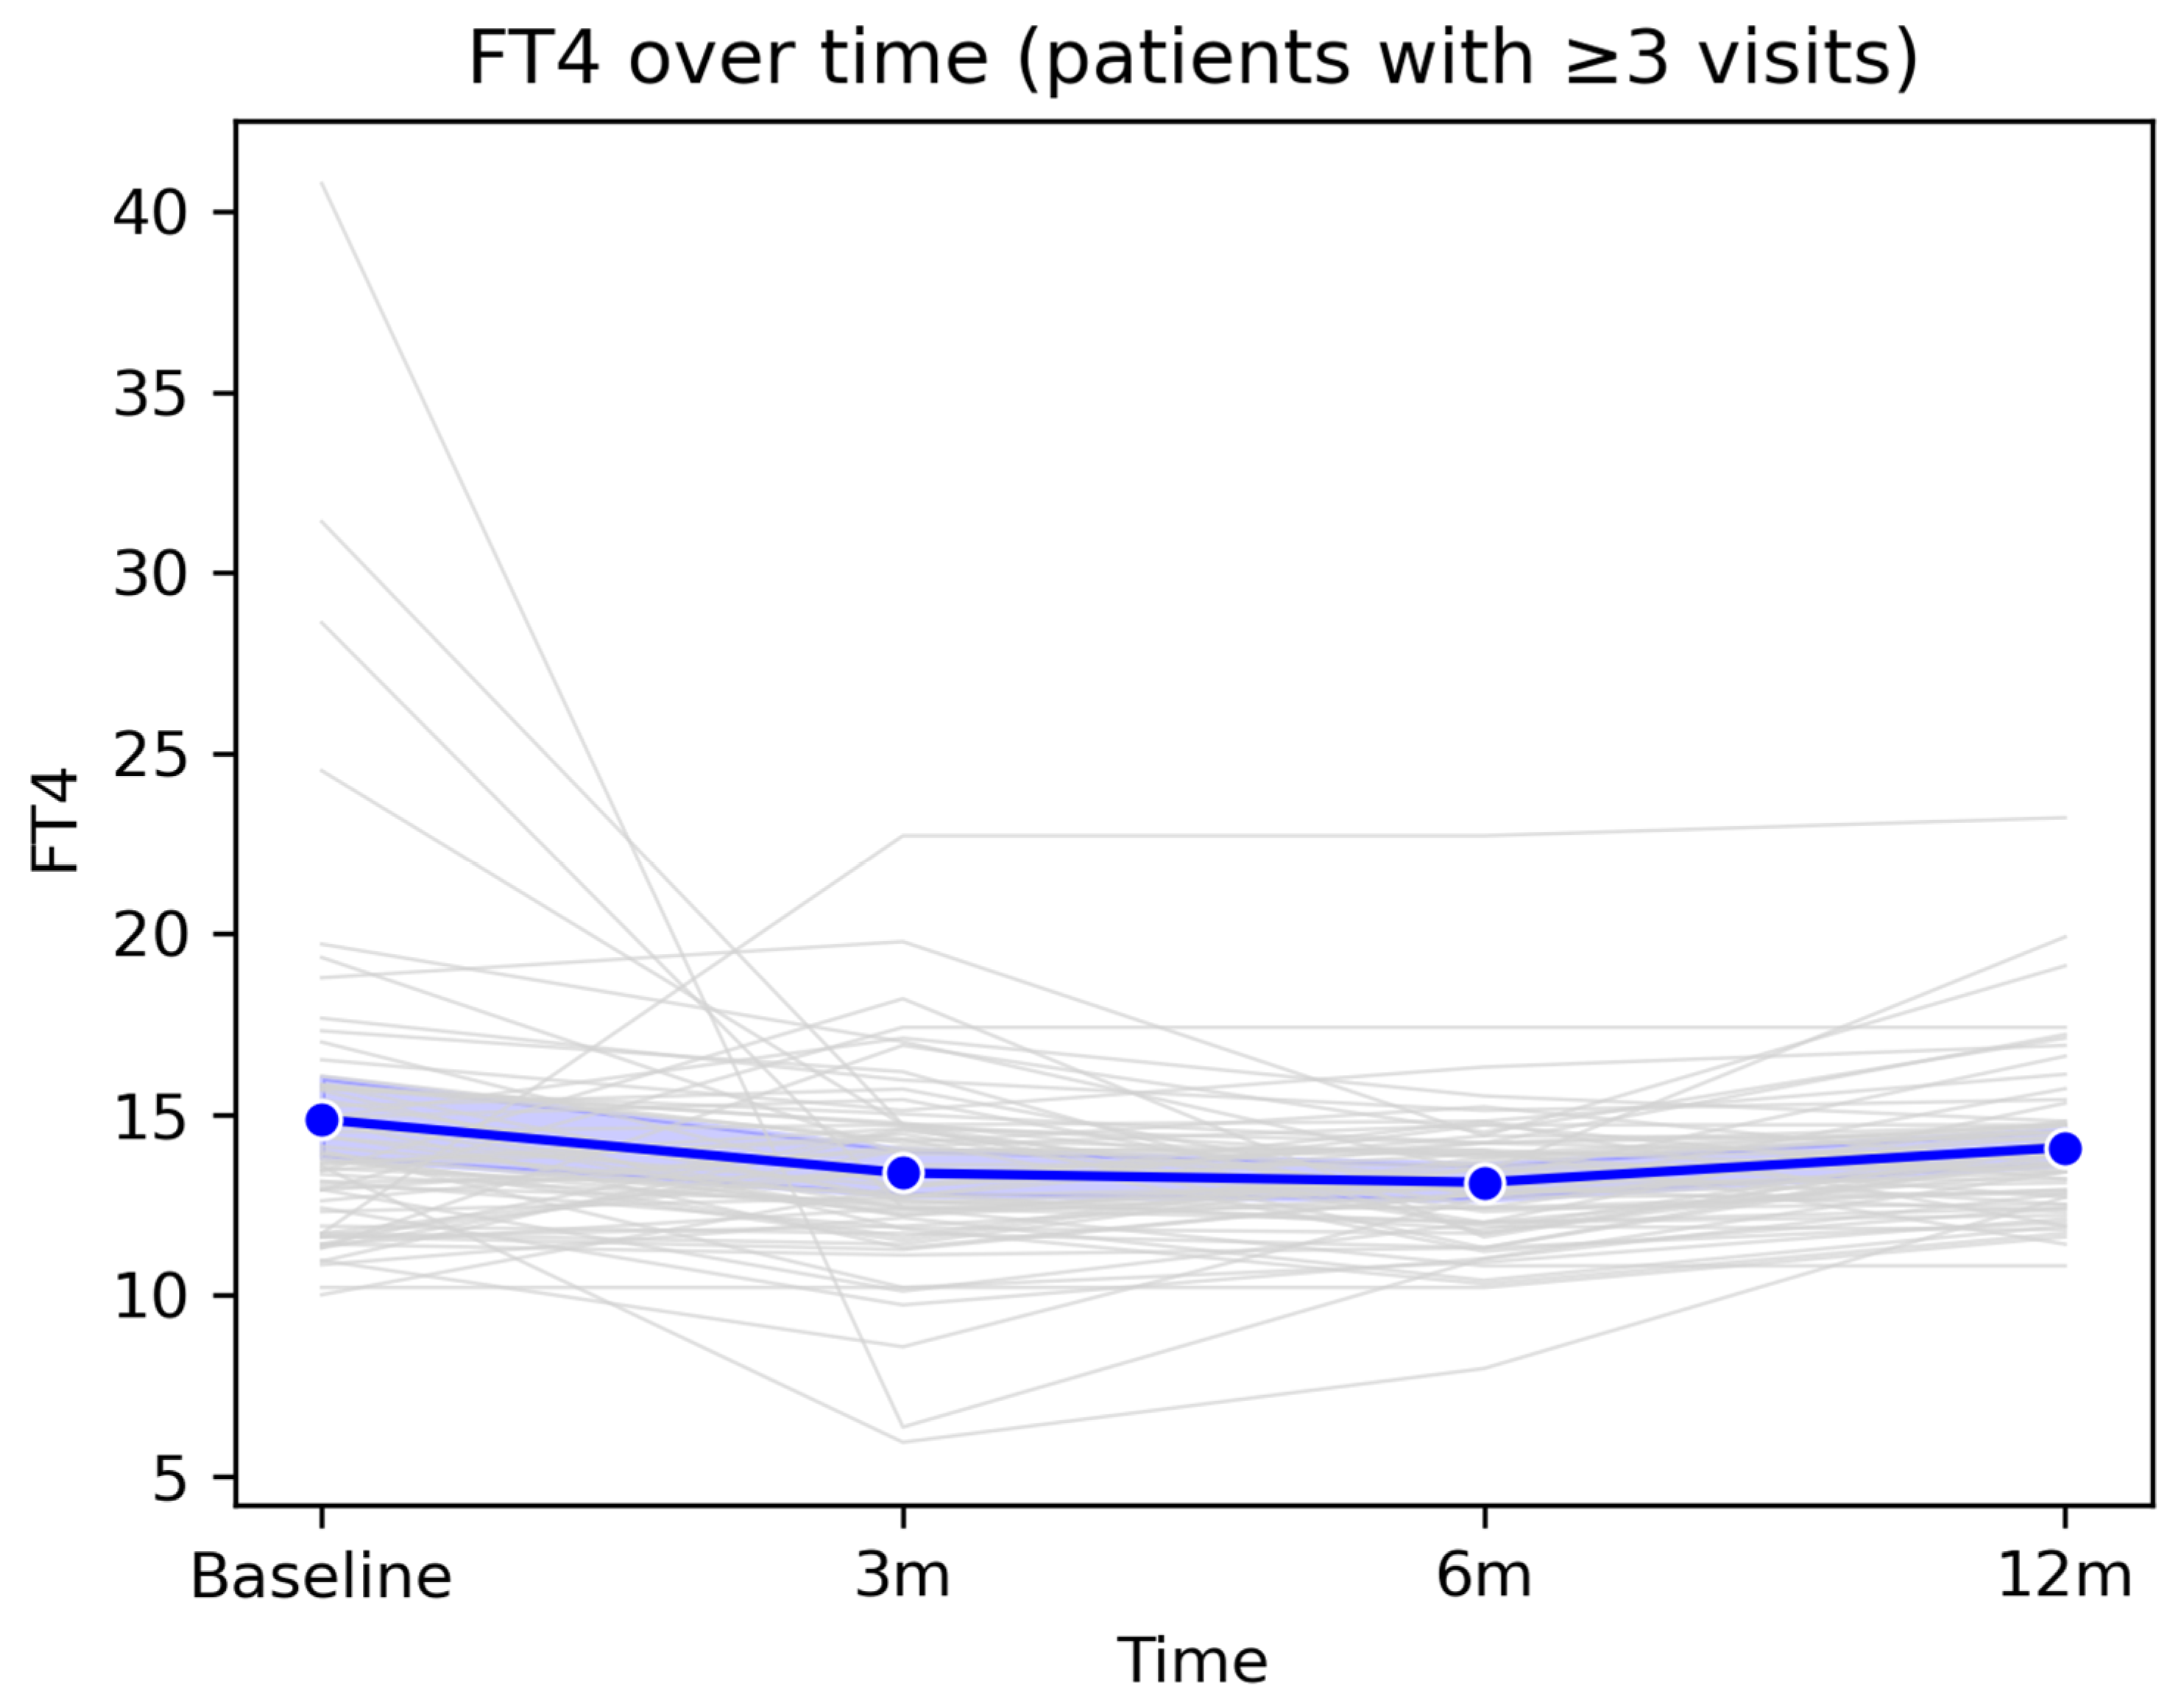
The mean FT4 value showed a slight decrease from baseline to the 3-month visit, followed by relative stabilization at 6 months and a modest return toward baseline values at 12 months. Overall, FT4 levels remained within the reference range at the group level, despite isolated fluctuations observed in some patients. This pattern suggests that most post-COVID changes in FT4 are transient and do not reflect a persistent long-term thyroid dysfunction.
Figure 4.
Longitudinal evolution of FT4 levels during 12-month follow-up. Legend: Longitudinal evolution of FT4 values over the 12-month follow-up period in patients with ≥3 follow-up visits. The figure illustrates the longitudinal dynamics of FT4 values among patients with at least three consecutive measurements available during the 12-month follow-up period. Grey lines represent individual patient trajectories, highlighting inter-individual variability in thyroid function following COVID-19 infection. The blue line indicates the cohort mean at each assessment time point (baseline, 3 months, 6 months, and 12 months), accompanied by the 95% confidence interval, displayed as a semi-transparent blue band.
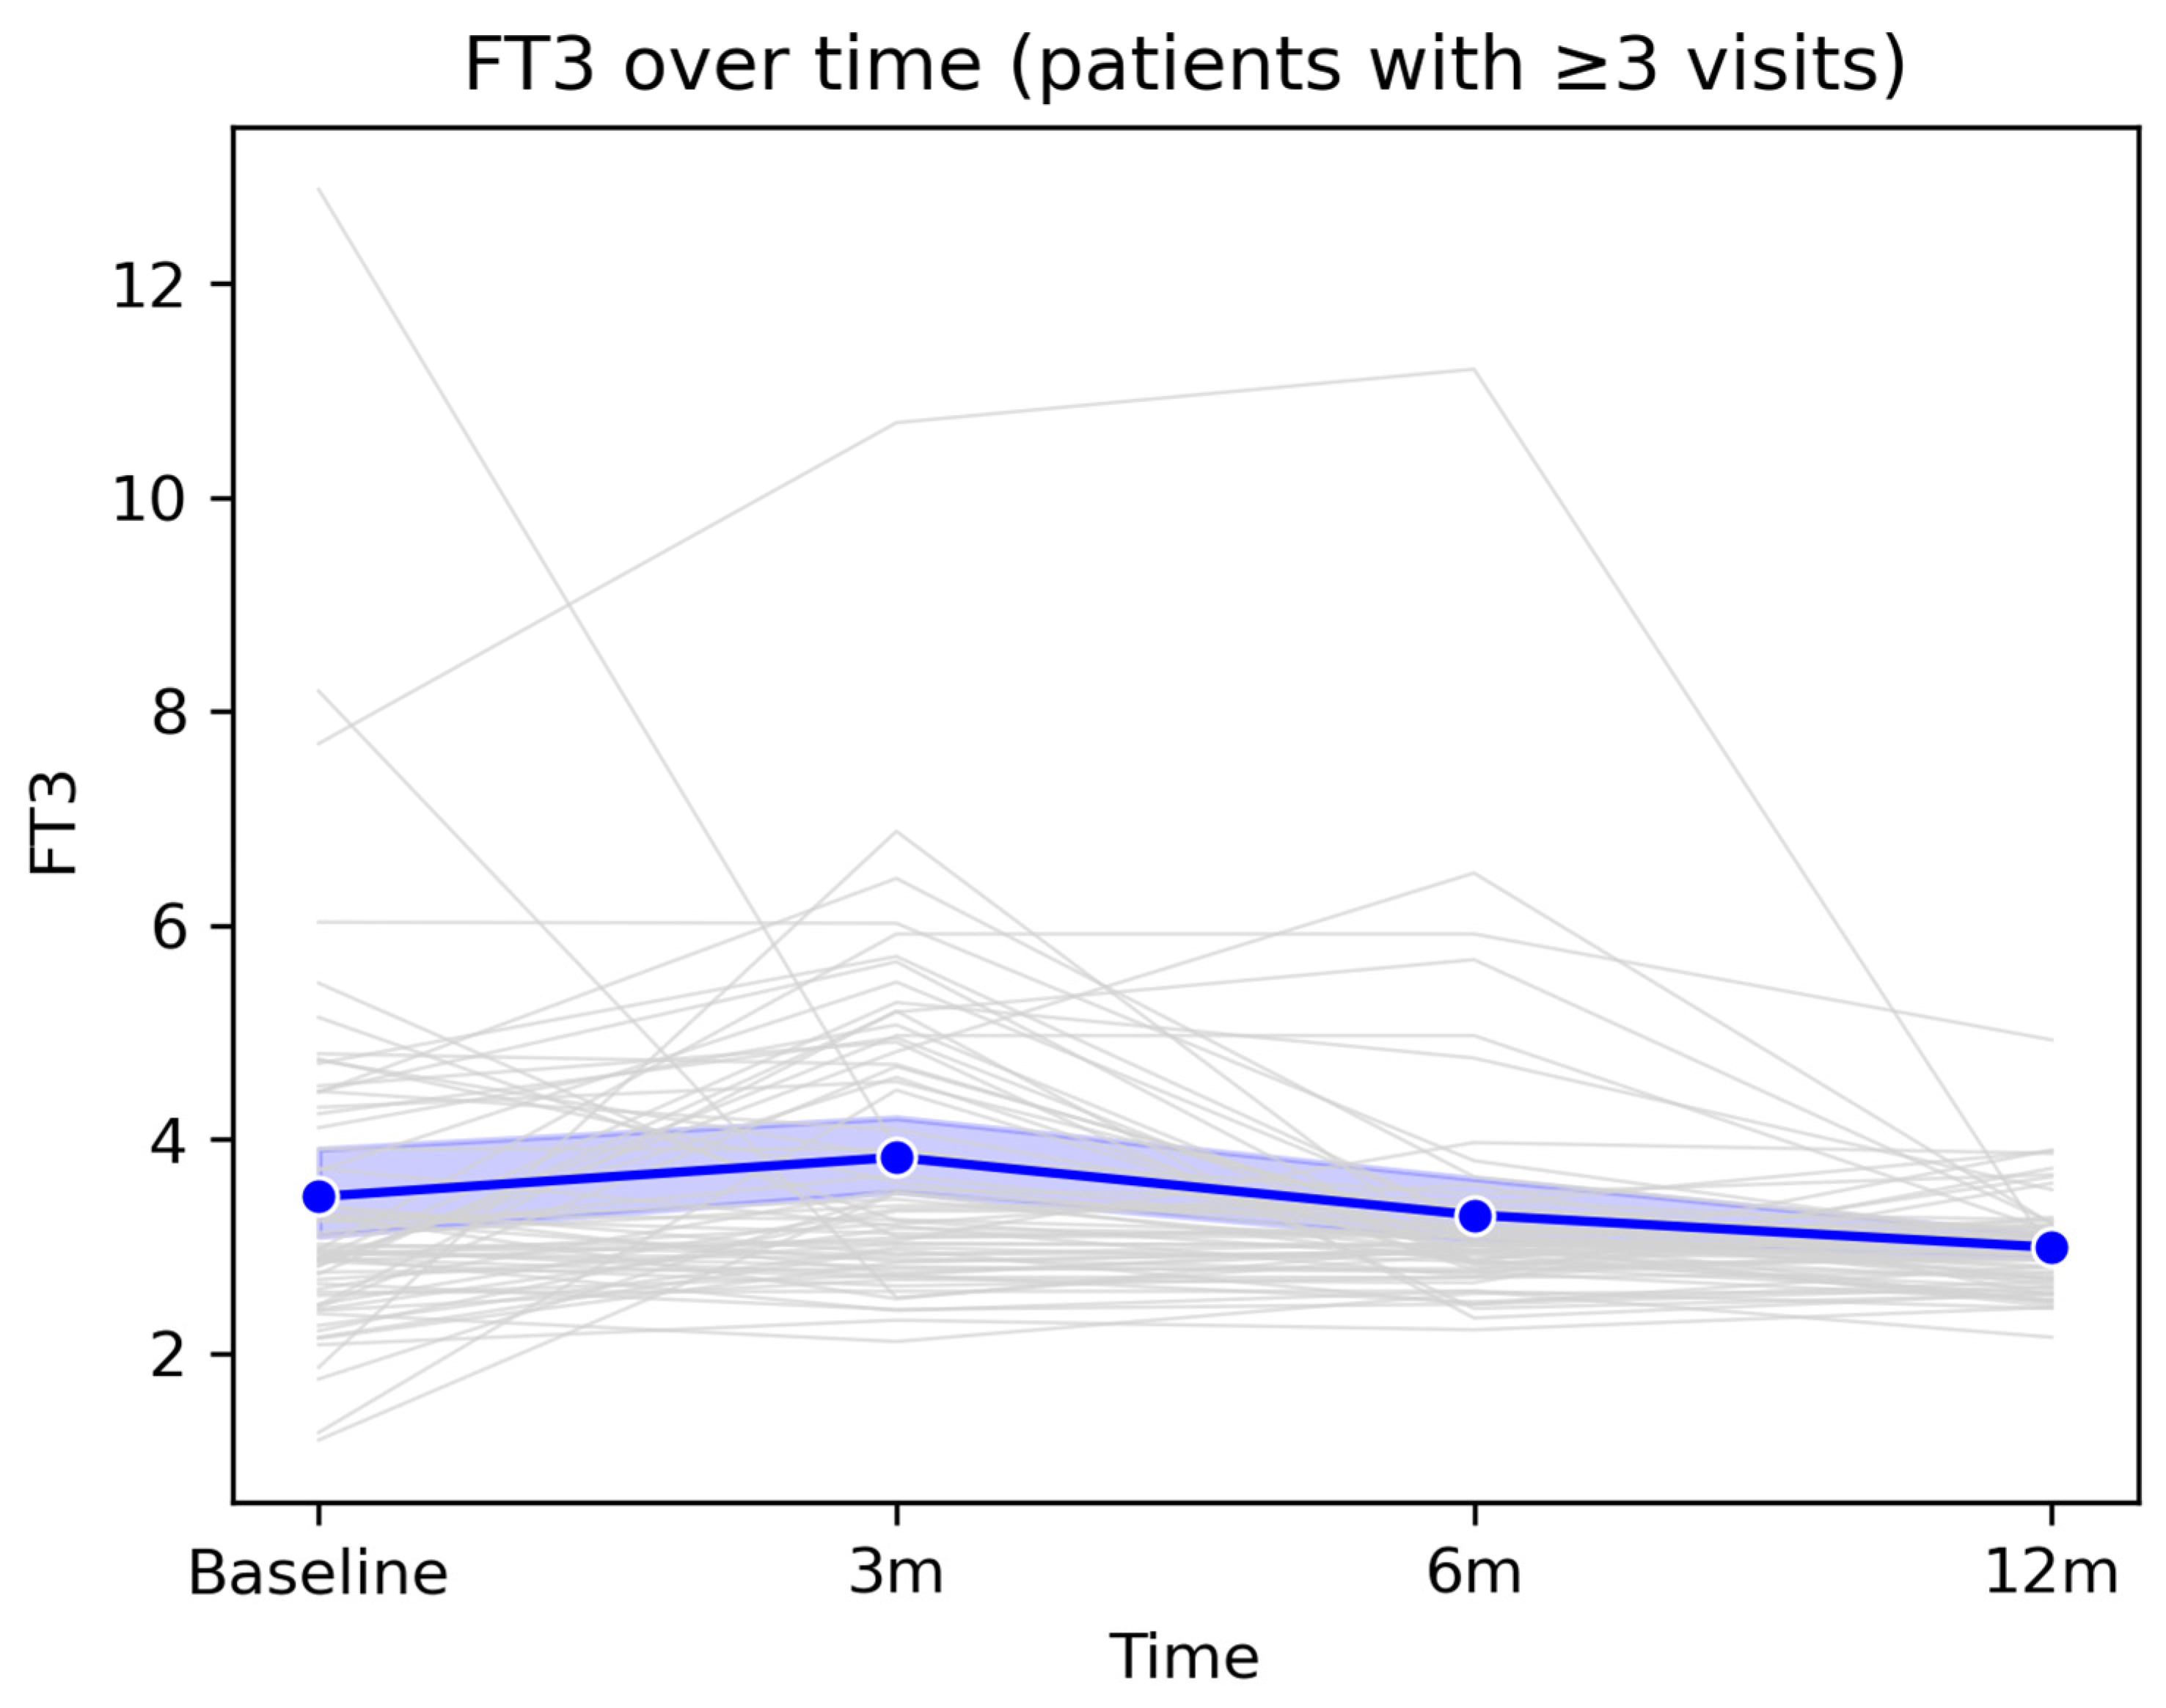
At the population level, FT3 showed a slight increase at the 3-month visit, followed by a gradual decline toward 12 months, with mean values remaining within the physiological range throughout the entire monitoring period. This profile suggests an overall trend toward stabilization and normalization of peripheral thyroid function after the acute infectious episode.
Figure 5.
Longitudinal evolution of FT3 levels during 12-month follow-up. Legend:
Figure 5 illustrates the longitudinal evolution of serum FT3 concentrations among patients with at least three available measurements over the 12-month follow-up period. Grey lines represent individual trajectories, highlighting inter-individual variability, including several markedly elevated baseline values that progressively declined over time. The thick blue line represents the cohort mean, accompanied by the 95% confidence interval (semi-transparent blue band). A slight increase in mean FT3 levels is observed at the 3-month visit, followed by a gradual decline at 6 and 12 months, with values returning close to the reference range.
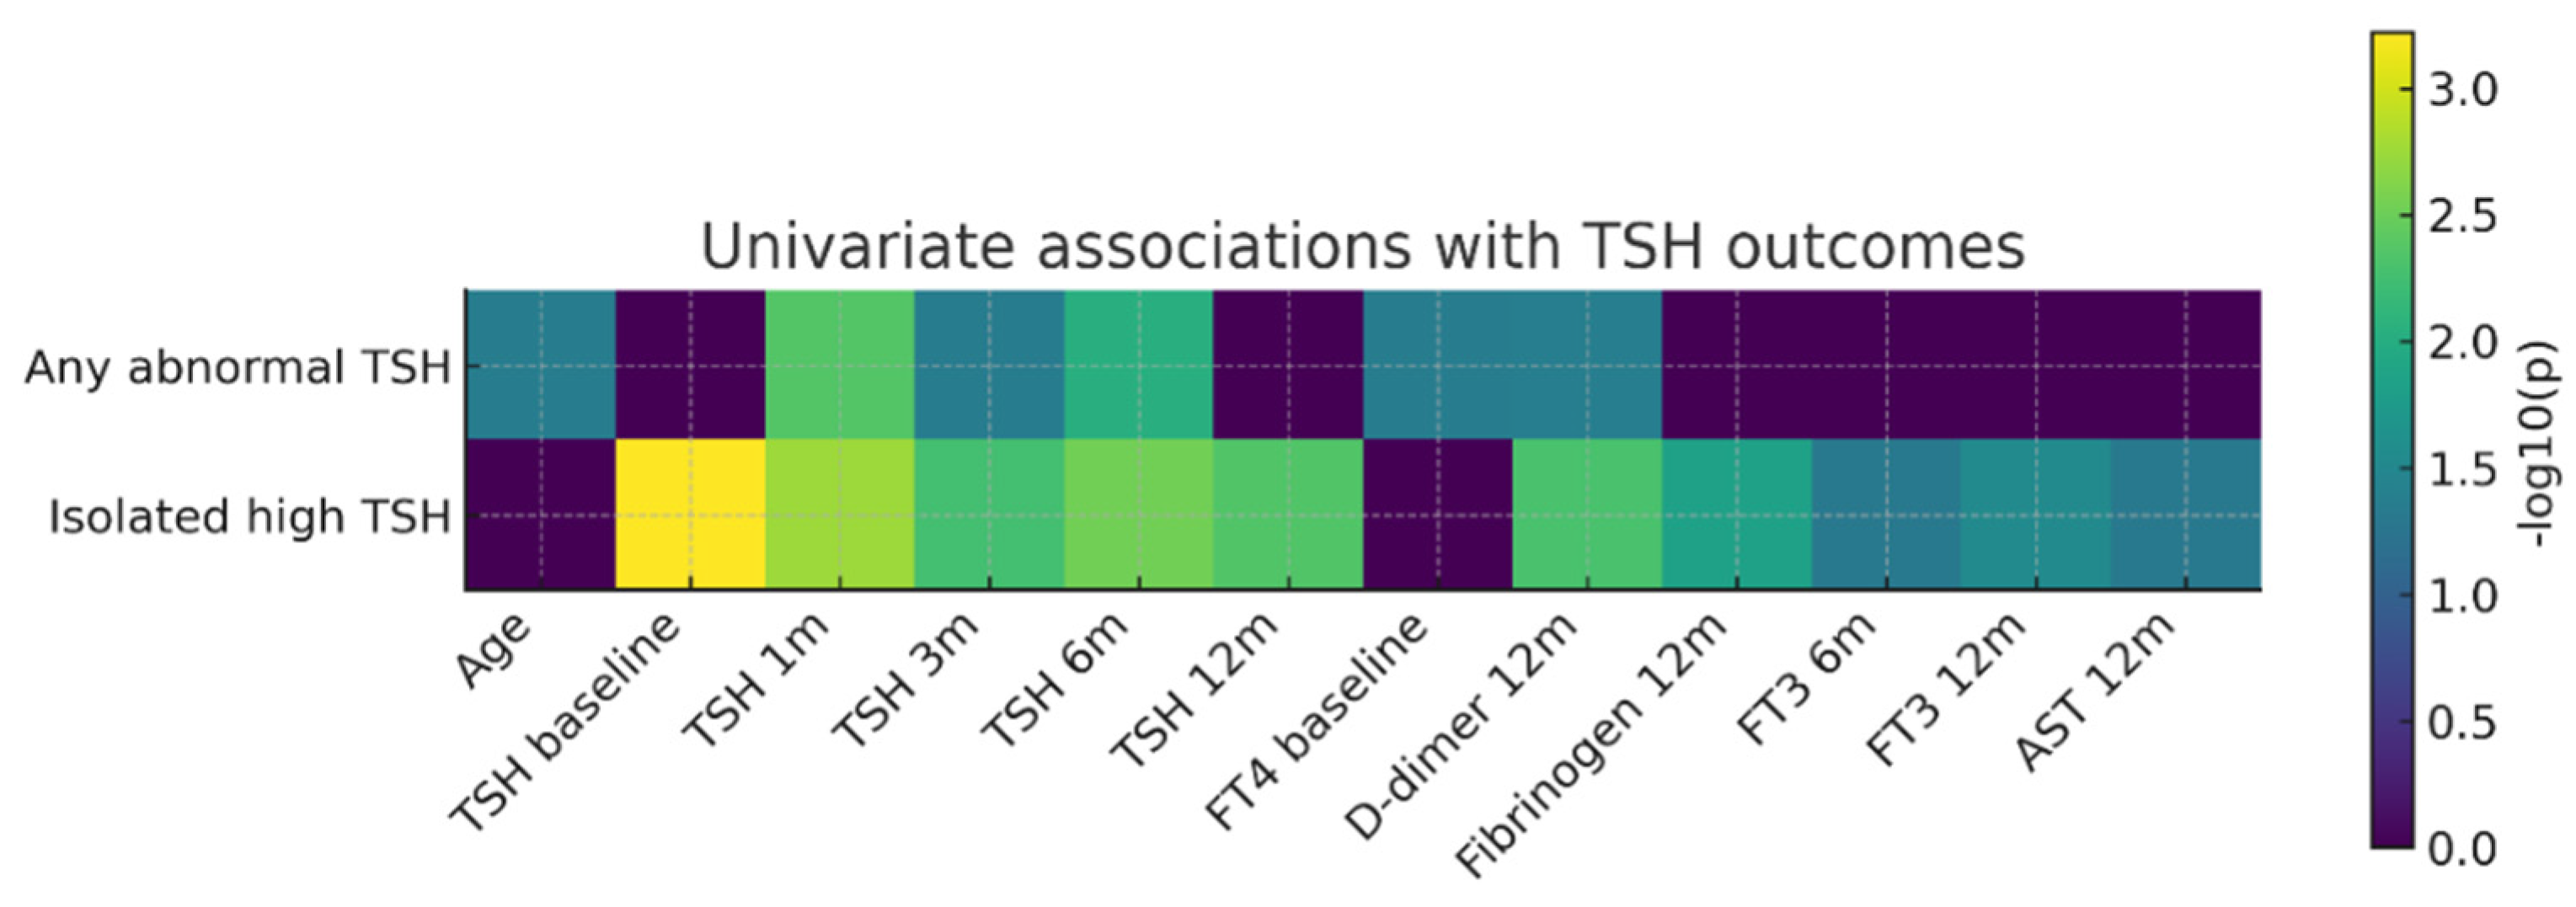
3.5. Prevalence and Patterns of TSH Abnormalities
Among the 67 patients who completed the 12-month follow-up and had complete TSH measurements available, 23 patients (34.3%) experienced at least one episode of abnormal TSH, defined as TSH <0.4 mIU/L or >4.5 mIU/L. The remaining 44 patients (65.7%) maintained TSH values within the reference range throughout the entire monitoring period. Patterns of TSH abnormalities were heterogeneous. Some patients exhibited transient episodes of TSH suppression, consistent with post-inflammatory thyrotoxicosis, whereas others developed episodic or persistent elevations in TSH, suggestive of subclinical or early hypothyroidism. Patients with abnormal TSH values were, on average, older, and age showed a modest but statistically significant association with the presence of at least one abnormal TSH value (Welch’s t-test, p = 0.0428).
Univariate association analysis (
Figure 6) showed that isolated elevated TSH was most strongly correlated with baseline TSH values and with those obtained at early follow-up visits (1–6 months). In contrast, the composite outcome “any abnormal TSH” was primarily associated with early post-COVID TSH values, baseline FT4 levels, age, and D-dimer concentrations at 12 months. These findings suggest a complex relationship between early post-infectious thyroid regulation and later systemic parameters.
Figure 6.
Heatmap of univariate associations between clinical/paraclinical predictors and thyroid outcomes (TSH). Legend: Heatmap of univariate associations between clinical/paraclinical predictors and thyroid outcomes (TSH). Rows represent the two thyroid outcomes analyzed (“Any abnormal TSH” and “Isolated elevated TSH”), while columns correspond to baseline predictors and variables measured during follow-up (age, TSH values at different time points, baseline FT4, D-dimer levels at 12 months, fibrinogen at 12 months, FT3 at 6 and 12 months, and AST at 12 months). Color intensity reflects the strength of the statistical association expressed as −log10(p), with darker shades indicating smaller p-values (stronger associations), whereas values close to zero (dark purple) indicate the absence of a statistically significant association.
This univariate analysis in a post-COVID cohort highlight that a relevant proportion of patients develop TSH abnormalities within the first year after infection and that early post-infectious TSH values are closely associated with subsequent thyroid function trajectories. Although inflammatory and coagulation markers reflected a persistent pro-inflammatory and pro-thrombotic systemic profile in a subset of patients, their direct associations with thyroid dysfunction were more modest. Overall, these findings suggest that post-COVID thyroid dysregulation is more strongly driven by instability of the hypothalamic–pituitary–thyroid axis than by the intensity of acute systemic inflammation.
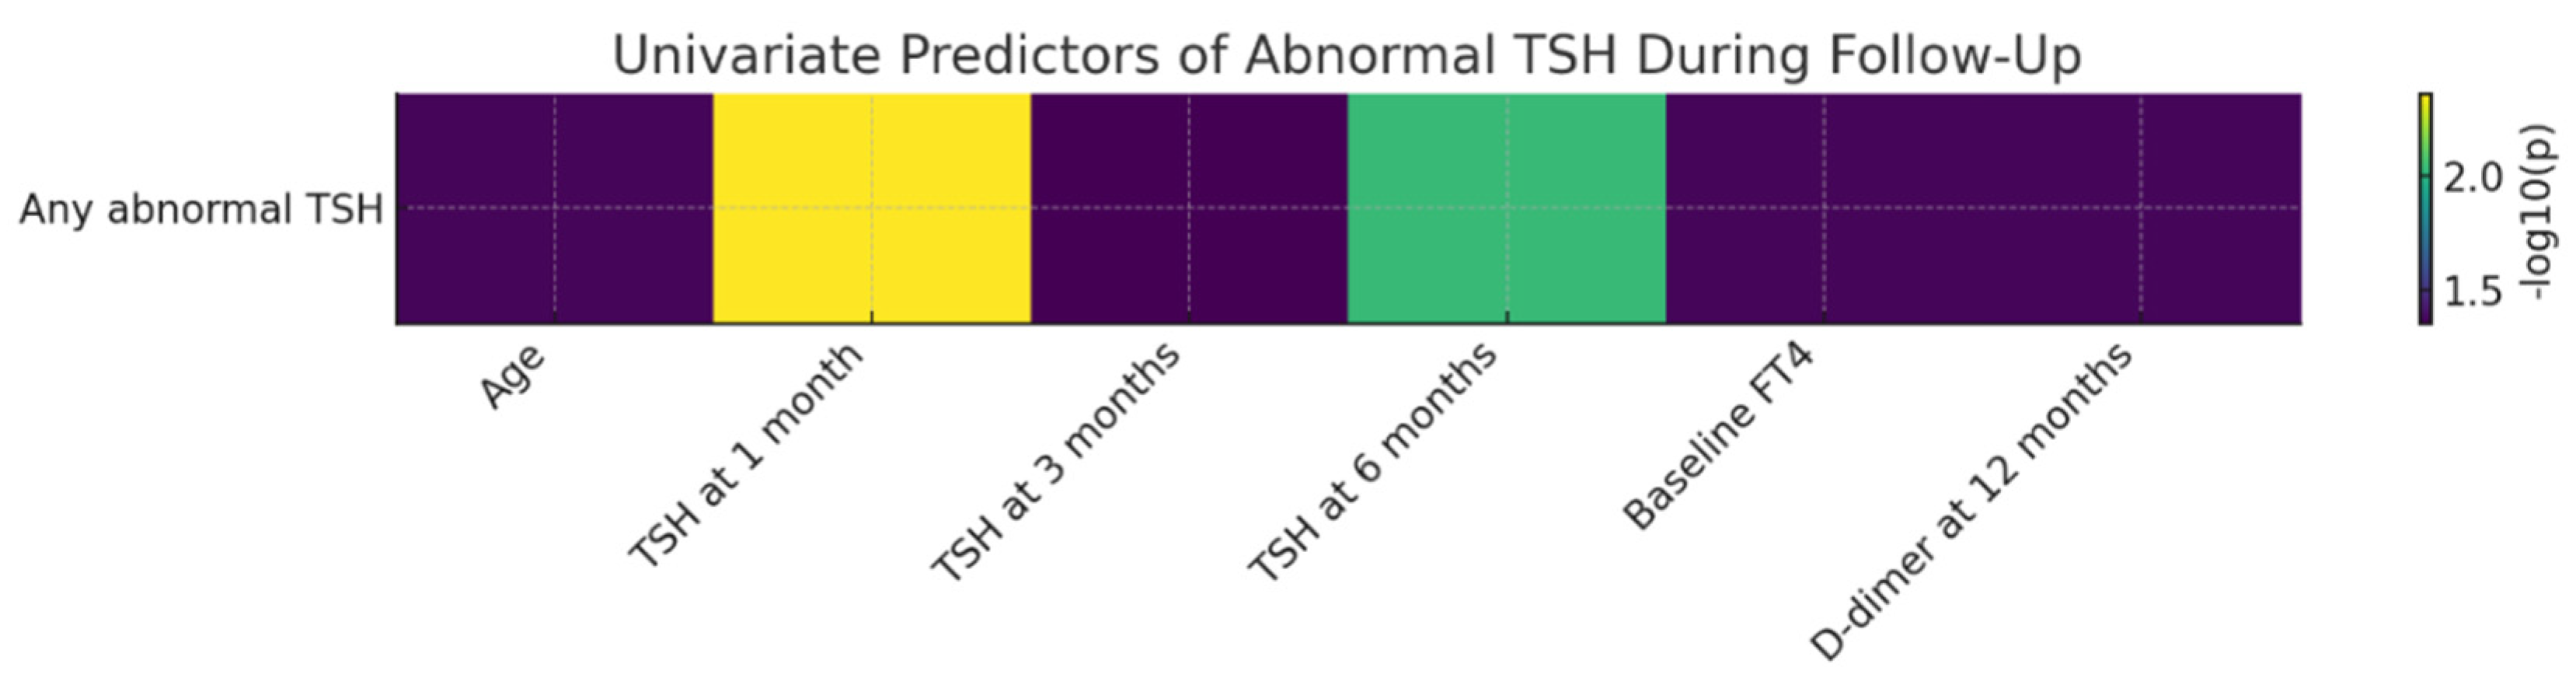
3.6. Predictors of TSH Abnormalities During Follow-Up
Univariate analyses identified several factors associated with the occurrence of TSH abnormalities over the 12-month follow-up period. TSH values measured at early visits (4–6 weeks, 3 months, and 6 months) were significantly higher in patients who subsequently developed persistent or recurrent TSH abnormalities, suggesting that early disturbances of the hypothalamic–pituitary–thyroid axis may anticipate delayed thyroid dysfunction.
Baseline FT4 levels were also significantly associated with the later development of TSH abnormalities (p = 0.0430), indicating that subtle alterations in peripheral thyroid hormone dynamics during the early post-infectious phase may have predictive relevance. In addition, D-dimer levels measured at 12 months were significantly associated with the presence of abnormal TSH values (p = 0.0423), suggesting a potential link between persistent low-grade activation of the coagulation system and instability of thyroid regulation in the post-COVID period.
The figure bellow illustrates, in the form of a heatmap, the strength of univariate associations between the evaluated clinical and paraclinical predictors and the occurrence of abnormal TSH during follow-up. The strongest predictor identified was TSH at the 4–6-week visit, followed by TSH at 6 months. Additional predictors showing moderate associations included baseline FT4 levels, age, and D-dimer concentrations at 12 months.
Figure 7.
Univariate Predictors of Abnormal TSH During 12-Month Follow-Up After SARS-CoV-2 Infection. Legend: Heatmap of univariate associations between clinical/paraclinical predictors and the occurrence of abnormal TSH during the 12-month follow-up period. Values are expressed as −log10(p), allowing visual comparison of the relative relevance of each predictor.
The strongest predictor identified was TSH measured at 4–6 weeks, with higher early values being significantly associated with the subsequent development of TSH abnormalities. This finding suggests that early disturbances of hypothalamic–pituitary–thyroid feedback may anticipate delayed thyroid dysfunction. Similarly, TSH levels at 6 months showed a strong association, indicating persistence of thyroid regulatory instability during the subacute post-COVID phase. Additional predictors with a moderate level of association included baseline FT4 levels, age, and D-dimer concentrations at 12 months, all exhibiting −log10(p) values compatible with statistical significance. These results suggest that both early thyroid function parameters and markers of late coagulation activation may contribute to shaping the risk of thyroid dysfunction during long-term recovery after COVID-19. Overall, the heatmap highlights a heterogeneous profile of factors associated with TSH abnormalities, with a clear predominance of early thyroid-related markers and additional associations involving selected systemic parameters, including coagulation markers. This integrated visualization underscores that post-COVID TSH abnormalities are linked to a diverse set of longitudinally assessed clinical and paraclinical variables.
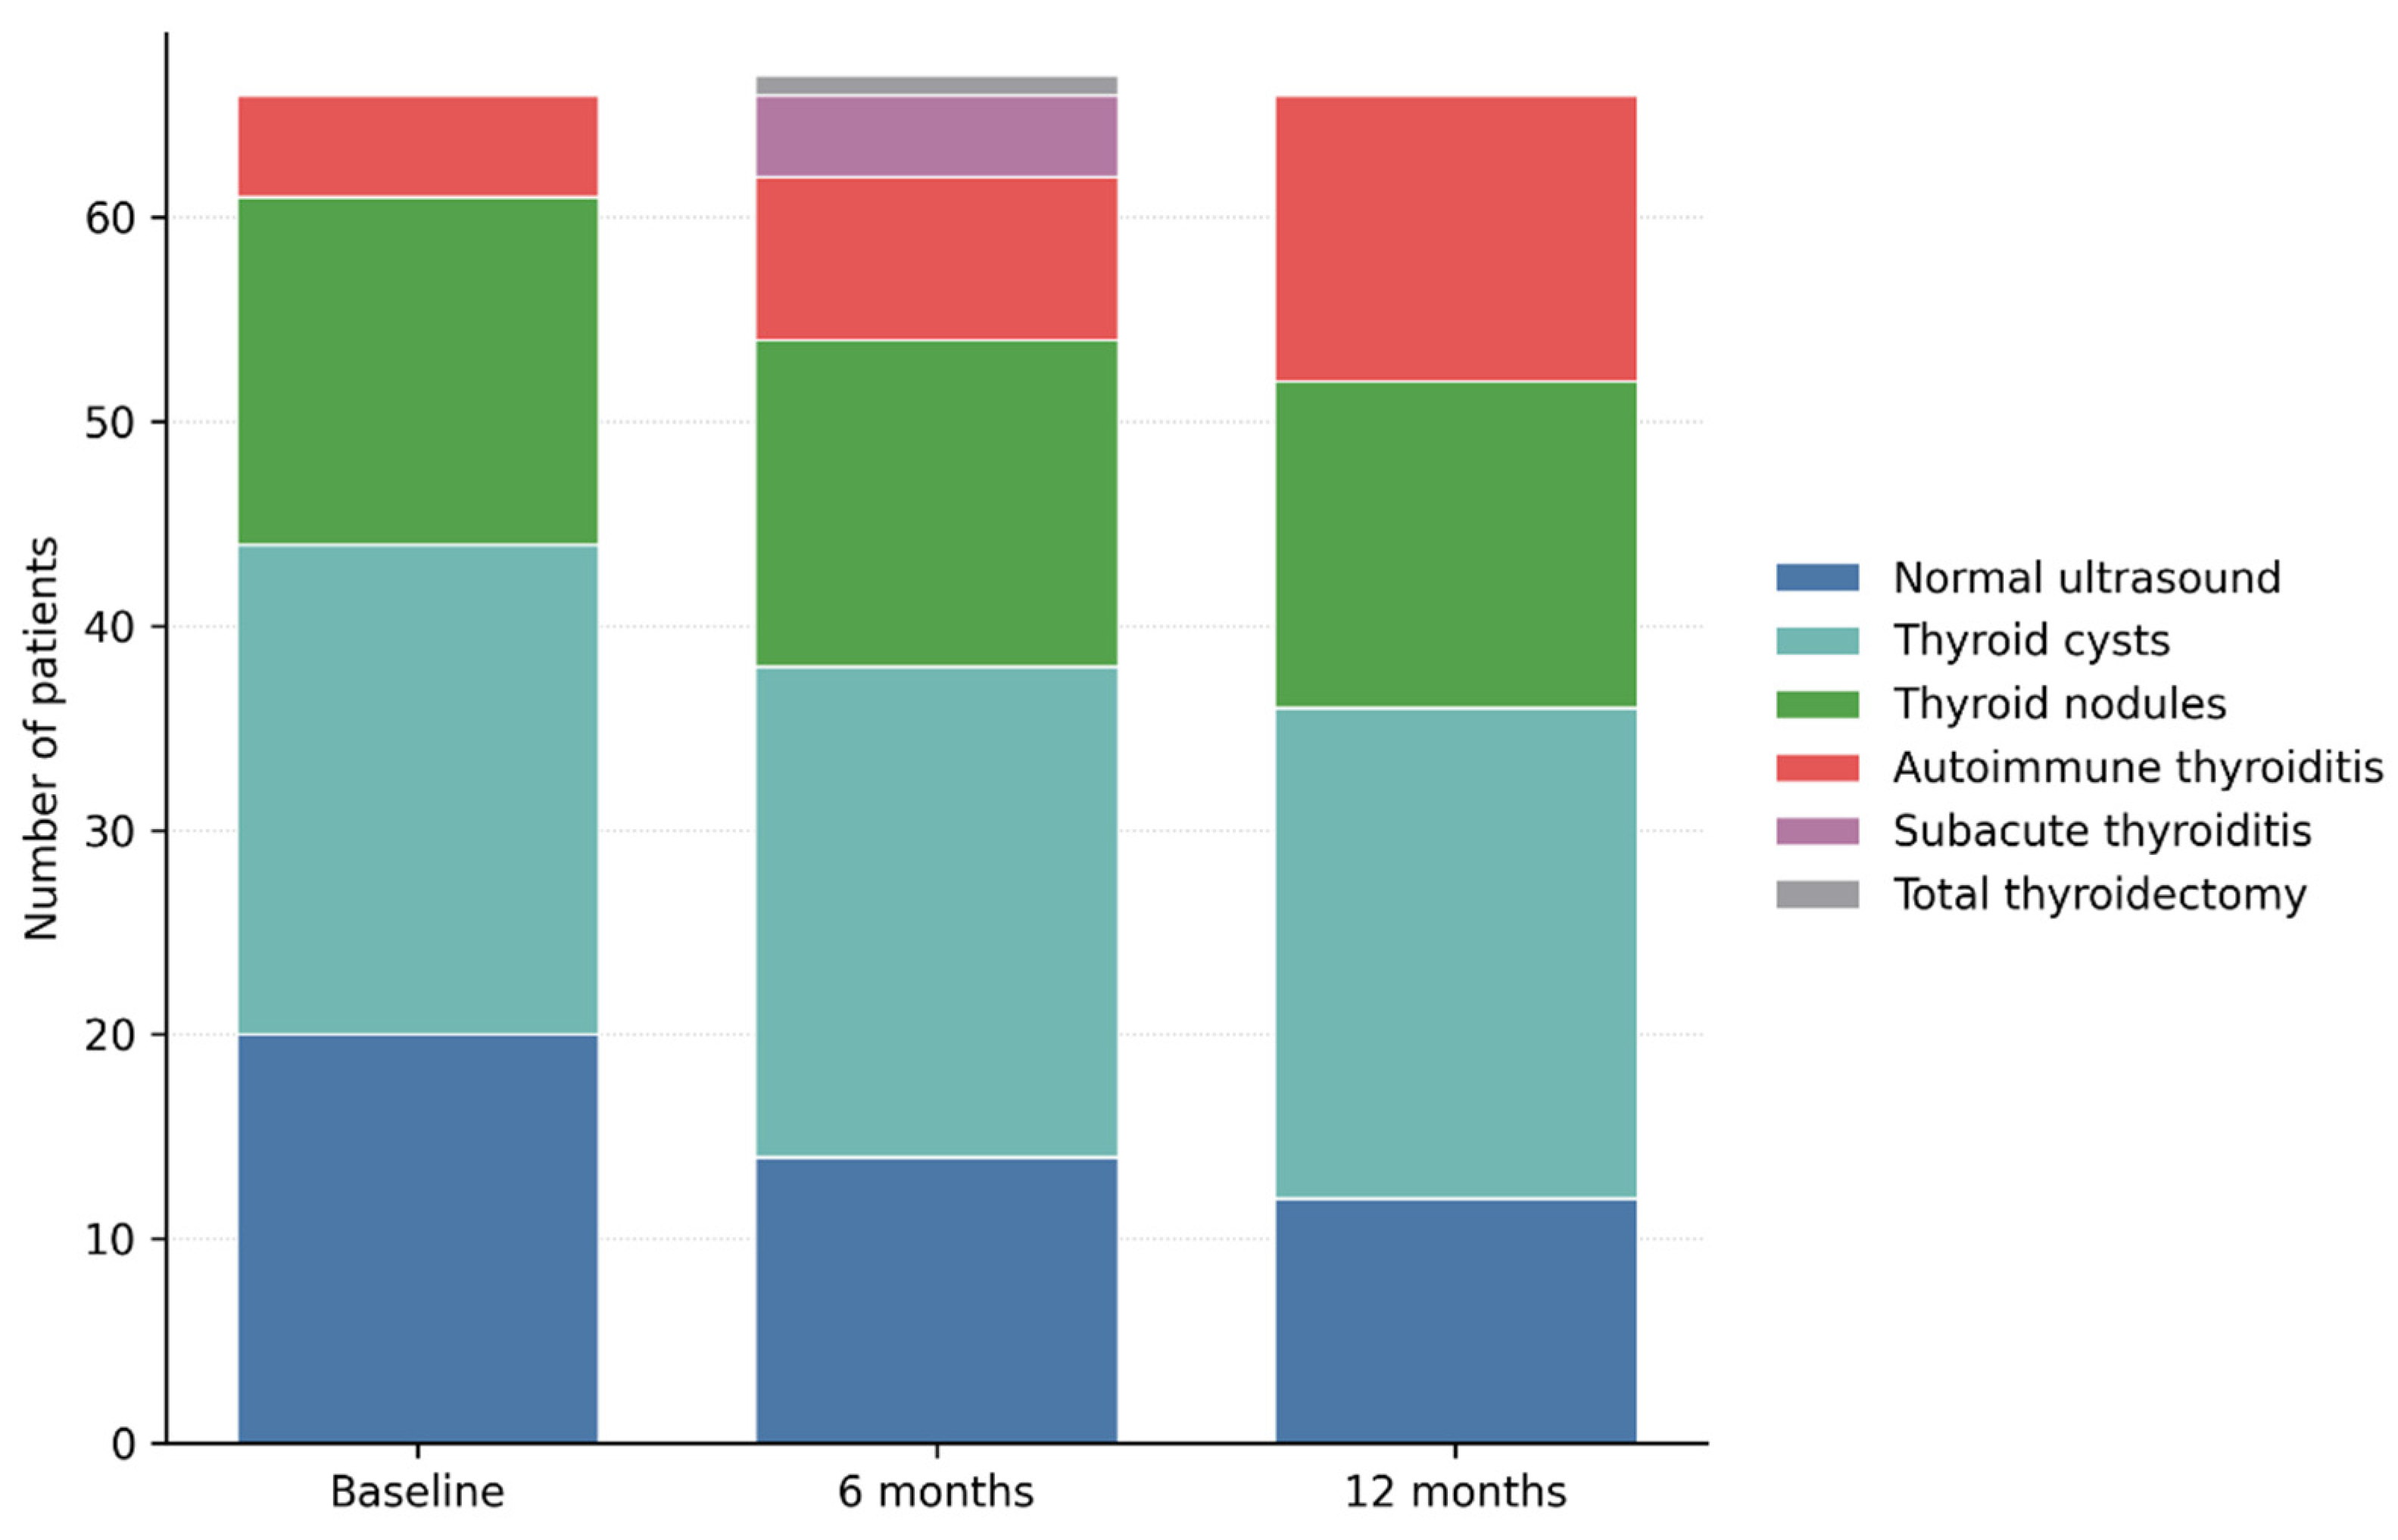
3.7. Longitudinal Thyroid Ultrasound Evolution over 12 Months of Follow-Up
Longitudinal thyroid ultrasound evaluation revealed dynamic structural changes of the thyroid gland throughout the 12-month follow-up period. Compared with baseline, the proportion of patients with a normal thyroid ultrasound pattern progressively decreased, from 29.9% at inclusion (20 patients) to 20.9% at 6 months (14 patients) and 17.9% at 12 months (12 patients), suggesting the de novo development of thyroid structural abnormalities during the post-COVID period.
Through longitudinal ultrasound monitoring, the prevalence of thyroid cysts remained unchanged, being identified in 24 patients at baseline as well as at the 6- and 12-month evaluations. Similarly, thyroid nodules exhibited a stable course, being observed in 17 patients at baseline and in 16 patients at subsequent assessments. No significant changes in lesion size, ultrasound characteristics, or vascular behaviour were documented during follow-up. This stability indicates a benign and non-progressive ultrasound profile of cystic and nodular lesions, without evidence of inflammatory activation associated with SARS-CoV-2 infection.
Figure 8.
Changes in Thyroid Ultrasound Patterns from Baseline to 12 Months after SARS-CoV-2 Infection. Legend: Longitudinal evolution of thyroid ultrasound findings over 12 months of follow-up. Stacked bar chart illustrating the distribution of thyroid ultrasound patterns at baseline, 6 months, and 12 months after SARS-CoV-2 infection. While benign cystic and nodular findings remained largely stable, a progressive increase in autoimmune thyroiditis was observed over time, along with transient cases of subacute thyroiditis. These findings highlight the dynamic and predominantly structural nature of post-COVID thyroid involvement.
In contrast, ultrasound findings suggestive of autoimmune thyroiditis showed a progressive and clinically relevant increase over time. The number of patients exhibiting a diffusely hypoechoic and heterogeneous thyroid pattern increased from 6 patients at baseline (9.0%) to 8 patients at 6 months (11.9%) and to 14 patients at 12 months (20.9%). This evolution supports the development or progression of structural changes compatible with autoimmune thyroiditis during the post-infectious period, even in the absence of marked functional thyroid abnormalities. Subacute thyroiditis was identified on ultrasound in 4 patients (6.0%) at the 6-month evaluation, characterized by poorly defined hypoechoic areas, reduced vascularity, and a diffuse inflammatory appearance. At the 12-month assessment, no patients exhibited active ultrasound features of subacute thyroiditis, confirming the transient and self-limiting nature of this condition. One patient required total thyroidectomy during follow-up after being diagnosed with papillary thyroid carcinoma at the 6-month evaluation and was therefore classified as post-total thyroidectomy at the 12-month visit.
Overall, longitudinal ultrasound analysis demonstrates a shift from a predominantly normal structural profile, or one characterized by benign, nonspecific lesions toward progressive inflammatory and autoimmune changes. These findings suggest that post-COVID thyroid involvement may manifest as a delayed structural phenotype, detectable on ultrasound before the development of overt hormonal dysfunction.
Table 4.
Longitudinal evolution of thyroid ultrasound findings during the 12-month follow-up after SARS-CoV-2 infection.
Table 4.
Longitudinal evolution of thyroid ultrasound findings during the 12-month follow-up after SARS-CoV-2 infection.
| Ultrasound Pattern |
Baseline (n = 67) |
6 Months (n = 67) |
12 Months (n = 67) |
| Normal ultrasound appearance |
20 |
14 |
12 |
| Thyroid cysts |
24 |
24 |
24 |
| Thyroid nodules |
17 |
16 |
16 |
| Autoimmune thyroiditis |
6 |
8 |
14 |
| Subacute thyroiditis |
0 |
4 |
0 |
| Status post-total thyroidectomy |
0 |
0 |
1 |
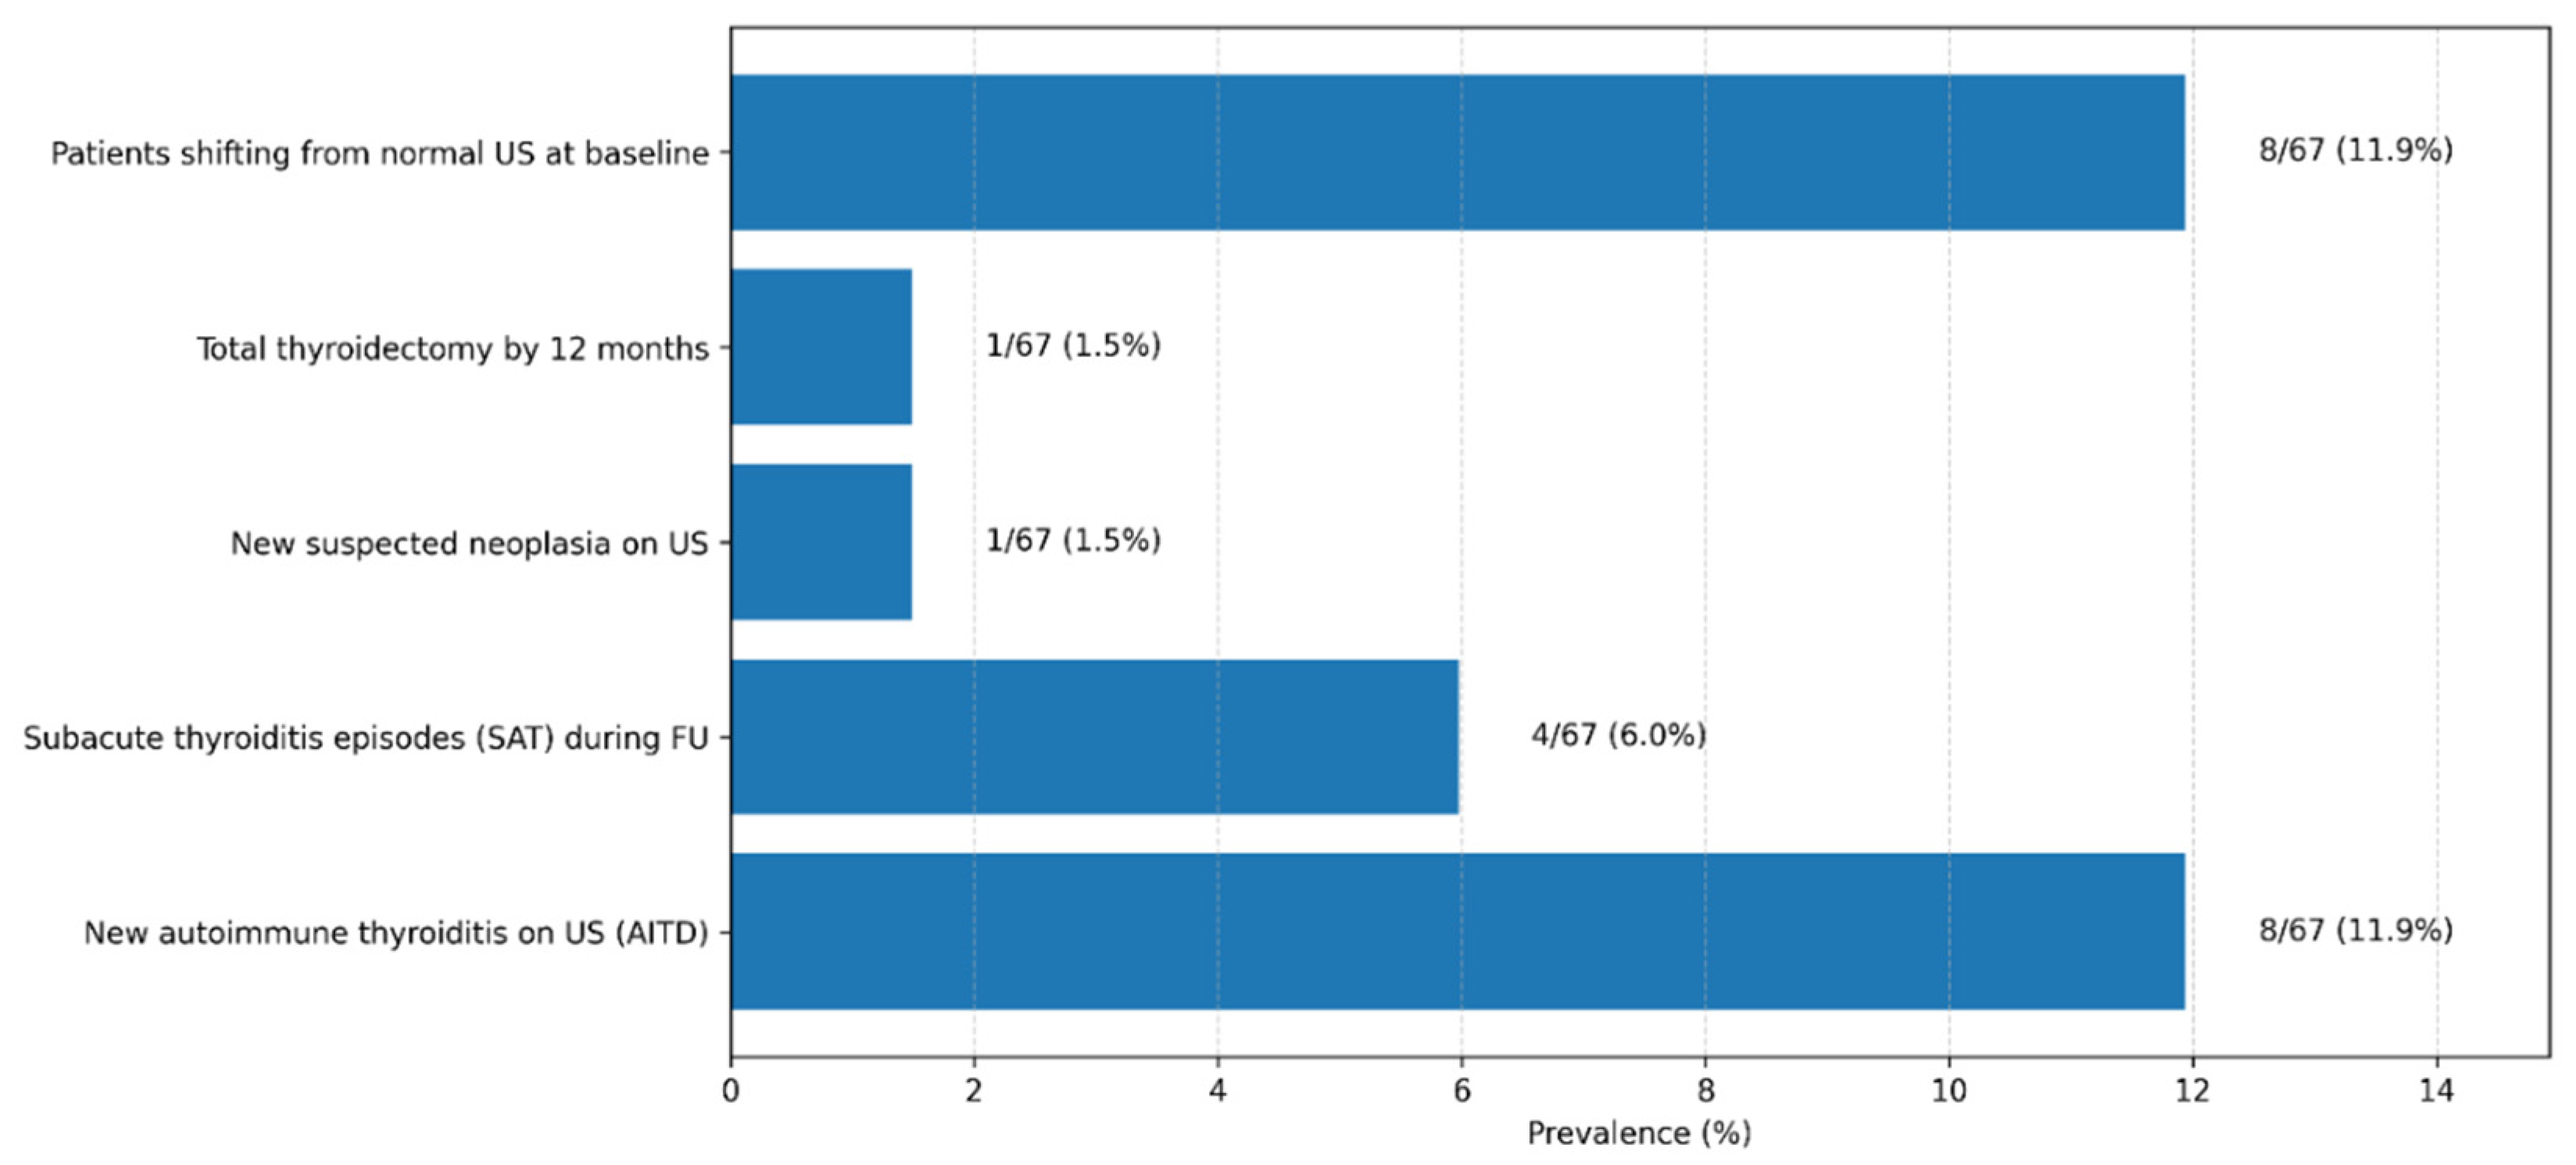
3.8. Prevalence of Thyroid Disorders at 12-Month Follow-Up
In the cohort of 67 patients monitored for 12 months after acute SARS-CoV-2 infection, we identified a substantial proportion of inflammatory and autoimmune thyroid disorders. Overall, despite the predominantly mild or moderate severity of the acute infection, nearly one in five patients (17.9%) developed an inflammatory or autoimmune thyroid condition during the year following infection. Moreover, only approximately 12% of participants remained completely free of biochemical and/or ultrasound thyroid abnormalities throughout follow-up, suggesting that subtle functional or structural thyroid alterations are common after COVID-19, even in patients without prior thyroid disease.
These findings are consistent with emerging data from the international literature and support the concept that SARS-CoV-2 may induce both transient inflammatory thyroid processes and persistent immune autoreactivity. The results underscore the need for careful endocrine follow-up after COVID-19, particularly in patients with persistent symptoms or early detected hormonal abnormalities.
Figure 9.
Thyroid-Related Clinical and Ultrasonographic Outcomes Observed During 12-Month Post–COVID-19 Follow-Up. Legend: The bar chart summarizes the prevalence of key thyroid-related outcomes identified during the 12-month follow-up period in the study cohort (n = 67). Displayed outcomes include the development of new autoimmune thyroiditis on ultrasound (AITD), episodes of subacute thyroiditis (SAT), transition from normal baseline thyroid ultrasound to abnormal findings, newly suspected thyroid neoplasia, and total thyroidectomy performed during follow-up. Values are expressed as absolute numbers and corresponding percentages. Autoimmune thyroiditis was defined based on characteristic ultrasonographic features, with or without associated thyroid autoantibodies.
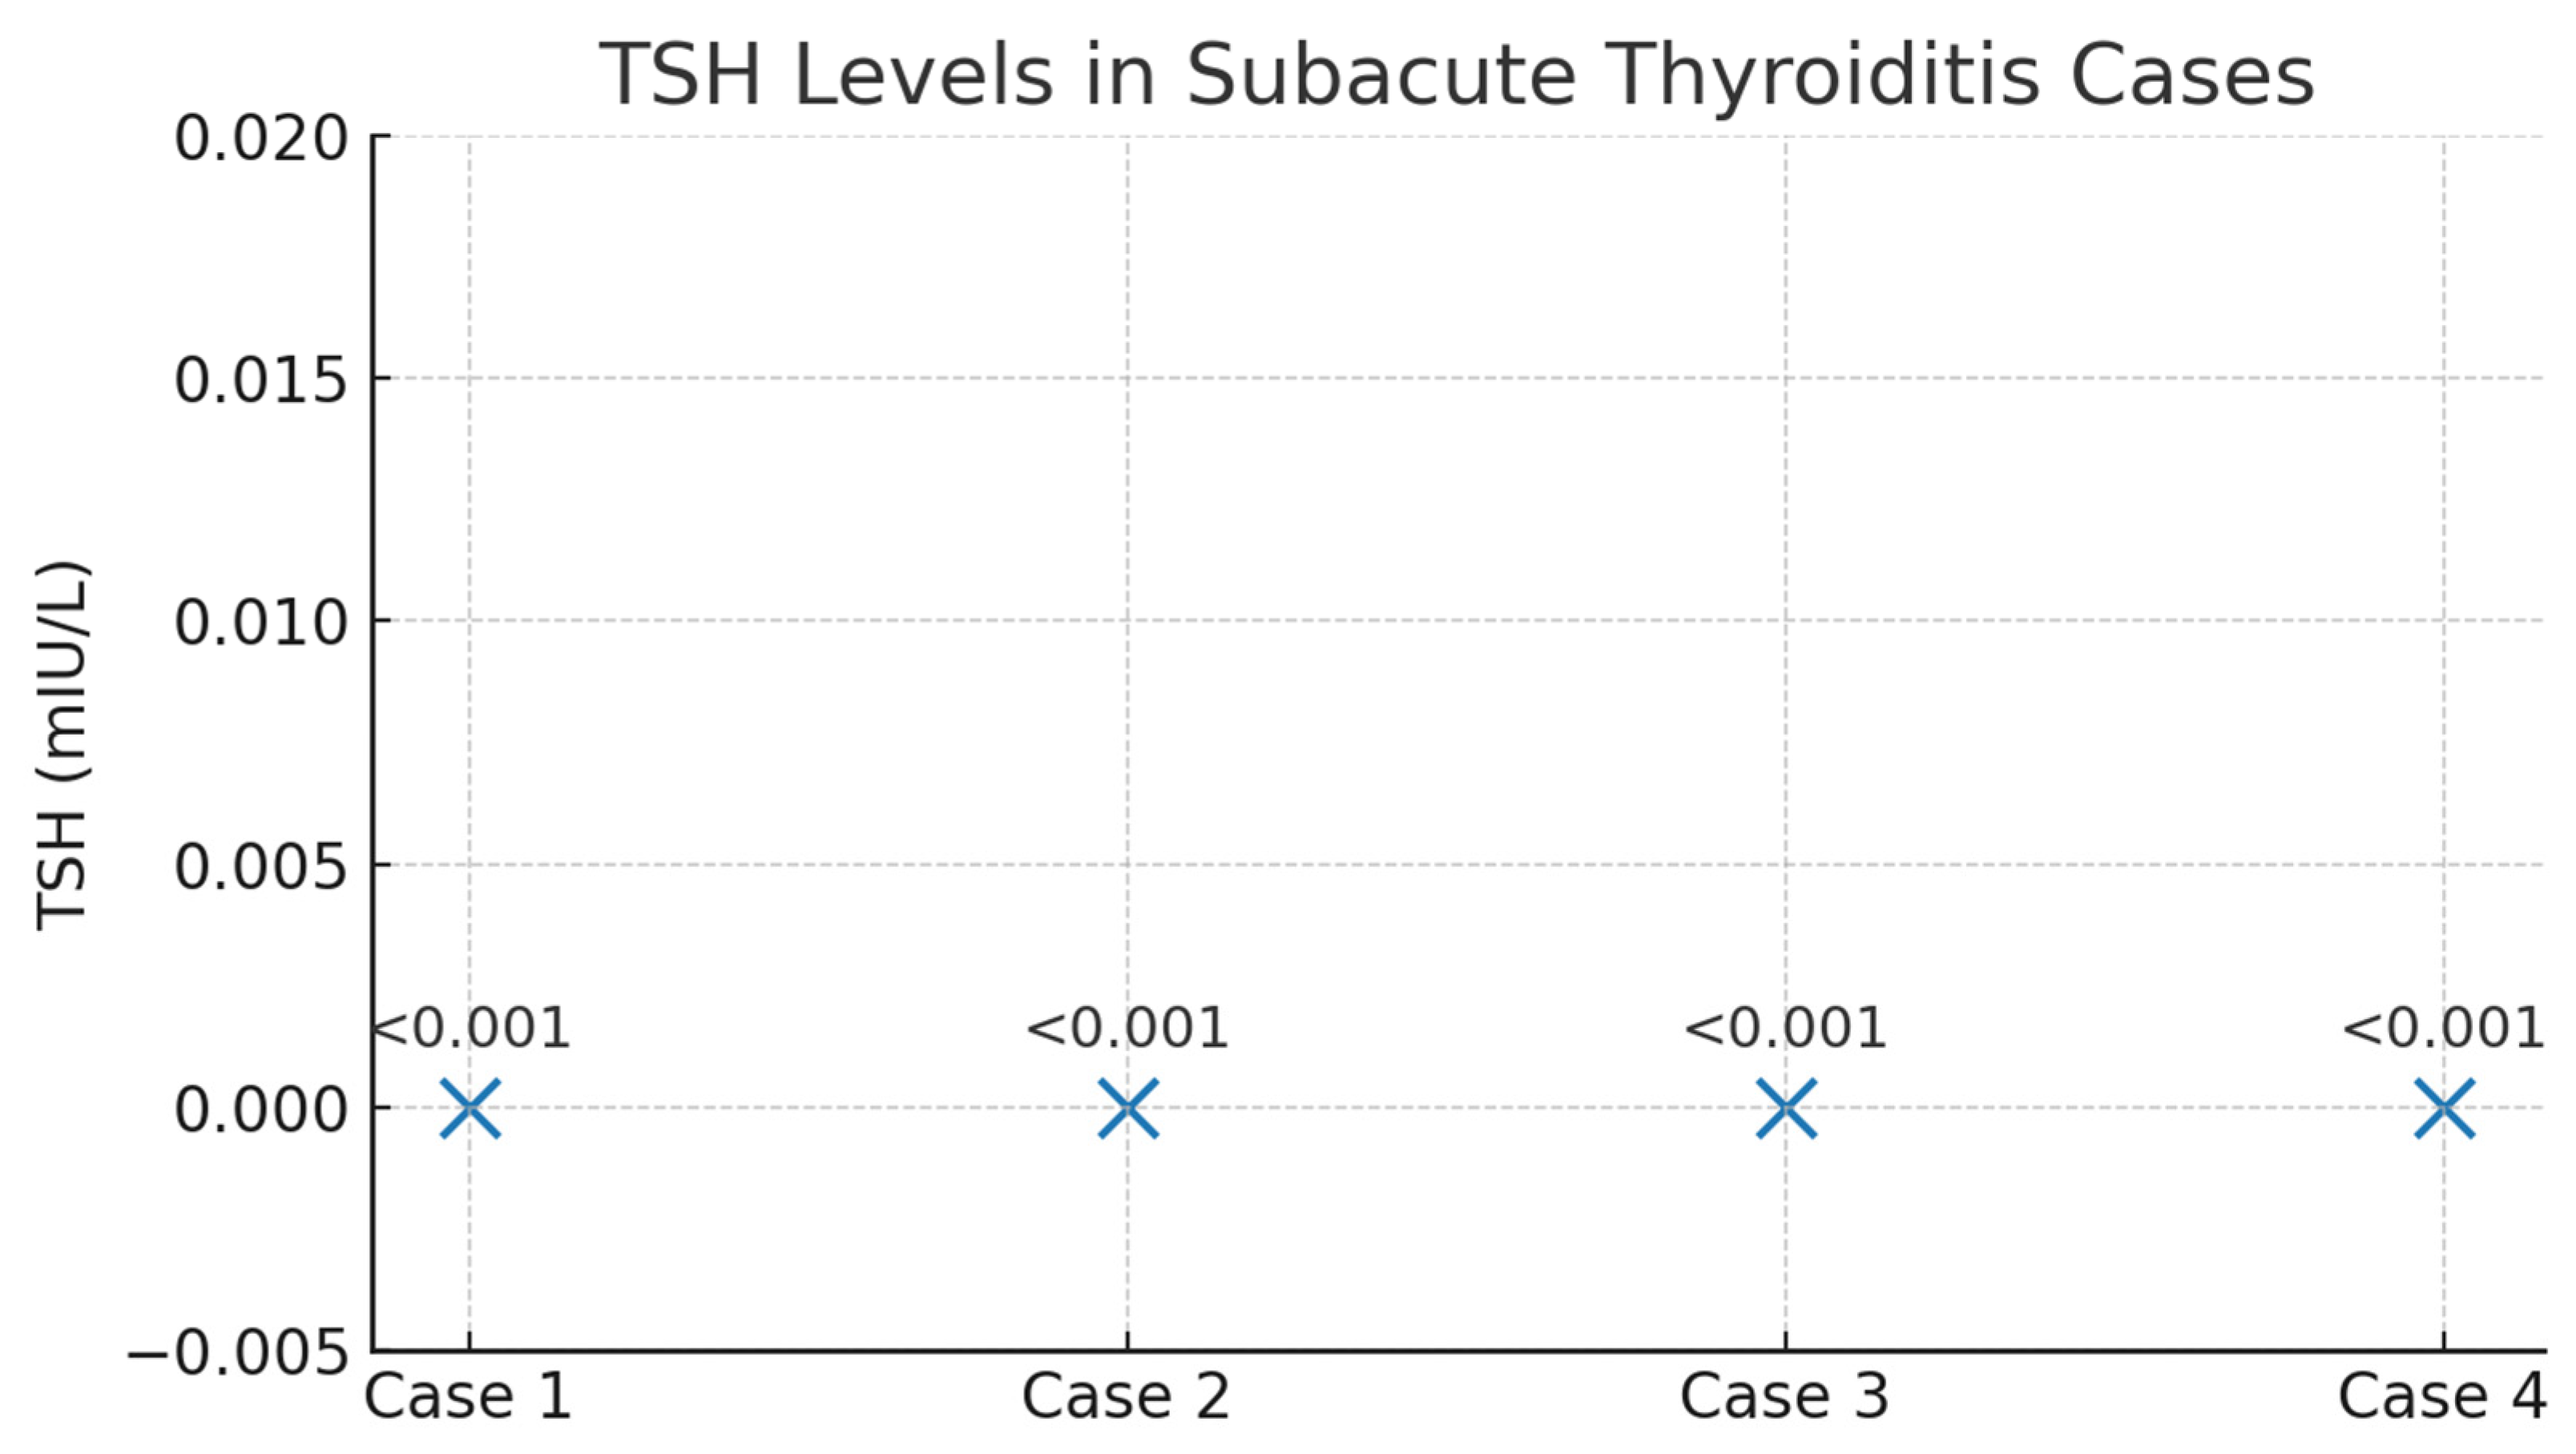
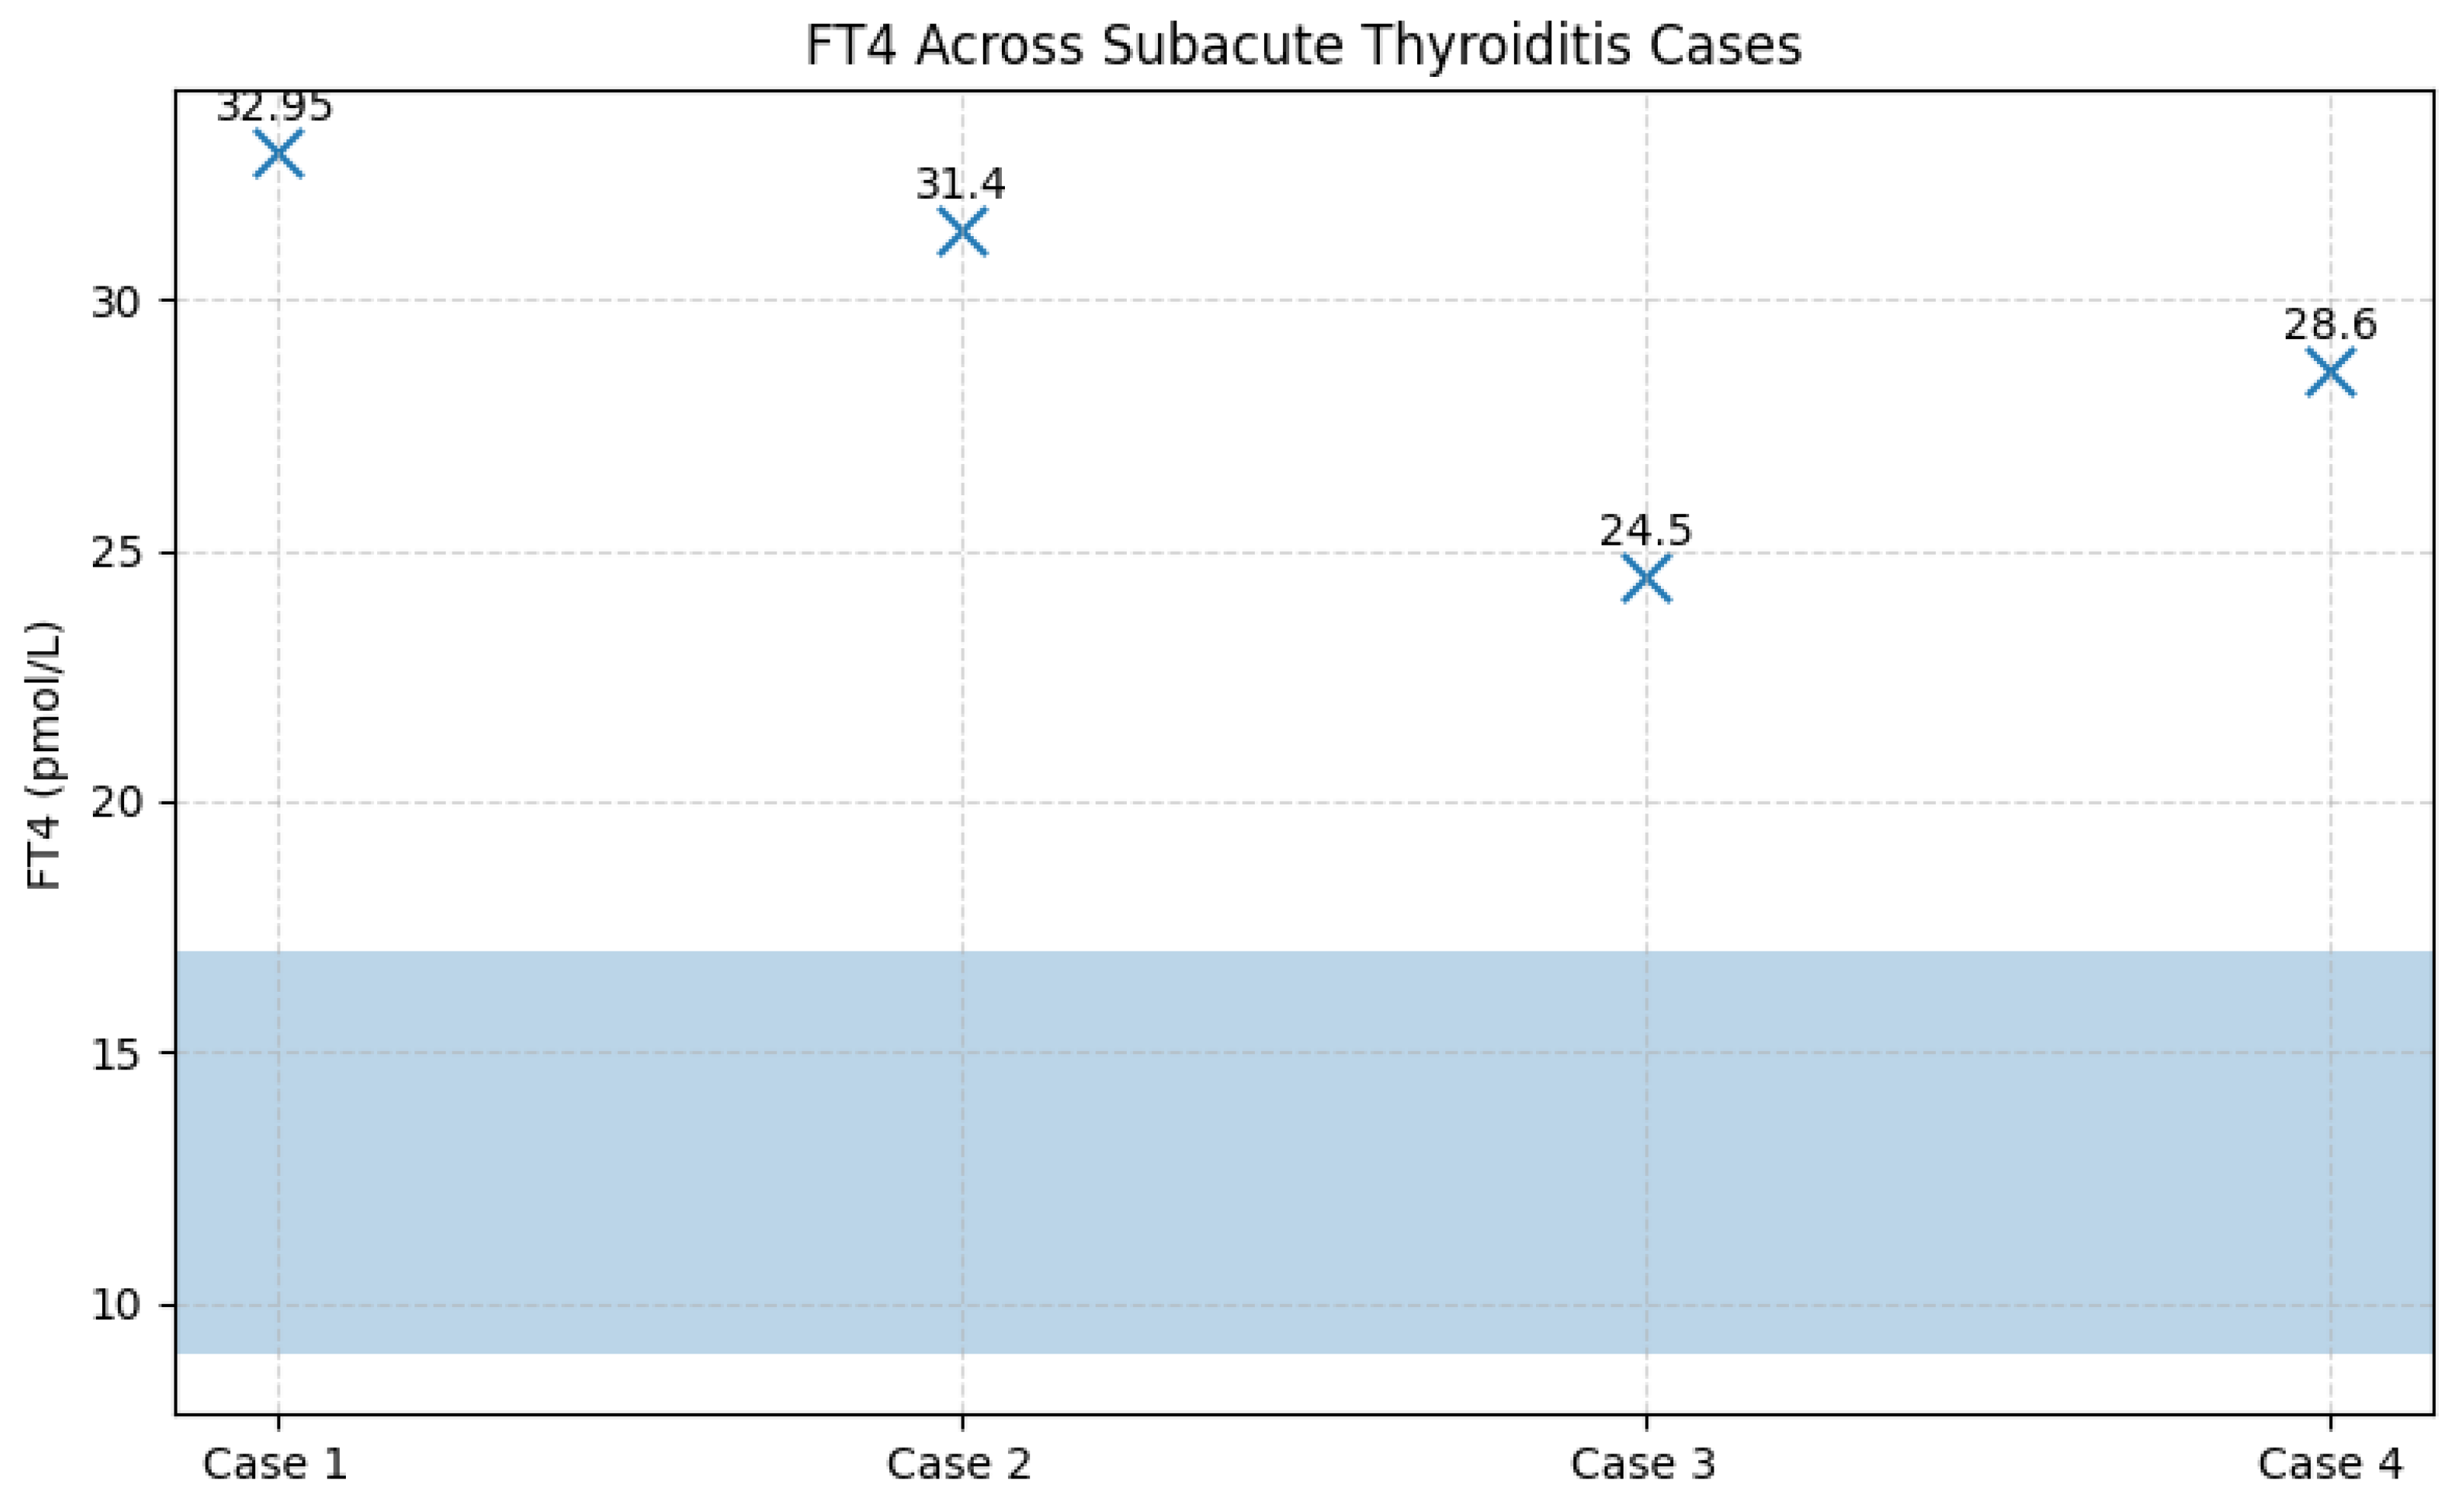
3.8.1. Incidence of Subacute Thyroiditis
Among the 67 patients prospectively followed for 12 months after acute SARS-CoV-2 infection, four cases of subacute thyroiditis (SAT) were identified, corresponding to an incidence of 6.0%. The cases were evenly distributed by sex (two women and two men), with ages ranging from 40 to 71 years. Symptom onset occurred between 30 and 45 days after the acute COVID-19 episode, a time frame consistent with post-viral inflammatory manifestations. Clinically, all patients presented with persistent fever and anterior neck pain; alternative infectious causes of fever were excluded through standardized evaluation. From a paraclinical perspective, all patients exhibited marked systemic inflammation, including leukocytosis and significantly elevated ESR, fibrinogen, and CRP levels. Thyroid function tests revealed a clear pattern of transient thyrotoxicosis, with profoundly suppressed TSH levels (<0.001 mIU/L; reference range 0.3–4.5 mIU/L) and markedly elevated FT4 concentrations ranging from 24.5 to 32.95 pmol/L (reference range 8.9–17.2 pmol/L). Thyroid autoantibodies, anti-TPO (<30 IU/mL) and anti-thyroglobulin (<95 IU/mL), remained within normal limits in all cases, confirming the non-autoimmune nature of the inflammatory process.
Thyroid ultrasound, performed by an experienced thyroid imaging specialist, demonstrated features characteristic of subacute thyroiditis, including hypoechoic, heterogeneous, poorly vascularized areas, without nodules or ultrasound findings suggestive of autoimmune thyroid disease. These findings supported the diagnosis in accordance with European Thyroid Association criteria.
All patients were treated with corticosteroids, with a rapid clinical response characterized by prompt resolution of neck pain and fever within the first days of therapy. Notably, none of the patients had received corticosteroid treatment during the acute COVID-19 episode, as all had experienced mild forms of the disease. Clinical evolution was favorable: at follow-up (three months for two patients and six months for the remaining two), thyroid function had normalized in all cases, with no requirement for subsequent thyroid hormone replacement therapy. Although a brief transient hypothyroid phase was observed in two patients, this resolved spontaneously, consistent with the classic triphasic course of SAT.
Analysis of vaccination status showed that two affected patients were unvaccinated against COVID-19, while the other two had received two doses of the Pfizer-BioNTech vaccine approximately two years prior to the onset of thyroiditis, an interval that does not support a direct temporal association between vaccination and the inflammatory episode.
Table 5.
Biochemical and Immunological Profile of Patients with Subacute Thyroiditis at Diagnosis.
Table 5.
Biochemical and Immunological Profile of Patients with Subacute Thyroiditis at Diagnosis.
| Case |
Sex |
TSH (mIU/L) |
FT4 (pmol/L) |
FT3 (pmol/L) |
Anti-TPO (IU/mL) |
Anti-Tg (IU/mL) |
| 1 |
F |
<0.001 |
32.9 |
10.7 |
8 |
34.9 |
| 2 |
M |
0.018 |
31.4 |
7.7 |
2.13 |
33.1 |
| 3 |
F |
<0.001 |
24.5 |
8.91 |
25 |
28 |
| 4 |
M |
<0.001 |
28.6 |
8.8 |
20 |
52.4 |
Figure 10.
TSH values in patients with subacute thyroiditis identified during follow-up. Legend: Scatter plot illustrating TSH levels in the four cases of subacute thyroiditis diagnosed during follow-up. All patients exhibited biochemical thyrotoxicosis, with TSH values below the assay detection limit (<0.001 mIU/L). The uniform and profound suppression of TSH reflects the acute destructive process characteristic of subacute thyroiditis.
Figure 11.
FT4 concentrations in patients with subacute thyroiditis in relation to the reference range. Legend: FT4 values for the four cases of subacute thyroiditis are displayed relative to the reference range (8.9–17.2 pmol/L, highlighted by the shaded blue area). All patients exhibited markedly elevated FT4 concentrations, consistent with the thyrotoxic phase of subacute thyroiditis. Individual FT4 values are indicated above each data point for clarity.
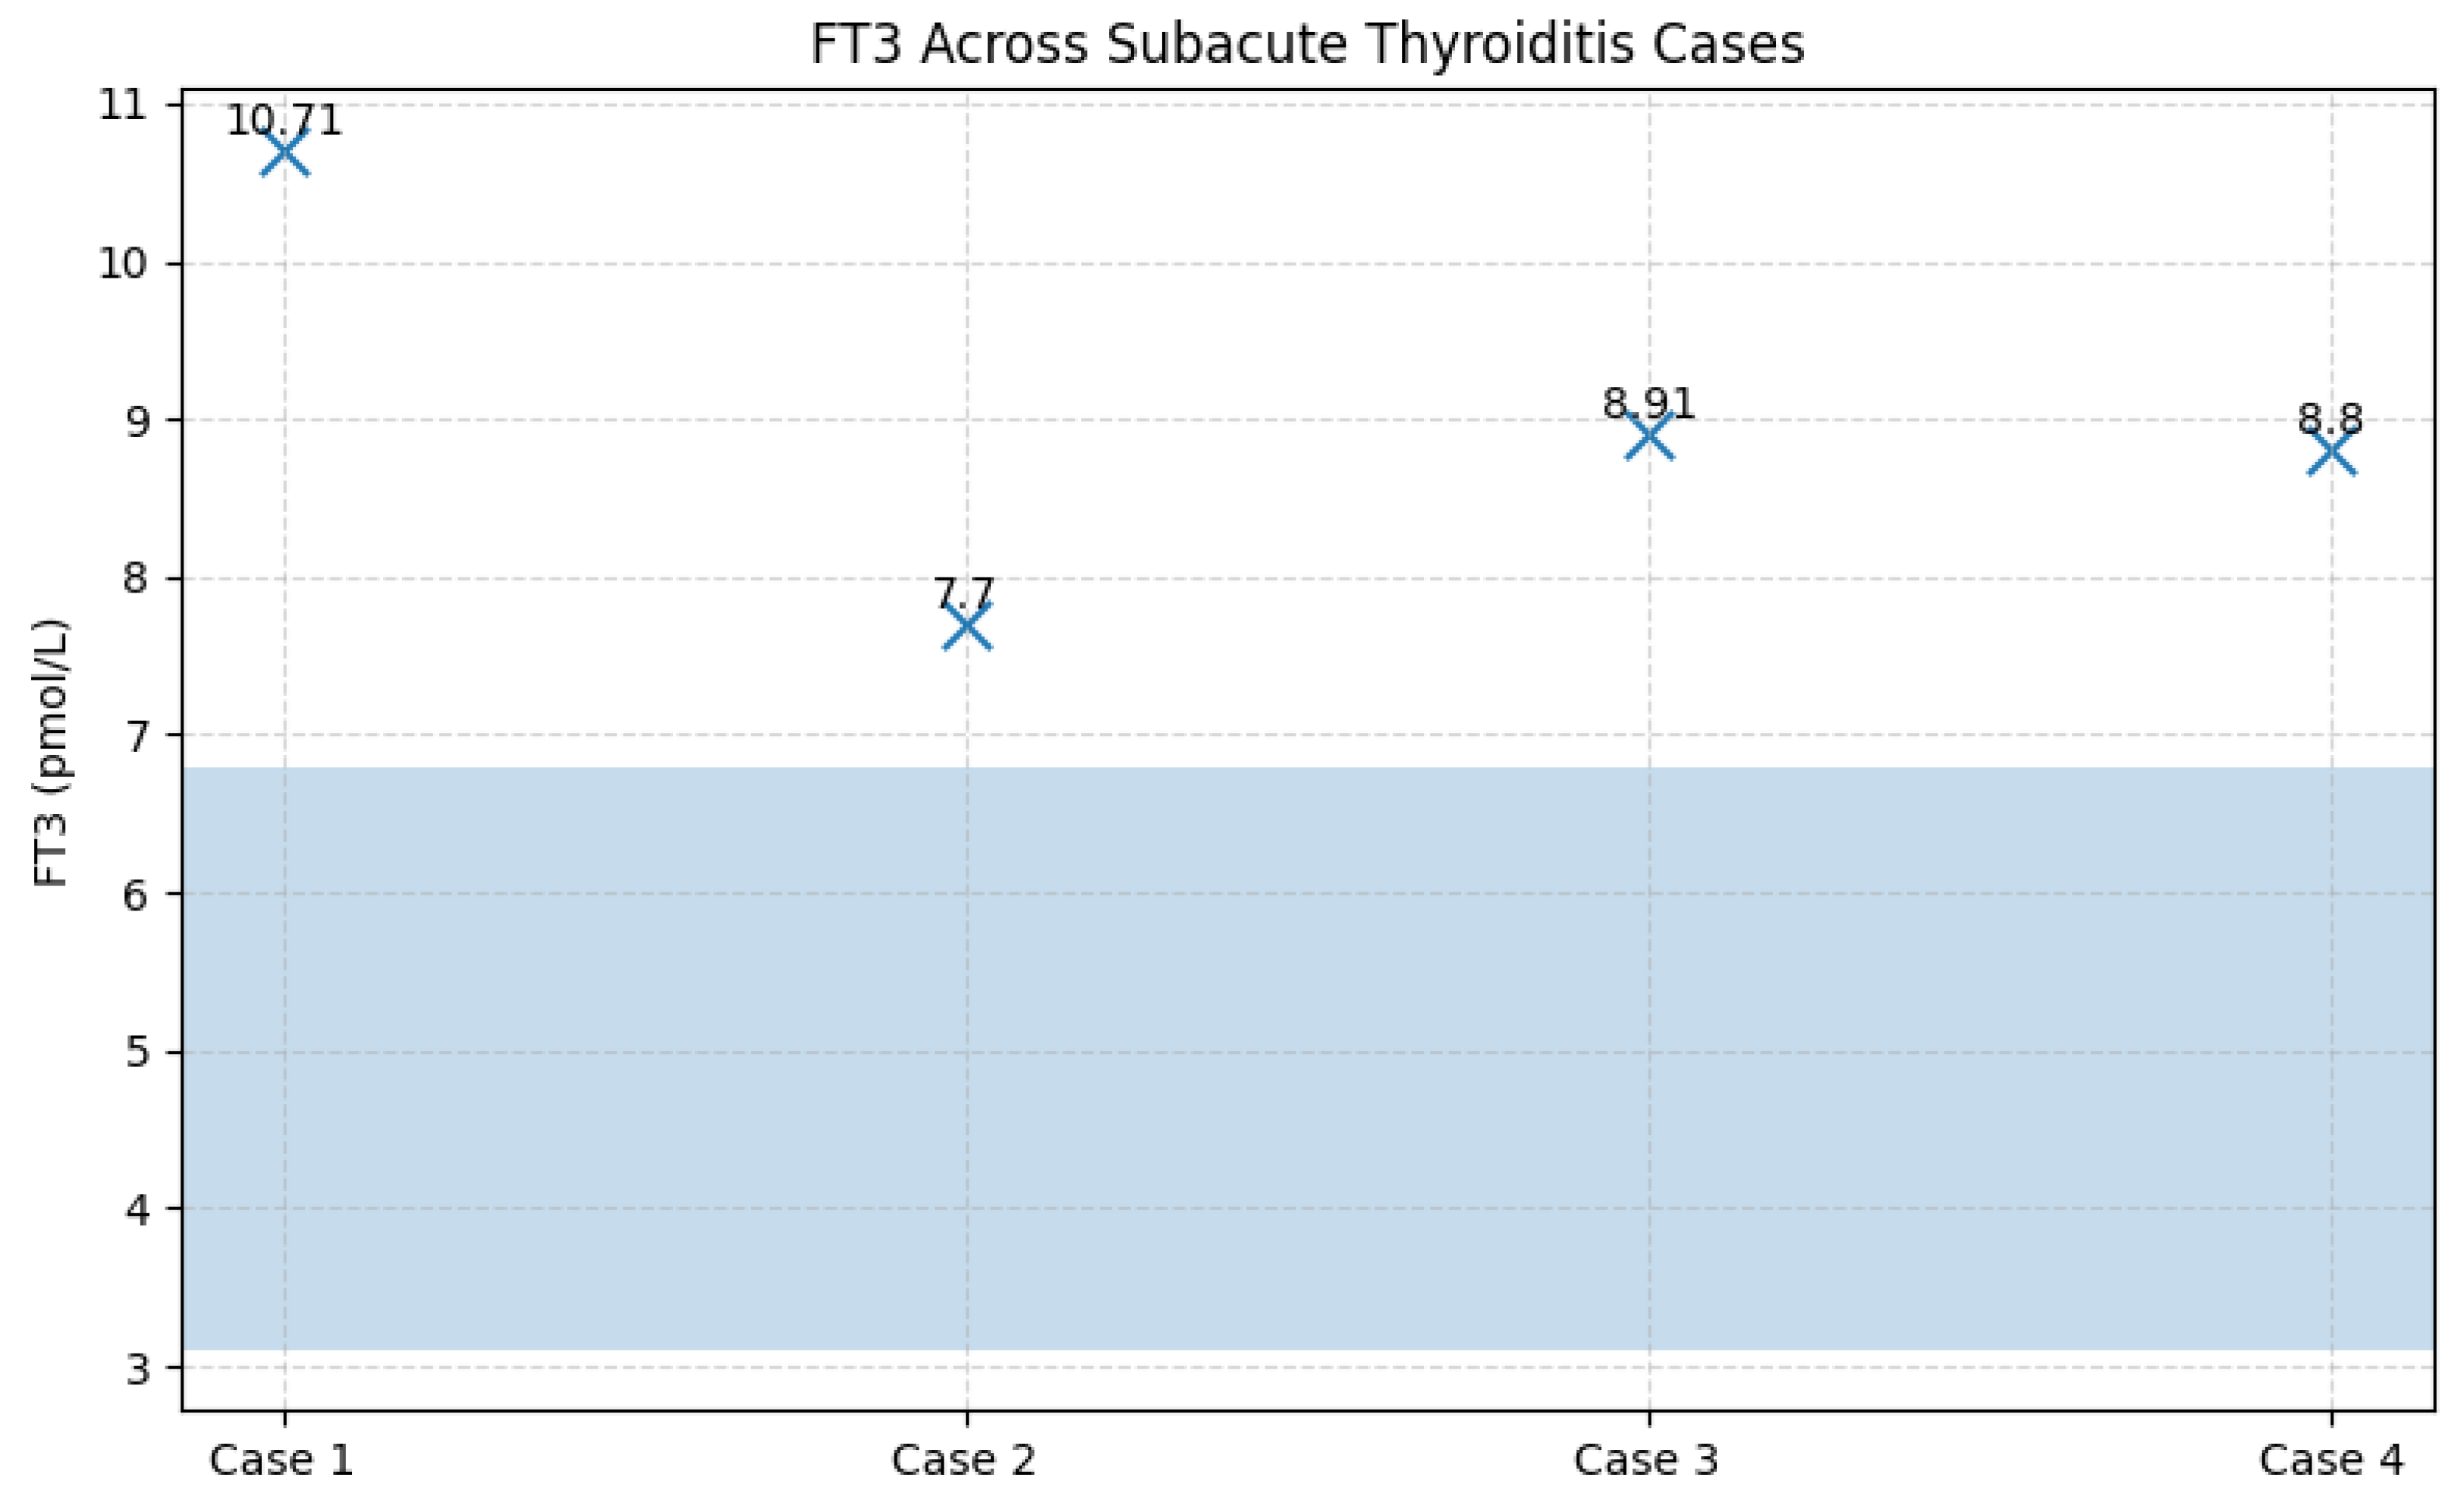
Figure 12.
FT3 concentrations in patients with subacute thyroiditis in relation to the reference range. Legend: FT3 values are shown relative to the normal reference range (highlighted by the shaded blue area). All four patients exhibited elevated FT3 concentrations, indicating active thyrotoxicosis due to the release of thyroid hormones from the inflamed thyroid gland. Individual FT3 values are displayed numerically on the graph for clarity.
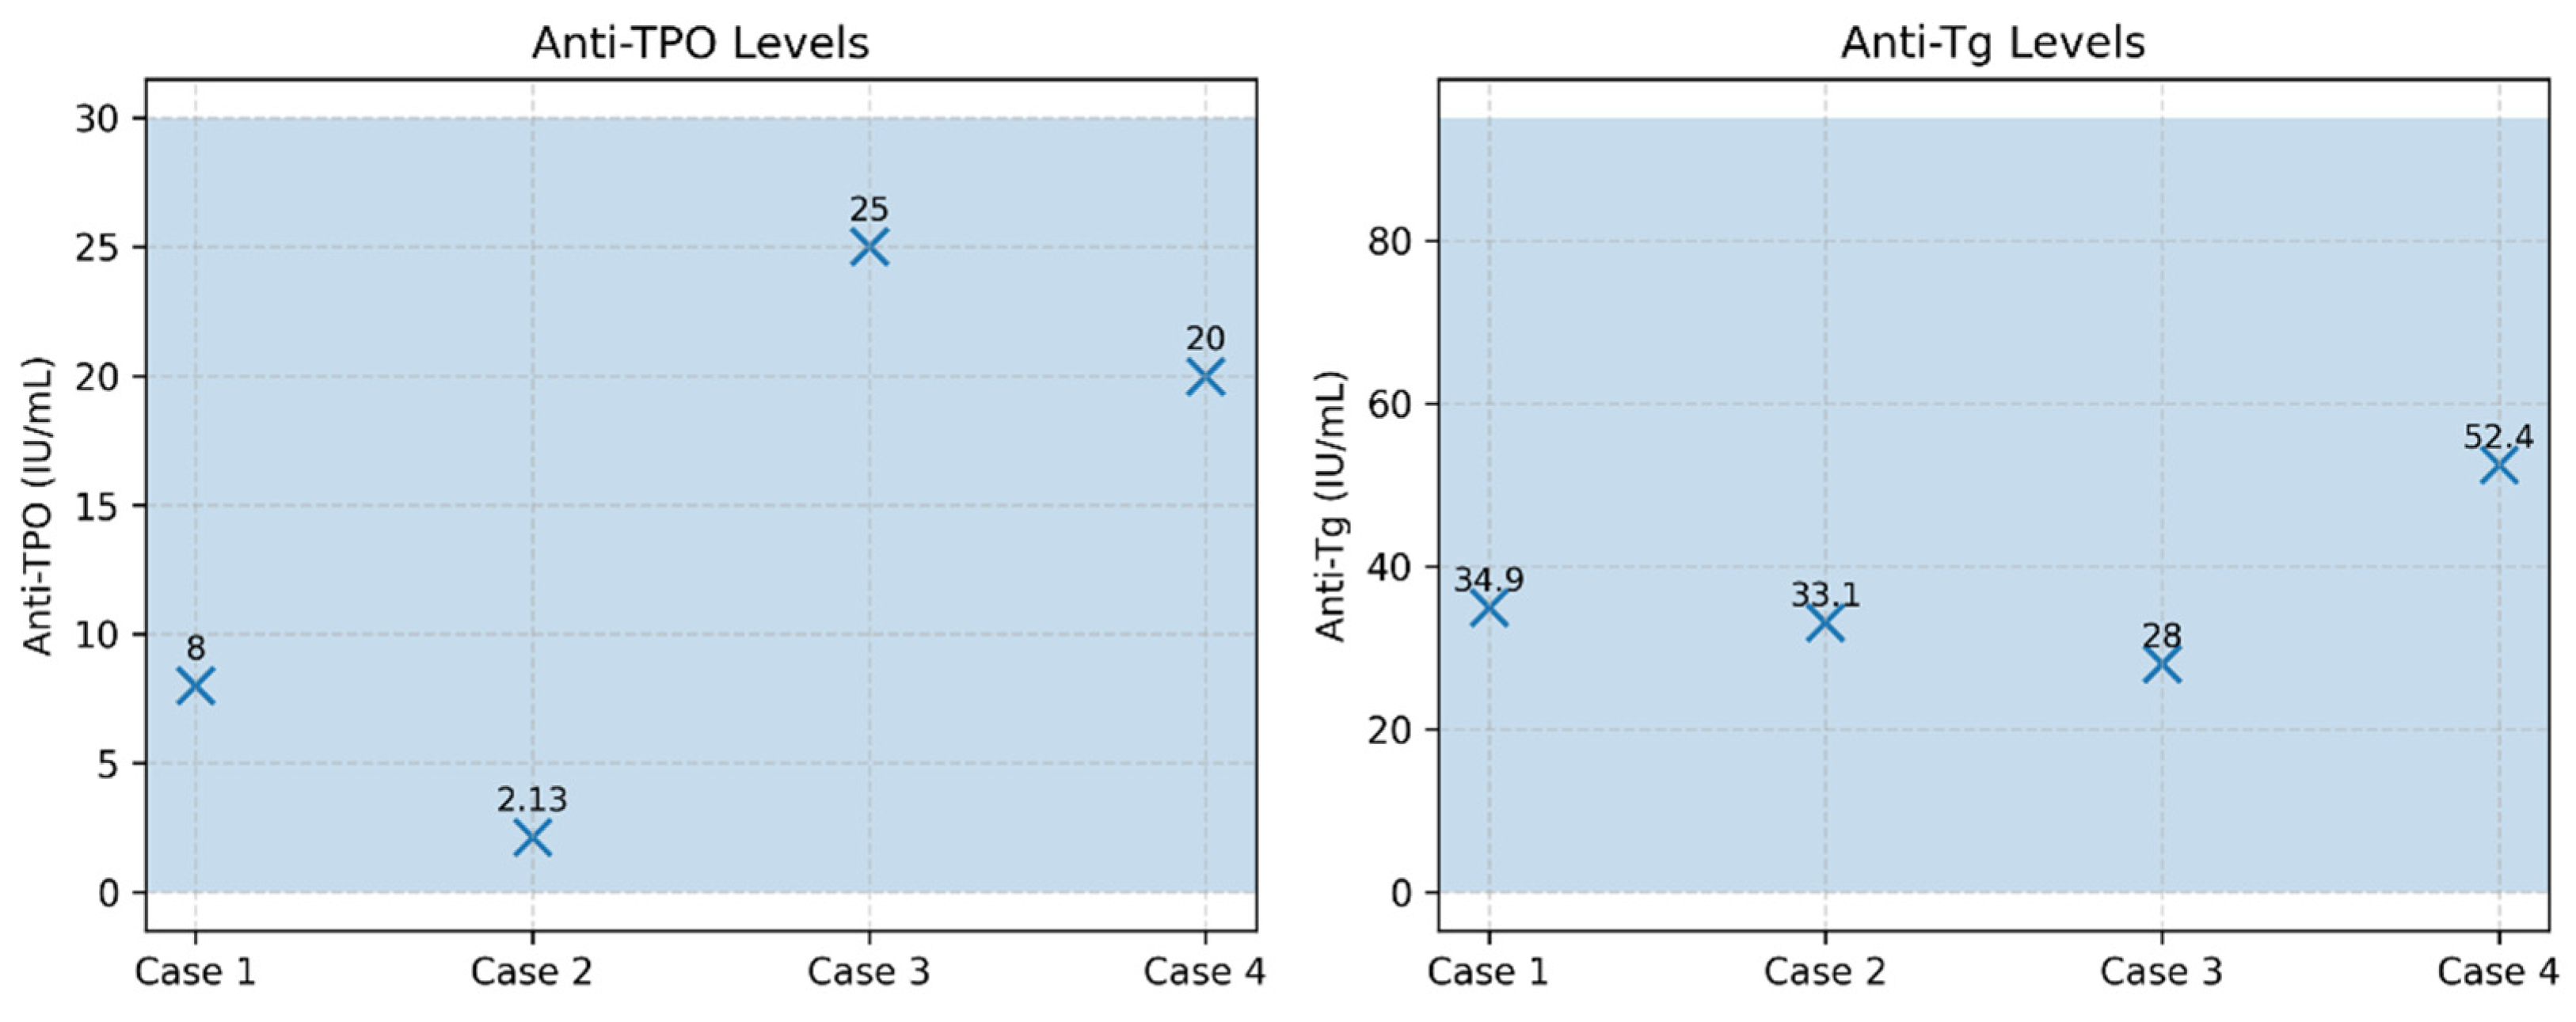
Figure 13.
Thyroid autoantibodies (anti-TPO and anti-Tg) in patients with subacute thyroiditis. Legend: Serum anti-TPO (reference <30 IU/mL) and anti-thyroglobulin antibodies (anti-Tg; reference <95 IU/mL) are shown for the four cases of subacute thyroiditis. All patients exhibited antibody levels within the normal reference ranges, a finding characteristic of non-autoimmune subacute thyroiditis. Shaded blue areas indicate the reference intervals for each marker.
3.8.2. Incidence of Autoimmune Thyroiditis
For the analysis of autoimmune thyroiditis incidence, patients with a known history of autoimmune thyroid disease were excluded from this evaluation. At baseline, all patients included in this subgroup had no prior history of autoimmune thyroiditis, and thyroid ultrasound performed at enrolment was normal.
During follow-up, autoimmune thyroiditis was identified in 8 patients (11.9%). In these patients, thyroid ultrasound abnormalities developed over the course of monitoring, becoming evident predominantly at the 6-month evaluation and characterized by a diffuse hypoechoic and heterogeneous echotexture. Assessment of thyroid autoantibodies revealed elevated anti-thyroid peroxidase (anti-TPO) and/or anti-thyroglobulin (anti-Tg) titters in four patients, whereas in the remaining cases ultrasound changes were present in the absence of detectable thyroid autoantibodies. From a functional perspective, patients exhibited either a euthyroid profile or TSH values consistent with subclinical or early hypothyroidism. TSH levels showed a heterogeneous course within this subgroup. Most patients maintained TSH values within the reference range (0.3–4.5 mIU/L) throughout follow-up; however, several patients experienced significant fluctuations during the first months, compatible with transient post-infectious thyroid dysfunction, including one case with marked TSH suppression (<0.001 mIU/L) persisting between 3 and 12 months. In addition, one patient demonstrated progressive increases in TSH at 6 and 12 months, reaching 5.59 mIU/L. Overall, TSH dynamics highlighted substantial interindividual variability over the 12-month follow-up period (
Figure 14).
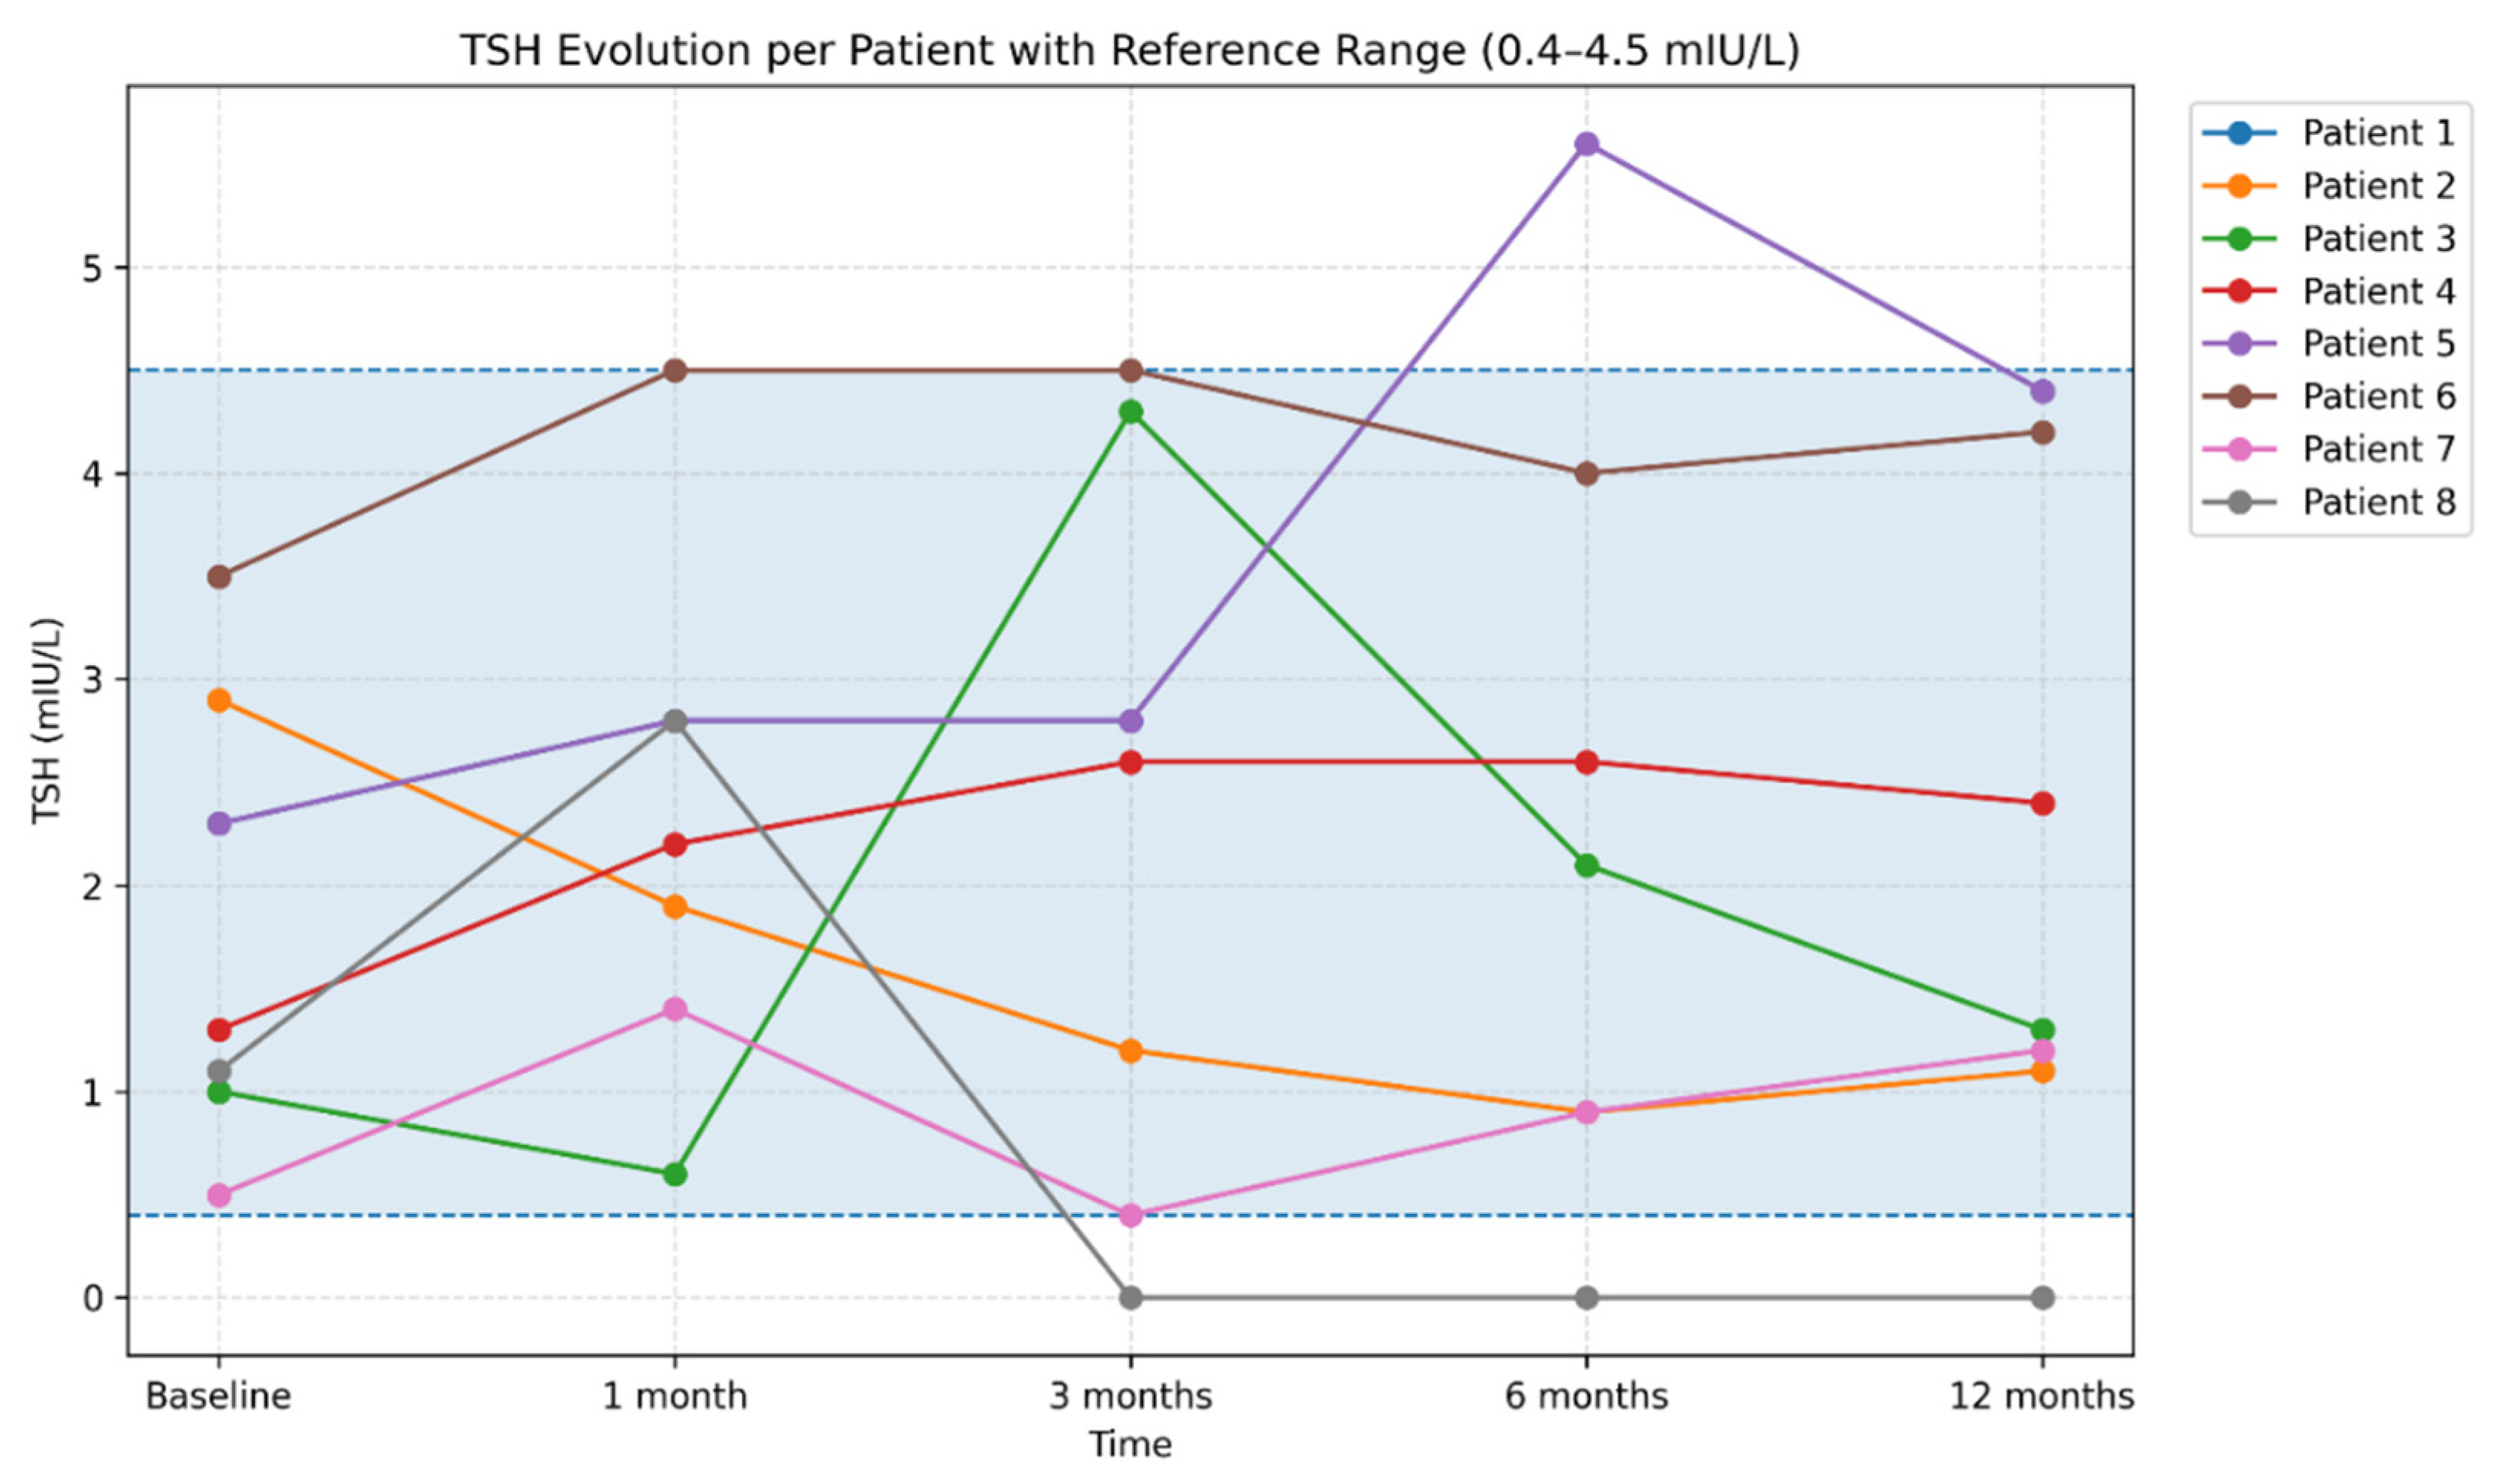
Figure 14.
Individual trajectories of TSH values over the 12-month follow-up period. Legend: Each line represents an individual patient trajectory, illustrating interindividual variability in thyroid function during the post-COVID period. Both transient TSH fluctuations and stable profiles are observed, reflecting the heterogeneity of thyroid responses following SARS-CoV-2 infection. The shaded area indicates the TSH reference range (0.4–4.5 mIU/L), facilitating the identification of transient or persistent deviations beyond normal limits. Serological analysis demonstrated a variable evolution of thyroid autoantibody titers. In a subset of patients, increases in anti-thyroid peroxidase (anti-TPO) and/or anti-thyroglobulin (anti-Tg) levels were observed during the first months, followed by a tendency toward decline at 6 and 12 months (
Figure 15 and
Figure 16). In other patients, autoantibody titers remained within normal limits or showed only mild elevations throughout follow-up.
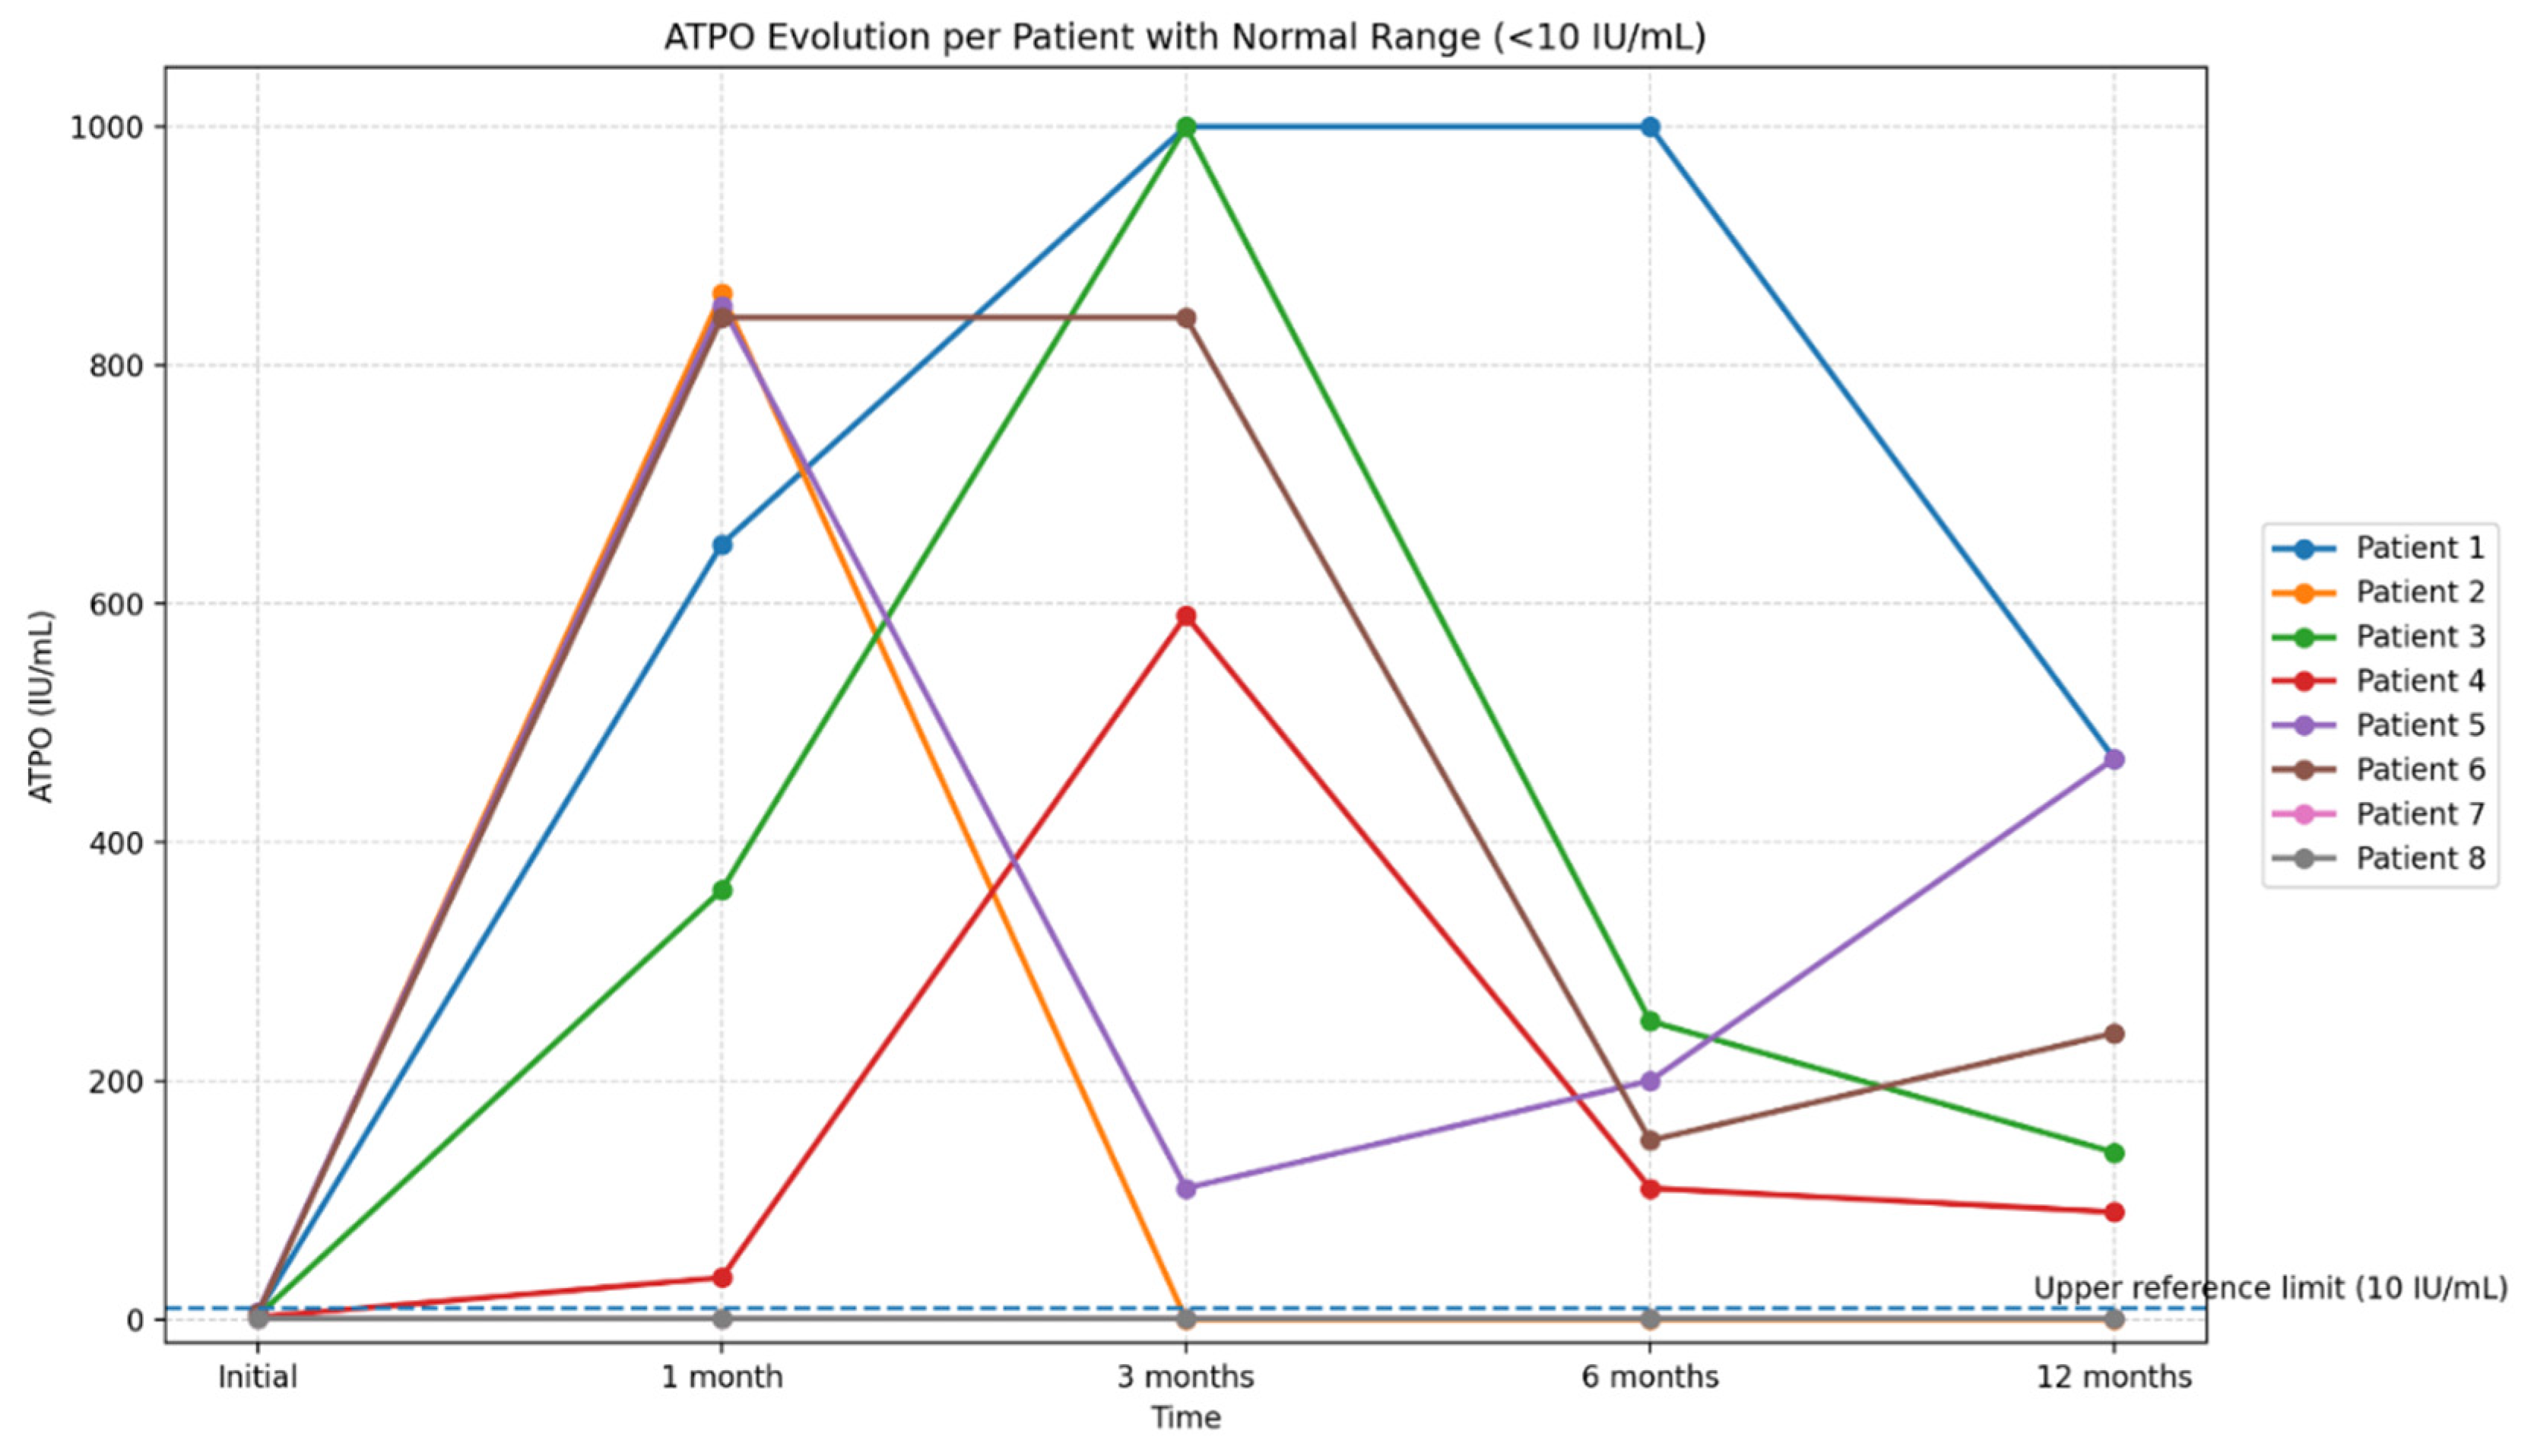
Figure 15.
Longitudinal evolution of anti–thyroid peroxidase antibody (anti-TPO) titers over the 12-month follow-up period. Legend: The figure illustrates the individual trajectories of anti-TPO levels in eight patients with serial measurements obtained at baseline, 1 month, 3 months, 6 months, and 12 months. Each line represents the longitudinal profile of a single patient, highlighting the substantial interindividual variability in autoantibody titers during the post-COVID period. The reference range for anti-TPO (<10 IU/mL) is indicated to facilitate interpretation of deviations from normal values. The graph emphasizes the presence of marked but transient increases in anti-TPO titers in a subset of patients.
Figure 16.
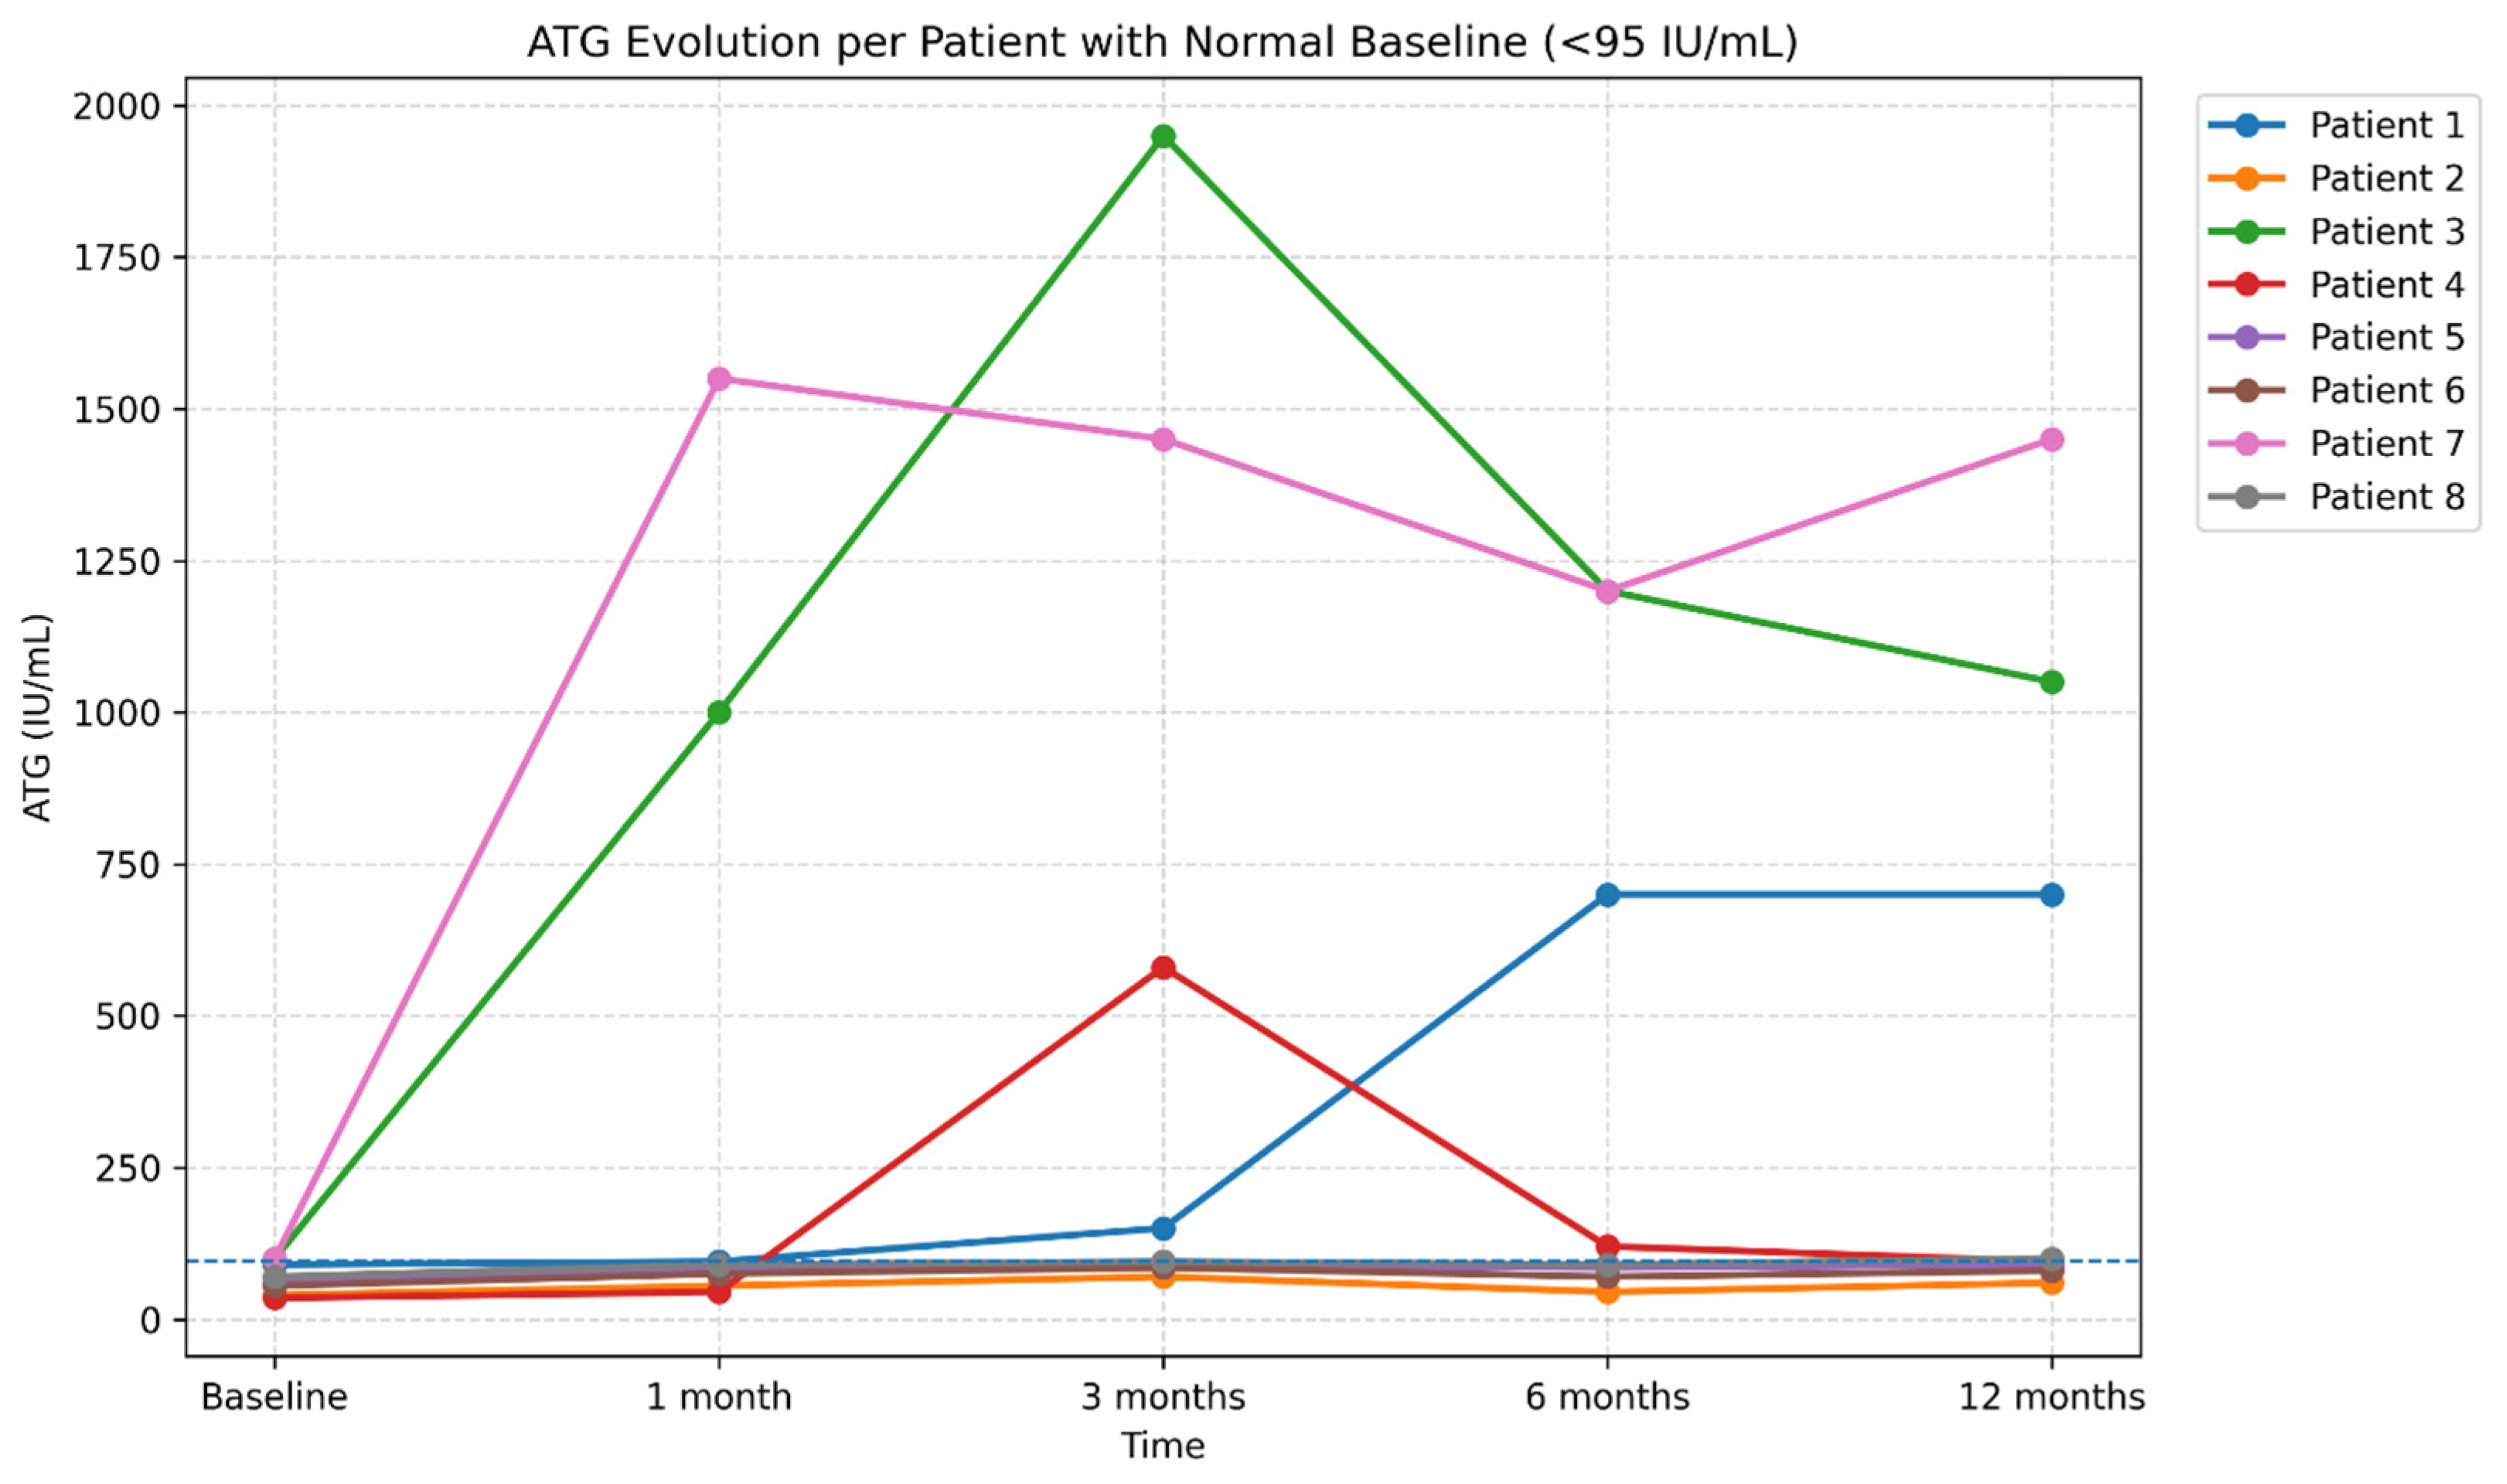
Longitudinal evolution of anti-thyroglobulin antibody (ATG) levels over 12 months of follow-up (reference range <95 IU/mL. Legend: The figure illustrates the individual trajectories of ATG levels in eight patients monitored at baseline, 1 month, 3 months, 6 months, and 12 months. Each line represents one patient, highlighting the substantial interindividual variability of the post-COVID autoimmune response. While most patients exhibited stable or only mildly elevated ATG levels, two cases showed marked increases followed by a subsequent decline, suggesting a transient post-infectious autoimmune response. The reference range (<95 IU/mL) is indicated in the title to facilitate interpretation of elevated values.
Figure 16.
Longitudinal evolution of anti-thyroglobulin antibody (ATG) levels over 12 months of follow-up (reference range <95 IU/mL. Legend: The figure illustrates the individual trajectories of ATG levels in eight patients monitored at baseline, 1 month, 3 months, 6 months, and 12 months. Each line represents one patient, highlighting the substantial interindividual variability of the post-COVID autoimmune response. While most patients exhibited stable or only mildly elevated ATG levels, two cases showed marked increases followed by a subsequent decline, suggesting a transient post-infectious autoimmune response. The reference range (<95 IU/mL) is indicated in the title to facilitate interpretation of elevated values.
Thyroid ultrasound frequently revealed a diffusely heterogeneous echotexture, variable inflammatory changes, as well as the presence of hypoechoic nodular lesions, small bilateral cysts, or nonsuspicious micronodules. In some cases, well-defined nodules with a hypoechoic halo and preserved vascular signal were described.
3.9. Analysis of the Relationship Between Anti–SARS-CoV-2 Vaccination and Thyroid Changes
In the analyzed cohort, 36 patients had a history of anti–SARS-CoV-2 vaccination, predominantly with the Pfizer-BioNTech vaccine, administered in two, three, or four doses, while a small number of patients had received the Johnson & Johnson vaccine.
Thyroid ultrasound examinations demonstrated a wide spectrum of findings, including benign lesions commonly encountered in the general population (thyroid cysts, microcysts, and nodules), features suggestive of autoimmune thyroiditis, and, in a few isolated cases, subacute thyroiditis. In a subset of patients, thyroid ultrasound findings were entirely normal.
The distribution of ultrasound abnormalities did not show clear differences according to the number of vaccine doses administered. Benign lesions were observed both in patients who had received two doses and in those who had received three or four doses, while ultrasound patterns compatible with autoimmune thyroiditis were similarly distributed across these categories. The small number of subacute thyroiditis cases precluded any meaningful epidemiological assessment of an association with vaccination.
Statistical analysis did not reveal significant associations between vaccination status and the occurrence of abnormal TSH values during the 12-month follow-up, nor with elevated titers of antithyroid antibodies (anti-TPO, anti-TG) or structural thyroid changes on follow-up ultrasound (all p > 0.05). Likewise, no significant differences were observed in inflammatory markers (CRP, ferritin, D-dimer, IL-6) according to vaccination status.
Overall, within the analyzed cohort, anti–SARS-CoV-2 vaccination was not associated with detectable structural, functional, or immunological thyroid abnormalities during the follow-up period.