
Submitted:
20 August 2026
Posted:
20 August 2026
You are already at the latest version
Abstract
Background. Long-term exposure to ambient ozone is an established cause of chronic obstructive pulmonary disease (COPD) mortality. Absolute ozone-attributable COPD deaths have risen sharply since 1990, but the separate contributions of changing ozone exposure, changing population size, and changing background COPD mortality have not been quantified.Methods. Using Global Burden of Disease Study 2023 estimates for 204 countries, we expressed ozone-attributable COPD deaths as the product of the population-attributable fraction, the background COPD death rate, and population size, and decomposed the 1990–2023 change into three exactly additive components using the Das Gupta (1993) three-factor method. We additionally estimated a counterfactual in which the population-attributable fraction remained at its 1990 value. Reconstructed totals were validated against the published GBD global estimate before analysis.Results. Global ozone-attributable COPD deaths rose from 172,584 (95% uncertainty interval 39,323–329,062) in 1990 to 468,719 (108,209–854,387) in 2023, an increase of 171.6%. The three drivers contributed almost equally: population size +113,103 deaths (38.2% of the change), exposure +93,059 (31.4%), and rising background COPD death rates +89,973 (30.4%). Country-level patterns diverged sharply from this global average: countries in which exposure was the leading driver of the increase accounted for 62.6% of the 2023 global burden, against 27.7% for population size and 8.2% for the background COPD rate. Had ozone exposure remained at 1990 levels, an estimated 326,192 deaths would have occurred in 2023, implying 142,526 deaths (30.4% of the 2023 burden) attributable to the change in exposure. South Asia accounted for 285,164 deaths in 2023, with exposure the single largest driver there (39.9%). In high-income countries and in Central and Eastern Europe the exposure component was negative, averting an estimated 7,054 and 3,865 deaths respectively.Conclusions. Rising ozone-attributable COPD mortality is not driven predominantly by demography. Exposure change accounts for 31.4% of the global increase and is the leading driver across the countries carrying 62.6% of the current burden. Precursor emission controls have measurably reduced burden where they have been applied. These results are based on all-age data and therefore cannot separate population growth from population ageing.
Keywords:
COPD mortality
; ambient ozone
; decomposition analysis
; Das Gupta method
; global burden of disease
; environmental epidemiology
1. Introduction
Long-term exposure to ambient ozone is associated with increased respiratory morbidity and mortality, particularly from chronic obstructive pulmonary disease (COPD) (Jerrett et al. 2009; Turner et al. 2016; Huangfu and Atkinson 2020). Although fine particulate matter dominates total air-pollution-attributable mortality, ozone is the only ambient pollutant for which the Global Burden of Disease (GBD) framework currently accepts a causal relationship with COPD mortality (Cohen et al. 2017).
Absolute ozone-attributable COPD deaths have risen substantially since 1990. That rise is the net product of at least three distinct processes acting simultaneously: change in ambient ozone concentrations and the resulting population-attributable fraction; change in the size of the exposed population; and change in the underlying rate at which people die of COPD from all causes combined. Because these processes can move in opposing directions, and frequently do, a rising death count is compatible with improving air quality, and a falling death count is compatible with deteriorating air quality. Descriptive trend analyses cannot distinguish these cases, yet the policy implications differ entirely.
Decomposition methods address precisely this problem, and have been applied to GBD outputs for a range of risk–outcome pairs. What has not been established for the ozone–COPD pair specifically is the relative magnitude of the three components, at country resolution, over the full 1990–2023 period covered by the GBD 2023 cycle. This study provides that estimate, together with a policy-facing counterfactual quantifying how many 2023 deaths are attributable to the change in exposure since 1990.
We deliberately restrict our claims to what the available data can support. As set out in Section 2.6, the analysis uses all-age estimates and therefore identifies the effect of population size but not of population age structure; we do not attribute any part of the change to population ageing.
2. Methods
2.1. Data
We used GBD 2023 estimates of deaths attributable to ambient ozone pollution for COPD, for 204 countries and territories, for 1990 and 2023 (Global Burden of Disease Collaborative Network 2025). Three further extracts were used: total COPD deaths from all causes combined, for the same countries and years; total population, for the same countries and years; and the published GBD global aggregate, used for validation. All extracts were obtained from the GBD Results tool for sex = both and age = all ages, metric = number, with rates and percentages retained for descriptive use.
In GBD 2023, population-weighted warm-season daily maximum 8-hour ozone concentrations are estimated at approximately 10 km resolution by fusing ground monitoring, satellite retrievals, chemical transport model output and land-use predictors; attributable burden is computed from a log-linear exposure–response function above a theoretical minimum-risk exposure level of 29.1–35.7 ppb, with a relative risk of approximately 1.06 (95% uncertainty interval 1.03–1.10) per 10 ppb (GBD 2021 Risk Factors Collaborators 2024).
2.2. Decomposition Framework
For each country, ozone-attributable COPD deaths D were expressed as
D = PAF × R × N
where PAF is the population-attributable fraction (attributable COPD deaths divided by total COPD deaths), R is the crude background COPD death rate (total COPD deaths divided by population), and N is population. The identity is exact by construction.
The change in D between 1990 (subscript 0) and 2023 (subscript 1) was decomposed into three additive components using the Das Gupta (1993) three-factor standardisation. For the PAF component,
Δ_PAF = (PAF₁ − PAF₀) × [ (R₀N₀ + R₁N₁)/3 + (R₁N₀ + R₀N₁)/6 ]
with the components for R and N defined symmetrically. Interaction terms are distributed across components by the 1/3 and 1/6 weights, and the three components sum exactly to D₁ − D₀. We verified this numerically: the maximum absolute per-country residual was 2.9e-11 deaths, and component percentages sum to exactly 100% for every country. We note that the more familiar approximation using simple arithmetic means of the other two factors is not additive for a three-factor product and leaves a residual totalling 5,952 deaths; it was not used here.
We refer to the three components as the exposure effect (change in PAF), the population-size effect (change in N), and the background-rate effect (change in R). We avoid the term “demographic effect” because, for reasons given in Section 2.6, the population term here captures size only.
For the country classification in Figure 1, the leading driver in a country whose burden rose is defined as the component with the largest positive contribution. Using the largest absolute contribution would misclassify countries such as the United States, where the exposure term is large but negative — that is, where exposure reduced burden.
2.3. Counterfactual
To express the exposure component in a form directly usable by policy audiences, we computed the number of deaths that would have occurred in 2023 had the population-attributable fraction remained at its 1990 value while population and background COPD rates followed their observed paths:
D₁ᶜᶠ = PAF₀× R₁× N₁
The difference D₁ − D₁ᶜᶠ is the excess (or, where negative, the averted) 2023 mortality attributable to the change in ozone exposure since 1990. For mapping, this difference is expressed as a share of each country’s own burden, divided by max(D₁, D₁ᶜᶠ) so that the measure is bounded to ±100% and countries with very small burdens cannot generate extreme values.
2.4. Aggregation
Countries were assigned to the seven GBD super-regions and to World Bank income groups (World Bank 2024) using a lookup keyed on the exact GBD location names, so that all 204 countries are classified and none is pooled into a residual category. Two territories not classified by the World Bank (Niue, Tokelau; combined 2023 burden below 0.1 deaths) are reported separately and do not affect any income-group total. Aggregate components were obtained by summing country-level components, which is valid because the decomposition is additive.
2.5. Validation
Before any analysis, the sum of the country-level attributable death estimates was compared with the GBD-published global figure. The reconstructed 2023 total (468,719) agrees with the published global value (468,806) to within 0.02%. We recommend this check be reported routinely in GBD secondary analyses; the two quantities should agree to rounding, and a discrepancy indicates an extraction error.
2.6. Limitations of the Available Data, and Their Consequences
All extracts used here are for age = all ages. Two consequences follow, and we state them explicitly because they bound what the analysis can claim.
First, the population term identifies the effect of population size only. No age-structure component is identifiable, and we therefore make no claim about the contribution of population ageing. Second, because R is the crude COPD death rate, the background-rate component absorbs any change attributable to shifts in age structure. The background-rate component should therefore be read as “change in the crude rate at which the population dies of COPD”, which combines genuine epidemiological change with population ageing, and not as a measure of clinical progress in COPD prevention or treatment. Separating these would require re-estimation using age-specific data and a four-factor decomposition; we identify this as the principal extension of this work.
For the same reason, all rates reported here are crude rates. Age-standardised rates are not used and are not implied anywhere in this paper.
2.7. Sensitivity
We repeated the decomposition at the lower and upper bounds of the reported uncertainty intervals for attributable deaths. This is a bounding exercise, not a valid propagation of uncertainty: it assumes the bounds are perfectly correlated across all countries and both years, which they are not. Proper propagation requires the posterior draws underlying the GBD estimates, which are not available in the public results extracts. We report the bounding results in full, including where they are uninformative.
2.8. Software and Reproducibility
Analyses were conducted in Python 3.11 using pandas (McKinney 2010), NumPy (Harris et al. 2020) and GeoPandas (Jordahl et al. 2020). The full pipeline is distributed as three Jupyter notebooks — analysis, figures, and manuscript assembly — in which every value quoted in this text is injected programmatically from the analysis output rather than transcribed, so that the manuscript cannot diverge from the results. The pipeline asserts at run time that the reconstructed global total reconciles with the published GBD figure, that the decomposition residual is zero, and that every country is classified. Code, the country-classification lookup, and all derived tables are available at https://github.com/Azad77/OzoneCOPD-ASMR.
3. Results
3.1. Global Burden, 1990 and 2023
Global ozone-attributable COPD deaths increased from 172,584 (95% uncertainty interval 39,323–329,062) in 1990 to 468,719 (108,209–854,387) in 2023, a rise of 296,135 deaths or 171.6%. The corresponding crude attributable death rate rose from 3.24 to 5.82 per 100,000 population. Attributable disability-adjusted life-years in 2023 were 8,456,770 (1,927,721–15,282,264).
India carried by far the largest absolute burden in 2023, followed by China and Bangladesh (Table 1); the global distribution of crude attributable death rates is mapped in Supplementary Figure S1. The uncertainty intervals are wide — India’s spans 56,880 to 406,737 deaths — reflecting uncertainty in the cohort-derived relative risk rather than in the underlying mortality or exposure estimates.
3.2. Decomposition of the 1990–2023 Change
Globally, the three components contributed almost equally to the increase. The population-size effect accounted for +113,103 deaths (38.2% of the total change), the exposure effect for +93,059 (31.4%), and the background-rate effect for +89,973 (30.4%). No single mechanism dominates: the largest and smallest components differ by fewer than 8 percentage points.
That near-equal global split, however, conceals a strongly structured geography (Figure 1). Exposure was the leading driver of the increase in 62 countries, and those countries accounted for 62.6% of the 2023 global burden. Population size led in 57 countries carrying 27.7% of the burden, and the background COPD rate led in 41 countries carrying 8.2%. Burden fell outright in the remaining 44 countries, which hold 1.5% of the 2023 total. Weighting by where people actually die, therefore, exposure — not demography — is the leading driver of the global increase.
Country-level component shares are given in Table 2 and Figure 2. In India, which alone accounts for 64% of the global increase, the exposure effect is the largest single component at 39.2%. The same is true of Bangladesh (49.2%), Indonesia (64.6%), Thailand (75.7%) and Spain (74.1%). In China the exposure effect is negative (-9.4%), consistent with precursor controls implemented since 2013 (Zhang et al. 2019), with the net increase driven by population size and the rising crude background COPD rate.
For countries whose net change is small relative to the individual components — the United States is the clearest example — the percentage decomposition is arithmetically valid but not interpretable, because a near-zero denominator inflates all three shares. For these countries we report absolute contributions and suppress percentages in interpretation.
3.3. Regional and Income-Group Patterns
South Asia dominates the global picture, with attributable deaths rising from 56,302 to 285,164 (+406.5%). Critically, exposure is the largest single driver in that region (39.9%), ahead of population size (33.7%) and background rate (26.4%). The narrative that South Asian burden growth is primarily demographic is not supported by these estimates.
Two regions show negative exposure components. In the high-income super-region the exposure effect was -22.9% of a comparatively small net change, and in Central Europe, Eastern Europe and Central Asia it was 73.2% of a net change that was itself negative — that is, falling exposure was the main reason burden fell by 54.4% in that region. Sub-Saharan Africa shows the reverse composition, with population size (70.5%) and exposure (46.2%) both raising burden while the background rate component reduced it (-16.7%).
Figure 3.
Contribution of each component to the change in ozone-attributable COPD deaths, 1990–2023, by GBD super-region (A) and World Bank income group (B). Bars extending left of zero indicate components that reduced burden.
Figure 3.
Contribution of each component to the change in ozone-attributable COPD deaths, 1990–2023, by GBD super-region (A) and World Bank income group (B). Bars extending left of zero indicate components that reduced burden.
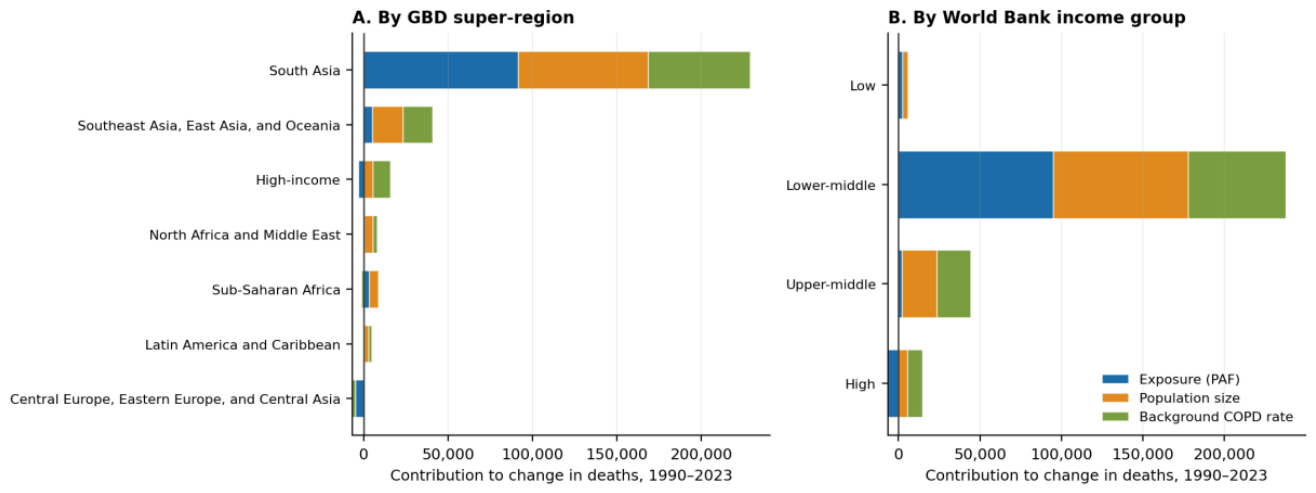

Table 3.
Decomposition by World Bank income group, 1990–2023.
| Income group | Deaths 1990 | Deaths 2023 | Change % | Exposure % | Population size % | Background rate % |
| Low-income | 2,389 | 8,644 | 261.8 | 40.8 | 54.1 | 5.1 |
| Lower-middle income | 63,691 | 301,412 | 373.2 | 39.9 | 35.0 | 25.2 |
| Upper-middle income | 75,551 | 119,668 | 58.4 | 5.0 | 48.3 | 46.8 |
| High-income | 30,952 | 38,994 | 26.0 | -80.5 | 66.4 | 114.1 |
Table 4.
Decomposition by GBD super-region, 1990–2023.
| Super-region | Deaths 1990 | Deaths 2023 | Change % | Exposure % | Population size % | Background rate % |
| South Asia | 56,302 | 285,164 | 406.5 | 39.9 | 33.7 | 26.4 |
| Southeast Asia, East Asia, and Oceania | 69,538 | 110,301 | 58.6 | 12.3 | 44.5 | 43.2 |
| High-income | 22,703 | 35,595 | 56.8 | -22.9 | 42.6 | 80.3 |
| North Africa and Middle East | 5,243 | 13,062 | 149.1 | 7.4 | 61.8 | 30.7 |
| Sub-Saharan Africa | 2,741 | 10,245 | 273.8 | 46.2 | 70.5 | -16.7 |
| Latin America and Caribbean | 3,920 | 8,818 | 125.0 | 8.3 | 49.2 | 42.5 |
| Central Europe, Eastern Europe, and Central Asia | 12,138 | 5,534 | -54.4 | 73.2 | 2.2 | 24.6 |
3.4. Counterfactual: Deaths Attributable to the Change in Exposure
Had the population-attributable fraction remained at its 1990 value in every country, an estimated 326,192 ozone-attributable COPD deaths would have occurred in 2023 rather than the estimated 468,719. The difference — 142,526 deaths, or 30.4% of the 2023 burden — is attributable to the change in ozone exposure since 1990.
Expressed as a share of each country’s own burden, the counterfactual separates the world cleanly (Figure 4). Across South and Southeast Asia, West and East Africa, and much of South America, more than half of the current burden is attributable to exposure deterioration since 1990. Across the former Soviet states, Eastern Europe, North America and Mexico the sign reverses: exposure improvement has removed a substantial share of the burden those countries would otherwise carry.
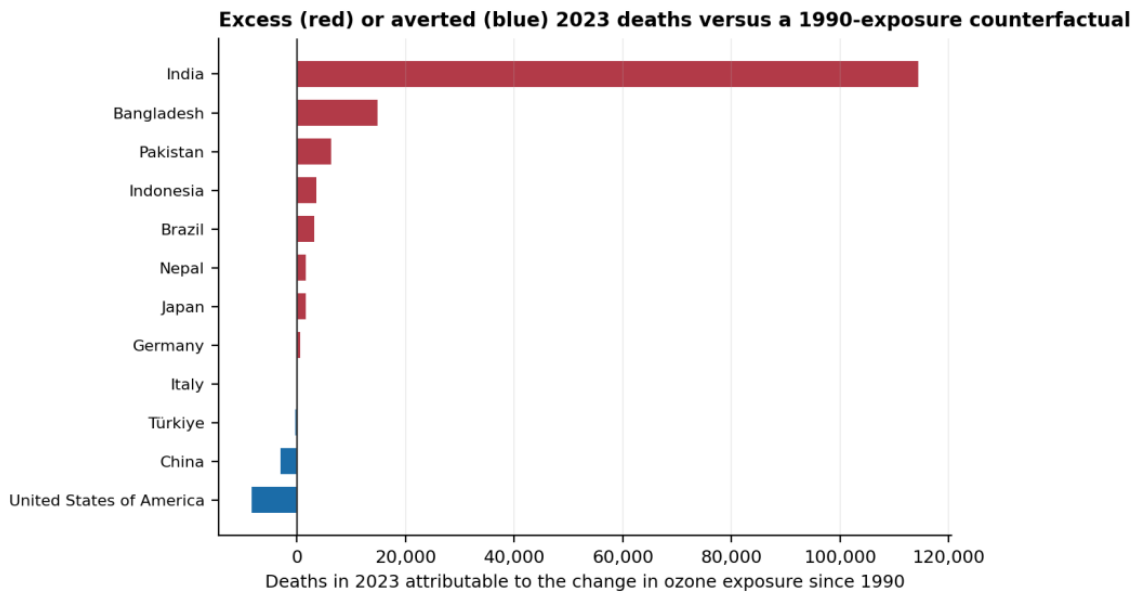
In absolute terms the total conceals large offsetting movements (Table 5). India alone accounts for 114,399 excess deaths under this counterfactual, with Bangladesh contributing a further 14,821. In the opposite direction, the United States averted an estimated 8,278 deaths in 2023 relative to its 1990 exposure level, China 3,060, Mexico 2,694 and the Russian Federation 1,717. Aggregated, high-income countries averted 7,054 deaths and Central and Eastern Europe a further 3,865.
Figure 5.
Excess (red) or averted (blue) 2023 ozone-attributable COPD deaths relative to a counterfactual holding the population-attributable fraction at its 1990 value, twelve highest-burden countries.
Figure 5.
Excess (red) or averted (blue) 2023 ozone-attributable COPD deaths relative to a counterfactual holding the population-attributable fraction at its 1990 value, twelve highest-burden countries.
3.5. Sensitivity
Repeating the decomposition at the bounds of the reported uncertainty intervals produces results that differ not only in magnitude but in sign (Table 6). At the lower bound the net global change is negative (-220,854 deaths) and the exposure component is strongly negative; at the upper bound the net change is +815,064 with the exposure component accounting for 69.1%. We report this openly: the bounding exercise does not confirm the robustness of the central decomposition, and any claim that it does would be unwarranted. The central estimates should be read as conditional on the GBD central exposure–response function, and the wide intervals reflect genuine uncertainty in that function rather than instability in the decomposition method itself, which is exact.
4. Discussion
This analysis separates the drivers of rising ozone-attributable COPD mortality into three exactly additive components across 204 countries over 33 years. Globally the three components are close to equal — population size, exposure and the background COPD death rate contribute 38.2%, 31.4% and 30.4% respectively — but that global average is not the operative finding. Weighted by where the burden actually falls, exposure is the leading driver in countries holding 62.6% of the 2023 global total.
The most consequential regional finding concerns South Asia, which accounts for 61% of the 2023 global burden. There, exposure is the largest single driver of the increase. This runs against a common framing in which burden growth in low- and middle-income countries is treated as principally demographic, with air quality a secondary concern. On these estimates, rising ozone exposure in South Asia has contributed more to the increase in attributable deaths than population growth has. The counterfactual makes the same point in absolute terms: 114,399 deaths in India in 2023 are attributable to the deterioration in exposure since 1990.
The converse finding is equally policy-relevant. In high-income countries and across Central and Eastern Europe, the exposure component is negative — falling ozone exposure has reduced attributable mortality, offsetting some or all of the upward pressure from population and background disease trends. In Central and Eastern Europe this was sufficient to produce an outright 54.4% decline in attributable deaths. This is consistent with the documented effects of precursor emission controls in road transport, power generation and industry (Markandya et al. 2018; European Environment Agency 2023), and with the effects of China’s post-2013 air quality programme (Zhang et al. 2019), whose negative exposure component is visible here despite a net increase in Chinese attributable deaths.
Taken together these results support a straightforward policy reading: ozone precursor control demonstrably reduces COPD mortality burden where it is implemented, and the absence of such control is a leading — not a secondary — driver of the burden increase in the regions where burden is concentrated.
Limitations
Several limitations bound these conclusions. First and most importantly, the analysis uses all-age estimates and therefore cannot separate population growth from population ageing; the population term identifies size only, and the background-rate term necessarily absorbs the ageing signal. We have been careful not to attribute any part of the change to ageing, and readers should not infer such a decomposition from these results. Re-estimation using five-year age groups would resolve this and is the principal extension we propose.
Second, all rates reported are crude. Age-standardised rates are not derivable from the extracts used and are not reported.
Third, the uncertainty bounding in Section 3.5 is not a valid propagation of uncertainty, and does not establish robustness. Reliable intervals on the decomposition components require the GBD posterior draws.
Fourth, the GBD framework accepts COPD as the only outcome causally linked to long-term ozone exposure. Associations with cardiovascular and all-cause mortality reported elsewhere (Kazemiparkouhi et al. 2020; Wang et al. 2025) are therefore excluded, and the total ozone-attributable burden is likely underestimated.
Fifth, the exposure–response function is assumed uniform across regions and does not account for differences in co-pollutant environment or photochemical regime (Cohen et al. 2017; World Health Organization 2021). Sixth, the decomposition treats the three factors as independent, whereas urbanisation influences both population distribution and precursor emissions. Finally, the wide uncertainty intervals reflect the extrapolation of cohort evidence from North American and European populations (Turner et al. 2016; Lim et al. 2019; Hu and Yang 2024) to high-exposure settings where no comparable cohorts exist.
5. Conclusions
Global ozone-attributable COPD deaths rose 171.6% between 1990 and 2023, and the increase was driven in roughly equal thirds by growth in population size, deterioration in ozone exposure, and rising crude background COPD death rates. Weighted by burden, however, exposure is the leading driver: countries in which it dominates carry 62.6% of the 2023 global total. Exposure change accounts for 142,526 deaths in 2023 — 30.4% of that year’s burden — and is the largest single driver in South Asia, where the burden is concentrated. Where precursor controls have been implemented, in high-income countries, Central and Eastern Europe and China, the exposure component is negative and measurable.
The policy implication is that ozone precursor control should be treated as a first-order intervention for COPD mortality in South Asia, not as a long-term complement to health system strengthening. Establishing how much of the remaining burden growth is attributable to population ageing as distinct from population growth requires age-stratified re-estimation, which we identify as the necessary next step.
Supplementary Materials
The following supporting information can be downloaded at the website of this paper posted on Preprints.org.
Funding
No external funding was received for this study.
Institutional Review Board Statement
This study used publicly available, aggregated, de-identified estimates from the Global Burden of Disease Study 2023. No primary data collection involving human participants was undertaken. Ethics approval and informed consent were not required.
Informed Consent Statement
Not applicable.
Data Availability Statement
GBD 2023 estimates are publicly available from the IHME Global Health Data Exchange (https://ghdx.healthdata.org). The complete analysis pipeline — three Jupyter notebooks, the country-classification lookup, all derived tables and all figure source code — is available at https://github.com/Azad77/OzoneCOPD-ASMR.
Acknowledgments
The author thanks the Institute for Health Metrics and Evaluation and the GBD 2023 collaborators for producing and making available the estimates underpinning this analysis. Responsibility for the interpretation presented here rests solely with the author.
Conflicts of Interest
The author declares no competing interests.
References
- Cohen, AJ; Brauer, M; Burnett, R; et al. Estimates and 25-year trends of the global burden of disease attributable to ambient air pollution: an analysis of data from the Global Burden of Diseases Study 2015. Lancet 2017, 389, 1907–1918. [Google Scholar] [CrossRef] [PubMed]
- Das Gupta, P. Standardization and decomposition of rates: a user’s manual. In US Bureau of the Census, Current Population Reports Series P23-186; US Government Printing Office: Washington DC, 1993. [Google Scholar]
- European Environment Agency. Europe’s air quality status 2023; Publications Office of the European Union: Luxembourg, 2023. [Google Scholar] [CrossRef]
- GBD 2021 Risk Factors Collaborators (2024) Global burden and strength of evidence for 88 risk factors in 204 countries and 811 subnational locations, 1990–2021: a systematic analysis for the Global Burden of Disease Study 2021. Lancet 403, 2162–2203. [CrossRef] [PubMed]
- Global Burden of Disease Collaborative Network (2025) Global Burden of Disease Study 2023 (GBD 2023) Results; Institute for Health Metrics and Evaluation: Seattle; Available online: https://vizhub.healthdata.org/gbd-results/.
- Harris, CR; Millman, KJ; van der Walt, SJ; et al. Array programming with NumPy. Nature 2020, 585, 357–362. [Google Scholar] [CrossRef] [PubMed]
- Hu, W; Yang, J. Effect of ambient ozone pollution on disease burden globally: a systematic analysis for the Global Burden of Disease Study 2019. Sci Total Environ 2024, 926, 171739. [Google Scholar] [CrossRef] [PubMed]
- Huangfu, P; Atkinson, R. Long-term exposure to NO2 and O3 and all-cause and respiratory mortality: a systematic review and meta-analysis. Environ Int 2020, 144, 105998. [Google Scholar] [CrossRef] [PubMed]
- Jerrett, M; Burnett, RT; Pope, CA; et al. Long-term ozone exposure and mortality. N Engl J Med 2009, 360, 1085–1095. [Google Scholar] [CrossRef] [PubMed]
- Jordahl, K; Van den Bossche, J; Fleischmann, M; et al. geopandas/geopandas: v0.8.1; Zenodo, 2020. [Google Scholar] [CrossRef]
- Kazemiparkouhi, F; Eum, K-D; Wang, B; Manjourides, J; Suh, HH. Long-term ozone exposures and cause-specific mortality in a US Medicare cohort. J Expo Sci Environ Epidemiol 2020, 30, 650–658. [Google Scholar] [CrossRef] [PubMed]
- Lim, CC; Hayes, RB; Ahn, J; et al. Long-term exposure to ozone and cause-specific mortality risk in the United States. Am J Respir Crit Care Med 2019, 200, 1022–1031. [Google Scholar] [CrossRef] [PubMed]
- Markandya, A; Sampedro, J; Smith, SJ; et al. Health co-benefits from air pollution and mitigation costs of the Paris Agreement: a modelling study. Lancet Planet Health 2018, 2, e126–e133. [Google Scholar] [CrossRef] [PubMed]
- McKinney, W. Data structures for statistical computing in Python. Proc 9th Python Sci Conf, Austin; 2010; pp. 56–61. [Google Scholar]
- Turner, MC; Jerrett, M; Pope, CA; et al. Long-term ozone exposure and mortality in a large prospective study. Am J Respir Crit Care Med 2016, 193, 1134–1142. [Google Scholar] [CrossRef] [PubMed]
- Wang, Y; Yang, Y; Yuan, Q; et al. Substantially underestimated global health risks of current ozone pollution. Nat Commun 2025, 16, 102. [Google Scholar] [CrossRef] [PubMed]
- World Bank. World Bank country and lending groups: country classification by income; World Bank: Washington DC, 2024. [Google Scholar]
- World Health Organization. WHO global air quality guidelines: particulate matter (PM2.5 and PM10), ozone, nitrogen dioxide, sulfur dioxide and carbon monoxide; WHO: Geneva, 2021. [Google Scholar]
- Zhang, Q; Zheng, Y; Tong, D; et al. Drivers of improved PM2.5 air quality in China from 2013 to 2017. Proc Natl Acad Sci USA 2019, 116, 24463–24469. [Google Scholar] [CrossRef] [PubMed]
Figure 1.
Leading driver of the increase in ozone-attributable COPD deaths, 1990–2023, by country. For countries whose burden rose, the leading driver is the component making the largest positive contribution; countries whose burden fell are shown separately. Percentages in the legend give each class’s share of the 2023 global burden.
Figure 1.
Leading driver of the increase in ozone-attributable COPD deaths, 1990–2023, by country. For countries whose burden rose, the leading driver is the component making the largest positive contribution; countries whose burden fell are shown separately. Percentages in the legend give each class’s share of the 2023 global burden.
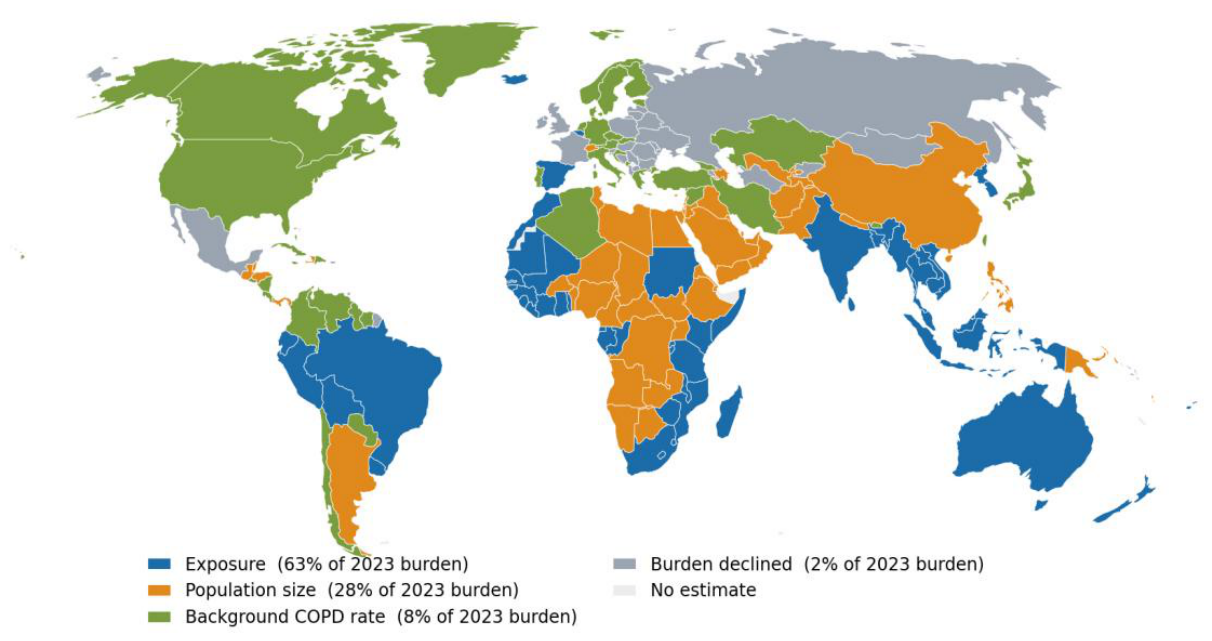
Figure 2.
Decomposition for the fifteen countries with the highest 2023 ozone-attributable COPD burden.
Figure 2.
Decomposition for the fifteen countries with the highest 2023 ozone-attributable COPD burden.
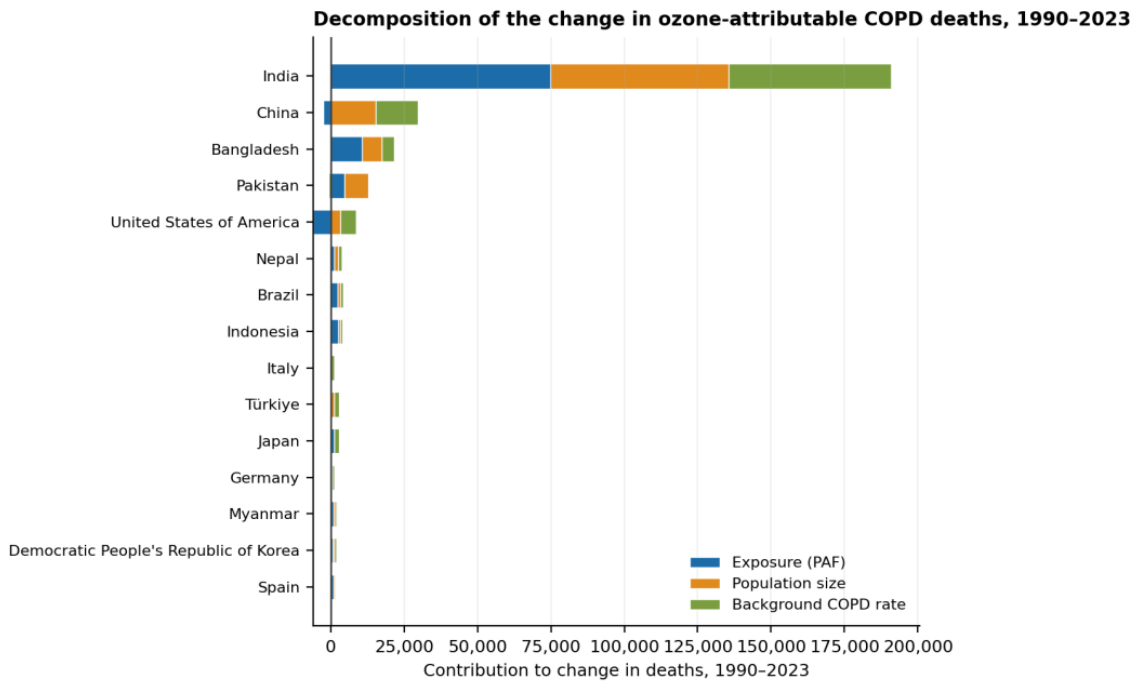
Figure 4.
Share of each country’s 2023 ozone-attributable COPD burden attributable to the change in ozone exposure since 1990. Red indicates excess burden from deteriorating exposure; blue indicates burden averted by improving exposure. Bounded to ±100% (Section 2.3).
Figure 4.
Share of each country’s 2023 ozone-attributable COPD burden attributable to the change in ozone exposure since 1990. Red indicates excess burden from deteriorating exposure; blue indicates burden averted by improving exposure. Bounded to ±100% (Section 2.3).
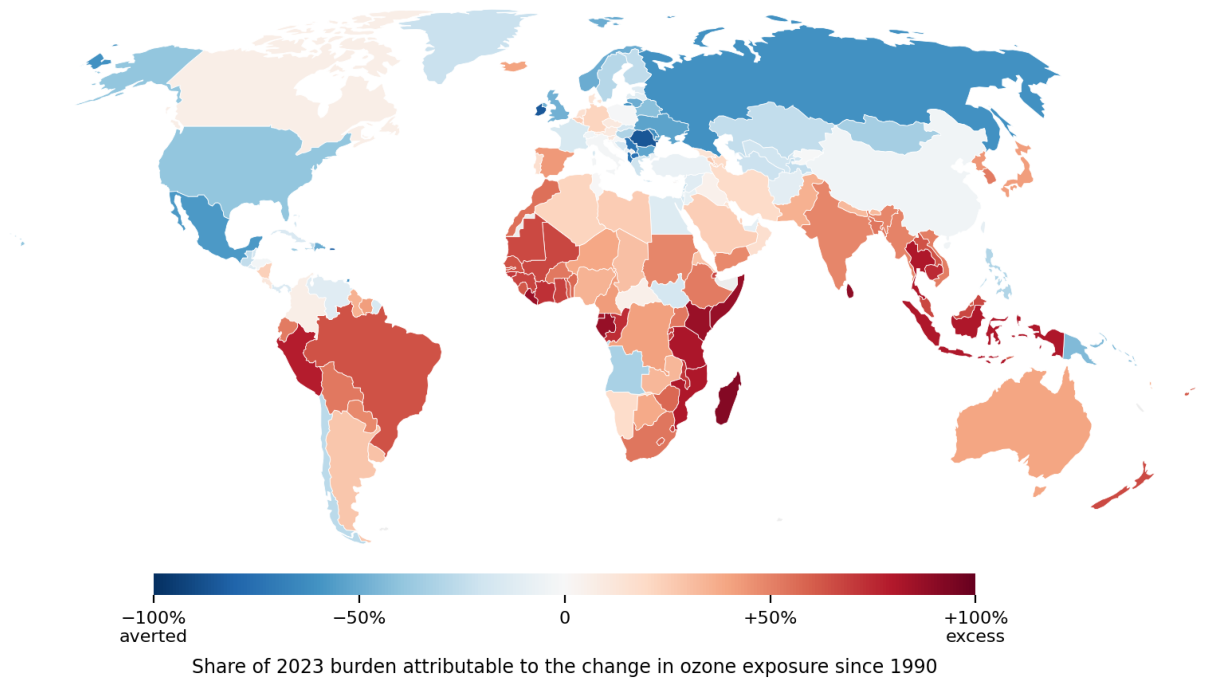
Table 1.
Ten countries with the highest number of ozone-attributable COPD deaths, 2023. Rates are crude rates for all ages, not age-standardised.
Table 1.
Ten countries with the highest number of ozone-attributable COPD deaths, 2023. Rates are crude rates for all ages, not age-standardised.
| Rank | Country | Deaths 2023 | 95% uncertainty interval | Crude rate per 100,000 |
| 1 | India | 233,970 | 56,880–406,737 | 16.2 |
| 2 | China | 93,729 | 21,890–179,713 | 6.6 |
| 3 | Bangladesh | 27,802 | 5,429–52,263 | 16.0 |
| 4 | Pakistan | 17,976 | 4,046–34,995 | 7.4 |
| 5 | United States of America | 12,843 | 3,131–23,100 | 3.8 |
| 6 | Nepal | 5,316 | 1,103–9,658 | 17.1 |
| 7 | Brazil | 5,039 | 1,180–9,151 | 2.4 |
| 8 | Indonesia | 4,389 | 1,041–8,513 | 1.5 |
| 9 | Italy | 4,296 | 1,016–7,711 | 7.3 |
| 10 | Türkiye | 4,296 | 914–8,145 | 5.0 |
Table 2.
Das Gupta decomposition of the change in ozone-attributable COPD deaths, 1990–2023, fifteen countries with the highest 2023 burden. Component percentages sum to 100% by construction.
Table 2.
Das Gupta decomposition of the change in ozone-attributable COPD deaths, 1990–2023, fifteen countries with the highest 2023 burden. Component percentages sum to 100% by construction.
| Country | Deaths 1990 | Deaths 2023 | Net change | Exposure % | Population size % | Background rate % |
| India | 43,182 | 233,970 | 190,788 | 39.2 | 31.8 | 29.0 |
| China | 66,508 | 93,729 | 27,221 | -9.4 | 56.4 | 53.0 |
| Bangladesh | 6,106 | 27,802 | 21,696 | 49.2 | 31.2 | 19.7 |
| Pakistan | 5,549 | 17,976 | 12,427 | 37.8 | 66.1 | -3.9 |
| United States of America | 10,107 | 12,843 | 2,736 | -219.2 | 120.6 | 198.6 |
| Nepal | 1,441 | 5,316 | 3,875 | 30.1 | 35.7 | 34.1 |
| Brazil | 884 | 5,039 | 4,156 | 56.5 | 21.2 | 22.3 |
| Indonesia | 396 | 4,389 | 3,993 | 64.6 | 20.8 | 14.6 |
| Italy | 3,160 | 4,296 | 1,136 | -5.5 | 11.8 | 93.7 |
| Türkiye | 1,719 | 4,296 | 2,577 | -7.4 | 44.3 | 63.1 |
| Japan | 1,037 | 3,831 | 2,794 | 42.1 | 0.6 | 57.3 |
| Germany | 1,576 | 2,940 | 1,364 | 40.1 | 8.7 | 51.3 |
| Myanmar | 835 | 2,913 | 2,078 | 53.4 | 28.5 | 18.0 |
| Democratic People’s Republic of Korea | 690 | 2,685 | 1,995 | 42.1 | 17.8 | 40.0 |
| Spain | 1,196 | 2,584 | 1,389 | 74.1 | 27.2 | -1.4 |
Table 5.
Counterfactual 2023 deaths under 1990 ozone exposure: five countries with the largest excess and five with the largest averted burden.
Table 5.
Counterfactual 2023 deaths under 1990 ozone exposure: five countries with the largest excess and five with the largest averted burden.
| Country | Observed 2023 | Counterfactual 2023 | Excess (+) or averted (−) |
| India | 233,970 | 119,571 | +114,399 |
| Bangladesh | 27,802 | 12,981 | +14,821 |
| Pakistan | 17,976 | 11,643 | +6,333 |
| Indonesia | 4,389 | 828 | +3,562 |
| Brazil | 5,039 | 1,816 | +3,224 |
| United States of America | 12,843 | 21,121 | -8,278 |
| China | 93,729 | 96,789 | -3,060 |
| Mexico | 1,989 | 4,683 | -2,694 |
| Russian Federation | 1,135 | 2,852 | -1,717 |
| Romania | 98 | 674 | -575 |
Table 6.
Decomposition evaluated at the central estimate and at the bounds of the reported uncertainty intervals. Absolute contributions in deaths.
Table 6.
Decomposition evaluated at the central estimate and at the bounds of the reported uncertainty intervals. Absolute contributions in deaths.
| Scenario | Net change | Exposure | Population size | Background rate |
| central | 296,135 | 93,059 | 113,103 | 89,973 |
| lower bound | -220,854 | -389,777 | 94,700 | 74,223 |
| upper bound | 815,064 | 563,359 | 140,199 | 111,506 |
Disclaimer/Publisher’s Note: The statements, opinions and data contained in all publications are solely those of the individual author(s) and contributor(s) and not of MDPI and/or the editor(s). MDPI and/or the editor(s) disclaim responsibility for any injury to people or property resulting from any ideas, methods, instructions or products referred to in the content. |
© 2026 by the author. Licensee MDPI, Basel, Switzerland. This article is an open access article distributed under the terms and conditions of the Creative Commons Attribution (CC BY) license.
Copyright: This open access article is published under a Creative Commons CC BY 4.0 license, which permit the free download, distribution, and reuse, provided that the author and preprint are cited in any reuse.