
Submitted:
27 December 2025
Posted:
29 December 2025
You are already at the latest version
Abstract
This research evaluates how energy consumption per capita (ENUS) is affected by Environmental, Social, and Governance (ESG) factors, with particular focus on the Environmental pillar and its relationships with energy systems. The key research question is whether and how indicators related to ESG provide additional explanatory power for capturing variations in ENUS across countries and time, and whether machine learning techniques offer novel ways to address this problem beyond traditional panel econometric models. To this end, this research aims to combine panel econometric models and machine learning procedures, using a large dataset from the World Bank that provides internationally comparable data for approximately 161 countries during the period 2004-2023. From a methodological standpoint, this research will consist of three key steps. In a First Step, a sequence of fixed-effect, random-effect, and weighted least-squares models will be applied, with a specific focus on identifying how a large set of ESG-related variables relate to ENUS in a structural equation, controlling for country-specific unobserved heterogeneity. As a second step, this research will explore a sequence of clustering procedures, with a specific interest in identifying a number of regimes across which countries systematically co-pattern energy use with emissions, climate, and natural resources in a shared, multidimensional setting. In a third and final step, this research will evaluate a set of machine learning techniques through a sequence of assessments, with a specific focus on the K-Nearest Neighbor algorithm. It will identify that this technique is one of the most accurate models across a set of normalized criteria, such as accuracy and fit parameters. Model explanation will be improved through dropout loss and additive explanations, consistently assessing individual ESG variable weights in describing energy use. The analysis provides novel evidence that a strong and complex multideterminant pattern defines the relationships between ESG factors and energy use, with a strong influence from environmentally driven indicators, emissions intensity, energy efficiency, and natural resource usage, and with a complex interplay between social and governance pillar variables in driving energy consumption through development, institution, and structure variables.
Keywords:
energy use per capita
; ESG framework
; environmental sustainability
; machine learning
; panel data
1. Introduction
Energy use per capita (ENUS) is a key starting point for research into sustainable development, climate change, and economic transformation. In this respect, it captures both productive potential and technological change, as well as living standards and access to modern services, while also serving as a key mechanism through which human activity exerts pressure on the environment. Inasmuch as energy use drives greenhouse gas emissions, air pollution, natural resource use, and climate change, ENUS is clearly at the fulcrum of the sustainability challenge. However, a lack of energy use is directly associated with poverty, limited access to health and education services, and missed economic opportunities. Recently, the Environmental, Social, and Governance (ESG) paradigm has emerged as the most important metric for measuring sustainability performance across countries, companies, and financial instruments. ESG variables are extensively used now in policy formulation, risk assessment analyses, and in financial choices. It acts as a multivariable benchmark for measuring sustainable advancements (Drago et al., 2025; Saltık, 2024). However, presently, the empirical literature has yet to shed light on the proper positioning of the energy use per capita within the ESG system. Most empirical analyses to date view energy use through scattered observation points that predominantly focus either on the economic growth aspect of energy use or on the carbon-emission performance of energy use (Horbach, 2024; Şahin, 2025). There are other analyses that examine ESG variables as outcomes or predictors in financial or institutional settings, but do not explicitly incorporate energy use as the central variable affected by ESG processes (Tan et al., 2025). It has often resulted in energy use being predominantly the focus of observations, either in the context of the environment or as a control variable outside ESG regimes. It indicates a lack in the empirical literature. Firstly, very few studies exist on ENUS and ESG factors at a large scale (Afzal et al., 2025). Secondly, although environmental factors are considered in these studies, they apply linear econometric analysis (Davidescu et al., 2025) only when using large international datasets. However, it is important to analyze regions with diverse development paths, energy structures, environmental challenges, and so on, in the context of sustainable development. Furthermore, current research on energy, sustainability, and machine learning remains an independent process, focused on forecasting accuracy rather than interpretability and theoretical orientation (López-Flores et al., 2025; Xie et al., 2024). This paper fills this void in the literature by presenting an original and comprehensive empirical analysis of energy use per capita within the ESG framework, particularly the Environmental dimension. The originality of this study essentially resides in three main dimensions: the conceptual dimension, which presents an original interpretation of ENUS not only as a peripheral or technical indicator of ESG factors, but also as an essential outcome variable influenced by ESG environmental factors. The methodological dimension proposes an original approach that combines panel econometrics, clustering analysis, and machine learning methods within a comprehensive, unified framework. Conceptually speaking, the paper departs from the traditional divide between energy, on the one hand, as an driver for environmental degradation, and energy on the other, as an input into economic value added. Indeed, the paper considers the ENUS not merely as an intersection of energy and environmental degradation, but as part of the broader environmental system viewed through the lens of ESG factors. Thus, environmental management is conceptualized not only with regard to emissions but also through resource use, climate-related stresses, integrity of ecosystems, and energy system factors. Methodologically speaking, the article offers an integration of complementary methods that have been combined very rarely in the ESG and energy literature. First, panel data methods are used to establish structural connections between ENUS and environmental variables by exploiting cross-country differences and time-series variation (Davidescu et al., 2025). Fixed effects models, random effects models, and Weighted Least Squares methods are all applied to ensure robustness and to overcome typical heteroscedasticity and autocorrelation problems in cross-country panel analysis. Second, it presents an application of the clustering technique to identify underlying environmental regimes in which energy consumption is linked in its trajectory to various environmental variables: emissions, climate, resource depletion, and energy characteristics. This is an entirely novel approach because applying clustering analysis to ENUS issues has rarely been attempted in the ESG framework. Rather than imposing a single global relationship between environmental variables and energy consumption, the clustering analysis proposes several scenarios for different sustainability paths (Afzal et al., 2025). These CL’s point to the fact that different energy consumption patterns may be supported by very different patterns in environmental variables; that high or low values of ENUS have no meaning unless considered in the wider context of the environment. Third, it integrates analyses based on machine-learning algorithms to improve prediction accuracy by leveraging their stronger ability to handle complex relationships beyond the reach of standard econometric techniques. A set of algorithms is comparatively tested using an extensive set of normalized performance criteria, accounting for error measures and explanatory power. The outcome clearly shows that the K-Nearest Neighbors (KNN) algorithm distinguishes itself from others by its superior accuracy and robustness, as it better explains energy consumption by leveraging established environmental variables (Şahin, 2025; López-Flores et al., 2025). An important feature of this study is that it neither applies machine-learning algorithms in a “black box” way nor uses an uninterpretable explanatory variable set. The interpretation problem is overcome by applying dropout-based and additive-explanation techniques to estimate each individual variable’s contribution to energy consumption prediction. The empirical findings yield several new insights that directly address the gaps identified in the literature review. Firstly, panel regressions indicate that ENUS is significantly and deterministically driven by environmental pressure variables, emissions intensity, energy efficiency, and resource use variables, including carbon dioxide emissions, emissions of greenhouse gases above CO2, water withdrawals, waste production, and energy intensity (Davidescu et al., 2025). Not only do these results substantiate the fact that energy use incorporates deeply complex environmental dynamics and processes rather than operating strictly as a consequence of purely economic activities, but they spell out a clear message about the costs associated with the pursuit of environmentalism at the expense of energy progress for emerging nations which continue to dominate the world order at the dawn of the 21st century. Secondly, results based on clustering indicate a complex set of environmental regimes that fall into two broad categories – those that display high energy use associated with extreme environmental pressures and those that reflect high ENUS measures associated with comparatively moderate environmental pressures, reflecting their different sets of efficiencies and energy sources. On the other hand, low energy use regimes indicate countries with high natural capital or higher renewal rates, whereas others are associated with structural constraints and environmental pressures (Afzal et al., 2025; Horbach, 2024). Thirdly, results based on machine learning point out the primacy associated with non-linear local relationship dynamics that effectively determine ENUS measures. Not only do these results reinforce that energy use owes a great deal to similarities between countries' environmental variables and confirms the view of environmental scientists that countries continue along their specific environmental trajectories or routes rather than being forced into a globally convergent manner as argued among neoliberals and neoclassicals associated with globalization theory (Horbach, 2022; Iliško et al., 2020), but they indicate that emissions variables, overall environmental efficiencies and pollutions, as well as climate change variables owe a great deal compared to structural variables and land variables associated with their determinations as confirmed innovatively by interpretability analysis procedures and methods (Şahin, 2025; Xie et al., 2024). On the whole, this article is an original contribution inasmuch as it integrates ESG analysis, energy economics, and machine learning. This paper clearly illustrates that energy use per capita is far too complex to be addressed from either structural inference or regime detection alone. Rather, it is argued that knowledge about energy per capita is best acquired via an integrated approach that combines structural inference, regime detection, and predictive analysis. By locating countries’ ESG scores within ESG-defined multidimensional environmental regimes, it is easier to gain a sophisticated perspective on sustainability issues. Indeed, this paper’s analysis clearly indicates that energy and climate policies must be matched to differentiated regimes rather than treated in a generic way. Thus, this paper is an original contribution vis-à-vis both empirical and ESG-based analyses of sustainability challenges (Drago et al., 2025; Tan et al., 2025).
The article continues as follows: the second section reviews the literature on energy consumption and ESG, highlighting the main theoretical perspectives and empirical gaps. The third section presents the methodology, data, and theoretical framework, introducing the integrated use of panel data econometrics, machine learning regression, and clustering techniques. The fourth section analyzes the relationship between energy use per capita and the Environmental (E) pillar of ESG using multimethod empirical evidence. The fifth section examines the Social (S) determinants of energy consumption, focusing on social development, labor markets, and demographic dynamics. The sixth section investigates the role of Governance (G) indicators in shaping energy use through institutional quality and regulatory effectiveness. The seventh section interprets energy use per capita as a multidimensional ESG nexus by integrating results across all three pillars. The eighth section discusses policy implications within an integrated ESG framework. The final section concludes by summarizing the main findings and contributions of the study.
2. Literature Review
Recent research increasingly positions environmental, social, and governance (ESG) considerations as the guiding principle for understanding the transformation of modern energy systems. As a guiding principle, energy efficiency and transformation are perceived not only from a technological perspective but also through the lens of a complex process, whose contours are shaped by the quality of governance, financial structures, technological change, and human capital. Research on the subject is increasing, exploring how the integration of ESG considerations affects energy efficiency at the corporate, sector, and macroeconomic levels, while acknowledging the value-creating potential of a cohesive ESG approach, alongside the risks posed by poor governance and greenwashing. Recent research also highlights the growing integration of ESG considerations into the global energy sector and views ESG factors as a strategic means to improve energy sustainability and competitiveness. Adedokun (2026) highlights the legal and institutional integration of ESG factors for Nigeria's energy transition in its oil and gas industry and asserts that sound ESG governance structures can expedite the transition to energy sustainability. Nor et al. (2026) demonstrate the beneficial impact of digital advancements and smart technologies on the ESG performance of Malaysian buildings and validate technological innovation in energy efficiency and ESG performance. Li and Darko (2025) empirically demonstrate, in their evolutionary game model analysis of energy efficiency strategies, that governments’, corporations’, and markets’ cooperation strategies maximize energy efficiency and reflect stakeholder interactions in ESG strategy design. Green financing's specific beneficial impact on energy carbon neutrality has been found in research by Lou (2025) and reflects the critical influence of financial system integration on the ESG energy transition. Empirical evidence of the relationship between ESG performance factors and energy efficiency and profitability has been provided in studies by Madwe et al. (2025) and Burinskienė et al. (2025), reflecting the ESG performance strategy's overall "double dividend" of improved energy sustainability and profitability. A new energy-sharing strategy using Nash Negotiation has been proposed by Wang et al. (2025), suggesting ESG performance strategy value-creation collaboration. At the same time, Yücel (2025) assesses greenwashing and legitimacy risks in ESG performance and energy transition strategy data, and reflects on the integrity of ESG strategy data. Yu et al. (2025) also outlined approaches to validating and improving the accuracy of energy ESG performance strategy data, the impact of text mining on energy ESG performance strategy data, and the validation of strategy synergies with the United Nations' sustainable development goals. Final considerations emphasizing human subcapital, digital skilling in energy, and the validity of ESG strategy success and performance have been provided in Ragazou et al. (2025). Collectively, these findings point to a fundamental message: for a sustainable energy transformation, a systemic integration of governance, financing, technology, and human capabilities is required. In an ESG context, energy efficiency stands out not only as a technological tool but also as a strategic approach that promotes sustainability and resilience. In terms of fiscal incentives aimed at energy efficiency savings and emission cuts, for example, Wu & Min (2025) found that these measures not only contribute to energy savings but also further improve the effectiveness of green technology innovations, establishing a direct link between national energy policies and enhanced ESG progress in corporations. Similarly, in a study by Mao et al. (2025), energy transition policies in China’s demonstration cities were found to result in notable ESG improvements, establishing a link between reduced fossil fuel dependence and enhanced ESG performance. Liu et al. (2025) and, further, a separate study by Khan et al. (2025) confirm this link by showing that digital transformation policies further improve a firm’s effectiveness in energy resource management and ESG alignment. This association is further defined by Mengyuan et al. (2025) as an ESG risk assessment framework specific to the energy sector, with yardsticks provided for evaluating the sustainability of energy production and consumption. In addition, evidence at the macroeconomic level by Zhang et al. (2025) indicates that improved corporate ESG performance due to energy transitions leads to greater social welfare benefits, while Wang and Wang (2025) suggest that specific green bonds and carbon pricing instruments direct investments towards low-energy and low-carbon strategies. Adaptive ESG policies to manage energy transitions are a critical imperative for balancing the energy and climate challenges discussed by Narayan et al. (2025) for emerging countries. Supporting evidence on AI and cloud-based solutions by Niu et al. (2025), Zhou et al. (2025), and Aljohani (2025) suggests improved energy efficiency and greater environmental disclosure on ESG statements. Companies following best ESG energy management policies have also demonstrated reduced capital expenditure (Wilberg et al., 2025), thus explicitly confirming that economic benefits, along with ecological advantages, support energy sustainability. Mufungizi and Mpaka’s (2025) study demonstrates ESG integration in the Congo DR’s mining industry, turning resource extraction into sustainable energy consumption, proving that quality governance decreases the energy intensity of resource extraction. Kiran et al. (2025) examine ESG investments in G8 countries and conclude that ecological sustainability is enhanced through clean production and efficient energy resource allocation, demonstrating that quality governance moderates the effect of energy consumption on the environment. Jin’s (2025) ESG-conformal investment in SMEs boosts green economic revival and sustainable resource innovation, while Liu et al. (2025) detail an optimization approach for micro-grid-scale energy consumption, demonstrating that intelligent planning can achieve an optimal ESG approach through zero waste and maximum renewable energy consumption. ESG performance is further confirmed in global financial planning through improvements in market value and sustainability assessments in the energy and utility sector when efficient energy consumption is implemented, as demonstrated by Christine et al. (2025). At a governance level, Zournatzidou et al. (2025) discuss threshold effects of ESG performance and energy policy efficiency in Europe. It is inferred that better ESG performance is directly related to more efficient energy use. On the contrary, Singh and Arora (2025) argue that companies with strong ESG performance could potentially mislead on energy efficiency. Gao et al. (2025) discuss greenwashing practices in electric cars and found that inefficient ESG performance misleads about efficient energy output. Authors such as Kweh et al. (2025) and Wieteska-Rosiak (2025) demonstrated that ESG practices and sustainable design achieve greater energy efficiency and resilience in European cities, and reiterated that efficient energy use is a prerequisite for achieving good ESG performance. Sorrosal-Forradellas et al. (2025) demonstrated that, through financial and sustainability performance strategies in investment funds, energy-efficient investment is possible and aligns with the ESG energy strategy. Costanzo et al. (2025) discussed the use of cyclical resources for fertilizers derived from organic wastes, which reduces energy intensity and, conversely, promotes environmental and economic aspects of ESG performance. Sklavos et al. (2025) discussed green accounting in European financial institutions and demonstrated that efficient energy use and ESG performance are directly correlated with financial performance metrics. Magaletti et al. (2025) extend the lesson to the construction industry and observe a significant energy-savings potential from the use of decarbonization strategies informed by ESG factors. Veisi (2025) finds that the increased use of corporate sustainability reports in the Wisconsin region increasingly aligns energy transition strategies with climate governance. Riti et al. (2025) and Dong et al. (2025) indicate that the increased use of AI and innovation networks improves companies’ ESG performance by encouraging the use of energy-efficient strategies and green technologies. Jin et al. (2025) offer additional insights into the increased use of energy efficiency credit guidelines as a boost to low-carbon innovation and ESG performance. Alkhalifa (2025) expresses reservations about treating LEED as a proper proxy for energy-related ESG factors. Fu et al. (2025) observe an increased reliance on globalization in the diffusion of green technologies. Lastly, Gao et al. (2025) observe an increase in the use of effective ESG performance to augment total factor productivity in the energy company sector. See Table 1.
3. Methodology, Data and Theoretical Background
The research aims to use the intersection of panel data econometrics, unsupervised clustering, and machine learning techniques to investigate the role of Environmental, Social, and Governance (ESG) factors, particularly the Environment dimension, in influencing energy use normalized for population (ENUS) across countries. This will be done by adopting recent research recommendations that call for the complementary use of econometric techniques and data-driven approaches for modeling sustainability trends in the energy arena (Davidescu et al., 2025; Saltık, 2024). To make trends comparable across nations, the research will use the World Bank's World Development Indicators dataset. This will provide a consistent framework for modeling, enabling the estimation of nearly 1,965 observations from an unbalanced panel of up to 127 countries over approximately 17 years. This will provide sufficient flexibility to capture structural heterogeneity and time-series variability for the respective sets of factors related to the environment, institutions, energy, etc., in conformity with global ESG rating systems (Costantiello & Leogrande, 2024; Laureti et al., 2023). In terms of methodologies, the empirical approach consists of three consecutive steps. In the first stage, econometric panel-data models with FE, RE, and Weighted Least Squares (WLS) estimators are used to estimate the structural link between ENUS and ESG factors. The FE model accounts for unobserved country-specific characteristics, such as geography and energy resource endowment, reflecting the importance of effective governance as a driver of ESG performance (Laureti et al. 2023). The WLS technique is used to treat heteroscedasticity and cross-sectional dependence. Additionally, Hausman tests for FE reliability show that FE is more accurate and robust theoretically than other tests (Hausman), complementing current trends toward using econometric models in the ESG-energy literature (Davidescu et al. 2025). The second stage uses the K-Means algorithm in Unsupervised Machine Learning to discern environmental regimes in which energy use is correlated with Emissions, Climate Stressors, and Resource Use. The paradigm is consistent with current classification systems associated with sustainability and environmental conditions (Onomakpo 2025; Costantiello & Leogrande 2024). The algorithmic clustering is verified using Silhouette Scores, CH Scores, and Herfindahl Indices to form ten well-balanced subsets for exercising ten distinct ESG-energy regimes—ranging from energy-intensive to low energy and renewables-based. The third stage relies on Machine Learning to determine how different statistical models can forecast ENUS values. This paradigm is consistent with algorithmic studies toward establishing relevance to apply Machine Learning to further investigate nonlinear associations of ESG-ENUS (Davidescu et al. 2025) (Saltık 2024). The best-performing algorithm is established using Normalization across MSE, RMSE, MAE, MAPE, and explanatory strength (R-Squared) for K-Nearest-Neighbor (KNN). Additionally, Dropout loss helps determine the marginal contributions of select ESG variables to ENUS predictions. These include CO₂ Emissions, Energy Efficiency, Waste Generation, and Water Withdrawal. Theoretical rationales: Specifically, ESG sustainability factors place energy use within a nominated framework, where energy use is understood in terms of its relationship with economic and environmental stress. The Environment factor captures relationships among energy management, energy efficiency, and greenhouse gas emission intensity within the nominated ESG adoptability and applicability frameworks (Onomakpo, 2025; Costantiello & Leogrande, 2024). The nominated methodological approach employs econometric models, machine learning algorithms, and clustering methods in its design and implementation (Figure 1).
4. Energy Use and the ESG Environmental Pillar: Evidence from Panel Data, Machine Learning, and Clustering
4.1. Environmental Pillar of ESG and Energy Use: Evidence from Cross-Country Panel Regressions
This section examines the empirical relationship between the Environmental pillar of the ESG framework and per capita energy use (ENUS) through a set of panel data regressions. By focusing on a comprehensive set of environmental indicators related to resource use, emissions, land dynamics, and energy structure, the analysis aims to capture the multidimensional nature of the E-Environment component and its influence on national energy consumption patterns. The estimated models provide insight into how environmental pressure, efficiency, and sustainability-related factors jointly shape energy demand across countries and over time. We have estimated the following equation:
The above empirical model may be conceptually broken down as a mega panel data study on the impact of the Environmental pillar of the ESG paradigm, henceforth referred to as ‘E-Environment,’ on energy consumption as measured by the dependent variable ‘ENUS.’ This empirical methodology is compatible with a paradigmatic shift in related research towards emphasizing the importance of environmental pillars of ESG values on economic, financial, and energy-related outcomes as cited by recent publications (Lapinskienė et al., 2023; Manjengwa et al., 2025; Tutar et al., 2025). All the other variables have been taken from WorldBank datasets to add global validation and consistency, along with ‘gold standard’ level credibility to related data as followed by recent empirical paradigm study publications on related topics involving ESG variables (Farooq & Thavorn, 2025; Abbas et al., 2025). In this study, there are 127 cross-sections appearing likely to be countries, which have likely followed an unbalanced panel study period configuration having a maximum period of 17 years, hence giving rise to a total observation level of 1,965 observations. Conceptually, E-Environment in ESG research includes natural resource management practices, emissions, ecosystem integrity, and climate-related stresses. This conceptually inclusive perspective aligns with the existing ESG research context on the joint influence of environmental variables in measuring sustainability pressures and risks associated with transitioning factors (Lapinskienė et al., 2023; Tutar et al., 2025). The variables selected in the regression analysis represent the inclusive perspective. Variables such as electricity access, fossil fuel energy use, renewable energy variables, greenhouse gas emissions, land use change, and water withdrawal rates together represent the nexus between the state of the environment and the demand for energy. Thus, ENUS is not simply conceptualized in the economic context but at the nexus of the structural relationships existing between environmental sustainability and the energy domain—referencing similar insights from research on ESG variables and energy transition variables and environmental pressure variables respectively (Sharipov et al., 2025; Onomakpo, 2025). The estimation of the model uses three different panel data approaches with a focus on a fixed-effect estimator, a generalized least squares method using the Nerlove transformation, and a weighted least squares approach assuming unit-specific error variance. This multi-method estimation approach not only increases the robustness of the research, allowing for a clear comparison of the stability of coefficients across estimation methods, a methodological approach typically used in ESG-oriented panel data studies (Aslan-Çetin et al., 2024; Manjengwa et al., 2025). Furthermore, with high levels of country-specific heterogeneity, a fixed-effect approach becomes very relevant, where the empirical estimate controls for all time-invariant country-specific characteristics, such as geography, institutional structures, energy endowment, and development path. Based on the fixed-effect estimator, the result depicts a high level of goodness of fit, where the LSDV R-square is well above 0.99, while the within R-square approaches a value of 0.69. This scenario depicts a situation where the time-series fluctuations of E-Environment variables contribute a considerable share of changes in energy use, across different economies. Joint significance of the regressors can be established using the F-statistic for joint restrictions of coefficients; where p-value approaches zero, confirming the influence of E-variables on ENUS, consistent with the established evidence on ESG’s role on real-world outcomes (Farooq & Thavorn, 2025; Abbas et al., 2025). Electricity access is revealed as an important factor influencing energy consumption for all models. With a positive and strongly significant result, increased access to electricity is associated with increased aggregate energy consumption. From the ESG perspective, this finding points to the importance of an underlying trade-off for the environmental factor: while increased access to modern energy services is required for proper social development and inclusion goals, the potential stress-related impacts for the environment, depending on the underlying energy mix, might be increased. These trade-offs have been indicated by various studies investigating the link between ESG performance and sustainable developments in new and developing countries (Manjengwa et al., 2025; Sharipov et al., 2025). The CAGR-Value-Added sector shows a persistently negative coefficient, indicating that economies with a more primary-oriented structure present lower energy availment levels once country-specific variations are accounted for. Under the ESG paradigm, this indicates that environmental performance is to be understood from its structural angle, where sectoral differences matter for energy availment trends (Lapinskienė et al., 2023; Tutar et al., 2025). Annual Water Withdrawals present a positive and significant correlation with ENUS, thereby attesting to the well-known nexus between water withdrawal and energy availability. The stated finding is supportive of ESG-approach dwellings that continuously recognize natural resource extraction and energy systems’ well-known interconnectedness (Abbas et al., 2025; Onomakpo, 2025). The per-capita carbon dioxide emission shows one of the largest coefficients in the model. The strong positive relationship between carbon dioxide emission and energy usage indicates the continued entrapping relationship between the two, thereby indicating less global decoupling. According to the environmental pillar of ESG, the intensity of emission is a fundamental constituent of environmental sustainability (Lapinskienė et al., 2023; Farooq & Thavorn, 2025). The energy imports are depicted with mixed indicators in terms of specifications, owing to the complexities entailed in energy security in the E-Environment category. With the concerns of heteroskedasticity and across-country variance taken into full consideration, the negative coefficient in the weighted least squares equation indicates that import dependence can influence efficiency increases through activities made possible by structural constraints on consumption, which aligns with contemporary research on energy risk and sustainability transitions (Sharipov et al., 2025). The energy intensity of primary energy is positively and significantly correlated with ENUS under all models, thereby validating that energy inefficiencies directly correspond to increased levels of consumption and implying that energy efficiency remains a key component of ESG-based sustainable energy funds (Abbas et al., 2025; Matsali et al., 2025). The consumption of fossil fuel energy has a negative coefficient, potentially implying substitution/saturation patterns net of emissions and aggregate energy consumption. This finding illustrates that it is essential to consider and fully understand a series of E-Environment variables simultaneously and not in aggregate or isolated fashion, particularly within integrated frameworks of comprehensive ESG analysis (Tutar et al., 2025; Farooq & Thavorn, 2025). Emissions of greenhouse gases from changes in land use, forestry, methane, nitrous oxide, and tree cover loss are positively associated with ENUS, thereby offering evidence that various forms of environmental degradation are sequential patterns concurrent with increments of energy consumption. Such a finding and pattern validate that previously assigned principles incorporating holistic and integrated measures of ESG-based sustainable investments continue to effectively explain that variables associated with environmental pressure measures directly relate and interact systematically and not in opposition or offsetting patterns (Lapinskienė et al., 2023; Abbas et al., 2025). On balance, the above discussion highlights that the proposed model delivers robust support to the hypothesis that E-Environment factors of ESG variables demonstrate significant impacts on energy use. Using World Bank data, this proposed study confirms that no energy transition research could be accomplished effectively without taking into consideration the environment factors identified through ESG variables, which supports current research on ESG topics (Manjengwa et al., 2025; Tutar et al., 2025; Onomakpo, 2025). See Table 2.
4.2. E-Environment Typologies and Energy Demand: Evidence from K-Means Clustering
This simple empirical model set up in this study could be considered an extensive panel analysis concerning the large-scale impacts of the ESG Environmental pillar, from now on referred to as E-Environment, on energy consumption, represented here through the dependent variable ENUS. This type of analysis is in accordance with a contemporary and increasing stream of ESG models and theories that attribute a pivotal role to environmental aspects in ESG regarding economic, financial, and energy performance (Lapinskienė et al., 2023; Manjengwa et al., 2025; Tutar et al., 2025). All of the model's independent variables are taken from World Bank sources in this study, which is a strategy aiming at universality and consistency in methods and accuracy in derived facts and figures in this ESG empirical analysis, a strategy increasingly used in contemporary ESG empirical models and papers (Farooq et al., 2025; Abbas et al., 2025). The analysis includes 127 cross-sectional entities possibly representing countries, in an unbalanced panel, of maximum 17-year length, totaling 1,965 observation sub-units in general. On a conceptual level, E-Environment covers natural resource management, emissions, ecosystem integrity, and climate-related stressors in the ESG dimension. This multi-faceted view is in line with ESG research, which points to environmental factors collectively indicating pressures towards sustainability (Lapinskienė et al., 2023; Tutar et al., 2025). The regressors considered take this multifaceted approach. These regressors, access to electricity, the use of fossil fuel energy, renewable energy variable indicators, greenhouse gas emissions, land use change, and water withdrawal, provide information on how environmental states or performance intersect with energy demand. On this basis, the value of ENUS can be considered neither economic performance alone nor the predicate variable but rather influenced by structural relationships between environmental sustainability pressures and energy patterns, reflecting findings in ESG, energy transition, or environmental-pressure indicators (Sharipov et al., 2025; Onomakpo, 2025). Model is estimated using three different panel models of fixed effects, random effects using Nerlove transformation for Generalized Least Squares, and Weighted Least Squares with unit-specific variance of errors. The procedure provides stronger robustness of results and also allows comparison of coefficients' stability across different models. Such methodological design aligns better with common practices of applying panel models in relation to an ESG focus (ASLAN-ÇETİN et al. 2024; Manjengwa et al. 2025). The fixed-effect method appears particularly appropriate due to significant N heterogeneity and encompasses all time-invariant country characteristics that encompass geography, institutions, and energy resources that influence economic development. The fixed-effect results confirm outstanding explanatory models with an LSDV-R-squared of over 0.99 and Within-R-squared of approximately 0.69. This confirms that temporal changes of E-Environment variables strongly influence changes in energy use. The joint insignificance of variables was also supported by an F-test with an effective p-value of 0 and strongly confirms that environmental variables strongly influence ENUS, which aligns well with other research that confirms strong interrelations between ESG environmental variables and various economic and energy variables (Farooq & Thavorn 2025; Abbas et al. 2025). Electricity access is observed to play a major role as a driver for energy consumption for all models and specifications. This is indicated by the strongly positive and significant result that demonstrates that increased access to electricity is accompanied by increased total energy consumption. From an ESG analysis standpoint, the contribution of this result underscores the importance of the persisting trade-off that requires increased access within the sector for sustainable social development and inclusive growth, thereby simultaneously enhancing potential environmental pressures based on the prevailing energy sources and mixes (Manjengwa et al., 2025; Sharipov et al., 2025). The value added by agriculture, forestry, and fishing reveals a persistently negative coefficient, implying that more economy-specific emphasis on the primary sector is associated with lower energy use per capita once country-specific factors are adjusted for. Within the context of the ESG approach, this result points to the existence of the structural aspect of environmental behavior, wherein the sectoral composition of the economy underlies energy demand patterns (Lapinskienė et al., 2023 & Tutar et al., 2025). Annual freshwater withdrawals are positively and significantly related to ENUS, thereby establishing the strong relationship that exists between water withdrawal and energy use. This study's result is consistent with the water-energy nexus and affirms the study approach underpinned by the principles of ESG strategies, which emphasize water and energy system dependencies and interlinkages related to natural resource extraction and energy use practices (Abbas et al., 2025 & Onomakpo, 2025). The CO2 emissions per capita has one of the highest coefficients in the equation. This clearly points towards a close link between energy consumption and emissions, indicating a less-developed phenomenon of global decoupling. This result is completely consistent with the ESG framework’s environment dimension, in which the intensity of emissions serves as a key determinant for the measurement of sustainable risks (Lapinskienė et al., 2023; Farooq & Thavorn, 2025). The energy import variables have mixed results in terms of sign. However, taken on its own and incorporating all aspects of heteroskedasticity and cross-sectional variability of variables, energy imports' negative coefficient on weighted least squares appears to impose efficiency-enhancing practices and/or structural constraints on energy use in line with latest research on energy policy risks and sustainable transitions (Sharipov et al., 2025). Energy intensity of primary energy has a positive and significant relationship with the ENUS, thus confirming that the effects of a less efficient energy sector translate to increased levels of consumption, and the need for efficiency measures remains at the forefront of sustainable energy policies based on ESG ideologies (Abbas et al., 2025; Matsali et al., 2025). Consumption of fossil fuel energy has a negative coefficient, possibly due to the effects of substitution or saturation after controlling for the variables of emission and total consumption levels. This further supports the need for a combined understanding of E-Environment variables, as is the practice in ESG analysis (Tutar et al., 2025; Farooq & Thavorn, 2025). Finally, emissions of LUC, forestry, methane, nitrous oxide, and tree cover loss share positive correlations with ENUS, implying that processes of environmental degradation correlate with energy use. These findings confirm ESG-related views that environmental pressures share a systematic relationship in ESG analysis, which are not offset by one another (Lapinskienė et al., 2023; Abbas et al., 2025). To sum up in the form of a conclusion, the model developed affirms the strong influence of the E-Environment constituents of the ESG framework on energy use. This is owing to the group of variables consisting of environmental pressure indicators, emissions variables, resource exploitation variables, and efficiency variables. Based on the world bank data and the use of a panel approach in the research, the conclusion affirms the growing idea in the field of ESG research studies today (Manjengwa et al., 2025; Tutar et al., 2025; Onomakpo, 2025). See Table 3.
Under the ESG framework, and specifically within the E–Environment pillar, the K-Means clustering results can be interpreted as a set of distinct environmental “regimes” that describe how energy use per capita (ENUS) co-moves with key environmental, climate, and energy-system variables. This interpretation is consistent with recent applications of clustering techniques to environmental and energy data, where unsupervised methods are used to uncover latent sustainability patterns and development pathways (Krstić, 2023; Jiménez-Preciado et al., 2025; Noviandy et al., 2024). Because the reported cluster centers are standardized, positive values indicate above-average levels relative to the full sample and negative values indicate below-average levels. Read in this way, the clusters do not merely segment countries (or observations) statistically; they outline different combinations of energy consumption, emissions profiles, climate conditions, and environmental pressures that can be understood as ESG-relevant typologies, as suggested in multidimensional ESG and sustainability analyses (Costantiello & Leogrande, 2024; Saltık, 2024). A first important result concerns the balance and usability of the partition. Cluster sizes range from 54 to 451 observations, with no single cluster absorbing the majority of the sample. This is important for environmental interpretation because it suggests that the solution is not driven by one dominant “global average” group; instead, it captures multiple meaningful environmental patterns associated with ENUS. Similar balanced clustering structures have been highlighted as desirable in comparative environmental and development studies using K-Means (Noviandy et al., 2024; Mendoza-Mendoza et al., 2025). The within-cluster heterogeneity shares are relatively similar across the main clusters (especially clusters 1, 3, 4, 6, and 7), indicating that K-Means distributes explanatory structure across several clusters rather than concentrating it in a single group. The silhouette scores reinforce this interpretation: several clusters show reasonably good separation (notably clusters 2, 5, 8, and 10), suggesting that some environmental regimes are clearly distinct in the underlying feature space, in line with best practices in clustering-based environmental diagnostics (Krstić, 2023; Jiménez-Preciado et al., 2025). Focusing on ENUS and its relationship with environmental indicators, the centroids immediately identify clusters with high-energy, high-pressure profiles. Cluster 8 is the most extreme case, with ENUS strongly above average and similarly very high values for CO₂ emissions per capita (CO2P) and other environmental stress indicators, including large positive values for PM2.5 and waste-related measures (WSTR). This combination is consistent with an “energy- and emissions-intensive” regime, where high energy consumption is closely linked with elevated pollution burdens and greenhouse gas emissions. Comparable high-impact clusters have been identified in studies examining emissions-intensive development paths and carbon-intensive regimes using clustering approaches (Lee et al., 2025; Krstić, 2023). From an ESG perspective, this cluster can be read as a high environmental risk profile in which energy use translates into multiple forms of environmental pressure rather than being mitigated by cleaner technologies or systemic efficiency, a concern emphasized in ESG-based energy sector analyses (Saltık, 2024). Cluster 10 also exhibits an above-average ENUS centroid, together with a high CO2P centroid and positive values on several climate-related variables. Compared with cluster 8, the pattern appears less extreme but still reflects a development trajectory characterized by high per-capita energy demand and associated emissions. Together, these clusters highlight a core message of the E pillar: high energy use is rarely environmentally neutral, and clustering results suggest that it often coincides with higher carbon intensity and broader environmental burdens for specific groups of observations. This finding is consistent with cross-country clustering evidence on emissions drivers and energy use (Lee et al., 2025; Jiménez-Preciado et al., 2025). At the opposite end of the spectrum, clusters with below-average ENUS—such as clusters 2, 3, 5, 6, and 7—represent lower-energy regimes, but they are not environmentally homogeneous. Cluster 2 combines low ENUS with strongly negative values in several energy-system variables, indicating a low-consumption profile that may reflect limited industrial energy demand, lower electrification, or structural conditions associated with less energy-intensive development. Similar low-energy clusters have been documented in environmental and development-focused classification studies (Mendoza-Mendoza et al., 2025). Cluster 5 shows below-average ENUS while featuring very high values in variables related to natural capital (such as FRST), suggesting a regime where energy use is relatively low and ecological endowments are strong, a pattern consistent with natural-capital-oriented environmental typologies (Noviandy et al., 2024). Cluster 7 also displays low ENUS but stands out for strong positive values in renewable-related indicators (RENC) and other environmental variables, implying a low-energy profile potentially aligned with cleaner energy structures or stronger environmental performance, as observed in studies linking renewable intensity and environmental outcomes (Lee et al., 2025; Saltık, 2024). A particularly informative result is that the clustering distinguishes between cases where low ENUS is associated with environmental advantage and cases where low ENUS coexists with other forms of environmental stress. For example, some lower-ENUS clusters still show positive values in pollution-related indicators such as PM2.5 or in greenhouse gases other than CO₂, suggesting that low energy use does not automatically imply superior environmental outcomes. Conversely, clusters with higher ENUS differ markedly in their environmental signatures, indicating that the relationship between energy use and environmental impact is mediated by factors such as energy mix, technology, and environmental regulation. This heterogeneity echoes recent ESG research emphasizing that environmental performance depends not only on consumption levels but also on structural and regulatory conditions (Costantiello & Leogrande, 2024; Jiménez-Preciado et al., 2025). Finally, the silhouette results help identify which environmental regimes are most clearly separated and thus most reliable for interpretation. Clusters with higher silhouette values, such as clusters 2, 5, 8, and 10, represent more coherent and internally consistent environmental typologies, whereas clusters with lower silhouette values, such as cluster 1, may capture transitional or mixed regimes. This distinction is particularly relevant for ESG reporting and benchmarking, where clarity and stability of classification are essential for policy and investment applications (Saltık, 2024). Overall, the K-Means solution provides a balanced and interpretable typology of environmental profiles linking energy use per capita to emissions, pollution, climate conditions, and energy-system characteristics. The clusters demonstrate that ENUS is embedded within broader environmental regimes: some are clearly high-energy and high-impact, others combine low energy use with strong natural capital or renewable signals, and several occupy intermediate positions where energy use and environmental pressures interact in more nuanced ways. This multidimensional segmentation is therefore especially useful for ESG-oriented comparative analysis, as it moves beyond single indicators and captures complex environmental patterns associated with energy use (Krstić, 2023; Mendoza-Mendoza et al., 2025; Saltık, 2024). See Table 5.
Within the ESG paradigm, specifically within the E-Environment domain, K-Means Cluster Analysis outcomes could be understood to identify a set of ‘regimes’ through which energy use per capita (ENUS) variables are jointly mapped. This resonates with contemporary practices of applying Machine Learning models, such as K-Means, to climate metrics, in which unsupervised algorithms are used to identify hidden trends in sustainable development (Krstić, 2023; Jiménez-Preciado, 2025; Noviandy et al., 2024). As K-Means clusters are standardized, positive value indices indicate values above the mean of a variable sampled from a broader set of observations, whereas negative indices indicate values below the mean. Thus, understood in their broader perspective, these are more than statistical patterns based on country-identifiers of observations. Set within an alternative paradigm, rather, these could be understood to be coordinated patterns of energy use and emissions levels, climatic factors, along with ‘pressures’ upon this environment—that could be classified within an alternative set of ESG paradigm ideas, specifically upon zones of multidimensional climate-sustainability patterns (Costantiello & Leogrande, 2024; Saltık, 2024). A major finding concerns the balance and interpretability of the partition. The cluster sizes range from 54 to 451 cases, and no cluster contains the majority of the data. Being of environmental significance, this means that instead of focusing on a single major “global average” type of group, this solution identifies several significant environmental patterns related to ENUS. Such balanced clustering patterns have previously been identified as important for comparable environmental and developmental research using K-Means (Noviandy et al., 2024; Mendoza-Mendoza et al., 2025). The shares of within-cluster dispersion are quite balanced among the major clusters (especially clusters 1, 3, 4, 6, and 7), suggesting that K-Means is allocating model-explaining structure to several clusters concurrently instead of allocating to a single group. The Silhouette measures further underscore this finding and point to several clusters (especially clusters 2, 5, 8, and 10) being able to discriminate relatively well in a suitable manner (among environmental regimes specifically) in accordance with proper clustering for environmental analysis (Krstić, 2023; Jiménez-Preciado et al., 2025). Regarding ENUS and its correlations with environmental variables, the centroids easily distinguish high-energy, high-pressure patterns. Cluster 8 stands out as a clear example, where not only is ENUS well above the mean, but CO₂ emissions per capita (CO2P) and various other measures of environmental stress, including very positive values for PM2.5 and waste measures (WSTR), are correspondingly extremely high. Together, these factors can be categorized as a specifically "energy- and emissions-intensive" regime, in which energy use is strongly correlated with high levels of both polluting loads and greenhouse gas emissions. Clusters of this kind have appeared in research on emissions-intensive development patterns and carbon regimes employing clustering analysis techniques (Lee et al. 2025; Krstic, 2023). For ESG, this cluster can be considered a high-risk cluster for the environment, where energy use feeds into various forms of negative, non-mitigated factors, a pattern highlighted in energy sector ESG research (Saltik, 2024). Cluster 10, by contrast, features a high positive centroid on ENUS, a high positive centroid on CO2P, and positive measures on a variety of climate variables. Compared to Cluster 8, a more similar, though still high, pattern emerges, suggesting a development pathway associated with high energy demand and corresponding levels of emissions. These clusters, together, reinforce one of the pivotal points of the E pillar of the research framework, namely, energy demand will often be difficult to act on from an environmentally neutral perspective, being instead strongly associated with various levels of carbon intensification, as well as corresponding levels of environmental repositories in a set of pattern-specific observations. These observations concur with cross-country research assessments, specifically regarding patterns of energy demand and emissions (Lee et al. 2025; Jiménez-Preciado et al. 2025). On the other hand, with ENUS scores below average, clusters such as 2, 3, 5, 6, and 7 represent low-energy regions. However, environmental homogeneity is not present in these groups. In particular, Cluster 2 shows low ENUS values and highly negative values for energy system variables. Hence, there is evidence of a low energy-consuming pattern. Likewise, similar low-energy-consuming clusters have been previously established for environmental development classification (Mendoza-Mendoza et al., 2025). Another case is Cluster 5 with low ENUS values and very high values for natural capital-related variables (e.g., FRST). Consequently, there is evidence of a low-energy-consuming pattern, yet natural capital is very high. This supports natural capital environmental typologies (Noviandy et al. 2024). Cluster 7 is characterized as low ENUS with very high values for renewable energy-related variables (RENC) and other environmental variables. Thus, there is evidence for a low-energy-consuming pattern. This is potentially similar to cleaner energy structure regions or regions with improvements regarding environmental performance (Lee et al. 2025; Saltık 2024). One of the most enlightening outcomes is the clustering analysis's ability to differentiate between regions with low ENUS values accompanied by an advantage in the environment and those with lower ENUS values accompanied by different sources of environmental stress. Take, for instance, the reduced ENUS clusters with values that continue to register positively for indicators such as PM2.5 and greenhouse gases other than CO₂, indicating that while the region may have low energy use, this is not necessarily a hallmark of enhanced environmental performance. On the other hand, new clusters with greater ENUS show greater variation in the environmental variables, indicating that the interaction between energy and the environment is mediated by the underlying energy composition and environmental policies and structures (Costantiello & Leogrande, 2024; Jiménez-Preciado et al., 2025). Finally, the silhouette analysis outcome also enables the determination of which groups are more distinguishable in the environment and can be considered for more reliable interpretation. Groups with high silhouette coefficients, such as 2, 5, 8, and 10, can be considered more homogeneous with respect to the environment classification. On the other hand, groups with a low coefficient value, such as group 1, may represent a transitional state or a mixture of environments. This takes on a more specific form in the context of ESG reports and benchmarks, where a clear interpretation is needed. In summary, the K-Means solution provides a balanced and meaningful typology of environmental profiles connecting ENUS to emissions, pollution, climate factors, and energy system types. These clusters show that ENUS is situated within larger environmental systems, some of which are obviously high energy and high impact, some of which match low energy use to strong natural capital or renewable factors, and others of which are situated in mid-range positions in which energy use and environmental pressure interact in more complex ways. This multidimensional segmentation approach is highly relevant to comparative analysis for its ESG focus, as it looks beyond simple indicators to more complex environmental patterns related to energy use (Krstić, 2023; Mendoza-Mendoza et al., 2025; Saltık, 2024). See Table 6.
This figure brings together two different perspectives which complement each other to form a basis for determining and validating the optimal number of clusters in K-Means analysis through the use of statistical measures in determining model goodness of fit and the analysis of cluster morphology through visualization. Panel A of this figure offers an explanation of the process of determining optimal cluster numbers through an Elbow Method plot where cluster number is depicted on one axis versus various measures of goodness of fit, including Within-Cluster Sum of Squares (WSS), Akaike Information Criterion (AIC), and Bayesian Information Criterion (BIC) on the other axis. These curves all reduce in intensity with an increase in cluster number, which is an indication of an increase in precision of fit through grouping of points into smaller clusters, though at a rate where increasing benefits of further clustering start to be diminished. The point of inflexion at which BIC is at its least (at around ten clusters) is the most significant point and is an indication that this is a statistically optimal clustering solution where further clustering is unnecessary since additional clusters tend to increase overall model complexity rather than enhance goodness of fit. Since BIC is a criterion where complexity is strictly penalized compared to WSS, its trough is an optimal solution that seeks to ensure a balance in explanatory power rather than mere parsimony. Panel B of this figure presents a two-dimensional t-SNE plot of clustered data for further visualization and interpretation of clusters. Each point in this graph is represented in a cluster, and this is used to determine an insight into cluster separation and distinctness. It is realized from this graph that each cluster tends to be distinct and separate in this two-dimensional graph, though some appear to be more dispersed than others. However, all clusters seem to be distinct and separate and do not, in large numbers, appear to be overlapping or identical, which is an indication of an optimal solution in clustering that does not suffer from redundancy and overlapping. See Figure 2.
4.3. Machine Learning Performance in Predicting Energy Use per Capita within the ESG Environment Pillar
Within this section, the predictive capacity of different machine learning models used to estimate energy usage per capita (ENUS) is assessed, as included in the Environment part of the ESG model (Seow, 2025). To make all models eligible for comparison, this evaluation uses normalized, directionally consistent values to assess model accuracy and degree of adaptability, including both error reduction and model explainability rates. As part of this benchmarking exercise, this section proceeds to use the concept of dropout loss to evaluate and outline which variables of the environmental category impact overall prediction rates to the greatest extent, providing insight into those factors who lead to prediction differences within the estimate of ENUS in this multivariable and potentially complex setting of MRA study and application (Selmeya et al., 2025). This table displays predictive model rates for several prediction models assessed for overall normalized and directionally consistent set of comparative indicators for prediction models’ efficacy, mutually adjusted to represent better or improved values for all models and methods applied in prediction estimation and theory of knowledge and application of MRA principles for final predictions and results toward informed decision-making and estimate of better or improved models and methods to choose from for applications of efficient energy usage practices and models for better or improved estimations and estimates of theoretical and MRA approaches and principles related to optimal energy usage practices for global and/or predictive needs and applications of knowledge and principles of MRA theories and approaches and principles for better or improved estimations and predictions of energy needs and requirements for better or improved applications of MRA principles and approaches related to energy practices and usage (Seow, 2025). One of the first things to note is the spread of performance metrics for all models. It’s obvious that SVM underperforms, consistently scoring zero across all performance metrics, indicating the largest prediction errors and, correspondingly, the weakest explanations. This means that the SVM does not need to be considered further. Of all the models to be analyzed, it’s clear there are significant differences. Although Linear Regression and Regularized Linear models do not perform badly, their error metrics are relatively low, indicating that their R² values are obviously poor compared to those of non-linear models. This means that a linear model does not capture the underlying data process very well, resulting in relatively poor explanatory ability and a large prediction error (Almeida et al., 2024). Boosting and Decision Tree models show a considerable improvement over linear methods. Both methods show well-balanced but not outstanding results across all metrics, while, upon inspection, Decision Tree methods perform particularly well on MSE but less so on scaled errors and R² values. These models provide intermediate solutions—they improve forecasting accuracy relative to linear models but fail to outshine on all tasks specified within the entire list of evaluation criteria (Pence et al., 2024). Finally, it is apparent that Random Forest outperforms all other competitors. This model scores highest on normalized MSE and shows outstanding performance across all other metrics, indicating a model that effectively combines high predictive quality with low forecasting errors. Indeed, it is typical for higher-quality models to be more accurate and less prone to error across all the task sets mentioned earlier, especially for methods like Random Forest, known for their efficacy and resistance to noise and outliers (Ekinci & Ozturk, 2025). Therefore, it is proposed that Random Forest is a highly credible and balanced algorithm capable of making accurate predictions across all specified parameters. However, when all the parameters are considered together, it is apparent that the best-performing model is the K-Nearest Neighbors (KNN). This is because KNN supports the maximum values for all error-related parameters, such as scaled MSE, RMSE, MAE/MAD, and MAPE. This further reveals lower prediction error values than those of other models used. At the same time, it supports the maximum R² measure values. As such, it points to maximum explanation of the total variance of the dependent (Y) variable (Yasin et al., 2025). The simultaneous support for maximum/minimum variations on all parameters is quite appreciable. This is because it clearly distinguishes itself from other models. In this case, it does not compromise one objective to fulfill another. As such, it is reasonable to state that when both aspects of all parameters are appropriately addressed, KNN is clearly the best-performing procedure for predictions. The other model that actually supports moderate values is Random Forest. The rest support varying values on inferiority (Selmeya et al., 2025; Seow, 2025; Ekinci & Ozturk, 2025). See Table 7.
The table mentioned earlier illustrates the average dropout loss for a set of environmental variables in the E-Environment domain of the ESG criteria, based on predicted energy use per capita (ENUS) values. The average dropout loss estimates the loss in predictive performance resulting from removing a variable from the prediction model. It indicates a direct contribution of the variable to ENUS prediction when a high value is obtained and a secondary contribution when a low value is obtained. The relevance of using estimates is more pronounced in the context of complex models. The estimate accounts for both direct effects and interaction terms simultaneously (Lee et al., 2025). The analysis reveals that the relative importance of various environmental drivers in energy consumption is unequal. CO₂ emissions per capita (CO2P) are identified as the most vital driver with a significant difference in importance. The very high dropout rate in CO2P indicates a strong relationship between energy consumption and carbon emissions. This result is consistent with the ESG literature, which shows that higher energy consumption linearly influences carbon emissions (Han et al., 2021). The dominance of CO2P in importance strongly supports that ENUS is not solely an economic and technological measure. Rather, it strongly emphasizes its importance in E (Drago et al., 2025). The following sets of variables with substantial influence include waste generation (WSTR), water withdrawal (AFWW), and energy efficiency (GEFF). The substantial influence of WSTR suggests that energy-intensive processes are linked to material intensity and waste generation. The finding suggests inefficient production and consumption patterns (Ferro et al. 2025). AFWW emphasizes the link between energy and water resources. Given that energy is used for production and consumption, its relationship to water resources is particularly emphasized. The substantial level of GEFF suggests focusing on energy efficiency as an intermediate factor influencing energy intensity. Variations in energy intensity separately affect energy intensity and its correlation with environmental pressures, thereby supporting energy intensity decoupling from environmental pressures (Dey et al. 2023). Environmental/climate pollutants also have a great presence. Contiddleware climate-related indicators (TCL, LST, HI35) and air pollutant indicators (PM25) exhibit high dropout values, indicating high sensitivity to climate indicators. A rise in temperature increases cooling demand, thereby increasing energy consumption, while environmental indicators serve both as causes and effects of energy consumption (Kotsompolis et al., 2025). The above-discussed points again emphasize the reinforcing cycle of environmental stressors with ENUS. Other greenhouse gases, such as methane (CH4P) and nitrous oxide (N2OP), which are also of high importance, indicate the embeddedness of energy use within other systems of emissions, such as agriculture, waste, and industry (Drago et al., 2025). It shows that ENUS emissions are not confined solely to electricity use and fossil fuel combustion but are embedded across multiple environmental settings. Variables related to the structure of energy system parameters—energy imports (ENIM), energy intensity (ENIN), and fossil fuel dependence (FOSS)—have a non-negligible but secondary effect. That their dropout terms are important shows that these parameters’ structural influences are significant, even if their main effects are through emissions, efficiency, and the environment rather than through direct primary impacts. Variables associated with renewable energy (RELE, RENC) also have a secondary effect, which suggests their impacts on ENUS are indirect, perhaps through system structure and/or efficiency (Kotsompolis et al., 2025). Land-use/natural capital variables—including agricultural land (AGRL), forest cover (FRST), and deforestation-related variables (ASFD)—also help explain ENUS, with relatively small losses due to dropouts. This indicates that energy use links, particularly through bioenergy or agricultural uses, are less straightforward than those associated with greenhouse gases, energy efficiency, and climate change. However, their presence shows that energy use is linked with natural systems (Ferro et al., 2025). Climate variability variables, such as HDD and CDD, and drought variables (SPEI) also exhibit relatively small yet non-zero loss values. Such variables are associated with energy demand, including heating and cooling degree days and drought. Their relatively small values, therefore, indicate that structural variables play a larger role than climate change variability variables in ENUS values (Lee et al., 2025). In conclusion, the analysis of the dropout loss provides a unified view that the major drivers of energy consumption per capita are variables characterizing environmental pressure, emissions, efficiency, and resource use. Within the ESG Environment pillar framework, the ENUS plays a crucial mediating role, connecting climate change, pollution, resource depletion, and efficiency. It is indicated that those aiming at emission reduction and management strategies for waste and emissions, resource efficiency, and climate change adaptation have great potential to influence the ENUS and are critical for assessing environmental sustainability challenges (Kotsompolis et al., 2025; Ferro et al., 2025). See Table 8.
This table presents counterfactual or attribution results that assess the impact of the ‘E–Environment’ element of the ESG framework on energy use per capita (ENUS). Every scenario shows a change in ENUS against a common baseline, along with the individual contributions of environment variables. These can be considered marginal effects: a negative value indicates a contribution that decreases ENUS relative to the baseline, while a positive value indicates a contribution that increases it. Thus, in this context, this table provides a breakdown of all elements of ENUS, including environmental pressures, climate, emissions, resource use, and energy system parameters. Notably, in each of the nine instances, the projected ENUS is significantly lower than the baseline, highlighting intense downward pressure on energy use arising from the joint setting of the E-Environment variables. An ESG analysis shows that environmental constraints, efficiency effects, and climate conditions strongly shape or limit energy use, rather than merely reacting to it, as further supported by Raza et al. (2025) on the shape of the energy-emission relationship within BRICS systems. Emissions-related variables appear strongly influential across cases. CO₂ emissions per capita (CO2P) show strong negative contributions, with values often exceeding −200,000 across cases, indicating a strongly intertwined relationship between energy consumption and carbon intensity: scenarios with lower or limited emissions imply lower energy use (Bagadeem, 2025). Methane (CH4P) and nitrous oxide (N2OP) show similar negative contributions across all cases, supporting the interpretation that the ENUS system is part of a larger greenhouse gas system rather than a CO₂-only system. The importance of emissions management is apparent throughout the E pillar and strongly indicates that the impact of low-carbon strategies would be directly and significantly realized in terms of lowering the levels of energy consumption, supporting the findings of Zohra (2025) that technological and policy advancements have been influential in lowering CO₂ emissions scenarios for developing areas. Indicators of resource use and pollution provide additional evidence of such an understanding. Waste generation (WSTR) and air pollution (PM25) tend to be negatively associated with predicted ENUS values, suggesting that environmental stress from material fluxes and local pollution is associated with reduced energy use. Water withdrawal (AFWW) is also negatively associated, thereby underlining an equally close energy-water nexus; that is, less-than-adequate or inefficient water use may be an important consideration affecting energy production and consumption. The essential role of efficiency progress and technological advances in mitigating such stress and decoupling energy use from environmental stress is underlined by Lu et al. (2025). The climate variables show more complex patterns. For example, cooling degree days (CDD), heating degree days (HDD), land surface temperature (LST), and heat intensity (HI35) have different signs and values for other cases. For instance, high cooling demand can be a positive driver of ENUS in some scenarios, indicating its influence on energy demand in a warming climate. In other scenarios, high heat and unfavorable climatic conditions, or both, can negatively affect energy demand, potentially due to the inability of infrastructure to support energy-hungry equipment like air conditioners during high heat, a phenomenon observed by Bekele et al. (2024) in Sub-Saharan Africa. Variables such as energy system characteristics and energy efficiency are also significant. The energy efficiency (GEFF) consistently makes a significant negative contribution to ENUS. Thus, an improvement here is among the best ways to reduce energy consumption from an environmental perspective in ESG. The energy intensity (ENIN) and energy imports (ENIM) are also pushing ENUS from below. Thus, systems with lower intensity or limited external sources are associated with lower energy consumption (Mukhiyayeva et al. 2025). The fossil fuel dependence (FOSS) is mainly negative. Thus, once again, this proves that systems with fossil fuel components have high ENUS, and any move away from them significantly affects ENUS values (Raza et al. 2025). Natural capital factors, such as forest area (FRST), agricultural land (AGRL), and renewable energy (RELE, RENC), have yielded mixed but informative results. Some of these factors indicate reduced energy use alongside increases in forest area and renewable energy use, which could be attributed to a move towards less energy-intensive, more sustainable development patterns. Nonetheless, their impact has been more indicative of structural change factors than a decisive driver of ENUS, as supported by Dincã et al. (2025), who argue that they can effectively reduce energy intensity and carbon emissions by increasing renewable energy within the EU. The indicators for climate stress and variability, SPEI, affect estimates of energy consumption differently in each case, sometimes raising and sometimes lowering them. This can be attributed to the contradictory nature of climate stress, in which, on the one hand, droughts can increase energy demand due to adaptation and mitigation activities. At the same time, they can limit energy demand due to reduced economic activity. In general, the decomposition of ENUS indicates that, in the E-Environment dimension of ESG, the factors that most significantly impact ENUS are emissions intensity, efficiency, pollution, and resource constraints, rather than purely climatic conditions or land use patterns (Lu et al., 2025). The findings are consistent with the idea that energy consumption is an essential nexus in, rather than an independent driver of, the integrated environmental system. It can thus be envisioned that decarbonization, efficient use, waste reduction, and pollution mitigation policies will have the most significant leverage in ENUS, thereby further confirming that ENUS serves as an essential nexus through which environmental sustainability goals are achieved in the ESG framework (Mukhiyayeva et al., 2025). See Table 9.
Also, the predictive accuracy of the K-Nearest Neighbors (KNN) algorithm is presented in the diagram using two complementary graphics that assess the accuracy and calibration of the predictive models. KNN has been widely applied in predictive modeling and environmental studies due to its ability to describe non-linear relationships between observed and predicted variables, resulting in high predictive accuracy and model calibration (Mokhtara et al., 2025). The graph shows the predictive performance, with the expected test data plotted against the observed test data. Nearly all the observed data points are closely clustered around the diagonal, indicating strong consistency between the predicted and observed data. However, the observed deviation from the diagonal is slight throughout, indicating minimal systematic error and an optimal fit provided by the data's mode (Nie et al., 2025). From this information, it can be concluded that the KNN algorithm accurately replicates the non-linear structure of the data. In the other graph, the mean-squared error is plotted against the number of neighbors, with calculations performed on the training and validation data. As anticipated, the mean-squared error on the training data decreases continuously as k is lowered, reflecting the models' increased flexibility. Still, the mean-squared error on the validation data exhibits a “U” shape. Additionally, the minimum mean-squared error on the validation data is small for small k, indicating the optimal combination provided by the KNN models. A small value of k tends to increase the probability of overfitting (Figure 3).
5. Social Determinants of Energy Consumption: An ESG–S Analysis Using Econometric and ML Approaches
5.1. Social Sustainability and Energy Consumption: Structural Evidence from Panel Regressions
This article investigates the relationship between the Social (S) dimension of the ESG framework and energy use per capita (ENUS), conceptualizing energy consumption as a socio-economic outcome rather than a purely environmental variable. By focusing on indicators related to health, demographics, food security, and social well-being, the analysis explores how social development patterns shape national energy demand. Using a large cross-country panel dataset and a fixed-effects econometric framework, the study aims to uncover the structural social drivers of energy use and to highlight the trade-offs and complementarities between social progress and sustainable energy consumption.
The following equation has been estimated:
Within the ESG framework, the Social (S) dimension captures the conditions that shape human well-being, social cohesion, demographic dynamics, access to essential services, and the inclusiveness of economic participation (Jílková & Kotěšovcová, 2023; Jiang et al., 2024). In this context, energy use per capita (ENUS), although traditionally classified as an environmental variable, can be interpreted as a meaningful outcome of social development. Energy consumption reflects not only production and income levels but also the quality of health systems, demographic structures, food security, lifestyles, and access to infrastructure (Kharlamova et al., 2025; Drago et al., 2025). As such, it provides a useful lens through which the interaction between social progress and sustainability can be assessed. The empirical analysis is based on a panel of 150 countries observed over an unbalanced time span of up to 18 years. This wide coverage allows the identification of both cross-country structural differences and within-country dynamics over time (Jiang et al., 2024). The strong rejection of the hypothesis of common intercepts across groups confirms that countries differ markedly in their baseline levels of energy use per capita. These differences are not random but reflect deep-rooted social, demographic, and institutional characteristics (Jeon, 2025). The variance decomposition further reinforces this point: the between-country variance is far larger than the within-country variance, indicating that structural social factors explain much more of the variation in energy use than short-run changes. From a methodological standpoint, the Hausman test decisively rejects the consistency of random-effects estimates, implying that unobserved country-specific characteristics are correlated with the social regressors (Jílková & Kotěšovcová, 2023). This result is consistent with the nature of social indicators, which are embedded in long-term historical, cultural, and institutional contexts (Pacheco, 2025). Consequently, the fixed-effects framework is theoretically preferable, as it controls for time-invariant national traits and isolates the impact of changes in social conditions on energy use. At the same time, the presence of heteroskedasticity, cross-sectional dependence, non-normal residuals, and autocorrelation suggests that the data violate standard panel assumptions. These features are common in large cross-country datasets and reflect global shocks, shared trends, and interconnected development paths (Enriquez et al., 2025). For this reason, WLS estimates are reported as a robustness check, although their coefficients must be interpreted with caution, particularly when signs differ from those in the fixed-effects model. Turning to the substantive results, the food production index (FDPI) displays a negative and statistically significant relationship with energy use per capita in both fixed- and random-effects models. This finding suggests that countries with more efficient and productive food systems tend to consume less energy per person (Affonso, 2025). From a social sustainability perspective, this result highlights the role of food security and agricultural efficiency as stabilizing forces. Efficient food production reduces losses along supply chains, limits the need for energy-intensive imports, and mitigates vulnerability to food crises. In social terms, this reflects the capacity of societies to meet basic nutritional needs without placing excessive pressure on energy systems (Costantiello et al., 2025). Hospital beds per capita (HBED) exhibit a strong and consistently positive association with energy use per capita across all models. This is one of the most robust findings in the analysis and illustrates a fundamental trade-off within the Social dimension. A higher number of hospital beds reflects greater access to healthcare services, improved medical infrastructure, and stronger welfare systems (Hubbard, 2025). However, healthcare systems are inherently energy intensive, relying on continuous power supply, advanced medical equipment, climate-controlled facilities, and extensive logistics. The positive coefficient therefore does not indicate inefficiency or waste but rather the energy requirements of delivering high-quality health services. From an ESG perspective, this result underscores the importance of integrating energy efficiency and renewable solutions into healthcare infrastructure so that social progress in health does not translate into disproportionate increases in energy demand (Kharlamova et al., 2025; Drago et al., 2025). Life expectancy at birth (LEXP) is negatively associated with energy use per capita in the fixed- and random-effects specifications. This suggests that societies achieving better health outcomes and longer lifespans do not necessarily rely on higher levels of energy consumption (Jeon, 2025). In social terms, this points to the importance of preventive healthcare, education, sanitation, and effective public health policies. These factors improve population health without requiring energy-intensive interventions. The result supports the idea that social development can decouple well-being from energy intensity, particularly when improvements are driven by institutional quality and human capital rather than resource-intensive medical treatments alone (Pacheco, 2025; Enriquez et al., 2025). A similar interpretation applies to the under-five mortality rate (U5MR), which also shows a negative and statistically significant coefficient in the panel estimations. Lower child mortality is one of the most fundamental indicators of social development, reflecting access to basic healthcare, clean water, adequate nutrition, maternal education, and effective public health systems (Jiang et al., 2024). The negative association with energy use indicates that improvements in these foundational social conditions are not inherently energy intensive. The share of the population aged 65 and above (POP65) is negatively associated with energy use per capita. Demographic aging is a central feature of advanced stages of social development, particularly in high-income economies (Kharlamova et al., 2025). Older populations tend to exhibit lower mobility, reduced participation in energy-intensive labor activities, and different consumption patterns compared to younger cohorts. As a result, population aging can moderate aggregate energy demand. In contrast, the prevalence of overweight (OVWT) shows a positive and highly significant relationship with energy use per capita. This variable captures aspects of lifestyle, dietary patterns, urbanization, and material consumption associated with higher income levels (Affonso, 2025; Drago et al., 2025). Socially, a higher prevalence of overweight reflects not only health risks but also broader consumption behaviors, including energy-intensive food systems, greater reliance on private transportation, and higher residential energy use. From a policy perspective, these findings imply that strengthening the Social pillar cannot be pursued in isolation from energy and environmental considerations. Social investments in health, nutrition, and inclusion should be accompanied by strategies that promote energy efficiency, clean technologies, and sustainable consumption patterns (Jeon, 2025; Enriquez et al., 2025). Healthcare systems, in particular, represent a critical area where social and environmental objectives intersect, and where innovation can yield large co-benefits (Hubbard, 2025; Pacheco, 2025). Similarly, addressing lifestyle-related health risks such as overweight can simultaneously improve social outcomes and reduce energy pressure (Costantiello et al., 2025). In conclusion, the empirical evidence highlights that social sustainability can either reinforce or undermine environmental sustainability, depending on how social progress is achieved (Drago et al., 2025; Jílková & Kotěšovcová, 2023). Energy use per capita reflects the social choices societies make regarding welfare provision, demographic development, and consumption patterns. Policies aimed at advancing the Social pillar of ESG should therefore be designed with an integrated perspective, ensuring that gains in health, longevity, and well-being do not translate into disproportionate increases in energy demand (Jeon, 2025; Kharlamova et al., 2025). See Table 10.
5.2. Multi-Criteria Evaluation of Clustering Algorithms for S-Social Profiles and ENUS
This section discusses the criteria for determining the most effective clustering method for analyzing the Social (S) element of the ESG approach in the context of energy consumption per capita (ENUS). In the multi-criteria analysis, the assessment involves a set of diverse criteria with opposing optima; the method accounts for goodness-of-fit and the structural value of the clusters (Ishizaka et al., 2021). This approach will be utilized in the assessment by ensuring that a normalized and oppositely aligned multi-criteria method is employed (Sevgi & Figen, 2025). In making the best choice among these algorithms, one needs to appreciate that the criteria in this framework are not all the same and are of opposite natures—in other words, the criteria to be optimized follow both maxim and minim conventions, with criteria Maxim, Silhouette, Minimum Separation, γ, Dunn Index, and CH Index to be maximized, and criteria AIC, BIC, SD, Entropy, and HH Index to be minimized. The criteria are arranged in the table in their scaled form, where increases are beneficial in all criteria (Rusu et al., 2023). From Density-Based, this approach performs best in terms of goodness-of-fit and information criteria, with the highest R², AIC, and BIC. However, although this approach is statistically sound, it has an inferior structure or silhouette value, which is zero, geometric separation, which is inadequate, and, more specifically, it has a high HH Index value, which is notable since it suggests that there is not negligible density or number of data points forming each cluster. As such, with regard to equilibrating this structure, this approach is not particularly suitable, although it performs well in terms of goodness of fit (Sultana & Zeya, 2025). Hierarchical clustering is at the other extreme of this spectrum. The performance of hierarchical clustering is outstanding across various structural and geometric metrics: the silhouette, separation, Pearson γ, Dunn’s indices, and entropy all attain their best possible values, suggesting a high degree of separation and compactness. However, its performance is suboptimal on R², AIC, and BIC criteria, indicating that the obtained clusters fail to capture data variability adequately and that the model is inefficient. Although its performance is high-quality from a modeling perspective, this clustering method is relatively weak from an explanatory viewpoint (Ishizaka et al., 2021; Rusu et al., 2023). Fuzzy C-Means has a medium performance across all aspects, except for being outstanding in no crucial category. Entropy and HH Index values are relatively high, indicating a lack of balance and interpretability; nonetheless, they remain less explanatory than other models (Sevgi & Figen, 2025). Model-Based and Random Forest clustering are producing fair results on some criteria, yet both are penalized for the lack of explanatory power and for high HH Index values. Specifically, Random Forest clustering has the highest HH Index value, indicating the highest cohesion and, therefore, the least balanced distribution of clusters among the methods assessed (Sultana & Zeya, 2025). With these considerations in mind, the best compromise in general is provided by K-Means. It yields large values for essential performance measures, such as R² and the Calinski-Harabasz index, reflecting strong explanatory capability and good compactness relative to separation, respectively (Jauhari et al., 2025; Sinaga & Yang, 2025). It also obtains a quite good silhouette ranking, with the best value for the maximum diameter after normalization, reflecting compactness. Most importantly, it received the lowest values for the HH Index, indicating a favorable distribution of data points in the clusters, an important aspect when avoiding dominance by large clusters. Thus, taking into account the maximization as well as the minimization objectives that are simultaneously considered, with equal importance given to the ability of the resultant clusters being balanced along with the simplicity of the model itself, K-Means yields the most optimal as well as valid result (Sinaga & Yang, 2025; Sevgi & Figen, 2025). It does not optimize any particular dimension but performs very well across all significant dimensions, making it the most suited algorithm for the multi-criteria assessment framework based on ESG (Jauhari et al., 2025). See Table 11.
From the clustering outcomes, with particular emphasis on the broad heterogeneity in the profiles of social development and their correlated energy use, it emerges that the pattern linking ENUS (energy use per capita) and S-Social in the ESG paradigm provides an informative representation. In conformity with previous research on national development (Mendoza-Mendoza et al., 2025), it will be observed that countries can be grouped according to their social features so that ENUS can be viewed not merely as an economic variable but as a phenomenon thoroughly ingrained in societies in terms of welfare structures and demographics (Filì & De Anna, 2025). One of the first interesting aspects concerns the size of the clusters and the quality achieved internally. The cluster sizes are not homogeneous, ranging from tiny ones (2 and 5, with only 9 cases each) to considerably larger ones (1, 3, 6, and 10). The smaller clusters generally have very high values of the silhouette coefficient (2, 5, and 9, for example), which indicates that these clusters have high cohesion among their cases, as well as a clear distinction from the other groups, which, again, suggests that these social-energy patterns are highly distinctive, even if restricted to a few cases. The values for the larger clusters are lower, which generally indicate a higher degree of heterogeneity, as could be expected for countries with greater social heterogeneity (Mendoza-Mendoza et al., 2025). Analysis of ENUS for each cluster clearly shows a pattern of increasing energy consumption with higher levels of development. Based on ENUS, clusters 5 and 1 rank higher on standardized energy consumption per capita. These two clusters are distinguished by relatively more favorable social conditions, including better access to sanitation, lower levels of malnutrition, and, for cluster 1, higher levels of ESRP, internet use, life expectancy, and the proportion of seniors. From an ESG-Social perspective, it can be noted that more developed countries with better welfare systems are more energy-intensive due to energy-hungry lifestyles, infrastructure, and services, as argued by the authors Simionescu & Oancea (2025). On the other hand, clusters 2, 7, and 8 rank low on ENUS, with more negative scores, indicating lower energy consumption per capita. These clusters are distinguished by poor social conditions: extremely low ESRP, life expectancy, fertility rates, child mortality rates, sanitation access, internet use, and higher levels of malnutrition. The social conditions for these clusters reflect limited development, which means low energy use, not because it’s more sustainable, but because of restricted access to energy services and developmental limitations. This varies distinctly across ENUS patterns for deprived clusters when considered from an ESG perspective, as it marks a clear point of risk for social performance rather than sustainability success, as argued by Huang et al. (2025). The intermediate clusters numbered 3, 4, 6, and 10 fall into the intermediate category. They have ENUS values that are close to zero or slightly negative. This depicts the intermediate state of their social structures. They are also most likely to have a balanced ESRP value, with the population's health improving. Access to education and sanitary facilities will also be incomplete. Additionally, the demographic structure will also be balanced in these countries. Here, energy consumption increases as countries develop socially. This increase in energy consumption does not reach the peak levels attained by the most socially developed countries (Filì & De Anna, 2025). Demographic factors are particularly significant in influencing ENUS across groups. Groups with high fertility and high under-five mortality, like groups 2 and 8, are found to be associated with lower ENUS. On the other hand, groups with high life expectancy and an older population aged 65+ are prone to high energy consumption due to the demands of aging societies and healthcare systems (Zhang and Liu, 2023). Labor force participation and unemployment are also important factors here. Groups with high unemployment or lower labor force participation are prone to lower ENUS due to fewer economic and industrial activities and, consequently, lower energy consumption. Education and gender factors further accentuate these factors. Groups with high government expenditure on education, high primary education enrollment, and high gender parity are associated with higher ENUS due to the demands of an inclusive social system (Huang et al., 2025). On the other hand, groups with high educational backlog and gender inequality are associated with dampened energy consumption due to the social implications of energy poverty. In general, this clustering analysis confirms that ENUS is inextricably linked to the Social aspect of ESG. High levels of energy consumption per capita are connected to strong social rights, adequate health, education, and social inclusion. In contrast, low levels are often related to deprivation rather than sustainability per se (Simionescu & Oancea, 2025). The above findings emphasize that one fundamental lesson from ESG is that cutting energy consumption without addressing underlying levels of deprivation can have inequality-increasing implications. Thus, socially inclusive, sustainable transitions in this domain mean that improved welfare levels and greater social rights should accompany clean, efficient, and lower pollution levels, not reduced access to energy supplies (Mendoza-Mendoza et al., 2025; Filì & De Anna, 2025). See Table 12.
The above table reports the standardized values of the centroids of the energy use per capita (ENUS) variable together with other extensive sets of ESG-based factors of a ‘social’ type, providing an insightful explanation of the complex interpretation of the ENUS variable in relation to the development of societal structures. As suggested by recent research on ESG issues (Manjengwa et al., 2025; Enriquez et al., 2025), the above results confirm once again the complex embedding of the ENUS variable within societal structures. Cluster 1 has high ENUS values alongside robust social sector performance, as measured by high indices of ESRP, internet usage, life expectancy, labor force participation, sanitation services, and an older population. This cluster corresponds to countries with very advanced welfare states, wherein the operation of digital networks, health services, and services within older communities is necessarily energy-consuming, supporting the argument that social inclusion policies and welfare extension usually raise energy demand except insofar as efficiency offsets this relationship (Kharlamova et al., 2025; Jeon, 2025). Cluster 5 has the highest ENUS, but the social factors are mixed. While overall social inclusion is limited, the presence of effective migration processes and service-oriented life orientations is working in favor of energy demand. This indicates that specific selective social and demographic forces may be at work to produce a high ENUS even without overall social development (Nurgaliyeva, 2025). On the other hand, Clusters 2, 7, and 8 exhibit very low ENUS alongside significant levels of social deprivation, including low life expectancy, restricted internet access, poor sanitation, and high fertility or child mortality. In line with the literature on ESG-S, the low energy use in Clusters 2, 7, and 8 can be attributed to ‘energy poverty’ rather than sustainability (Enriquez et al., 2025). Clusters 3 and 4 reflect regimes of transition, during which some positive social change occurs alongside modest progress on ENUS, suggesting possible trajectories toward decoupling societal advancement from energy use (Brożek et al., 2025). Additionally, cluster 6 shows that disparities in social achievement do not necessarily lead to greater energy use during periods of economic stagnation. On the whole, the clustering above confirms a fundamental principle of our approach to ESG: ENUS is often associated with social inclusion when it is high, while a low ENUS signal can indicate not sustainability but exclusion, thereby requiring efficiency-related and clean energy policies to balance social progress with natural limitations (Costantiello et al., 2025). See Table 13.
5.3. Benchmarking Machine Learning Models for ENUS Prediction Using ESG Social Indicators
In this section, the capability of different models using machine learning techniques is evaluated for explaining energy use per capita, commonly referred to as ENUS, through Social S dimension indicators using ESG. To foster a transparent method of assessment, a normalized multi-metric model that considers both error reduction and explanation at the same time is used. In a similar vein, recent studies have used similar methods that involve model comparisons through a variety of metrics for testing predictive models (de Dieu Hagenimana & Sumbiri, 2025; Sibai et al., 2024). This has made it relatively easy to select a model that presents a more balanced solution for predictive capability, robustness, and, more importantly, explanation, before moving towards analyzing the relative weight that social indicators have for explaining energy consumption. The aim is to identify which machine learning technique performs best out of the models considered through a complete relative comparison. This comparison is achieved through a Min-Max normalization technique, ensuring all performance values are relative. This technique has a higher score for values closer to 1. The error metrics include MSE, RMSE, MAE/MAD, and MAPE. For error metrics, lower error values are associated with higher performance. However, the coefficient of determination score has a conventional scale. This technique has successfully enabled relative performance comparison among diverse indicators in a similar predictive model framework as outlined in Ling et al. (Ling et al., 2024). As per the normalized outcome results, the best-performing model is seen to be the ‘K-Nearest Neighbors’ (KNN) model. The KNN model also achieves the highest normalized outcome measure (1.00) on all dimensions of evaluation – on absolute as well as relative error terms and goodness of fit. The superiority of the KNN model is evident on every aspect of the overall evaluation framework, reflecting its strongest predictive capability on every aspect (Avinash et al., 2025). Considering the aspect of minimizing error norms – both MSE and RMSE – the KNN model remains superior to every other model in the evaluation test and achieves the lowest error norm measure on every dimension. Furthermore, while measuring performance through ‘Mean Absolute Error’ (MAE/MAD) and ‘Mean Absolute Percentage Error’ (MAPE), the KNN model remains the best-performing model on every dimension, reflecting its capability to make exact predictions in terms of both absolute as well as relative deviations (Sibai et al., 2024). In addition to error measures, KNN also attains the highest value of Normalized R², which means that the model captures the most variance in the target variable compared to other models. A high value of R² along with a minimal value of prediction error measures good fit, along with good generalization capabilities within the identified domain. The consistency of both parameters again justifies that KNN attains a much better overall fit rather than just focusing on a specific measure (Troncoso et al., 2023). In relation to other superior models like Random Forest and Decision Trees, KNN retains its superiority. Although Random Forest produces superior scores on many parameters, it doesn’t produce harmony towards optimal values like KNN. Decision Trees are good but more variant on parameters, thus not as stable as KNN. Linear and ridge regression models are inferior to KNN on accuracy despite their simplicity. Support Vector Machines are not consistent, doing extremely well on some error measures but failing catastrophically on other measures like R²(Ling et al., 2024). In conclusion, the above normalized statistical analysis clearly indicates that the KNN model is the most effective of the lot for this predictive task, based on its outstanding performance, error minimization, and ability to explain the results, as indicated above (Avinash et al., 2025; de Dieu Hagenimana & Sumbiri, 2025). Table 14.
The significance of Social (S)-related dimension variables to ESG factors concerning variations in per-capita energy use (ENUS) is explained through analyzing mean dropout loss scores. The higher the mean dropout loss score, better are the reductions in model performance to measure variable significance to explain energy use patterns. The findings confirm that labour market patterns and socio-demographic factors have a prominent influence on per-capita energy use, and that Labour Force Participation Rate (LFPR) is the dominant variable affecting energy use patterns, as indicated by higher participation generally begetting consumptive demand of energy. The relationship indicates that higher levels of engagement of people generally have a strong correlation to higher energy use levels, provided that this demand is driven by engagement of people within their capacities to produce and consume. Equally, the unemployment rate (UNEM) and population density (POPD) have great explanatory power as well. Unemployment has been known to influence household income, consumption behaviors, as well as government spending, which have, in turn, been associated with energy consumption. Population density, commonly associated with urbanization, has been associated with cumulative energy consumption due to the infrastructure associated with dwellings, transport networks, as well as urban infrastructure, hence its explanatory power for the ENUS equation as well. The second set of variables explaining the ENUS equation relates to demographic changes as well as social investment variables. Net migration (NMIG) has a high level of dropout loss, suggesting that migration has played a crucial role in the level of national energy usage, given that migration translates to changes in population size, labor, as well as consumption behaviors as well. Similarly, government spending per capita on educational institutions (GEE) has great explanatory power, suggesting that human investment translates to the level of developmentalism, which has been associated with highly developed, hence highly energy-dependent, economies as well. The variables associated with social development, social inclusion, as well as life quality also have great explanatory power for the ENUS equation, with variables such as the number of people using the Internet (INTU) as well as the number of people using "safely managed sanitation" (SANT) suggesting the level of technological diffusion as well as infrastructure development associated with the same, both of which require significant energy usage as well. Life expectancy at birth (LEXP) further has been associated with the level of overall social-economic development, as well as living standards, which have been associated with high overall per capita energy usage as well. Of great significant is the fact that the Economic and Social Rights Performance Score (ESRP) has been associated with non-negligible explanatory power, suggesting that the level of institutionalism, social protection, as well as the realization of rights has great influence on the level of overall energy usage as well. Other variables associated with health changes, as well as demographic composition, such as the number of hospital beds per 1000 population (HBED), population 65 years or older (POP65), as well as "fertility rate" (FERT) have been associated with moderate, as well as significant, explanatory power as well, suggesting that the same have influenced the overall usage due to the associated infrastructure, as well as behavior, associated with healthcare, as well as population changes as well. In general, however, the results indicate that social development, labor market participation, demographics, and institutionality are fundamental determinants of per capita energy consumption. By analyzing from an ESG perspective, it can be observed that under Social, there not only exist equity or welfare considerations, but there is, in fact, a basic factor determining demand. The importance of incorporating Social indicators to policies related to Energy/Resources and Sustainability is thus underlined by this fact. See Table 15.
The model allows for a breakdown of the predicted energy use per capita (ENUS) at the level of each case, on an everyday basis, to 2.705. For each case, the difference between the predicted ENUS and the everyday basis is then decomposed into the marginal contribution of the Social (S) factors under the ESG approach. Negative coefficients indicate drivers of energy use per capita that reduce it beyond the everyday level. In contrast, positive coefficients signify drivers of increased energy use per capita. Across all five cases, this model shows that the predicted energy use per capita is consistently lower than on an everyday basis, indicating that the Social factors introduced into each case act jointly to suppress energy use per capita. Also, labor market conditions are a key determinant of ENUS. The labor force participation rate turns out to have significant adverse effects in most instances, most notably in Cases 1 and 2, where the effect is the second most prominent in absolute value. This indicates that lower workforce participation is associated with lower economic activity, lower industry output, and lower mobility, all of which contribute to lower energy demand. Unemployment, as a determinant, takes a prominent place, mainly negatively, although its effect fluctuates across cases. Demographic dynamics also help clarify further differences in ENUS. The level of net migration is found to have consistently negative coefficients, indicating that reductions in migration inflows or outflows are associated with lower energy use per capita, mainly because they suppress population growth. Fertility rates and the percentage of the population aged 65 or older also show significant coefficients, indicating that demographic structure contributes to energy demand. Variables related to social infrastructure and access to primary services have some of the most significant effects. The contribution of access to safely managed sanitation is particularly high in Case 1, indicating that inadequate investments in the sector are associated with lower ENUS. Upgrading this sector always entails significant investments in water treatment and distribution networks, which are the primary drivers of its high correlation with ENUS. On the other hand, the number of Internet users usually has a negative association, suggesting that less developed societies with low diffusion rates are associated with lower ENUS. Health and human development factors also matter. “Life expectancy at birth” and “hospital beds per 1,000 people” tend to have generally adverse effects, indicating that countries with less developed healthcare systems consume less energy. The “under-five mortality rate” has mixed but typically minor effects, suggesting that healthcare outcomes influence energy consumption primarily through broader development channels. Variables related to education further strengthen the link between societal development and energy consumption. Government expenditure on education, primary school enrollment, and educational equality has made significant contributions in many instances. In Case 5, the massive negative impacts of primary school enrollment clearly establish that countries with inefficient education systems have less economic complexity and productivity, in turn consuming less energy. Education is a harbinger of technological advancements in a region's economic structure, thereby enhancing energy consumption. Finally, the Economic and Social Rights Performance Score is generally a negatively contributing variable, suggesting that poorer-quality institutions and the lack of social rights protection are associated with lower outcomes in infrastructure development and energy consumption. Overall, the above analysis clearly shows that Social variables remain the primary drivers of energy consumption per capita. Better outcomes in labor, education, healthcare, and social infrastructure are closely related to the positive effects of energy consumption. Table 16.
The figure contains two panels that represent the performance and tuning of the K-Nearest Neighbors Regression model. Panel A contains a scatter diagram with the test values on the x-axis and the predicted values on the y-axis. Each point in the scatter diagram represents an observation from the test dataset, and the red line represents the 45-degree reference line, where the predicted values are always equal to the observed ones. The points are concentrated along the desired line, suggesting that the predictions match the values accurately. The fact that the points are not perfectly aligned along the reference line but are scattered, especially at the higher end, is expected for real datasets, as even the best model cannot perfectly predict values along the desired line due to residual prediction errors. The fact that the points do not systematically deviate from the reference line, however, indicates that the model does not exhibit bias toward the desired predictions. In panel B, the issue of model parameterization, or tuning, is handled by using the mean squared error (MSE) as a function of the number of nearest neighbors, k. Two curves are shown: the dotted curve represents the training data, and the solid curve represents the validation data. With the increase in k, the error in the train data monotonically increases, as expected from the prevalence of the smoothing effect from the addition of more and more neighbors. Initially, for small k, the models fit the training data closely, so the training error is tiny, but the risk of overfitting is very high. The error in the validation data initially decreases, reaches a minimum at k = 2 (marked by a red dot), and then steadily increases as k increases. This is, of course, the trade-off between bias and variance. When k is small, the models exhibit substantial variance and, consequently, high generalization error. As k becomes very large, the models become highly biased and consequently underfit. The minimum error on the validation data thus provides the optimal value of k. Overall, the two panels provide different but useful information: while panel A verifies the strong predictive power of the chosen KNN algorithm, panel B verifies the choice of k by showing how parameter tuning affects the generalization error. See Figure 4.
6. Institutional Drivers of Energy Use: Insights from ESG Governance Indicators and Multimethod Analysis
6.1. Governance Quality and Energy Use per Capita: Evidence from the ESG G-Pillar
This section examines the relationship between the Governance (G) dimension of the ESG framework and energy use per capita (ENUS) using a panel data model that incorporates key indicators of institutional quality, political stability, gender representation, and innovation capacity. The aim is to assess whether, and through which channels, improvements in governance—such as stronger rule of law, greater political stability, and more inclusive institutions—are associated with changes in energy consumption, interpreting ENUS as a proxy for economic scale, infrastructural maturity, and technological intensity rather than as a purely environmental outcome.
This series of empirical results can be logically ascribed to an ESG framework by focusing on the governance (G) perspective and formulating a fundamental research question: How does the quality of governance, the stability of politics, the strength of institutions, the number of female representatives in political institutions, and the national innovation capabilities interact and intersect with energy consumption per capita (ENUS)? Although the energy consumption per capita is a standard outcome variable in the environment domain, it is equally helpful as a good proxy for the general structural features of an economy, such as the size and type of economic activities, the level of infrastructure development, the extent of public services, and the overall technology intensity of financial activities and consumption patterns. From this perspective, energy consumption can be attributed to and influenced by the environment, economic development, institutional capabilities, and structural changes (Mukhtar, 2023). Including the governance variables is particularly important, as they significantly determine investment incentives, the effectiveness of regulation, long-term planning priorities, the efficiency of the public sector, and overall institutional credibility (Waseem et al., 2025). All of the above variables can be drivers or brakes on energy use, even if the outcome variable represents the overall energy consumption and various measures, such as emissions, efficiency, or shares of renewable energy. Good governance is a key force that can stimulate economic growth and provide the structural capacity to address the environmental implications of such development (Canh & Anh, 2025). Thus, the governance-energy nexus is a critical area of focus for ESG analysis, as it intersects with development, sustainability, and governance (Török, 2025). The empirical test uses an extensive, unbalanced macro-panel data set spanning 150 cross-sectional units (countries) and 2,583 observations in total. The minimum number of observations per time series is two, with a maximum of nineteen. As is familiar with cross-country governance data, this unbalanced format reflects better time-series coverage being available with elapsed time, as well as differences across indicators. The dependent variable, per capita energy use (ENUS), has a mean of roughly 2,325.8; however, its standard deviation is exceptionally high, at approximately 2,739.7. Again, this reflects substantial cross-section variation. Variance decomposition under random effects further supports this interpretation, revealing that the between variance (roughly 5.15 million) dwarfs the within-unit variance (approximately 144,294). Implications: This suggests that variation in per-capita energy use is driven by fundamental differences across countries rather than by varying levels within countries. This is absolutely critical to interpretation, as it suggests that differences in governance indicators can help shed light on fundamental differences between countries in per-capita levels of use and year-to-year variation within countries. Extremely high levels of per-capita energy consumption are functionally integral to development fundamentals, such that fundamental development trajectories, underlying infrastructure, industrial structure, or climatological circumstances, to take a few examples, all vary but very, very slowly over time (Bhattacharya & Yan, 2025). The results are presented for three estimators: random-effects GLS, fixed-effects (LSDV), and Weighted Least Squares (WLS). The choice of model is informed by the Hausman test, which plays a crucial role in panel data estimation. The Hausman test finds that the null hypothesis that the random effects estimator is consistent is to be rejected (Chi-square(4) = 43.98, p ≈ = 6.49e-09), which implies that the error term is not independent of the governance indicators because of the underlying presence of unobservable country-specific effects. From an intuitive perspective, this finding is not atypical because profound structural factors, including past institutional development, geographic features, natural resource deposits, and persistent economic structures, are intertwined with governance quality and patterns of energy consumption in any international community. Given that these unobservable effects are contemporaneously associated with governance quality indicators, random-effects estimates conflate the impact of good governance on improved energy consumption per capita across countries while abstracting from time-invariant characteristics (Alinsato et al., 2025). Evidently, from an ESG analysis appropriately interpreting the results on behalf of an investor, the fixed effects model is to be regarded as more valid because this model abstracts from every time-invariant characteristic in the target countries while seeking to establish whether changes in good governance impact changes in per capita patterns of energy consumption (Waseem et al., 2025; Canh & Anh, 2025). However, various diagnostic tests establish significant violations of classical panel data assumptions. The distribution-free Wald test on homoskedasticity is rejected, signifying strong evidence of heteroskedasticity across panels. Cross-sectional dependence tests using Pesaran’s approach are significant across all forms, suggesting that each country is exposed to global shocks and unobserved global variables, such as global business cycles, international energy price trends, technological spillovers, geophysical events, pandemics, or worldwide policy regimes (Bhattacharya & Yan, 2025). The Wooldridge test for autocorrelation of errors rejects the null of no first-order autocorrelation, suggesting that panels are contaminated by serial correlation. In contrast, normality tests for residuals are significant for all forms, rejecting the null hypothesis of normality. Taken together, these empirical findings suggest that standard errors could be biased without appropriate covariate adjustments, and thus, inference should be treated with due care. Though WLS correction mitigates heteroskedasticity to some extent, it does not necessarily correct for cross-sectional dependence or autocorrelation without specific models for these conditions. Without standard errors adjusted for heteroskedasticity, autocorrelation, and cross-sectional dependence with Driscoll-Kraay standard errors or appropriate clustering, it is safest to focus on directional information, relative sizes, and cross-estimator consistency rather than emphasizing specific levels of significance. Looking at the empirical findings, political stability and the absence of violence (PSAV) have positive and significant effects on energy intensity per capita using all three models. Despite differing magnitudes, the positive signs in all three models imply that greater political stability in countries is associated with higher per capita energy intensity. The positive effect of political stability can be explained by the fact that it provides an enabling environment for economic growth, industries, infrastructure development, and investment. Political instability undermines investors’ confidence in the economy, leading them to refrain from investing amid uncertainties in the country. However, from a governance perspective, the positive effect has no implications, as it only indicates that countries that experience growth due to political stability may also face environmental pressures when that growth translates into increased energy intensity. From an ESG perspective, environmental sustainability, by encouraging energy efficiency, would address ecological pressures associated with increased energy intensity. The share of parliamentary seats held by women (WPAR) has a negative and highly significant coefficient in all models. This means that a higher share of female seats in Parliament is associated with lower per-capita energy use, all else equal. There are several channels through which this result can be explained. First, there is the channel of policy preferences. Higher female representation in politics tends to be associated with a greater concern for social welfare, public goods, and risk aversion in the long run. This type of risk aversion may also include energy policies. Yet another channel might be related to institutional improvements. Higher female representation could be associated with improvements in institutional factors such as transparency, accountability, and governance that can lead to improvements in demand-side energy management. In the fixed-effects model, a negative sign indicates that, as the number of female seats in Parliament increases in a country, per-capita energy use declines slightly. This could be consistent with a move towards a less energy-intensive development path. The rule of law (RLAW) has a considerable, positive, and highly significant impact across all specifications. An improved rule of law leads to greater contract security, lower transaction costs, more secure property rights, and increased investment in capital-intensive industries such as manufacturing, real estate, and energy infrastructure. The positive correlation in political stability captures a size relationship: better institutions are conducive to more economic activity and, consequently, more consumption. From an ESG perspective, this finding underscores a fundamental policy trade-off arising from improved institutional building, which enhances both welfare and productive capability. Still, it may also lead to more adverse climate impacts, as highlighted by increased energy demand from a sustainability perspective, as discussed in Alinsato et al. (2025) and Waseem et al. (2025). At the same time, a strict rule of law is a prerequisite for an enabling environment for all these aspects through proper infrastructure development, carbon pricing, or environmental regulations, as discussed in Török (2025). Scientific and Technical Journal Articles (SCIA), used as a proxy for innovation power, enter with a small but positive and significant coefficient. Although the coefficient is small, it is due to the variable's large size. Countries with substantial scientific achievements would generally have more developed knowledge-intensive economies, broader R&D facilities, and technologically advanced sectors, all of which demand energy use (Canh & Anh, 2025). When considering the topic from the perspective of sustainable growth, innovation is a two-sided issue: it increases energy demand due to its scale, but also improves energy efficiency, enabling effective decarbonization. The dependent variable measures energy levels, not energy intensity or emission, so the positive relationship is mainly due to the size aspect of innovation-powered growth. On the whole, findings reflect a process of scale-throughput-structure enabling within governance that is positively correlated with scale and, consequently, with per capita energy demand, and more tempered use of energy linked to its representation through women’s parliamentary mandates. From an ESG perspective, the takeaway message is to focus not on a process where “better governance is associated with increasing energy use as a problem per se, but on better understanding how good or bad governance has impacted the management of development-related energy demand.” Within this frame of understanding, growth and stability that stem from good governance, scale, and innovation, while enabling fast growth, also open pathways to a reduced carbon future through optimization and efficiency of energy systems and grids (Waseem et al., 2025; Canh & Anh, 2025; Török, 2025). Table 17.
6.2. Identifying Governance–Energy Regimes Through Model-Based Clustering in the ESG Framework
This article provides an account of the clustering process used in this work to outline specific governance-energy regimes within the ESG approach, based on ESG factors and indicators. Employing a multi-criteria, normalized approach to alternative algorithm selection, this process determines that the clustering method that best balances statistical validity and interpretability is used for this work’s purpose and goals. Parallel approaches combining statistical modeling and ESG factors have been successfully used in recent sustainability studies to distinctly classify various governance and energy performance regimes (Ren et al., 2025). Applying this method to specific configurations of governance quality and systematically establishing existing associations between various institutional forms and variations in energy use per capita (ENUS), based on several metrics and comparison criteria, this work finds that the best-suited method is Model-Based clustering. While different methods don’t show superior performances across all criteria considered, this method is best at combining all of them, and this is particularly important for this work’s specific goals and aims, aiming to achieve not an optimization of a geometric criterion but to achieve and provide a defensible solution, as described in Saltık’s work of 2024. To begin with, Model-Based clustering significantly surpasses other models on the most basic evaluation standards for model quality and fit. It has reached the maximum normalized values for R², AIC, and BIC, which are essential for model assessment in terms of data explanation, while accounting for model complexity. Just as the probabilistic models used in global ESG regulatory research by Costantiello and Leogrande (2023), this model has a distinct advantage in terms of data explanation and stable model results, which are essential for models that do not rely solely on geometric principles for data representation. High R² values indicate that the model explains a significant portion of the data’s variability. At the same time, the model’s efficiency, as evidenced by the lowest AIC and BIC scores, demonstrates its ability to describe the data without unnecessary components. Model-based clustering is vital in ESG indicator taxonomies for data representation, as it helps distinguish data across categories (Sica et al., 2023). Such an application has demonstrated its importance in model-based data representations for distinguishing data across multiple categories based on their indicators. Second, it is clear that the Model-Based algorithm performs outstandingly on the Calinski-Harabasz index. This global metric evaluates the relationship between inter-cluster and within-cluster dispersion. The high value for this criterion indicates that the algorithm produces dense, globally distinct clusters, supporting the conclusion that it identifies intrinsic patterns within the dataset. This aligns with current research on energy governance, which shows that probabilistic or combined approaches are superior to deterministic algorithms for detecting structural patterns in ESG metrics (Ren et al., 2025; Saltık, 2024). However, it is recognized that Model-Based clustering is not the best-performing method when purely geometric and distance-based measures such as Silhouette, the Dunn Index, and Minimum separation are used. This, of course, is to be understood in context. These measures prefer models that produce spherical, easily separable clusters. Model-Based clustering, on the other hand, models the data-generating process using a mixture of probability distributions. This scenario is perhaps more accurate in practice, as overlapping and hard-to-separate data are common (Costantiello et al., 2025). Thus, slight scores in geometric separation may be far from optimal but reflect a different paradigm. On comparing the options, a trade-off emerges. Fuzzy C-Means is good at measures focusing on separation, like Pearson’s gamma and maximum diameter, but is statistically sub-optimal and does poorly on AIC and BIC. Density-Based approaches perform well on measures of concentration, such as the HH Index, but not on other parameters. K-Means, Hierarchical, and Random Forest-based approaches perform on average and do not perform better on any parameter worth considering. In conclusion, Model-Based clustering is the best all-around and most robust solution. While performances in terms of statistical measures, as well as overall cluster validity, greatly surpass those in terms of geometrical nearness, the preference for interpretability and statistical validity over efficiency and geometrical accuracy makes Model-Based clustering the optimal solution among the considered approaches. This aligns with new studies in the field of ESG that increasingly use model-based probabilistic approaches to integrate governance, environmental, and institutional variables in a replicable way (Sica et al., 2023; Costantiello et al., 2025). See Table 18.
Findings from Model-Based clustering indicate considerable variability in the G− component of the ESG framework on ENUS, which captures the effects of governance-related variables on energy consumption and institutional outcomes in a systematic and non-linear fashion (You et al. in 2024; Zhang et al. in 2025). By simultaneous ENUS analysis using variables such as Control of Corruption (CCOR), Political Stability and Absence of Violence (PSAV), Women’s Political Representation (WPAR), Regulatory Quality (RQUA), Rule of Law (RLAW), Scientific and Technical Journal Articles (SCIA), and Voice and Accountability (VACC), the clustering identifies governance institutional patterns, as opposed to the effect of respective variables (Ren et al. in 2025). Clusters 2, 5, and 7 in this case relate to governance-favorable environments and have a positive effect on ENUS; the effect is most positive for Cluster 7. This was found to be a parameter that has the highest scores in all ENUS and governance variables, namely CCOR, PSAV, RQUA, RLAW, and VACC, thus suggesting that in situations of high, multi-dimensional, and comprehensive governance in terms of institutions, stability, inclusiveness, and governance, the effect on energy consumption and sustainability is, in fact, positive and multiplicatively accentuated (Waseem et al. in 2025). The Model-Based analysis confirms that the interpretation of ENUS measurements indicates a positive effect from comprehensive institutional systems, whereas isolated governance variability does not produce the same effect (You et al., 2024). This is true for the next, fifth cluster as well, which bears the same indices and indicates a similarly positive effect on the governance and ENUS variables, but of a relatively lower order. Here, a high score on the indexes WPAR, RQUA, and SCIA indicates that gender equity, reasonable regulation, and scientific achievements, in this case, play a key enabling role in determining the outcome in the energy area (Zhang et al., 2025). This fifth cluster suggests that, while there may be a lack of comprehensive positive governance, isolated strengths in regulation and science can still ensure positive outcomes in the dynamic area of ENUS. The next, or second, in this case, shows a similar index and a positive effect on the ENUS area and is characterized by positive scores in most related indexes and in the ENUS area itself. Finally, the remaining, or Clusters 1, 3, 4, 6, and the eighth, lack positive effects in the governance and ENUS indexes. Cluster 1 signifies the fragility of governance, and its intense negativity in WPAR, RQUA, and RLAW correlates with inferior ENUS results, reflecting how the lack of institutions, lack of inclusiveness, and poor regulatory environments obstruct the ability to facilitate an efficient and sustainable energy infrastructure (Ren et al. 2025). Cluster 8 reaffirms this conclusion, showing abysmal scores across all governance factors and the worst ENUS performance, indicating a deficiency in overall governance quality. Clusters 3 and 4 indicate a more complex scenario, in which poor ENUS results are balanced by poor performance across all other dimensions, except Voice and Accountability (VACC), which are portrayed with positive scores. This indicates that, in the absence of well-functioning institutions, regulation, and the rule of law, democracy through Voice and Accountability does not suffice to promote energy sustainability (Waseem et al. 2025; You et al. 2024). The quality of governance, therefore, appears to be an altogether indispensable, complex, and multifaceted factor. The patterns of the last two, Cluster 9 and Cluster 10, indicate an imbalanced form of the G dimension. Cluster 9, in particular, reveals extremely high values for CCOR and poor performance on SCIA and VACC, reflecting an asymmetric, imbalanced, and disproportionate development of institutions (Zhao et al. 2025). Cluster 10, characterized by an extreme SCIA, indicates an ability to compensate, to some degree, for poor ENUS results through scientific infrastructure (Zhang et al. 2025). In general, the Model-Based clustering approach supports the conclusion that poor ENUS results, caused by the G dimension, correlate in their impact on ENUS in a systemic, not proportional, manner. The activation of all dimensions of sustainability, through proper, balanced, and focused governance, through the G dimension, allows, therefore, only in those cases to achieve an Eco-Efficient Sustainable Future through ESG, in accordance with Waseem et al. (2025), underlines sustainability through, and through only, all, and only all, dimensions of the quality of sustainability, as reaffirmed in Zhao et al. (2025). See Table 19.
Component analysis reveals particular profiles of governance and energy that clarify how specific patterns of institutional quality shape ENUS (You et al., 2024). In general, the data reveal that ENUS remains sensitive to proper integration between political stability, institutional capacity, inclusiveness, and knowledge capacity (Waseem et al., 2025). Components 2 and 7 indicate the most preferred governance integration, both having high positive ENUS indicators and high scores in Control of Corruption (CCOR), Political Stability (PSAV), Regulatory Quality (RQUA), and Rule of Law (RLAW). Component 7 appears as the best practice leader, maintaining high scores across all governance indicators and the highest positive ENUS score, which emphasizes that institutional growth with efficient regulation and accountability systems supports favorable energy outcomes (You et al., 2024; Waseem et al., 2025). Component 5 also scores high in ENUS, maintaining high scores in PSAV, RQUA, and RLAW, and achieving high scores in Voice and Accountability (VACC), suggesting that engagement supports positive outcomes in reduced energy use despite the lack of favorable science production outputs (Zhang et al., 2025). Whereas, the ENUS is negative for Components 1, 3, 4, 6, and 8, accompanied by poor governance indicators. For example, Component 1 reflects poor political stability, regulatory quality, and the rule of law, underscoring the significant influence of institutional instability on energy performance (Waseem et al., 2025). This is also confirmed by Component 8, which shows consistently negative indicators for governance and ENUS, thereby indicating a system-wide governance issue (You et al., 2024). Some components exhibit slightly asymmetric patterns. Significantly, Component 9 generates a strongly positive ENUS, irrespective of governance indicators, suggesting that a lack of institutional balance does not hamper energy performance but might remain systemically vulnerable in the long run. Likewise, for Component 10, ENUS is primarily driven by the SCIA index, which is strongly positive, indicating that technological performance can generate a substantial ENUS, even when accompanied by moderately positive indicators of governance across the system (Zhang et al., 2025). On the whole, the average for components indicates that inclusive, well-tuned governance frameworks drive positive ENUS performance. There might be isolated pockets of technological or institutional capability that lead to better energy efficiency, but sustainability depends on effective governance frameworks (Waseem et al., 2025; You et al., 2024; Zhang et al., 2025). See Table 20.
The figure presents a comprehensive view of the modeled clustering outcomes, integrating model selection, clustering representation, and interpretation in a single visual setting (Costantiello & Leogrande, 2023; Sica et al., 2023; Saraswati et al., 2024). The focus of the information in panel A is on determining the number of optimal clusters by showing the AIC, BIC, and the trace of the within-cluster sum of squares for varying numbers of clusters. The AIC and BIC curves exhibit a monotonically decreasing trend, indicating improved fits as the number of models increases. The minimum BIC suggests that the optimal solution is to identify 10 clusters, as the balancing theme of the respective models aims to incorporate both explanation and simplicity. This implies a complex data configuration that does not correspond to a simplified view of a limited number of homogeneous subsets, which is in line with the recent literature on ESG-based clustering, which emphasizes the multidimensional character of institutional and sustainability metrics (Costantiello & Leogrande, 2023). Panel B shows a two-dimensional representation of the clustered data points, colored by their cluster. This representation indicates that overlaps among the clusters exist, as well as areas of relatively higher density. This observation is not unusual in model-based clustering, as identified in this research, where clustering occurs around probabilistic distributions rather than geometric boundaries. This overlap does not necessarily indicate poor model performance. Instead, it points to the reasonable assumption that the institutional and energy-related profiles may share common attributes, as was also observed in previous research on the ESG taxonomy and indicators (Sica et al., 2023). The presence of a few labeled data points indicates outliers, but they do not affect the mixture distributions. In Panel C, the most informative interpretation is to show the average values of ENUS and the governance variables for each cluster. The output indicates that significant heterogeneity exists in governance/energy profiles. On one hand, some clusters have positive average scores in ENUS, control of corruption, political stability, regulatory quality, rule of law, and voice and accountability. These scores indicate that institutional environments exist in which high-quality governance is associated with good ENUS scores. On the other hand, some clusters have negative average scores across all those variables, suggesting that those institutional environments are fragile, with poor ENUS scores coexisting with poor governance. In addition, some clusters have asymmetric profiles, in which observations tend to be extreme on particular variables, such as science output and rule of law (Saraswati et al., 2024). Overall, the three figures demonstrate the merits of the model-based clustering approach. The approach allows for both the determination of several clusters supported by statistical theory and the discovery of underlying complex regimes discernible at the institutional level. The graph confirms the conditional nature of the relationship between governance and ENUS, bolstering the argument that energy outcomes result instead from systematic combinations of political, institutional, and knowledge-based factors, rather than single governance traits (Costantiello & Leogrande, 2023; Sica et al., 2023; Saraswati et al., 2024). Figure 5.
6.3. Machine Learning Evaluation of Governance Drivers of Energy Use per Capita
This report examines the use of Machine Learning approaches in the Governance (G) area of the ESG paradigm to determine the most effective method for explaining and accurately forecasting per-capita energy use (Seow, 2025). By systematically examining a range of approaches using error measures and explanatory power, this report will explore the predictive validity of these models and the interactions among variables in the area of governance (Dipierro et al., 2025). This report will rely on three key approaches: identifying the best algorithm, assessing variable significance, and interpreting predictive models using additive models. Based on the normalized results, the K-Nearest Neighbors algorithm is found to be the best overall option. This is because a combined analysis of all the above metrics is made, taking into consideration those metrics for which lower values are desirable, in addition to the fact that the R² metric, for which higher values are desirable, also has to be simultaneously optimized. Normalization allows for comparison among all metrics, since they all share a common range, thereby allowing for all metrics to be easily judged in terms of a relative ranking, ranging from 0 for the worst-performing algorithm among those compared in the experiment to 1, for the best-performing one (Thongsanitkarn & Sugunnasil, 2025). KNN has scored a maximum for MSE, MSE scaled, MAPE, and R², in addition to achieving a maximum or near maximum score for RMSE, MAE, or MAD. This further confirms the fact that the algorithm is one of the best in terms of effectively minimizing average errors in addition to effectively minimizing errors in the form of squares, alongside a supreme ability to establish effective explanations for variations in the given data. Also, the fact that the algorithm scored a maximum for R², with a resultant value being 1, confirms the fact that KNN is the best-performing algorithm in relating features or variables, since KNN outperforms all other algorithms, including linear algorithms, in addition to the fact that it is also better than algorithms such as Boosting and Support Vector Machine (SVM) (Seow, 2025). Random Forest is the nearest rival. It performs very well concerning RMSE, MAE/MAD, and MAPE, with normalized values regularly above 0.95, and it has a high R² value. At the same time, it is slightly less stable compared to KNN concerning MSE and MSE(scaled), where KNN has a remarkable lead. This suggests that, despite being very accurate, Random Forest can be slightly more volatile regarding square-error performance, possibly because of its increased complexity, which combines several decision trees (Dipierro et al., 2025). The other algorithms have more obvious shortcomings. Decision Trees are robust on both MAE and MAPE metrics but are weaker on R2 and squared-error-based metrics. On the other hand, the Boosting algorithm has mediocre performance on all metrics but does not outperform any particular other metric. Linear Regression and Regularized Linear algorithms have normalized values that are generally lower and therefore lack flexibility in handling the nonlinear relationship between the two variables. Lastly, the performance of the Support Vector Machine algorithm on all metrics tends towards zero (Thongsanitkarn & Sugunnasil, 2025). In a nutshell, owing to its outstanding performance on all evaluation criteria as well as well-distributed error rates, the best algorithm among the ones examined has been determined to be the KNN algorithm (Seow, 2025; Dipierro et al., 2025; Thongsanitkarn & Sugunnasil, 2025). See Table 21.
These findings represent the model importance scores obtained from the KNN model with a mean dropout loss function, where higher scores indicate greater importance, as their absence would lead to significantly reduced model accuracy (Kim & Lee, 2025). The findings clearly show that RQUA is the most crucial feature, with an importance score of 3.09E+09, indicating that the KNN model is highly dependent on this feature to infer local information and compute pairwise distances between observations. The second-most important feature is VACC, with an importance score of 2.90E+09, and its high importance indicates that this feature is of equal significance to the RQUA feature and could work together to improve model predictions and accuracy (Fabijańska et al., 2025). Both RLAW and CCOR have moderate importance levels at 2.36E+09 and 2.02E+09, respectively. Although still important, their importance is not as high as that of the following two most important variables, suggesting that their loss would not significantly affect model accuracy, possibly because of correlations among some features. Both WPAR and PSAV share very close levels of importance, at about 1.9E+09, suggesting moderate, but not trivial, importance, as these both seem to play an augmenting, rather than a definitional, role in model accuracy. Finally, SCIA has been determined to have the lowest level of importance, at 1.10E+09. This, again not being a trivial level, suggests that model accuracy would not be significantly reduced in the absence of SCIA, according to the KNN algorithm, as stated by Pence et al. in 2024. Overall, the importance value distribution suggests that the KNN model is heavily influenced by a small set of principal variables, led by RQUA and VACC. In contrast, the impact of the other variables tends to become smaller cumulatively. Such a description proves highly helpful for explaining the model’s processes as well as for selecting variables or reducing dimensionality, thus confirming previous studies that governance and accountability variables have overriding importance for the interpretable machine learning models based upon environmentally/socially responsible governance (Kim & Lee, 2025; Fabijańska et al., 2025; Pence et al., 2024). See Table 22.
The given data are additive explanations of the predictions generated by k-nearest neighbors (KNN) models on an ESG paradigm, aiming to forecast the Energy Use (per capita), ENUS, based on the Governance dimension. The "Base value" in this context, 2323.932, may be understood as the average per-capita energy use in the test dataset. For each observation, the "Predicted value" is calculated as the sum of the contributions of each Governance-dimension variable to the base value. The observation that all predicted values are significantly lower than the base suggests that, given the observed cases, their respective governance patterns are, on average, linked to lower per-capita energy usage than the test dataset (Drago et al., 2025). One major factor responsible for this correction is the Rule of Law (RLAW). In all cases, RLAW shows strong negative contributions, obtaining a lowest value of -1335.482 in case 3. The fact that this factor encompasses weaknesses in contract-enforcing institutions, property rights, or a lack of trust in the judicial system, and that it thus has a strong correlation with low per-capita energy consumption, can be inferred from its adverse effect. Furthermore, Control of Corruption (CCOR) shows negative contributions across all cases, suggesting that high levels of perceived corruption are associated with lower estimated energy consumption. Energy markets can be distorted by bribery, while financial inflows to build energy-related assets, along with access to modern fuels, can be hampered, thereby aligning with this observed effect (Mahmood et al., 2021). Equally, Voice and Accountability (VACC) makes significant negative contributions, suggesting that lack of civic engagement, lack of freedom of speech, and lack of accountability in governance correlate with lower levels of energy use per capita, which could be linked to weaker demand patterns and/or less economic development (Costantiello & Leogrande, 2024). On the positive side, Regulatory Quality (RQUA) appears as the driving variable. The strength of its contribution grows with the cases, surpassing 600 in cases 4 and 5. Regulatory quality can be defined as the capacity of the government to design and implement sound policies and regulations that support private-sector development (Costantiello & Leogrande, 2024; Drago et al., 2025). As an enabler of energy production, distribution, and access, it compensates for the adverse effects arising from deficiencies in other aspects of governance (Costantiello & Leogrande, 2024). Political Stability and Absence of Violence (PSAV) has mixed but relatively modest effects, negative in some instances and slightly positive in others. These findings suggest that political stability remains a secondary yet significant factor, with stable governance conditions facilitating energy infrastructure and consumption to a lesser degree than institution building and regulatory capacity. The Proportion of seats held by women in parliament (WPAR) provides relatively modest yet generally negative contributions, which suggest that, in terms of this model or data set, women's participation in governance institutions does not have immediate effects on per capita energy consumption or may have an indirect impact that is otherwise captured in terms of governance. Scientific and Technical Journal Articles (SCIA), as proxy measures for innovation or knowledge creation, yield limited yet negative contributions that suggest that science or innovation contributions are not immediately associated or correlated with increased per capita energy consumption in instances in which governance limitations are predominant factors in the model's perspective or interpretation (Drago et al., 2025). In general, additive explanations suggest that core governance institutions drive ENUS in this ESG-focused approach. A lack of strength in the rule of law, control of corruption, and accountability exerts a strongly negative influence on per-capita energy consumption, which a high-quality regulatory framework can offset. This explanation confirms that good governance is fundamental to understanding energy consumption trends through a sustainability lens (Mahmood et al., 2021; Costantiello & Leogrande, 2024; Drago et al., 2025). See Table 23.
Panel A (Predictive Performance Plot) shows the correlation between actual ENUS values in the test data and the corresponding KNN model predictions. The strong data clustering around the 45-degree line indicates high predictive accuracy and excellent model performance. The data points are close to the line, indicating excellent model performance in identifying nonlinear associations between ESG governance factors and ENUS. The data points are not highly dispersed around the line, reflecting low prediction error variability even in the high ENUS zone. Such results are highly significant in ESG analysis, where institutional variations and governance asymmetry are often associated with nonlinear effects of energy consumption patterns that are inadequately modeled through linear predictive techniques. Panel B (Mean Squared Error Plot) focuses on model parameterization and robustness of the KNN model through the Mean Squared Error (MSE) measure for both the model’s training and validation data sets for various numbers (k) of nearest neighbors. The validation curve reaches its minimum at a small k (indicated by the red spot), indicating appropriate model parameterization. It clearly demonstrates a sound compromise between model biases and variances, capable of reflecting similarities in local governance patterns without introducing noise. Beyond a certain level of k, the validation error increases gradually, reflecting model underfitting through excessive blurring of local governance patterns. Both graphs provide decisive evidence for KNN as an appropriate predictive tool before additive decomposition of ENUS along its key governance drivers. Figure 6.
7. Energy Use per Capita as an Environmental ESG Nexus: Evidence from Multimethod Analysis
The current research provides a holistic, multidimensional perspective on the relationships involving per capita energy use (ENUS) in the Environmental (E) dimension of ESG, reflecting the intricate linkages among energy use, environmental pressures, and sustainability performance (Magaletti et al., 2025). Through the integration of approaches that involve panel econometrics, clustering, and ML, the research can identify not only the structural but also the situational factors that govern global trends in energy use, thus paving the way for novel contributions to the existing body of knowledge on the link that connects energy and the environment (Gattone et al., 2025). The results from the panel data reveal that ENUS is positively associated with environmental pressure measures—CO₂ emissions (CO2P), energy intensity (ENIN), and, along with fresh water withdrawal activity (AFWW)—echoing the intuitive idea that increased energy use translates to increased environmental stress (Costantiello et al., 2025). Conversely, measures such as renewable energy use (RENC) and forest area/coverage (FRST) show negative correlations, indicating that “clean” energy systems and abundant natural assets counter environmental pressures generated by energy use (Gattone et al., 2025). It is pertinent to highlight that Access to Electricity (ACEL) remains positively significant to ENUS in many respects, thus highlighting in an objective way that in fact, through ESG trade-offs, increased modern energy availability for human welfare contributes to enhanced development outcomes in terms of improved human well-being but effectively increases associated energy consumption rates along with likely environmental emissions (Magaletti et al., 2025). In sum, regression analysis confirms that energy use is not a neutral economic signal, as argued, but rather a key player in the environment, as it is influenced by energy efficiency, resource intensity, and institutional conditions. The cluster analysis, as a complementary piece of evidence, identifies 10 distinct environments that link ENUS to emissions, pollution, and resource-use patterns. For regions with high ENUS values, there are energy- and emission-intensive environments marked by high levels of CO₂, methane, air pollution (PM2.5), as well as climate stress patterns defined by Land Surface Temperature (LST) and Heat Index (>35°C), which reflect conditions associated with unsustainable energy systems, as outlined by Costantiello et al. (2025). By contrast, regions categorized into the low-ENUS clusters are diverse, portraying sustainable environments with supportive levels of RE and FC, as well as environments with limited energy access and persistent levels of climate stress, specifically in developing regions, as outlined by Gattone et al. (2025). This clustering clearly underscores that low energy use levels are not identical to sustainable environments by default; on the contrary, high energy use levels do not point to(environmental) failure, as performance is context-dependent on energy mix, technology, and governance capacity, as outlined by Magaletti et al. (2025). These clusters identify specific sets of ESG-Energy typologies, defined by patterns of energy use, emissions, and environments in which energy demand processes follow particular paths. The machine learning test, particularly about the KNN algorithm, further validates non-linear associations with ESG variables. Notably, KNN performs better than any other algorithm, suggesting that ENUS patterns are more closely aligned with similarity within ESG variables than with global principles (Gattone et al., 2025). Dropout loss function analysis reveals that carbon emissions (CO₂), waste generation (WSTR), energy efficiency (GEFF), and water withdrawal are key drivers of ENUS's energy consumption patterns, reinforcing emissions and resource intensity as key drivers of ENUS. Climate variables are again significant due to associations with temperature stress and energy consumption feedback loops. The integration of these empirical dimensions shows that ENUS is, at the same time, an "indicator variable" and a driver of environmental sustainability. Countries with optimized energy resources and high renewable penetration maintain moderate ENUS levels at low environmental costs. At the same time, those relying on fossil fuels exhibit high energy use and other environmental impacts. The results illustrate how energy use must be considered in a broader ESG context, in which the Environmental factor encompasses resource efficiency, emissions reduction, and equity in access (Magaletti et al., 2025; Gattone et al., 2025; Costantiello et al., 2025). In terms of policy, the above findings promote differentiated ESG-focused energy policies. In high-energy countries, decarbonization and efficiency gains must be achieved through sustainable finance approaches; in low-energy countries, an equitable distribution of energy must be achieved through clean technology applications. By identifying structural and contextual regimes, this study underscores that ESG-focused energy policies must be supported by alignment between environmental performance and the dynamic use patterns of energy itself (Gattone et al., 2025). See Table 24.
8. Policy Implications of Energy Use within an Integrated ESG Framework
This research's conclusions provide an important application of a comprehensive policy approach that integrates energy demand into the overall Environmental, Social, and Governance (ESG) paradigm. Indeed, empirical research shows that energy use per capita (ENUS) is influenced by multifaceted, integrated, and combined drivers of environmental efficiencies, social development, and institutional quality. As such, instead of being limited to specific sources, as in "siloed policies," policymakers now need to address overall consistency among the three pillars of ESG issues, as reported by Abdelkawy and Al Shammre in 2025 and by Thapa et al. in 2025. Only in this case is a successful "energy transition toward sustainability possible by simultaneously pursuing environmental integrity, social inclusion, and good governance, as reported by Ren et al. in 2025. From an ecological sustainability perspective, factors such as CO₂ emissions (CO2P), energy intensity (ENIN), fossil fuels (FOSS), and water withdrawal (AFWW) have the greatest impact on energy consumption. What this means is that the post-2025 global economy still relies heavily on energy and carbon sources, and that the challenges of decarbonization include reducing these reliance patterns (He et al., 2025; Taghizadeh-Hesary & Rasoulinezhad, 2025). Energy efficiency should be enhanced through technology and financial support, alongside industrialization and technological advancement. Supporting the consumption of renewable energy sources (RENC), the generation of electricity from renewables (RELE), and interaction to protect forested regions (FRST) could counterbalance the effects of energy expansion on the ecosystem. Evidence emphasizes the interconnectedness of natural systems, stating that excessive withdrawal of freshwater resources and increased land surface temperatures increase the burden on resources linked to energy consumption (Ren et al., 2025). Thus, indicators show that economic strategies to protect the planet should address the water-energy-land interlinkages, avoiding actions to obstruct advancement on another front. Climate-resilient strategies to address demand variations for cooling and heating (HDD, CDD, HI35) should be included to support further energy sustainability in the face of global warming challenges (Akadiri & Özkan, 2025). The social component of the outcomes shows that energy use is intricately linked to human development and well-being. Electricity access (ACEL) and clean fuels for cooking (ACFT) both have a significant positive effect on ENUS, suggesting that social development and advancement are mutually inclusive of higher demands for energy use. Yet, this correlation need not be harmful to the environment and climate, and this should inform new approaches to energy access that are grounded in and focused on clean, efficient, and decentralized models of energy development and deployment (Taghizadeh-Hesary & Rasoulinezhad, 2025). Education expansion (GEE) and internet use and accessibility (INTU) enhance this social capacity to pursue more sustainable energy solutions and practices (Yip, 2025). Likewise, increased life expectancy (LEXP) and improvements to environmental health through better and more functional sanitation systems and initiatives (SANT) are also associated with increased demands for energy use, suggesting that expanding benefits and growth through various forms of welfare and development must be reconciled through new advances and improvements to energy efficiency and accessibility. Unemployment (UNEM) and energy use also show a positive correlation, confirming that economic activity and energy demand are intrinsically linked and should inform new approaches to monetary policy that support green growth and development principles and practices (Thapa et al., 2025). Governance becomes a systemically relevant driver in realizing a positive outcome from increased energy consumption, whether sustainability or environmental deterioration. “Regulatory quality (RQUA), Rule of law (RLAW), and Control of corruption (CCOR) are demonstrably associated with efficient energy use, reduced pollutions, and effective energy systems,” Abdelkawy & Al Shammri (2025) state. “There is a positive relationship found between Political stability (PSAV) countries, which are stable and transparent, to attract long-term investments for low-carbon infrastructure.” At the same time, “Voice & Accountability (VACC) is a critical driver in developing a sustainable, participatory culture for sustainability policies,” according to Ren et al. (2025) research. “Enhanced research and technological innovation (SCIA) in developing countries would not only increase the overall global knowledge stock but also improve long-term adaptation capabilities for energy transition governance,” according to research conducted by He et al. (2025). In conclusion, energy consumption is both a driver and a signal of ESG performance. This means that environmental policies must focus on a strategy that reduces and decouples the relationship between energy consumption, greenhouse gas emissions, and resource depletion; social policies must pursue a policy that is both equity- and efficiency-focused; while governance policies must include a strategy that promotes transparency, accountability, and regulatory consistency (Yip, 2025). The best approach here would be a strategy that sufficiently investigates all three aspects from a broader ESG policy perspective. Governments must pursue a strategy that monitors ESG interplays influencing the impact of energy consumption and greenhouse gas emissions over time (Thapa et al., 2025). Also, there is a need for international cooperation towards an ESG standards harmonization strategy, which was reflected in a global strategy promoting "sustainable finance and technology cooperation" through technology transfer (Akadiri & Özkan, 2025; Taghizadeh-Hesary & Rasoulinezhad, 2025). The best strategy, as a final implication, would be a policy that aligns energy policies through an ESG strategy that secures a truly environmentally sound, socially inclusive, and resilient strategy that secures long-run sustainability amidst a new era characterized by an increasingly dependent relationship on energy resources generally, as suggested by Ren et al. (2025).
9. Conclusions
This research work constitutes an original, all-encompassing contribution to the existing body of energy economics and sustainability literature by identifying energy per capita (ENUS) as a fundamental outcome variable within the framework of the Environmental, Social, and Governance (ESG) model. As opposed to the mainstream literature, which either focuses solely on the economic aspects of energy consumption or assesses the relationship between ESG variables separately, this article proposes a comprehensive framework for the examination of energy consumption as a result of the interaction between the indicated model’s pillars: the environment, social development, and the quality of governance. The originality of this work lies in the fact that, contrary to the common assumption that the use of energy per capita (ENUS) could be regarded solely as a proxy for economic activity or energy consumption as a deterministic cause-and-effect mechanism for greenhouse gas emissions, ENUS could be considered as a systemic, integral variable of the ESG framework model. ENUS, consequently, can be alternatively perceived as a driver, an outcome, or a signal for the overall performance level of sustainability as related to consumption activity, as this study gathers all the pillars encompassing the ESG framework model, thus transcending the boundaries of silo-based analyses related to the concepts of energy transition, consumption, or change processes associated with the general topic of sustainability. Second, in terms of contributions, the article is significant methodologically, insofar as it integrates panel data econometrics, unsupervised cluster analysis, and regression models developed in the machine learning paradigm as a unique research design. The research uses fixed-, random-, and weighted-least-squares panel models to identify consistent structural links between ESG variables and ENUS values, net of country-specific differences. The application of cluster analysis helps identify ESG-energy regimes, in which levels of energy consumption across different regimes are assessed to determine how similar levels of energy use may reflect somewhat different values in ESG and ENUS categories overall. Finally, the research applies regression models developed in the machine learning paradigm, specifically the K-Nearest Neighbors algorithm, to identify non-linear similarity structures not captured by traditional regression models. The dropout loss function is also used in research to ensure predictive validity is accompanied by interpretive validity, thereby overcoming potential criticisms of being a "black box"—a common critique of traditional machine learning models. Based on the Environmental (E) school of thought, the findings clearly reveal significant ENUS drivers, including emissions intensity, energy efficiency, resource use, and environmental stress factors. Panel regressions reveal that increased CO2 and GHG emissions, water withdrawal, waste production, and energy intensity are systematically related to ENUS. Cluster estimates tend to support these findings by indicating high-energy regimes with high emissions and pollution levels, and low-energy regimes with either strong natural assets or structural factors. Machine learning estimates clearly support the notion that environmental factors—primarily emissions and energy efficiency—rank as the most significant ENUS drivers. From a Social (S) perspective, this analysis shows a close nexus among human development, welfare, and energy consumption. Variables such as electricity access, clean fuels, education, health, and standard of living are positively related to ENUS, underscoring that with every advance in human development, there is an increased demand for energy. It is, however, not implied by this result that increased demand for energy, which is socially driven, is unsustainable. The implication, instead, is that whether socially driven energy demand is sustainable depends entirely on its context. Thus, from a Governance (G) perspective, higher-quality institutions have a vital, moderating, and enabling effect on both energy and ESG variables. Superior regulatory quality, stronger performance criteria for the rule of law, better control of corruption, greater political stability, and greater innovation capacity positively impact more efficient, less environmentally intensive energy use. The governance variables are not mere offsetters or enhancers of ENUS. The impact mechanism operates through interaction forces and structural mediation rather than straightforward linear effects, as revealed by machine learning analyses. Taken cumulatively, energy consumption per capita is better represented as a nexus variable in the ESG system rather than as a standalone indicator. Pressures for environmental preservation, social development, and governance quality simultaneously impact energy consumption patterns, and these phenomena cannot be unpicked together without sacrificing valuable information. A blend of econometric, clustering, and machine learning techniques is critical to both approaches. From a policy analysis perspective, this means that ESG-driven energy-sector policies should be differentiated and tailored to specific regimes. For high-energy countries, strategies should focus on decarbonization, efficiency enhancement, and institutional support. In contrast, for countries labeled as low-energy, the emphasis should be on achieving equal energy access through clean, decentralized energy solutions. Therefore, there is no common approach to energy sector transformation. To sum up, this paper makes contributions to both ESG and energy research by showing that energy consumption is both a cause and a consequence of ESG performance and that a multidimensional, data-driven approach is imperative to this end. With its ESG unification of panel econometrics, machine learning, and clustering methods, this research offers solid findings and an adequate toolkit for researchers engaged in developing a sustainable, inclusive, and institution-friendly approach to energy transitions.
List of Acronyms

Table 25.
List of Acronyms.
| Variables | Acronym | ESG |
| Energy use (per capita) | ENUS | y |
| Access to clean fuels and technologies for cooking | ACFT | E-Environment |
| Access to electricity | ACEL | |
| Adjusted savings: natural resources depletion | ASNR | |
| Adjusted savings: net forest depletion | ASFD | |
| Agricultural land | AGRL | |
| Agriculture, forestry, and fishing value added | AFFV | |
| Annual freshwater withdrawals | AFWW | |
| CO₂ emissions (per capita) | CO2P | |
| Cooling Degree Days | CDD | |
| Electricity production from coal | ELCO | |
| Energy imports, net | ENIM | |
| Energy intensity of primary energy | ENIN | |
| Forest area | FRST | |
| Fossil fuel energy consumption | FOSS | |
| GHG emissions/removals (LUCF) | GEFF | |
| Heat Index 35 | HI35 | |
| Heating Degree Days | HDD | |
| Land Surface Temperature | LST | |
| Level of water stress | WSTR | |
| Methane emissions (per capita) | CH4P | |
| Nitrous oxide emissions (per capita) | N2OP | |
| PM2.5 air pollution exposure | PM25 | |
| Renewable electricity output | RELE | |
| Renewable energy consumption | RENC | |
| Standardised Precipitation–Evapotranspiration Index | SPEI | |
| Tree cover loss | TCL | |
| Economic and Social Rights Performance Score | ESRP | S-Social |
| Fertility rate | FERT | |
| Food production index | FDPI | |
| GDP growth | GDPG | |
| Government expenditure on education | GEE | |
| Hospital beds | HBED | |
| Individuals using the Internet | INTU | |
| Labor force participation rate | LFPR | |
| Life expectancy at birth | LEXP | |
| Mortality rate, under-5 | U5MR | |
| Net migration | NMIG | |
| People using safely managed sanitation | SANT | |
| Population ages 65 and above | POP65 | |
| Population density | POPD | |
| Prevalence of overweight | OVWT | |
| Prevalence of undernourishment | UNDR | |
| Ratio female to male labor participation | FLMR | |
| School enrollment, primary | PRIM | |
| School enrollment gender parity index | SGPI | |
| Unemployment rate | UNEM | |
| Control of Corruption | CCOR | G-Governance |
| Political Stability and Absence of Violence | PSAV | |
| Proportion of seats held by women | WPAR | |
| Regulatory Quality | RQUA | |
| Rule of Law | RLAW | |
| Scientific & technical journal articles | SCIA | |
| Voice and Accountability | VACC |
References
- Abbas, N.; Hassan, M.; Shaheen, W. A. Sustainability in action: an examination of human capital, green finance, green growth, and environmental taxation on load capacity factors. Journal of Climate and Community Development 2025, 4(1), 91–104. [Google Scholar]
- Abdelkawy, N. A.; Al Shammre, A. S. A Tailored ESG Framework for Economic Growth in Saudi Arabia: ARDL Evidence from 1990 to 2022. Sustainability 2025, 17(12), 5273. [Google Scholar] [CrossRef]
- Adedokun, I. A. Environmental, social, and governance (ESG) metrics and Nigeria’s energy transition: Towards legal integration in the oil and gas sector. Journal of Sustainable Development Law and Policy 2026, 17(1), 139–169. [Google Scholar] [CrossRef]
- Affonso, T. THE ESG AGENDA IN THE OIL AND GAS INDUSTRY. Journal for Sustainable Development Law & Policy 2025, 16(3). [Google Scholar]
- Afzal, M. A.; Rahman, S. U.; Aslam, M. T. Mapping the Nexus of Sustainability, Innovation, and Renewable Energy: A Bibliometric Analysis of Green Technology Research. The Critical Review of Social Sciences Studies 2025, 3(2), 1176–1200. [Google Scholar] [CrossRef]
- Akadiri, S. S.; Özkan, O. (2025). Navigating uncertainty: the impact of ESG factors on clean energy markets and investment dynamics. Corporate Social Responsibility and Environmental Management.
- Alinsato, A. S.; Dossou, T. A. M.; Dossou, P. K. N.; Kambaye, E.; Asongu, S. A. The financial development and renewable energy consumption nexus in Africa: Does the quality of governance matter? In Natural Resources Forum; Blackwell Publishing Ltd: Oxford, UK, August 2025; Vol. 49, No. 3, pp. 2845–2868. [Google Scholar]
- Aljohani, A. A decision-support framework for evaluating AI-enabled ESG strategies in the context of sustainable manufacturing systems. Scientific Reports 2025, 15(1), 23864. [Google Scholar] [CrossRef]
- Alkhalifa, F. A. Assessing the predictive power of LEED certification on ESG performance: Limitations and implications for holistic sustainability measurement. Sustainable Development 2025, 33(5), 7459–7473. [Google Scholar] [CrossRef]
- Almeida, F. P. S.; Castelli, M.; Côrte-Real, N. Leveraging Feature Sets and Machine Learning for Enhanced Energy Load Prediction: A Comparative Analysis. 2024. [Google Scholar]
- ASLAN-ÇETİN, F.; Öztürk, S.; Akarsu, O. N. The Effect of ESG Data of Companies on Financial Performance: A Panel Data Analysis on The BIST Sustainability Index. Sosyoekonomi 2024, 32. [Google Scholar] [CrossRef]
- Avinash, G.; Pachori, H.; Sharma, A.; Mishra, S. Time series forecasting of bed occupancy in mental health facilities in India using machine learning. Scientific Reports 2025, 15(1), 2686. [Google Scholar] [CrossRef]
- Bagadeem, S. Impact of macroeconomic and sustainability practices on carbon emissions performance. Discover Sustainability 2025, 6(1), 992. [Google Scholar] [CrossRef]
- Bekele, M.; Sassi, M.; Jemal, K.; Ahmed, B. The dynamic linkage between renewable energy consumption and environmental sustainability in Sub-Saharan African countries: Heterogeneous macro-panel data analysis. Cogent Economics & Finance 2024, 12(1), 2285188. [Google Scholar]
- Bhattacharya, M.; Yan, E. Press freedom and stringency measures: the role of energy consumption during COVID-19 lockdowns. Empirical Economics 2025, 1–33. [Google Scholar] [CrossRef]
- Brożek, J.; Kożuch, A.; Wieruszewski, M.; Ankudo-Jankowska, A.; Adamowicz, K. Environmental, Social, and Governance (ESG) Clustering of EU Forest Policies in the Context of the 2030 New Forest Strategy. Sustainability 2025, 17(17), 7925. [Google Scholar] [CrossRef]
- Burinskienė, A.; Grybaite, V.; Lapinskiene, G. The link between ESG factors and corporate profitability: Evidence from resource-intensive industries in Europe and the USA. Sustainability 2025, 17(23), 10714. [Google Scholar] [CrossRef]
- Canh, L. Q.; Anh, D. T. H. Renewable energy policy, renewable energy consumption and economic growth: The moderating role of governance quality. Asian Economic and Financial Review 2025, 15(8), 1276–1289. [Google Scholar] [CrossRef]
- Cemek, B.; Kültürel, Y.; Cemek, E.; Küçüktopçu, E.; Simsek, H. Modeling Soil Temperature with Fuzzy Logic and Supervised Learning Methods. Applied Sciences 2025, 15(11), 6319. [Google Scholar] [CrossRef]
- Chen, P.-F.; Chen, M.-P. Do country sustainability practices matter to happiness? Economic Modelling 2025, 152, 107277. [Google Scholar] [CrossRef]
- Christine, A. F.; Hakam, D. F.; Nainggolan, Y. A.; Wiryono, S. K.; Hakam, L. I. Environmental, social, and governance (ESG) impact on corporate financial strategy of energy and utilities companies worldwide. Energy Strategy Reviews 2025, 62, 101916. [Google Scholar] [CrossRef]
- Costantiello, A.; Leogrande, A. The Regulatory Quality and ESG Model at World Level. 2023. [Google Scholar]
- Costantiello, A.; Laureti, L.; Quarto, A.; Leogrande, A. Methane Emissions in the ESG Framework at the World Level. Methane 2025, 4(1), 3. [Google Scholar] [CrossRef]
- Costanzo, M. R.; Ingenito, S.; Matarazzo, A.; Scuderi, A.; Guagliardi, G.; Lapiana, A. From organic waste to agricultural fertilizer: A measurement of the level of circularity and an assessment of economic feasibility. Environmental Engineering and Management Journal 2025, 24(10), 2181–2193. [Google Scholar] [CrossRef]
- Davidescu, A. A.; Agafiței, M. D.; Gheorghe, M.; Strat, V. A. A Machine Learning and Econometric Framework for Credibility-Aware AI Adoption Measurement and Macroeconomic Impact Assessment in the Energy Sector. Mathematics 2025, 13(19), 3075. [Google Scholar] [CrossRef]
- de Dieu Hagenimana, J.; Sumbiri, D. Benchmarking Machine Learning Models for Landslide Susceptibility: A Study in the Ngororero Sector. Journal of Information and Technology 2025, 5(1), 16–24. [Google Scholar] [CrossRef]
- Dey, A.; Yodo, N.; Yadav, O. P.; Shanmugam, R.; Ramoni, M. Addressing uncertainty in tool wear prediction with dropout-based neural network. Computers 2023, 12(9), 187.7. [Google Scholar] [CrossRef]
- Dincă, G.; Netcu, I. C.; Ungureanu, C. Renewable Energy Transitions in the EU: A Comparative Panel Data Perspective. Energies 2025, 18(18), 4836. [Google Scholar] [CrossRef]
- Dipierro, A. R.; Barrionuevo, F. J.; Toma, P. Predicting ESG Controversies in Banks Using Machine Learning Techniques. Corporate Social Responsibility and Environmental Management 2025, 32(3), 3525–3544. [Google Scholar] [CrossRef]
- Dong, H.; Wang, L.; Wu, X.; Hou, K. The impact of green innovation network embeddedness on ESG performance in energy enterprises: The mediating role of green dynamic capabilities and the moderating role of organizational agility. Journal of Cleaner Production 2025, 526, 146632. [Google Scholar] [CrossRef]
- Drago, C.; Arnone, M.; Leogrande, A. A Machine Learning and Panel Data Analysis of N2O Emissions in an ESG Framework. Sustainability 2025, 17(10), 4433. [Google Scholar] [CrossRef]
- Drago, C.; Costantiello, A.; Arnone, M.; Leogrande, A. Bridging Sustainability and Inclusion: Financial Access in the Environmental, Social, and Governance Landscape. Journal of Risk and Financial Management 2025, 18(7), 375. [Google Scholar] [CrossRef]
- Ekinci, G.; Ozturk, H. K. Forecasting Wind Farm Production in the Short, Medium, and Long Terms Using Various Machine Learning Algorithms. Energies 2025, 18(5), 1125. [Google Scholar] [CrossRef]
- Enriquez, R. S.; Hillbom, E.; Palacio, A. Can Sovereign ESG Help Guide Nation-States’ Transformative Change? Journal of Sustainable Development 2025, 18(1), 1–56. [Google Scholar] [CrossRef]
- Fabijańska, A.; Wołczek, P.; Sikacz, H. Can machine learning bring ESG ratings closer to small and medium-sized enterprises? Oeconomia Copernicana. 2025. [Google Scholar]
- Farooq, U.; Thavorn, J. Exploring the Impact of Environmental, Social, and Governance (ESG) Performance on Firm Efficiency: The Mediating Role of Environmental R&D Investment in BRICS Economies. Corporate Social Responsibility and Environmental Management 2025, 32(3), 3978–3996. [Google Scholar] [CrossRef]
- Ferro, A.; Marazzina, D.; Stocco, D. Uncovering ESG Ratings: The (Im) Balance of Aspirational and Performance Features. Corporate Social Responsibility and Environmental Management. 2025. [Google Scholar]
- Filì, T.; De Anna, M. Long-term trends in sustainable development across the G7: a multidimensional perspective. Quality & Quantity 2025, 1–15. [Google Scholar] [CrossRef]
- Fu, Y.-H.; Yang, H.-C.; Feng, G.-F.; Chang, C.-P. What’s the impact of multi-dimensional globalization in accelerating green technology diffusion? Sustainable Development 2025, 33(5), 6399–6417. [Google Scholar] [CrossRef]
- Gao, W.; Sun, J.; Hao, C. Impact of ESG on the total factor productivity of energy enterprises—From the perspectives of investor preference and financing constraints. Journal of Resources and Ecology 2025, 16(5), 1306–1314. [Google Scholar] [CrossRef]
- Gao, Y.; Zhang, M.; Nasir, M. A.; Hao, Y.; Wu, J.; Zhang, L. ESG greenwashing behaviour in the electric vehicle supply chain: Insights from evolutionary game theory. International Journal of Production Economics 2025, 289, 109798. [Google Scholar] [CrossRef]
- Gattone, T.; Costantiello, A.; Leogrande, A.; Quarto, A. Modelling CO 2 emissions through econometric and machine learning approaches: The role of renewable energy and resource use in climate action. Geological Journal 2025. [Google Scholar] [CrossRef]
- Ghani, M.; Qin, Q.; Khan, S. Modeling volatility dynamics in emerging markets: Novel evidence from a large set of predictors. Journal of Forecasting 2025, 44(8), 2364–2385. [Google Scholar] [CrossRef]
- Han, Y.; Gopal, A.; Ouyang, L.; Key, A. Estimation of corporate greenhouse gas emissions via machine learning. arXiv 2021, arXiv:2109.04318. [Google Scholar] [CrossRef]
- He, P.; Chen, Q.; Chen, L. The Impact of ESG on Corporate Value Under the ‘Dual Carbon’Goals: Empirical Evidence from Chinese Energy Listed Companies. Energies 2025, 18(18), 4811. [Google Scholar] [CrossRef]
- Horbach, J. Digitalisation and sustainability measures at the firm level. Digital economy and sustainable development 2024, 2(1), 19. [Google Scholar] [CrossRef]
- Huang, L.; Raimi, L.; Al-Faryan, M. A. S. Africa's Quest for Sustainable Development: Do Financial Development, Energy Transition, and Digitalization Reinforce Multidimensional Gains? Sustainable Development. 2025. [Google Scholar]
- Huang, Z.; Chen, M.; Zheng, S. Spectral Adaptive Dropout: Frequency-Based Regularization for Improved Generalization. Information 2025, 16(6), 475. [Google Scholar] [CrossRef]
- Hubbard, S. Environmental Social Governance (ESG) Reporting for Large US Airports. Sustainability 2025, 17(11), 4832. [Google Scholar] [CrossRef]
- İnan, O. IDENTIFYING OPTIMAL BIOGAS PLANT INSTALLATION IN EASTERN ANATOLIA REGION USING CLUSTERING TECHNIQUES. Yalvaç Akademi Dergisi 10(1), 19–32. [CrossRef]
- Ishizaka, A.; Lokman, B.; Tasiou, M. A stochastic multi-criteria divisive hierarchical clustering algorithm. Omega 2021, 103, 102370. [Google Scholar] [CrossRef]
- Jauhari, A.; Suzanti, I. O.; Anamisa, D. R.; Tangguh, F. PCA-counseled k-means and k-medoids with dimension reduction for improved in determining optimal aid clustering. Jurnal Ilmiah KURSOR 2025, 13(1). [Google Scholar] [CrossRef]
- Jeon, G. Leveraging AI for ESG Performance: A Global Analysis of National AI Capabilities and Sustainability in International Business. Business Strategy & Development 2025, 8(3), e70162. [Google Scholar]
- Jiang, P. C.; Feng, G. F.; Wang, H. J.; Chang, C. P. CSR from different perspectives: The global ESG indexes updated. Corporate Social Responsibility and Environmental Management 2024, 31(5), 4694–4714. [Google Scholar] [CrossRef]
- Jiang, S.; Gao, H.; Lu, Y.; Song, H.; Zhang, Y.; Wang, M. Improved Honey Badger Algorithm and Its Application to K-Means Clustering. Applied Sciences 2025, 15(2), 718. [Google Scholar] [CrossRef]
- Jílková, P.; Kotěšovcová, J. ESG performance and disclosure: National composite indicators for monitoring sustainable growth conditions in the EU-27. TEM journal 2023, 12(3), 1845. [Google Scholar] [CrossRef]
- Jiménez-Preciado, A. L.; Álvarez-García, J.; Cruz-Aké, S.; Venegas-Martínez, F. On the Latin America Evidence for the Environmental Kuznets Curve: A Two-Stage Approach using K-means Clustering and Polynomial Regression. International Journal of Energy Economics and Policy 2025, 15(2), 409. [Google Scholar] [CrossRef]
- Jin, C. Investigating the intersection of ESG investing, green recovery, and SME development in the OECD. Humanities and Social Sciences Communications 2025, 12(1), 572. [Google Scholar] [CrossRef]
- Jin, J.; Xu, S.; Gao, B. Can energy efficiency credit guidelines boost enterprises' low-carbon technological innovation? Evidence from China. Energy Economics 2025, 150, 108855. [Google Scholar] [CrossRef]
- Khan, Z.; Chatti, Walid; Ali, S.; Zhu, X. Integrating fiscal reforms, green innovation, and governance effectiveness for sustainable ESG transitions in developed economies. Journal of Environmental Management 2025, 395, 127949. [Google Scholar] [CrossRef]
- Kharlamova, G.; Shchur, D.; Humenna, O. S+ ESG as a New Dimension of Resilience: Security at the Core of Sustainable Business Development. Sustainability 2025, 17(18), 8425. [Google Scholar] [CrossRef]
- Kim, H.; Lee, M. Unraveling the Drivers of ESG Performance in Chinese Firms: An Explainable Machine-Learning Approach. Systems 2025, 13(7), 578. [Google Scholar] [CrossRef]
- Kiran, M.; Naeem, M. A.; Rabbani, M. R. Evolving dynamics of ecological sustainability: Investigating ESG investments and governance quality in G8 nations. Journal of the Knowledge Economy 2025, 16(6), 17755–17783. [Google Scholar] [CrossRef]
- Kotsompolis, G.; Cheilas, P.; Konstantakis, K. N.; Sfakianakis, E.; Goutte, S.; Michaelides, P. G. Smart Forecasting of Carbon Prices Using Machine Learning and Neural Networks: When ARIMA Meets XGBoost and LSTM. Journal of Forecasting 2025. [Google Scholar] [CrossRef]
- Krstić, M. Climate change in the EU: Analysis by clustering and regression. Serbian Journal of Management 2023, 18(1), 111–132. [Google Scholar] [CrossRef]
- Kweh, Q. L.; Ting, I. W. K.; Ren, C.; Asif, J. How do environmental, social, and governance initiatives and controversies explain the firm efficiency of Chinese energy companies? Kybernetes 2025, 54(9), 5316–5338. [Google Scholar] [CrossRef]
- Lapinskienė, G.; Gedvilaitė, D.; Liučvaitienė, A.; Peleckis, K. How does environmental data from ESG concept affect stock returns: Case of the European Union and US capital markets. Emerging science journal. 2023, 7(2), 410–427. [Google Scholar] [CrossRef]
- Laureti, L.; Alberto, C.; Angelo, L. (2023). The role of government effectiveness in the light of esg data at global level. Available at SSRN 4324938.
- Lee, J.; Oh, Y.; Kim, S.; Lim, D. Y. Continuum Dropout for Neural Differential Equations. arXiv 2025, arXiv:2511.10446. [Google Scholar] [CrossRef]
- Lee, K.; Yun, S. J.; Park, S. Varied drivers for reducing CO2 emissions in countries with legislated carbon neutrality targets: a Kaya identity clustering analysis: Lee et al. Environment, Development and Sustainability 2025, 1–23. [Google Scholar] [CrossRef]
- Li, Y.; Darko, A. Incentive mechanisms and decision-making behaviors in warehouse energy efficiency retrofits: A tripartite evolutionary game analysis. Energy and Buildings 2025, 349, 116578. [Google Scholar] [CrossRef]
- Li, Y.; Tsang, Y. P.; Lee, C. K. M.; Luo, J.; Ho, G. T. S.; Wu, C. H. Is it time to rethink ESG strategies for SMEs in supply chains? Evaluating implementation priority and performance with decision models. Corporate Social Responsibility and Environmental Management 2025, 32(6), 8688–8706. [Google Scholar] [CrossRef]
- Li, Z.; Cheng, Q.; Chen, L.; Zhang, B.; Guo, S.; Zhou, X.; Chen, Z. Predicting Winter Wheat Yield with Dual-Year Spectral Fusion, Bayesian Wisdom, and Cross-Environmental Validation. Remote Sensing 2024, 16(12), 2098. [Google Scholar] [CrossRef]
- Ling, J. Y. X.; Chan, Y. J.; Chen, J. W.; Chong, D. J. S.; Tan, A. L. L.; Arumugasamy, S. K.; Lau, P. L. Machine learning methods for the modelling and optimisation of biogas production from anaerobic digestion: a review. Environmental Science and Pollution Research 2024, 31(13), 19085–19104. [Google Scholar] [CrossRef] [PubMed]
- Liu, B.; Song, Z.; Wang, H. An economic scheduling management method for microgrids using multi-strategy improved sand cat swarm optimization. Biomimetics 2025, 10(11), 735. [Google Scholar] [CrossRef]
- Liu, Y.; Kumar, S.; Liu, H.; Li, S.; Zhou, Z. ESG performance, digital transformation, and green innovation. Humanities and Social Sciences Communications 2025, 12(1), 1739. [Google Scholar] [CrossRef]
- López-Flores, F. J.; Sánchez-Zarco, X. G.; Rubio-Castro, E.; Ponce-Ortega, J. M. A machine learning approach for optimizing the water-energy-food-ecosystem nexus: A resilience perspective for sustainability. Environment, Development and Sustainability 2025, 27(4), 8863–8891. [Google Scholar] [CrossRef]
- Lou, Y. Green finance market and carbon neutralization capacity in China. Humanities and Social Sciences Communications 2025, 12(1), 261. [Google Scholar] [CrossRef]
- Lu, Y.; Ahmad, S.; Noureen, S.; Salman, M. Green growth and sustainable energy transitions: evaluating the critical role of technology, resource efficiency, and innovation in Europe’s low-carbon future. Humanities and Social Sciences Communications 2025, 12(1), 1–13. [Google Scholar] [CrossRef]
- Lukács, B.; Rickards, R. C.; Molnár, P.; Suta, A.; Tóth, Á. ESG disclosure topics and reporting frameworks: Exploratory research across automotive, construction, and energy industries. Discover Sustainability 2025, 6(1), 649. [Google Scholar] [CrossRef]
- Madwe, M. C.; Nzuza, Z. W.; Olarewaju, O. M. The impact of energy efficiency on financial performance: Evidence from polluters in South Africa. Sustainability 2025, 17(23), 10630. [Google Scholar] [CrossRef]
- Magaletti, N.; Notarnicola, V.; Di Molfetta, M.; Leogrande, A. Decarbonizing the building sector: The integrated role of environmental, social, and governance indicators. Buildings 2025, 15(19), 3601. [Google Scholar] [CrossRef]
- Mahmood, H.; Tanveer, M.; Furqan, M. Rule of law, corruption control, governance, and economic growth in managing renewable and nonrenewable energy consumption in South Asia. International Journal of Environmental Research and Public Health 2021, 18(20), 10637. [Google Scholar] [CrossRef]
- Manjengwa, E.; Dunga, S. H.; Mncayi-Makhanya, P.; Makhalima, J. ESG Performance and Economic Growth in BRICS Countries: A Dynamic ARDL Panel Approach. Sustainability 2025, 17(14), 6334. [Google Scholar] [CrossRef]
- Mao, J.; Zhang, L.; Li, N. Does energy transition improve ESG performance? Evidence from China’s new energy demonstration city pilot. International Review of Economics and Finance 2025, 104, 104765. [Google Scholar] [CrossRef]
- Matsali, C.; Skordoulis, M.; Papagrigoriou, A.; Kalantonis, P. ESG Scores as Indicators of Green Business Strategies and Their Impact on Financial Performance in Tourism Services: Evidence from Worldwide Listed Firms. Administrative Sciences 2025, 15(6), 208. [Google Scholar] [CrossRef]
- Mendoza-Mendoza, A.; Visbal-Cadavid, D.; De La Hoz-Domínguez, E. Classification of Latin American and Caribbean Countries Based on Multidimensional Development Indicators: A Multivariate Empirical Analysis. Economies 2025, 13(6), 178. [Google Scholar] [CrossRef]
- Mengyuan, L.; Murayama, T.; Nishikizawa, S.; Suwanteep, K. Development of an ESG evaluation framework for China’s energy industry using the PSR–AHP model. Energy for Sustainable Development 2025, 89, 101877. [Google Scholar] [CrossRef]
- Mexia Pacheco, G. IMPLEMENTATION OF ESG METRICS IN SMES: LEADERSHIP, GOVERNANCE, AND ORGANIZATIONAL DEVELOPMENT TOWARD BUSINESS SUSTAINABILITY. Lex Localis: Journal of Local Self-Government 2025, 23. [Google Scholar] [CrossRef]
- Mokhtara, E. A. A.; Zainurib, N. A.; Jedic, M. A. M.; Ismailb, N. A. K-Nearest Neighbors for Predicting Ozone Concentrations: A Machine Learning Approach for Air Quality Assessment. Jurnal Kejuruteraan 2025, 37(6), 2851–2859. [Google Scholar] [CrossRef]
- Morelli, C.; Boccaletti, S.; Maranzano, P.; Otto, P. Multidimensional spatiotemporal clustering–an application to environmental sustainability scores in europe. Environmetrics 2025, 36(2), e2893. [Google Scholar] [CrossRef]
- Mufungizi, I.; Mpaka, Y. W. Transforming resource wealth into sustainable futures: ESG integration in the Democratic Republic of Congo's mining sector. Extractive Industries and Society 2025, 24, 101719. [Google Scholar] [CrossRef]
- Mukhiyayeva, D.; Alibekova, A.; Sembiyeva, L.; Shmygol, N.; Zhumatayeva, B.; Khamitova, D. Economic Efficiency of Natural Resource Use in the Context of ESG Integration and the Circular Economy Transition. Resources 2025, 14(12), 186. [Google Scholar] [CrossRef]
- Mukhtar, M. Unravelling Structural Underdevelopment: Is Governance Quality the Key? Doctoral dissertation, 2023. [Google Scholar]
- N Sibai, F.; El-Moursy, A.; Sibai, A. Forecasting the consumer price index: a comparative study of machine learning methods. International Journal of Computing and Digital Systems 2024, 15(1), 1–10. [Google Scholar] [CrossRef]
- Narayan, M.; Kumar, N.; Parida, V. K.; Kumari, P. Sustainable finance in emerging markets: Adaptive governance and ESG innovation for equitable climate resilience. Development and Sustainability in Economics and Finance 2025, 8, 100101. [Google Scholar] [CrossRef]
- Nie, X.; Su, C.; Wei, X. H.; Wang, A. L.; Xu, F.; Fan, J. R.; West, J. S. Predicting wheat powdery mildew epidemics in China using meteorological data and machine learning approaches. Pest Management Science 2025. [Google Scholar] [CrossRef]
- Niu, N.; Zhang, B.; Song, Y.; Boateng, A. Climate policy uncertainty and ESG performance of energy firms: The moderating effect of cloud computing technology. International Review of Financial Analysis 2025, 108, 104674. [Google Scholar] [CrossRef]
- Nor, M. H. M.; Syafiq Syazwan, M. S. S.; Yusop, F. M.; Sumarwati, S.; Nizam, N. A. M.; Wijayaningtyas, M. An ESG-based smart buildings assessment framework: A bibliometric and conceptual analysis in the Malaysian context. Multidisciplinary Reviews 2026, 9(4), e2026189. [Google Scholar] [CrossRef]
- Noviandy, T. R.; Hardi, I.; Zahriah, Z.; Sofyan, R.; Sasmita, N. R.; Hilal, I. S.; Idroes, G. M. Environmental and economic clustering of indonesian provinces: insights from K-Means analysis. Leuser Journal of Environmental Studies 2024, 2(1), 41–51. [Google Scholar] [CrossRef]
- Nurgaliyeva, K. Evaluating the Impact of ESG on Regional Development in Kazakhstan: Empirical Analysis. Eurasian Journal of Economic and Business Studies 2025, 69(1), 5–17. [Google Scholar] [CrossRef]
- Onomakpo, H. O. Determinants of Renewable Energy Investment: An Integrated Analysis of ESG, Geopolitical Risk, and Finance. 2025. [Google Scholar]
- Pacheco-Jaramillo, W. A.; Malliaros, P. Income Inequality, Governance Quality, and Political Engagement: A Cross-country Analysis of Disparities and Democratic Participation. F1000Research 2025, 14, 561. [Google Scholar] [CrossRef]
- Pampado, A.; Volpato, G.; Fioriti, D.; Lazzaretto, A. MESCO: A clustering framework for the design optimization of future Multi-Energy Systems. Energy 2025, 137038. [Google Scholar] [CrossRef]
- Pence, I.; Kumas, K.; Siseci Cesmeli, M.; Akyüz, A. Detailed analysis of Türkiye's agricultural biomass-based energy potential with machine learning algorithms based on environmental and climatic conditions. Clean Technologies and Environmental Policy 2024, 26(12), 4177–4195. [Google Scholar] [CrossRef]
- Putra, S. E.; Ilmi, M. Application of K-Nearest Neighbor Algorithm for Consumer Behaviour Identification and Product Personalisation Based on Big Data Analysis. Jurnal Ecotipe (Electronic, Control, Telecommunication, Information, and Power Engineering) 2024, 11(2), 205–213. [Google Scholar] [CrossRef]
- Ragazou, K.; Zournatzidou, G.; Sklavos, G.; Staikouras, C.; Sariannidis, N. Future-proofing the workforce: A fuzzy AHP–MARCOS model for evaluating green and digital reskilling in the ESG era. Journal of Environmental Management 2025, 396, 128146. [Google Scholar] [CrossRef]
- Raza, A.; Alharthi, M.; Shakeel, M.; Khan, M. I. Nexus Between CO2 Emissions, Economic Growth, and Energy Consumption with Special Reference to BRICS: A Panel Data Approach. Energy Nexus 2025, 100556. [Google Scholar] [CrossRef]
- Ren, B.; Wang, Q.; Ge, H.; Xu, J.; Hao, X.; Wang, H. Sustainability evaluation of the steel industry in belt and road countries using an ESG-MI and obstacle analysis framework. Scientific Reports 2025, 15(1), 36615. [Google Scholar] [CrossRef]
- Riti, R. I.; Bacali, L.; Abrudan, C. I. From AI adoption to ESG in industrial B2B marketing: An integrated multi-theory model. Sustainability 2025, 17(19), 8595. [Google Scholar] [CrossRef]
- Rusu, Ș.; Boloș, M. I.; Leordeanu, M. K-means and agglomerative hierarchical clustering analysis of esg scores, yearly variations, and stock returns: insights from the energy sector in Europe and the United States. Journal of Financial Studies 2023, 8, 166–180. [Google Scholar] [CrossRef]
- Şahin, E. E. Explaining Economic and Environmental Outcomes Through Renewable Energy Quality: An Interpretable Machine Learning Approach Using XGBoost and SHAP. Journal of Sustainable Development Issues 2025, 3(1), 32–52. [Google Scholar] [CrossRef]
- Saltık, Ö. Algorithmic Approaches to Unraveling ESGC Impact on Financial Per-formance Based on the Ethical Investing in the Energy Sector. International Journal of Pure and Applied Sciences 2024, 10(2), 459–517. [Google Scholar] [CrossRef]
- Saraswati, E.; Ghofar, A.; Atmini, S.; Dewi, A. A. Clustering of companies based on sustainability performance using ESG materiality approach: evidence from Indonesia. International Journal of Energy Economics and Policy 2024, 14(2), 112–125. [Google Scholar] [CrossRef]
- Selmeya, M. G.; Bialy, B. A. E.; Hassanein, A.; Baker, A. A.; Ali, W. M.; Aboushadi, N. R.; Mohamad, E. F. E. Antecedents and forecasting of carbon emissions using machine learning algorithms: insights from the top ten carbon-emitting nations. International Journal of Energy Economics and Policy 2025, 15(4), 511–524. [Google Scholar] [CrossRef]
- Seow, R. Y. C. Transforming ESG analytics with machine learning: A systematic literature review using TCCM framework. Corporate Social Responsibility and Environmental Management 2025, 32(6), 7358–7389. [Google Scholar] [CrossRef]
- Sevgi, E.; Figen, A. Z. Determination of Renewable Energy Growth Using Cluster Analysis and Multi-Criteria Decision-Making Methods. Applied Sciences 2025, 15(3), 1575. [Google Scholar] [CrossRef]
- Sharipov, K.; Abdullayev, I.; Kuziboev, B.; Makhmudov, S.; Kalandarov, F.; Khaytboeva, N.; Ilkhamova, Z. The Effect of Energy Policy Risk on Renewable Energy. International Journal of Energy Economics and Policy 2025, 15(2), 566. [Google Scholar] [CrossRef]
- Sica, F.; Tajani, F.; Sáez-Pérez, M. P.; Marín-Nicolás, J. Taxonomy and indicators for ESG investments. Sustainability 2023, 15(22), 15979. [Google Scholar] [CrossRef]
- Simionescu, M.; Oancea, B. Does Income Inequality Influence Energy Consumption in the European Union? Energies 2025, 18(4), 787. [Google Scholar] [CrossRef]
- Sinaga, K. P.; Yang, M. S. A Globally Collaborative Multi-View k-Means Clustering. Electronics 2025, 14(11), 2129. [Google Scholar] [CrossRef]
- Singh, K.; Arora, A. ESG reputation and the possibility of energy inefficiency: Does stakeholder perception conceal the adverse effects of compromised legitimacy? Social Responsibility Journal 2025, 21(10), 2253–2270. [Google Scholar] [CrossRef]
- Sklavos, G.; Zournatzidou, G.; Ragazou, K.; Sariannidis, N. Green accounting and ESG-driven eco-efficiency in European financial institutions: A two-stage DEA–CRITIC–TOPSIS evaluation. PLOS ONE 2025, 20(10), e0334882. [Google Scholar] [CrossRef]
- Sorrosal-Forradellas, M.-T.; Fabregat-Aibar, L.; Barberà-Mariné, M.-G.; Terceño, A. Tailoring fund selection to diverse investors: Integrating financial and sustainability performance. Journal of Business Economics and Management 2025, 26(5), 1027–1049. [Google Scholar] [CrossRef]
- Sultana, N.; Zeya, F. Advancing Firm-Specific ESG Sentiment Analysis: A Machine Learning Approach to Clustering, Prediction, and Financial Performance Implications. Business Strategy & Development 2025, 8(3), e70150. [Google Scholar]
- Taghizadeh-Hesary, F.; Rasoulinezhad, E. Accelerating the renewable energy transition in the EU: the role of smart technologies and ESG investments. Discover Sustainability 2025, 6(1), 692. [Google Scholar] [CrossRef]
- Tan, W.; Yan, E. H.; Chen, X. H. Positive press, greener progress: the role of ESG media reputation in corporate energy innovation. Sustainable Development, 2025. [Google Scholar]
- Tang, X.; Liu, S.; Wang, Y.; Wan, Y. Study on carbon emission reduction countermeasures based on carbon emission influencing factors and trends. Environmental Science and Pollution Research 2024, 31(9), 14003–14022. [Google Scholar] [CrossRef] [PubMed]
- Thapa, B. S.; Adhikari, B.; Pathak, D. D. Does ESG Performance Drive Long-Term Sustainable Economic Growth in Asia? Insights from a Novel ESG Index and Panel Cointegration Analysis. Nepal Journal of Multidisciplinary Research 2025, 8(1), 1–17. [Google Scholar] [CrossRef]
- Thongsanitkarn, T.; Sugunnasil, P. Prediction of Electricity Consumption Using Interpretable Machine Learning Approach: ข้อมูล จาก ประเทศไทย ใน ช่วง ปี 1973 จนถึง 2021. ASEAN Journal of Scientific and Technological Reports 2025, 28(3), e257539–e257539. [Google Scholar] [CrossRef]
- Török, L. Economic Drivers of Renewable Energy Growth in the European Union: Evidence from a Panel Data Analysis (2015–2023). Energies 2025, 18(13), 3363. [Google Scholar] [CrossRef]
- Troncoso, J. A.; Quijije, Á. T.; Oviedo, B.; Zambrano-Vega, C. Solar Radiation Prediction in the UTEQ based on Machine Learning Models. arXiv 2023, arXiv:2312.17659. [Google Scholar] [CrossRef]
- Tutar, H.; Štreimikienė, D.; Mutlu, H. T. The Relationship Between ESG and Financial Performance in Global Firms: A Multidimensional Study Across Sectors and Regions for the Period 2015–2025. Corporate Social Responsibility and Environmental Management 2025, 32(6), 8280–8294. [Google Scholar] [CrossRef]
- Veisi, H. Advancing energy transition and climate accountability in Wisconsin firms: A content analysis of corporate sustainability reporting. Sustainability 2025, 17(19), 8935. [Google Scholar] [CrossRef]
- Wang, J.; Zhang, H.; Hou, X.; Yang, Z. Comprehensive value evaluation of rural shared energy storage based on Nash negotiation. Sustainability 2025, 17(23), 10513. [Google Scholar] [CrossRef]
- Wang, W.; Wang, J. Sustainable finance and carbon neutrality: The role of green bonds, ESG investments, and carbon pricing. Journal of Environmental Management 2025, 395, 127731. [Google Scholar] [CrossRef]
- Waseem, M.; Khurshid, N.; Egbe, C. E.; Rashid, M. Energy Transition and Institutional Quality in E-7 Economies: Unveiling Paths to Sustainable Development with CS-ARDL Analysis. Sustainability 2025, 17(10), 4321. [Google Scholar] [CrossRef]
- Wenda, A.; Notan, A. R. K.; Sudirman, S. A. R.; Ferdiansyah, T.; Pratama, T. S.; Alfian, Z. Application of K-Means on Human Rights, Demographic, Economic, and Crypto Investment Data. Journal of Artificial Intelligence and Engineering Applications (JAIEA) 2025, 4(3), 2539–2548. [Google Scholar] [CrossRef]
- Wieteska-Rosiak, B. Housing environment as a tool for strengthening urban resilience to climate change: ESG good practices in sustainable development. Bulletin of Geography: Socio-economic Series 2025, 70, 85–96. [Google Scholar] [CrossRef]
- Wilberg, S.; Kjellevoll, V.; Holz, F.; Neumann, A. Impact of ESG performance on the cost of capital in the energy, utilities, and basic materials sectors. Utilities Policy 2025, 97, 102016. [Google Scholar] [CrossRef]
- Wu, Q.; Min, S. Sustainable future engine: Exploring the impact of energy saving and emission reduction fiscal policies on green technological innovation quality. Journal of Environmental Management 2025, 395, 128025. [Google Scholar] [CrossRef] [PubMed]
- Xie, M.; Zhao, S.; Lv, K. The impact of green finance and financial technology on regional green energy technological innovation based on the dual machine learning and spatial econometric models. Energies 2024, 17(11), 2521. [Google Scholar] [CrossRef]
- Yasin, K. H.; Yasin, M. I.; Iguala, A. D.; Gelete, T. B.; Tulu, D.; Kebede, E. Predictive machine learning and geospatial modeling reveal PM10 hotspots and guide targeted air pollution interventions in Addis Ababa, Ethiopia. Discover Applied Sciences 2025, 7(4), 263. [Google Scholar] [CrossRef]
- Yip, P. C. W. The integration of environmental, social, and governance metrics and market value: A multi-dimensional analysis of corporate sustainability and financial performance. Corporate Governance and Sustainability Review, 2025. [Google Scholar]
- You, Z.; Chen, D.; Fang, C.; Gao, M.; Cheng, J. How green governance empowers high-quality development: An EKC framework-based analysis of ESG and green total factor productivity. Science Progress 2024, 107(4), 00368504241288782. [Google Scholar] [CrossRef] [PubMed]
- Yu, T.-K.; Horng, J.-S.; Chang, I.-C.; Liu, C.-H.; Chou, S.-F.; Tai-Yi, T.-Y. Exploration of the relationship between SDGs and CSR reports with text mining techniques for stock exchange companies in Taiwan. Discover Computing 2025, 28(1), 286. [Google Scholar] [CrossRef]
- Yücel, M. Strategic decoupling through legitimacy: The sustainability-innovation gap in the food processing sector and its health implications. Globalization and Health 2025, 21(1), 70. [Google Scholar] [CrossRef]
- Zhang, R.; Jing, L.; Li, Y.; Guo, X. The role of technological innovation and institutional quality in environmental and economic growth sustainability in emerging Asian countries. Frontiers in Environmental Science 2025, 12, 1510120. [Google Scholar] [CrossRef]
- Zhang, X.; Huang, Q.; Shi, P. The comprehensive welfare effects of energy transition: Evidence from corporate ESG performance. Energy 2025, 339, 138982. [Google Scholar] [CrossRef]
- Zhang, Y.; Liu, D. Assessment of socio-economic adaptability to ageing in resource-based cities and its obstacle factor. Sustainability 2023, 15(17), 12981. [Google Scholar] [CrossRef]
- Zhao, D.; Ngan, S. L.; Jamil, A. H.; Salleh, M. F. M.; Yusoff, W. S. Peer Effects on ESG Disclosure: Drivers and Implications for Sustainable Corporate Governance. Sustainability 2025, 17(10), 4392. [Google Scholar] [CrossRef]
- Zhong, J.; Zhang, Y.; Wang, L.; Liu, W. The asymmetric impact of ESG rating disagreement on stock mispricing: Implications for green investment and corporate sustainability. Journal of Environmental Management 2025, 394, 127555. [Google Scholar] [CrossRef]
- Zhou, X.; Peng, Y.; Sun, X.; Cao, X.; Wang, Z.; Zhang, J. Advancing new energy industry quality via artificial intelligence-driven integration of ESG principles. Humanities and Social Sciences Communications 2025, 12(1), 1491. [Google Scholar] [CrossRef]
- Zohra, K. Exploring the Relationship Between ICT and Carbon Dioxide Emissions in Middle East and North African (MENA) Countries: A Panel ARDL-PMG Analysis. Nature Environment & Pollution Technology 2025, 24(4). [Google Scholar]
- Zournatzidou, G.; Staikouras, C.; Ragazou, K.; Zopounidis, C.; Sariannidis, N. Unlocking the threshold effects of ESG performance towards policy energy efficiency of the European energy sector: A hybrid multi-criteria decision-making approach based on weight-entropy TOPSIS. Energy Economics 2025, 151, 108915. [Google Scholar] [CrossRef]
Figure 1.
The ESG Blueprint for Energy Use: Environmental, Social, and Governance Drivers. This figure illustrates energy use per capita as a central ESG nexus shaped by interacting Environmental, Social, and Governance drivers. Environmental pressures, social development, and institutional quality jointly influence energy demand, highlighting trade-offs between growth, sustainability, and efficiency within an integrated ESG framework.
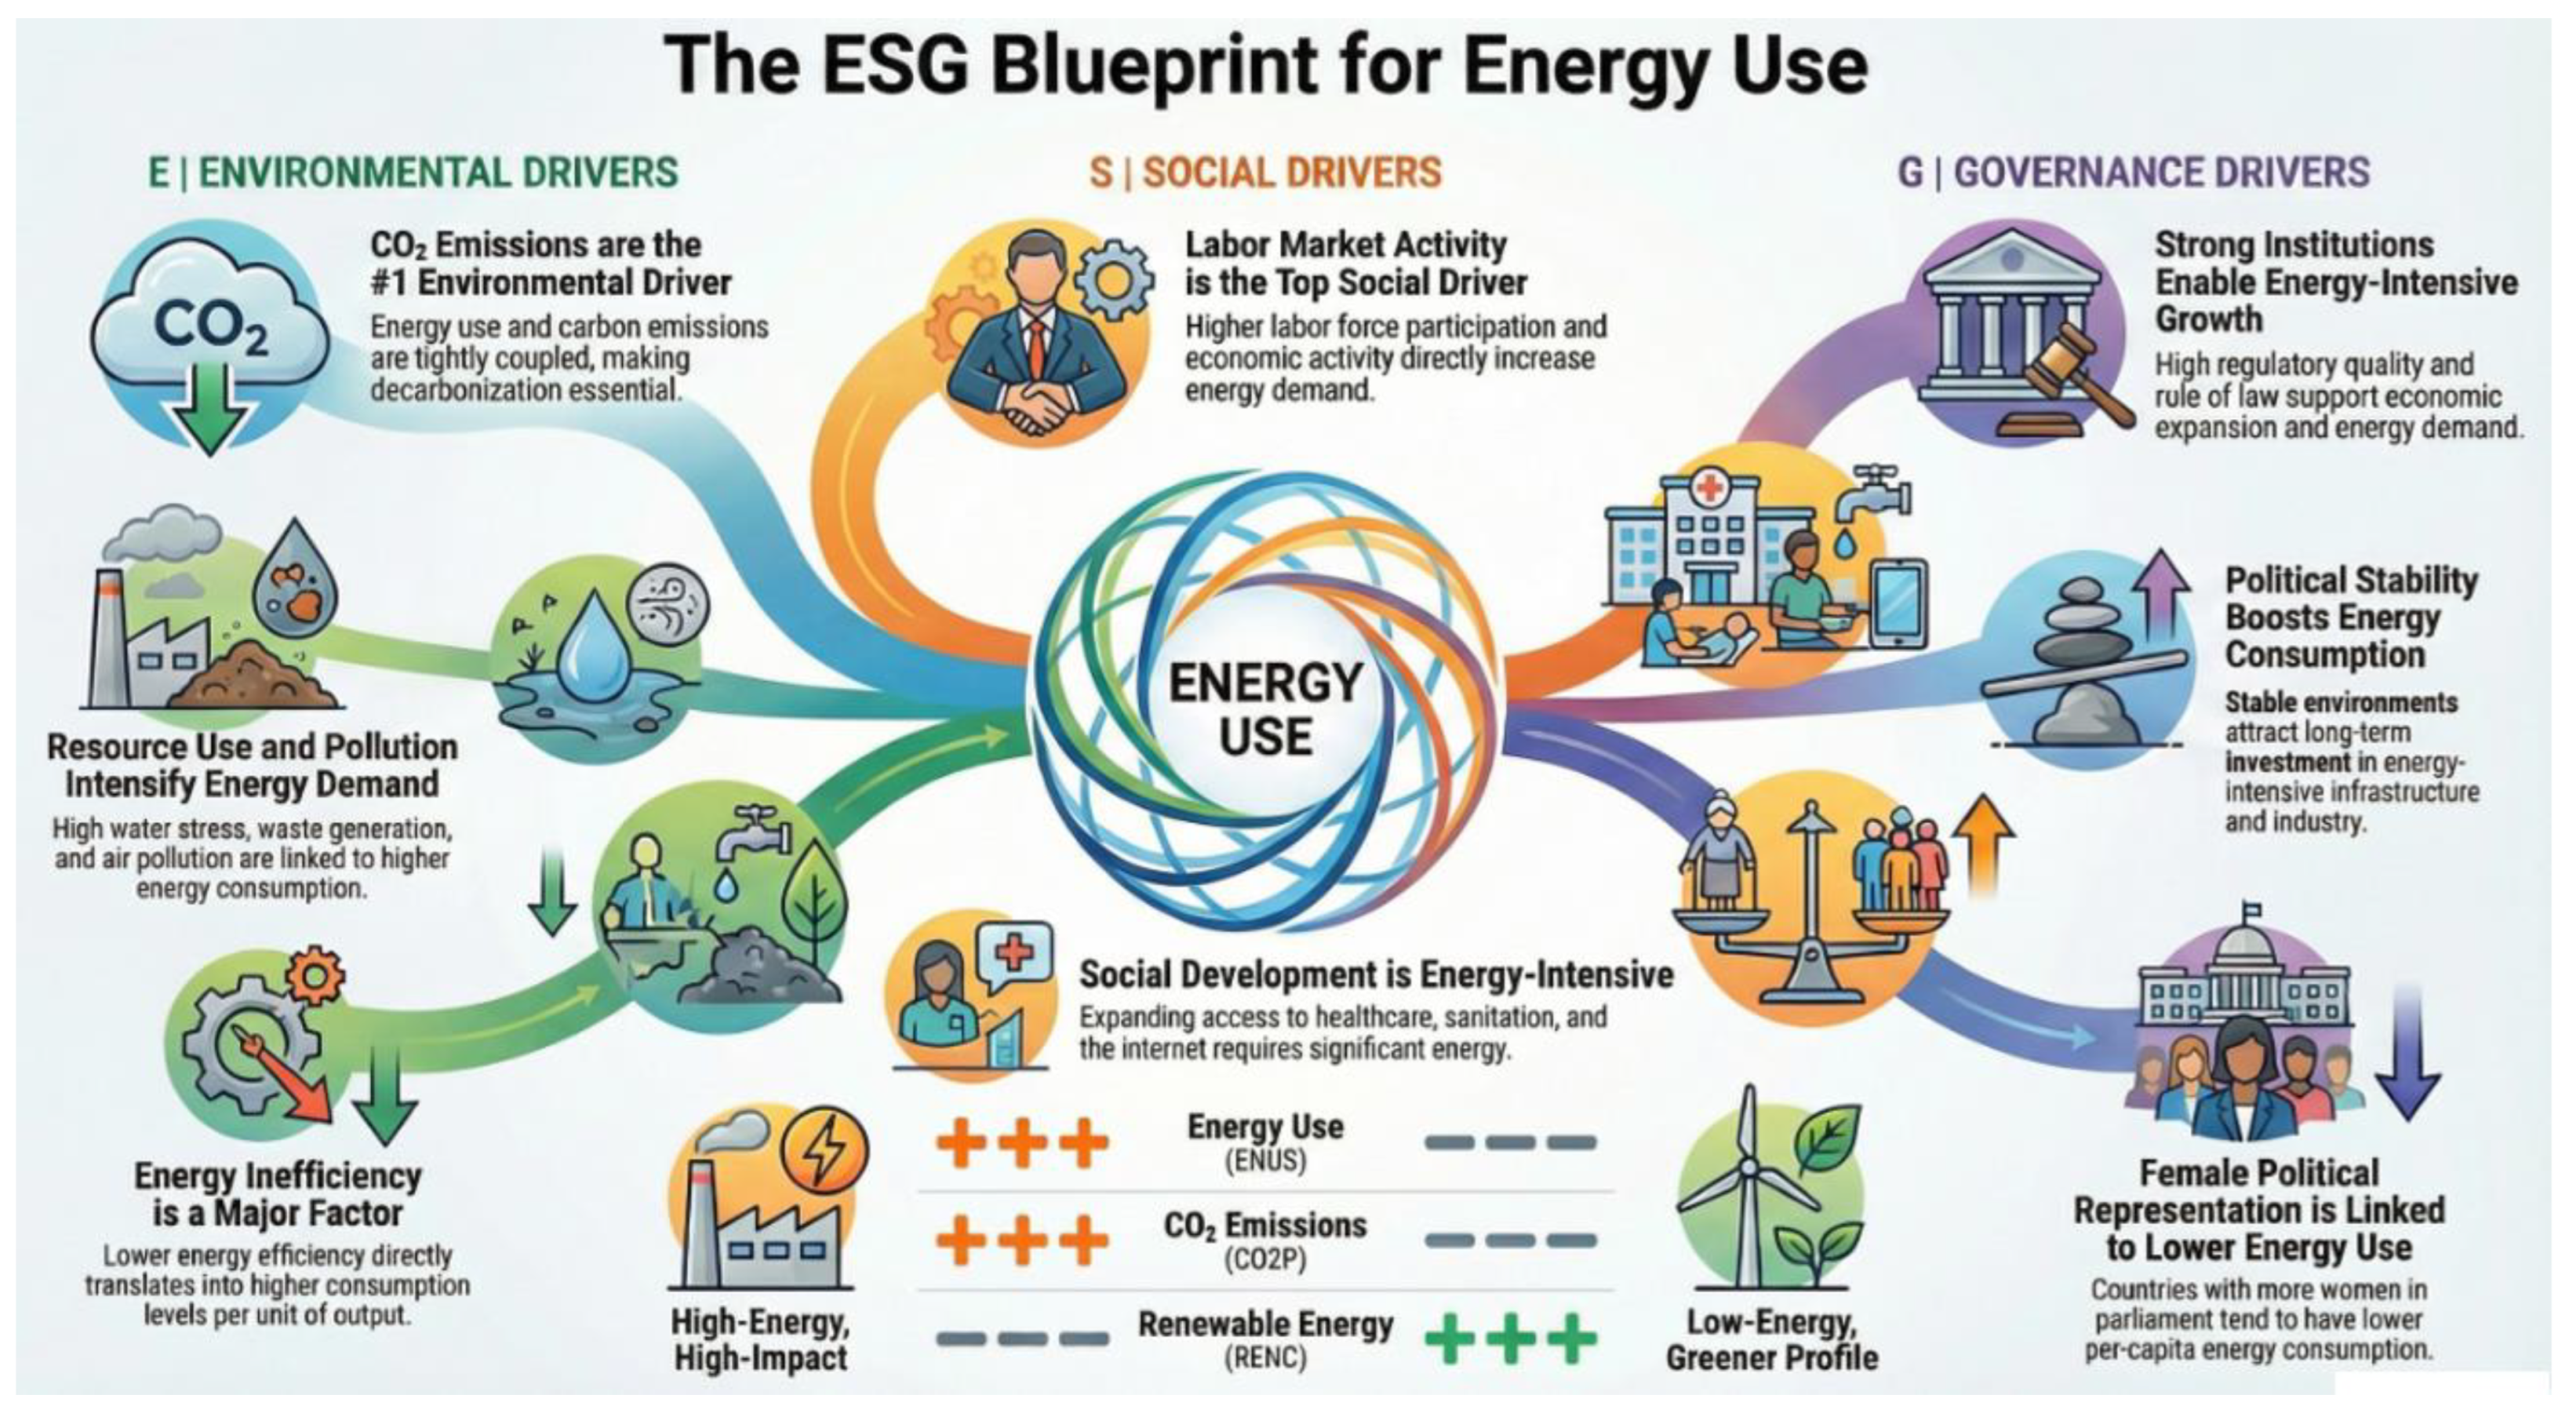
Figure 2.
Determination and Validation of Optimal Clusters in K-Means Analysis of Cross-Country Energy Use. Note: Panel A shows the Elbow Method using WSS, AIC, and BIC to identify the optimal number of clusters, with the minimum BIC indicating ten clusters as the best balance between goodness of fit and model complexity. Panel B presents a t-SNE visualization of the resulting clusters, highlighting well-defined and interpretable cross-country energy consumption patterns with limited overlap among clusters.
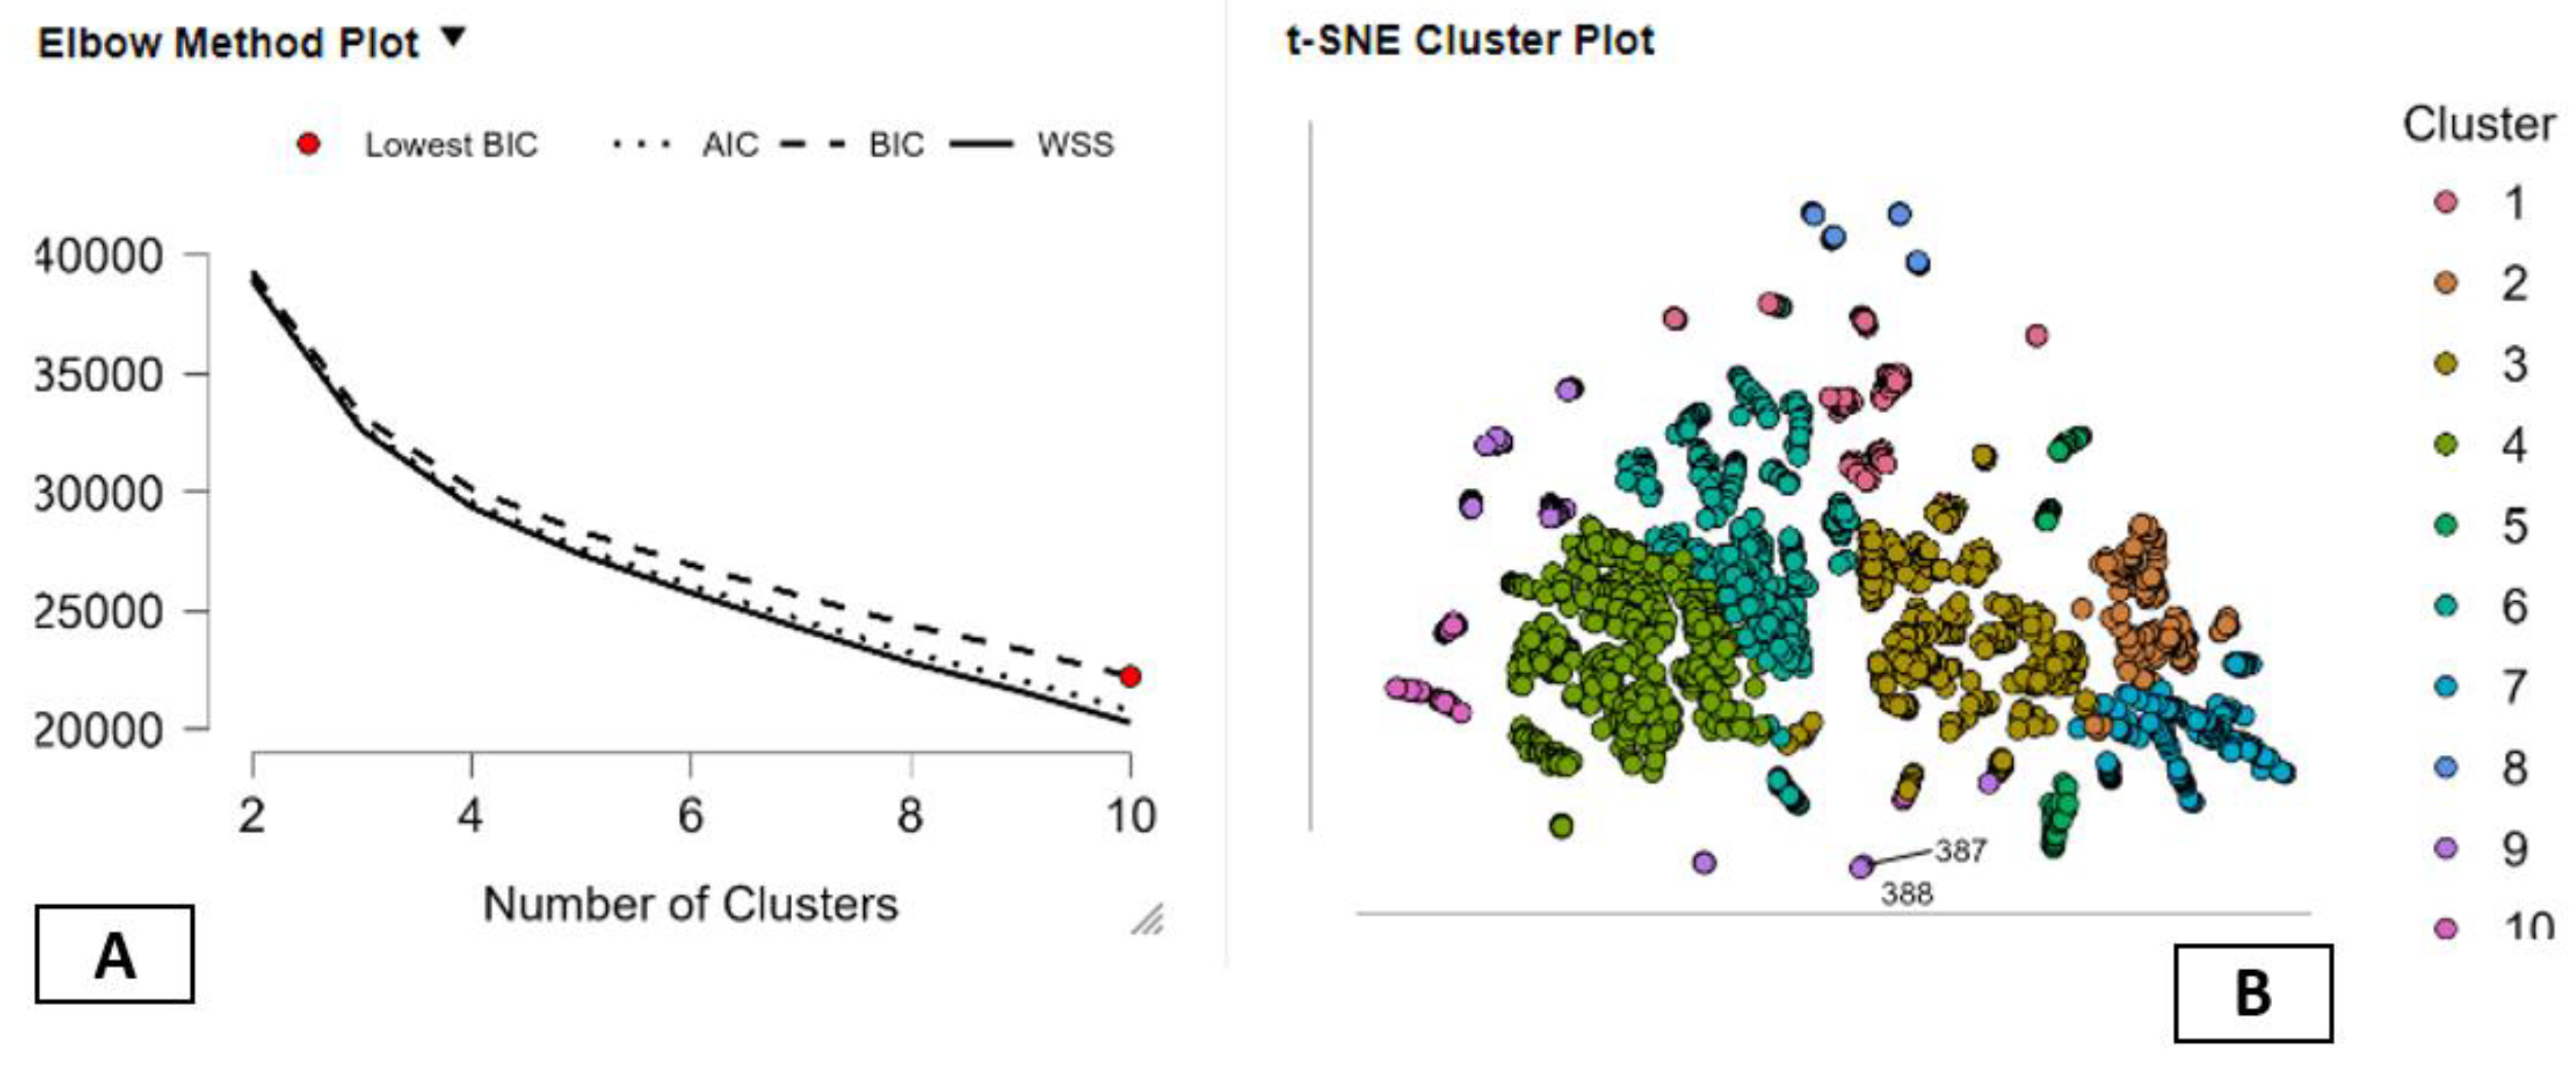
Figure 3.
Predictive Accuracy and Calibration of the K-Nearest Neighbors (KNN) Model. Panel A plots observed versus predicted test values, showing strong alignment along the 45° line and minimal systematic error. Panel B reports training and validation mean squared errors across different neighbor values, identifying the optimal K that balances model flexibility and generalization, confirming the high predictive reliability of the KNN approach.
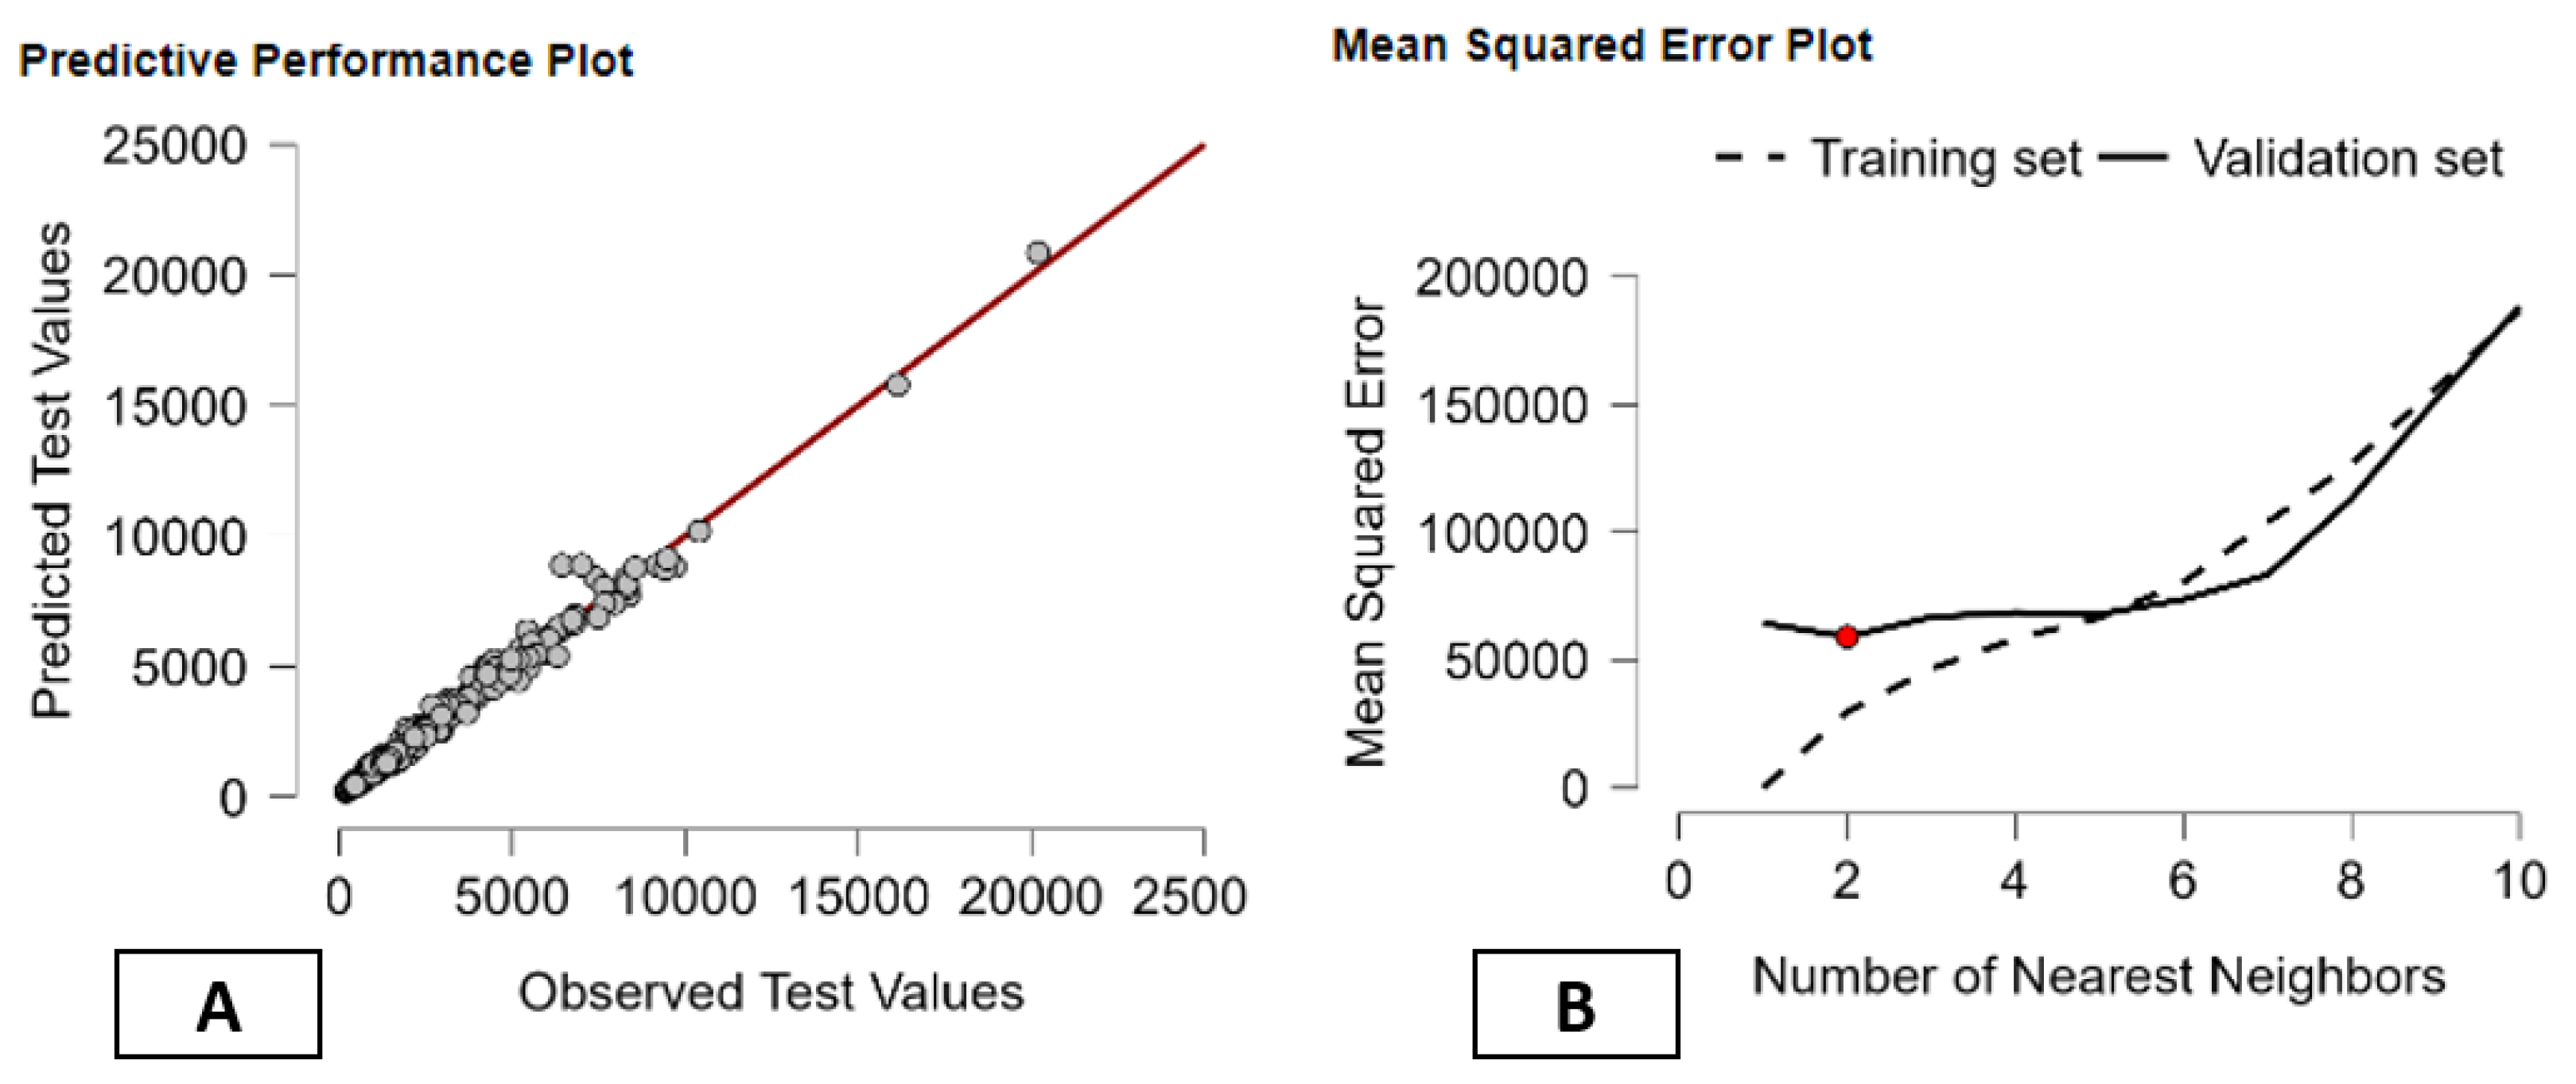
Figure 4.
Predictive Accuracy and Hyperparameter Tuning of the K-Nearest Neighbors (KNN) Regression Model. Panel A illustrates the correspondence between observed and predicted test values of ENUS, showing a strong alignment around the 45-degree reference line and indicating high predictive accuracy with limited bias. Panel B reports training and validation mean squared errors across different values of k, highlighting the bias–variance trade-off and identifying k = 2 as the optimal neighborhood size that minimizes out-of-sample prediction error.
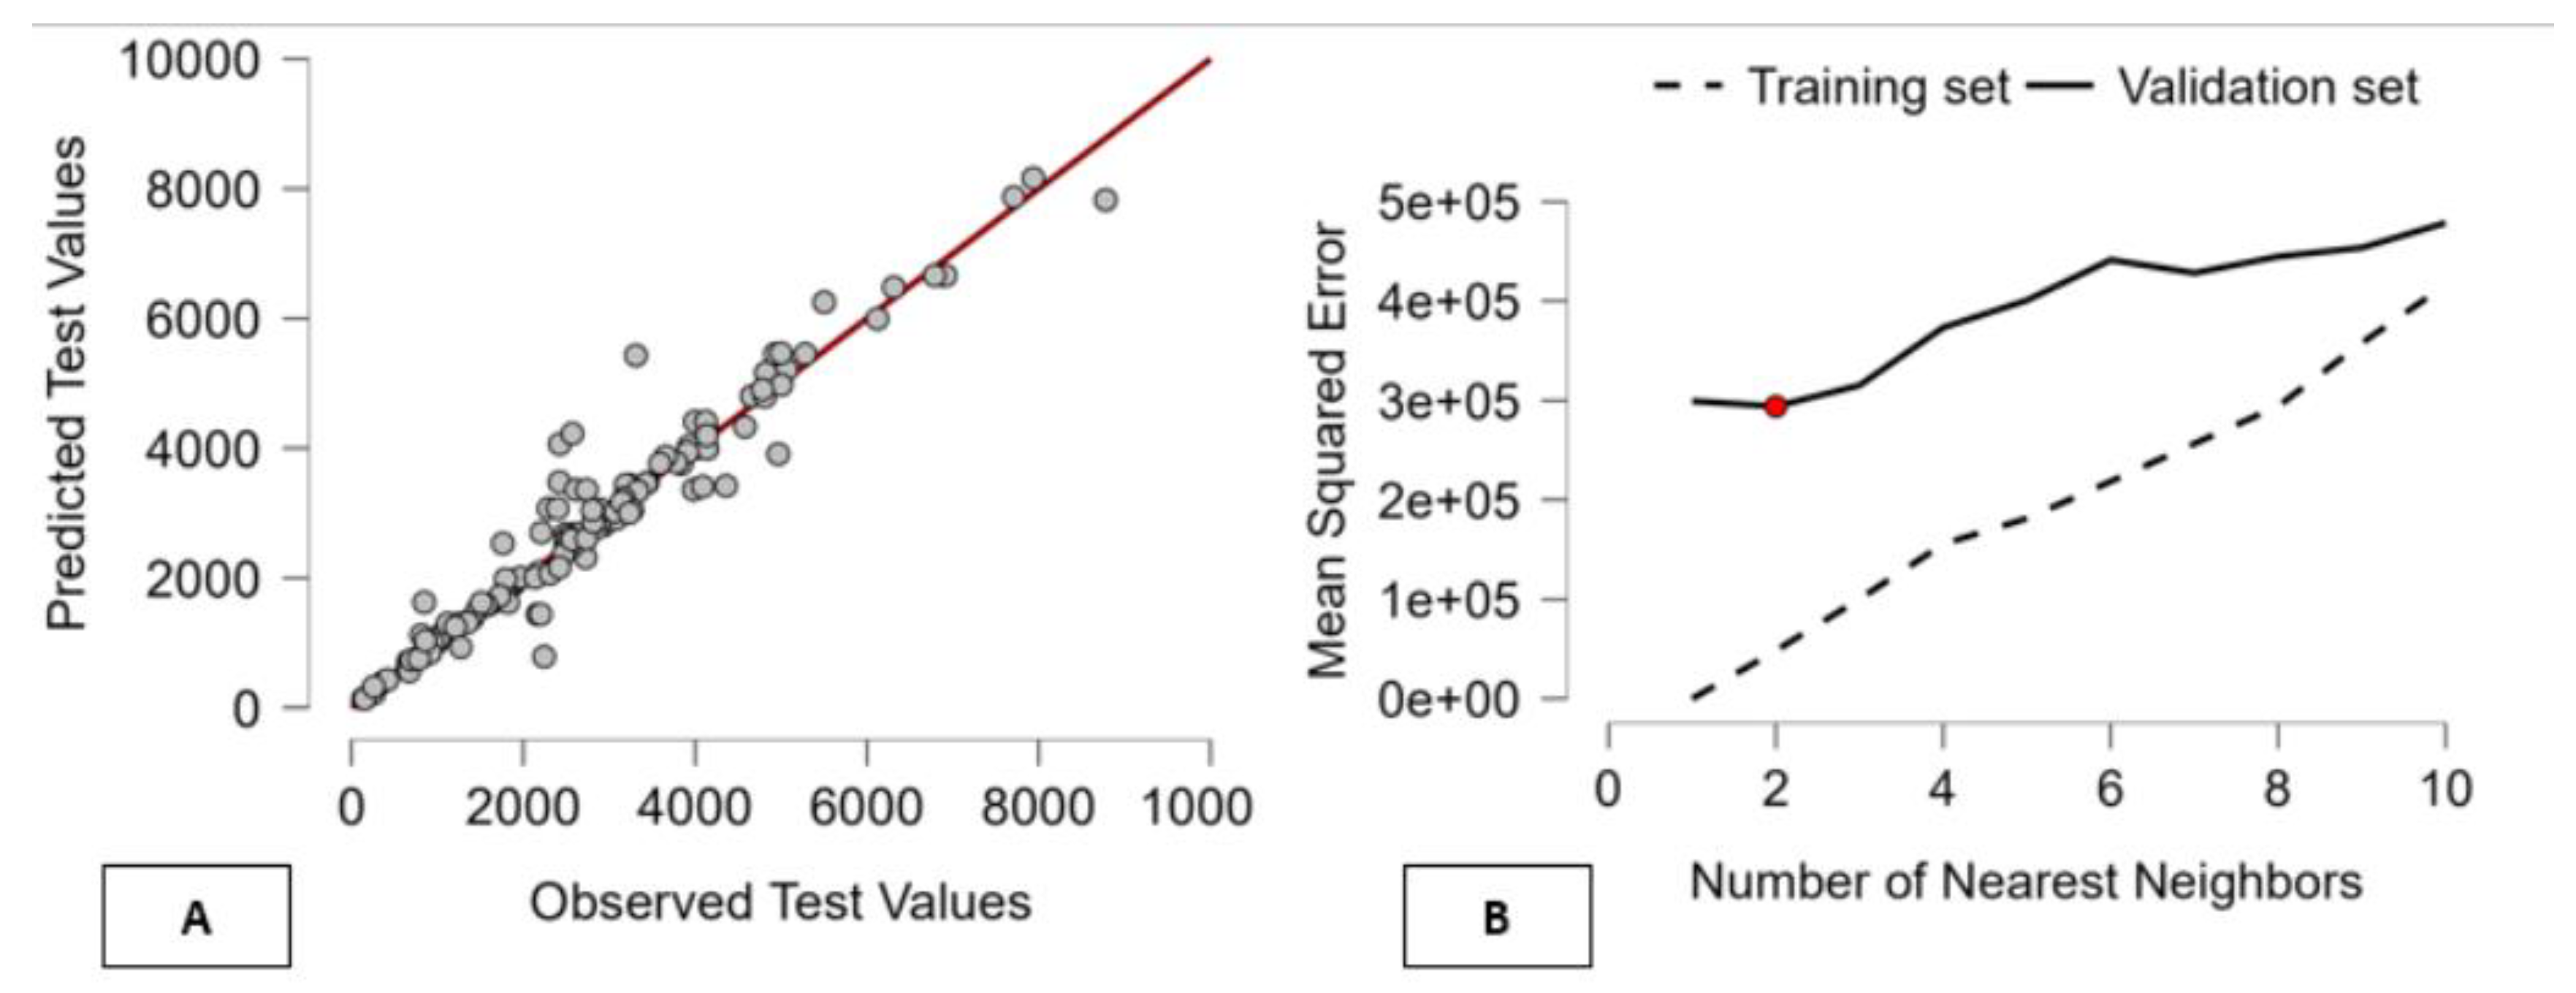
Figure 5.
Model-Based Clustering of Governance (ESG–G) Indicators and Energy Use per Capita (ENUS). This figure integrates cluster selection, visualization, and interpretation of governance–energy regimes. Panel A identifies the optimal number of clusters using AIC, BIC, and within-cluster sum of squares, with the minimum BIC indicating ten clusters as the best balance between fit and parsimony. Panel B displays a two-dimensional representation of clustered observations, highlighting partially overlapping yet distinct governance–energy profiles typical of probabilistic clustering. Panel C reports average standardized values of ENUS and governance indicators across clusters, revealing substantial heterogeneity: clusters with strong institutional quality are associated with higher ENUS, while fragile governance environments correspond to lower energy use. Overall, the figure illustrates the multidimensional and conditional relationship between governance structures and energy consumption.
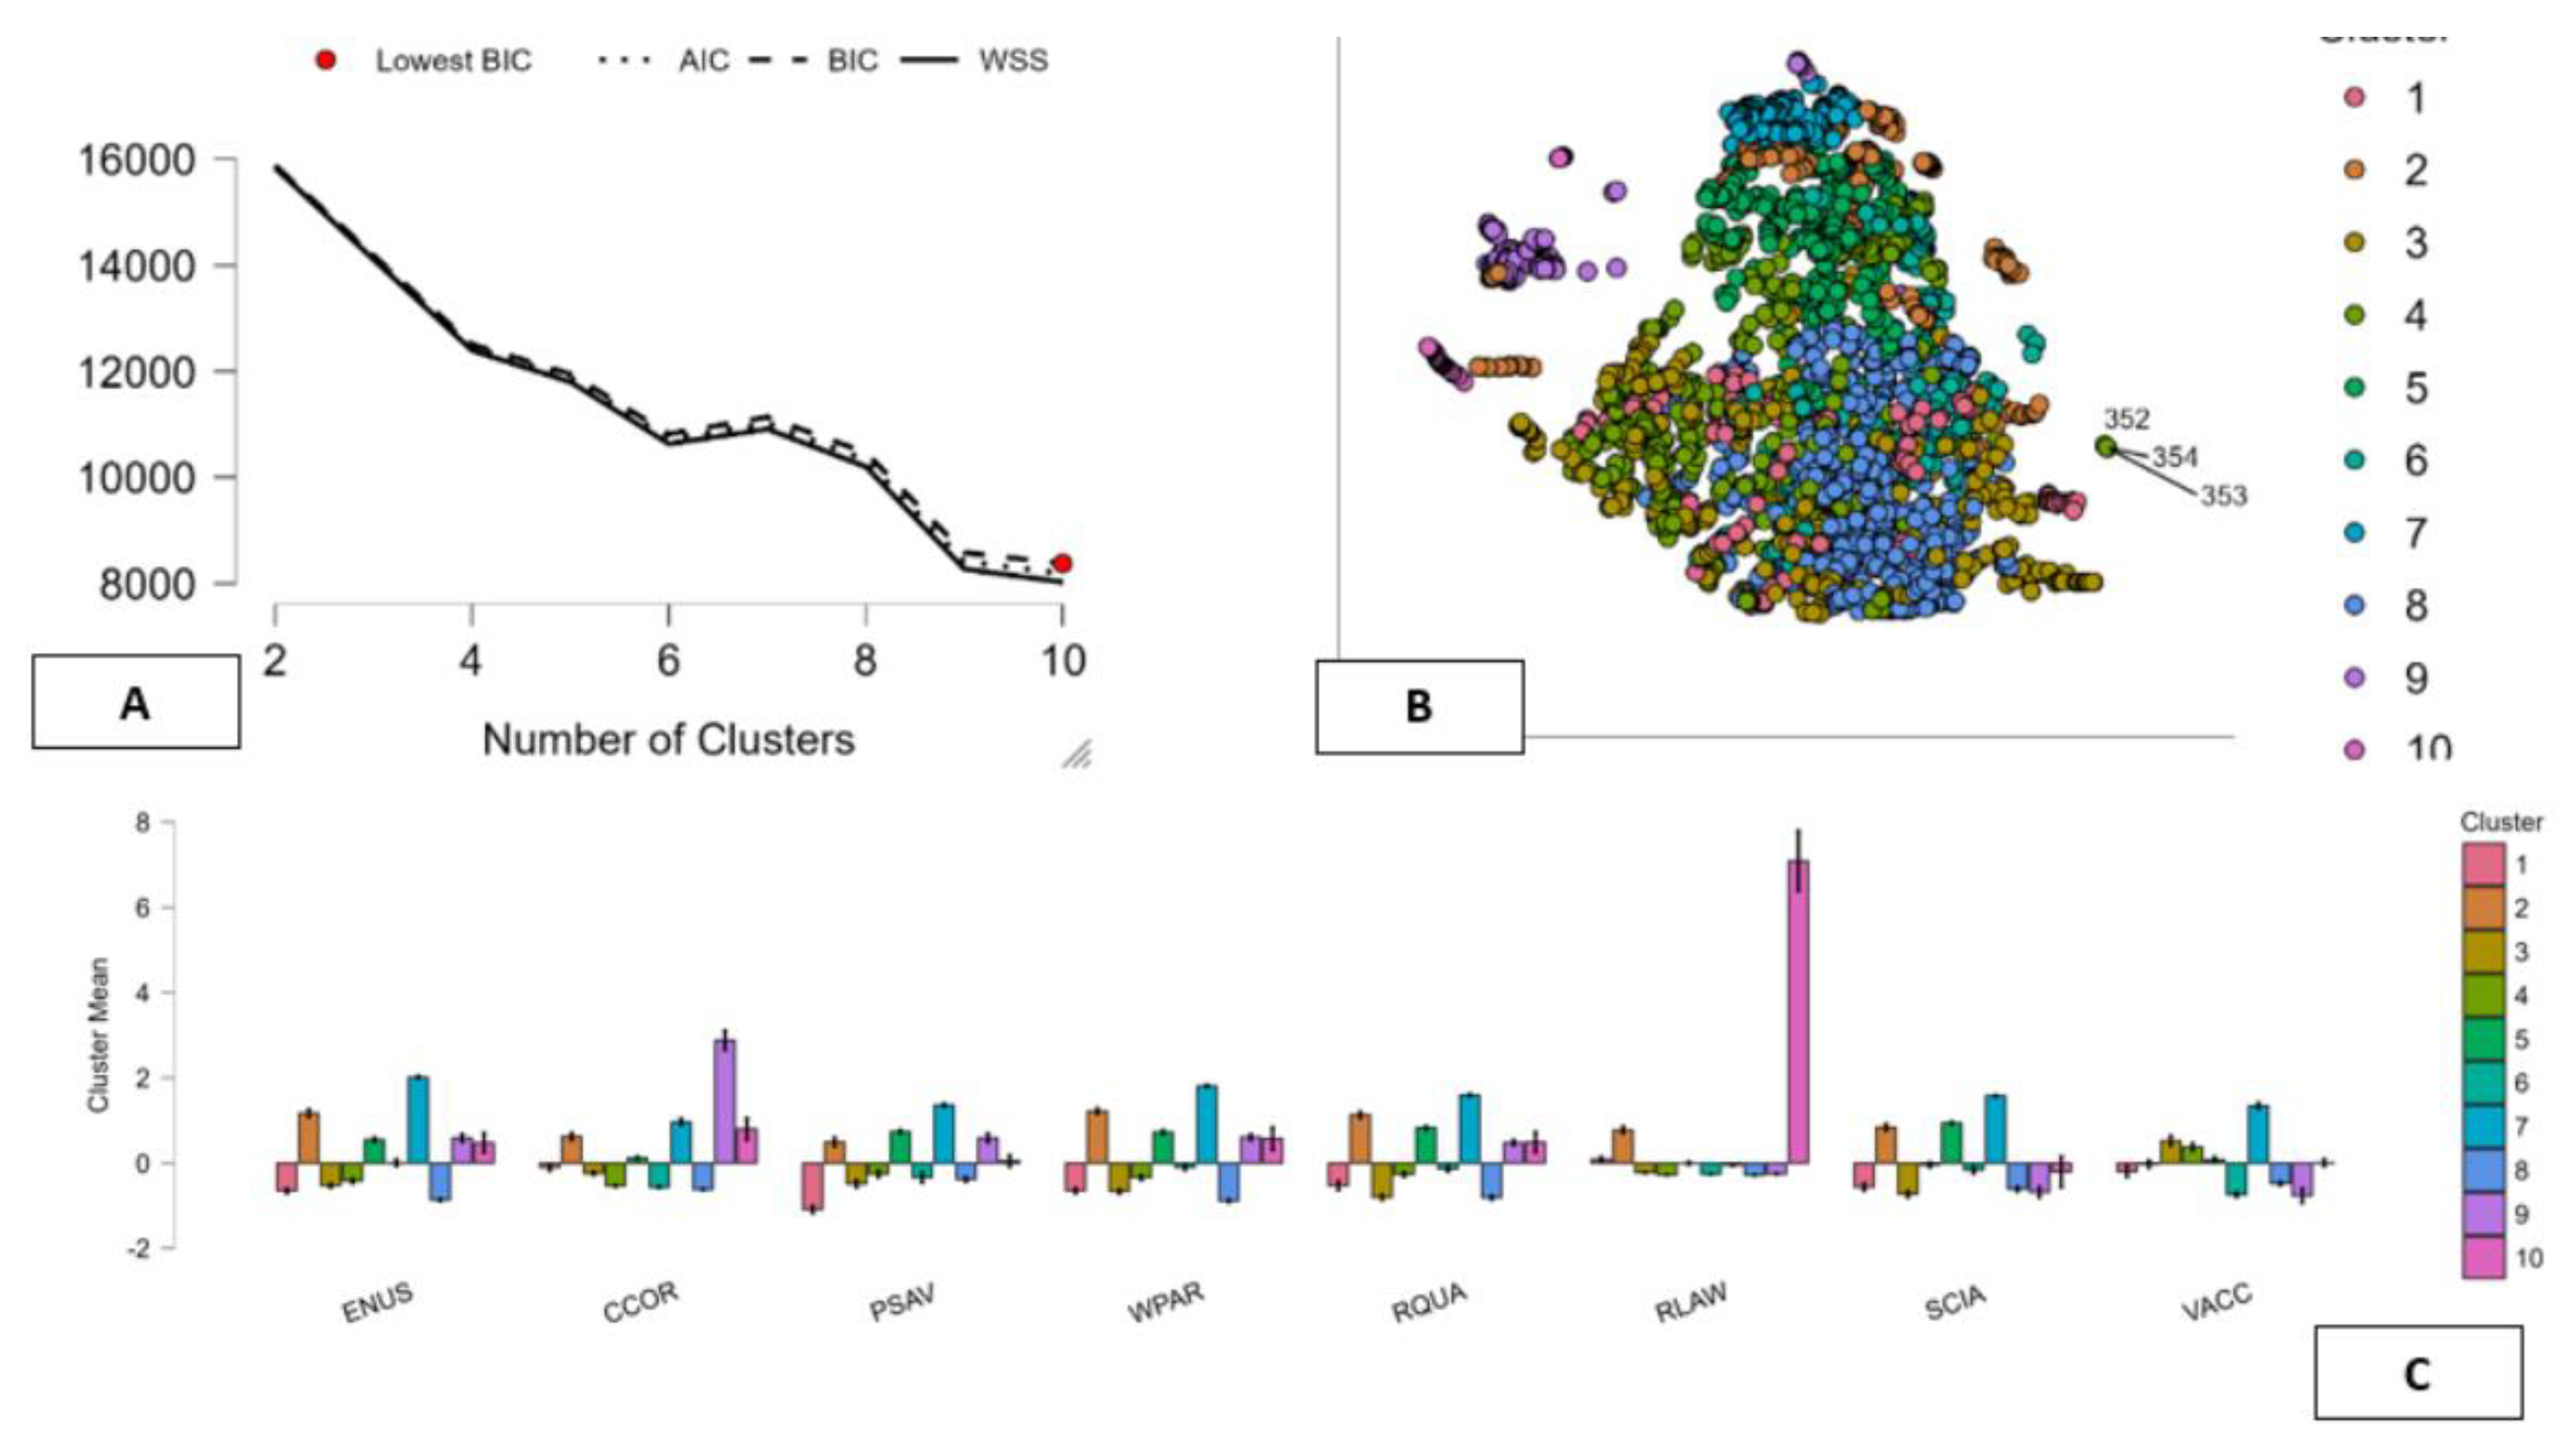
Figure 6.
Predictive Accuracy and Hyperparameter Tuning of the KNN Model for Energy Use. Panel A displays the relationship between observed and predicted ENUS values, highlighting the strong predictive performance of the KNN model. Panel B reports training and validation mean squared errors across different numbers of nearest neighbors, identifying the optimal model configuration and confirming a favorable bias–variance trade-off.
Table 1.
Key Thematic Streams Linking Energy Use and ESG Performance in the Literature.
| Macro-Theme | Key Studies | Main Findings | Relationship Between Energy Use and ESG |
| 1. Financial and Governance Mechanisms for Sustainable Energy Use | Sorrosal-Forradellas et al. (2025); Sklavos et al. (2025); Gao et al. (2025) | ESG integration in finance and accounting systems drives sustainable investment and enhances eco-efficiency. High ESG performance reduces financial risks and improves productivity. | Financial institutions adopting ESG frameworks channel capital toward low-energy, low-carbon sectors, proving that energy efficiency strengthens financial stability and ESG value creation. |
| 2. Technological Innovation and Energy Efficiency | Dong et al. (2025); Jin et al. (2025); Riti et al. (2025) | AI adoption, innovation networks, and credit incentives stimulate green technology and low-carbon innovation. | Technology-oriented ESG strategies optimize industrial energy use by fostering innovation, reducing emissions, and improving ESG scores across energy-intensive sectors. |
| 3. Built Environment and Circular Energy Systems | Costanzo et al. (2025); Magaletti et al. (2025); Alkhalifa (2025) | Studies on circular economy and building decarbonization show how environmental and governance indicators drive resource efficiency. | Circular design and sustainable certification systems lower building energy consumption and align operational practices with ESG sustainability standards. |
| 4. Globalization, Accountability, and Corporate Transition | Fu et al. (2025); Veisi (2025); Gao et al. (2025) | Global interconnectivity and transparent corporate reporting accelerate the global diffusion of green technologies and energy transition policies. | Global ESG alignment enhances energy accountability and carbon reduction, linking responsible governance to more efficient global energy use. |
Note. This table summarizes the main strands of the recent literature examining the relationship between energy use and Environmental, Social, and Governance (ESG) factors. It highlights key macro-themes, representative studies, principal findings, and the mechanisms through which ESG-related financial, technological, institutional, and structural factors influence energy efficiency, carbon intensity, and sustainable energy consumption patterns across sectors and countries.
Table 2.
Panel Data Estimates of Environmental ESG Drivers and Energy Use per Capita.
| Observations | 1965 | ||||||||
| Cross-sectional units | 127 | ||||||||
| Time-series length | minimum 1, maximum 17 | ||||||||
| Dependent variable | ENUS | ||||||||
| Model | Fixed Effects | Random-effects (GLS) Using Nerlove's transformation | WLS Weights based on per-unit error variances | ||||||
| Coefficient | Std. Error | t-ratio | Coefficient | Std. Error | z | Coefficient | Std. Error | t-ratio | |
| const | 1273.73*** | 128.05 | 9.94 | 1306.64*** | 187.125 | 6.98 | 502.12*** | 35.44 | 14.17 |
| ACEL | 3.33*** | 1.17 | 2.83 | 3.84*** | 1.16 | 3.30 | 8.23*** | 0.38 | 21.21 |
| AFFV | −12.59*** | 2.85 | −4.41 | −13.57*** | 2.82 | −4.80 | −11.17*** | 0.99 | −11.17 |
| AFWW | 0.23*** | 0.05 | 3.94 | 0.22*** | 0.05 | 4.07 | 0.08*** | 0.01 | 6.63 |
| CO2P | 298.39*** | 6.20 | 48.06 | 303.14*** | 6.10 | 49.63 | 389.61*** | 2.65 | 146.9 |
| ENIM | 1.33*** | 0.10 | 12.18 | 1.30*** | 0.10 | 12.02 | −0.32*** | 0.04 | −7.69 |
| ENIN | 43.32*** | 6.41 | 6.75 | 46.35*** | 6.35 | 7.29 | 47.51*** | 3.28 | 14.45 |
| FOSS | −14.16*** | 1.33 | −10.64 | −14.95*** | 1.30 | −11.46 | −17.28*** | 0.34 | −50.67 |
| GEFF | 86.22*** | 30.62 | 2.81 | 110.62*** | 30.04 | 3.68 | 284.21*** | 10.29 | 27.62 |
| CH4P | 70.06*** | 13.54 | 5.17 | 68.79*** | 13.34 | 5.15 | 51.97*** | 4.67 | 11.11 |
| TCL | 8.16216e-05*** | 2.53084e-05 | 3.22 | 8.11878e-05*** | 2.51170e-05 | 3.23 | 2.20238e-05*** | 8.18672e-06 | 2.69 |
| Statistics | Mean dependent var | 2453.03 | 2453.03 | ||||||
| Sum squared resid | 76859902 | 1.81e+09 | 1552.56 | ||||||
| LSDV R-squared | 0.994240 | 0.97 | |||||||
| LSDV F(136, 1828) | 2320.14 | 8974.34 | |||||||
| Log-likelihood | −13177.41 | −16278.88 | −2556.75 | ||||||
| Schwarz criterion | 27393.73 | 32641.17 | 5196.92 | ||||||
| S.D. dependent var | 2606.591 | 2606.59 | |||||||
| S.E. of regression | 205.0510 | 961.05 | 0.89 | ||||||
| Within R-squared | 0.691222 | 0. | |||||||
| P-value(F) | 0.000000 | 0.00 | |||||||
| Akaike criterion | 26628.82 | 32579.75 | 5135.510 | ||||||
| Hannan-Quinn | 26909.93 | 32602.32 | 5158.081 | ||||||
| Durbin-Watson | 1.06 | 1.06 | |||||||
| Tests | Test statistic: F(10, 1828) = 409.21 with p-value = P(F(10, 1828) > 409.21) = 0 | 'Between' variance = 2.30111e+006 'Within' variance = 39114.5 mean theta = 0.963999 | Test for normality of residual - Null hypothesis: error is normally distributed Test statistic: Chi-square(2) = 2205.13 with p-value = 0 |
||||||
| Test for differing group intercepts - Null hypothesis: The groups have a common intercept Test statistic: F(126, 1828) = 126.433 with p-value = P(F(126, 1828) > 126.433) = 0 | Joint test on named regressors Asymptotic test statistic: Chi square(10) = 4422.15 with p-value = 0 |
Pesaran CD test for cross-sectional dependence - Null hypothesis: No cross-sectional dependence Asymptotic test statistic: z = 7.27548 with p-value = 3.45201e-13 | |||||||
| Distribution free Wald test for heteroskedasticity - Null hypothesis: the units have a common error variance Asymptotic test statistic: Chi-square(124) = 2.37516e+29 with p-value = 0 |
Breusch-Pagan test - Null hypothesis: Variance of the unit-specific error = 0 Asymptotic test statistic: Chi-square(1) = 6288.96 with p-value = 0 |
||||||||
|
Test for normality of residual - Null hypothesis: error is normally distributed Test statistic: Chi-square(2) = 6679.36 with p-value = 0 |
Hausman test - Null hypothesis: GLS estimates are consistent Asymptotic test statistic: Chi-square(10) = 61.5036 with p-value = 1.88023e-09 |
||||||||
| Wooldridge test for autocorrelation in panel data - Null hypothesis: No first-order autocorrelation (rho = -0.5) Test statistic: F(1, 121) = 46.1894 with p-value = P(F(1, 121) > 46.1894) = 4.31079e-10 |
Test for normality of residual - Null hypothesis: error is normally distributed Test statistic: Chi-square(2) = 1818.88 with p-value = 0 |
||||||||
| Pesaran CD test for cross-sectional dependence - Null hypothesis: No cross-sectional dependence Asymptotic test statistic: z = 12.2128 with p-value = 2.6556e-34 |
Wooldridge test for autocorrelation in panel data - Null hypothesis: No first-order autocorrelation (rho = -0.5) Test statistic: F(1, 121) = 46.1894 with p-value = P(F(1, 121) > 46.1894) = 4.31079e-10 |
||||||||
| Pesaran CD test for cross-sectional dependence - Null hypothesis: No cross-sectional dependence Asymptotic test statistic: z = 10.7956 with p-value = 3.61098e-27 | |||||||||
Note: This table reports panel regression results linking energy use per capita (ENUS) to Environmental ESG indicators across 127 countries. Fixed Effects, GLS, and WLS estimators are compared to assess robustness. Results highlight the dominant role of emissions, resource use, and energy efficiency in shaping energy consumption patterns. Asterisks indicate statistical significance levels: *** p < 0.01, ** p < 0.05, and * p < 0.10.
Table 3.
Comparison of Clustering and Classification Models for ESG–Energy Use Analysis.
| Model | R² | AIC | BIC | Silhouette | Max Diameter | Min Separation | Pearson’s γ | Dunn | Entropy | Calinski–Harabasz | HH Index |
| Density-Based | 1.000 | 1.000 | 1.000 | 1.000 | 0.270 | 0.541 | 0.677 | 0.522 | 0.000 | 0.114 | 0.828 |
| Fuzzy C-Means | 0.173 | 0.032 | 0.049 | 0.000 | 0.000 | 0.000 | 0.000 | 0.000 | 0.687 | 0.417 | 0.000 |
| Hierarchical | 0.000 | 0.000 | 0.000 | 1.000 | 0.640 | 1.000 | 1.000 | 1.000 | 1.000 | 0.000 | 1.000 |
| K-Means | 0.497 | 0.566 | 0.567 | 0.700 | 1.000 | 0.143 | 0.356 | 0.211 | 0.336 | 1.000 | 1.000 |
| Random Forest | 0.389 | 0.438 | 0.438 | 0.100 | 0.173 | 0.651 | 0.227 | 0.595 | 0.290 | 0.659 | 1.000 |
Note: This table compares alternative clustering and classification approaches using multiple goodness-of-fit, separation, and information criteria. The metrics evaluate model performance in identifying ESG–energy use regimes, highlighting the relative strengths of K-Means and density-based methods in capturing structured patterns linking energy use to environmental sustainability indicators.
Table 5.
K-Means Environmental ESG Regimes and Energy Use per Capita (ENUS).
| Cluster | 1 | 2 | 3 | 4 | 5 | 6 | 7 | 8 | 9 | 10 |
| Size | 153 | 141 | 344 | 451 | 69 | 332 | 153 | 66 | 88 | 54 |
| Explained proportion within-cluster heterogeneity | 0.142 | 0.063 | 0.138 | 0.142 | 0.050 | 0.132 | 0.139 | 0.103 | 0.057 | 0.034 |
| Within sum of squares | 2.879 | 1.275 | 2.806 | 2.887 | 1.016 | 2.680 | 2.818 | 2.097 | 1.162 | 684.816 |
| Silhouette score | 0.059 | 0.271 | 0.190 | 0.247 | 0.271 | 0.131 | 0.115 | 0.281 | 0.169 | 0.299 |
| Center ENUS | 0.240 | -0.817 | -0.572 | 0.455 | -0.409 | -0.273 | -0.811 | 3.286 | 0.203 | 1.451 |
| Center ACFT | 0.699 | -1.582 | -0.164 | 0.712 | -0.865 | 0.311 | -2.019 | 0.735 | 0.335 | 0.722 |
| Center ACEL | 0.513 | -1.156 | 0.145 | 0.528 | -1.199 | 0.453 | -2.370 | 0.530 | 0.330 | 0.513 |
| Center ASNR | 0.559 | -0.283 | -0.252 | -0.510 | 3.153 | -0.173 | 0.534 | 0.955 | -0.248 | -0.219 |
| Center ASFD | -0.254 | -0.035 | -0.157 | -0.277 | 0.581 | -0.273 | 2.171 | -0.286 | -0.280 | -0.287 |
| Center AGRL | -1.284 | 0.719 | -0.106 | -0.168 | -0.982 | 0.762 | 0.124 | -0.649 | 1.046 | -0.861 |
| Center AFFV | -0.434 | 1.464 | 0.009 | -0.740 | -0.441 | 0.083 | 2.046 | -0.867 | -0.272 | -0.718 |
| Center AFWW | 0.896 | -0.125 | -0.186 | -0.176 | -0.196 | -0.134 | -0.190 | 2.091 | -0.193 | -0.189 |
| Center CO2P | 0.323 | -0.829 | -0.559 | 0.320 | -0.440 | -0.130 | -0.894 | 3.281 | 0.391 | 1.385 |
| Center CDD | 0.863 | 1.383 | 0.675 | -1.017 | 0.604 | -0.707 | 0.572 | 1.656 | -0.653 | -0.869 |
| Center ENIM | -0.275 | 0.160 | 0.171 | 0.365 | -3.234 | 0.259 | 0.042 | -1.085 | 0.000 | -0.032 |
| Center ENIN | -0.001 | -0.050 | -0.519 | -0.399 | -0.229 | 0.358 | 1.212 | 0.830 | -0.234 | 0.799 |
| Center FRST | -0.890 | -0.472 | 0.587 | 0.371 | 2.036 | -0.541 | -0.024 | -1.391 | -0.663 | 0.489 |
| Center FOSS | 1.084 | -0.769 | -0.020 | 0.027 | -0.776 | 0.564 | -2.132 | 1.159 | 0.340 | 0.436 |
| Center GEFF | 0.052 | -0.823 | -0.409 | 1.124 | -1.246 | -0.439 | -1.072 | 0.398 | 0.806 | 0.745 |
| Center HI35 | 0.238 | 1.110 | -0.204 | -0.357 | -0.359 | -0.332 | -0.208 | 3.805 | -0.307 | -0.345 |
| Center HDD | -0.639 | -0.767 | -0.809 | 0.809 | -0.926 | 0.657 | -0.858 | -0.864 | 0.414 | 2.160 |
| Center LST | 1.138 | 0.914 | 0.495 | -1.010 | 0.335 | -0.353 | 0.685 | 1.572 | -0.344 | -1.884 |
| Center WSTR | 0.231 | -0.149 | -0.220 | -0.186 | -0.289 | -0.088 | -0.244 | 4.047 | -0.259 | -0.232 |
| Center CH4P | 0.099 | -0.524 | -0.166 | -0.399 | 0.686 | -0.253 | -0.415 | 3.276 | 1.738 | 0.498 |
| Center N2OP | -0.299 | -0.514 | -0.270 | -0.014 | -0.383 | -0.161 | 0.122 | -0.569 | 3.416 | 0.292 |
| Center PM25 | 0.359 | 1.930 | -0.252 | -0.708 | 0.021 | -0.004 | 0.346 | 2.234 | -0.800 | -0.952 |
| Center RELE | -0.987 | -0.451 | 0.367 | 0.091 | 0.347 | -0.290 | 1.170 | -1.111 | 0.163 | -0.001 |
| Center RENC | -0.982 | 1.084 | 0.100 | -0.266 | 0.895 | -0.524 | 2.107 | -1.065 | -0.298 | -0.568 |
| Center SPEI | -0.512 | 0.048 | 0.151 | 0.099 | 0.225 | -0.130 | 0.203 | -0.810 | 0.000 | 0.463 |
| Center TCL | -0.301 | -0.225 | 0.184 | -0.235 | -0.206 | -0.207 | -0.063 | -0.311 | -0.124 | 4.523 |
Table 6.
Environmental ESG Cluster Profiles and Energy Use per Capita (Standardized K-Means Centroids).
Table 6.
Environmental ESG Cluster Profiles and Energy Use per Capita (Standardized K-Means Centroids).
| Cluster | ENUS | ACFT | ACEL | ASNR | ASFD | AGRL | AFFV | AFWW | CO2P | CDD | ENIM | ENIN | TCL |
| 1 | 0.513 | 0.699 | -0.434 | 0.896 | -1.284 | -0.254 | 0.559 | 0.863 | 0.099 | 0.323 | -0.275 | -6.971×10⁻⁴ | 0.231 |
| 2 | -1.156 | -1.582 | 1.464 | -0.125 | 0.719 | -0.035 | -0.283 | 1.383 | -0.524 | -0.829 | 0.160 | -0.050 | -0.149 |
| 3 | 0.145 | -0.164 | 0.009 | -0.186 | -0.106 | -0.157 | -0.252 | 0.675 | -0.166 | -0.559 | 0.171 | -0.519 | -0.220 |
| 4 | 0.528 | 0.712 | -0.740 | -0.176 | -0.168 | -0.277 | -0.510 | -1.017 | -0.399 | 0.320 | 0.365 | -0.399 | -0.186 |
| 5 | -1.199 | -0.865 | -0.441 | -0.196 | -0.982 | 0.581 | 3.153 | 0.604 | 0.686 | -0.440 | -3.234 | -0.229 | -0.289 |
| 6 | 0.453 | 0.311 | 0.083 | -0.134 | 0.762 | -0.273 | -0.173 | -0.707 | -0.253 | -0.130 | 0.259 | 0.358 | -0.088 |
| 7 | -2.370 | -2.019 | 2.046 | -0.190 | 0.124 | 2.171 | 0.534 | 0.572 | -0.415 | -0.894 | 0.042 | 1.212 | -0.244 |
| 8 | 0.530 | 0.735 | -0.867 | 2.091 | -0.649 | -0.286 | 0.955 | 1.656 | 3.276 | 3.281 | -1.085 | 0.830 | 4.047 |
| 9 | 0.330 | 0.335 | -0.272 | -0.193 | 1.046 | -0.280 | -0.248 | -0.653 | 1.738 | 0.391 | 3.225×10⁻⁴ | -0.234 | -0.259 |
| 10 | 0.513 | 0.722 | -0.718 | -0.189 | -0.861 | -0.287 | -0.219 | -0.869 | 0.498 | 1.385 | -0.032 | 0.799 | -0.232 |
| FRST | FOSS | GEFF | HI35 | HDD | LST | WSTR | CH4P | N2OP | PM25 | RELE | RENC | SPEI | |
| 1 | 0.240 | 1.084 | -0.890 | 0.052 | -0.639 | 0.238 | 1.138 | -0.299 | 0.359 | -0.987 | -0.982 | -0.512 | -0.301 |
| 2 | -0.817 | -0.769 | -0.472 | -0.823 | -0.767 | 1.110 | 0.914 | -0.514 | 1.930 | -0.451 | 1.084 | 0.048 | -0.225 |
| 3 | -0.572 | -0.020 | 0.587 | -0.409 | -0.809 | -0.204 | 0.495 | -0.270 | -0.252 | 0.367 | 0.100 | 0.151 | 0.184 |
| 4 | 0.455 | 0.027 | 0.371 | 1.124 | 0.809 | -0.357 | -1.010 | -0.014 | -0.708 | 0.091 | -0.266 | 0.099 | -0.235 |
| 5 | -0.409 | -0.776 | 2.036 | -1.246 | -0.926 | -0.359 | 0.335 | -0.383 | 0.021 | 0.347 | 0.895 | 0.225 | -0.206 |
| 6 | -0.273 | 0.564 | -0.541 | -0.439 | 0.657 | -0.332 | -0.353 | -0.161 | -0.004 | -0.290 | -0.524 | -0.130 | -0.207 |
| 7 | -0.811 | -2.132 | -0.024 | -1.072 | -0.858 | -0.208 | 0.685 | 0.122 | 0.346 | 1.170 | 2.107 | 0.203 | -0.063 |
| 8 | 3.286 | 1.159 | -1.391 | 0.398 | -0.864 | 3.805 | 1.572 | -0.569 | 2.234 | -1.111 | -1.065 | -0.810 | -0.311 |
| 9 | 0.203 | 0.340 | -0.663 | 0.806 | 0.414 | -0.307 | -0.344 | 3.416 | -0.800 | 0.163 | -0.298 | 4.777×10⁻⁴ | -0.124 |
| 10 | 1.451 | 0.436 | 0.489 | 0.745 | 2.160 | -0.345 | -1.884 | 0.292 | -0.952 | -9.149×10⁻⁴ | -0.568 | 0.463 | 4.523 |
Note: This table reports standardized centroid values for ten K-Means clusters linking energy use per capita (ENUS) with environmental, climate, and energy-system indicators. The clusters identify distinct ESG–Environment regimes, highlighting heterogeneous combinations of emissions, resource use, climate stress, and energy structures that shape cross-country energy consumption patterns.
Table 7.
Comparative Performance of Machine Learning Models in Predicting Energy Use per Capita (ENUS).
Table 7.
Comparative Performance of Machine Learning Models in Predicting Energy Use per Capita (ENUS).
| Model | MSE | MSE (scaled) | RMSE | MAE / MAD | MAPE | R² |
| Boosting | 0.55 | 0.75 | 0.49 | 0.32 | 0.22 | 0.74 |
| Decision Tree | 1.00 | 0.73 | 0.59 | 0.70 | 0.78 | 0.70 |
| KNN | 0.69 | 1.00 | 1.00 | 1.00 | 1.00 | 1.00 |
| Linear Regression | 0.52 | 0.34 | 0.44 | 0.19 | 0.13 | 0.47 |
| Random Forest | 1.00 | 0.92 | 0.92 | 0.98 | 0.81 | 0.85 |
| Regularized Linear | 0.53 | 0.54 | 0.49 | 0.27 | 0.09 | 0.63 |
| SVM | 0.00 | 0.00 | 0.00 | 0.00 | 0.00 | 0.00 |
Table 8.
Variable Importance from Dropout Loss Analysis in the ESG Environmental Pillar.
| Variables | Mean dropout loss | Variables | Mean dropout loss |
| CO2P | 916.076 | HI35 | 309.783 |
| WSTR | 734.972 | AFFV | 309.632 |
| AFWW | 568.696 | ENIN | 301.560 |
| GEFF | 529.801 | PM25 | 299.433 |
| TCL | 488.285 | ASNR | 270.603 |
| CH4P | 403.829 | FOSS | 269.217 |
| N2OP | 357.762 | LST | 245.489 |
| ENIM | 339.636 | HDD | 243.425 |
| AGRL | 335.590 | ACFT | 232.056 |
| RELE | 331.240 | SPEI | 231.137 |
| FRST | 321.240 | CDD | 218.313 |
| RENC | 212.666 | ACEL | 185.019 |
| ASFD | 195.173 |
Note: This table reports mean dropout loss values measuring the relative importance of environmental variables in predicting energy use per capita (ENUS). Higher values indicate stronger contributions to predictive accuracy. Results highlight emissions, pollution, resource use, and energy efficiency as dominant drivers, confirming ENUS as a key nexus linking environmental pressure, sustainability, and energy demand within the ESG framework.
Table 9.
Counterfactual Decomposition of Energy Use per Capita under the ESG Environmental Pillar.
| Case | Predicted | Base | ACFT | ACEL | ASNR | ASFD | AGRL | AFFV | AFWW | CO2P | CDD | ENIM | ENIN |
| 1 | 1.026.064 | 2.482.340 | -34.266 | 11.052 | -0.314 | 5.470 | -51.860 | -199.945 | -42.576 | -209.377 | 32.548 | -33.753 | -89.027 |
| 2 | 1.055.150 | 2.482.340 | 48.756 | 9.378 | -218.049 | -0.645 | -73.869 | 13.684 | -46.538 | -224.857 | -74.373 | -101.819 | -39.940 |
| 3 | 1.203.802 | 2.482.340 | 84.970 | 42.681 | -85.961 | -8.711 | 62.497 | 12.050 | -35.045 | -198.555 | -232.975 | -107.761 | -22.484 |
| 4 | 1.308.443 | 2.482.340 | 55.255 | 33.459 | -17.950 | -11.227 | -2.864 | 40.771 | -35.484 | -188.546 | 5.315 | -205.868 | 9.810 |
| 5 | 401.406 | 2.482.340 | -70.478 | 8.006 | -255.979 | -3.749 | -1.407 | 2.422 | -51.127 | -258.641 | -6.068 | 82.074 | -77.746 |
| FRST | FOSS | GEFF | HI35 | HDD | LST | WSTR | CH4P | N2OP | PM25 | RELE | RENC | SPEI | TCL |
| -27.040 | -48.318 | -145.717 | -2.857 | 13.458 | -19.985 | -106.578 | -227.003 | -90.027 | 2.258 | -377.400 | -12.477 | 311.853 | -114.396 |
| -40.914 | 33.985 | -181.966 | -96.752 | -2.448 | -160.650 | -119.575 | -106.678 | -28.875 | -3.208 | 10.581 | 30.222 | 22.823 | -75.463 |
| -91.178 | 88.151 | -173.502 | -107.219 | 37.559 | -186.353 | -79.788 | -172.211 | -70.901 | 23.393 | -26.623 | 73.919 | -11.270 | -93.220 |
| 91.059 | 62.658 | -179.616 | -101.010 | -187.969 | -169.573 | -117.791 | -137.228 | -47.203 | 24.524 | -30.514 | 53.121 | -21.280 | -95.747 |
| 0.359 | -230.392 | -310.404 | -1.149 | -260.395 | -79.400 | -99.709 | -177.618 | -2.734 | 0.000 | -208.376 | -85.670 | -8.902 | 16.150 |
Note: This table reports counterfactual attribution results decomposing predicted energy use per capita (ENUS) into baseline levels and marginal contributions from environmental, climate, emissions, resource-use, and energy-system variables. Negative values indicate downward pressure on energy consumption, highlighting how decarbonization, efficiency gains, pollution control, and resource management jointly shape ENUS within the ESG Environmental framework.
Table 10.
Social Determinants of Energy Use per Capita within the ESG–Social Pillar.
| Observation | 2018 | ||||||||
| Cross Sectional units | 150 | ||||||||
| Time Series Length | minimum 1, maximum 18 | ||||||||
| Dependent Variable | ENUS | ||||||||
| Model | Fixed-effects | Random-effects (GLS) | WLS | ||||||
| Coefficient | Std. Error | t-ratio | Coefficient | Std. Error | z | Coefficient | Std. Error | t-ratio | |
| const | 3611.23*** | 721.03 | 5.00 | 2790.87*** | 741.270 | 3.765 | −18710.2 | 412.381 | −45.37 |
| FDPI | −3.23*** | 0.81 | −3.97 | −3.77*** | 0.799348 | −4.718 | −8.00153 | 0.857473 | −9.332 |
| HBED | 174.82*** | 16.38 | 10.67 | 181.01*** | 16.0032 | 11.31 | 286.057 | 8.47390 | 33.76 |
| LEXP | −28.84*** | 9.22 | −3.12 | −21.88** | 9.10707 | −2.403 | 273.571 | 5.63210 | 48.57 |
| U5MR | −5.95*** | 2.36 | −2.52 | −5.98*** | 2.31683 | −2.582 | 28.1757 | 0.918075 | 30.69 |
| POP65 | −45.85** | 10.03 | −4.56 | −45.33*** | 9.67267 | −4.687 | −107.324 | 4.98385 | −21.53 |
| OVWT | 28.93*** | 4.49 | 6.44 | 29.83*** | 4.30905 | 6.923 | 22.4842 | 1.14521 | 19.63 |
| Statistics | Mean dependent var | 2621.35 | Mean dependent var | 2621.354 | Sum squared resid | 1636.410 | |||
| Sum squared resid | 2.58e+08 | Sum squared resid | 1.57e+10 | R-squared | 0.844852 | ||||
| LSDV R-squared | 0.98 | Log-likelihood | −18873.27 | F(6, 2011) | 1825.143 | ||||
| LSDV F(155, 1862) | 783.42 | Schwarz criterion | 37799.81 | Log-likelihood | −2651.930 | ||||
| Log-likelihood | −14726.89 | rho | 0.572590 | Schwarz criterion | 5357.128 | ||||
| Schwarz criterion | 30640.92 | S.D. dependent var | 2908.895 | S.E. of regression | 0.902070 | ||||
| rho | 0.57 | S.E. of regression | 2793.393 | Adjusted R-squared | 0.844390 | ||||
| S.D. dependent var | 2908.89 | Akaike criterion | 37760.54 | P-value(F) | 0.000000 | ||||
| S.E. of regression | 372.06 | Hannan-Quinn | 37774.95 | Akaike criterion | 5317.859 | ||||
| Within R-squared | 0.11 | Durbin-Watson | 0.679448 | Hannan-Quinn | 5332.271 | ||||
| P-value(F) | 0.00 | ||||||||
| Akaike criterion | 29765.78 | ||||||||
| Hannan-Quinn | 30086.97 | ||||||||
| Durbin-Watson | 0.67 | ||||||||
| Tests | Joint test on named regressors - Test statistic: F(6, 1862) = 39.885 with p-value = P(F(6, 1862) > 39.885) = 7.43509e-46 | 'Between' variance = 6.91053e+006 'Within' variance = 127728 mean theta = 0.954259 Joint test on named regressors - Asymptotic test statistic: Chi-square(6) = 257.296 with p-value = 1.13064e-52 |
Test for normality of residual - Null hypothesis: error is normally distributed Test statistic: Chi-square(2) = 3509.23 with p-value = 0 |
||||||
| Distribution free Wald test for heteroskedasticity -Null hypothesis: the units have a common error variance Asymptotic test statistic: Chi-square(143) = 2.98964e+31 with p-value = 0 | Breusch-Pagan test - Null hypothesis: Variance of the unit-specific error = 0 Asymptotic test statistic: Chi-square(1) = 13464.5 with p-value = 0 |
Pesaran CD test for cross-sectional dependence - Null hypothesis: No cross-sectional dependence Asymptotic test statistic: z = 49.6655 with p-value = 0 |
|||||||
| Test for differing group intercepts -Null hypothesis: The groups have a common intercept Test statistic: F(149, 1862) = 535.374 with p-value = P(F(149, 1862) > 535.374) = 0 | Hausman test - Null hypothesis: GLS estimates are consistent Asymptotic test statistic: Chi-square(6) = 37.9345 with p-value = 1.15698e-06 |
||||||||
| Distribution free Wald test for heteroskedasticity -Null hypothesis: the units have a common error variance Asymptotic test statistic: Chi-square(143) = 2.98964e+31 with p-value = 0 | Test for normality of residual - Null hypothesis: error is normally distributed Test statistic: Chi-square(2) = 4069.59 with p-value = 0 |
||||||||
| Test for normality of residual - Null hypothesis: error is normally distributed Test statistic: Chi-square(2) = 7055.51 with p-value = 0 | Pesaran CD test for cross-sectional dependence - Null hypothesis: No cross-sectional dependence Asymptotic test statistic: z = 18.1795 with p-value = 7.49951e-74 |
||||||||
| Wooldridge test for autocorrelation in panel data - Null hypothesis: No first-order autocorrelation (rho = -0.5) Test statistic: F(1, 125) = 33.8258 with p-value = P(F(1, 125) > 33.8258) = 4.74157e-08 |
|||||||||
| Pesaran CD test for cross-sectional dependence - Null hypothesis: No cross-sectional dependence Asymptotic test statistic: z = 17.1453 with p-value = 6.81392e-66 | |||||||||
Note: This table reports panel regression estimates linking social indicators—health outcomes, demographics, income distribution, and welfare conditions—to energy use per capita (ENUS). Results across fixed effects, random effects, and WLS models highlight that social development and welfare improvements are systematically associated with changes in energy demand, underscoring the need for socially inclusive yet energy-efficient ESG policies. Asterisks indicate statistical significance levels: *** p < 0.01, ** p < 0.05, and * p < 0.10.
Table 11.
Comparative Evaluation of Clustering and Machine Learning Models for ESG–Social Energy Use Profiles.
Table 11.
Comparative Evaluation of Clustering and Machine Learning Models for ESG–Social Energy Use Profiles.
| Model | R² | AIC | BIC | Silhouette | Max Diameter | Min Separation | Pearson’s γ | Dunn | Entropy | Calinski–Harabasz | HH Index |
| Density Based | 1.000 | 1.000 | 1.000 | 0.000 | 0.000 | 0.242 | 0.274 | 0.124 | 0.170 | 0.000 | 0.603 |
| Fuzzy C-Means | 0.553 | 0.208 | 0.177 | 0.200 | 0.539 | 0.000 | 0.456 | 0.000 | 0.573 | 0.577 | 0.521 |
| Hierarchical | 0.000 | 0.000 | 0.000 | 1.000 | 0.774 | 1.000 | 1.000 | 1.000 | 1.000 | 0.372 | 0.000 |
| K-Means | 0.747 | 0.410 | 0.391 | 0.480 | 1.000 | 0.086 | 0.306 | 0.191 | 0.279 | 1.000 | 0.676 |
| Model Based | 0.248 | 0.030 | 0.043 | 0.200 | 0.265 | 0.393 | 0.000 | 0.248 | 0.000 | 0.589 | 0.760 |
| Random Forest | 0.392 | 0.132 | 0.128 | 0.120 | 0.265 | 0.393 | 0.000 | 0.248 | 0.000 | 0.589 | 1.000 |
Note: This table compares alternative clustering and machine learning approaches used to identify social-development regimes associated with energy use per capita (ENUS). Model performance is evaluated using goodness-of-fit, separation, compactness, and entropy measures. Results highlight K-Means as the most balanced unsupervised method, capturing heterogeneous ESG–Social energy patterns more effectively than density-based, hierarchical, or model-based alternatives.
Table 12.
Social–Energy Regimes Identified through K-Means Clustering within the ESG–S Pillar.
| Cluster | 1 | 2 | 3 | 4 | 5 | 6 | 7 | 8 | 9 | 10 |
| Size | 198 | 9 | 117 | 57 | 9 | 97 | 40 | 32 | 11 | 107 |
| Explained proportion within-cluster heterogeneity | 0.208 | 0.012 | 0.132 | 0.078 | 0.012 | 0.129 | 0.113 | 0.126 | 0.007 | 0.183 |
| Within sum of squares | 1.104 | 64.224 | 700.600 | 415.239 | 64.731 | 684.554 | 602.506 | 667.524 | 36.035 | 973.810 |
| Silhouette score | 0.204 | 0.590 | 0.149 | 0.157 | 0.481 | 0.120 | 0.165 | 0.136 | 0.645 | 0.084 |
| Center ENUS | 1.072 | -1.422 | 0.103 | -0.382 | 1.474 | -0.228 | -1.124 | -1.307 | -0.503 | -0.829 |
| Center ESRP | 0.698 | -2.484 | 0.120 | 0.182 | -0.030 | 0.383 | -1.582 | -2.777 | 0.768 | -0.311 |
| Center FERT | -0.351 | 5.256 | -0.497 | 0.330 | -0.170 | -0.584 | 0.578 | 2.568 | -0.688 | 0.204 |
| Center FDPI | 0.179 | -0.050 | -0.055 | 0.079 | 0.434 | 0.147 | -0.248 | -0.896 | 0.637 | -0.184 |
| Center GDPG | -0.343 | 0.773 | 0.195 | 0.323 | 0.031 | -0.914 | 0.975 | 1.020 | 0.861 | 0.252 |
| Center GEE | -0.381 | 0.960 | -0.451 | 1.500 | 0.191 | -0.715 | 0.101 | 1.288 | -0.047 | 0.533 |
| Center HBED | 0.369 | -1.492 | 1.146 | -0.476 | -0.284 | 0.036 | -1.050 | -1.273 | 0.386 | -0.834 |
| Center INTU | 0.987 | -2.151 | 0.035 | -0.121 | 0.601 | 0.094 | -1.578 | -1.968 | 0.366 | -0.614 |
| Center LFPR | 0.741 | 0.460 | -0.030 | -0.496 | -0.186 | -0.214 | -1.203 | 0.497 | -0.573 | -0.544 |
| Center LEXP | 0.810 | -3.179 | -0.313 | 0.082 | 0.367 | 0.446 | -1.406 | -2.453 | 0.872 | -0.199 |
| Center U5MR | -0.503 | 5.213 | -0.349 | -0.177 | -0.315 | -0.422 | 1.294 | 2.661 | -0.373 | 0.136 |
| Center NMIG | 0.221 | -0.124 | -0.083 | 0.134 | 6.059 | -0.024 | -1.387 | -0.192 | -0.106 | -0.280 |
| Center SANT | 0.827 | -2.409 | 0.195 | 0.455 | 0.799 | 0.083 | -0.984 | -1.981 | 0.856 | -1.054 |
| Center POP65 | 0.752 | -1.839 | 0.475 | -0.907 | 0.096 | 0.686 | -1.425 | -1.711 | 0.635 | -0.924 |
| Center POPD | 0.034 | -0.581 | -0.310 | -0.055 | -0.332 | -0.178 | 1.010 | -0.335 | 5.783 | -0.328 |
| Center OVWT | 0.014 | -2.695 | 0.249 | 0.397 | 1.246 | 0.333 | -1.842 | -2.203 | 1.046 | 0.550 |
| Center UNDR | -0.440 | 2.651 | -0.361 | -0.223 | -0.441 | -0.364 | 1.312 | 2.920 | -0.441 | 0.155 |
| Center PRIM | -0.111 | -3.984 | -0.438 | -0.357 | 0.067 | -0.074 | 0.853 | 1.258 | -0.174 | 0.595 |
| Center SGPI | 0.268 | -4.591 | -0.137 | 0.347 | -0.146 | 0.055 | 0.436 | -1.669 | 0.138 | 0.139 |
| Center UNEM | -0.293 | -1.385 | 0.004 | -0.376 | -0.280 | 1.606 | -0.418 | -1.093 | -0.438 | -0.050 |
Note: This table reports standardized cluster centroids linking energy use per capita (ENUS) with key social ESG indicators. The clusters reveal heterogeneous social development regimes, showing that higher welfare, demographic transition, and social inclusion often coincide with higher energy demand. Sustainable transitions therefore require decoupling social progress from environmental and energy inefficiencies.
Table 13.
Standardized Cluster Centroids of Energy Use and Social ESG Indicators (ESG–S Pillar).
| ENUS | ESRP | FERT | FDPI | GDPG | GEE | HBED | INTU | LFPR | LEXP | |
| Cluster 1 | 1.072 | 0.698 | 0.179 | -0.351 | -0.343 | -0.381 | 0.369 | 0.987 | 0.810 | 0.741 |
| Cluster 2 | -1.422 | -2.484 | -0.050 | 5.256 | 0.773 | 0.960 | -1.492 | -2.151 | -3.179 | 0.460 |
| Cluster 3 | 0.103 | 0.120 | -0.055 | -0.497 | 0.195 | -0.451 | 1.146 | 0.035 | -0.313 | -0.030 |
| Cluster 4 | -0.382 | 0.182 | 0.079 | 0.330 | 0.323 | 1.500 | -0.476 | -0.121 | 0.082 | -0.496 |
| Cluster 5 | 1.474 | -0.030 | 0.434 | -0.170 | 0.031 | 0.191 | -0.284 | 0.601 | 0.367 | -0.186 |
| Cluster 6 | -0.228 | 0.383 | 0.147 | -0.584 | -0.914 | -0.715 | 0.036 | 0.094 | 0.446 | -0.214 |
| Cluster 7 | -1.124 | -1.582 | -0.248 | 0.578 | 0.975 | 0.101 | -1.050 | -1.578 | -1.406 | -1.203 |
| Cluster 8 | -1.307 | -2.777 | -0.896 | 2.568 | 1.020 | 1.288 | -1.273 | -1.968 | -2.453 | 0.497 |
| Cluster 9 | -0.503 | 0.768 | 0.637 | -0.688 | 0.861 | -0.047 | 0.386 | 0.366 | 0.872 | -0.573 |
| Cluster 10 | -0.829 | -0.311 | -0.184 | 0.204 | 0.252 | 0.533 | -0.834 | -0.614 | -0.199 | -0.544 |
| U5MR | NMIG | SANT | POP65 | POPD | OVWT | UNDR | PRIM | SGPI | UNEM | |
| Cluster 1 | 0.221 | 0.014 | 0.752 | 0.034 | -0.111 | 0.827 | 0.268 | -0.503 | -0.440 | -0.293 |
| Cluster 2 | -0.124 | -2.695 | -1.839 | -0.581 | -3.984 | -2.409 | -4.591 | 5.213 | 2.651 | -1.385 |
| Cluster 3 | -0.083 | 0.249 | 0.475 | -0.310 | -0.438 | 0.195 | -0.137 | -0.349 | -0.361 | 0.004 |
| Cluster 4 | 0.134 | 0.397 | -0.907 | -0.055 | -0.357 | 0.455 | 0.347 | -0.177 | -0.223 | -0.376 |
| Cluster 5 | 6.059 | 1.246 | 0.096 | -0.332 | 0.067 | 0.799 | -0.146 | -0.315 | -0.441 | -0.280 |
| Cluster 6 | -0.024 | 0.333 | 0.686 | -0.178 | -0.074 | 0.083 | 0.055 | -0.422 | -0.364 | 1.606 |
| Cluster 7 | -1.387 | -1.842 | -1.425 | 1.010 | 0.853 | -0.984 | 0.436 | 1.294 | 1.312 | -0.418 |
| Cluster 8 | -0.192 | -2.203 | -1.711 | -0.335 | 1.258 | -1.981 | -1.669 | 2.661 | 2.920 | -1.093 |
| Cluster 9 | -0.106 | 1.046 | 0.635 | 5.783 | -0.174 | 0.856 | 0.138 | -0.373 | -0.441 | -0.438 |
| Cluster 10 | -0.280 | 0.550 | -0.924 | -0.328 | 0.595 | -1.054 | 0.139 | 0.136 | 0.155 | -0.050 |
Note: This table reports the standardized centroids of K-Means clusters linking energy use per capita (ENUS) with key social ESG indicators, including health, education, demographics, labor participation, and welfare conditions. The results highlight heterogeneous social–energy regimes, showing how different development and inclusion patterns correspond to distinct levels of energy consumption across clusters.
Table 14.
Comparative Performance of Machine Learning Models in Predicting Energy Use per Capita under the ESG–Social Dimension.
Table 14.
Comparative Performance of Machine Learning Models in Predicting Energy Use per Capita under the ESG–Social Dimension.
| Statistics | Boosting | Decision Tree | KNN | Linear Reg. | Random Forest | Reg. Linear | SVM |
| MSE | 0.30 | 0.63 | 0.81 | 1.00 | 0.72 | 0.00 | 0.99 |
| MSE (scaled) | 0.58 | 0.79 | 1.00 | 0.05 | 0.86 | 0.43 | 0.00 |
| RMSE | 0.30 | 0.63 | 0.81 | 1.00 | 0.69 | 0.00 | 0.99 |
| MAE / MAD | 0.45 | 0.78 | 1.00 | 0.00 | 0.83 | 0.24 | 0.09 |
| MAPE | 0.55 | 0.90 | 1.00 | 0.00 | 0.83 | 0.38 | 0.63 |
| R² | 0.61 | 0.81 | 1.00 | 0.07 | 0.90 | 0.39 | 0.00 |
Note: All metrics are normalized and directionally aligned, with higher values indicating better performance. The results show that K-Nearest Neighbors (KNN) consistently outperforms alternative models across error and goodness-of-fit measures, while Random Forest provides a strong secondary benchmark. Linear and SVM models perform poorly, reflecting limited capacity to capture non-linear social–energy relationships.
Table 15.
Dropout Loss–Based Importance of Social (ESG–S) Indicators in Explaining Energy Use per Capita.
Table 15.
Dropout Loss–Based Importance of Social (ESG–S) Indicators in Explaining Energy Use per Capita.
| Mean dropout loss | Mean dropout loss | ||
| LFPR | 611.524 | HBED | 413.209 |
| UNEM | 551.578 | SGPI | 409.330 |
| POPD | 545.278 | OVWT | 391.616 |
| NMIG | 502.293 | FDPI | 352.332 |
| GEE | 500.069 | PRIM | 343.965 |
| INTU | 466.586 | GDPG | 330.764 |
| SANT | 451.106 | FERT | 307.202 |
| LEXP | 420.755 | POP65 | 289.267 |
| ESRP | 413.453 | UNDR | 283.200 |
| U5MR | 218.821 |
Note: Mean dropout loss values measure the reduction in predictive accuracy when each social variable is removed from the model. Higher values indicate greater importance for explaining ENUS. Results show that labor market participation, demographics, health, education, and social infrastructure are key drivers of per-capita energy demand within the ESG–Social pillar.
Table 16.
Decomposition of Predicted Energy Use per Capita by Social (ESG–S) Drivers.
| Case | Predicted | Base | ESRP | FERT | FDPI | GDPG | GEE | HBED | INTU | LFPR |
| 1 | 792.695 | 2.705.222 | -14.375 | -4.125 | -74.467 | -88.392 | -1.473 | -113.716 | -54.712 | -198.639 |
| 2 | 1.162.703 | 2.705.222 | 15.679 | -97.297 | 142.385 | -15.817 | 3.609 | -224.769 | -457.930 | -380.498 |
| 3 | 1.877.300 | 2.705.222 | -168.371 | -104.373 | -14.647 | -24.638 | 28.635 | -26.239 | 11.533 | -136.806 |
| 4 | 1.920.083 | 2.705.222 | -127.689 | -183.757 | -86.132 | -44.541 | 22.820 | -44.939 | -28.373 | -53.084 |
| 5 | 1.920.083 | 2.705.222 | -131.711 | -118.909 | -28.885 | 78.130 | -73.325 | 28.862 | -136.952 | 81.271 |
| LEXP | U5MR | NMIG | SANT | POP65 | POPD | OVWT | UNDR | PRIM | SGPI | UNEM |
| -68.882 | -14.193 | -153.177 | -626.318 | -27.830 | -72.604 | -99.074 | 4.484 | -212.114 | -13.442 | -79.478 |
| -4.723 | 9.294 | -46.253 | 0.000 | -311.401 | -49.388 | 14.416 | 8.145 | -24.094 | -0.103 | -123.774 |
| -146.556 | 13.124 | -93.047 | -7.108 | -24.913 | 121.856 | -116.040 | 42.646 | -196.765 | 46.907 | -33.119 |
| -118.300 | 12.663 | -67.371 | 9.167 | -2.466 | 121.856 | -49.223 | 41.413 | -237.175 | -0.897 | 50.889 |
| -61.519 | -7.057 | -61.634 | 0.000 | 178.660 | 121.856 | 130.130 | 59.046 | -892.177 | -5.283 | 54.357 |
Note: This table reports counterfactual attribution results for predicted energy use per capita (ENUS), decomposing deviations from the baseline into marginal contributions of Social ESG variables. Negative values indicate factors reducing ENUS, while positive values indicate drivers increasing consumption. Results highlight the heterogeneous and case-specific influence of social development, demographics, labor markets, and welfare conditions on energy demand.
Table 17.
Governance (ESG–G) Determinants of Energy Use per Capita: Panel Data Regression Results.
| Cross Sectional Units | 150 | ||||||||
| Observations | 2583 | ||||||||
| Time-series length | minimum 2, maximum 19 | ||||||||
| Dependent variable | ENUS | ||||||||
| Model | Random-effects (GLS) | Fixed-effects | WLS | ||||||
| Coefficient | Std. Error | z | Coefficient | Std. Error | t-ratio | Coefficient | Std. Error | t-ratio | |
| const | 2309.64*** | 189.02 | 12.22 | 2422.82*** | 30.40 | 79.69 | 2435.29*** | 26.75 | 91.03 |
| PSAV | 63.20** | 27.13 | 2.33 | 65.5070** | 27.00 | 2.42 | 305.68*** | 16.86 | 18.12 |
| WPAR | −5.27*** | 1.39 | −3.78 | −5.21*** | 1.38 | −3.75 | −15.02*** | 0.99 | −15.15 |
| RLAW | 278.16*** | 51.23 | 5.42 | 202.72*** | 52.17 | 3.88 | 1214.96*** | 17.28 | 70.30 |
| SCIA | 0.001*** | 0.0004 | 3.50 | 0.001*** | 0.0004 | 3.45 | 0.001*** | 0.0002 | 7.36 |
| Statistics | Mean dependent var | 2325.795 | Mean dependent var | 2325.795 | Sum squared resid | 2236.719 | |||
| Sum squared resid | 1.70e+10 | Sum squared resid | 3.50e+08 | R-squared | 0.851133 | ||||
| Log-likelihood | −23938.64 | LSDV R-squared | 0.981915 | F(4, 2578) | 3684.863 | ||||
| Schwarz criterion | 47916.56 | LSDV F(153, 2429) | 861.9665 | Log-likelihood | −3479.218 | ||||
| rho | 0.668619 | Log-likelihood | −18928.24 | Schwarz criterion | 6997.719 | ||||
| S.D. dependent var | 2739.678 | Schwarz criterion | 39066.41 | S.E. of regression | 0.931460 | ||||
| S.E. of regression | 2564.714 | rho | 0.668619 | Adjusted R-squared | 0.850902 | ||||
| Akaike criterion | 47887.28 | S.D. dependent var | 2739.678 | P-value(F) | 0.000000 | ||||
| Hannan-Quinn | 47897.89 | S.E. of regression | 379.8601 | Akaike criterion | 6968.435 | ||||
| Durbin-Watson | 0.495404 | Within R-squared | 0.024375 | Hannan-Quinn | 6979.049 | ||||
| P-value(F) | 0.000000 | ||||||||
| Akaike criterion | 38164.48 | ||||||||
| Hannan-Quinn | 38491.38 | ||||||||
| Durbin-Watson | 0.495404 | ||||||||
| Tests | 'Between' variance = 5.14683e+006 'Within' variance = 144294 mean theta = 0.956691 Joint test on named regressors - Asymptotic test statistic: Chi-square(4) = 82.6342 with p-value = 4.81647e-17 |
Joint test on named regressors - Test statistic: F(4, 2429) = 15.1715 with p-value = P(F(4, 2429) > 15.1715) = 2.95076e-12 |
Test for normality of residual - Null hypothesis: error is normally distributed Test statistic: Chi-square(2) = 7257.06 with p-value = 0 |
||||||
| Breusch-Pagan test - Null hypothesis: Variance of the unit-specific error = 0 Asymptotic test statistic: Chi-square(1) = 19601 with p-value = 0 |
Test for differing group intercepts - Null hypothesis: The groups have a common intercept Test statistic: F(149, 2429) = 585.769 with p-value = P(F(149, 2429) > 585.769) = 0 |
Pesaran CD test for cross-sectional dependence - Null hypothesis: No cross-sectional dependence Asymptotic test statistic: z = 8.34184 with p-value = 7.3144e-17 |
|||||||
| Hausman test - Null hypothesis: GLS estimates are consistent Asymptotic test statistic: Chi-square(4) = 43.9773 with p-value = 6.48586e-09 |
Distribution free Wald test for heteroskedasticity - Null hypothesis: the units have a common error variance Asymptotic test statistic: Chi-square(150) = 1.64677e+30 with p-value = 0 |
||||||||
| Test for normality of residual - Null hypothesis: error is normally distributed Test statistic: Chi-square(2) = 7163.76 with p-value = 0 |
Test for normality of residual - Null hypothesis: error is normally distributed Test statistic: Chi-square(2) = 13673.9 with p-value = 0 |
||||||||
| Wooldridge test for autocorrelation in panel data - Null hypothesis: No first-order autocorrelation (rho = -0.5) Test statistic: F(1, 148) = 50.7529 with p-value = P(F(1, 148) > 50.7529) = 4.25198e-11 |
Wooldridge test for autocorrelation in panel data - Null hypothesis: No first-order autocorrelation (rho = -0.5) Test statistic: F(1, 148) = 50.7529 with p-value = P(F(1, 148) > 50.7529) = 4.25198e-11 |
||||||||
| Pesaran CD test for cross-sectional dependence - Null hypothesis: No cross-sectional dependence Asymptotic test statistic: z = 9.18194 with p-value = 4.23398e-20 |
Pesaran CD test for cross-sectional dependence - Null hypothesis: No cross-sectional dependence Asymptotic test statistic: z = 10.6857 with p-value = 1.18793e-26 |
||||||||
Note: This table reports random-effects, fixed-effects, and WLS panel estimations assessing the impact of governance indicators on energy use per capita (ENUS). Results show that political stability, rule of law, and scientific capacity significantly increase ENUS, while women’s political representation moderates consumption. Findings highlight governance quality as a key structural driver shaping energy demand within the ESG framework. Asterisks indicate statistical significance levels: *** p < 0.01, ** p < 0.05, and * p < 0.10.
Table 18.
Comparative Performance of Clustering Algorithms for ESG–Governance and Energy Use Analysis.
Table 18.
Comparative Performance of Clustering Algorithms for ESG–Governance and Energy Use Analysis.
| Statistics | Density-Based | Fuzzy C-Means | Hierarchical | Model-Based | K-Means | Random Forest |
| R² (max) | 0.000 | 0.867 | 0.788 | 0.749 | 1.000 | 0.755 |
| AIC (min) | 0.000 | 0.889 | 0.776 | 0.735 | 1.000 | 0.740 |
| BIC (min) | 0.000 | 0.886 | 0.769 | 0.728 | 1.000 | 0.733 |
| Silhouette (max) | 1.000 | 0.167 | 0.611 | 0.019 | 0.389 | 0.000 |
| Maximum diameter (min) | 0.014 | 0.569 | 1.000 | 0.258 | 0.542 | 0.000 |
| Minimum separation (max) | 1.000 | 0.005 | 0.268 | 0.000 | 0.009 | 0.091 |
| Pearson’s γ (max) | 0.324 | 0.344 | 1.000 | 0.023 | 0.382 | 0.000 |
| Dunn index (max) | 1.000 | 0.034 | 0.795 | 0.000 | 0.034 | 0.080 |
| Entropy (min) | 1.000 | 0.080 | 0.555 | 0.000 | 0.031 | 0.022 |
| Calinski–Harabasz (max) | 0.000 | 0.625 | 0.405 | 0.347 | 1.000 | 0.355 |
| HH Index (min) | 0.000 | 0.959 | 0.636 | 1.000 | 0.992 | 0.979 |
Note: This table compares alternative clustering techniques using normalized statistical, geometric, and information-based criteria. It supports the selection of model-based and probabilistic approaches as robust tools for integrating governance, environmental, and institutional ESG variables in a replicable framework for analyzing energy use per capita (ENUS).
Table 19.
Governance–Energy Regimes Identified by Model-Based Clustering (ESG–G Dimension).
| ENUS | CCOR | PSAV | WPAR | RQUA | RLAW | SCIA | VACC | |
| Cluster 1 | -0.652 | -0.102 | -1.090 | -0.649 | -0.529 | 0.087 | -0.564 | -0.200 |
| Cluster 2 | 1.173 | 0.626 | 0.495 | 1.220 | 1.133 | 0.777 | 0.839 | -0.024 |
| Cluster 3 | -0.530 | -0.241 | -0.487 | -0.665 | -0.804 | -0.225 | -0.729 | 0.525 |
| Cluster 4 | -0.420 | -0.534 | -0.256 | -0.341 | -0.264 | -0.278 | -0.042 | 0.378 |
| Cluster 5 | 0.546 | 0.121 | 0.740 | 0.728 | 0.829 | -0.006 | 0.943 | 0.077 |
| Cluster 6 | 0.007 | -0.568 | -0.341 | -0.101 | -0.139 | -0.260 | -0.164 | -0.742 |
| Cluster 7 | 2.014 | 0.966 | 1.359 | 1.810 | 1.596 | -0.043 | 1.578 | 1.343 |
| Cluster 8 | -0.866 | -0.622 | -0.383 | -0.889 | -0.811 | -0.283 | -0.611 | -0.481 |
| Cluster 9 | 0.589 | 2.881 | 0.588 | 0.608 | 0.478 | -0.255 | -0.684 | -0.763 |
| Cluster 10 | 0.476 | 0.798 | 0.049 | 0.574 | 0.493 | 7.091 | -0.207 | 0.007 |
Note: This table reports standardized cluster centroids for energy use per capita (ENUS) and key governance indicators within the ESG–G dimension. The results identify distinct governance–energy regimes, showing that high-quality, balanced institutional systems—combining regulatory quality, rule of law, stability, accountability, and innovation—are systematically associated with higher and more sustainable ENUS outcomes, supporting an eco-efficient ESG-driven development path.
Table 20.
Component-Level Governance Profiles and Average Effects on Energy Use per Capita (ENUS).
| ENUS | CCOR | PSAV | WPAR | RQUA | RLAW | SCIA | VACC | |
| Component 1 | -0.109 | -0.653 | -1.103 | -0.212 | -0.538 | -0.645 | 0.082 | -0.572 |
| Component 2 | 0.614 | 1.156 | 0.484 | -0.031 | 1.120 | 1.206 | 0.767 | 0.821 |
| Component 3 | -0.250 | -0.529 | -0.483 | 0.505 | -0.790 | -0.657 | -0.226 | -0.716 |
| Component 4 | -0.533 | -0.413 | -0.249 | 0.360 | -0.263 | -0.342 | -0.278 | -0.036 |
| Component 5 | 0.125 | 0.549 | 0.742 | 0.084 | 0.830 | 0.729 | -0.005 | 0.944 |
| Component 6 | -0.570 | -8.527×10⁻⁴ | -0.334 | -0.743 | -0.135 | -0.109 | -0.261 | -0.153 |
| Component 7 | 0.967 | 2.013 | 1.359 | 1.340 | 1.595 | 1.808 | -0.045 | 1.578 |
| Component 8 | -0.621 | -0.871 | -0.379 | -0.476 | -0.818 | -0.893 | -0.283 | -0.619 |
| Component 9 | 2.902 | 0.593 | 0.590 | -0.756 | 0.480 | 0.610 | -0.255 | -0.685 |
| Component 10 | 0.799 | 0.477 | 0.051 | 0.006 | 0.494 | 0.575 | 7.074 | -0.204 |
Table 21.
Comparative Predictive Performance of Machine Learning Algorithms for Energy Use per Capita (ENUS).
Table 21.
Comparative Predictive Performance of Machine Learning Algorithms for Energy Use per Capita (ENUS).
| Statistics | Boosting | Decision Tree | KNN | Linear Regression | Random Forest | Regularized Linear | SVM |
| MSE | 0.447 | 0.343 | 1.000 | 0.115 | 0.968 | 0.230 | 0.000 |
| MSE(scaled) | 0.195 | 0.384 | 1.000 | 0.063 | 0.792 | 0.055 | 0.000 |
| RMSE | 0.256 | 0.192 | 0.979 | 0.059 | 1.000 | 0.124 | 0.000 |
| MAE / MAD | 0.214 | 0.935 | 0.984 | 0.000 | 1.000 | 0.905 | 0.115 |
| MAPE | 0.170 | 0.949 | 1.000 | 0.042 | 0.973 | 0.017 | 0.000 |
| R² | 0.166 | 0.339 | 1.000 | 0.051 | 0.763 | 0.045 | 0.000 |
Table 22.
Variable Importance of Governance (ESG–G) Indicators Based on KNN Mean Dropout Loss.
| Variables | Mean Dropout loss |
| RQUA | 3,09E+09 |
| VACC | 2,90E+09 |
| RLAW | 2,36E+09 |
| CCOR | 2,02E+09 |
| WPAR | 1,89E+09 |
| PSAV | 1,87E+09 |
| SCIA | 1,10E+09 |
Table 23.
Additive Decomposition of Predicted Energy Use per Capita by Governance (ESG–G) Drivers.
| Case | Predicted | Base | CCOR | PSAV | WPAR | RQUA | RLAW | SCIA | VACC |
| 1 | 716,623 | 2323,932 | -360,666 | -208,855 | 160,001 | -216,536 | -582,971 | -69,064 | -329,218 |
| 2 | 716,623 | 2323,932 | -409,6 | -187,832 | -33,525 | 311,552 | -531,51 | -75,637 | -681,298 |
| 3 | 712,288 | 2323,932 | -138,979 | -79,883 | -90,6 | 522,084 | -1335,48 | -78,539 | -410,245 |
| 4 | 786,071 | 2323,932 | -1201,36 | 72,405 | -321,148 | 627,14 | -184,722 | -79,808 | -450,371 |
| 5 | 824,374 | 2323,932 | -1219,78 | 32,906 | -148,544 | 686,258 | -357,65 | -109,028 | -383,723 |
Table 24.
Integrated ESG Dimensions and Their Aggregate Effects on Energy Use per Capita (ENUS).
| ESG Dimension | Acronyms | Aggregate Effects on ENUS | Interpretation and Macro Implications |
| E – Environment | CO2P, ENIN, FOSS, RENC, FRST, AFWW, WSTR, PM25, LST, TCL | Positive net effect: Higher CO₂ emissions, energy intensity, fossil fuel use, and water withdrawals increase ENUS. Negative moderating effects from renewable energy consumption (RENC) and forest area (FRST). | Energy use reflects the carbon and resource intensity of national systems. In fossil-based economies, ENUS rises with environmental degradation; in cleaner systems, renewables and forest preservation decouple energy demand from emissions. Environmental governance determines whether energy use supports or undermines sustainability. |
| S – Social | ACEL, ACFT, ESRP, GEE, LEXP, LFPR, UNEM, SANT, FERT, POPD | Positive developmental effect: Improved electricity and clean fuel access (ACEL, ACFT) increase ENUS; social progress (education, sanitation, life expectancy) raises sustainable energy demand. Negative moderating effect from low unemployment (UNEM) and reduced fertility (FERT). | The S dimension amplifies energy demand through modernization and welfare expansion. Energy use supports human development, but efficiency and equity must guide energy access. Social inclusivity and energy sustainability are interdependent. |
| G – Governance | CCOR, PSAV, RQUA, RLAW, VACC, SCIA | Moderating and enabling effect: High governance quality (RQUA, RLAW, CCOR) and innovation capacity (SCIA) lower the environmental intensity of ENUS while maintaining stable growth. Political stability (PSAV) enhances renewable energy investments. | Governance acts as a systemic stabilizer: effective institutions transform energy consumption into efficient, low-emission development. Strong regulation, transparency, and innovation capacity enable ESG-aligned energy transitions. |
Note: This table synthesizes evidence from panel econometrics, clustering, and machine learning to summarize how Environmental, Social, and Governance (ESG) dimensions jointly shape ENUS. It highlights ENUS as both an outcome and a driver of sustainability, emphasizing context-dependent trade-offs among emissions, resource efficiency, social development, and institutional quality.
Disclaimer/Publisher’s Note: The statements, opinions and data contained in all publications are solely those of the individual author(s) and contributor(s) and not of MDPI and/or the editor(s). MDPI and/or the editor(s) disclaim responsibility for any injury to people or property resulting from any ideas, methods, instructions or products referred to in the content. |
© 2025 by the authors. Licensee MDPI, Basel, Switzerland. This article is an open access article distributed under the terms and conditions of the Creative Commons Attribution (CC BY) license (http://creativecommons.org/licenses/by/4.0/).
Copyright: This open access article is published under a Creative Commons CC BY 4.0 license, which permit the free download, distribution, and reuse, provided that the author and preprint are cited in any reuse.


