
Submitted:
24 December 2025
Posted:
25 December 2025
You are already at the latest version
Abstract
Located in northeastern Algeria, the Tébessa region is characterized by a semi-arid climate. Due to the scarcity of surface water resources, groundwater has become the primary source for domestic, agricultural, and industrial use. However, the shallow aquifer system in the area is highly vulnerable to contamination and is increasingly impacted by various pollution phenomena. To investigate the extent and spatial distribution of groundwater pollution, hydrochemical data from about seventy sampling campaigns conducted in 2005, 2006, and 2018 were analyzed. Special attention was given to nitrate (NO₃⁻) concentrations, a key indicator of agricultural and domestic pollution, alongside other chemical tracers such as chloride (Cl⁻), sulfate (SO₄²⁻), and sodium (Na⁺). Multivariate statistical analyses, including Principal Component Analysis (PCA) and Hierarchical Cluster Analysis (HCA), were employed to identify the dominant factors controlling groundwater chemistry and to classify water types and pollution levels across the study area. The results reveal significant spatial variability in groundwater quality, with elevated nitrate levels and other contamination indicators (Na⁺, Cl⁻, SO₄²⁻) particularly concentrated in recharge zones affected by unregulated agricultural practices and wastewater discharge. This situation, suggesting significant anthropogenic influence and highlighting the urgent need for groundwater protection strategies.
Keywords:
groundwater quality
; nitrate pollution
; recharge zones
; PCA
; HCA
; hydrochemical assessment
; Tébessa
; Algeria
1. Introduction
Groundwater represents a vital and often irreplaceable resource in semi-arid regions, particularly in North Africa, where increasing demographic pressure, agricultural intensification, and climate variability exacerbate water scarcity (Scanlon et al., 2012; FAO, 2020).
In recent years, the Tébessa region, located in northeastern Algeria, has experienced a prolonged and severe drought marked by a significant rainfall deficit. This climatic stress has had a profound impact on surface water flows, notably the drying up of streams and springs, and has critically reduced the natural recharge of shallow aquifers. The resulting degradation of the ecological balance has not only accelerated groundwater pollution but also weakened the natural environment, with cascading effects on the region’s socio-economic development and sustainability.
The study region relies heavily on shallow aquifers to meet domestic, agricultural, and industrial demands due to the limited availability of surface water. However, this growing dependence has raised concerns about the long-term sustainability and quality of groundwater, especially in the face of mounting anthropogenic pressures. Groundwater can be polluted by a range of biological and chemical agents, including bacteria, viruses, and anthropogenic pollutants (Coleman et al., 2013).
Identifying the sources and mechanisms of groundwater contamination requires an integrated approach combining geochemical, isotopic, microbiological, and statistical analyses (Marjoua et al., 1997; Fakir et al., 2001; El Moujabber et al., 2006; Ben Hamouda et al., 2009; Kouzana et al., 2009; Mondal et al., 2010; Malana & Khosa, 2011; Belghiti et al., 2013; Yu et al., 2013; Kim et al., 2014; Kumar, 2014). Among the various contaminants, nitrate (NO3−) pollution is of particular concern due to its health implications and its widespread presence in shallow aquifers, often linked to agricultural runoff, livestock waste, and insufficient wastewater management (Aghzar, 2002).
Nitrate contamination, primarily resulting from excessive fertilizer use, inadequate wastewater treatment, and infiltration from agricultural return flows, has emerged as a critical threat to groundwater quality worldwide (Wakida & Lerner, 2005; Rivett et al., 2008). High nitrate concentrations in drinking water are linked to public health issues such as infant methemoglobinemia and chronic diseases (WHO, 2017; Ward et al., 2018). Thus, understanding the spatial patterns and drivers of nitrate pollution is essential for groundwater resource protection and sustainable land-use planning.
This study aims to identify zones vulnerable to nitrate contamination in the Tébessa region by applying multivariate statistical tools—Principal Component Analysis (PCA) and Hierarchical Cluster Analysis (HCA)—to a robust hydrochemical dataset collected over multiple years. Combined with GIS-based spatial analysis, this approach provides an integrated framework to evaluate groundwater quality, determine the influence of recharge zones, and support evidence-based water management strategies.
2. Materials and Methods
2.1. Study Area
The study area is located in the central part of the Tébessa-Morsott fault basin, situated at the northeastern extremity of Algeria, covering approximately 140 km2. It is part of the larger Medjerda river basin and the smaller Méllègue sub-basin (Figure 1). Previous hydro-climatic studies by several authors have confirmed the semi-arid climate of the Tébessa region, with significant variability in hydrological parameters both temporally and spatially.
This semi-arid region experiences annual rainfall that does not exceed 396.97 mm, and the average annual temperature is around 16 °C. Rainfall events are often torrential, leading to increased runoff and very limited infiltration due to the soil characteristics. The water balance, based on 30 years of climatic data, reveals a high actual evapotranspiration rate of 91.47%, with a small surplus of 8.53%. The annual agricultural deficit of 504.99 mm corresponds to a six-month drought period, from May to October. The surplus period is limited to the three months of January, February, and March, with an average annual surplus of 33.85 mm. Runoff and infiltration account for 6.97% and 1.56%, respectively (Bendekkoum, 2017; Seghir, K. 2008).
2.2. Geomorphological Overview
The Tébessa plain as a whole is considered a major graben that intersects orthogonally with southwest-northeast trending folds as well as large fractures. This plain is surrounded on both sides by limestone massifs, separated by depressions. The Tébessa Boulhaf-Dyr area represents a high point formed by large carbonated cliffs, including Djebel Dyr and Djebel Guenifida to the north, and the series of Djebels Doukane, Mestirie, Tazent, and Bouziane to the south. These two mountain chains, reaching elevations above 1,400 meters at Kef Ahmed in the north and 1,600 meters at Djebel Doukane in the south, are characterized by sharp ridges and cliffs that have been clearly shaped by erosional processes.
The primary watercourse, Kebir-Chabro-Ksob, which drains both surface and groundwater from the Tébessa-Morsott watershed, flows through this plain in a southeast-northwest direction, with a very slight gradient (Figure 2)
2.3. Geological and Hydrogeological Framework
The Tébessa-Boulhaf Dyr area constitutes the central part of the Tébessa-Morsott graben (DUROZOY G., 1949). It is composed of two major indigenous sedimentary formations:
- Carbonate formation with limestone and marl facies, which forms the outcrops along the margins and the Djebels.
- Alluvial fill sediments, which characterize the plain.
The geological parameters of the study area are illustrated in Figure 3.
2.4. Structural Features and Hydrogeological Context
The main structural features of the Saharan Atlas result from tectonic movements that have shaped the paleogeographic and structural evolution of the region. These features include:
- The folding of sedimentary series: This is characterized by a series of folds with large radii of curvature, where the framework is composed primarily of Cretaceous limestone layers. The anticlines are followed by large synclinal structures, with the core made of Eocene limestones. The key structural elements are marked by the homogeneity of folding in a northeast-southwest direction, a consequence of the Atlas tectonic phase during the late Eocene.
- The genesis of grabens: These post-Mio-Pliocene grabens are elongated in a northwest-southeast direction and are accompanied by large faults in the same direction, forming the general structure of the region. They are part of the landscape at the Algerian-Tunisian border and extend over several kilometers (Morsott-Tébessa grabens). These grabens are bounded by major normal faults, typically resulting either from a distensive phase or induced by the translation of blocks in a northeast-southwest direction through dextral rotation (J.P. Richart, 1969).
In the Mio-Pliocene-Quaternary alluvial fill, which forms the Tébessa plain, there exists a highly potential aquifer with considerable hydraulic capacity due to its great thickness and favorable hydrodynamic properties. This aquifer consists of lenticular horizons with very heterogeneous facies, primarily made up of large white limestone gravels, limestone pebbles, and mixtures of gravel, sand, and clay. The water table is sub-surface in wells located near the Oued Chabro Ksob, with the static level varying between 10 and 50 meters in wells situated in other catchment fields.
Piezometric surveys indicate that the general direction of groundwater flow is southeast-northwest, with moderate to high piezometric gradients from upstream to downstream. This aquifer is recharged underground by the carbonate outcrops along its margins. The rivers, Oued Kébir and Oued Chabro Ksob, drain this alluvial aquifer at certain points (Figure 4).
2.5. Water Sample Collection
In this study, water sample collection was conducted at multiple points within the region, including wells, boreholes, springs, and surface water sources (rivers). Sampling occurred during four periods: May 2005, November 2005, May 2006, and 2018. Wells were selected based on their geographic location and their use for drinking and irrigation purposes. The depth of the sampled wells ranged from 30 to 80 meters. For traditional wells, samples were collected with sterilized buckets, while for pumped wells, samples were taken after pumping ceased. All necessary precautions were observed to prevent contamination. Sample filtration was carried out using 0.45 mm cellulose filters. Chemical and physical analyses were performed on-site for parameters such as pH, temperature, conductivity, total alkalinity, and total carbonate alkalinity using a WTW multi-parameter device.
Major ion analysis (Ca2+, Mg2+, Na+, K+, Cl-, SO42-, HCO3-, NO3) was conducted using ICP-MS, while anions were measured by ion chromatography. Samples were stored under appropriate conditions and transported to specialized laboratories for further analysis. ArcGIS was used for chemical element mapping, and statistical analyses were performed using Xstat software to evaluate chemical data using Principal Component Analysis (PCA), Discriminant Analysis (DA), and Hierarchical Clustering (CAH).
2.6. Normality Tests
The statistical analysis of the physico-chemical data began with normality tests conducted using XlStat software. These tests were performed employing several methods, including Shapiro-Wilk, Anderson-Darling, Lilliefors, and Jarque-Bera, for key parameters such as Total Dissolved Solids (TDS), Sulfates (representative of major ions), and Nitrates (a surface pollution indicator). Two distinct sets of calculations were carried out: one on the raw, untransformed data and another on the logarithmically transformed data (Figures 5a,5b).
3. Results
The results of the physico-chemical analysis of the water are presented in Table 1, which displays the statistical averages of the elements for all the sampled water points.
The chemical data of the main elements are represented in the following maps (Figure 6, Figure 7, Figure 8 and Figure 9):
3.3. Statistical Results
a/Normality tests
The results of the normality tests are provided in Table 2, Table 3 and Table 4 (Table 2, Table 3 and Table 4). The P-P plot and Q-Q plot diagrams for TDS, Sulfates, and Nitrates are shown in Figure 10, Figure 11 and Figure 12.
Two series of calculations were performed: one on the untransformed data and the other on the logarithmic transformation of the data. Two figures present the comparison between the distribution graphs of the individuals on the F1/F2 axes to demonstrate the importance of transforming the data into logarithmic form (Figure 13a,b).
b/Principal component analysis (PCA)
The results of the PCA analysis of the untransformed chemical data and the log-transformed data are presented in tables (14,15):

Table 5.
Correlation between chemical parameters (data not transformed into logs).
| Variables | Ca(mg/l | Mg(mg/l | Na (mg/l) | K(mg/l | SO4(mg/l | NO3(mg/l | Cl(mg/l) | HCO3(mg/l | TDS |
|---|---|---|---|---|---|---|---|---|---|
| Ca(mg/l | 1 | 0,646 | 0,321 | 0,153 | 0,664 | 0,058 | 0,403 | 0,222 | 0,622 |
| Mg(mg/l | 0,646 | 1 | 0,608 | -0,032 | 0,837 | 0,111 | 0,557 | 0,417 | 0,823 |
| Na (mg/l) | 0,321 | 0,608 | 1 | -0,049 | 0,539 | 0,621 | 0,943 | 0,406 | 0,911 |
| K(mg/l | 0,153 | -0,032 | -0,049 | 1 | -0,092 | 0,170 | 0,102 | -0,079 | 0,013 |
| SO4(mg/l | 0,664 | 0,837 | 0,539 | -0,092 | 1 | 0,001 | 0,447 | 0,223 | 0,773 |
| NO3(mg/l | 0,058 | 0,111 | 0,621 | 0,170 | 0,001 | 1 | 0,659 | 0,184 | 0,471 |
| Cl(mg/l) | 0,403 | 0,557 | 0,943 | 0,102 | 0,447 | 0,659 | 1 | 0,355 | 0,887 |
| HCO3(mg/l | 0,222 | 0,417 | 0,406 | -0,079 | 0,223 | 0,184 | 0,355 | 1 | 0,499 |
| TDS | 0,622 | 0,823 | 0,911 | 0,013 | 0,773 | 0,471 | 0,887 | 0,499 | 1 |
Table 6.
Correlation between chemical parameters (log-transformed data).
| Variables | Ca(mg/l | Mg(mg/l | Na (mg/l) | K(mg/l | SO4(mg/l | NO3(mg/l | Cl(mg/l) | HCO3(mg/l | TDS |
|---|---|---|---|---|---|---|---|---|---|
| Ca(mg/l | 1 | 0,643 | 0,423 | 0,366 | 0,568 | 0,186 | 0,455 | 0,107 | 0,635 |
| Mg(mg/l | 0,643 | 1 | 0,770 | 0,146 | 0,818 | 0,194 | 0,568 | 0,162 | 0,847 |
| Na (mg/l) | 0,423 | 0,770 | 1 | 0,078 | 0,846 | 0,105 | 0,767 | 0,170 | 0,895 |
| K(mg/l | 0,366 | 0,146 | 0,078 | 1 | 0,123 | 0,190 | 0,270 | 0,046 | 0,136 |
| SO4(mg/l | 0,568 | 0,818 | 0,846 | 0,123 | 1 | -0,017 | 0,675 | -0,003 | 0,833 |
| NO3(mg/l | 0,186 | 0,194 | 0,105 | 0,190 | -0,017 | 1 | 0,080 | 0,147 | 0,199 |
| Cl(mg/l) | 0,455 | 0,568 | 0,767 | 0,270 | 0,675 | 0,080 | 1 | 0,087 | 0,711 |
| HCO3(mg/l | 0,107 | 0,162 | 0,170 | 0,046 | -0,003 | 0,147 | 0,087 | 1 | 0,334 |
| TDS | 0,635 | 0,847 | 0,895 | 0,136 | 0,833 | 0,199 | 0,711 | 0,334 | 1 |
Table 7.
Correlations between variables and factors.
| F1 | F2 | F3 | F4 | |
|---|---|---|---|---|
| Ca(mg/l | 0,712 | 0,262 | -0,254 | -0,067 |
| Mg(mg/l | 0,896 | -0,038 | 0,042 | 0,123 |
| Na (mg/l) | 0,905 | -0,218 | 0,123 | 0,057 |
| K(mg/l | 0,265 | 0,625 | -0,560 | -0,384 |
| SO4(mg/l | 0,897 | -0,292 | -0,108 | 0,038 |
| NO3(mg/l | 0,198 | 0,714 | 0,147 | 0,640 |
| Cl(mg/l) | 0,800 | -0,083 | -0,127 | -0,097 |
| HCO3(mg/l | 0,221 | 0,395 | 0,764 | -0,455 |
| TDS | 0,956 | -0,021 | 0,190 | 0,004 |
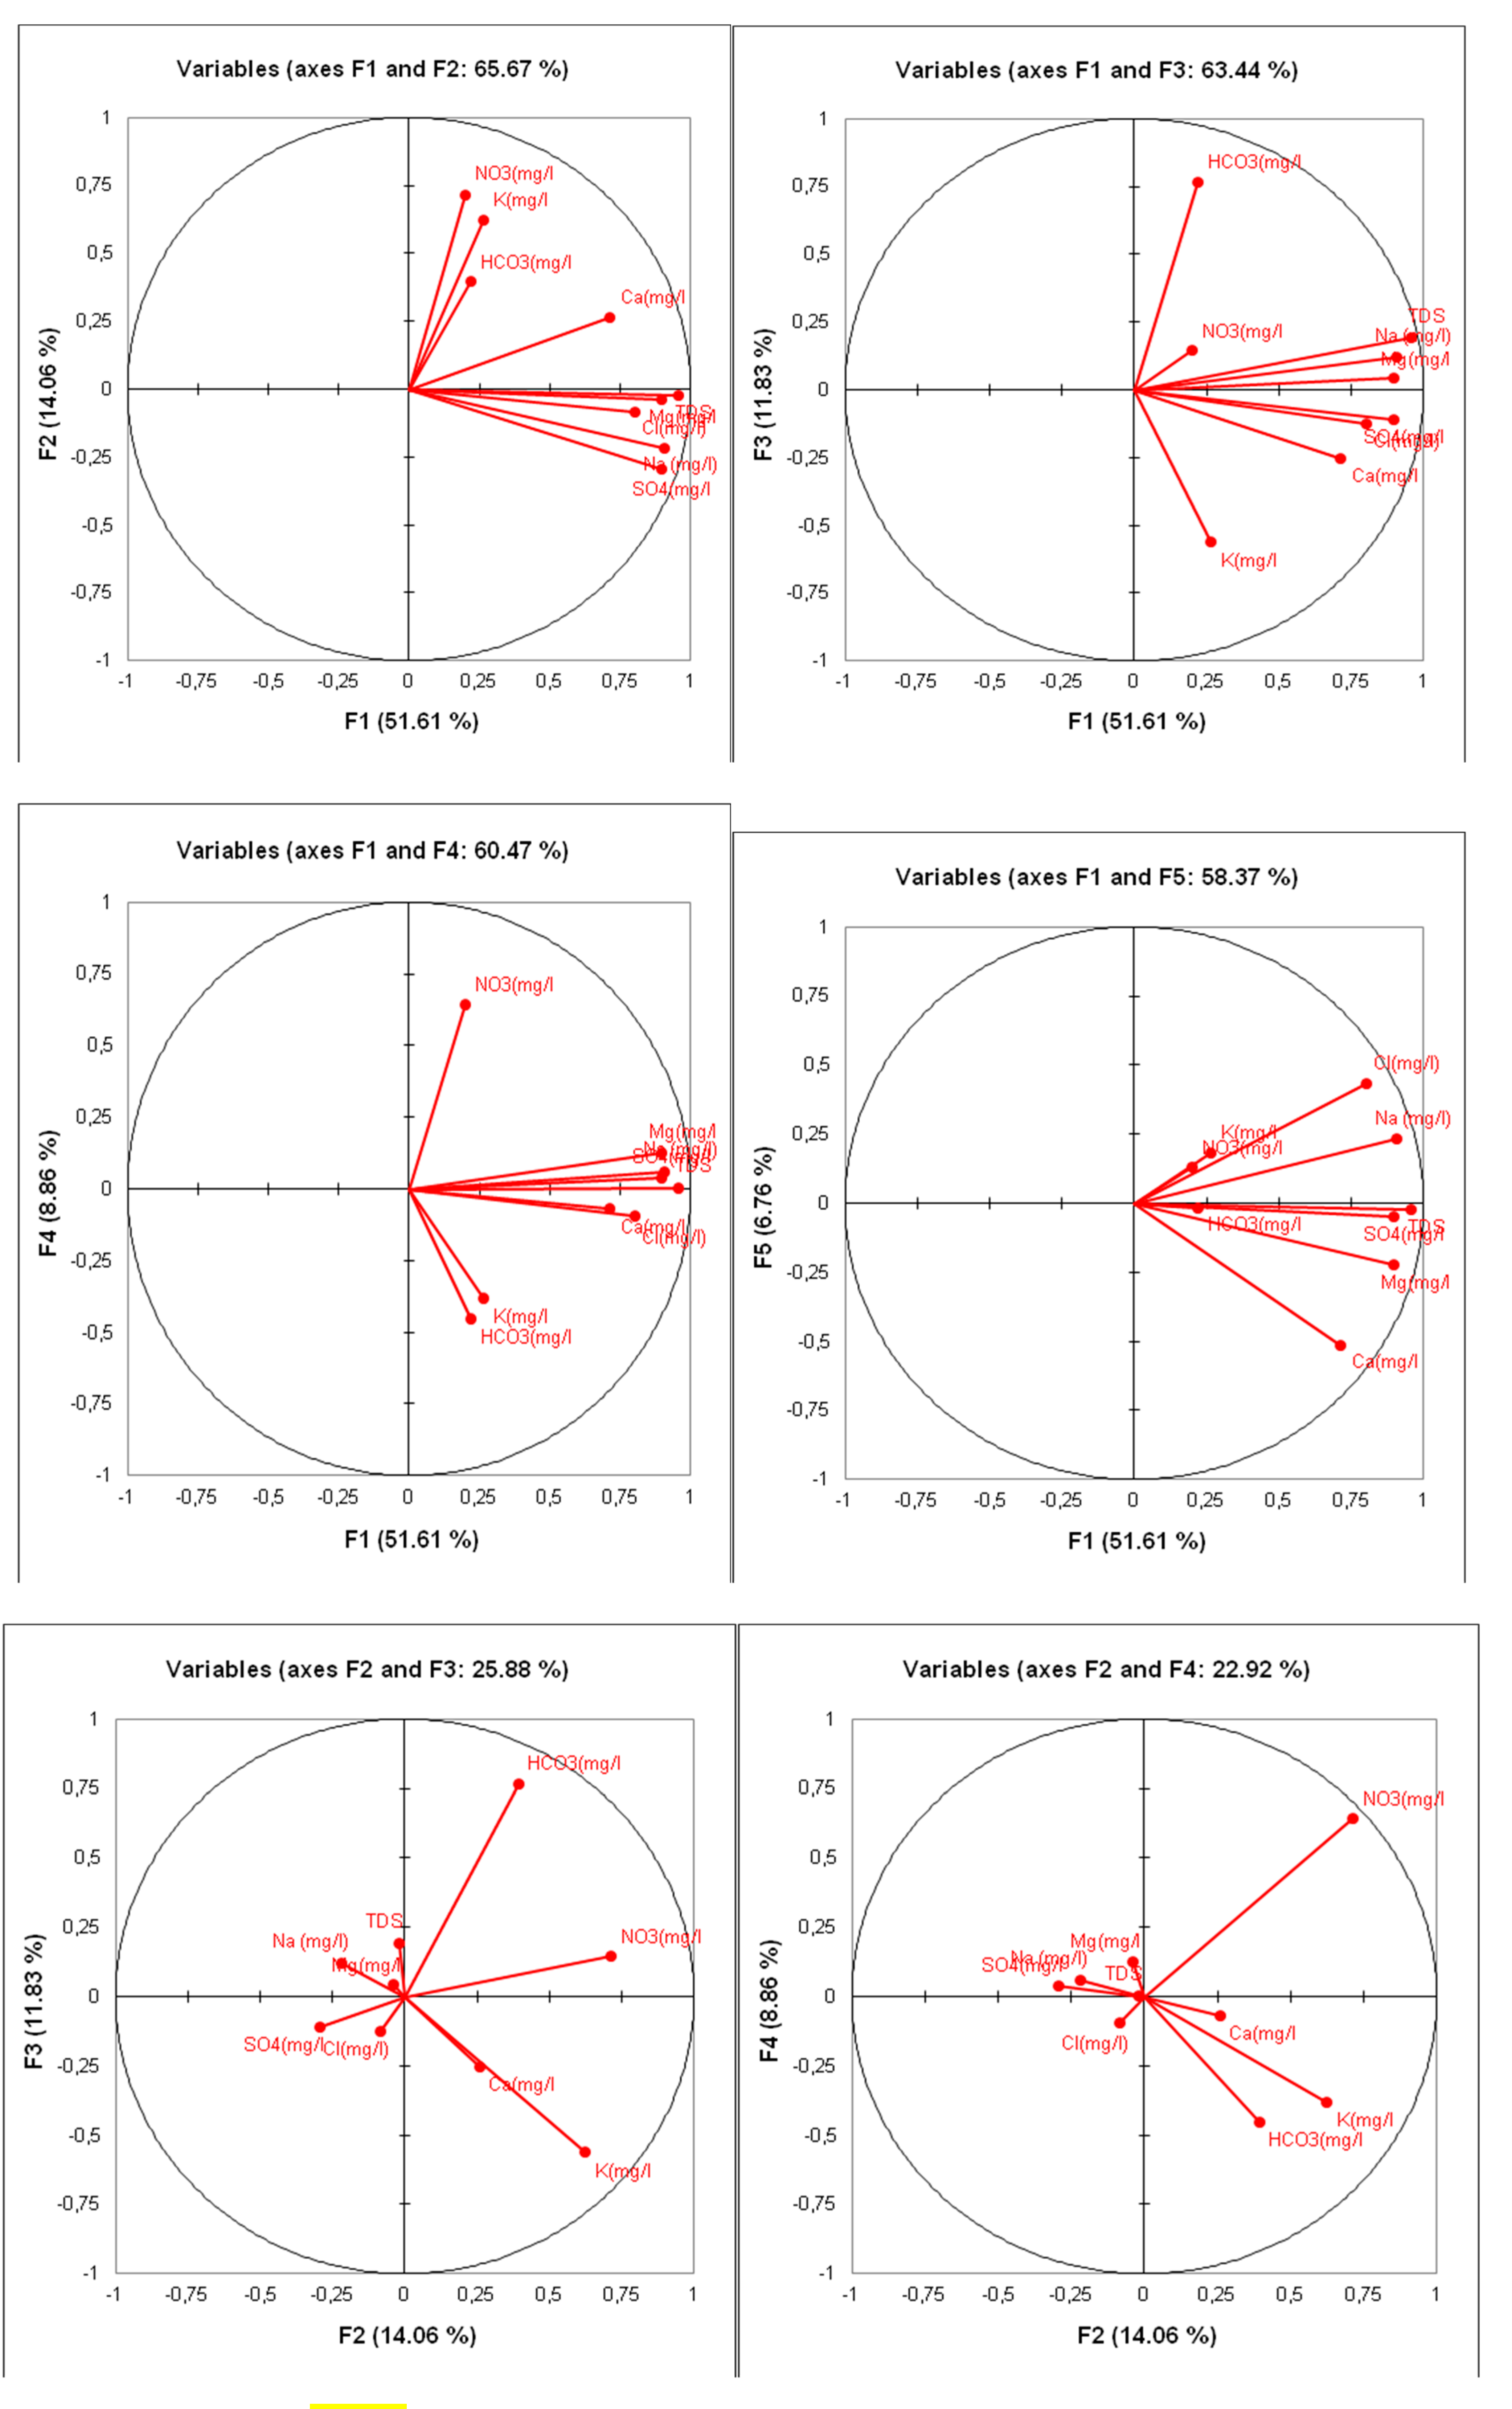
Figure 16.
Correlation circles for the F1/F2, F1/F3 and F1/F4 axes.
The distribution diagrams are shown in the following figures (Figure 17):
Figure 17.
Distribution diagrams of water points on axes F1/F2,F1/F3,F1/F4.
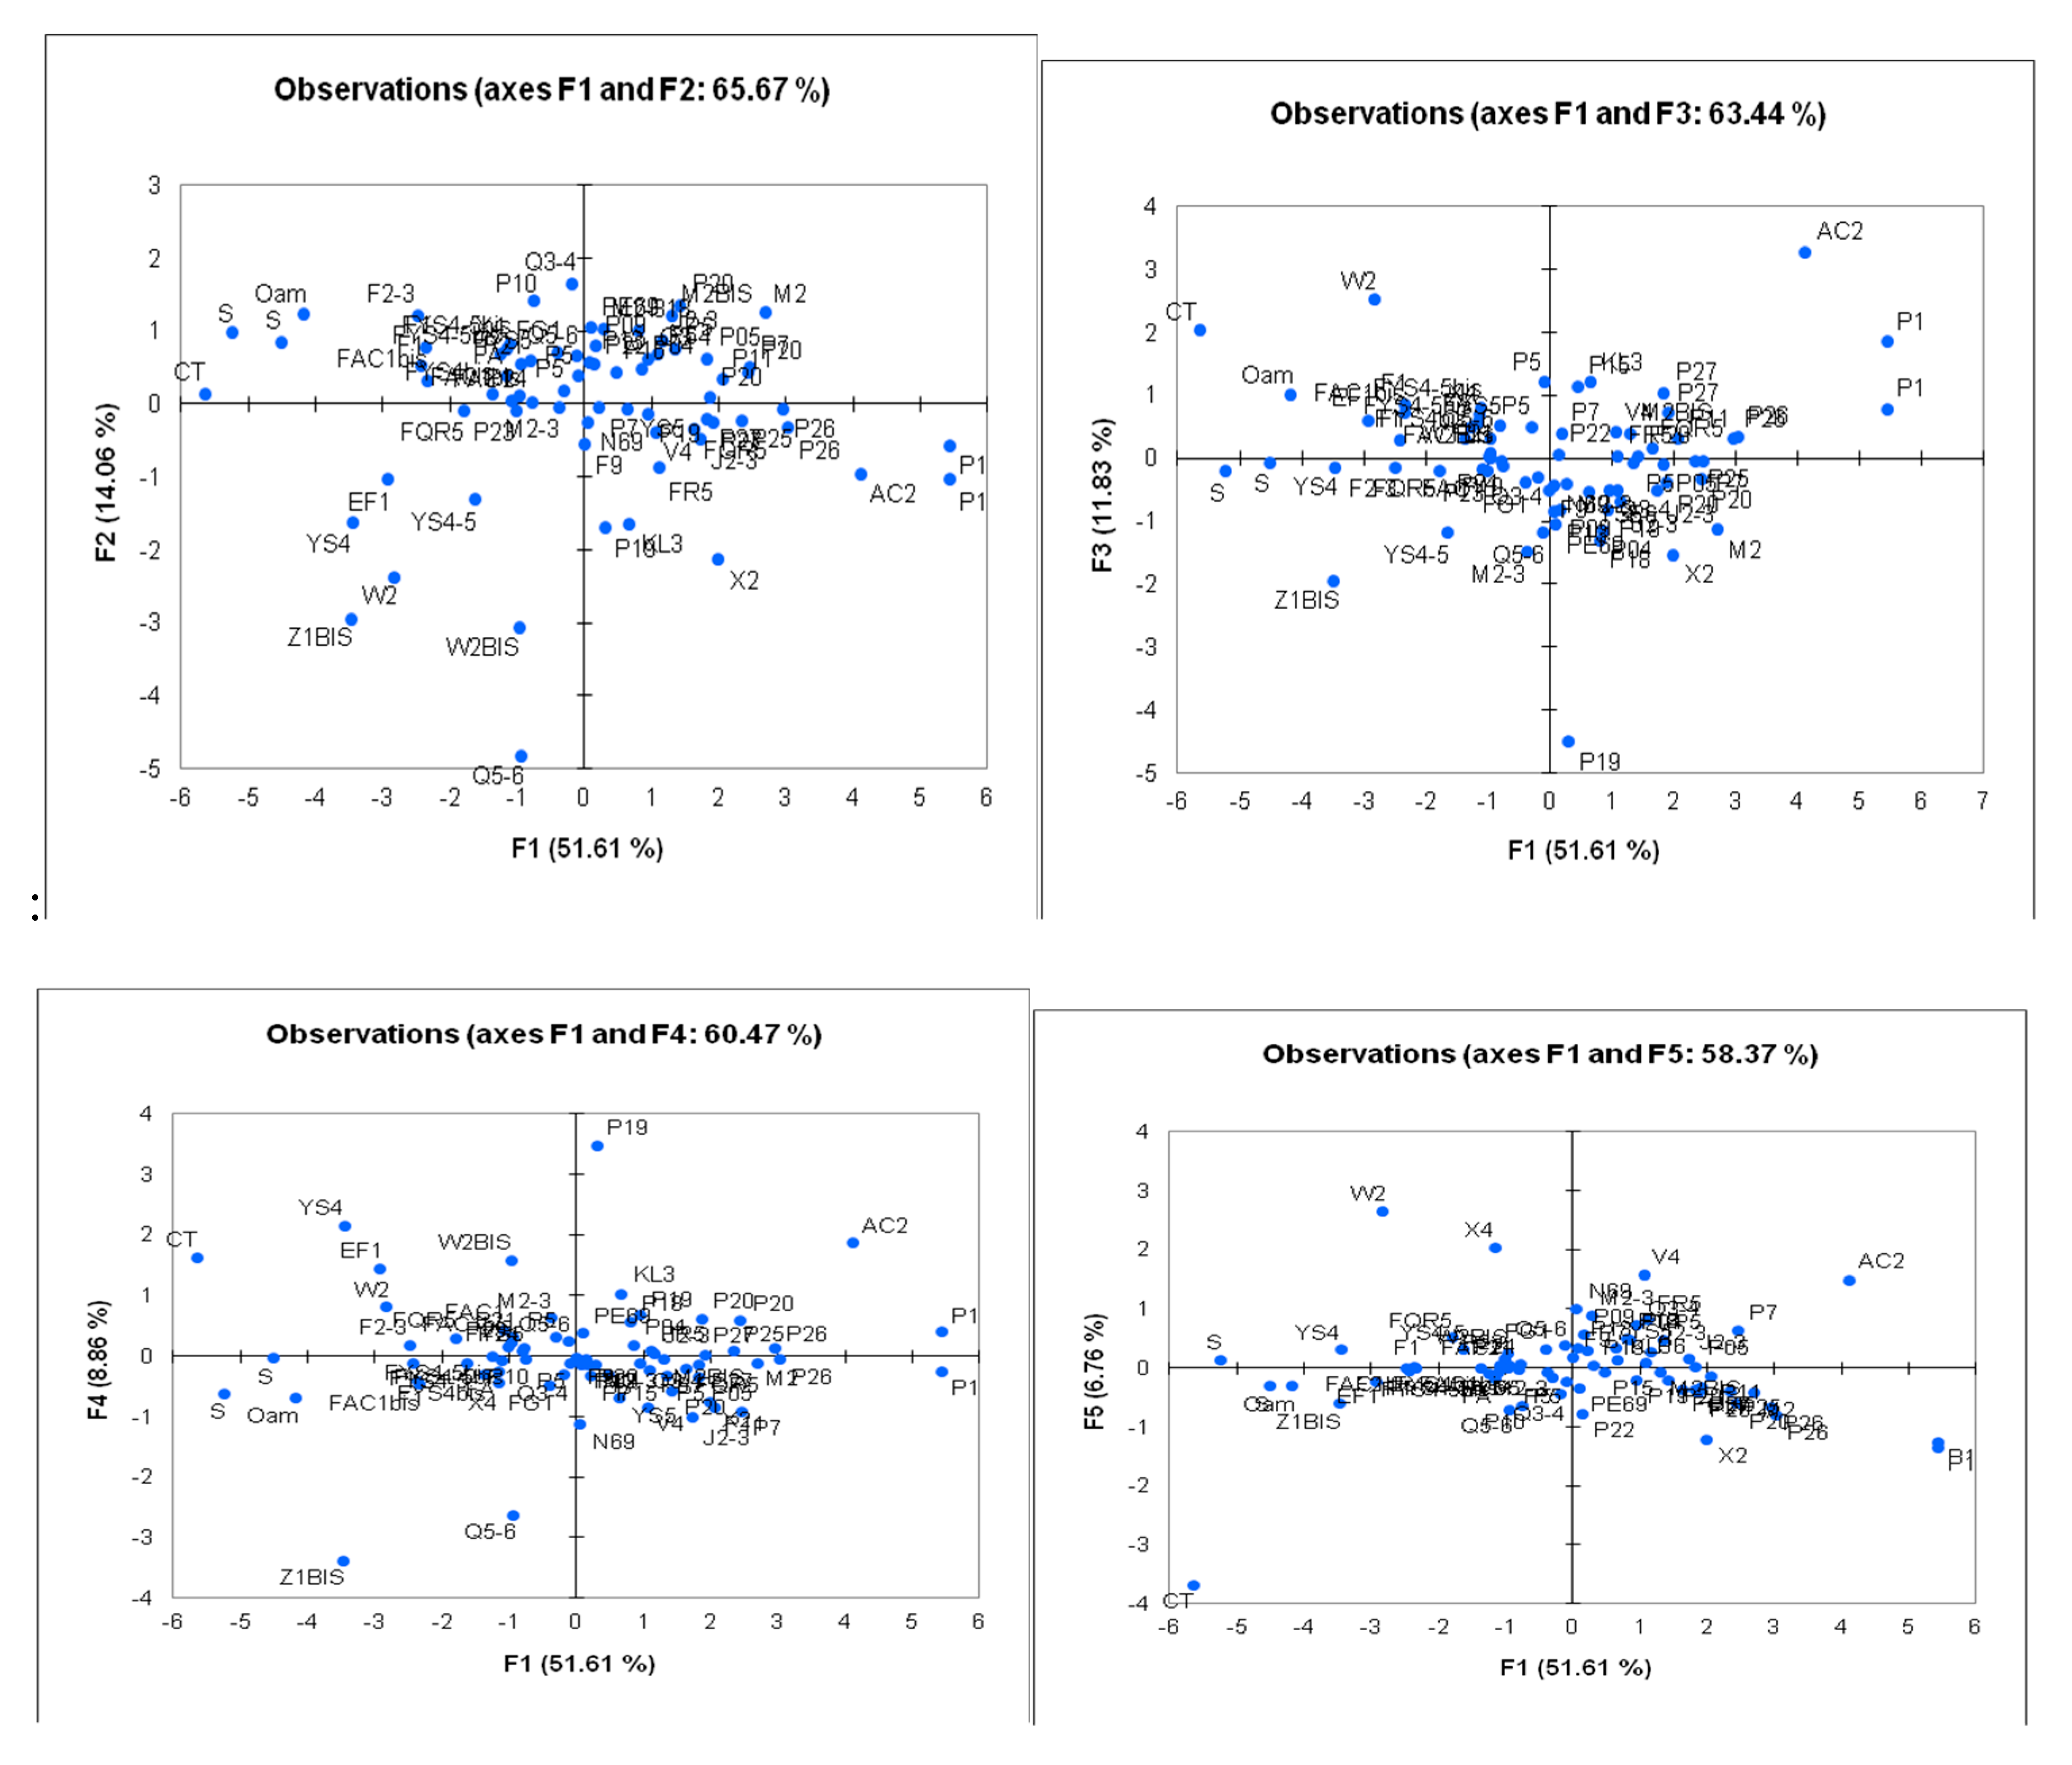
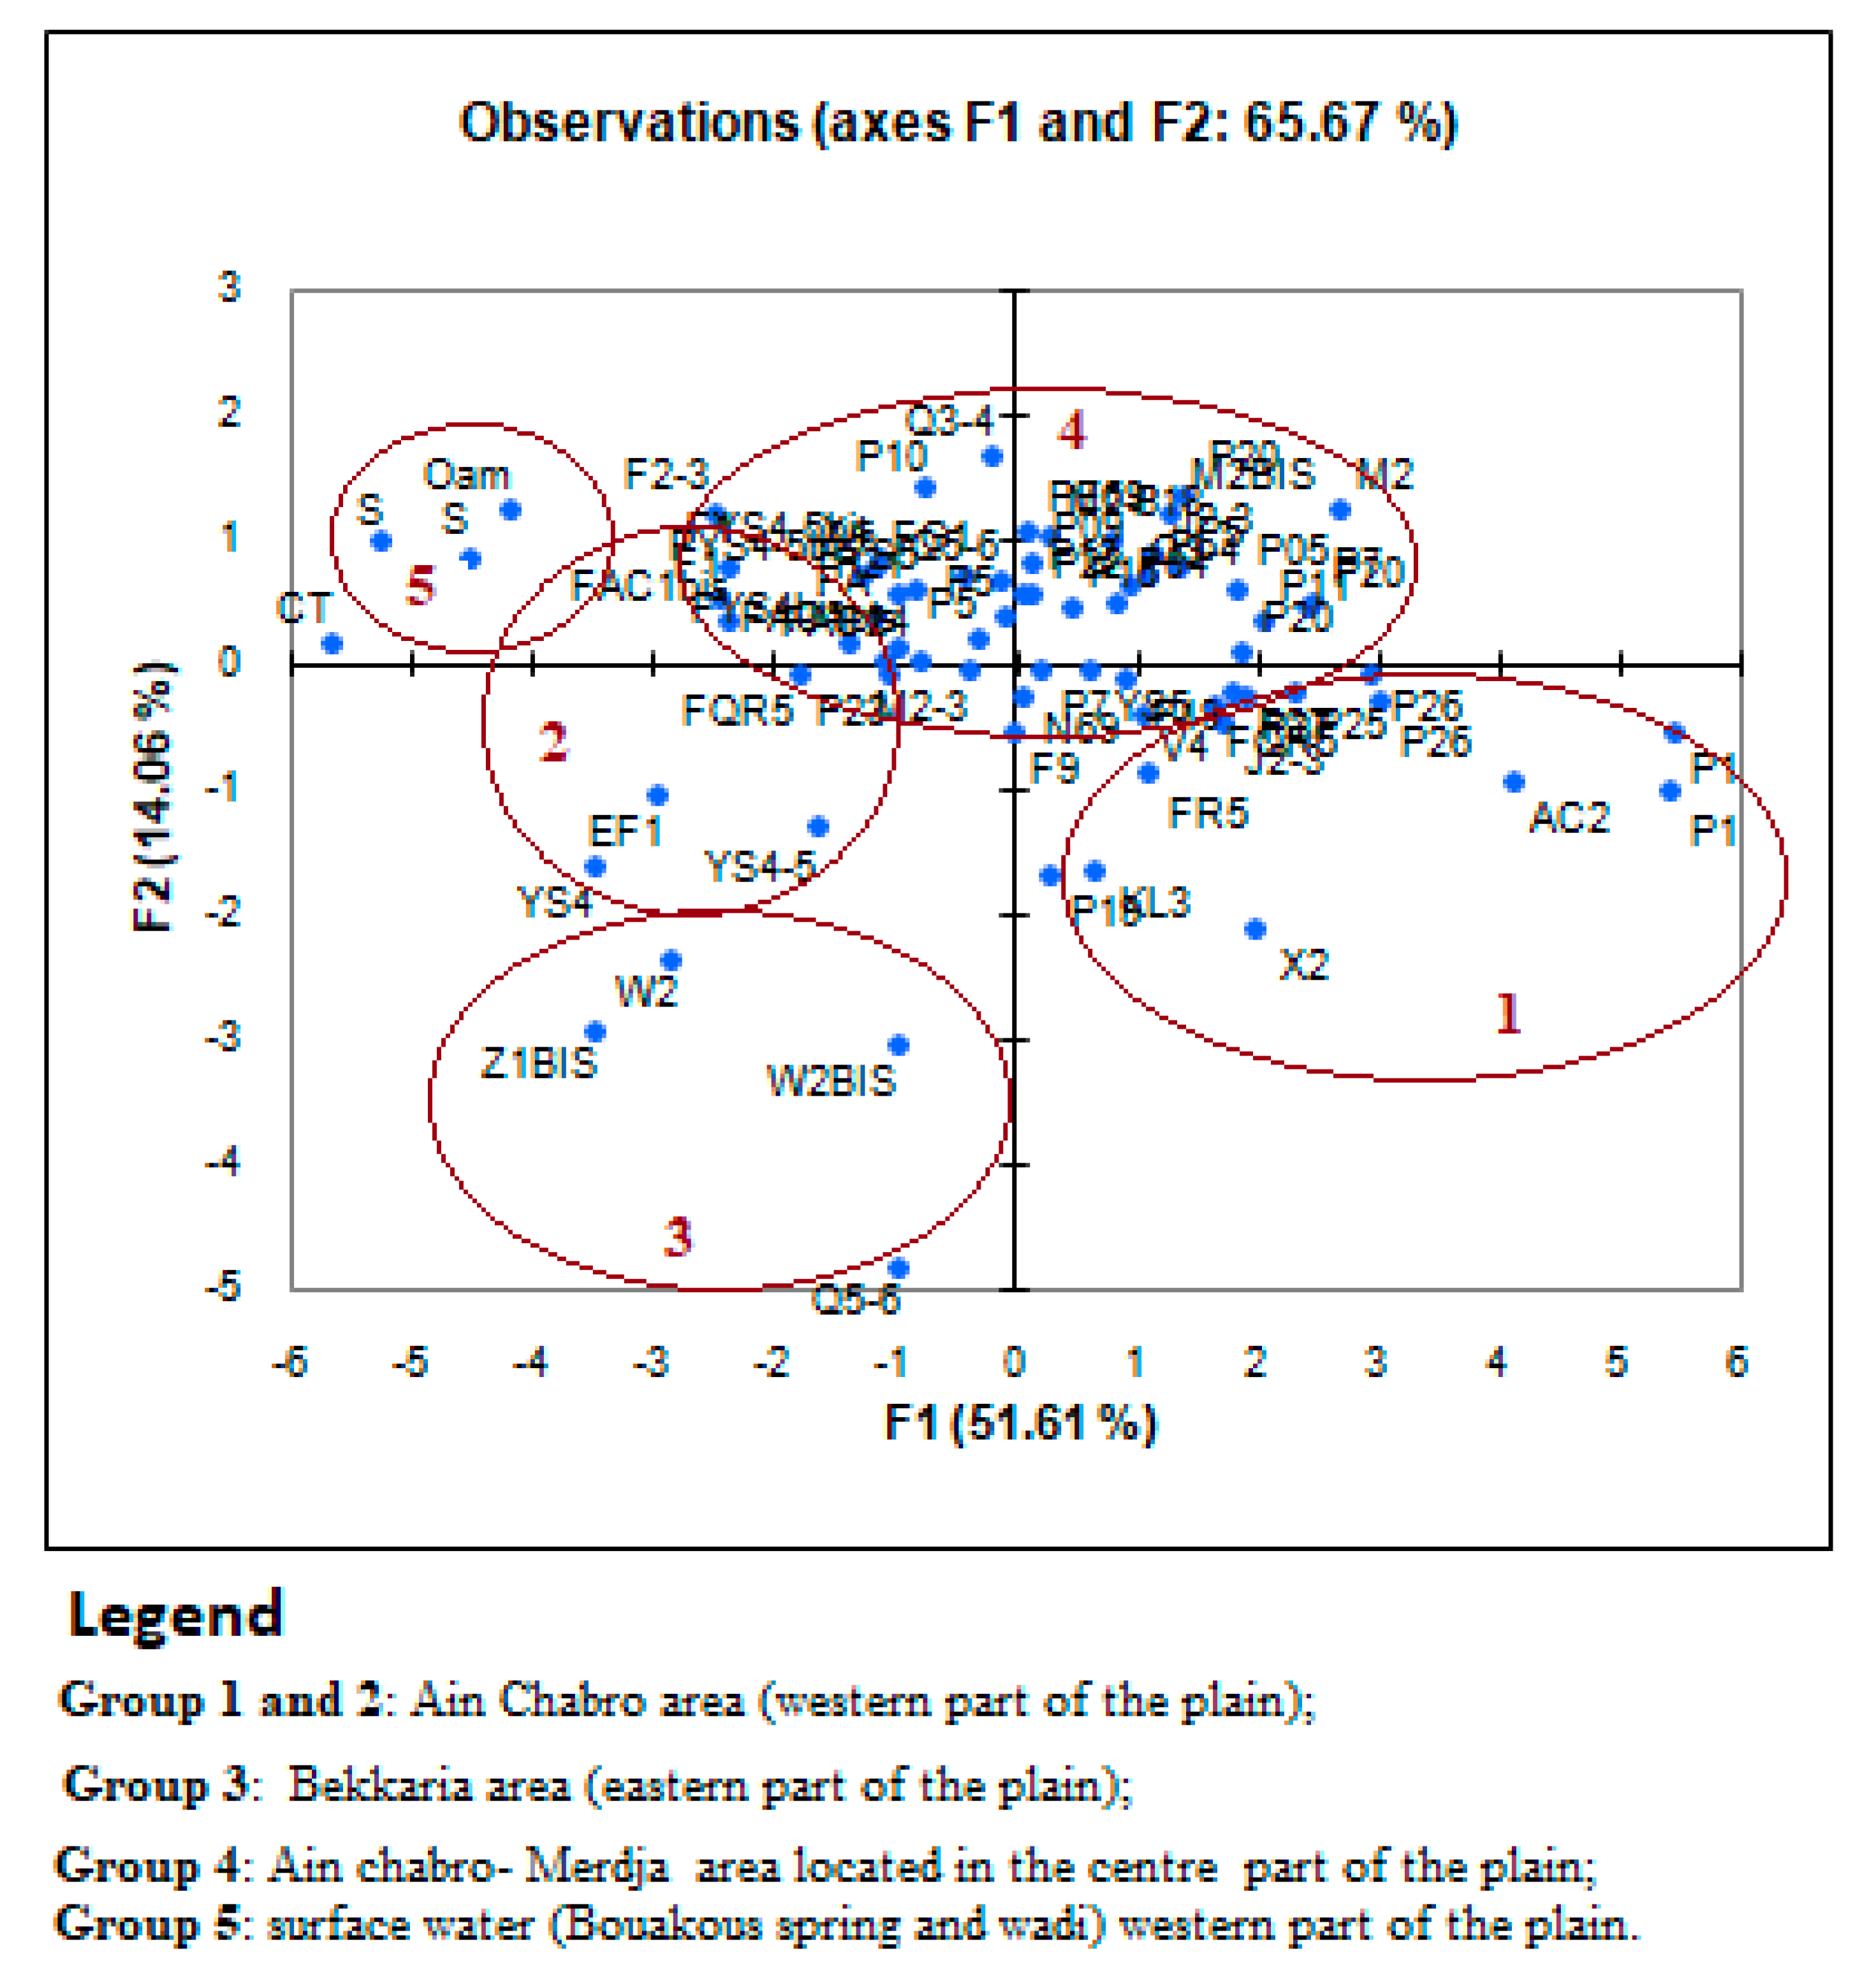
Figure 18.
Groups of water points according to their distribution on the F1/F2 axis.
c/Classification Hiérarchique Ascendante des données (CHA):
Les résultats sont donnés dans les figures (Figure 19):
4. Discussion
A/Spatio-Temporal Variability of Physicochemical Parameters in Groundwater and Surface Water
The measured pH values in the study area range from 7.01 to 8.33, indicating that the water varies from slightly neutral to slightly alkaline. Electrical conductivity (EC) values are generally higher in groundwater than in surface water (springs and rivers). The average EC for surface water is approximately 456.66 µS/cm, whereas shallow wells show significantly higher values, averaging 2,414.11 µS/cm, and boreholes present moderate levels with an average of 1,067.62 µS/cm. Extreme values reach up to 9,120 µS/cm, indicating substantial mineralization.
Nitrate concentrations frequently exceed the World Health Organization (WHO) recommended limit of 50 mg/L in both wells and boreholes (WHO, 2017). Surface water sources exhibit nitrate concentrations ranging between 16.37 mg/L and 27.45 mg/L. In contrast, shallow wells show alarmingly high concentrations, reaching 117.97 mg/L, while boreholes record more acceptable levels, with a maximum of 62.47 mg/L and an average of 28.87 mg/L. These elevated nitrate levels strongly suggest contamination of groundwater by polluted surface water.
The hydrochemical characteristics of the groundwater are influenced by both natural (geological and hydrogeological) and anthropogenic (agricultural and urban) factors. Spatial variations in chemical parameters were visualized using thematic maps. Emphasis was placed on chemical elements exceeding standard thresholds, including nitrates (NO3−), sulfates (SO42−), chlorides (Cl−), and sodium (Na+) (Figure 6, Figure 7, Figure 8 and Figure 9).
Nitrate pollution has reached critical levels in parts of the study area. While localized pollution is evident near urban centers and downstream zones, the highest nitrate concentrations—exceeding 50 mg/L—are predominantly found downstream of Oued Ksob in the central plain of El Merdja and in the western region near Ain Chabro. Conversely, other areas remain less affected.
The spatial distribution of chlorides and sodium shows a strong correlation, with high concentrations concentrated in the western (Ain Chabro) and eastern (Bekkaria) parts of the region. Elevated sulfate levels correspond to the outcrops of Triassic gypsum formations, notably in Djebel Djebissa (east) and Djebel Belkefif (west).
Nitrate and chloride concentrations are mainly attributed to anthropogenic activities, particularly intensive agriculture. Excessive use of nitrogen-based fertilizers and uncontrolled irrigation practices significantly degrade groundwater quality through diffuse nitrate pollution (World Bank, 1995; Collen et al., 1993). This contamination poses a serious public health risk, especially in rural areas that rely on untreated groundwater sources.
Moreover, the vulnerability of the aquifer is influenced by the physical environment, including hydrogeological features, lithology, and the presence of evaporitic formations. When multiple vulnerability factors coincide, the likelihood of nitrate migration into the aquifer intensifies (Strebel et al., 1989; Demarets et al., 1995; Robert et al., 1994).
In addition to agricultural sources, untreated urban wastewater and agro-industrial effluents, which are often rich in organic and inorganic nitrogen compounds, further exacerbate nitrate contamination—particularly in the northwestern downstream areas. Climate conditions, especially prolonged droughts and low rainfall, limit aquifer recharge and contribute to water quality deterioration.
The spatial analysis reveals a highly heterogeneous distribution of water quality in the study area. Groundwater from deep boreholes and springs generally exhibits better quality (calcium bicarbonate type), whereas shallow wells and surface water sources such as oueds tend to show significant pollution.
B/Normality Test
The normality tests conducted using various methods (Shapiro-Wilk, Anderson-Darling, Lilliefors, Jarque-Bera) reveal a clear difference in the distribution of values depending on whether they are transformed logarithmically or not. The logarithmic transformation results in distributions that are closer to normality compared to the untransformed data. This result is easily visible on the P-P plot and Q-Q plot diagrams (Figure 10, Figure 11 and Figure 12). The logarithmic transformation strongly aligns the points with the first diagonal, which represents the normal distribution with the same mean and standard deviation as the studied series. However, even with the logarithmic transformation, the distributions are not entirely normal. This likely indicates the presence of multiple sample sets, each with its own structure.
The benefit of the logarithmic transformation is evident in the results of the PCA calculations. Indeed, for the raw data, the influence of samples with extreme values is significant. The distribution of points in the first factor plane shows that most points are concentrated in one sector, with three points being completely distant from the rest of the samples (AC2, P1, P1). In logarithmic data, all points are distributed more evenly within the factor plane (Figure 13). Based on these results, we observed that working with logarithmic-transformed data is more representative and fruitful than with raw data, and therefore, we adopted statistical analyses using the log-transformed data.
C/Principal Component Analysis (PCA)
The Principal Component Analysis (PCA) of the logarithmically transformed data provided a highly significant correlation matrix between the chemical elements characteristic of the groundwater in question. Indeed, the calculations with the raw data showed that TDS (Total Dissolved Solids) was closely related to all the chemical parameters; nitrates were directly related to sodium (Na+) and chloride (Cl-). However, the calculations using logarithmically transformed data indicated that TDS was directly related to almost all chemical parameters, except for nitrates, which did not have a direct relationship with all the chemical elements constituting the composition of the groundwater. This observation confirms the anthropogenic superficial origin of nitrates.
The TDS of the water is strongly linked to the concentration of sulfates (SO4-2), sodium (Na+), and magnesium (Mg+2) (Table 6 and Table 7). Factor axis F1 accounts for 51.61% of the total information and represents the total mineralization of the water. It shows that the mineralization of groundwater is primarily marked by sulfates, calcium, magnesium, bicarbonates (HCO3), and potassium. Factor axis F2 represents the chemical facies of the water, showing a sulfate and chloride sodium and magnesium quality, in contrast to the bicarbonate calcium potassium and nitrate-rich facies. Axis F3 highlights the contamination of the water by nitrates, indicating that these elements do not have the same origin as the chemical elements characteristic of the groundwater in the region.
The correlation circle F1/F2 represents 65.67% of the total information and illustrates the mineralization of groundwater in the study area. This key parameter plays an important role in the hydrochemical characterization of the region’s water.
On the factor plane F1/F3, which represents 63.44% of the total information, we can distinguish the different facies and chemical qualities of the analyzed waters. Indeed, the primarily sulfate and chloride magnesium and calcium waters contrast with the bicarbonate calcium and nitrate-rich waters. This suggests a mixing of the groundwater with surface waters, which are often contaminated and polluted by nitrates (NO3-).
The distribution graphs of the individuals are clearly visible with the logarithmically transformed data. The most distant water points, which presented extreme values, have become closer to the other points and are now easier to compare with the others.
We can distinguish four different groups, three of which represent only the groundwater of the aquifer, and one group represents the surface water (source and river). Notably, (Figure 18):
- Group 1: Represents the groundwater of the Ain Chabro area (western part of the plain) (FR5, FKL3, FAC2, FJ2-3, P1).
- Group 2: Represents the water points of the Bekkaria area (eastern part of the plain) (FZ1BIS, FW2, FW2BIS, FQ5-6).
- Group 3: Represents the water points of the Ain Chabro-Hammamet area (western part of the plain) (FAC1, FQR5, FM2-3, FEG1, FYS4-5, P2, P5F2-3).
- Group 4: Represents the surface waters (Youkous spring and Youkous river).
It can be noted that all the water points studied are grouped according to their chemical quality, despite the lithological similarity from a geological and hydrogeological perspective in the exploited aquifer.
D/Discriminant Analysis (DA) and Hierarchical Ascending Classification (HAC)
The discriminant analysis of the chemical data allowed us to distinguish the studied water points based on their type (borehole, well, spring, river). Indeed, the Hierarchical Ascending Classification (HAC), obtained from the factorial means of the axes, showed that the water from wells and boreholes are very similar (sister groups), while the water from springs and rivers also forms a close group (sisters). This classification confirms the common origin of the waters. In fact, the surface waters flowing in the Oued Bouakous originate from the Youkous spring, which is located upstream of the Oued Bouakous.
The dendrogram clearly shows that groundwater and surface water (spring and river) do not resemble each other, reflecting the differences in their sources of supply. Surface waters, from both the spring and the downstream river, are characterized by a bicarbonate calcium facies with good quality. On the other hand, the waters of the aquifer display several facies, depending on the local lithology of the soil, the depth of the aquifer, as well as the nature of their superficial and underground recharge.
IV. Conclusion
This study utilized various statistical techniques to assess the changes in water quality of the alluvial aquifer in the Tebessa region, northeastern Algeria, and to determine the current state of nitrate contamination. The analysis of chemical parameters of the water helped identify and analyze the geochemical processes controlling the chemical characteristics of the groundwater in the area.
The results revealed that the dominant chemical facies are rich in sulfates (SO4), chlorides (Cl), magnesium (Mg), calcium (Ca), and bicarbonates (HCO3). Through Principal Component Analysis (PCA), the F1/F2 axes accounted for about 65.67% of the total information, showing that groundwater is significantly impacted by nitrate contamination from surface water infiltration. This was clearly demonstrated by Hierarchical Cluster Analysis (HCA), which showed that the water quality of wells (F) and boreholes (P) is similar, while surface water from springs (S) and Oued Youkous (O) is also closely related, reflecting the same origin.
The results clearly highlight the strong relationship between nitrate contamination and groundwater recharge areas, particularly in locations affected by the infiltration of polluted surface water. This suggests that the surface water feeding the aquifer is significantly impacted by human activities, such as unregulated wastewater disposal, septic tanks, and industrial pollution.
This study underscores the importance of utilizing modern statistical tools to understand water dynamics in the Tebessa region, providing a scientific framework for improving the sustainability of water resources in the area.
Author Contributions
Conceptualization, M.B. and K.S.; methodology, K.S. and V.V. and H.A.; validation, K.S., V.V. and H.A.; formal analysis, M.B.;M.A.S. investigation, M.B. and K.S.; resources, K.S.; data curation, L.B. and V.V.; writing—original draft preparation, M.B. and K.S.; writing—review and editing, K.S.; visualization, K.S.; supervision, K.S., H.A. and V.V.; project administration, K.S. All authors have read and agreed to the published version of the manuscript.
Funding
This research received no external funding.
Acknowledgments
In this section, you can acknowledge any support given which is not covered by the author contribution or funding sections. This may include administrative and technical support, or donations in kind (e.g., materials used for experiments).
Conflicts of Interest
The authors declare no conflicts of interest.
References
- BENDEKKOUM, Mehdi, 2017, Etat de la réserve en eaux souterraines dans la zone de Tébessa Boulhef-Dyr durant la période des hautes eaux du cycle hydrologique 2016/2017,Mémoire de Master, Département des Sciences de la Terre et de l’Univers, Université de Tébessa, 78p.
- SOUID, Faiza, AGOUBI, Belgacem, HAMDI, Mohamed, et al. Groundwater chemical and fecal contamination assessment of the Jerba unconfined aquifer, southeast of Tunisia. Arabian Journal of Geosciences, 2017, vol. 10, no 10, p. 231. [CrossRef]
- ROUABHIA, Abdelkader, BAALI, Fethi, et FEHDI, Chemseddinne. Impact of agricultural activity and lithology on groundwater quality in the Merdja area, Tebessa, Algeria. Arabian Journal of Geosciences, 2010, vol. 3, no 3, p. 307-318. [CrossRef]
- ROUABHIA, Abdelkader, BAALI, Fethi, HANI, Azzdine, et al. Impact des activités anthropiques sur la qualité des eaux souterraines d’un aquifère en zone semi-aride. Science et changements planétaires/Sécheresse, 2009, vol. 20, no 3, p. 279-285. [CrossRef]
- DRIAS, Tarek, FEHDI, Chemseddine, et BELLOUALA, Moufida. Hydrochemical Analysis and Evaluation of Groundwater Quality of an Alluvial Aquifer. Algeria. In: Euro-Mediterranean Conference for Environmental Integration. Springer, Cham, 2017. p. 637-639.
- FEHDI, Chemseddine, BOUDOUKHA, A., et ROUABHIA, Aek. Use of hydrogeochemistry and environmental isotopes for groundwater characterisation in Morsott–El Aouinet basin, Northeastern Algeria. Geochemical Journal, 2011, vol. 45, no 2, p. 87-96. [CrossRef]
- ZIANI, Dalila, BOUDOUKHA, Abderrahmane, BOUMAZBEUR, Abderrahmane, et al. Investigation of groundwater hydrochemical characteristics using the multivariate statistical analysis in Ain Djacer area, Eastern Algeria. Desalination and Water Treatment, 2016, vol. 57, no 56, p. 26993-27002. [CrossRef]
- ALBINET, M. et MARGAT, J. Cartographie de la vulnérabilité à la pollution des nappes d’eau souterraine. Bull. BRGM, 1970, vol. 2, no 3, p. 4.
- AGHZAR, N., BERDAI, H., BELLOUTI, A., et al. Pollution nitrique des eaux souterraines au Tadla (Maroc). Revue des sciences de l’eau/Journal of Water Science, 2002, vol. 15, no 2, p. 459-492. [CrossRef]
- AMHARREF, Mina, AASSINE, Saadia, BERNOUSSI, Abdes, et al. Cartographie de la vulnérabilité à la pollution des eaux souterraines: Application à la plaine du Gharb (Maroc). Revue des sciences de l’eau/Journal of Water Science, 2007, vol. 20, no 2, p. 185-199. [CrossRef]
- AMHARREF, Mina et BERNOUSSI, A. Vulnérabilité et risque de pollution des eaux souterraines. Actes des JSIRAUF, Hanoi, 2007, vol. 10.
- SCHOELLER, Henri J. La pollution des eaux souterraines. In: Actes du Colloque de Moscou. 1971.
- BOUCHEMAL, Fattoum. Qualité physico-chimique et paramètres de pollution des eaux souterraines de la région de Biskra. Larhyss Journal, 2015, vol. 12, no 2, p. 197-212.
- SEGHIR, Karima. Vulnérabilité à la pollution, protection des ressources en eaux et gestion active du sous système aquifère de Tébessa Hammamet (Est Algérien). 2008. Thèse de doctorat. Annaba.
- BENKADDOUR, Rachid, HAMMOUTI, Belkheir, EL-MRABET, M., et al. Salinité et pollution par les nitrates des eaux souterraines de la plaine des Triffa. Revue Marocaine des Sciences Agronomiques et Vétérinaires, 2004, vol. 24, no 2, p. 147-158.
- ZERHOUNI, Jaouad, FOUZIA, Rhazi Filali, ABOULKACEM, Amal, et al. UTILISATION DE L’ANALYSE EN COMPOSANTES PRINCIPALES (ACP) POUR EVALUER LA POLLUTION DES EAUX SOUTERRAINES EN MILIEU RURAL (VILLE DE SEBAA AYOUNE, MAROC). Larhyss Journal, 2018, vol. 15, no 4, p. 7-20.
- EL MOUSTAINE, Radouane, CHAHLAOUI, Abdelkader, EL HABIB, R. O. U. R., et al. Étude de la qualité bactériologique et physico-chimique des eaux de certains puits et sources par l’utilisation d’une analyse en composantes principales (ACP): Une étude de cas de la région de Meknès (MAROC). Les technologies de laboratoire, 2013, vol. 8, no 33.
- SORO, Gbombélé, SORO, Tanina Drissa, ADJIRI, Oi Adjiri, et al. Application des méthodes statistiques multivariées à l’étude hydrochimique des eaux souterraines de la région des lacs (centre de la Côte d’Ivoire). International Journal of Biological and Chemical Sciences, 2019, vol. 13, no 3, p. 1870-1889. [CrossRef]
- SEGHIR, Karima. Vulnérabilité à la pollution, protection des ressources en eaux et gestion active du sous système aquifère de Tébessa Hammamet (Est Algérien). 2008. Thèse de doctorat. Annaba.
- SEGHIR, K. LA VULNERABILITE A LA POLLUTION DES EAUX SOUTERRAINES DE LA REGION TEBESSA-HAMMAMET (EST ALGERIEN). LARHYSS Journal P-ISSN 1112-3680/E-ISSN 2521-9782, 2014, no 18.
- Scanlon, B.R., et al. (2012). Global groundwater depletion: the facts and the impacts. Nature Climate Change, 2(5), 333–338.
- FAO. (2020). The State of Food and Agriculture: Overcoming water challenges in agriculture. Rome.
- Wakida, F.T., & Lerner, D.N. (2005). Non-agricultural sources of groundwater nitrate: a review and case study. Water Research, 39(1), 3–16. [CrossRef]
- Rivett, M.O., et al. (2008). Nitrate attenuation in groundwater: A review of biogeochemical controlling processes. Water Research, 42(16), 4215–4232. [CrossRef]
- WHO. (2017). Guidelines for Drinking-Water Quality, 4th Edition. World Health Organization, Geneva.
- Ward, M.H., et al. (2018). Drinking water nitrate and human health: An updated review. International Journal of Environmental Research and Public Health, 15(7), 1557. [CrossRef]
- Ward, M. H., et al. (2018). Drinking Water Nitrate and Human Health: An Updated Review. International Journal of Environmental Research and Public Health, 15(7), 1557. [CrossRef]
- Rivett, M. O., et al. (2008). Nitrate attenuation in groundwater: A review of biogeochemical controlling processes. Water Research, 42(16), 4215–4232. [CrossRef]
- World Health Organization (2023). Guidelines for Drinking-Water Quality, 4th Edition + Addenda.
- World Health Organization (WHO). (2017). Guidelines for Drinking-water Quality, 4th edition.
- Collen, R., et al. (1993). Nitrate Pollution of Groundwater: Agricultural and Environmental Perspectives. Environmental Geology.
- Demarets, M., et al. (1995). Groundwater Vulnerability and Nitrate Contamination. Hydrogeology Journal.
- Robert, M., et al. (1994). Assessment of Groundwater Pollution Risk from Nitrate. Water Resources Management.
- Strebel, O., Duynisveld, W.H.M., & Böttcher, J. (1989). Nitrate Pollution of Groundwater in Western Europe. Agriculture, Ecosystems & Environment.
- World Bank. (1995). Water Pollution Management in the Mediterranean Basin.
Figure 1.
Map showing the geographical location of the study region.
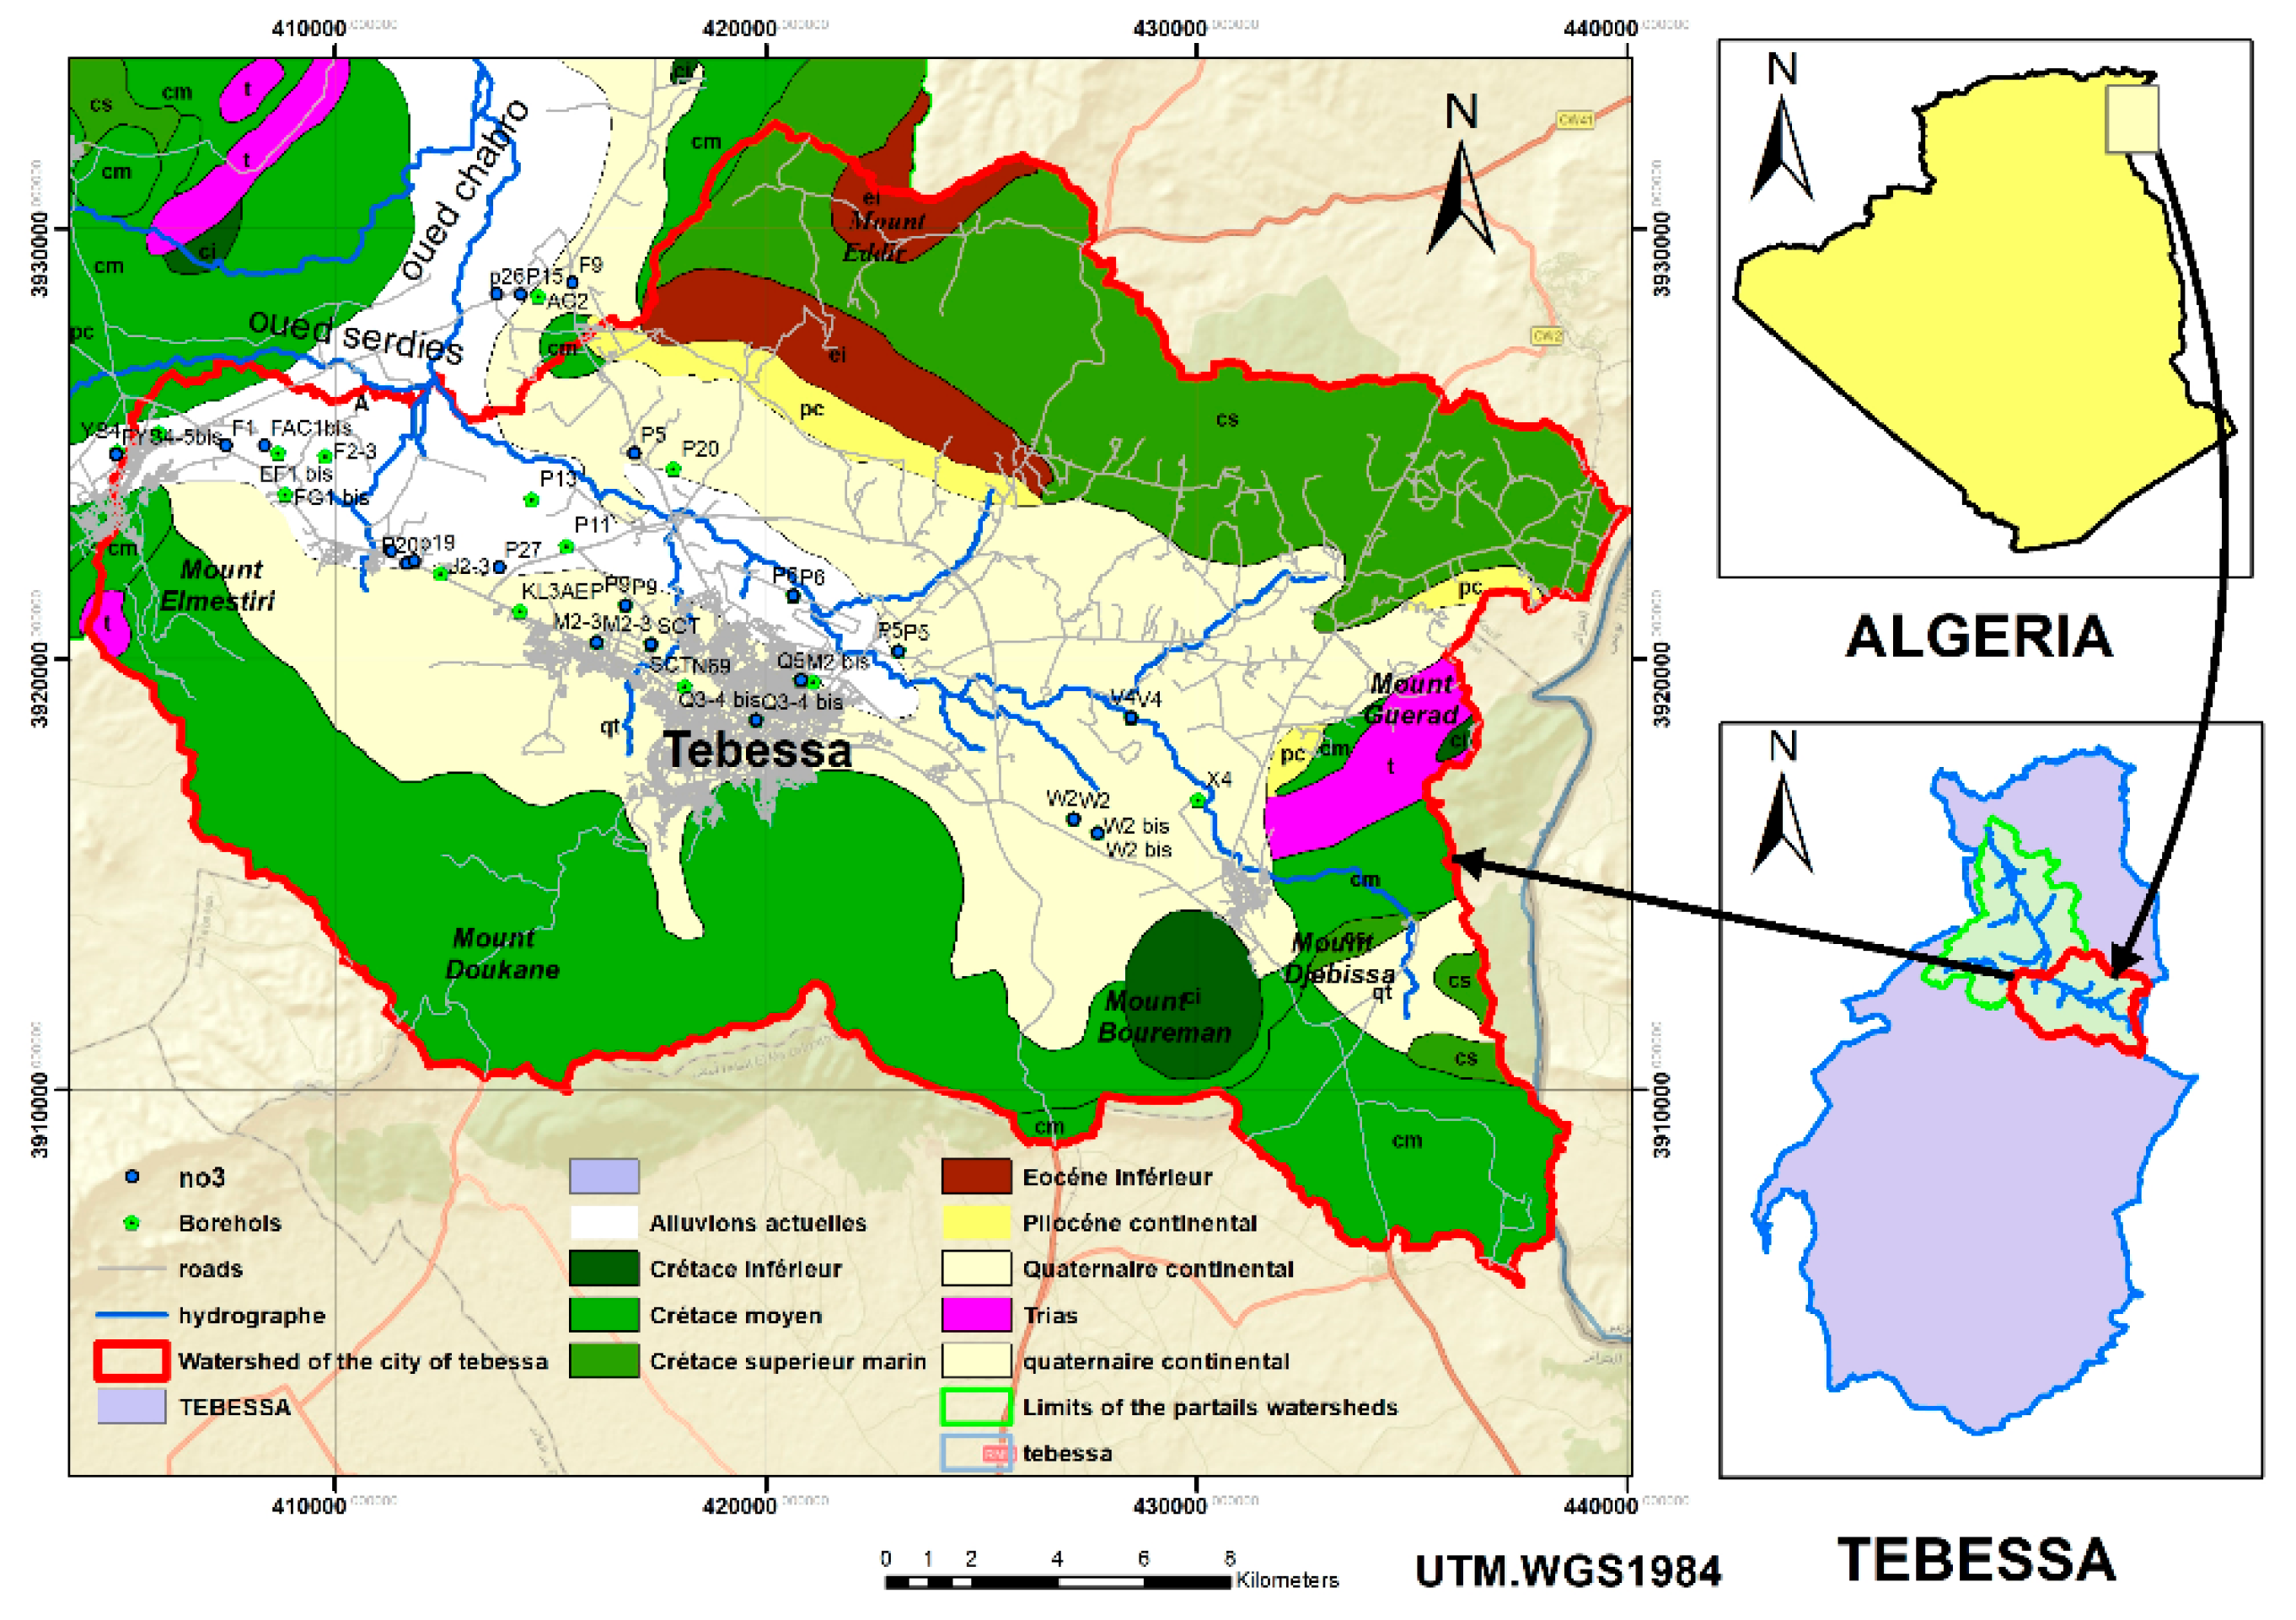
Figure 2.
Geomorphological card of Tebessa- Morsott graben.
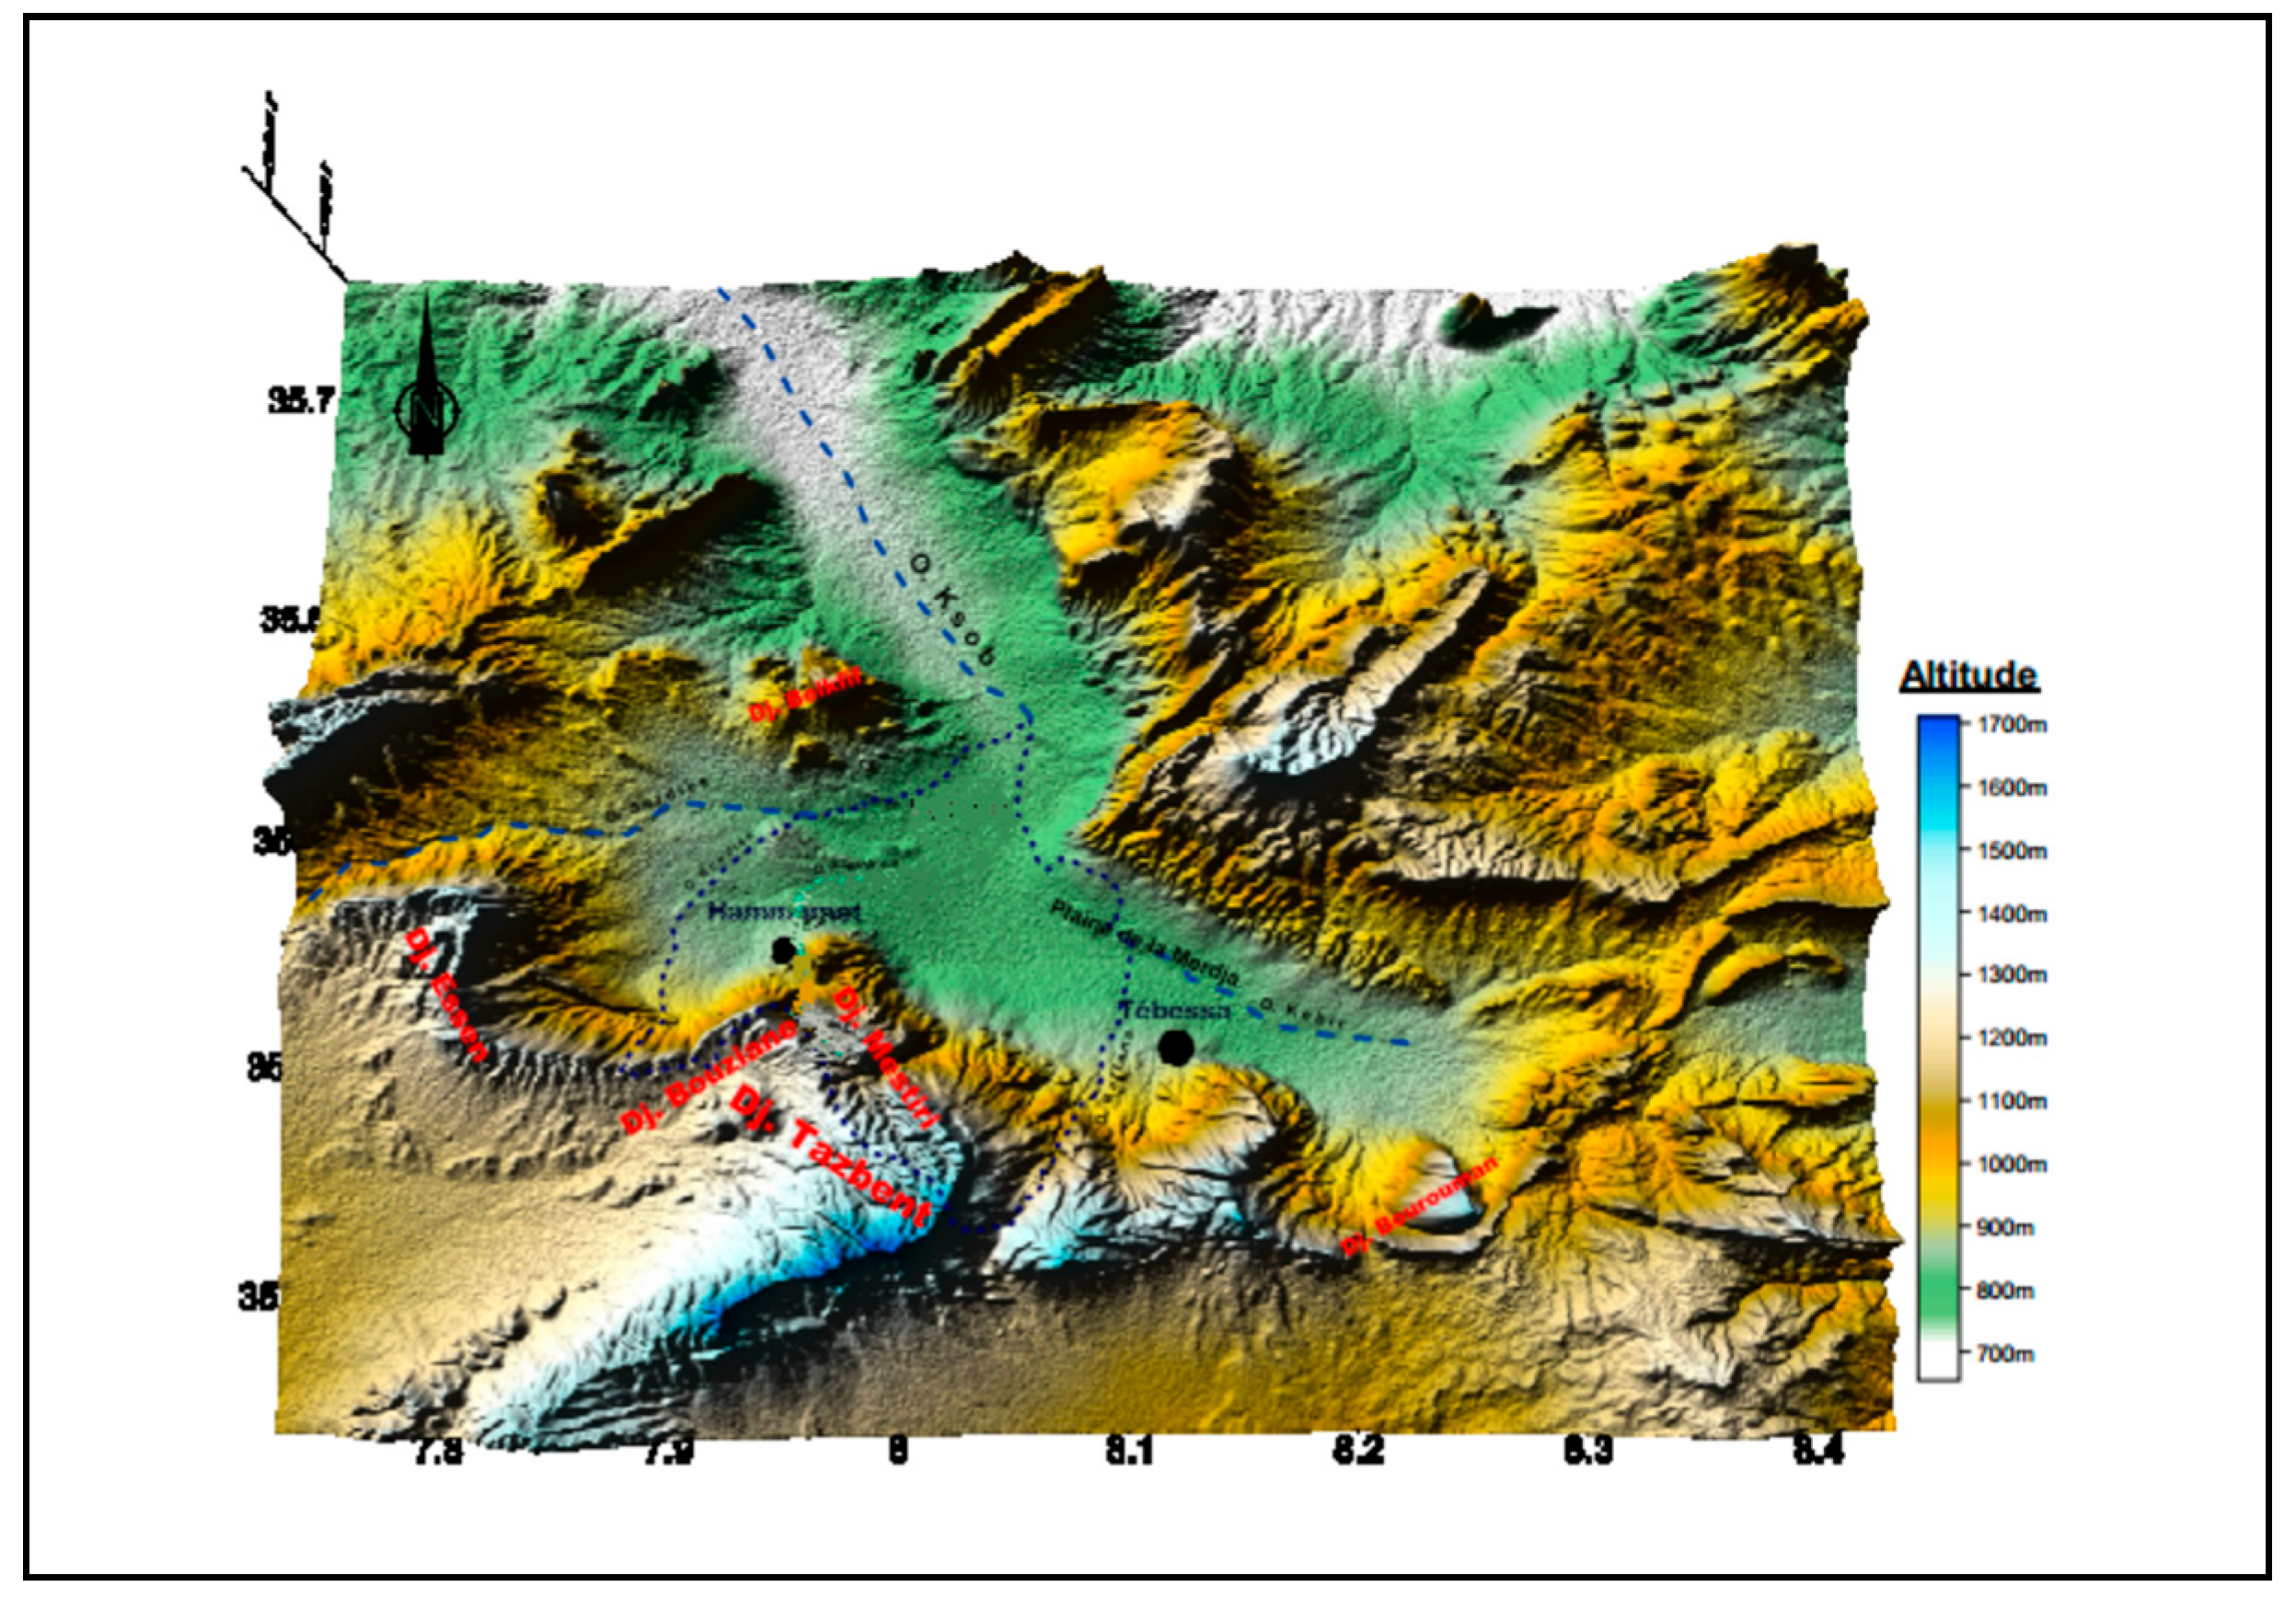
Figure 3.
Geological map of the study area.
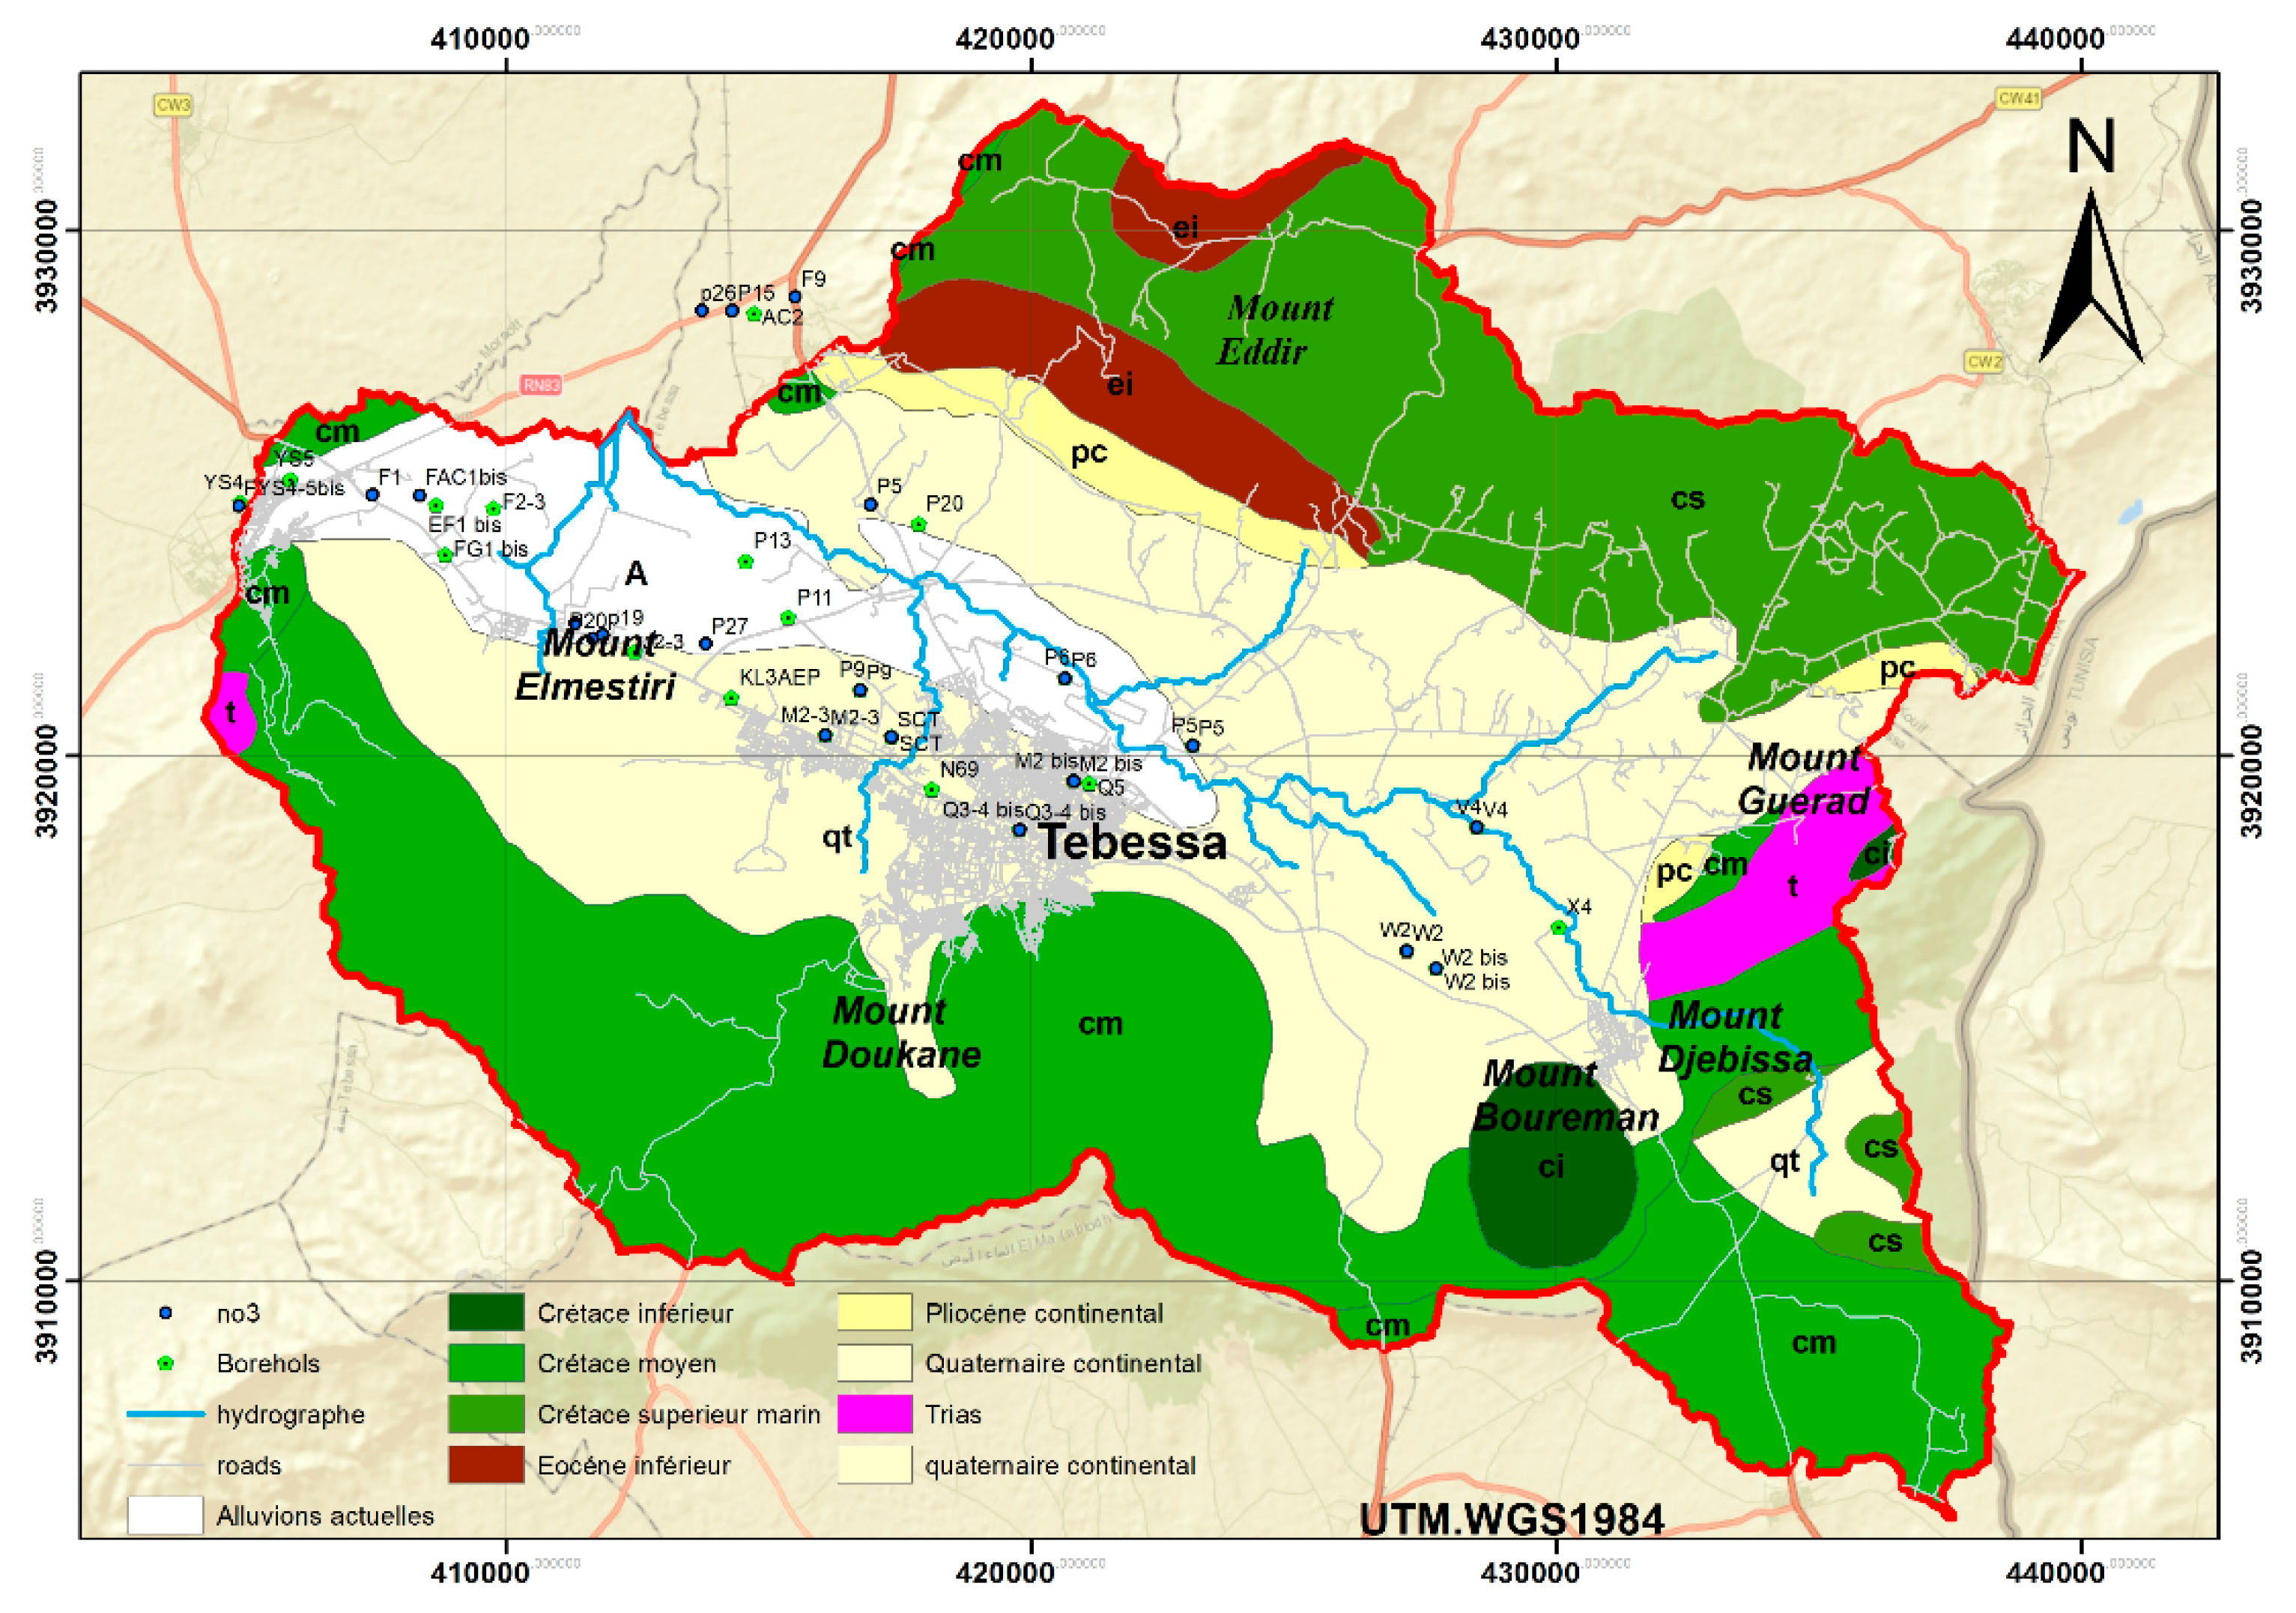
Figure 4.
Piezometric map May, 2021.
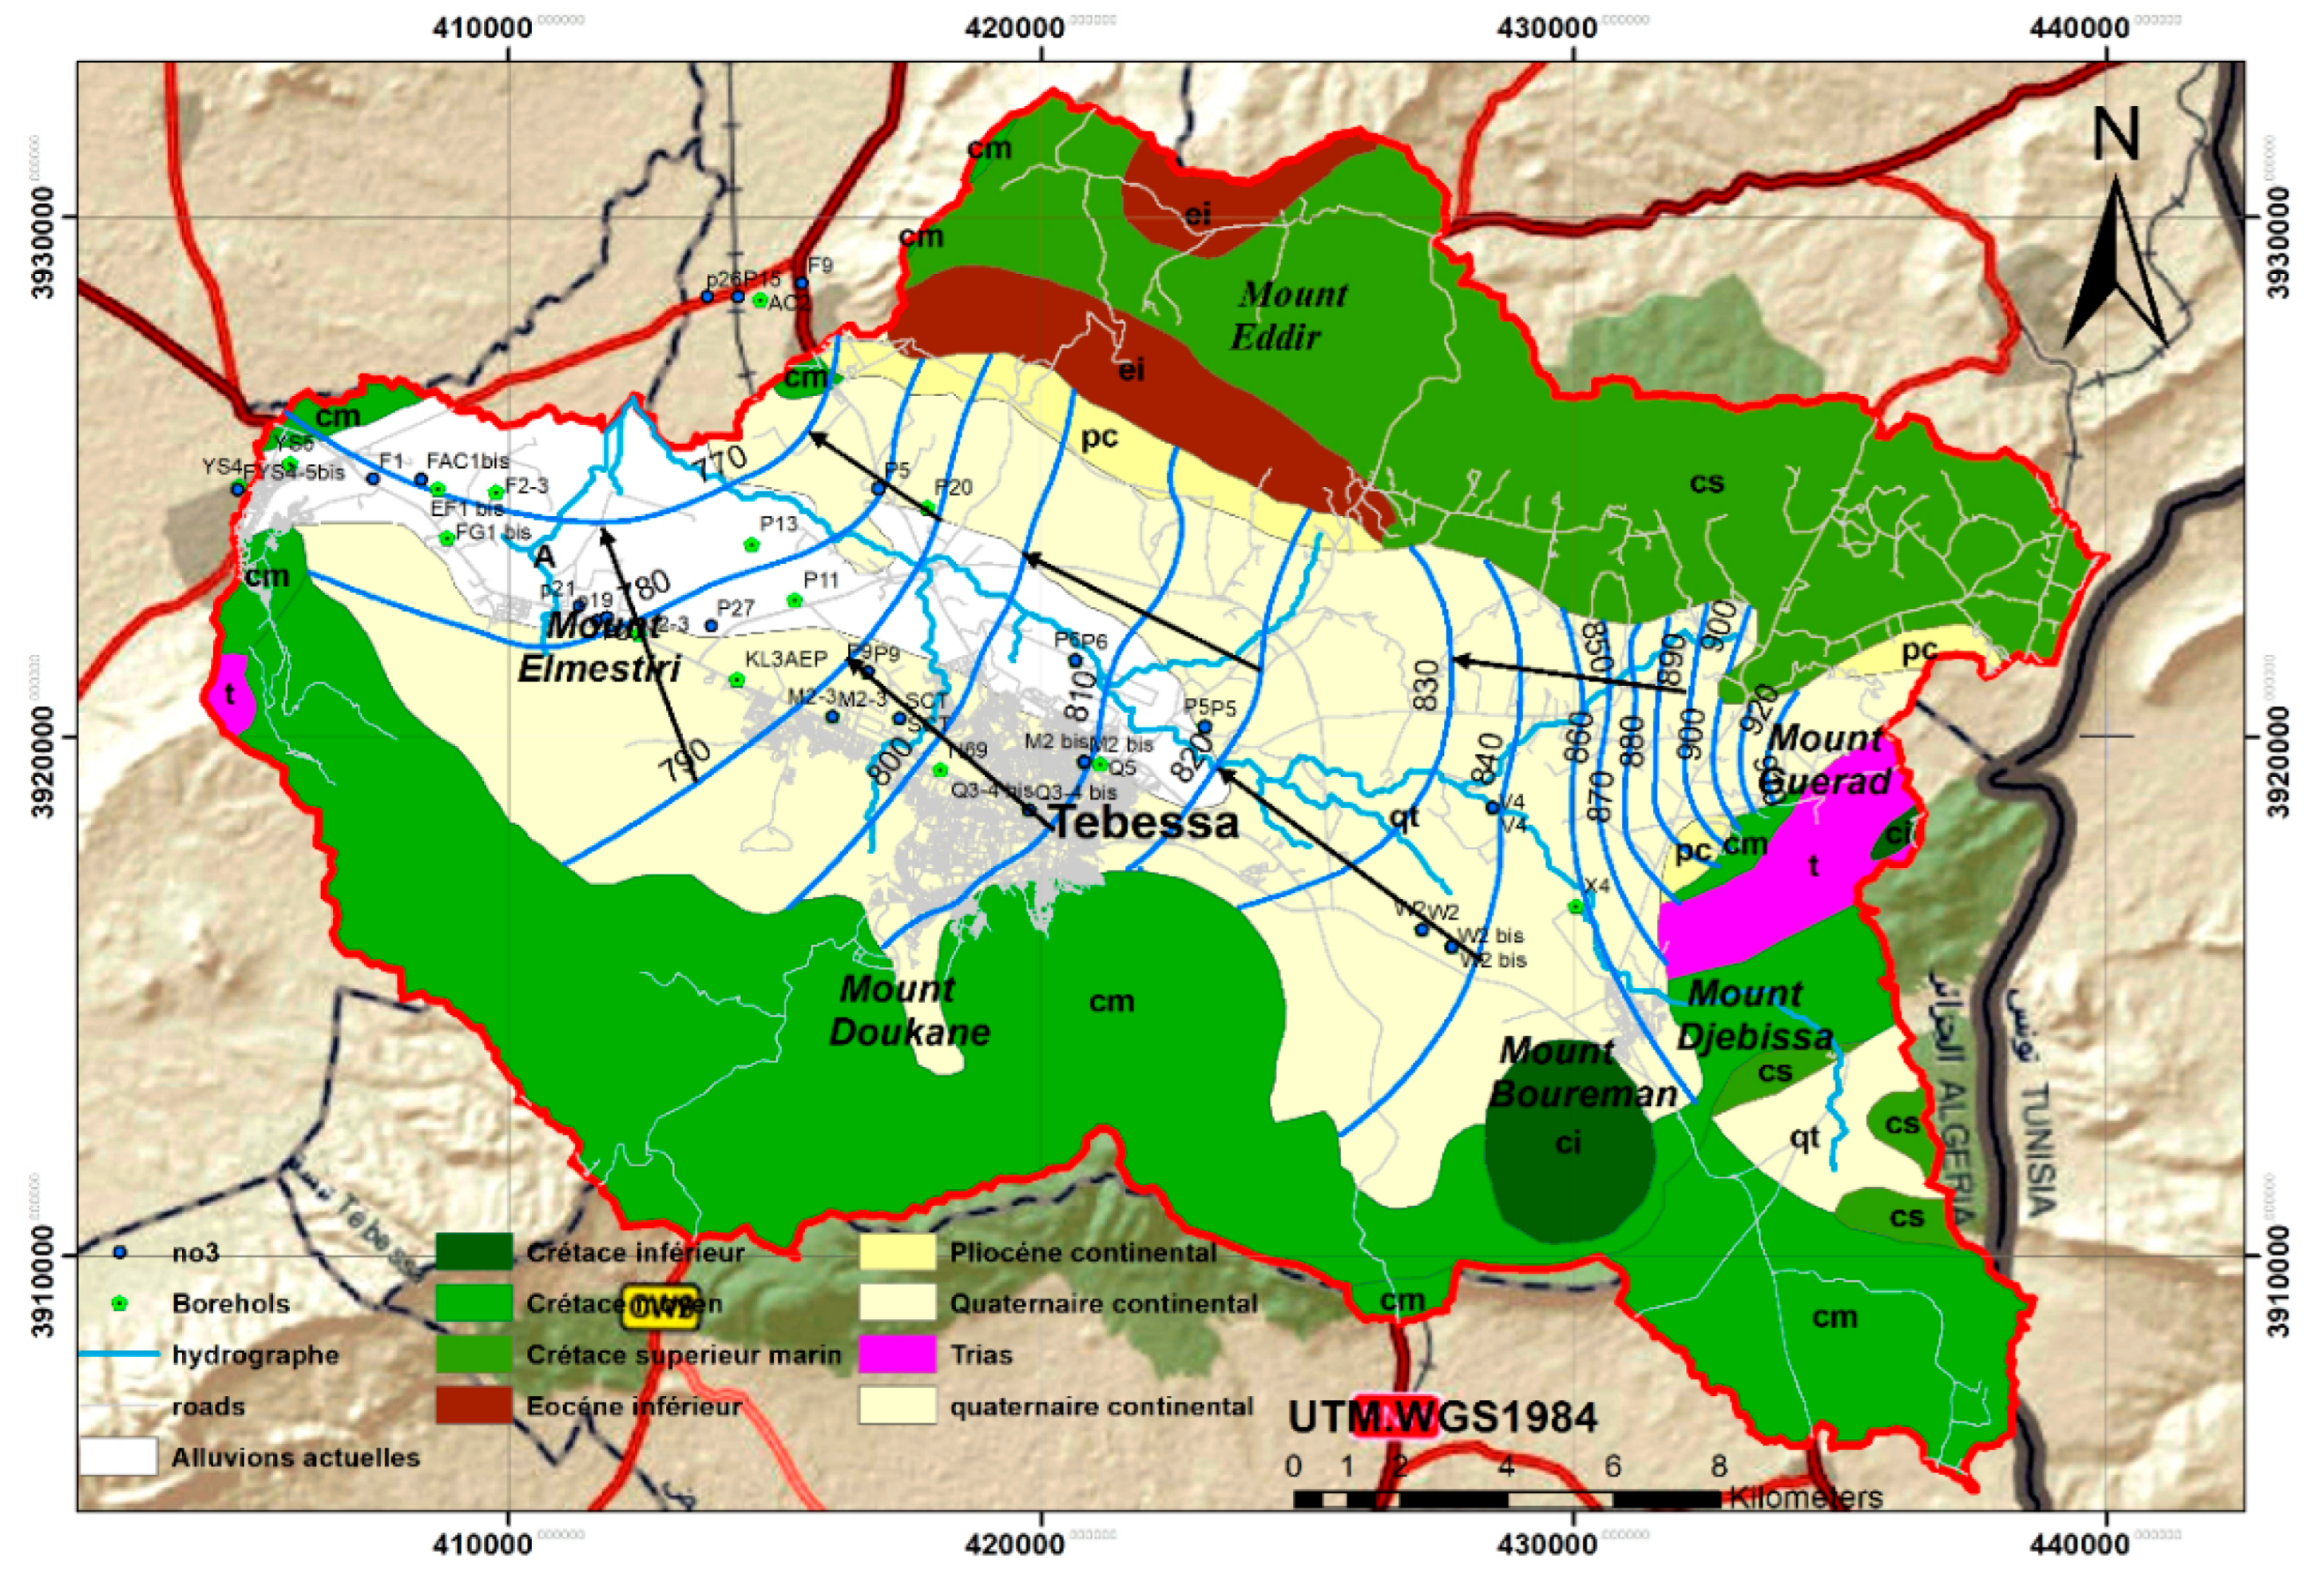
Figure 6.
Nitrates card.
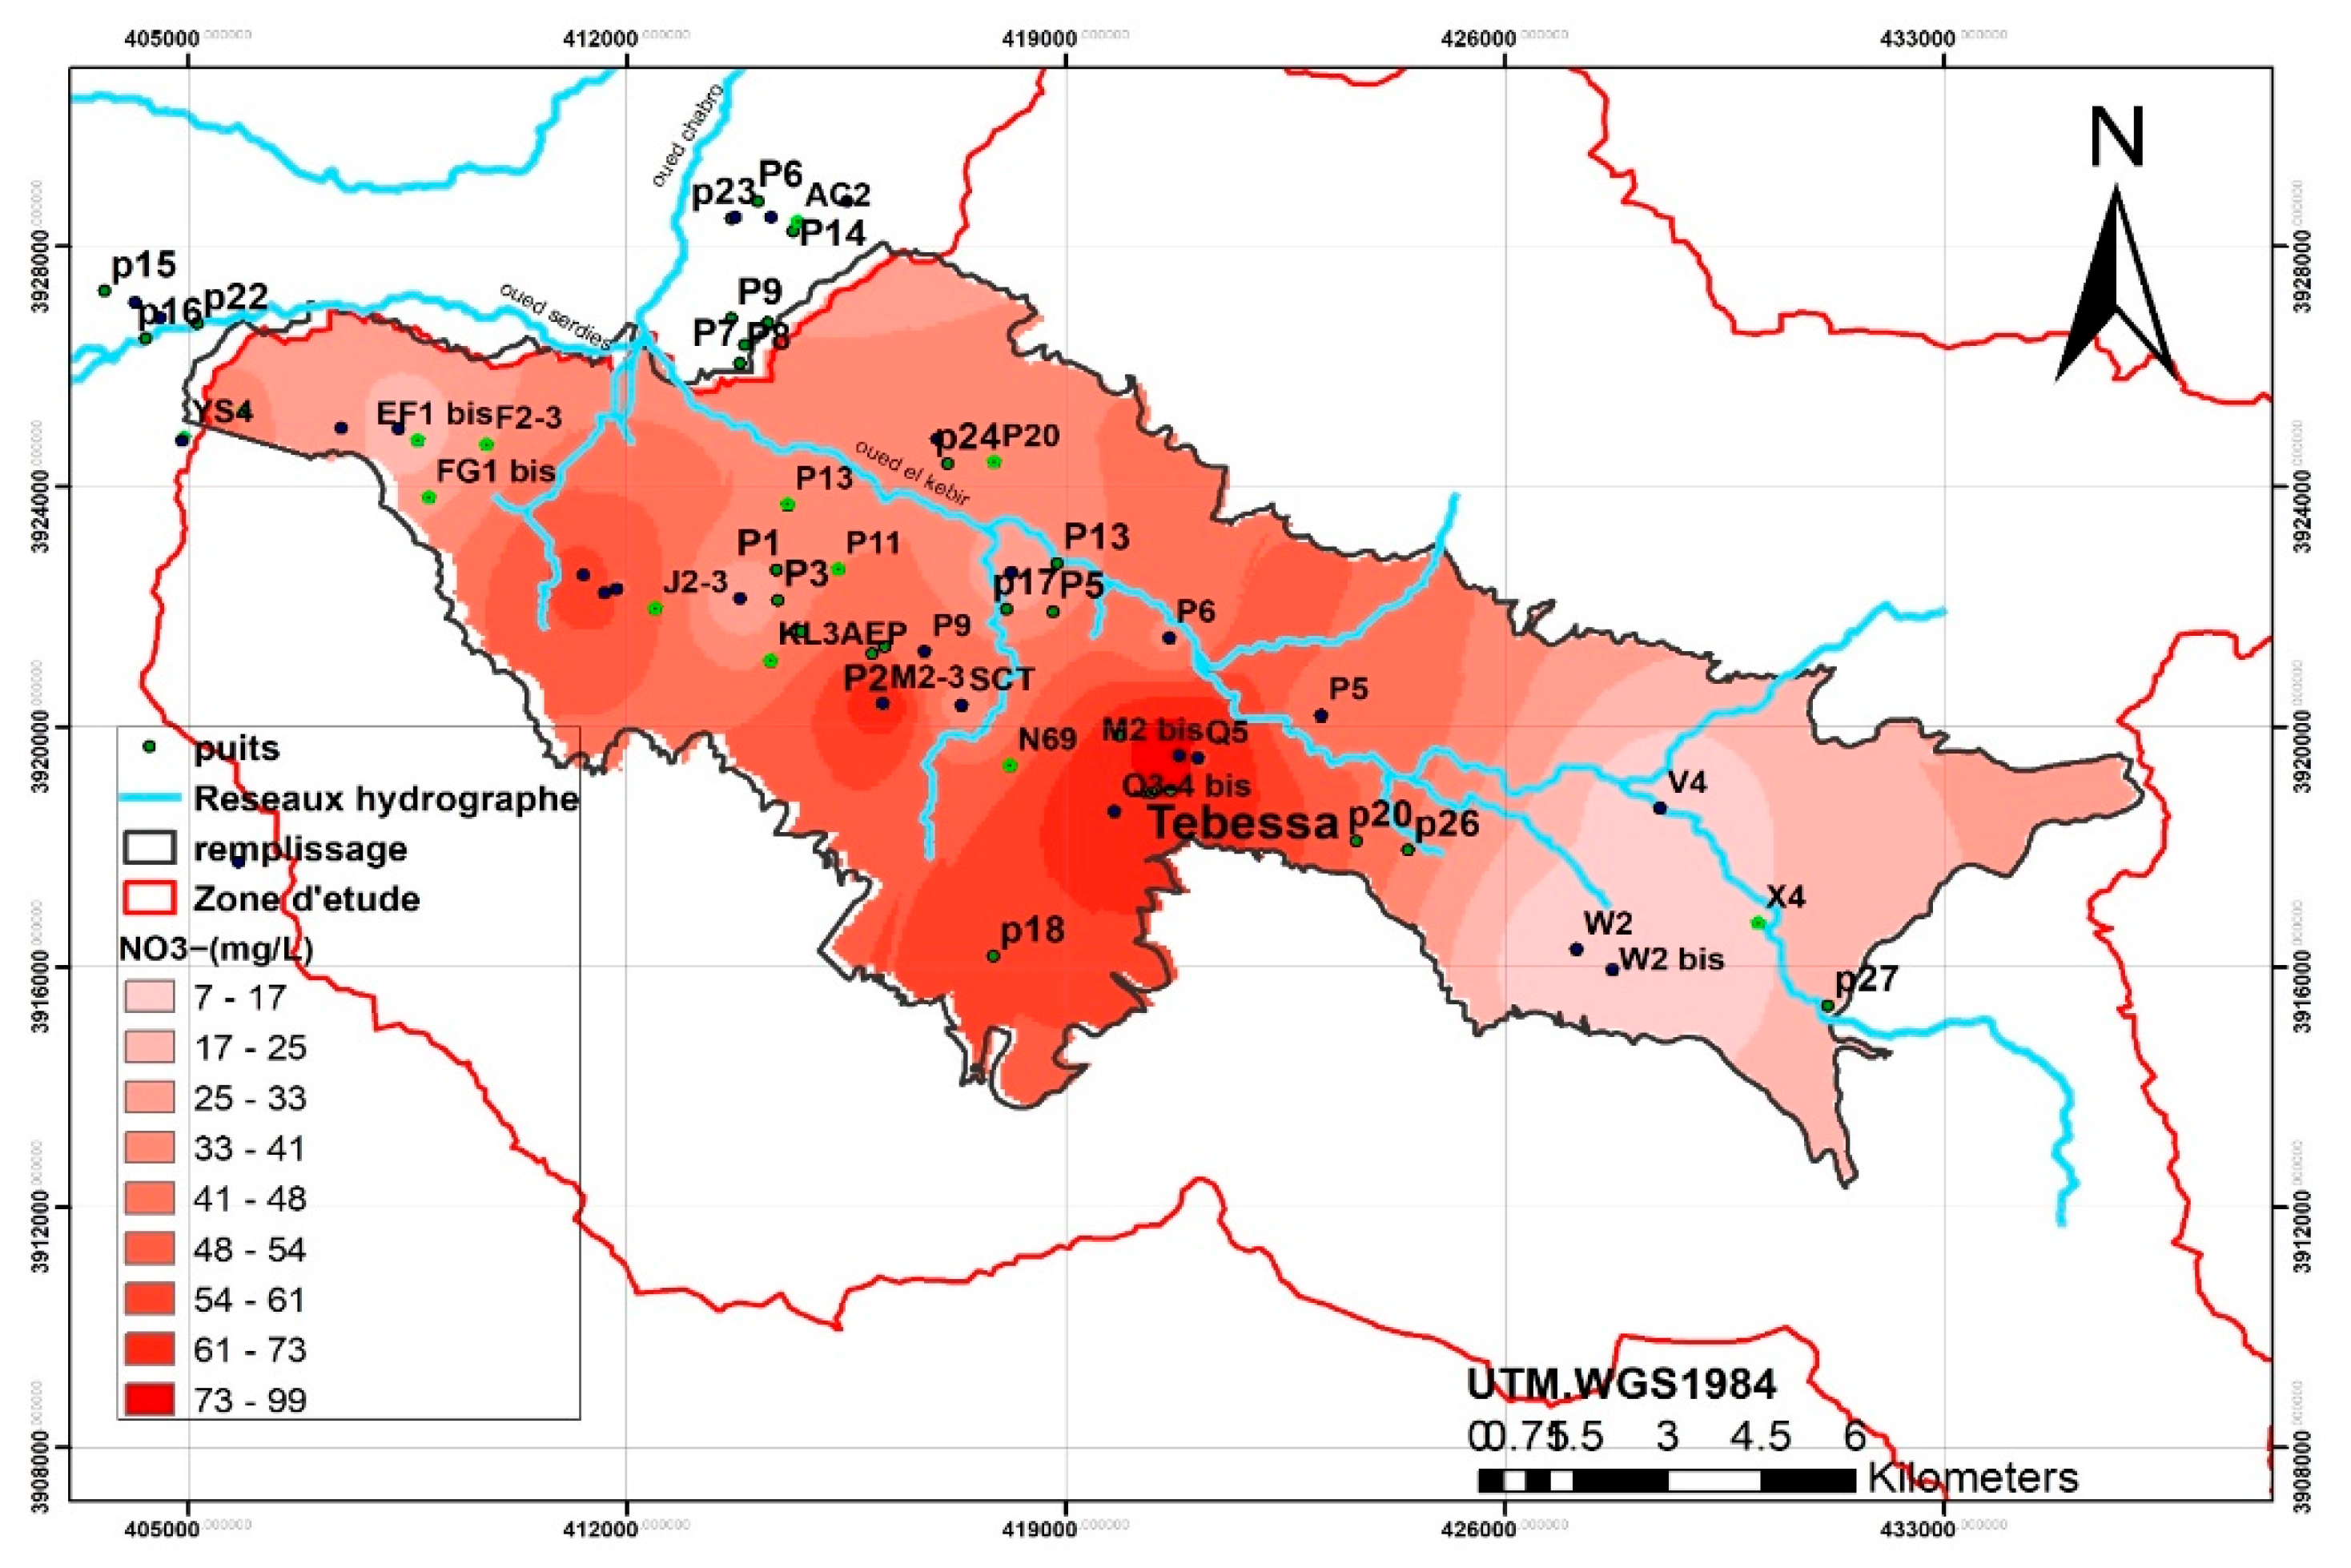
Figure 7.
Chlorides card.
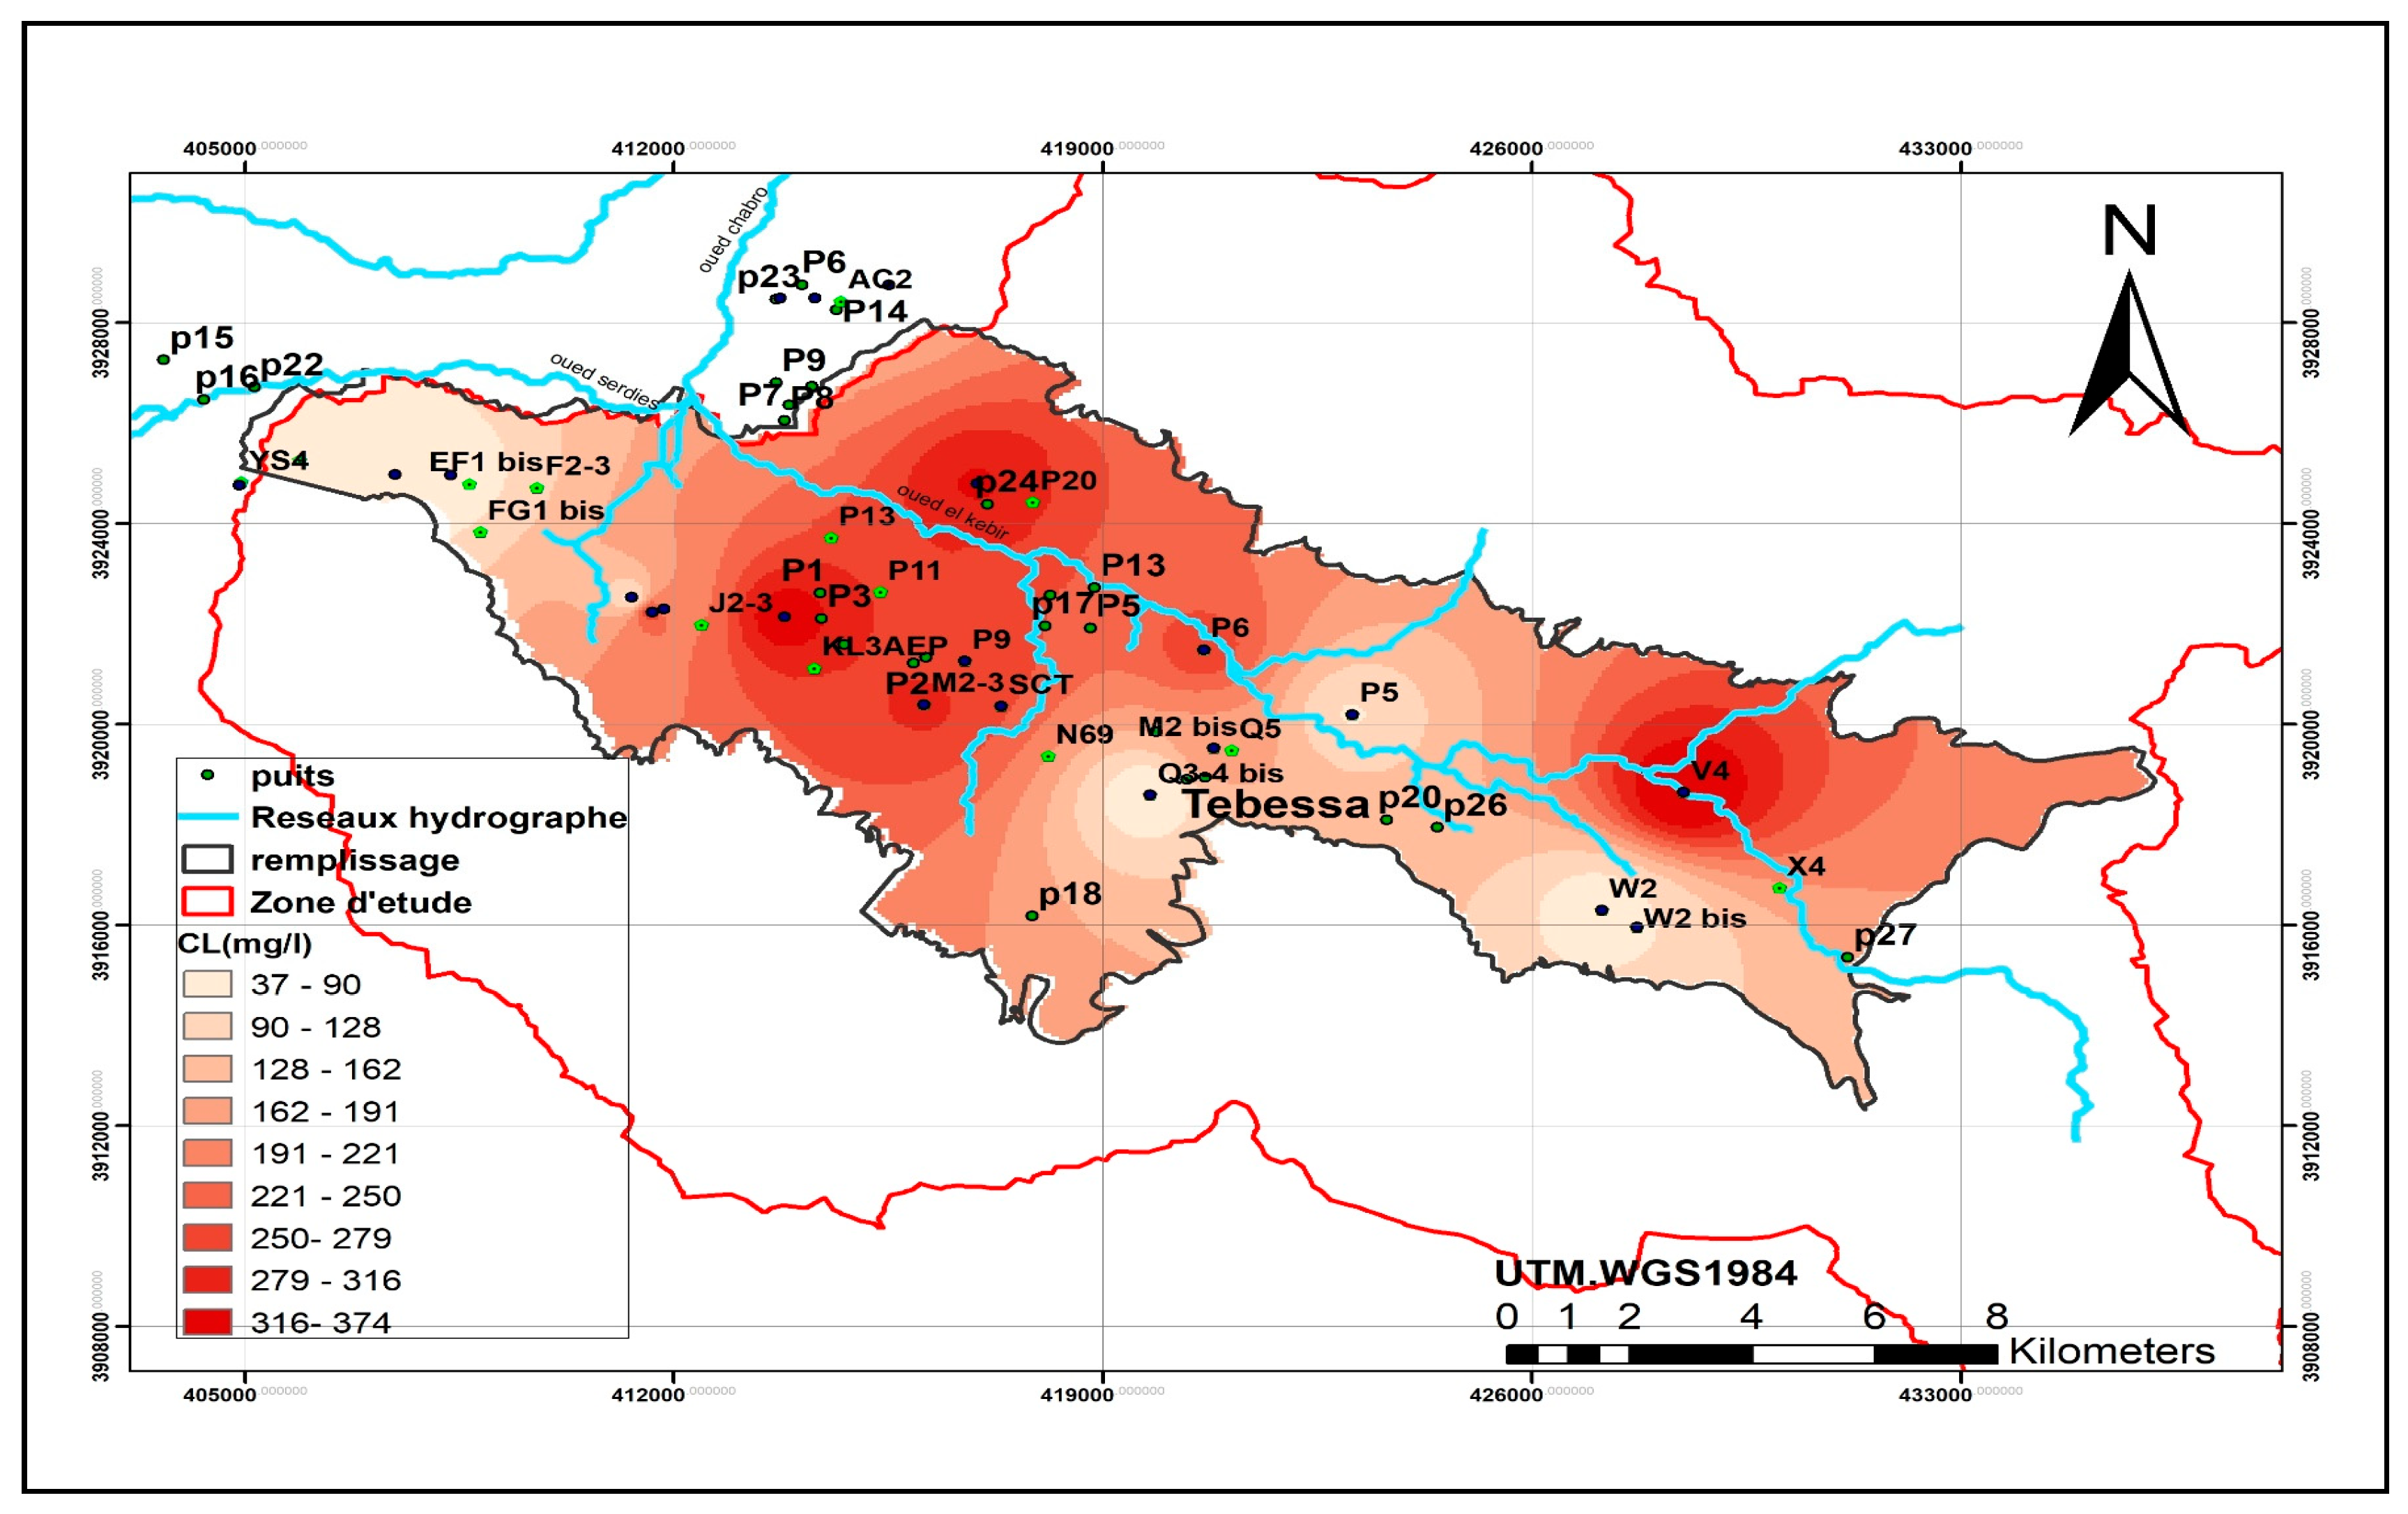
Figure 8.
Sulfates card.
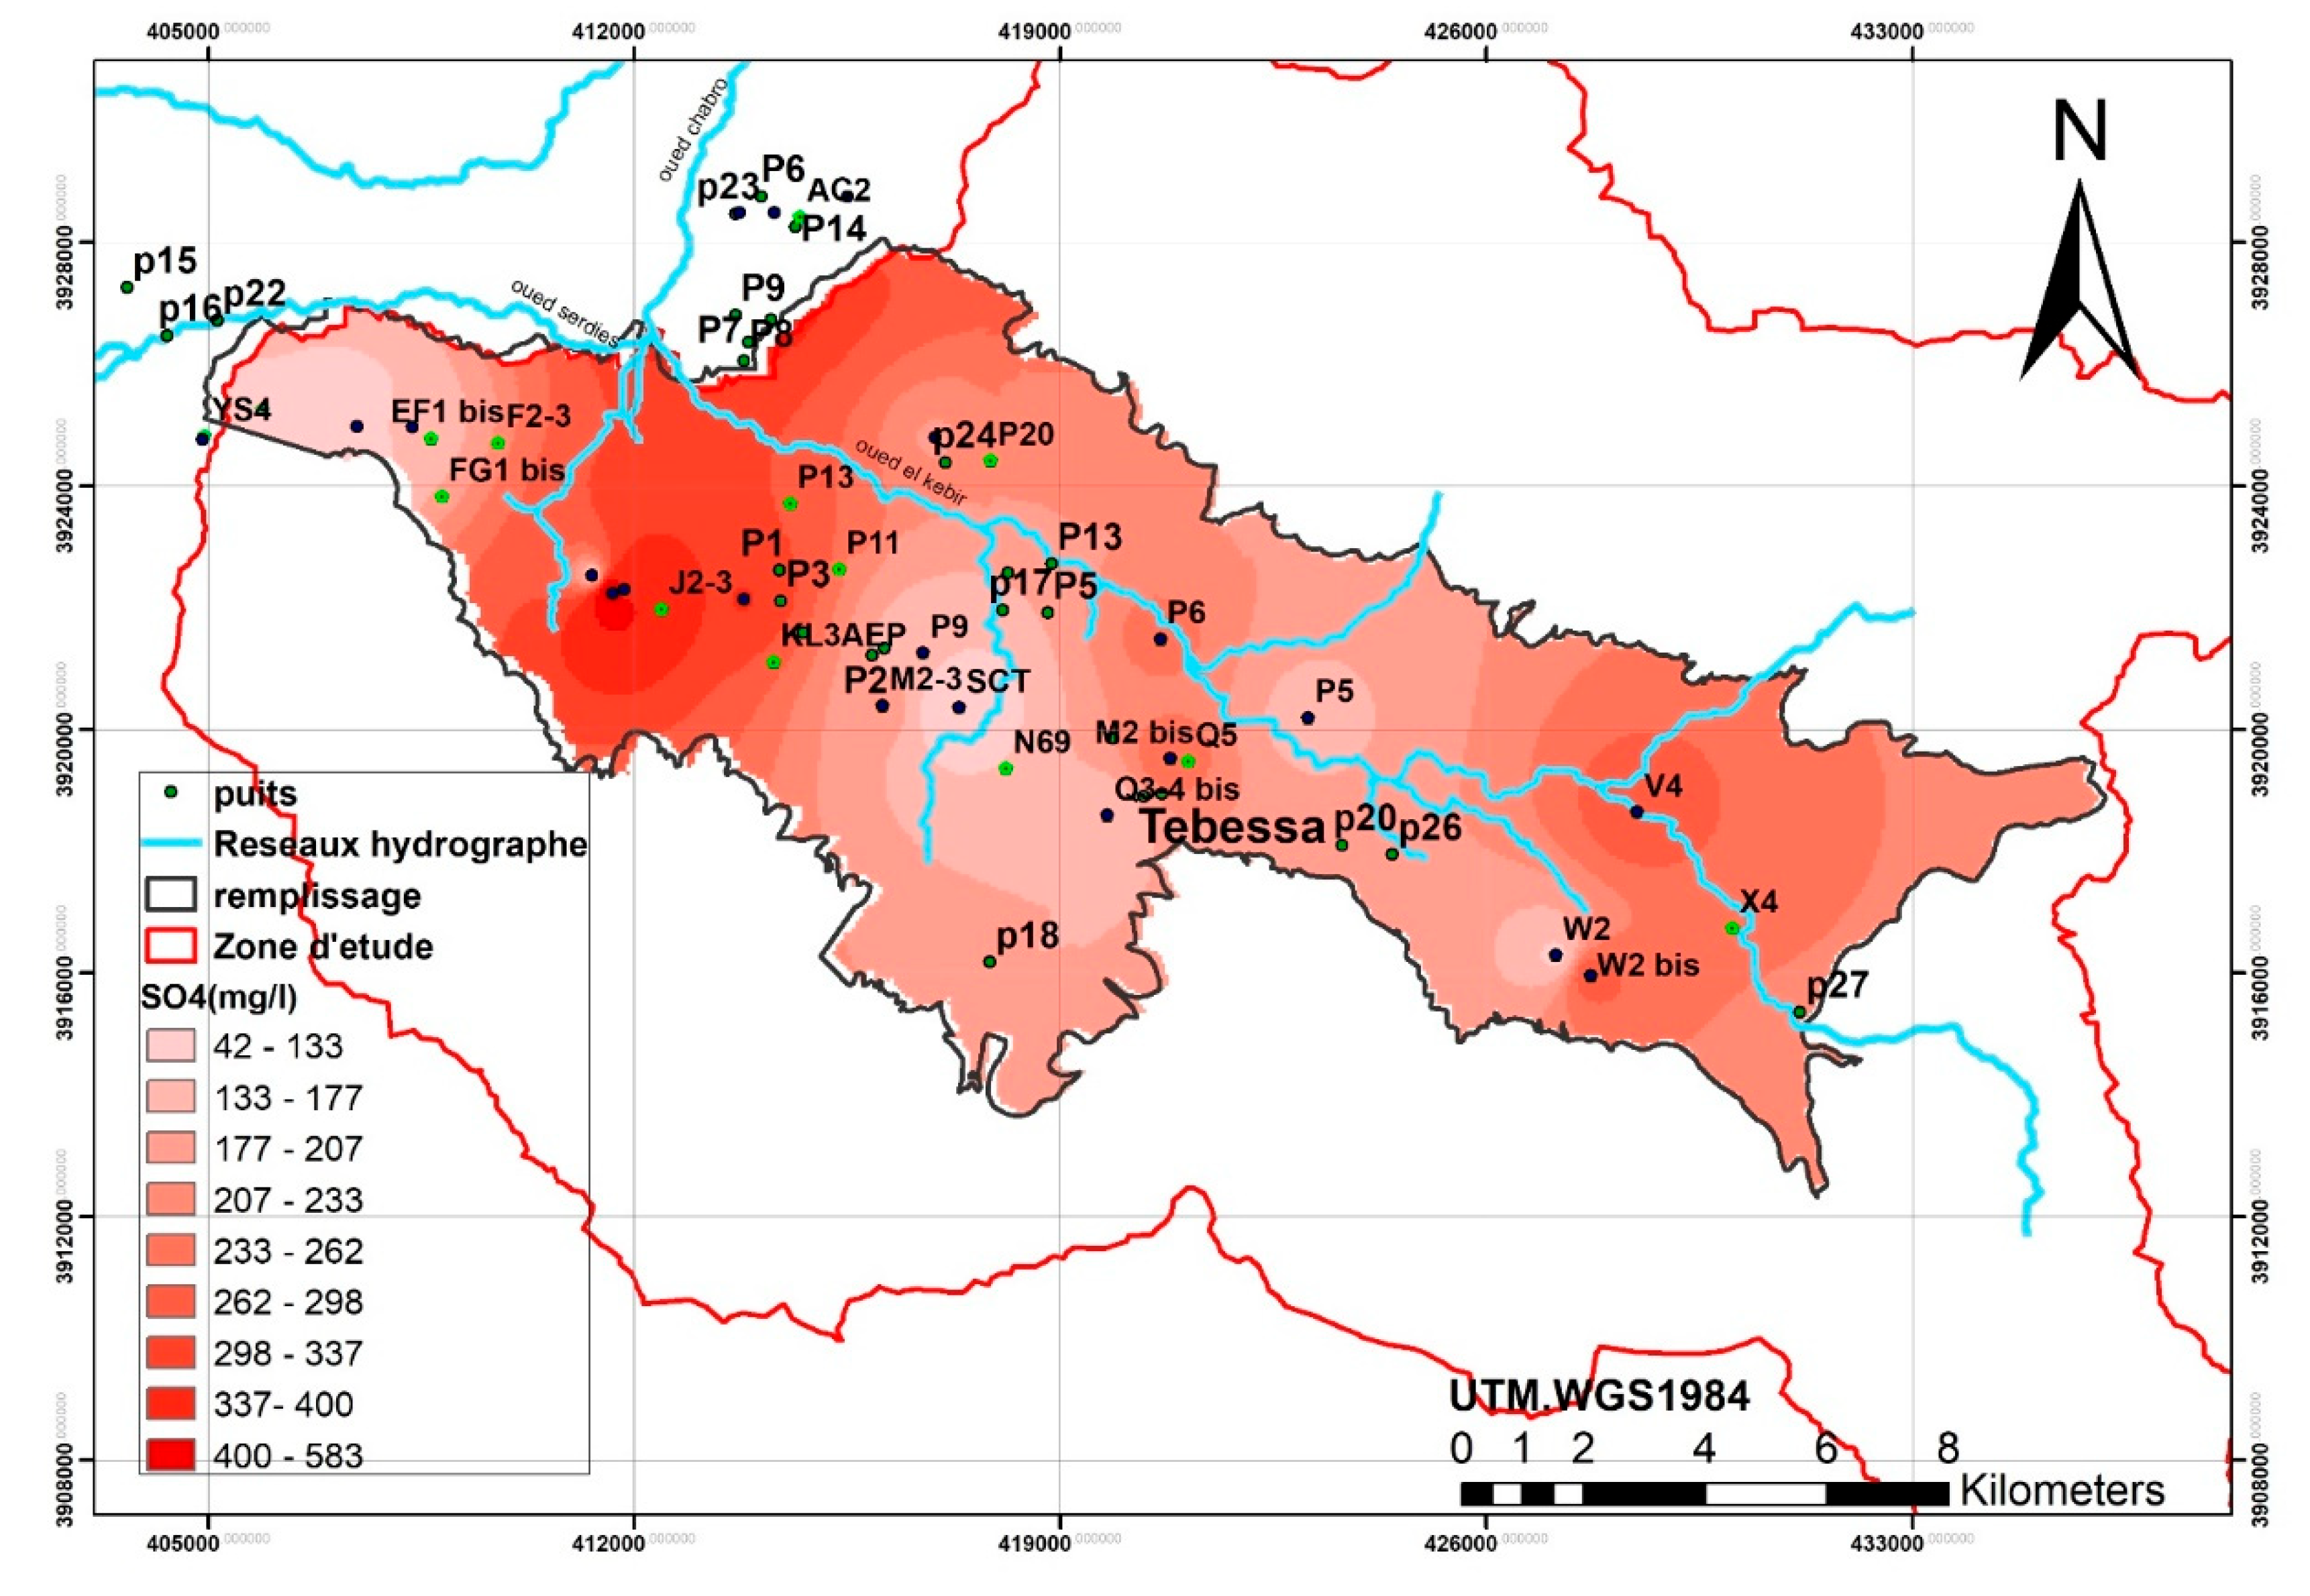
Figure 9.
Sodium card.

Figure 10.
P-P plot and Q-Q plot for TDS (P-P plot and Q-Q plot for TDS normal data top and TDS log data bottom).
Figure 10.
P-P plot and Q-Q plot for TDS (P-P plot and Q-Q plot for TDS normal data top and TDS log data bottom).
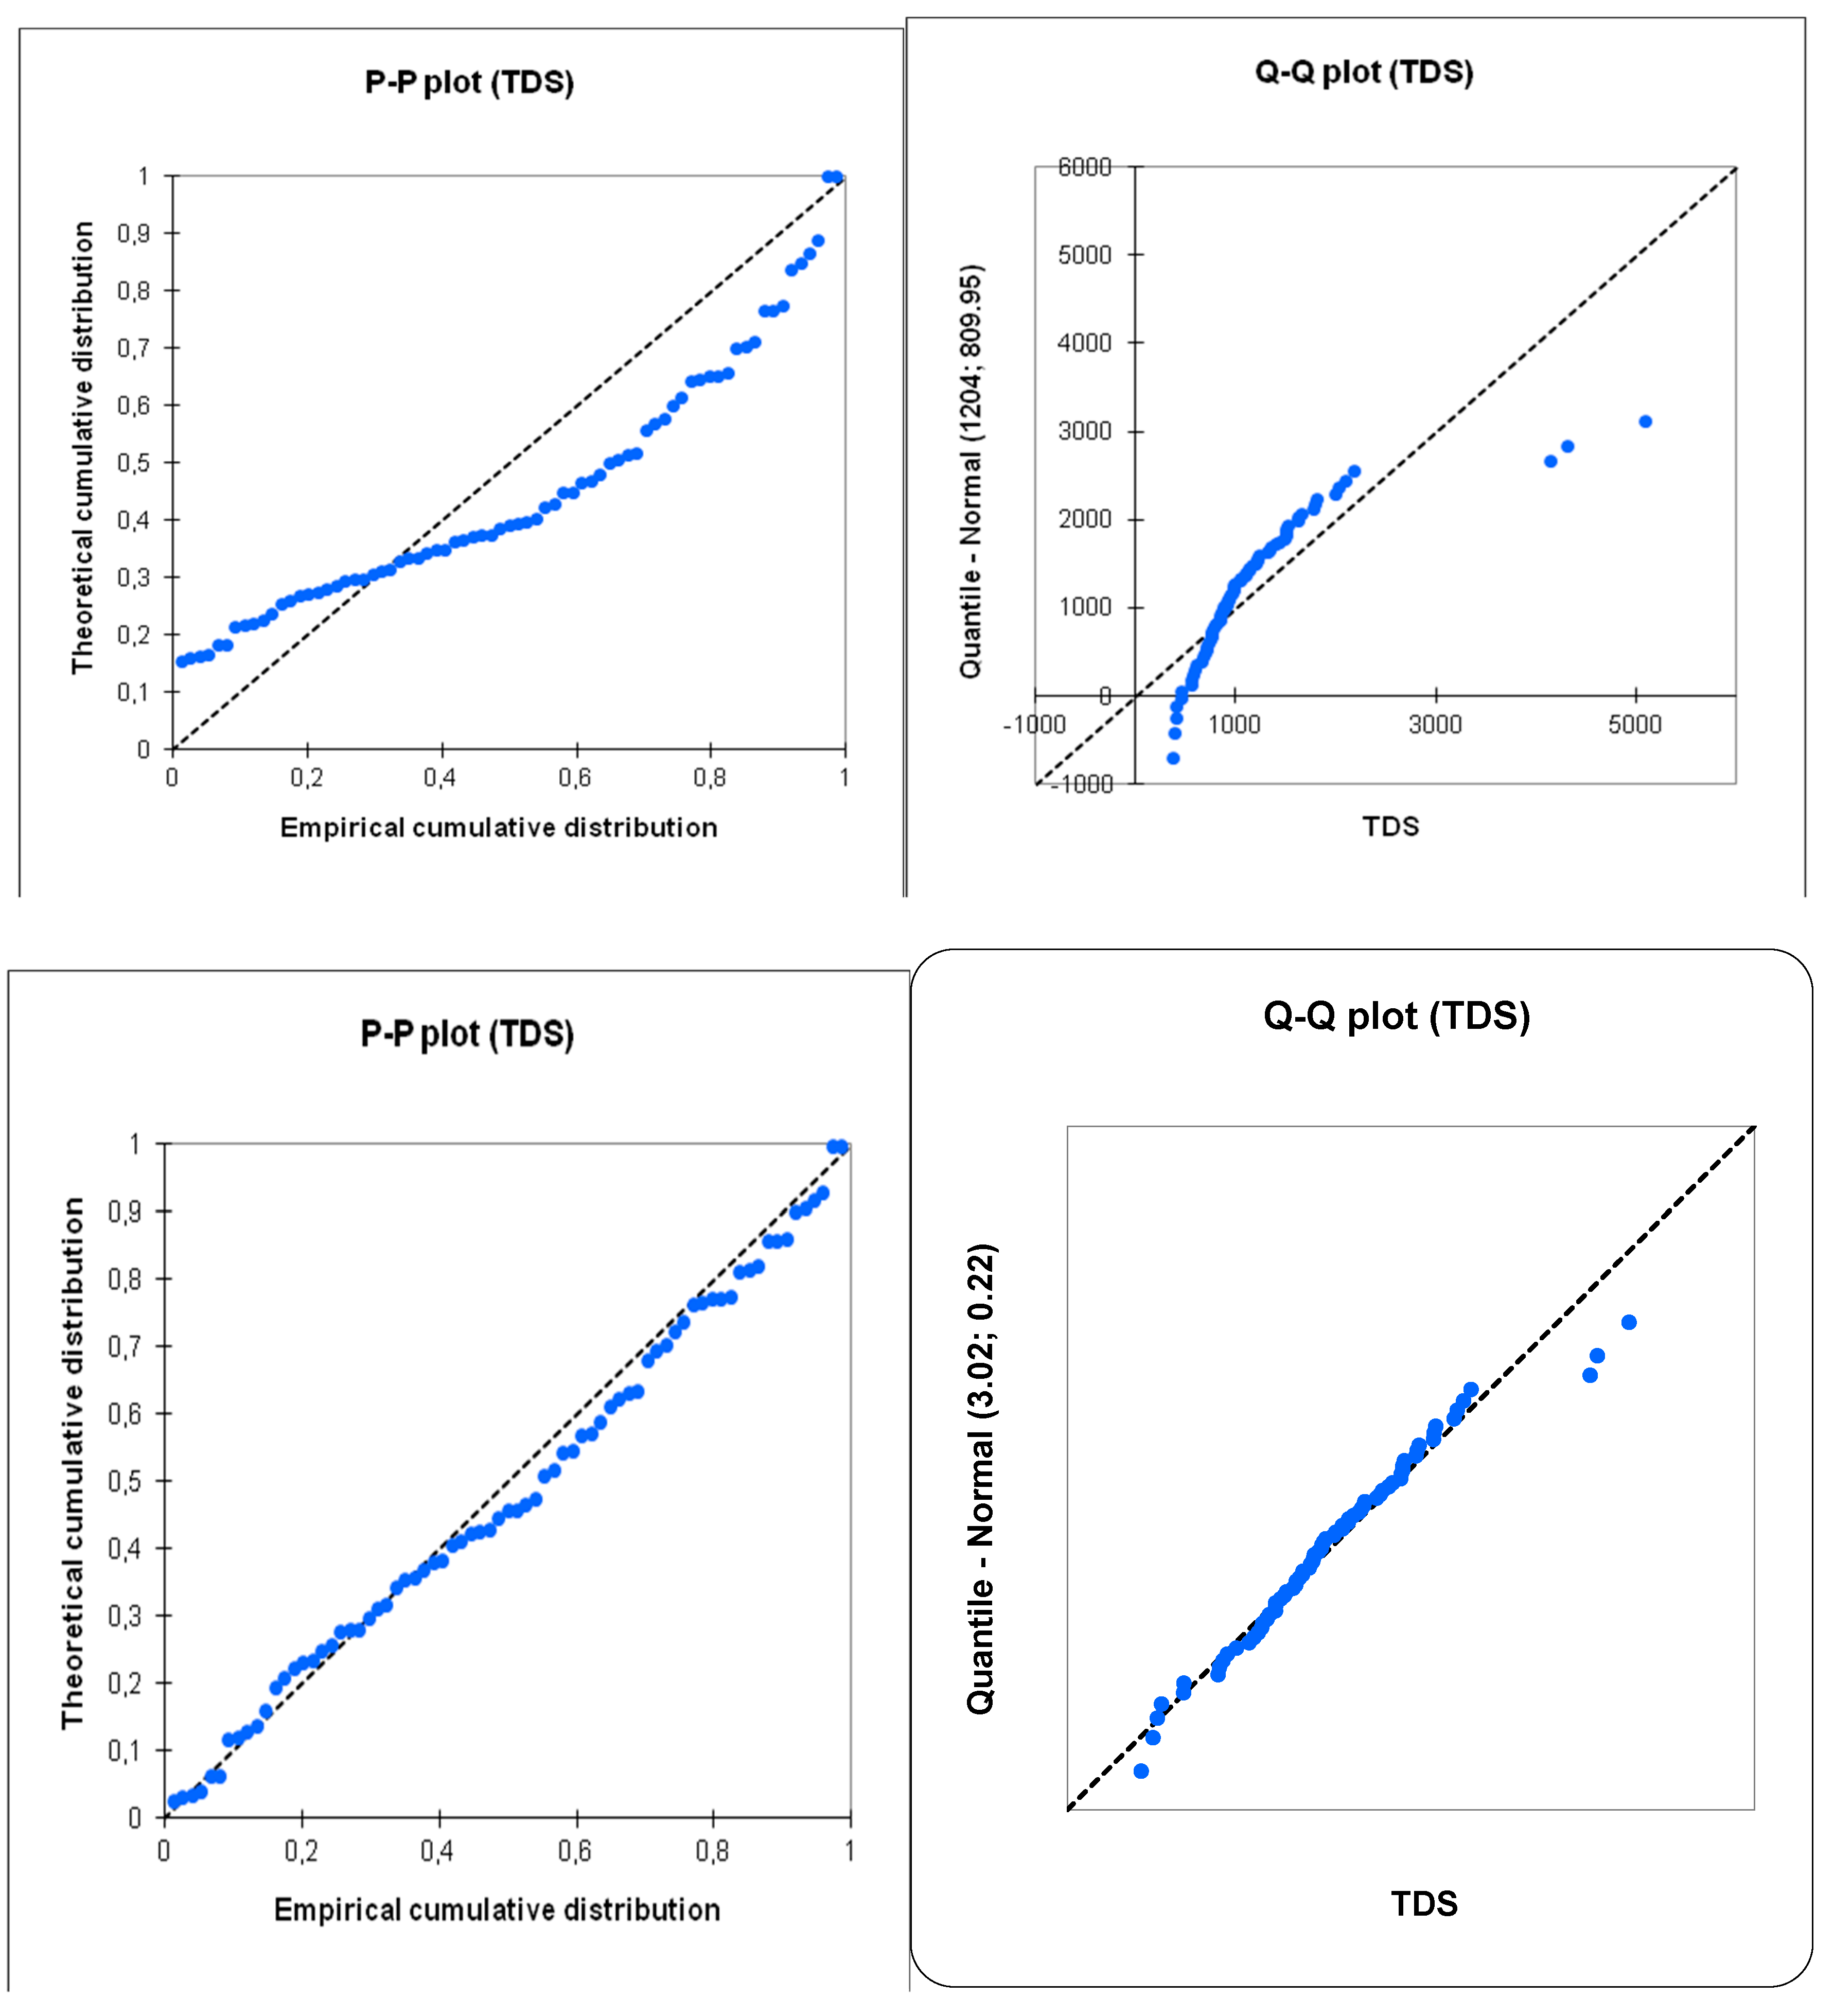
Figure 11.
P-P plot and Q-Q plot for Nitrates (P-P plot and Q-Q plot for normal NO3 data at the top and for log NO3 data at the bottom).
Figure 11.
P-P plot and Q-Q plot for Nitrates (P-P plot and Q-Q plot for normal NO3 data at the top and for log NO3 data at the bottom).
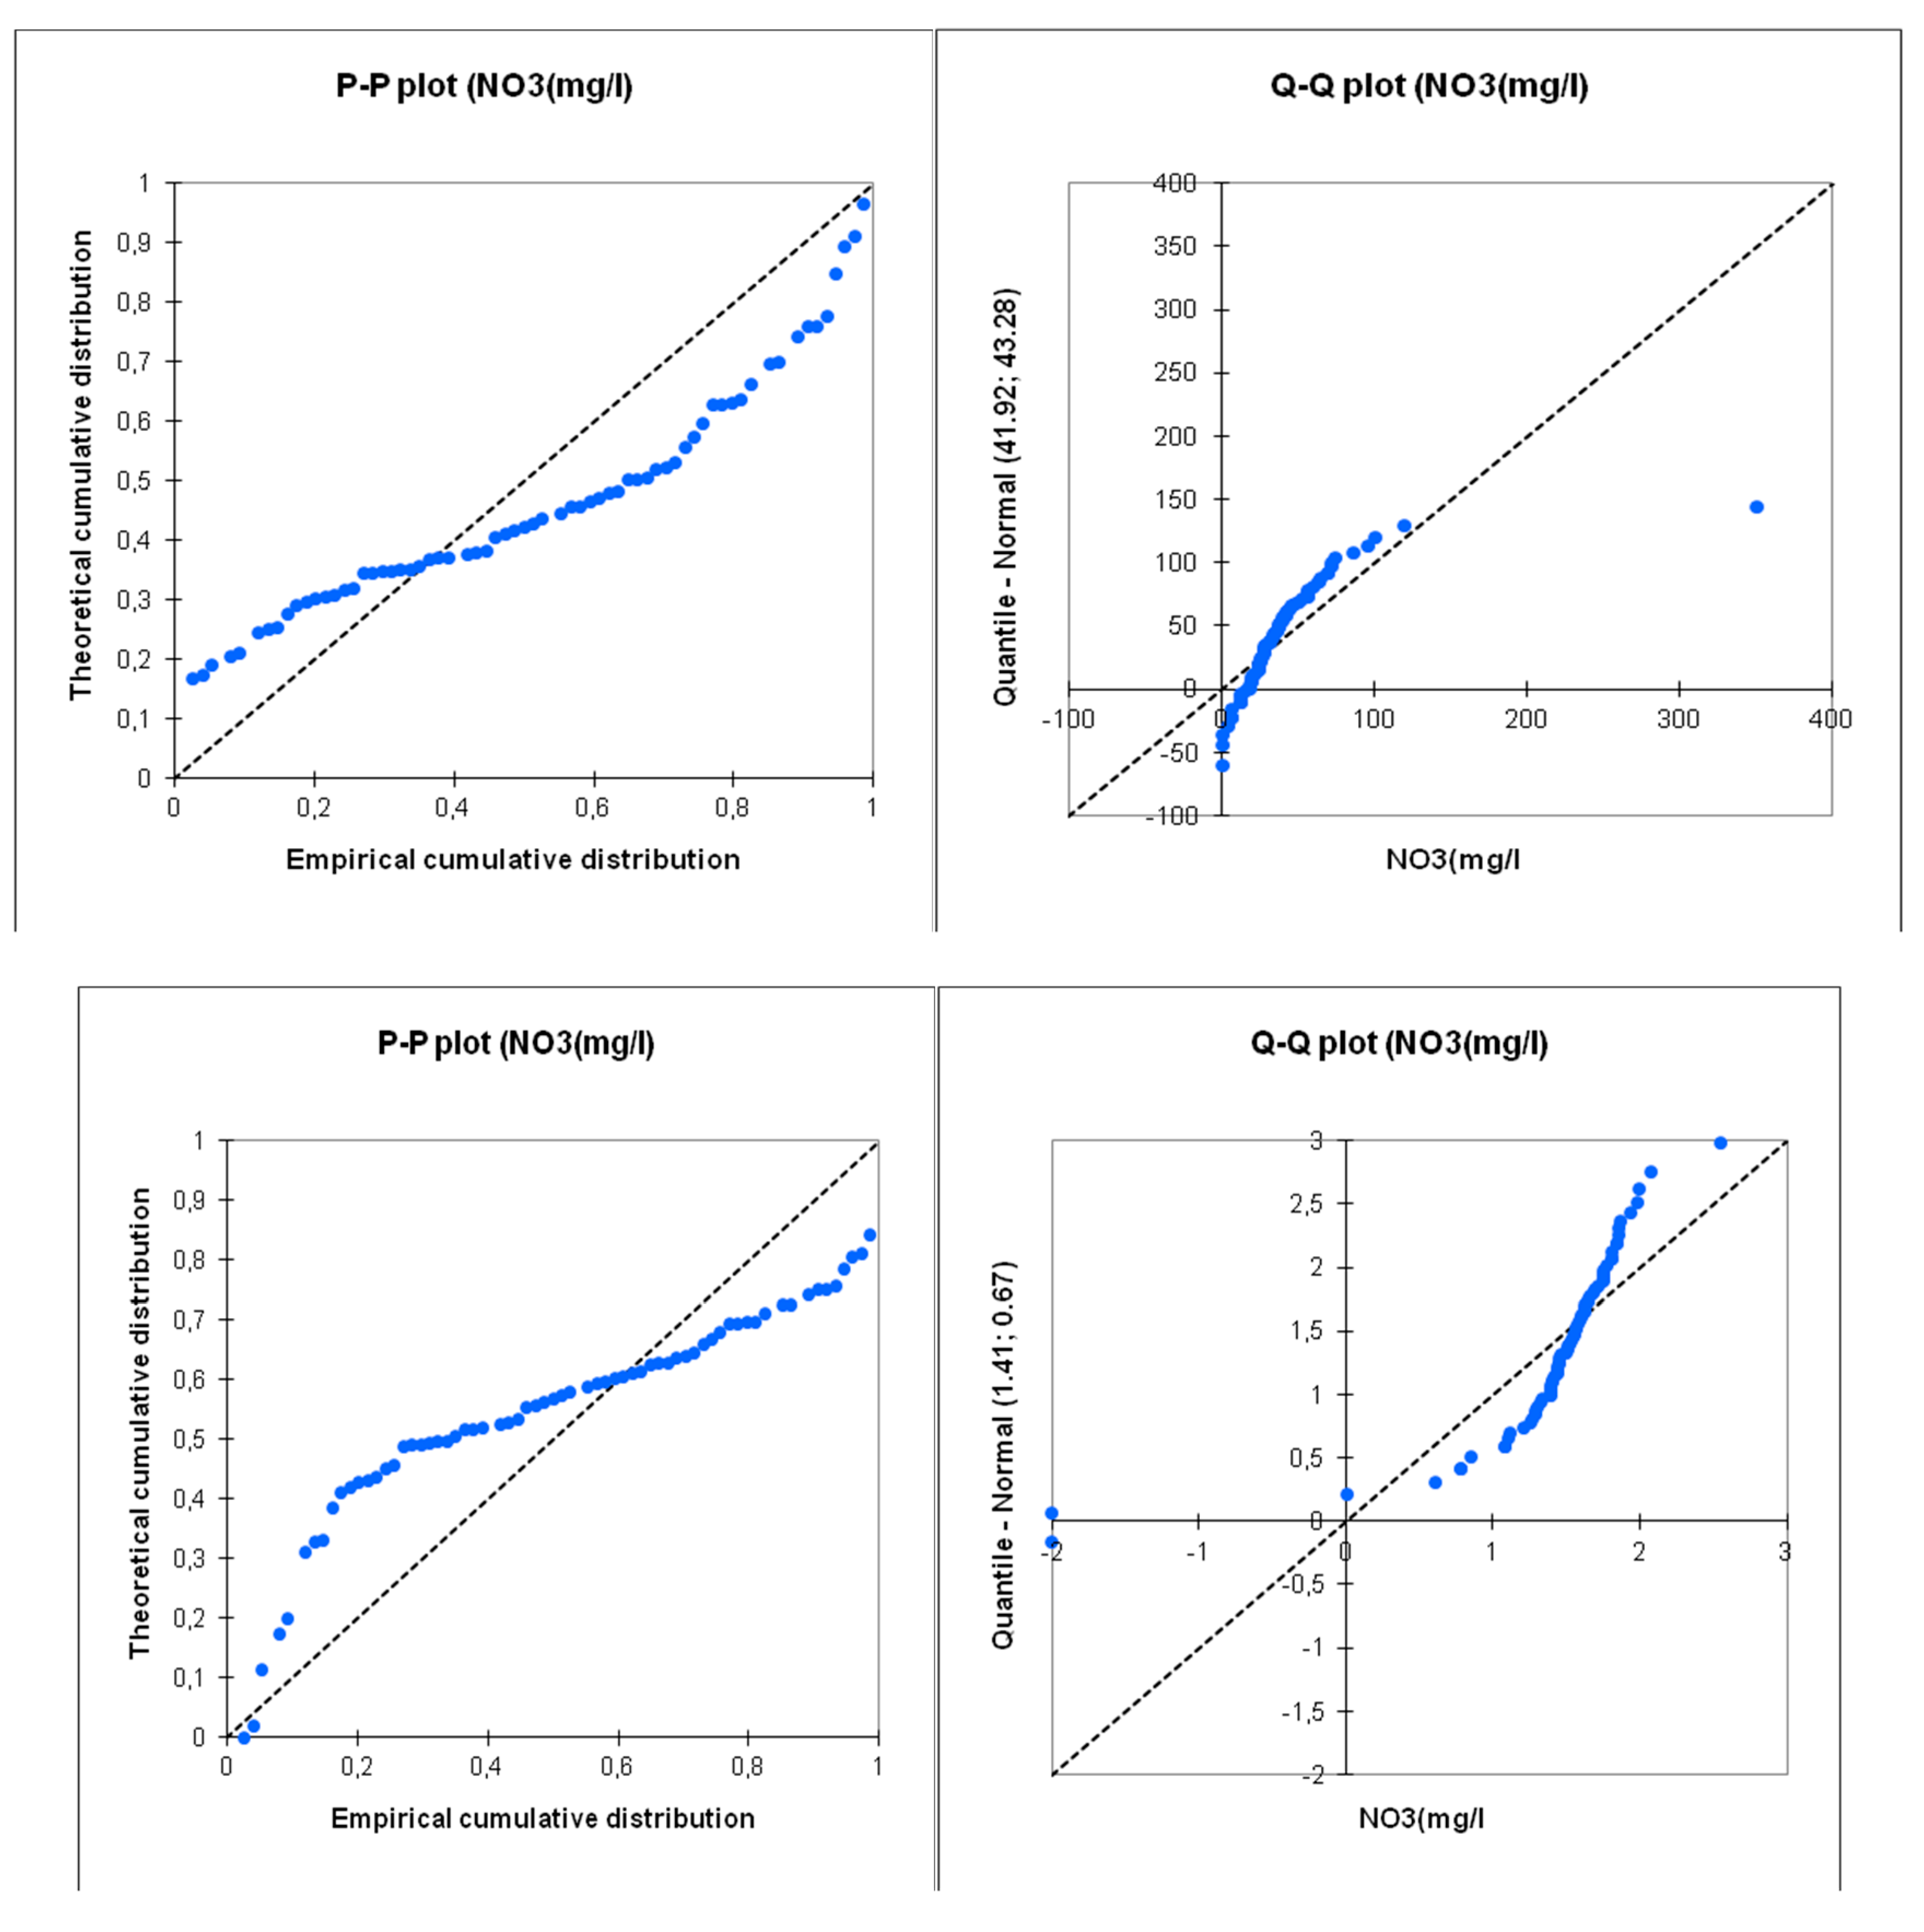
Figure 12.
P-P plot and Q-Q plot for Sulphates (P-P plot and Q-Q plot for normal SO4 data at the top and for log SO4 data at the bottom).
Figure 12.
P-P plot and Q-Q plot for Sulphates (P-P plot and Q-Q plot for normal SO4 data at the top and for log SO4 data at the bottom).
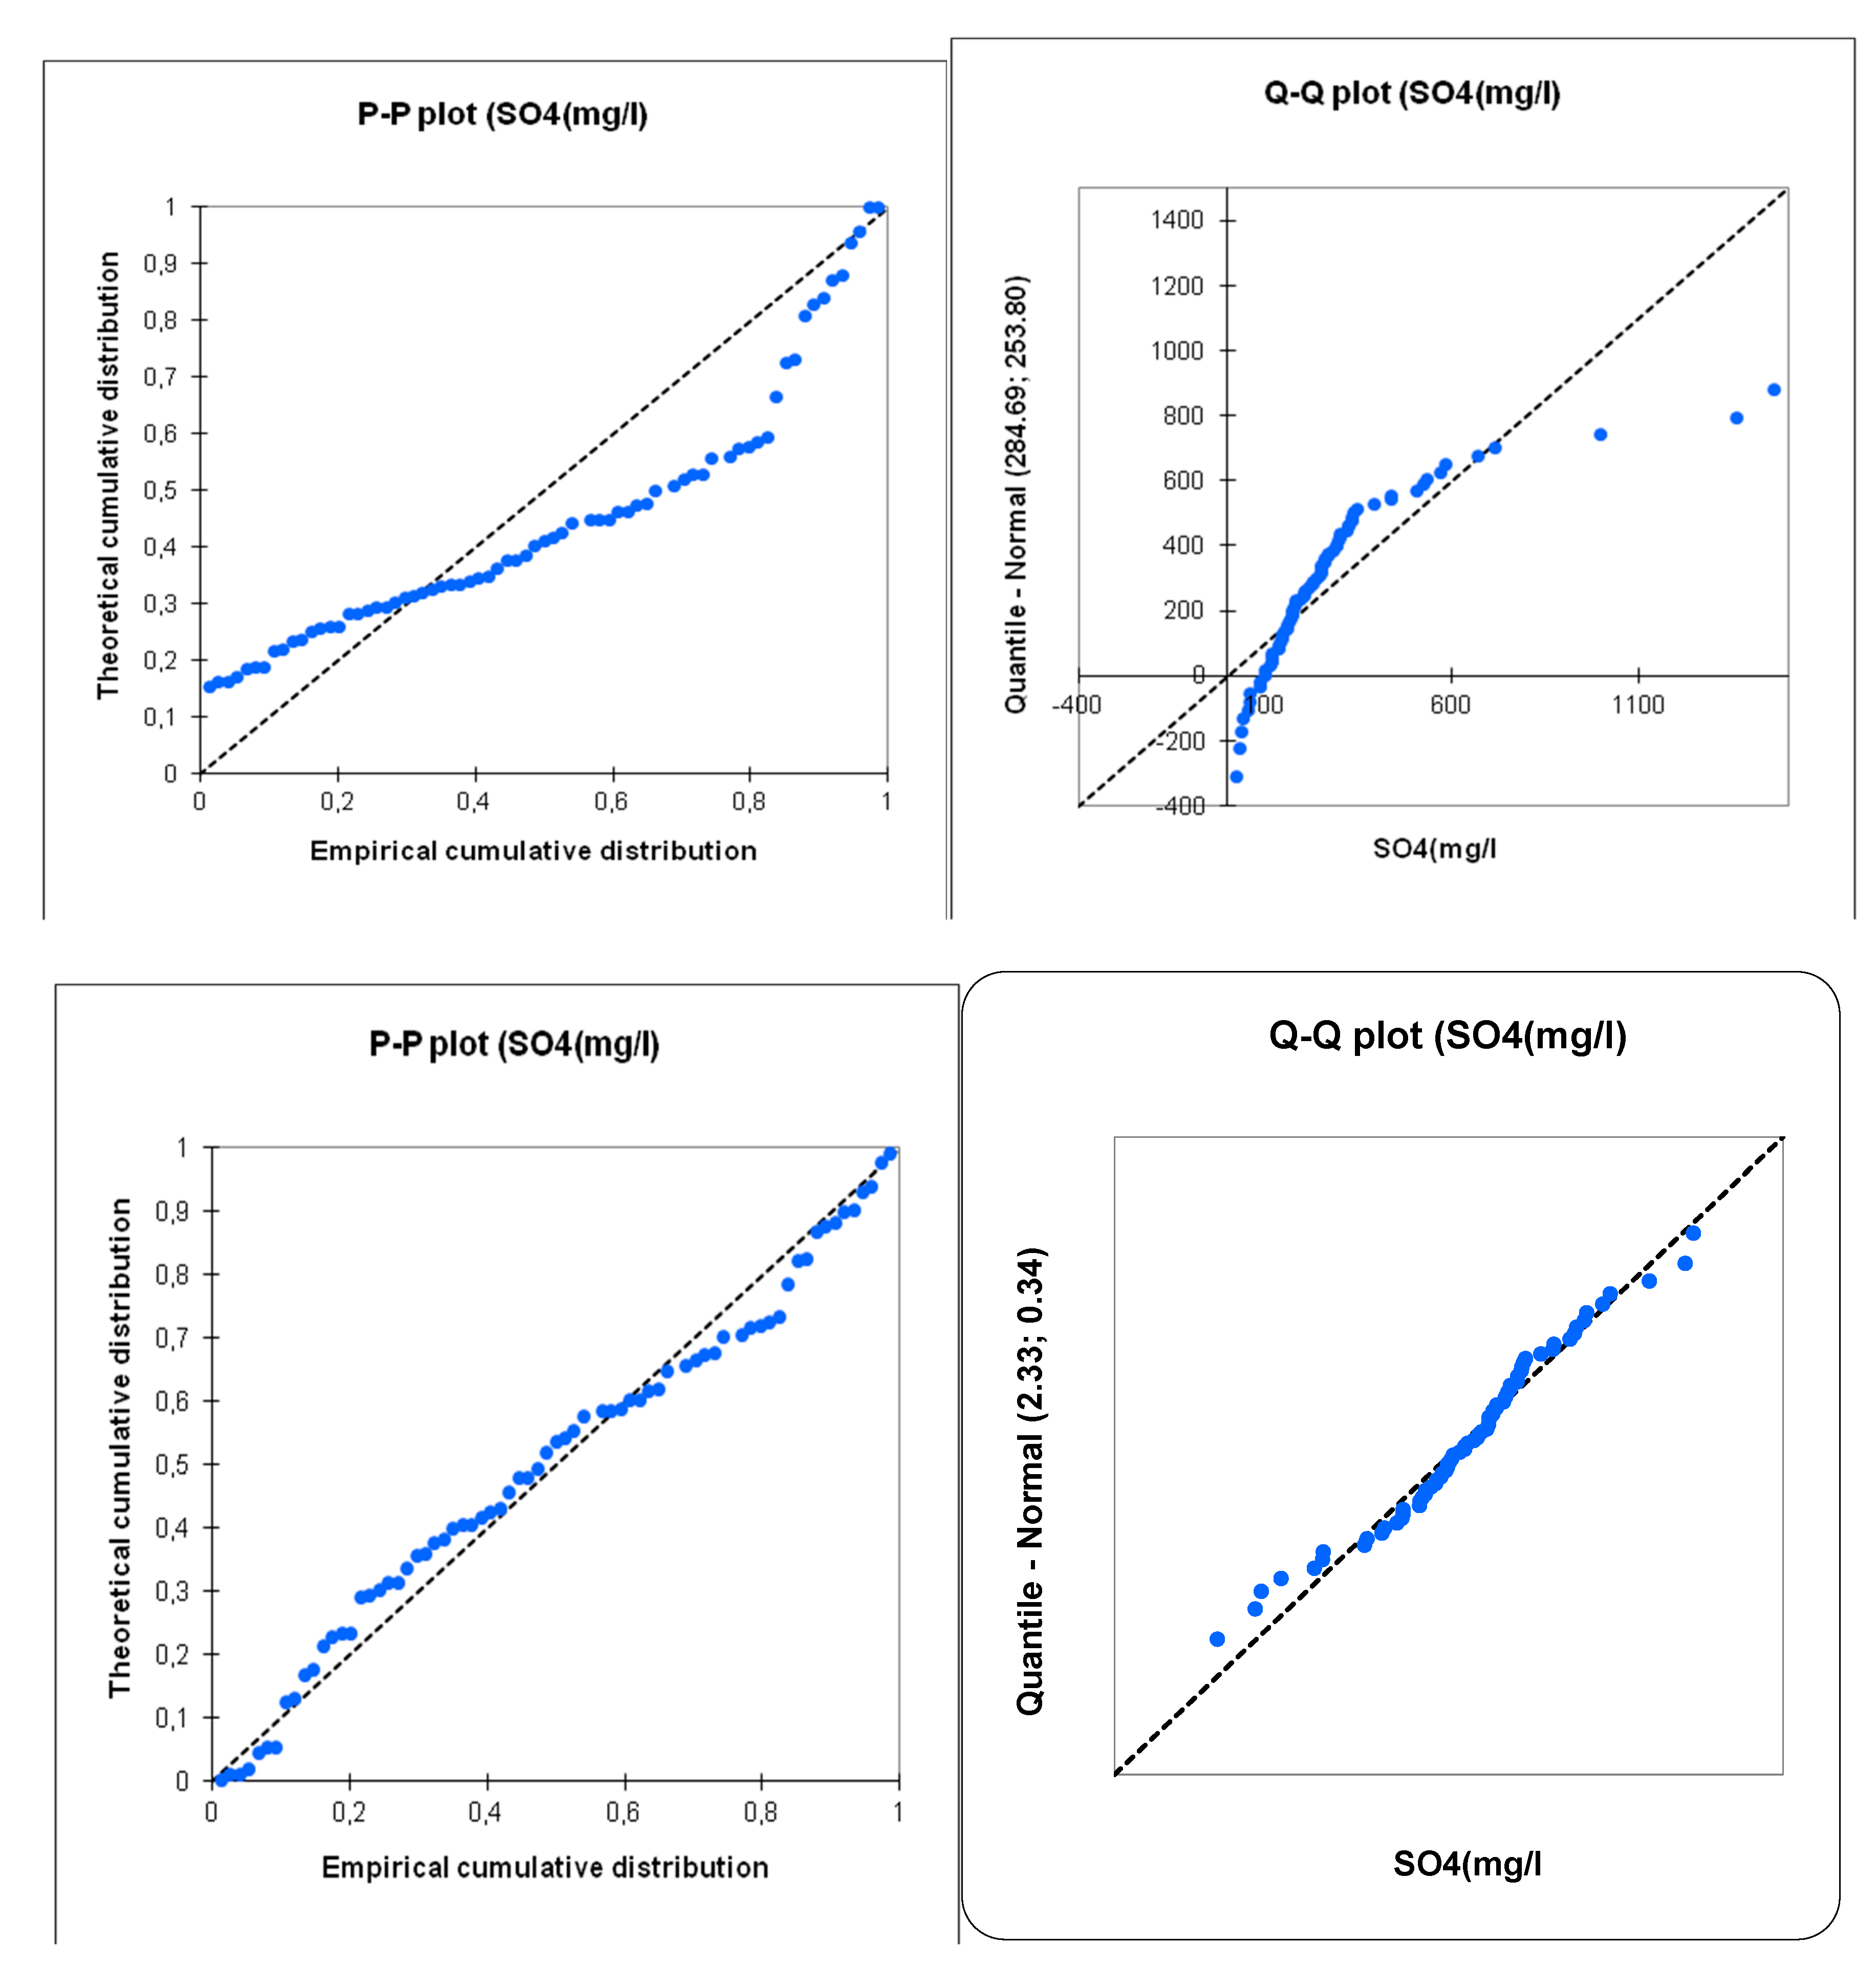
Figure 13.
a,b: Comparison of the distribution of samples in the first factorial plane for untransformed data (left) and with a log transformation (right).
Figure 13.
a,b: Comparison of the distribution of samples in the first factorial plane for untransformed data (left) and with a log transformation (right).
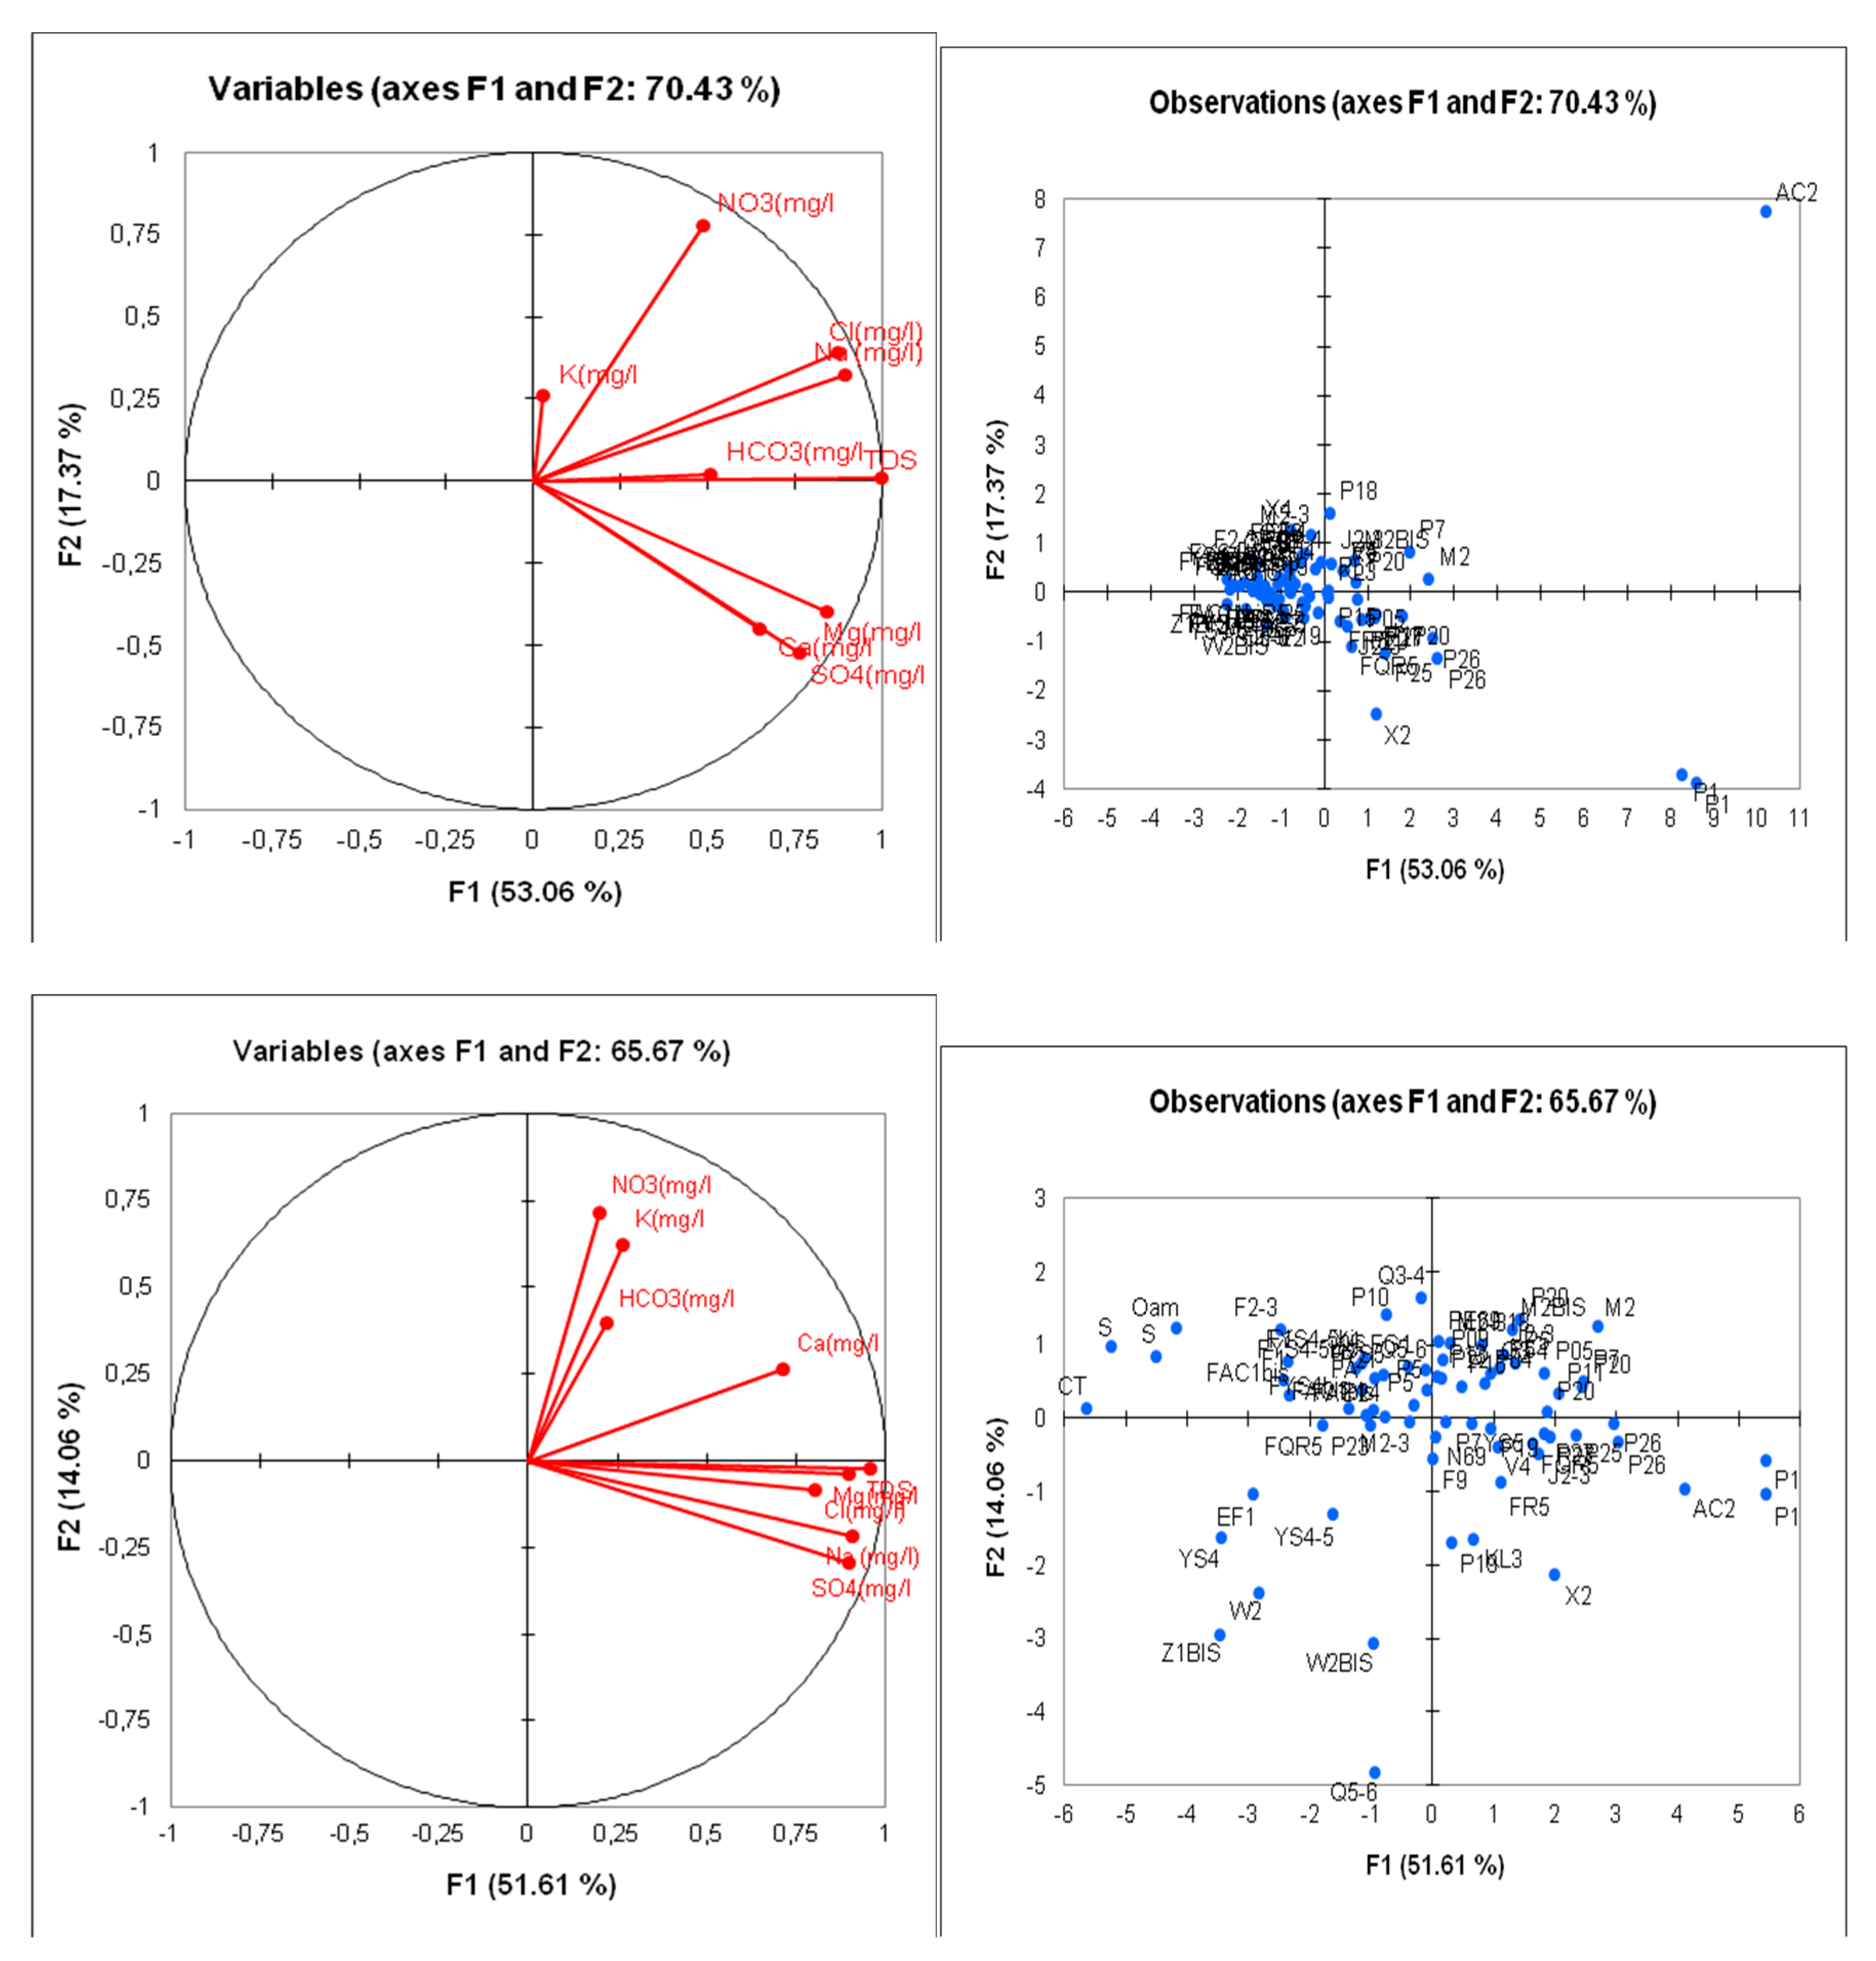
Figure 19.
Ascending hierarchical classification of water points (P: well, F: forge, S: spring, O: wadi).
Figure 19.
Ascending hierarchical classification of water points (P: well, F: forge, S: spring, O: wadi).
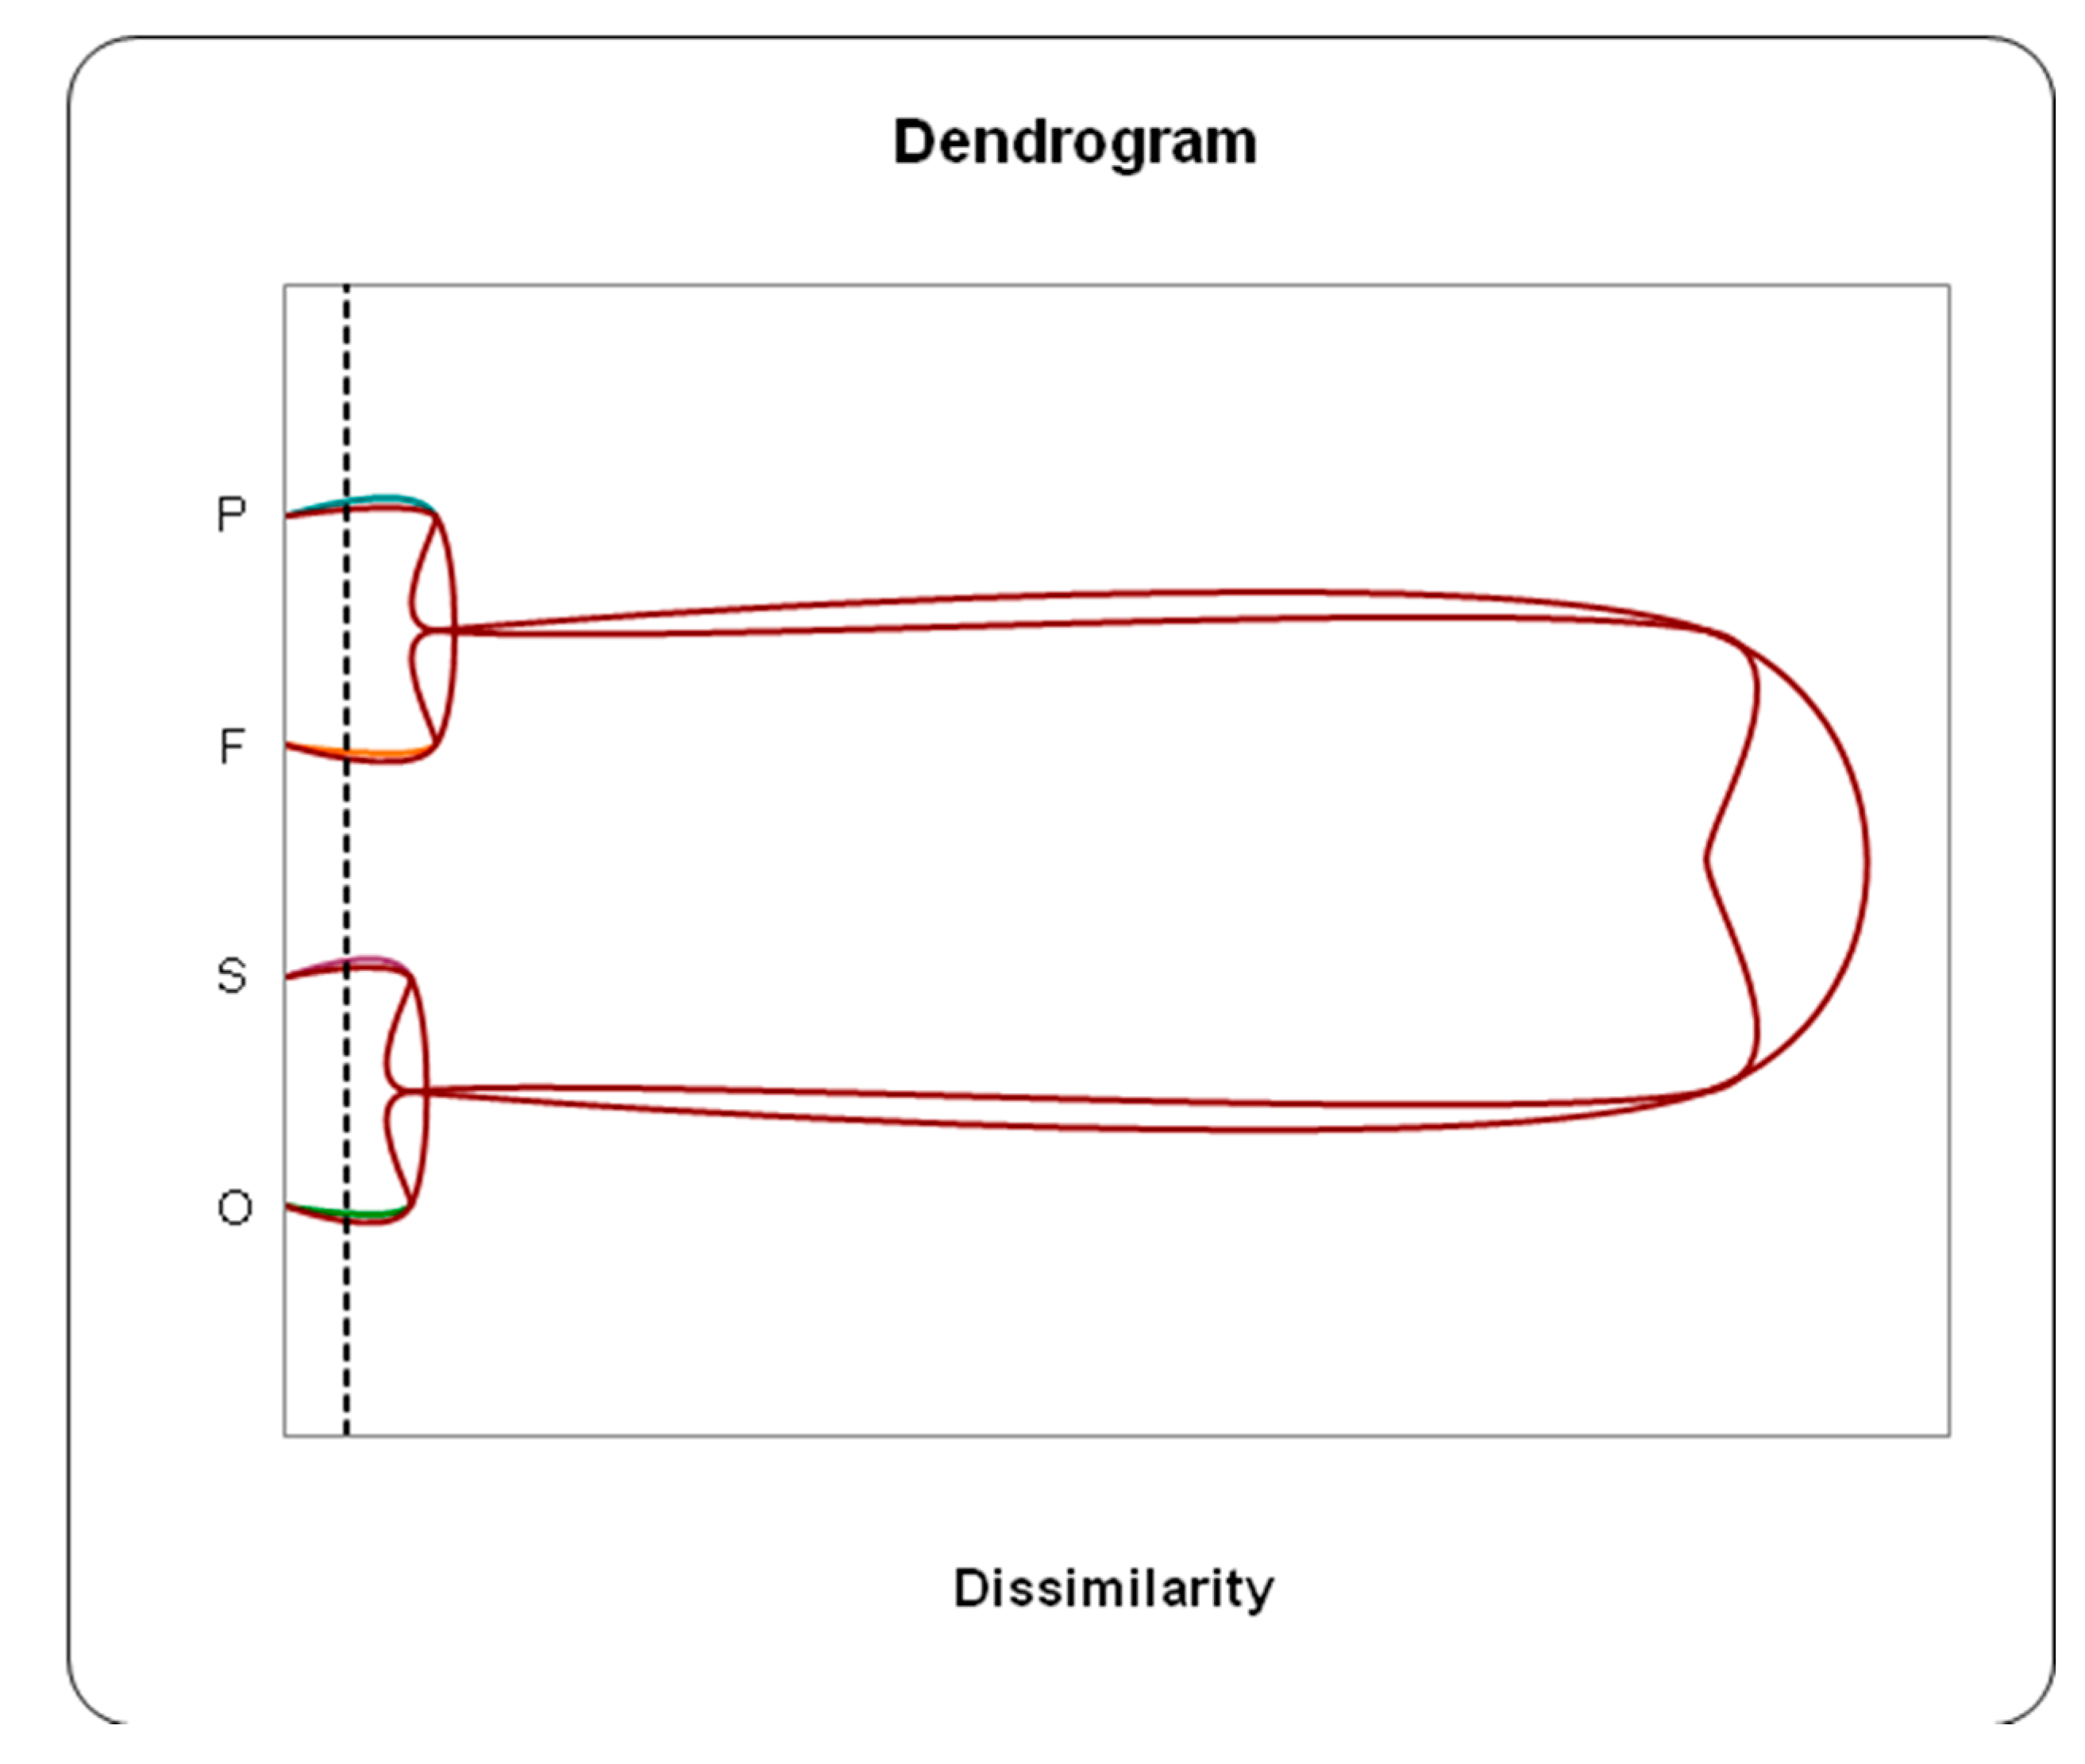
Table 1.
Average results of physico-chemical analysis of groundwater in the study area.
| Paramètres physico-chimiques/Paramètres statistiques | Eaux de surface (Oued, sources) | Nappe superficielle (captée par puits) | Nappe profonde (captée par forages) | ||||||||
| Paramètres physiques | Max | Min | Moy | Max | Min | Moy | Max | Min | Moy | Normes | |
| pH | 8.15 | 7.26 | 7.80 | 8.44 | 7.01 | 7.42 | 8.33 | 7.18 | 7.47 | >6,5<9,5 | |
| Salinité (g/l) | 0 | 0 | 0 | 4 | 0.3 | 1.12 | 1.1 | 0 | 0.33 | ||
| Cond. (µS/cm) | 480 | 442 | 456.66 | 9120 | 997 | 2414.11 | 2500 | 468 | 1067.62 | < 400 | |
| TDS (mg/l) | 208 | 197 | 203 | 7968 | 407 | 2087.91 | 1499 | 294 | 675.65 | 1500 | |
| Éléments majeurs | Ca+2(mg/l) | 77.02 | 73.64 | 75.48 | 510.80 | 47.92 | 172.78 | 178.19 | 37.14 | 93.38 | 100 |
| Mg+2(mg/l) | 9.76 | 3.32 | 7.33 | 491.38 | 29.81 | 107.62 | 68.49 | 6.67 | 26.77 | 50 | |
| Na+(mg/l) | 10.62 | 6.69 | 9.12 | 600 | 65.99 | 482.42 | 500 | 12.15 | 182.55 | 150 | |
| K+(mg/l) | 1.29 | 0.56 | 0.82 | 7.75 | 0.25 | 2.63 | 6.59 | 0.5 | 2.17 | 12 | |
| HCO3-(mg/l) | 454.98 | 242.78 | 316.76 | 740.54 | 134.2 | 361.47 | 418.42 | 207.4 | 312.01 | ||
| SO4-2(mg/l) | 35.46 | 24.27 | 31.12 | 2427.95 | 138.2 | 446.05 | 670.38 | 55.9 | 201.52 | 250 | |
| Cl-(mg/l) | 17.41 | 11.8 | 15.26 | 2202.70 | 75.74 | 344.77 | 228.25 | 7.28 | 90.43 | 200 | |
| NO3-(mg/l) | 27.45 | 16.37 | 23.03 | 117.97 | 1.52 | 38.67 | 62.47 | 4.26 | 28.87 | 50 | |
Table 2.
Results of normality tests for TDS.
| Variable | Shapiro-Wilk | Anderson-Darling | Lilliefors | Jarque-Bera |
| TDS | < 0.0001 | < 0.0001 | < 0.0001 | < 0.0001 |
| Variable | Shapiro-Wilk | Anderson-Darling | Lilliefors | Jarque-Bera |
| TDS | 0,039 | 0,190 | 0,590 | 0,025 |
Table 3.
Results of normality tests for NO3.
| Variable | Shapiro-Wilk | Anderson-Darling | Lilliefors | Jarque-Bera |
|---|---|---|---|---|
| NO3(mg/l | < 0.0001 | < 0.0001 | < 0.0001 | < 0.0001 |
| Variable | Shapiro-Wilk | Anderson-Darling | Lilliefors | Jarque-Bera |
| NO3(mg/l | < 0.0001 | < 0.0001 | < 0.0001 | < 0.0001 |
Table 4.
Results of normality tests for SO4.
| Variable | Shapiro-Wilk | Anderson-Darling | Lilliefors | Jarque-Bera |
|---|---|---|---|---|
| SO4(mg/l | < 0.0001 | < 0.0001 | < 0.0001 | < 0.0001 |
| Variable | Shapiro-Wilk | Anderson-Darling | Lilliefors | Jarque-Bera |
| SO4(mg/l | 0,125 | 0,049 | 0,118 | 0,268 |
Disclaimer/Publisher’s Note: The statements, opinions and data contained in all publications are solely those of the individual author(s) and contributor(s) and not of MDPI and/or the editor(s). MDPI and/or the editor(s) disclaim responsibility for any injury to people or property resulting from any ideas, methods, instructions or products referred to in the content. |
© 2025 by the authors. Licensee MDPI, Basel, Switzerland. This article is an open access article distributed under the terms and conditions of the Creative Commons Attribution (CC BY) license.
Copyright: This open access article is published under a Creative Commons CC BY 4.0 license, which permit the free download, distribution, and reuse, provided that the author and preprint are cited in any reuse.


