Submitted:
23 December 2025
Posted:
23 December 2025
You are already at the latest version
Abstract
This work focuses on the preparation and characterization of chitosan (CS) at different degrees of deacetylation (CS 74%, CS 86%, CS 90% and CS 95%) in order to use them as adsorbents to remove fluoride ions. The characterization of the materials was carried out by X-ray diffraction, Infrared spectroscopy and determination the degrees of deacetylation (DD) by conductometric titration. The influence of various physico-chemical parameters such as adsorbent dose, contact time, pH, initial fluoride concentration and temperature were studied. The adsorption kinetics was studied using pseudo-first order and pseudo-second order kinetic equations. The adsorption isotherm was investigated by Langmuir and Freundlich models.
Keywords:
adsorption
; fluoride
; chitosan
; degree of deacetylation
1. Introduction
Fluoride ions are generally released into the environment from alteration of fluorine-rich mineral rocks, such as fluorapatite (Ca5(PO4)3F) contained in natural phosphate. The results of physico-chemical analysis in some regions of Morocco have shown that fluoride ions in groundwater exceed the World Health Organization (WHO) standards.
For the defluoridation of contaminated water several techniques have been developed, including ion exchange, coagulation-precipitation, electrochemical methods and adsorption, the latter seems more effective and more economical [1,2]. Adsorption is thus the most studied technique with the exploration of new adsorbents and in particular those derived from abundant natural resources. Thus, in our laboratory we were interested in the properties of chitosan as adsorbents for denitrification [3] and defluoridation [4,5] of contaminated water.
Chitosan is a biopolymer obtained from chitin which itself extracted from the exoskeleton of the arthropods such as shrimps, crabs or the endoskeleton of cephalopods such as squid the structure of the chitosan is composed of two units, D-glucosamine and N-acetyl-D-glucosamine (Figure 1). It is thanks to the hydroxyl groups in the C-2 position and acetylamine in the C-6 position that the chitosan has a high adsorption capacity [6,7,8].
The degree of deacetylation is an important factor that affects the physico-chemical properties [9]. The degree of deacetylation giving the chitosan is between 56% and 99% [10]. However, chitosan only solubilizes above 85% [11].
The aim of this work is the preparation, characterization of chitosan at different degree of deacetylation, the study of the influence of the degree of deacetylation on chitosan and its capacity for adsorption of fluoride ions.
2. Experimental
Materials and Methods
Shrimp shells were collected from El Jadida, Morocco. Sodium hydroxide (NaOH), hydrochloric acid (HCl), acetic acid (CH3COOH), 1,2-Cyclohexylenedinitrilotetraacetic acid (CDTA) and fluoride of sodium (NaF) were purchased from Sigma-Aldrich. Fluoride analysis has been carried out by the combined fluoride selective electrode method NF T 90-004 (type ISE 67B). TISAB III (Total Ionic Strength Adjustment Buffer) solution was used as a buffer for maintaining the pH and background ion concentrations [12,13].
Preparation of Chitosan
The isolation of chitosan from shrimp shells is carried out by following the three conventional steps: demineralization, deproteinization and deacetylation.
Before the demineralization step and in order to remove the water-soluble impurities, the shrimp shells are initially washed extensively with tap water and then dried overnight in an air oven at 50 °C. This waste is then ground and then washed several times with distilled water until neutral pH is reached. After filtration, they are dried by returning to the oven at 50 °C.
The demineralization is done at ambient temperature using a solution of HCl (1N) (w/v 1:15). The mixture is dried under vigorous stirring for 5 h. The product obtained is washed with distilled water to a neutral pH and then dried for 24 hours at 50 °C.
Deproteinization is carried out at 90 °C with a solution of NaOH (5%) (w/v 1:20) under reflux and with stirring for 10 hours. The chitin produced is separated by filtration and then washed with distilled water until neutral pH, after which the sample is dried at 60 °C for 24 hours.
The deacetylation step is realized by heating at 90 °C under reflux [14] in the presence of sodium hydroxide (50%) (w/v 1:30) with stirring for a time varying from 2 to 10 hours. The resulting chitosan is filtered, washed neutral with demineralized water and dried at 60 °C.
Degree of Deacetylation (DD)
We chose the conductometric method to determine the DD of the chitosan samples, because according to Yu and al. [15] and DeAlvarenga and al. [16] conductometric assay is considered a reliable method for determining DD. It is also a simple and inexpensive method compared to other methods of analysis.
This analysis was carried out by solubilizing 150 mg of the sample in 10 mL of 0.1 N HCl, supplementing with distilled water to have a volume of 200 mL. The titration was carried out with a solution of 0.1 N NaOH.
X-Ray Diffraction
X-ray diffraction analysis (Diffractometer bruker D8 advanced). Copper Kα radiation (λ=1.5406), producted at 50 KV and 20 mA, was used as the X-ray source.
FTIR Analysis
Infrared spectra were measured by KBr, the frequency range 4000 – 500 cm−1 at resolution of 4 cm−1 using ALPHA FT-IR spectrometer.
Defluoridation Experiments
A 100 mg/L fluoride stock solution was prepared using anhydrous sodium fluoride (NaF). The concentrations of the fluoride solutions to be assayed were obtained by appropriate dilution of the stock solution.
The defluoridation experiments were carried out in polyethylene beakers with stirring at 600 rpm. The determination of the fluorine concentration in the filtrates was done by a selective fluorinated combined electrode (ISE 67B type). The removal percentage of fluoride ions %R and the adsorption capacity qe were calculated using the following equations (1) and (2):
Where Ci (mg/L) is the initial concentration of the fluoride solution, Ce (mg/L) is the equilibrium concentration of the fluoride solution, W (g) is the weight of the adsorbent and V(L) is the volume of the fluoride ion solution.
3. Results and Discussion
Determination the Degrees of Deacetylation (DD) of Chitosan Samples Prepared by Conductometric Titration:
The degree of deacetylation (DD) was calculated by the formula (3):
Where N represents the normality of the solution of NaOH (N), (V2-V1) is the difference volume of NaOH, Figure 2 corresponds to the number of mole of HCl required to protonate the amine groups of the chitosan by transforming the (-NH2) groups into (-NH3+) [16], m the mass of the chitosan sample (g), 203 (g/mol) is the molecular weight of the acetylated monomer and 42 (g/mol) is the difference between the molecular weight of the acetylated monomer and the molecular weight of the deacetylated monomer [15].
Infrared spectrometry
Figure 3 shows the chitosan has characteristic bands at 3364cm-1 and 3284 cm-1 which are attributed to the elongation vibration of the –NH2 function and –OH stretching vibration, The band of chitosan at 2882 cm-1 is attributed to the deformation and stretching of (CH), bands at 1618 cm-1 is attributed to the stretch of C=O(amide I) band at 1579 cm-1 assigned to group NH-C=O (amide II) [17]. These bands reflect the process of deacetylation of chitosan, band at 1420 cm-1 and 1375 cm-1 assigned to deformation (CH), band at 1323cm-1 assigned to (amide III),the bands at 1148 cm-1, 1076 cm-1 and 1031 cm-1 are assigned to the stretching (νas (COC) and νs (COC), these bands correspond to the residues of glucosamine in chitosan [18,19].
Figure 3 shows also that the band at 1644 cm-1 amide group (Amide I) intensity decreased in the chitosan when DD increased from (DD 74%) to (DD 95%) and, on the other hand, the intensity of the bands at 3364cm-1 and 3284 cm-1 (which are attributed to the elongation vibration of the –NH2 function and –OH stretching vibration) increased when DD increased, which in agreement with the deacetylation process with the removal of acetyl amide II (C = O) which is replaced by N-H of amide I [20,21].
X-ray Diffraction
Figure 4 shows the XRD chitosan pattern at different degrees of desacetylation (DDA). Three characteristic peaks of chitosan at 2θ to 10.14, 19.60 and 21.88 are observed. The presence of these three peaks was also reported by Trung et al. [22]. They correspond to a polymorph of chitosan, mentioned in the literature under the name of polymorphous hydrate (tendon) [23,24].
Figure 4 shows that the peak intensity increases as the DD increases thus the peak at 10 of the lower DD (74%) were lower than those of high DD (86-90-95%)) [24], indicating that the low values of the degree of deacetylation correspond to a low level of crystallinity. the diffraction peaks at 2θ = 10 and 2θ = 20 are attributed respectively to the crystalline forms I and II of the chitosan [25,26].
Effect of contact time
The study of the effect of contact time on the fluorine adsorption kinetics on different supports was carried out by varying the contact time from 1 to 120 minutes with a concentrated solution of fluoride ions (10 mg/L), at a fixed pH of 6.80 and at a 20 °C. Figure 5 shows the percentage removal of fluoride reached its maximum after the first ten minutes and remains constant for the remainder of the experimental period for all carriers. This suggests that adsorption of fluoride ions takes place rapidly at all active sites.
Effect of adsorbent dose
The study of the effect of the absorbent dose on the adsorption of fluoride ions was carried out on the various supports at doses of the adsorbent ranging from 1 to 6 g and an initial fluorine content of 10 mg/L. Figure 6 shows the evolution of the rate of adsorption of fluorine. From these results, we can see that the percentage of adsorption fluoride varies with the adsorbents to reach its maximum at 4 g. Beyond this, the residual fluorine content remains constant, whatever the absorbent.
Effect of initial fluoride concentrations
The study of the effect of the initial fluoride ion concentration on the fluoride removal rate was carried out in a concentration range of 2 to 14 mg/L. The experimental conditions in this study were maintained at a contact time of 8 min, an absorbing dose of 4 g/L at 20 °C and a neutral pH. Figure 7 shows that the amount of fluorine adsorbed on the chitosan remains constant between 2 and 10 mg/L and above these concentrations, the fluoride removal percentage decreases. This could be attributed, in the case of a highly concentrated fluoride ion solution, to the insufficient number of active sites which are available on the supports. These results are in agreement with those found on the adsorption of dyes on chitosan [27].
Effect of solution pH
The effect of the pH of the solution on the defluoridation was studied by adjusting the pH with 1 mol/L NaOH or 1 mol/L HCl using a pH meter (EUTECH pH 700). The fluoride adsorption was carried out in a pH range of 3 to 10 and with a fluoride concentration of 10 mg/L. Figure 8 shows that the maximum adsorption of fluoride ions is observed at pH=6.80 for all the adsorbents which best adsorbent is chitosan (95%) with an elimination rate greater than 60%. However, at acid and basic pH solution, an increase and decrease in adsorption was observed respectively for all adsorbents. The decrease may be explained in alkaline pH range by the competition between the anions fluoride and OH-. While in the acidic pH range the decrease of removal may be attributed to the formation of hydrofluoric acid whose presence lowers the removal [28].
Effect of temperature
The effect of the temperature on the fluorine adsorption was carried out in a temperature range of 20 °C to 60 °C. Figure 9 show that the variation of the temperature has no significant effect on the rate of removal of fluoride ions for the various supports. This may assume that the bond formed between the fluoride ions and the various supports is not impaired by the rise in temperature.
Effect of agitation
Figure 10 shows that the percentage removal of fluoride ions increases with increasing the agitation rate of the solution until an optimum value of 600 rpm for all supports. This can be reflected in the fact that the agitation increases the mobility of the ions by promoting the interactions between the adsorbent/adsorbate which are manifested by an increase in the adsorption capacity to reach its maximum. Accordingly, for the study of the other parameters, the stirring of the solution will be maintained at 600 rpm.
Kinetics and adsorption isotherms
Adsorption isotherms
Freundlich isotherm
The expression of the Freundlich isotherm [29] is given by the following formula (4):
Where qe being the amount of fluoride adsorbed per unit weight of the sorbent (mg/g).
Ce is the equilibrium concentration of fluoride in solution (mg/L).
kF is the adsorption capacity.
1/n is the adsorption intensity.
The calculation of the Freundlich isotherm constants (1/n and KF) is done from the slope and the extrapolation of the line functions log (qe) as a function of time figure 11 (a), Table 1 summarizes the results obtained. The fact that the values of 1/n between 0 and 1 confirms that the conditions are favorable for adsorption.
Langmuir isotherm
The expression of the Langmuir [30] is given by the following formula (5):
Where qe is the amount of fluorine adsorbed per unit weight of the sorbent (mg/g).
Ce is the equilibrium concentration of the fluoride ion solution (mg/L).
Q0 is the amount adsorbed on the cover of the complete monolayer (mg/g).
b is the Langmuir coefficient related to the adsorption equilibrium constant (L/mg).
Q0 and b have been calculated from the slope and intercept of the linear plot of vs. shown in Figure 11 (b) and the results are listed in Table 1.
Adsorption kinetics
The pseudo-first order and pseudo-second order models were used to study the experimental results obtained in order to better understand the mechanism of adsorption. The Lagergren pseudo-first order model is given as follows [31]:
Where qe and qt are the amounts of fluoride ions adsorbed onto chitosan (mg/g) at equilibrium and at time respectively and k1 is the rate constant of first-order adsorption (min−1). The rate constant k1 and the correlation coefficients R2 were determined from the line of log (qe - qt) as a function of time. The first-order Lagergren equation is only applicable during the initial phase of the adsorption process [32]. Figure 12 represents the corresponding pseudo-first order lines for chitosan at different degree of deacetylation (CS 74%, CS 86%, CS 90% and CS 95%).
The expression of the pseudo-second order model is as follows [31]:
Where k2 is the second order adsorption rate constant expressed in (g/mg.min). The straight lines of t/qt as a function of time t have been used to determine the correlation coefficient R2 and the rate constant k2 by extrapolation. Figure 13 shows the pseudo-second order lines for chitosan at different degrees of deacetylation (DD). This model predicts the adsorption behavior over the entire adsorption range [33].

Table 2.
Kinetic parameters for the adsorption of fluoride ions onto chitosan at different DD on the pseudo-first and pseudo-second order equation.
Table 2.
Kinetic parameters for the adsorption of fluoride ions onto chitosan at different DD on the pseudo-first and pseudo-second order equation.
| Adsorbents | Pseudo-first order | Pseudo-second order | |||||
| qexp (mg/g) | qecal (mg/g) | k1 (min−1) | R2 | qecal (mg/g) | k2 (g.mg−1.min-1) | R2 | |
| CS 74% | 0.98 | 1.10 | 0.311 | 0.970 | 1.01 | 0.587 | 0.993 |
| CS 86% | 1.34 | 1.45 | 0.256 | 0.964 | 1.40 | 0.336 | 0.992 |
| CS 90% | 1.38 | 1.52 | 0.316 | 0.966 | 1.42 | 0.487 | 0.994 |
| CS 95% | 1.55 | 1.85 | 0.276 | 0.855 | 1.57 | 0.671 | 0.998 |
The straight lines obtained in Figure 13 for the various adsorbents show that the adsorption of the fluorine obeys the Ho and McKay model, which implies that a chemisorption mechanism is involved.
4. Conclusions
The adsorbent prepared and characterized in this work is a natural biosorbent in this case chitosan with different degrees of deacetylation (DD) (CS 74%, CS86%, CS 90% and CS 95%).The optimum conditions for adsorption were: pH solution of 6.80, mass of adsorbent of 4 g, initial fluoride concentration of 10 mg/L and stirring speed of 600 rpm.
The percentage removal of fluoride under optimal conditions reaches its maximum after the first ten minutes for all adsorbents, which implies that the adsorption of the fluoride ions occurs rapidly on all the active sites. The adsorption isotherm was adjusted by the Langmuir linear equation. The pseudo-second order model was the most appropriate to explain the adsorption kinetics.
Author Contributions
Methodology, I.S.; Software, R.E.B.; Validation, A.M.; Formal analysis, A.G.; Investigation, A.S.; Writing—original draft, R.M. All authors have read and agreed to the published version of the manuscript.
Funding
This research received no external funding.
Institutional Review Board Statement
Not applicable.
Informed Consent Statement
Not applicable.
Data Availability Statement
The original contributions presented in this study are included in the article. Further inquiries can be directed to the corresponding author.
Conflicts of Interest
The authors declare no conflict of interest.
References
- M.S.Venkata, S.V. Ramanaiah, B. Rajkumar, P.N. Sarma, J. Hazard. Mater.141 (2007) 465–474.
- S. Ayoob, A.K. Gupta, J. Hazard. Mater.152 (2008) 976–985.
- S. Annouar, M. Mountadar, A. Soufiane, A. Elmidaoui, M.A. MenkouchiSahli, M. Kahlaoui, Desalination. 168 (2004)185.
- S. Annouar, M. Mountadar, A. Soufiane, A. Elmidaoui, M.A. MenkouchiSahli, Desalination. 165 (2004) 137-138.
- M.A. Menkouchi Sahli, S. Annouar, M.Tahaikt, M. Mountadar, A. Soufiane, A. Elmidaoui, Desalination. 212 (2007) 37-45.
- C.K.S. Pillai, W. Paul, P.S. Chandra, Prog. Polym. Sci. 34 (2009) 641-678.
- W. Pasanphan, T. Rattanawongwiboon, S. Choofong, O. Güven, K.K. Katti, Radiation physic chemistry. 106 (2015) 306 -37.
- E. Guibal, a review Separation and Purification Technology. 38 (2004) 43-74.
- B. Gisela, D. Herbert, G.P. Martin, Carbohydrate Polymers. 36 (1998) 205-216.
- Q.Li.E.T. Dunn, E.W. Grandmaison, M.F. Goosen, J. Bioact. Compat. Pol. 7 (1992) 370-397.
- H.K. No, S.P.Meyers, J. Aquat. Food. Prod. Tech.4-2 (1995) 27-52.
- N. Viswanathan, S. Meenakshi, J. Hazard. Mater.178 (2010) 226-232.
- Y. Vijaya, A. Krishnaiah, E- J. Chem. 6 (2009)7 13-724.
- M. Kaya, T. Baran, Int. J. Biol. Macromol. 75 (2015) 7-12.
- G. Yu, F.G. Morin, G.A.R.N. Nobes, R.H. Marchessault, Macromolecules. 32 (1999) 518-520.
- E.S. DeAlvarenga, C.P. De Oliveira, C.R. Bellato, Carbohydrate Polymers. 80 (2010) 1155-1160.
- S. Vaezifar, M.A. Golozar, M. Morshed, S. Razavi, S. Karbasi,M. Kamali, J. Clust. Sci. 24 (2013) 891-903.
- P. Bernabe, C. Peniche, W.A. Monal, Polymer Bulletin. 55 (2005) 367-375.
- C. Zhang, Q. Ping, H. Zhang, J. Shen, European Polymer Journal. 39 (2003) 1629-1634.
- A.T. Paulino, J.I. Simionato, J.C. Garcia, J. Nozaki, Carbohydr. Polym.64 (2006) 98-103.
- W. Pasanphan, G.R. Buettner, S. Chirachanchai, Appl. polym. Sci. 109 (2008) 38-46.
- T. S. Trung, W.W. Thein-Han, N.T. Qui, Chuen-How. Ng, W.F. Stevens, Bioresource Technology. 97 (2006) 659-663.
- E. Belamine, A. Domard, M.M.G. Guille, EuropeanPolymer Journal. 39 (2003) 1629-1634.
- DT. Thien, NT. An, NT. Hoa, Chem. Sci. J. 6 (2015) 1-8.
- W. Zhang, J. Zhang, Q. Jiang, W. Xia, Carbohydrate Polymer. 87 (2012) 309-313.
- R. J. Samuels, J. J. Polym. Sci:Polym. Phys. Ed.19 (1981) 1081-1105.
- G. Crini, P.M. Badot, E. Guibal, Presses universitaires de Franche Comté. 136 (2009) 1390-1398.
- S. Jagtap, D. Thakre, S. Wanjari, S. Kamble, N. Labhsetwar, S. Rayalu, Journal of Colloid and Interface Science. 332 (2009) 280-290.
- H.M.F. Freundlich, Z. Phys. Chem. 57A (1906) 385-470.
- Langmuir, J. Am. Chem. Soc.38 (1916) 2221-2295.
- Y.S. Ho, G. Mckay, Trans. Inst. Chem. Eng.76 (1998) 332.
- Y.S. Ho, G. Mckay, Water. Res. 33 (1999) 578-584.
- M.S. Chiou, H.Y. Li, Chemosphere. 50 (2003) 1095-1105.
Figure 1.
Structure of N-acetyl-D-glucosamine(a) and D-glucosamine (deacetylated unit) (b).

Figure 2.
Conductometric titration of chitosan samples.

Figure 3.
FT-IR spectra of chitosan at different degree of deacetylation (DD).

Figure 4.
XRD of chitosan at different degrees of deacetylation, (a) CS 74%, (b) CS 86%, (c) CS 90%, (d) CS 95% .
Figure 4.
XRD of chitosan at different degrees of deacetylation, (a) CS 74%, (b) CS 86%, (c) CS 90%, (d) CS 95% .
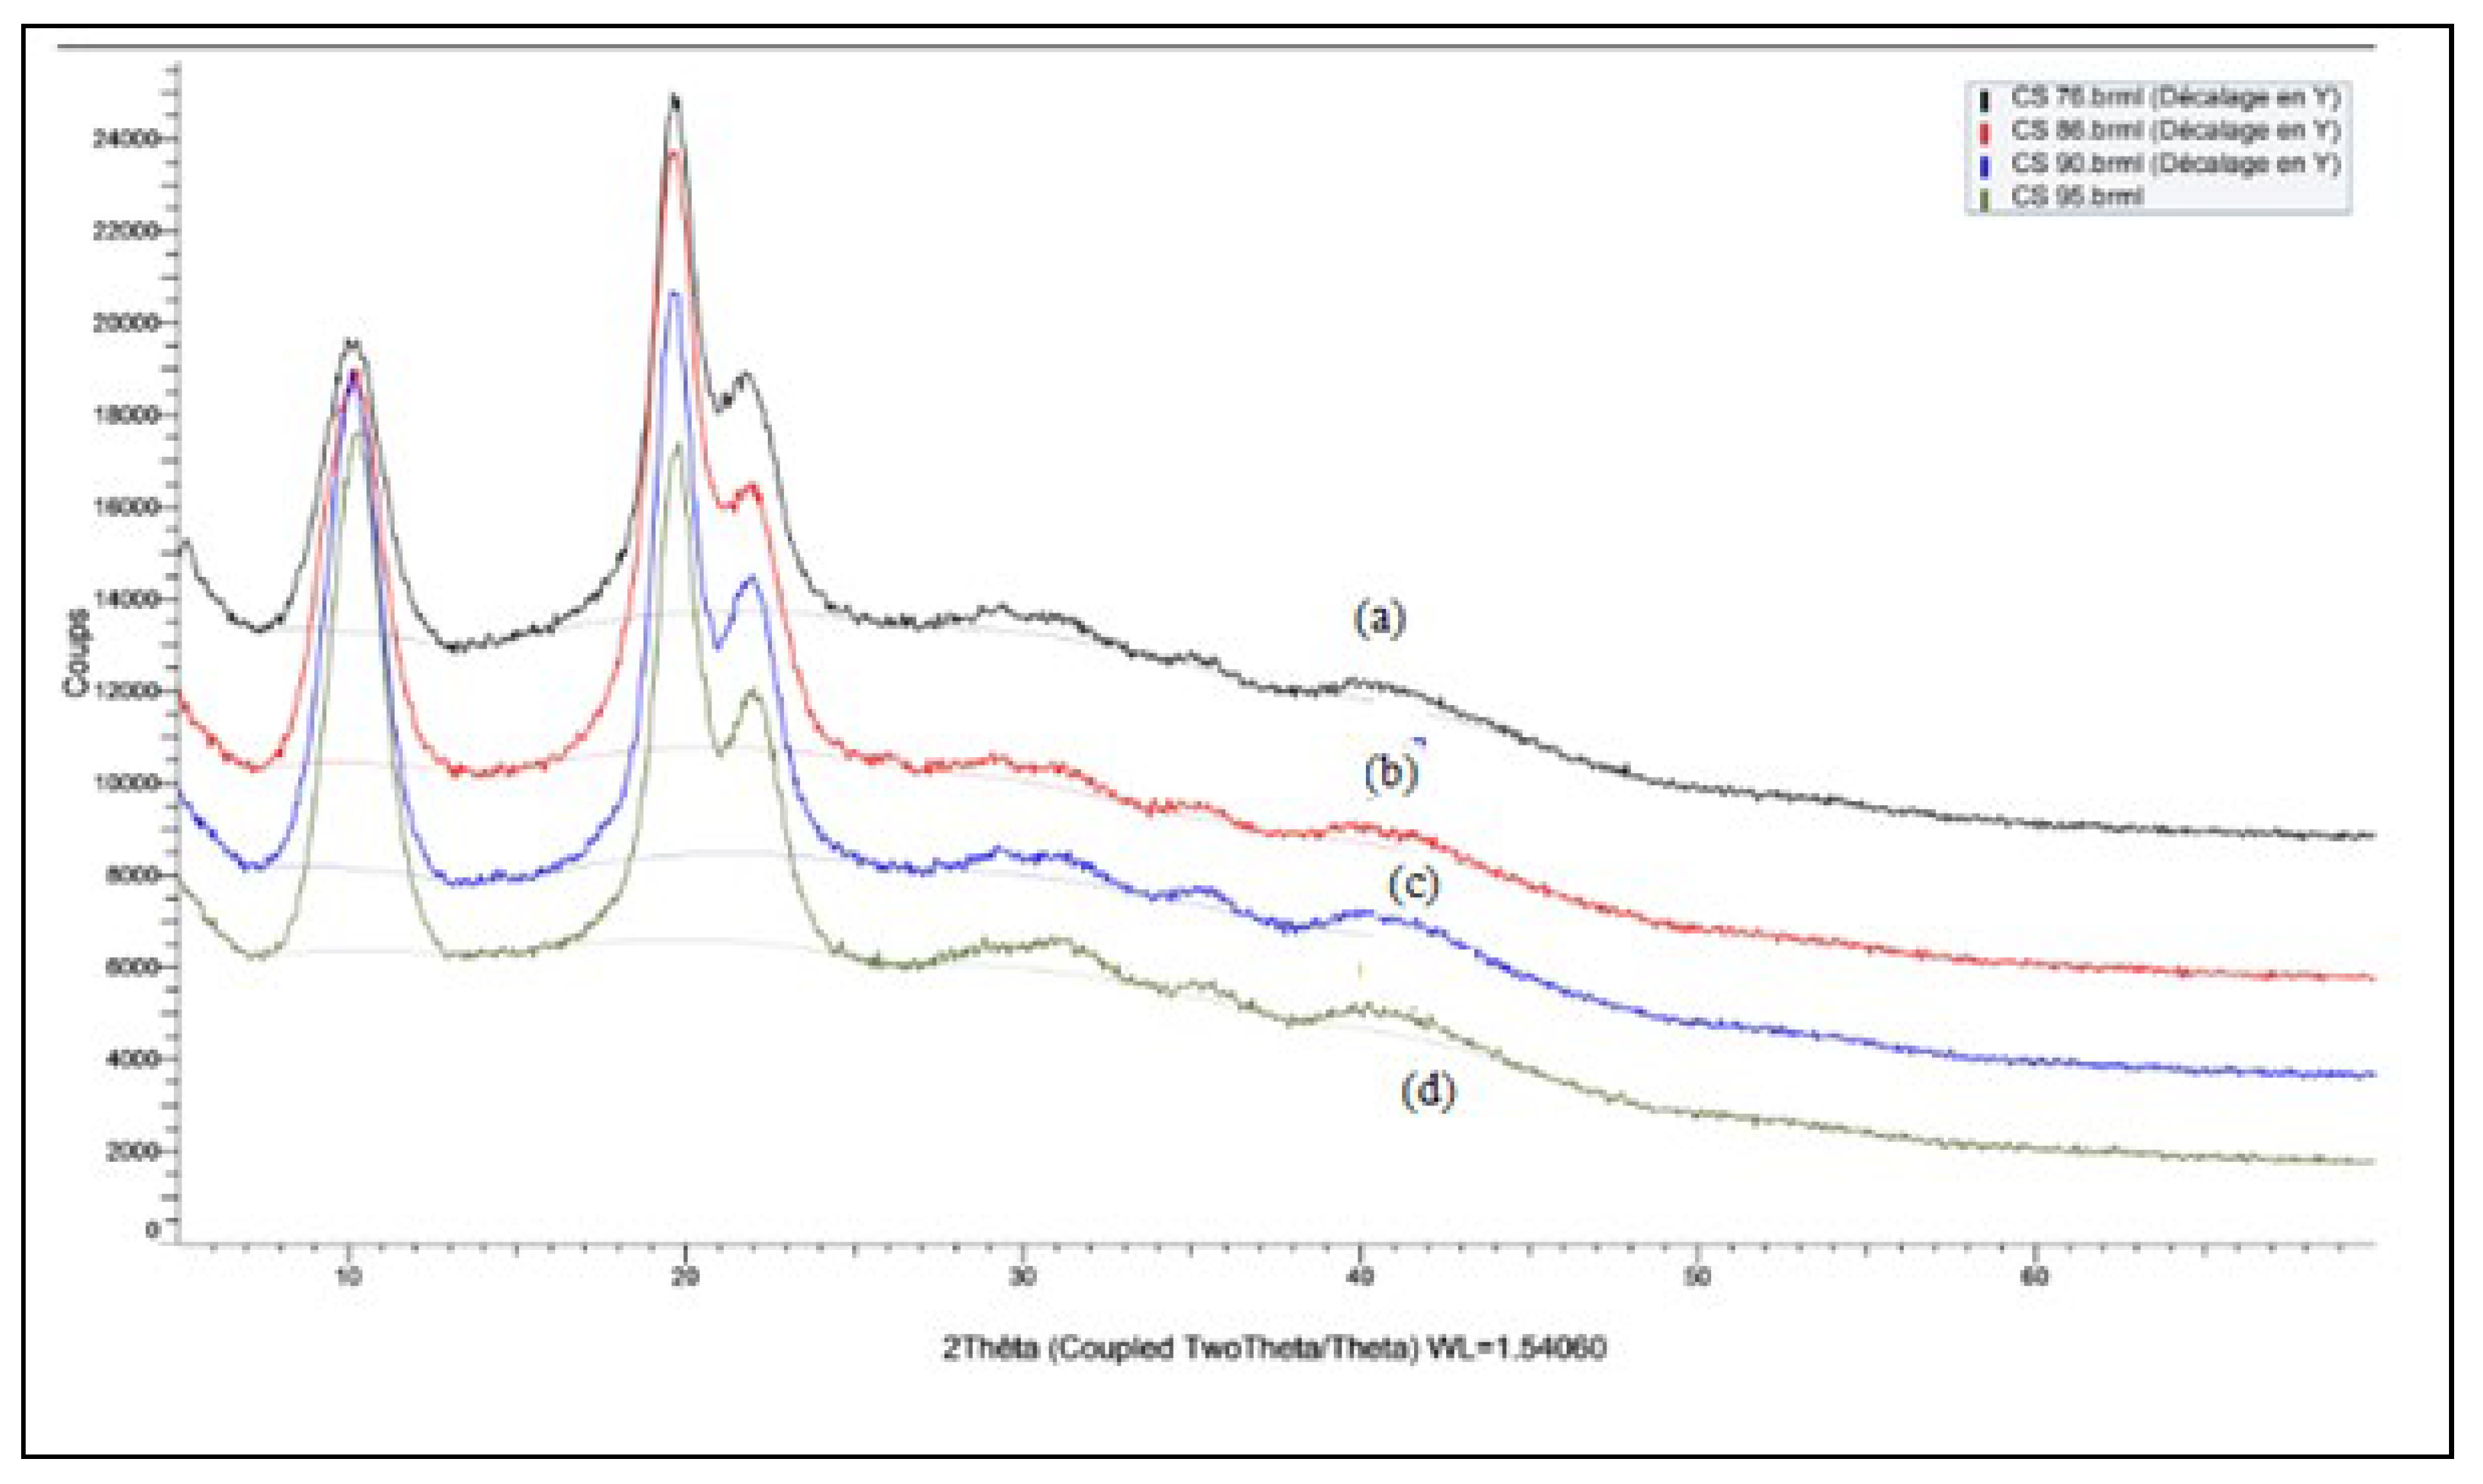
Figure 5.
Effect of contact time on fluoride removal by chitosan at different DD.
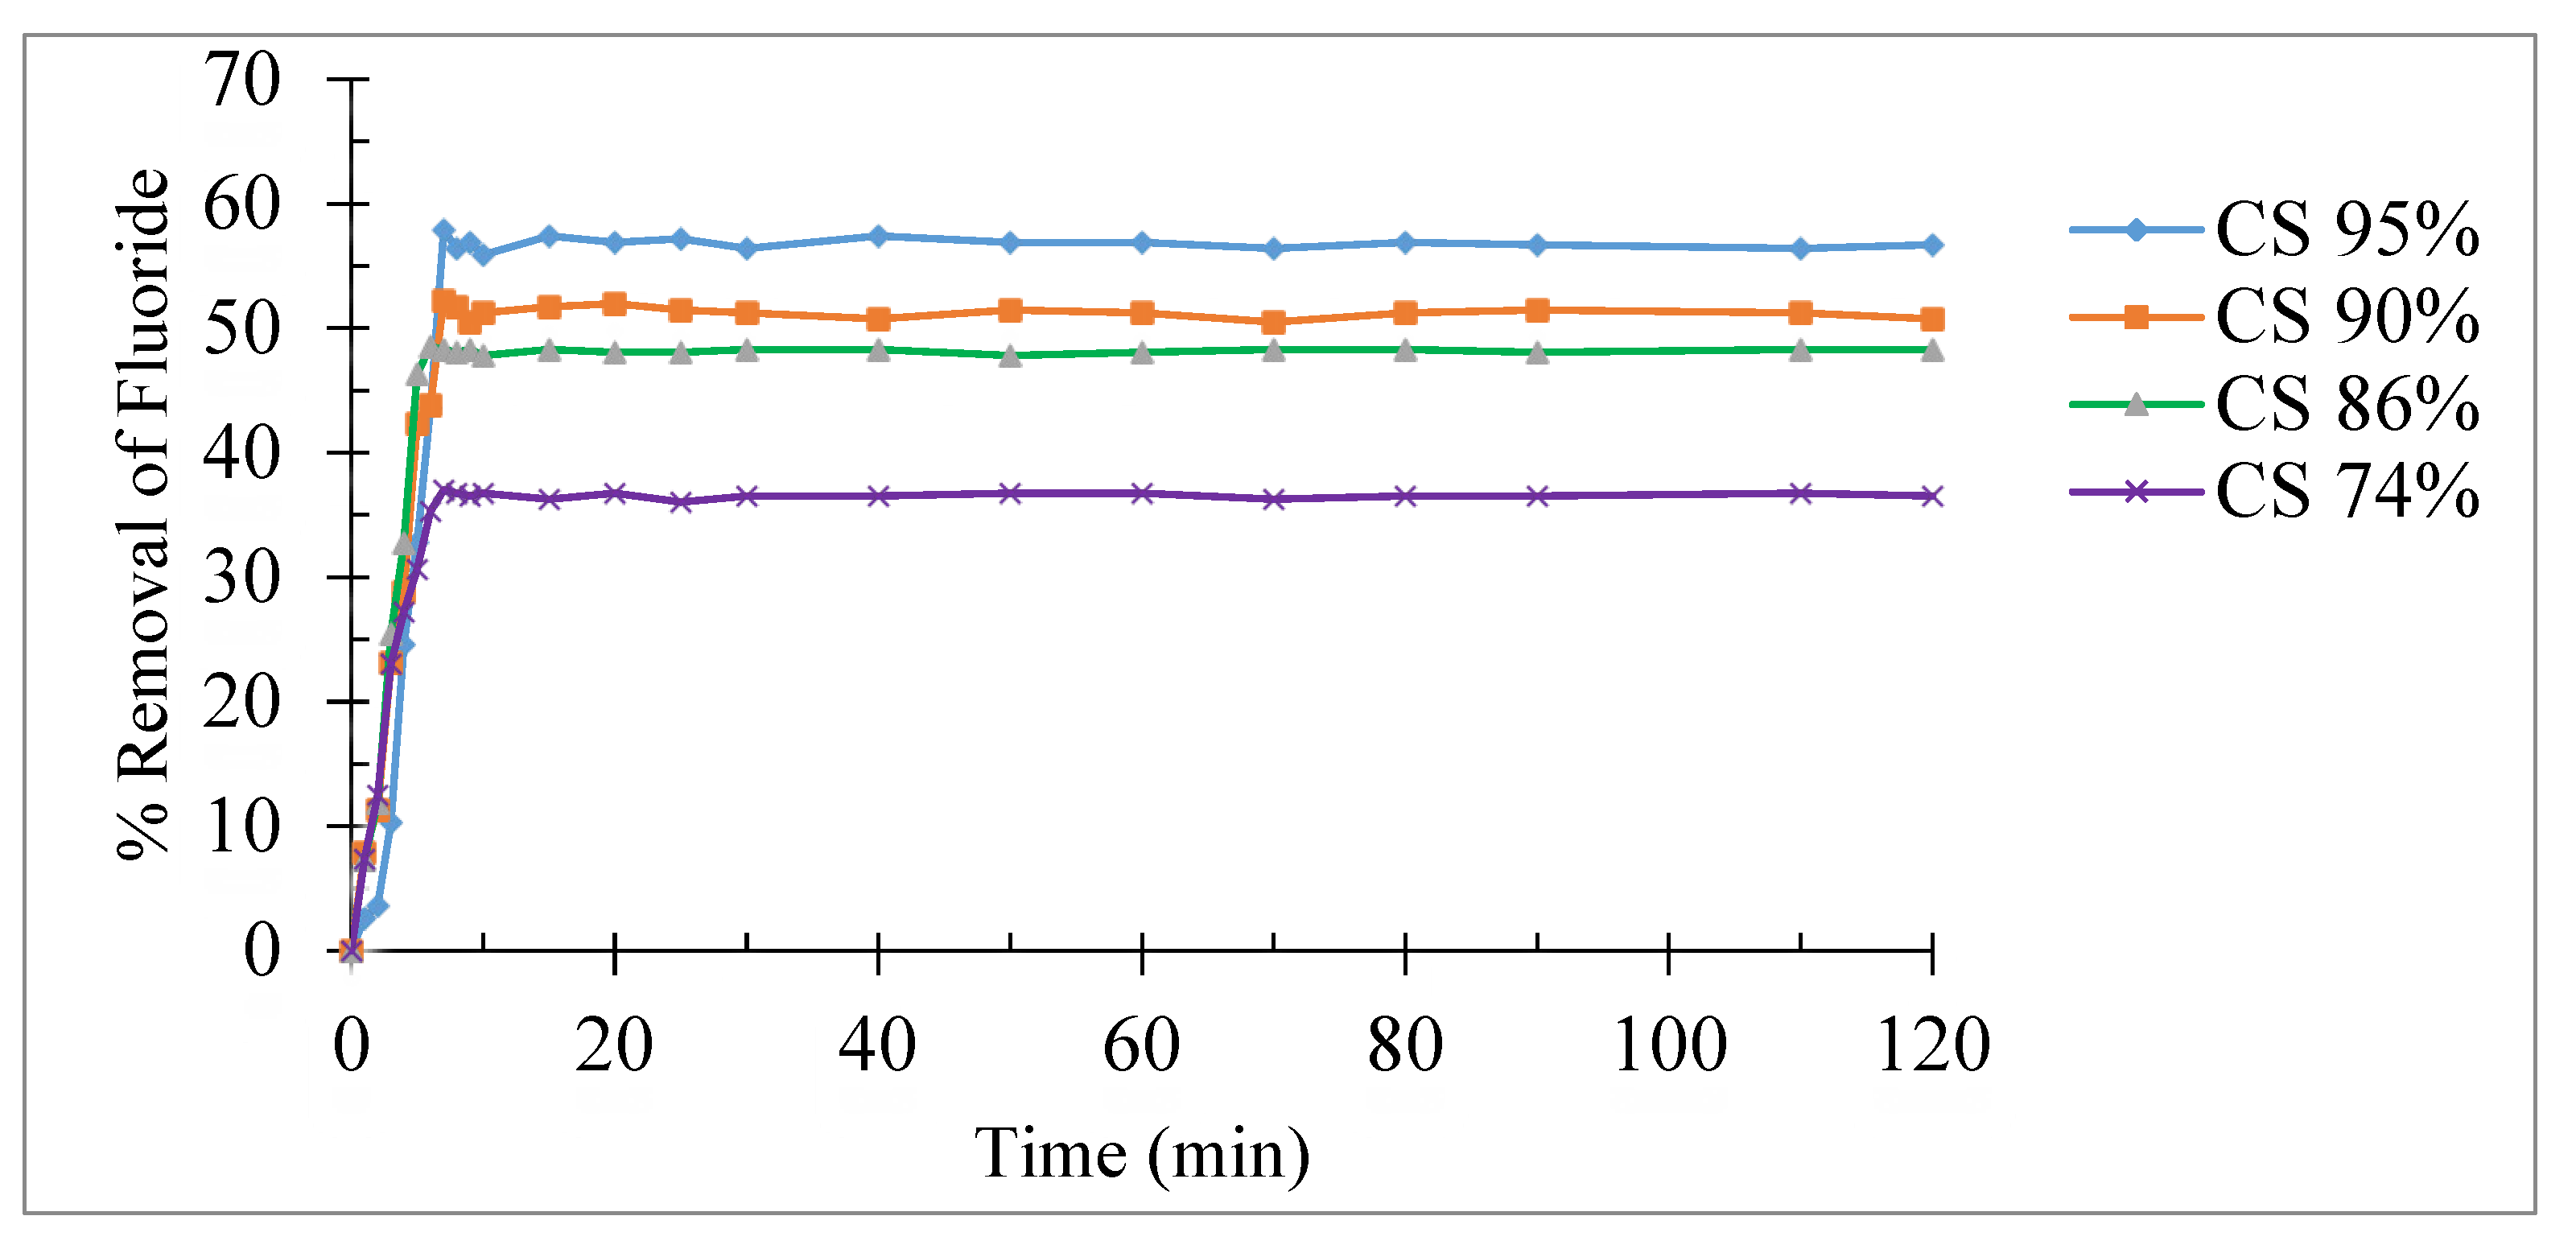
Figure 6.
Effect of adsorbent dose on fluoride removal by chitosan the different DD.
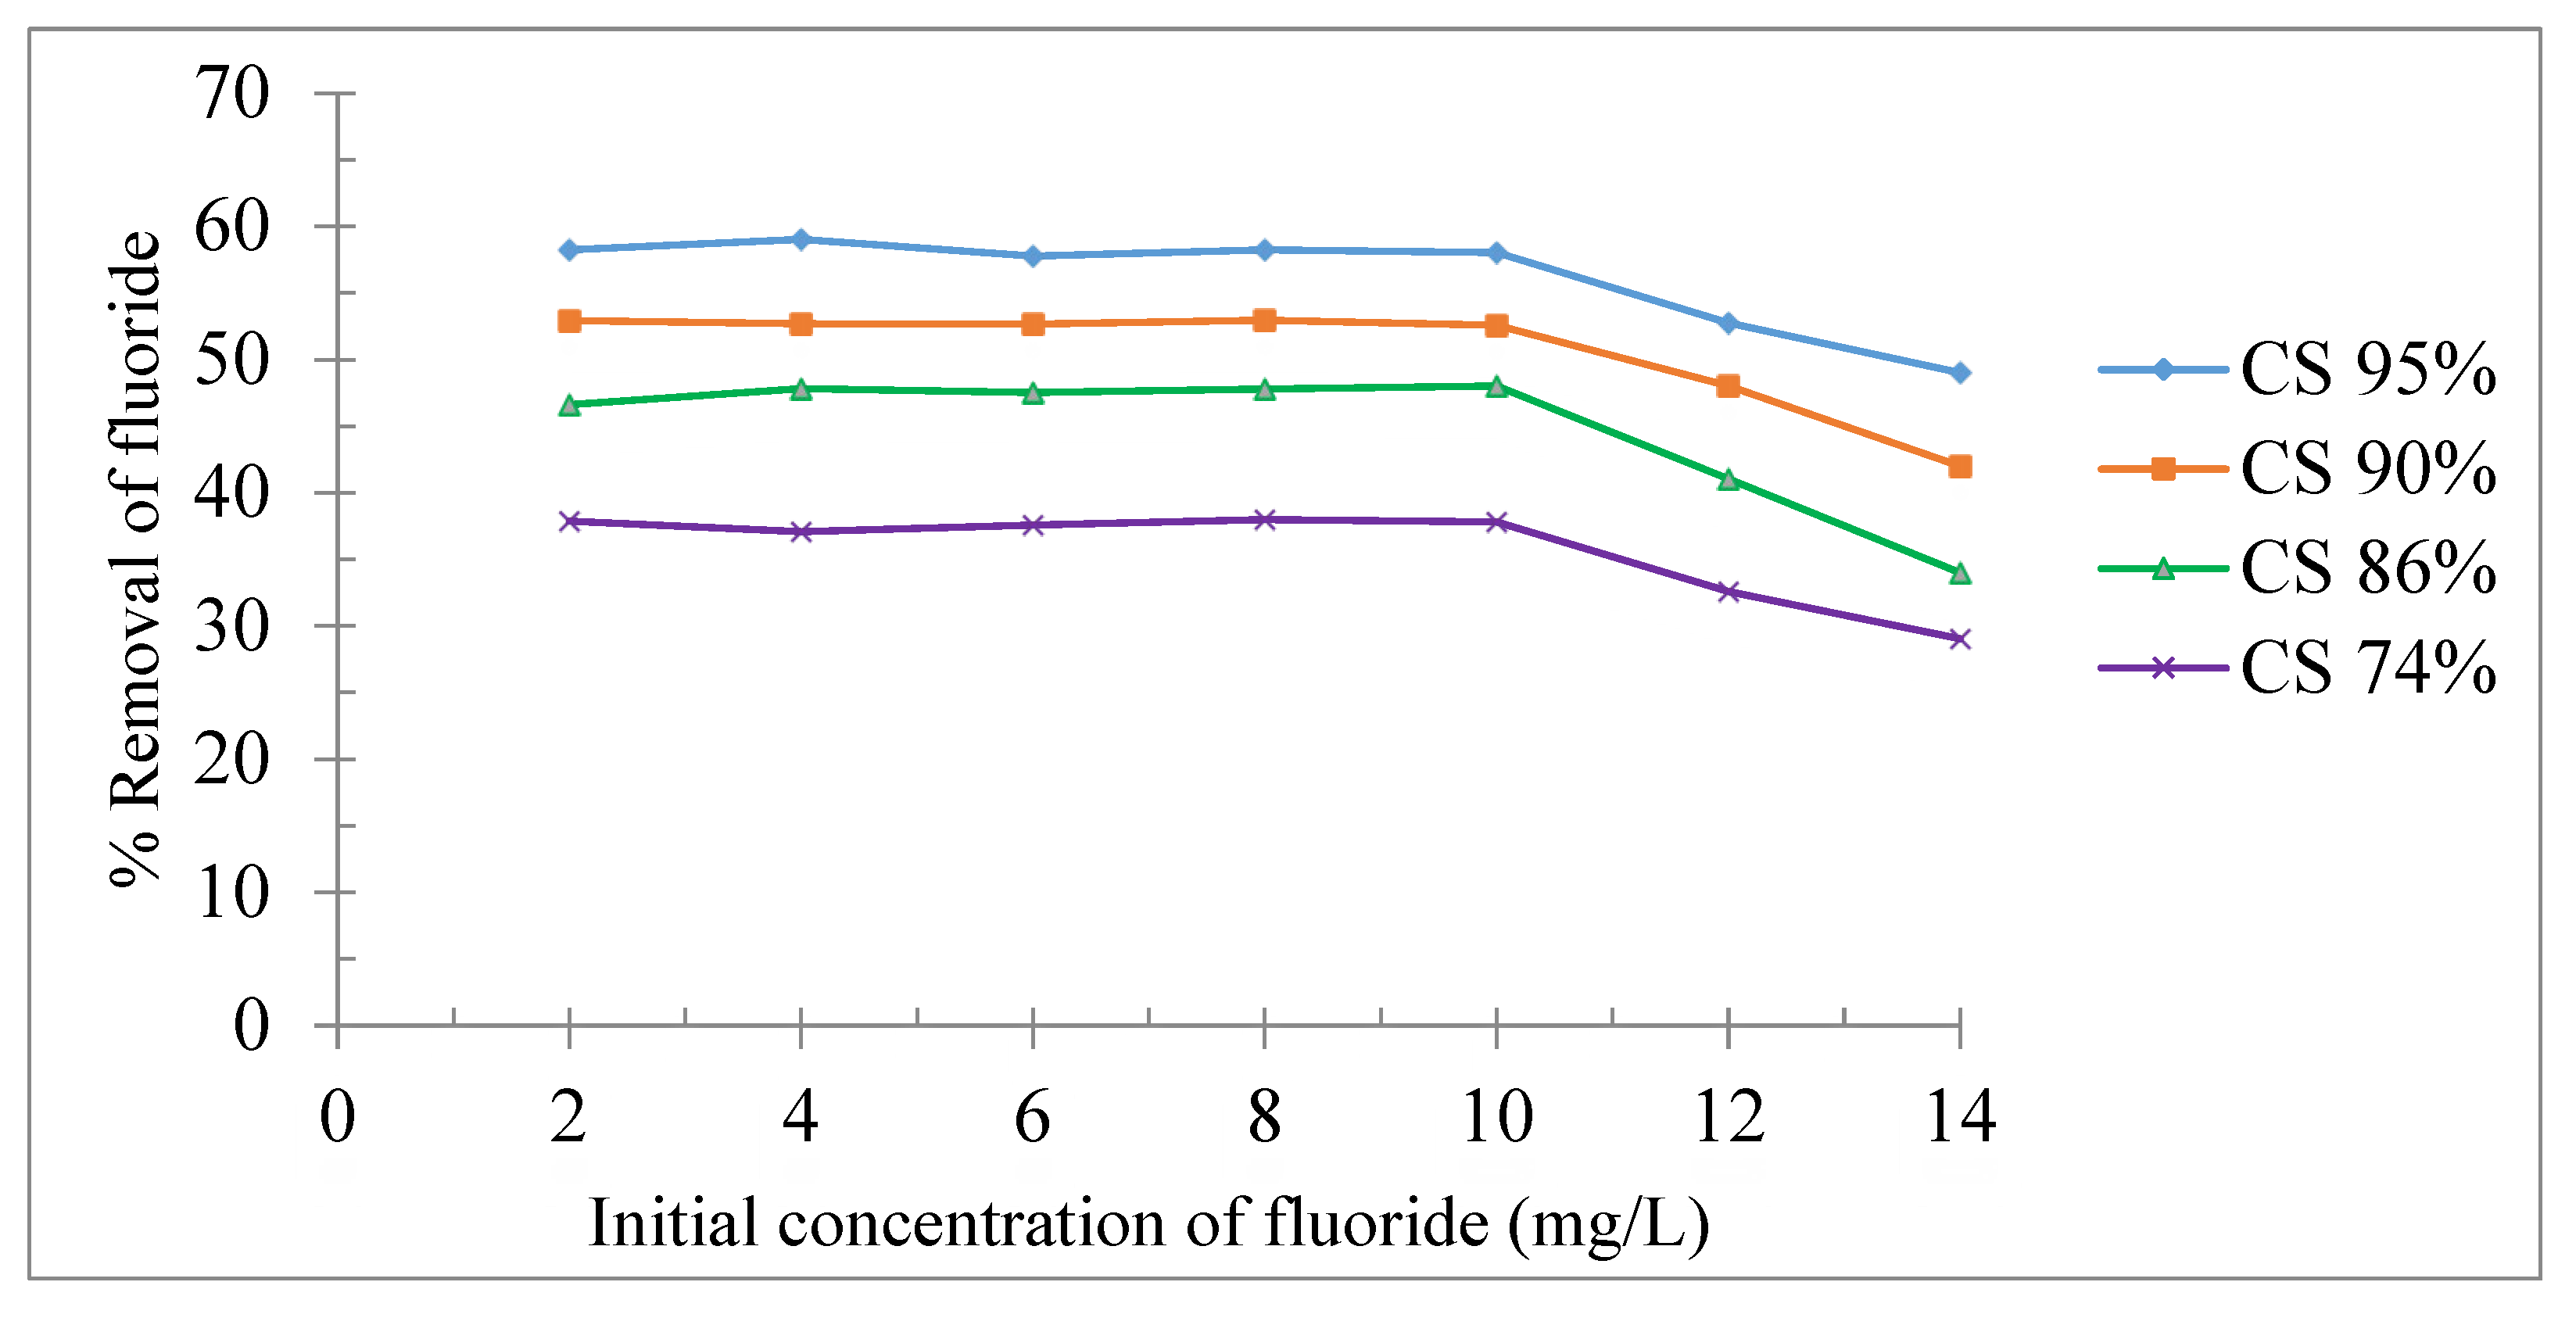
Figure 7.
Effect of initial fluoride concentrations.

Figure 8.
Effect of pH with the initial fluoride concentration of 10 mg/L.
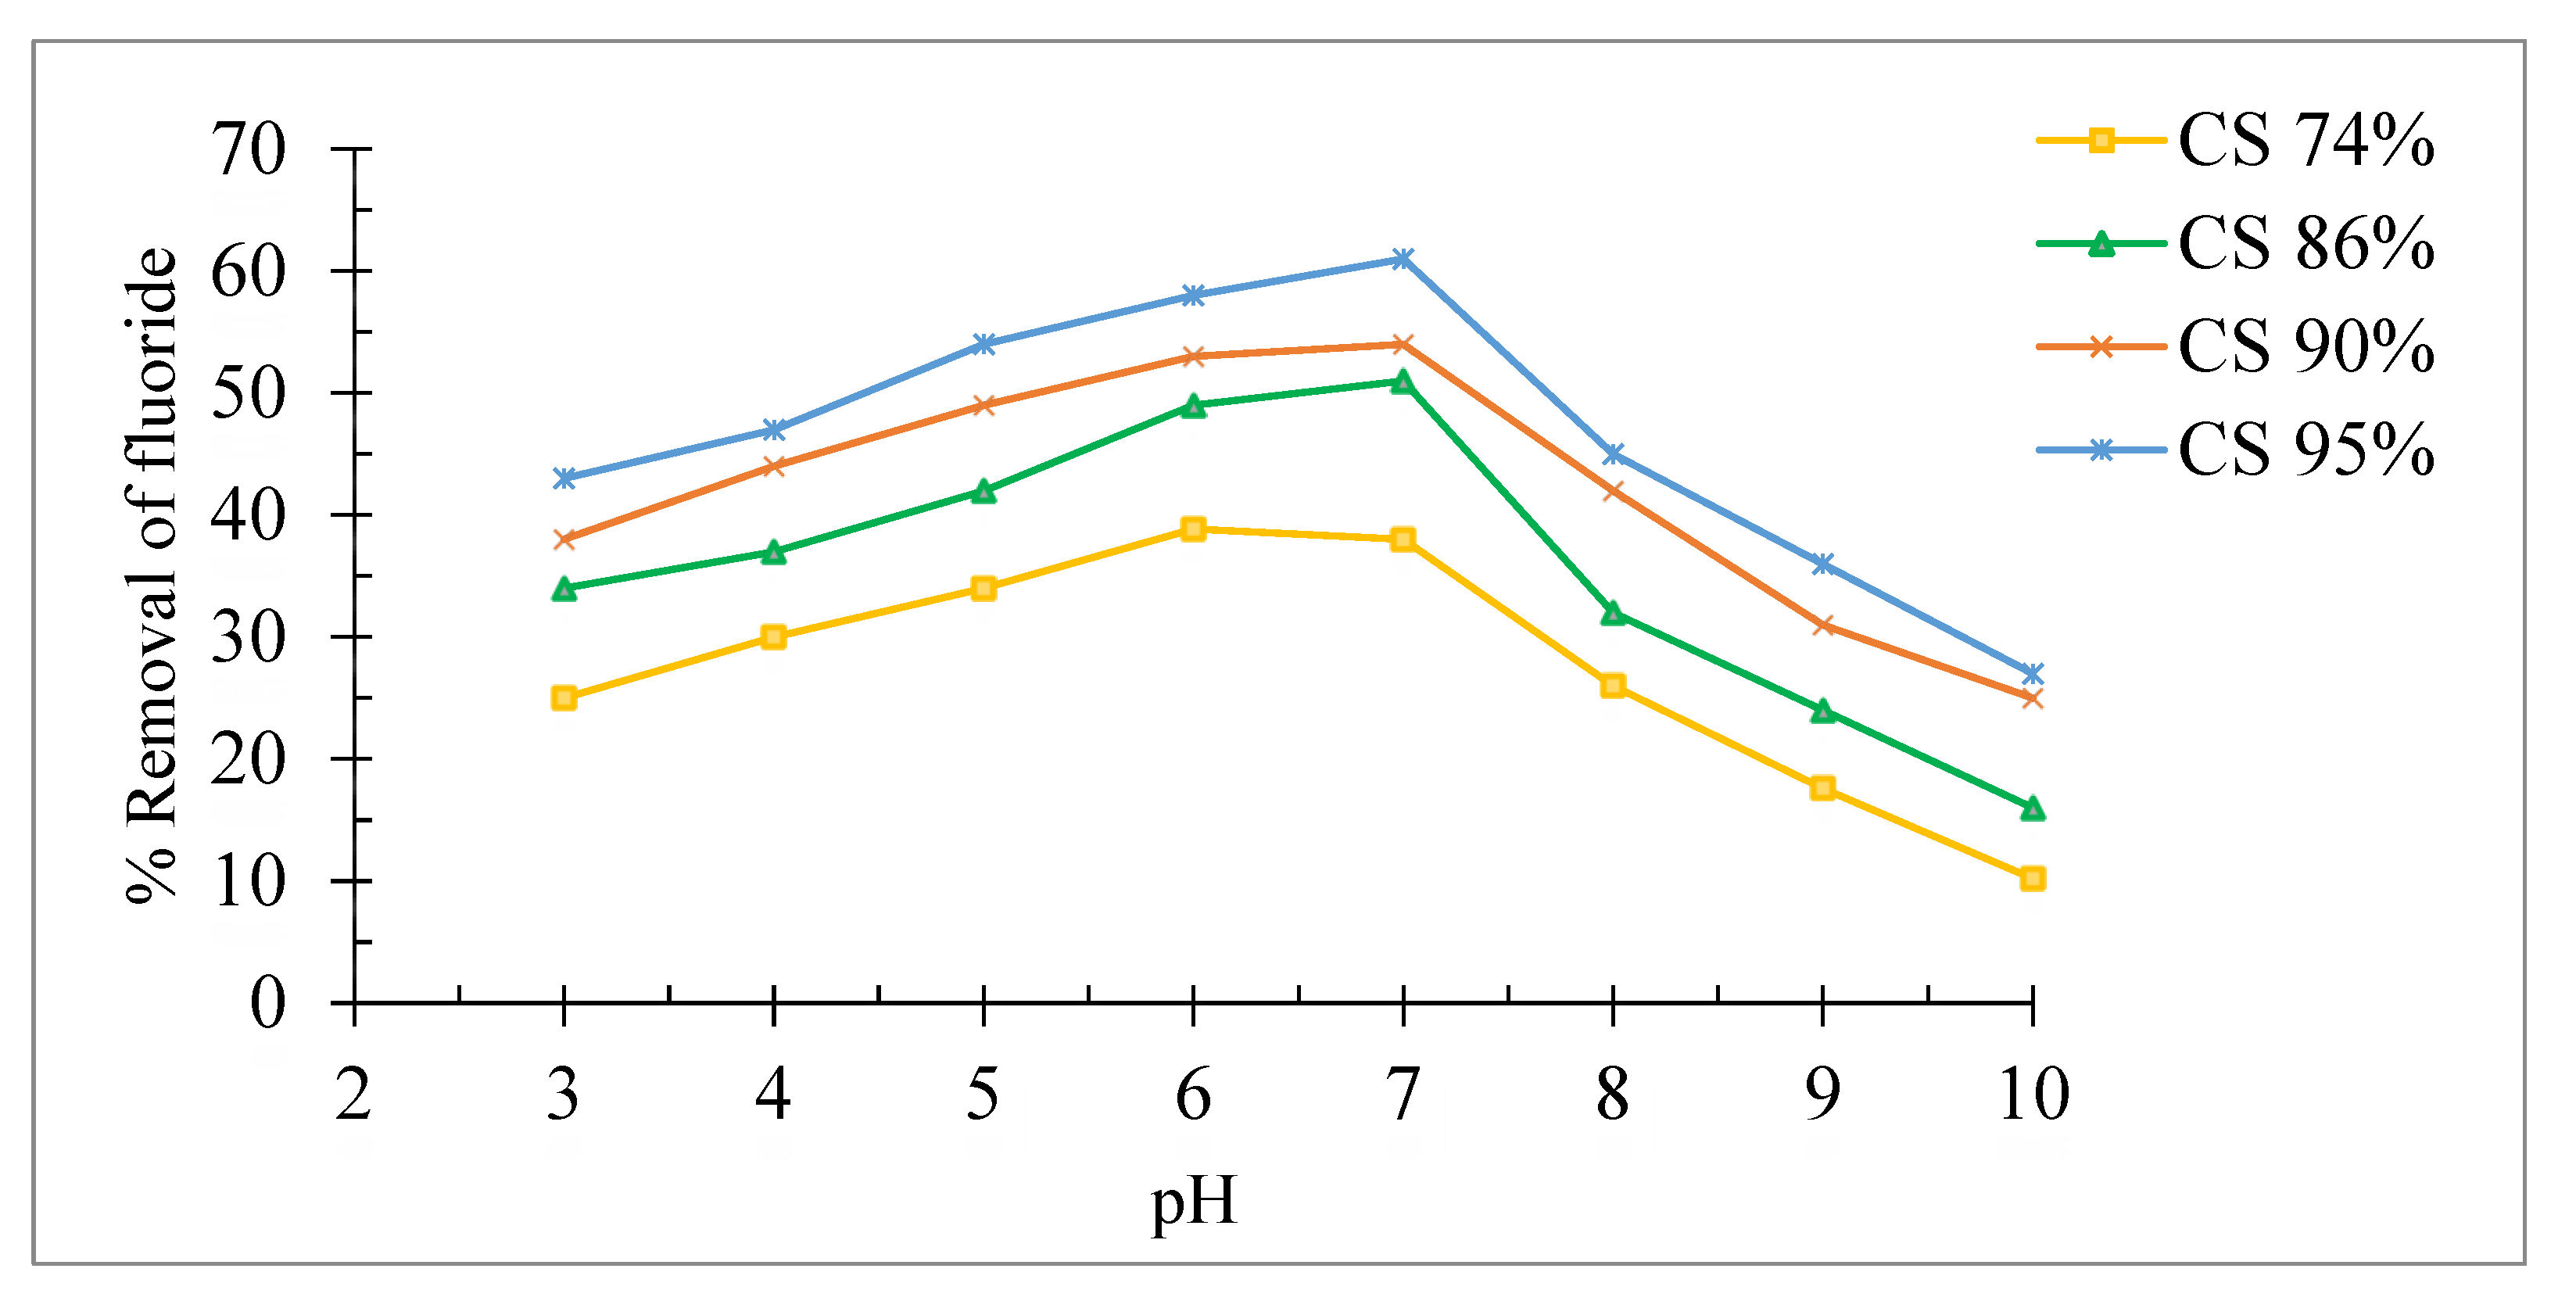
Figure 9.
Effect of temperature of the removal fluoride with 10 mg/L of initial fluoride concentration (m = 4g, pH=6.80 and V = 600 rpm).
Figure 9.
Effect of temperature of the removal fluoride with 10 mg/L of initial fluoride concentration (m = 4g, pH=6.80 and V = 600 rpm).
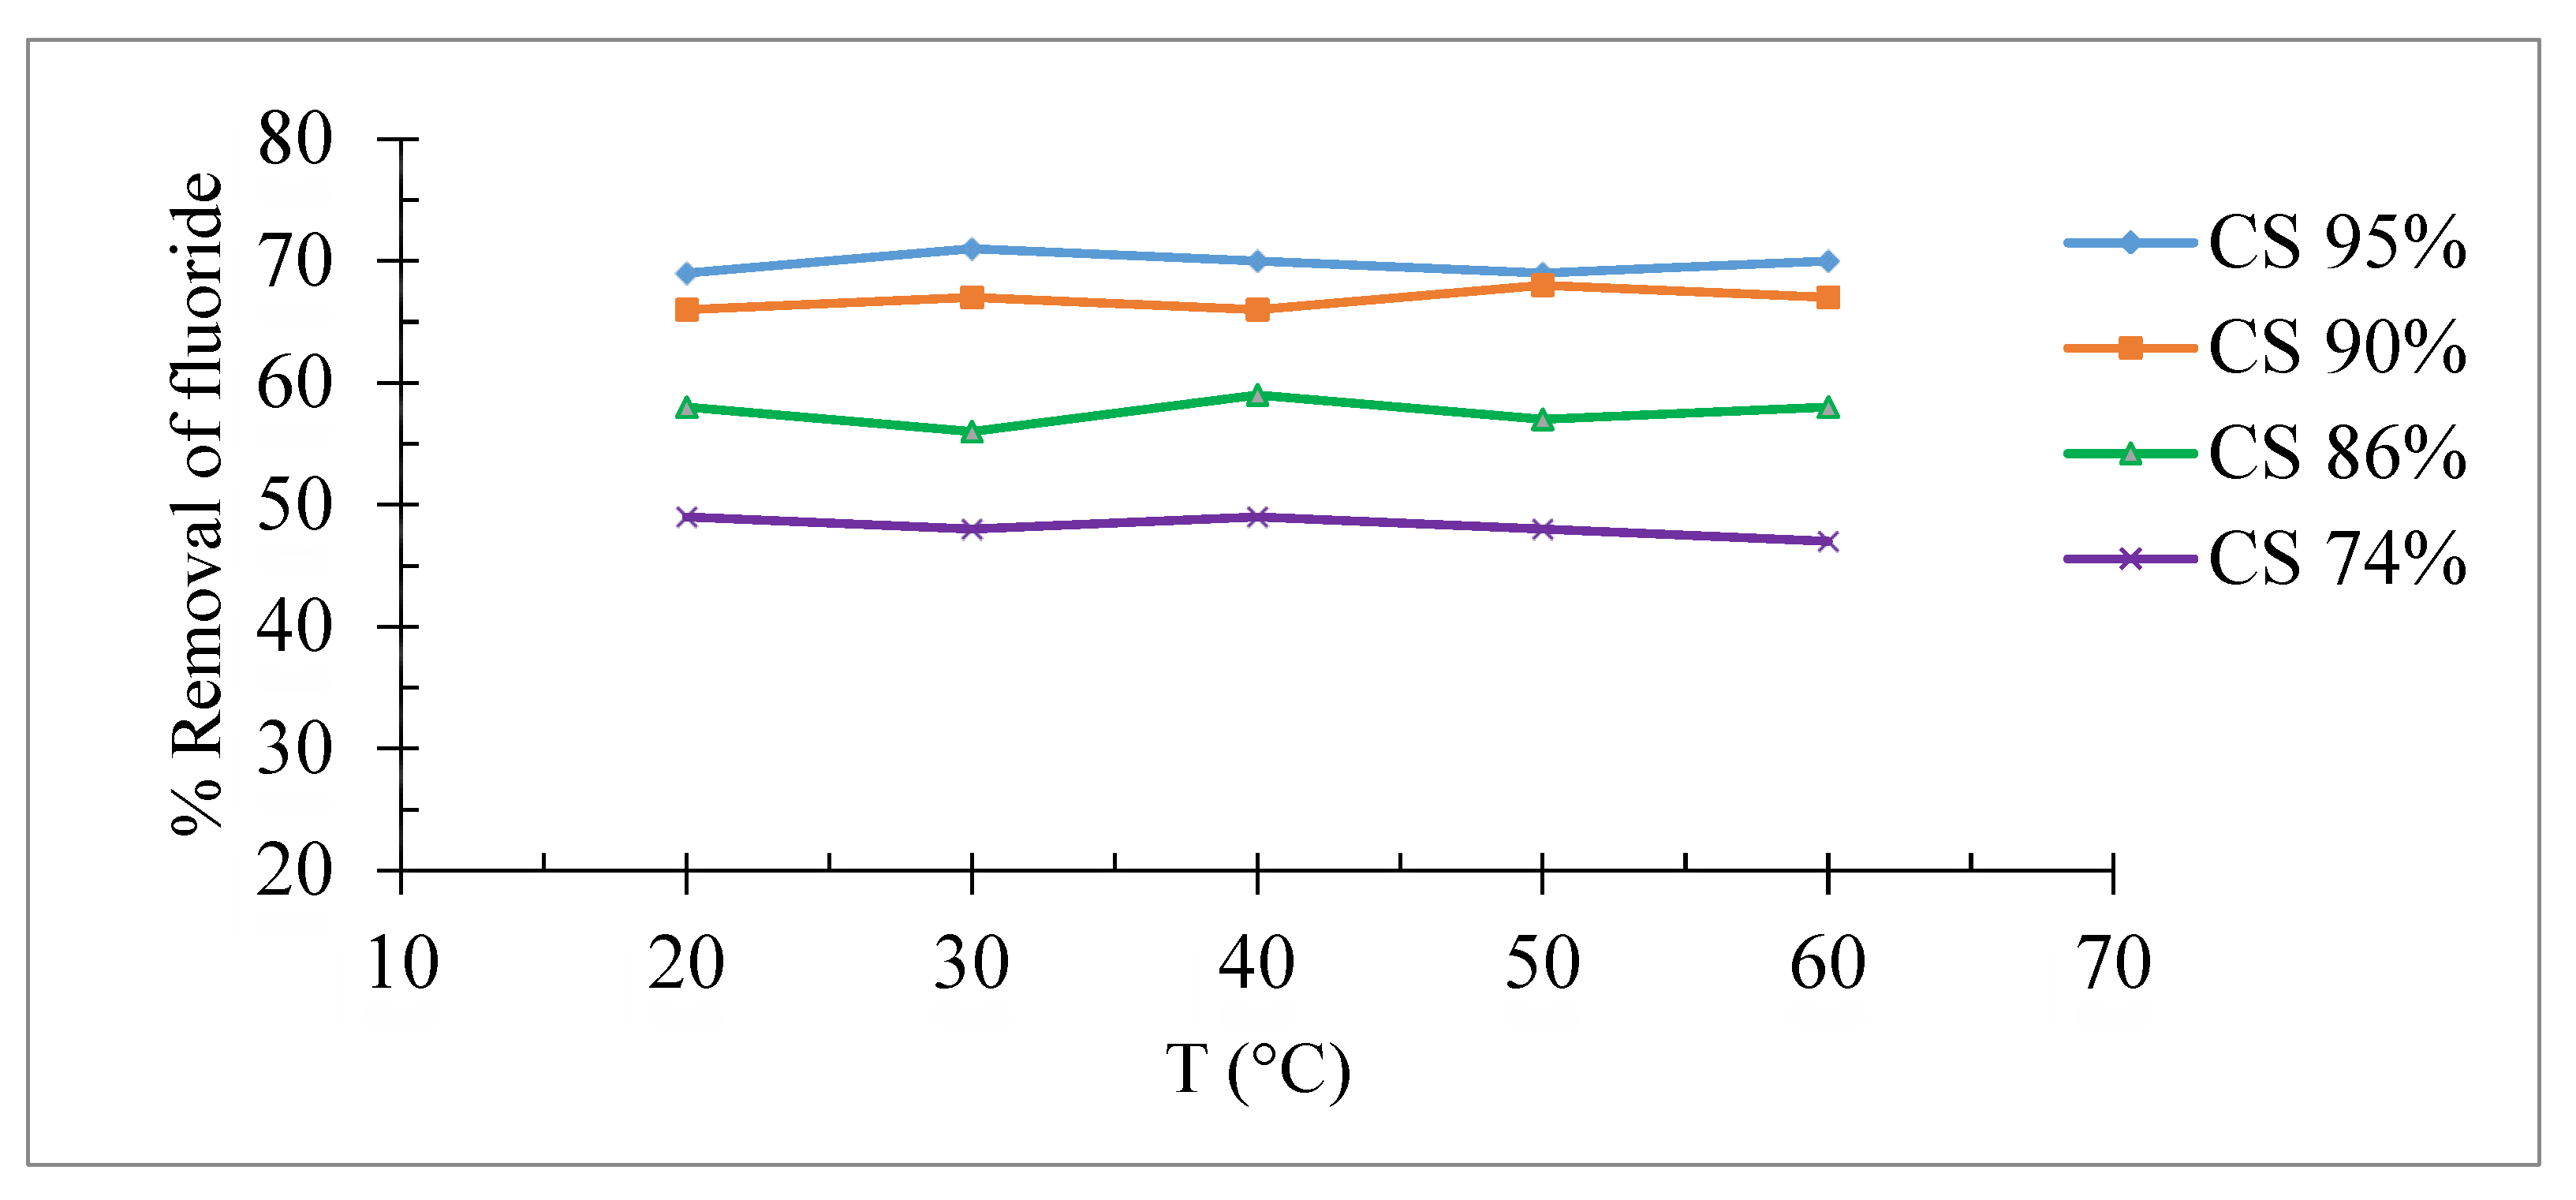
Figure 10.
Effect of agitation (C0 = 10 mg/L, m = 4g, pH = 6.80 and T = 24°C).

Figure 11.
Comparison of Freundlich (a) and Langmuir (b) isotherm plots for fluoride adsorption on chitosan at different degrees of deacetylation (DD).
Figure 11.
Comparison of Freundlich (a) and Langmuir (b) isotherm plots for fluoride adsorption on chitosan at different degrees of deacetylation (DD).
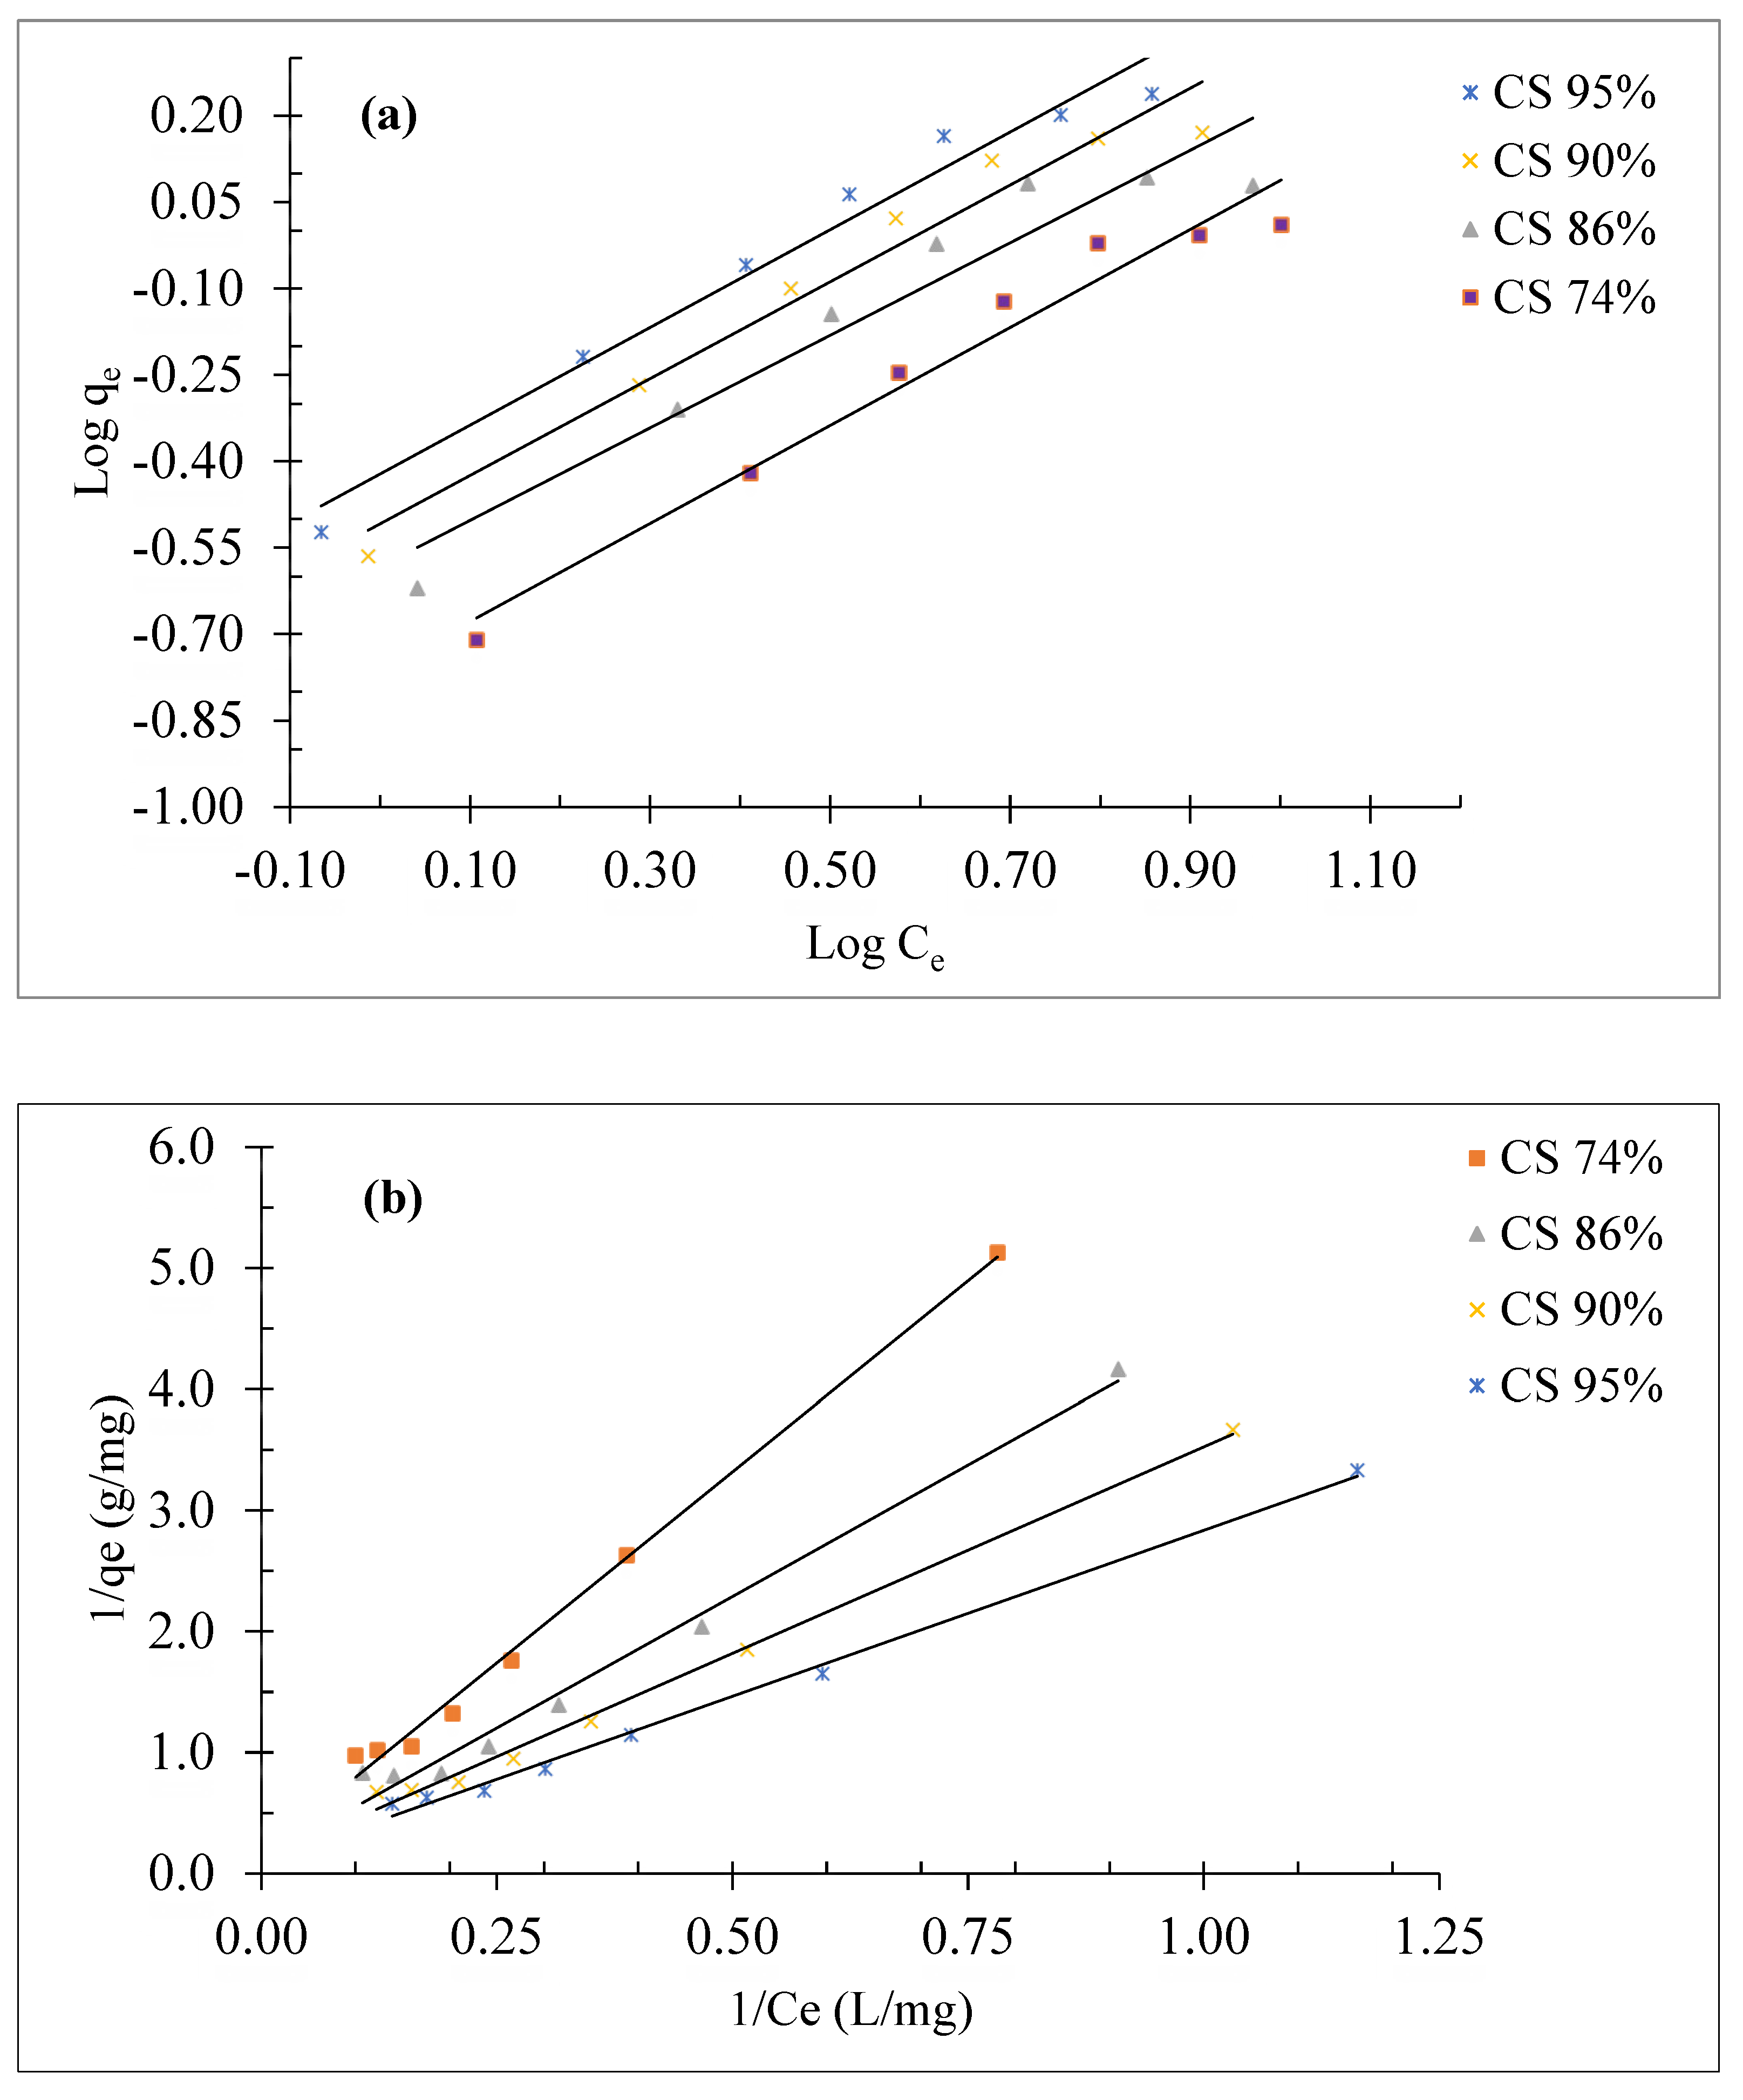
Figure 12.
Pseudo-first order curves for the adsorption of fluoride ions on chitosan at different degrees of deacetylation.
Figure 12.
Pseudo-first order curves for the adsorption of fluoride ions on chitosan at different degrees of deacetylation.
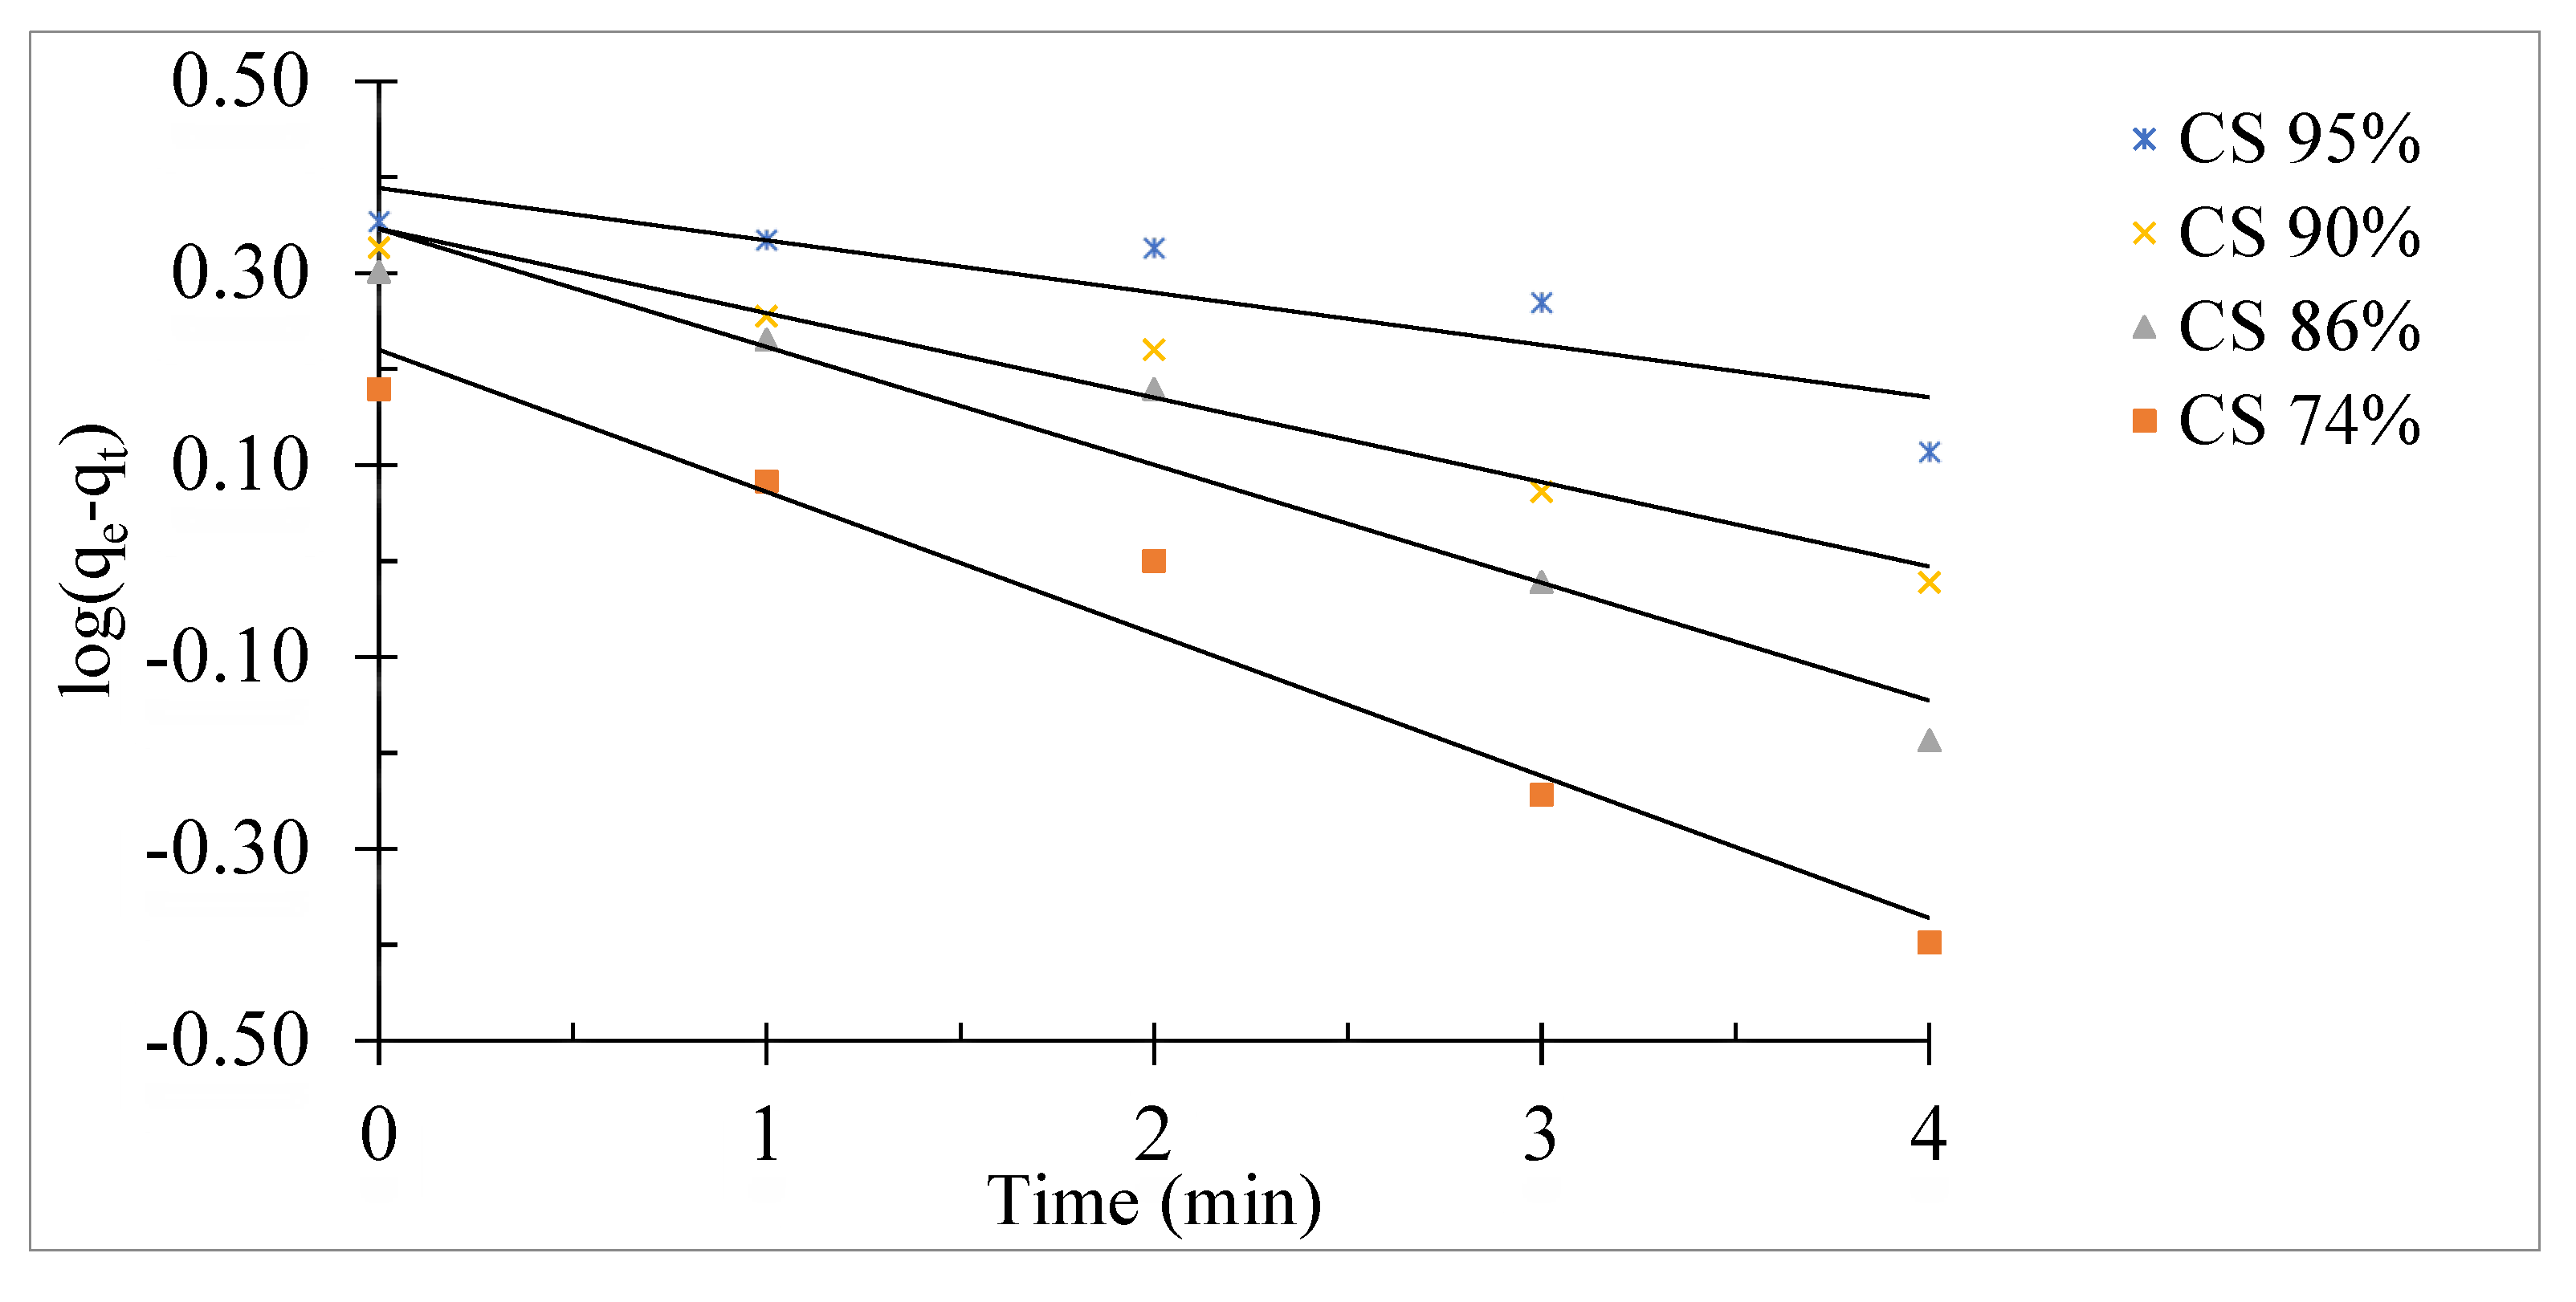
Figure 13.
Pseudo-second order curves for the adsorption of fluoride ions on chitosan at different degrees of deacetylation.
Figure 13.
Pseudo-second order curves for the adsorption of fluoride ions on chitosan at different degrees of deacetylation.
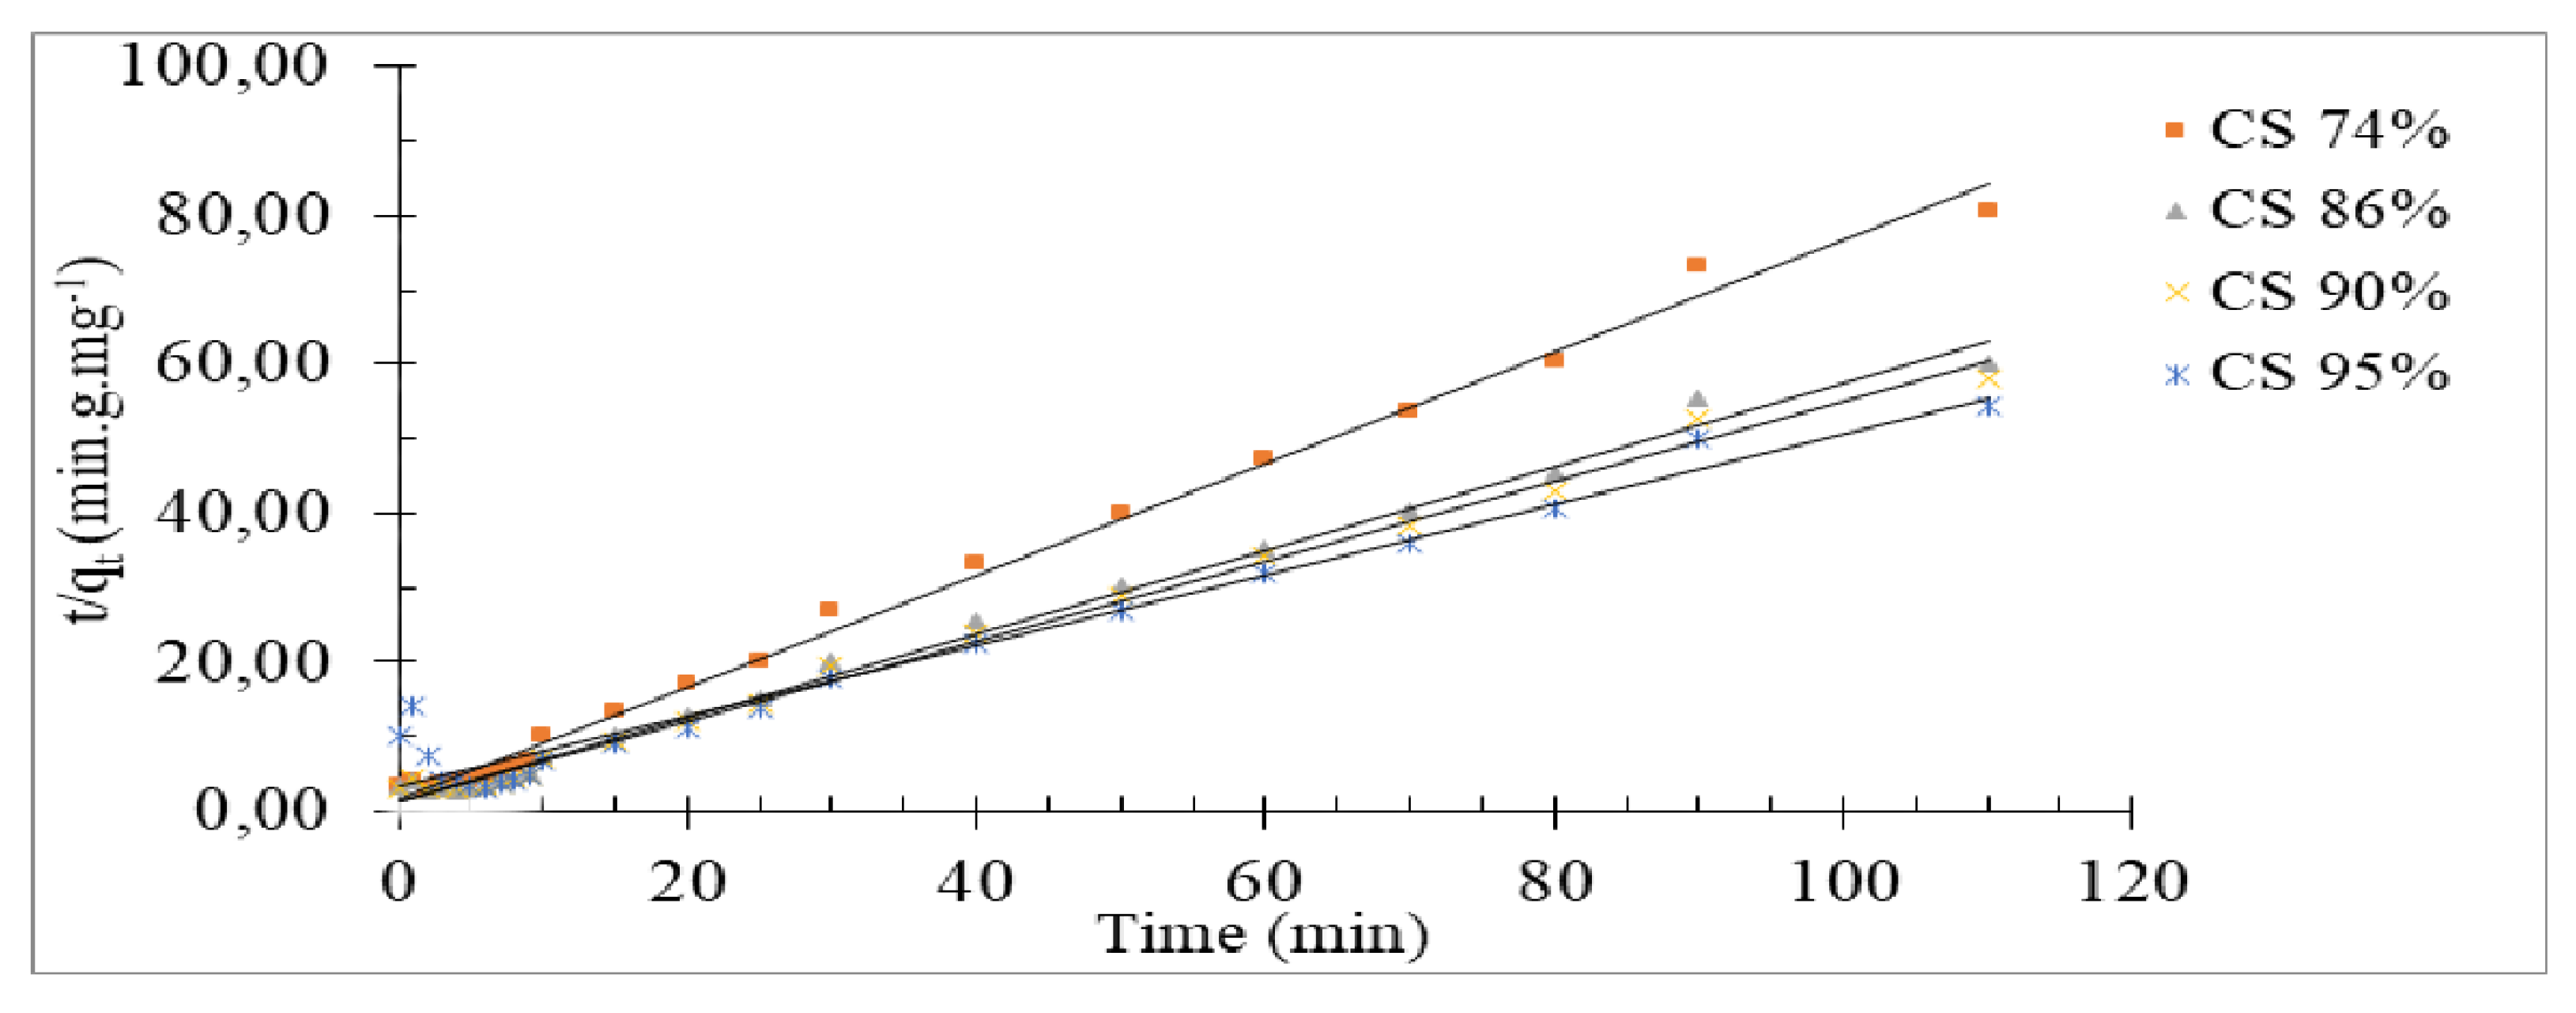
Table 1.
Freundlich and Langmuir isotherm parameters of chitosan at different DD.
| Adsorbents | Freundlich isotherm | Langmuir isotherm | |||||
| n | 1/n | KF(L.g-1) | R2 | Q0(mg.g-1) | b(L.mg-1) | R2 | |
| CS 74% | 1.176 | 0.850 | 0.173 | 0.964 | 5.155 | 0.031 | 0.997 |
| CS 86% | 1.316 | 0.760 | 0.319 | 0.904 | 5.988 | 0.048 | 0.992 |
| CS 90% | 1.203 | 0.831 | 0.322 | 0.949 | 8.264 | 0.036 | 0.996 |
| CS 95% | 1.203 | 0.831 | 0.422 | 0.944 | 10.204 | 0.039 | 0.995 |
Disclaimer/Publisher’s Note: The statements, opinions and data contained in all publications are solely those of the individual author(s) and contributor(s) and not of MDPI and/or the editor(s). MDPI and/or the editor(s) disclaim responsibility for any injury to people or property resulting from any ideas, methods, instructions or products referred to in the content. |
© 2025 by the authors. Licensee MDPI, Basel, Switzerland. This article is an open access article distributed under the terms and conditions of the Creative Commons Attribution (CC BY) license (http://creativecommons.org/licenses/by/4.0/).
Copyright: This open access article is published under a Creative Commons CC BY 4.0 license, which permit the free download, distribution, and reuse, provided that the author and preprint are cited in any reuse.


