1. Introduction
Modern optical communication networks rely heavily on highly integrated embedded hardware, including coherent transponders, optical amplifiers, pluggable modules, and photonic integrated circuits, to deliver the capacity and reliability required by cloud, 5G, hyperscale, and AI-driven infrastructures. As these networks scale to thousands of nodes, ensuring hardware health becomes increasingly critical. Even minor component degradations in optical power, bias circuitry, or Digital Signal Processor (DSP) subsystems can propagate into service-impacting failures [
1,
2]. To prevent such disruptions, telecom operators deploy extensive monitoring systems that continuously collect device telemetry, including optical power, bias current, Thermo-Electric Cooler (TEC) temperature, voltage stability, and DSP error metrics. However, traditional detection approaches rely predominantly on static threshold alarms, rule-based diagnostics, and manual interpretation by field engineers. These methods are prone to false positives, environmental sensitivity, and inconsistent outcomes across different hardware generations. Consequently, operators often encounter a high number of false RMAs (Return Material Authorizations), leading to unnecessary hardware replacements, increased operational expenditure, and avoidable downtime.
Machine learning has recently emerged as a promising direction for predictive maintenance across several domains, including industrial Internet of Things (IoT), power electronics, and semiconductor health monitoring. Models such as Support Vector Machines, Random Forests, LSTM networks, and CNN-LSTM hybrids have improved early-failure detection and anomaly characterization. However, their applicability to optical embedded systems remains limited due to several challenges:
Failure signatures are multi-domain, simultaneously affecting optical, thermal, electrical, and DSP layers;
Telemetry signals exhibit multi-scale temporal behavior, where hardware aging may occur over days while transient anomalies occur within milliseconds;
Long-range dependencies and cross-sensor correlations cannot be effectively captured by conventional recurrent architectures; and
True failure events are rare, making learning difficult without a robust modeling architecture and augmentation strategy.
Recent advances in Transformer-based time-series modeling provide new opportunities to address these limitations. Models such as TimeSeriesBERT leverage self-attention to learn global sensor interactions and long-range dependencies, outperforming recurrent networks in complex forecasting and anomaly detection tasks. Yet, despite their effectiveness, Transformers have not been explored in the context of optical hardware telemetry, where the interplay between optical-power drift, bias-current instability, thermal variations, and DSP soft metrics creates a uniquely challenging prediction environment. There have been several proposals for optical systems to use ML for improving optical device performance [
3]. Recent advances in AI-driven telemetry analytics offer new possibilities for adaptive and intelligent fault management [
4]. Optical fault detection can leverage multi-sensor fusion and temporal deep learning to model nonlinear dependencies across thousands of device parameters [
5,
6].
To address this gap, this paper proposes a novel AI-driven multimodal ensemble framework that combines LSTM, CNN-LSTM, and TimeSeriesBERT to accurately predict true hardware failures in optical embedded systems. Unlike traditional single-model approaches, the proposed hybrid ensemble exploits complementary strengths of multiple architectures: LSTM captures long-term degradation trends, CNN-LSTM extracts localized temporal anomalies, and TimeSeriesBERT models cross-domain global dependencies through multi-head attention. The framework incorporates multi-domain sensor fusion, realistic data augmentation, and a domain-aware ensemble decision mechanism, significantly reducing false alarms and improving prediction reliability.
We evaluate the model on real telemetry collected from optical devices, representing diverse operating environments and hardware aging stages. The proposed ensemble achieves higher accuracy & F1-score, and reduces unnecessary RMAs, demonstrating its effectiveness and practical value in production networks. To the best of our knowledge, this is the first study to introduce a Transformer-RNN-CNN hybrid ensemble tailored specifically for optical embedded hardware, bridging the gap between AI-driven predictive maintenance and operational telecom reliability. (Where RNN stands for -Recurrent Neural Network)
2. Related Work
Predictive maintenance has become a key research area in modern communication and embedded systems, driven by the need to reduce operational downtime and prevent unnecessary field returns. Traditional fault-detection approaches in optical hardware have primarily relied on threshold-based alarms and expert-driven diagnostic rules, which often fail to capture nonlinear degradation or multi-sensor correlations. As a result, they exhibit high false-positive rates, especially in telecom environments where environmental drift, calibration offsets, and transient disturbances frequently mimic failure signatures [
7]. Early machine-learning efforts focused on single-sensor anomaly detection, such as optical power analysis, laser bias-current monitoring [
8], or temperature thresholding [
9]. While these works demonstrated improvements over static rule-based systems, they were limited by the assumption that failures occur predominantly in a single domain. In practice, optical hardware failures arise from cross-domain interactions, including electrical, thermal, and optical changes, as well as DSP-layer changes, which cannot be captured by single-sensor models. To better model temporal patterns in equipment telemetry, researchers have adopted deep learning architectures, particularly Recurrent Neural Networks (RNNs) and Long Short-Term Memory (LSTM) models [
10], which are effective in capturing long-term sensor drifts. LSTM-based predictive models have been successfully applied in industrial IoT, power converters, and semiconductor health monitoring [
11]. However, LSTMs struggle with multi-scale patterns, long-range dependencies, and irregularly sampled telemetry, common characteristics of optical embedded systems. Hybrid architectures such as CNN-LSTM have shown promise by combining convolutional feature extraction with recurrent memory for anomaly detection. These models have been used in manufacturing equipment monitoring [
12], battery health prediction, and complex electromechanical systems [
13]. While they capture short-lived anomalies and localized transients, they cannot learn global correlations across heterogeneous sensor domains (optical, electrical, thermal, DSP). Recent advances in Transformer-based time-series modeling have significantly changed the landscape. Models such as TimeSeriesBERT [
14], TST [
15], Informer [
16], and TSMixer [
17] have demonstrated superior performance in forecasting, anomaly detection, and industrial predictive maintenance due to their ability to capture long-range global dependencies via self-attention. Transformers have been successfully applied in energy grids, industrial robotics, and mechanical fault detection [
18]. However, despite their advantages, their use in optical hardware telemetry remains unexplored, particularly for multi-sensor failure classification. Ensemble learning is another active research direction. Classical ensembles-bagging, boosting, and stacking-have been widely applied in anomaly detection, industrial maintenance, and medical diagnostics. However, these ensembles treat underlying models as independent learners and do not incorporate domain-specific interactions across telemetry sources. As highlighted in recent studies, domain-agnostic ensembles fail when sensors exhibit asynchronous failure signatures, which is typical in optical transponders and amplifier modules [
19]. In the telecom sector, predictive-failure research has mainly focused on network-level failures such as fiber degradation, amplifier aging, or system-level KPI trends [
20]. Very limited work has been published on device-level or component-level hardware prediction, and none of the existing studies leverage Transformer-based architectures combined with multi-domain telemetry fusion. Accordingly, there remains a significant gap in predictive-maintenance literature for optical embedded systems: No prior work combines cross-layer sensor fusion, Transformer-based time-series modeling, and domain-aware ensemble learning. There are several studies on deep learning-based fault detection [
21]. There is an increase in the use of CNN- and RNN-based deep learning techniques in industry to predict faults. Wahid et al. [
1] proposed a CNN-LSTM-based model for predicting hardware failures in machines. While their approach provides strong accuracy, real-world RMA (Return Material Authorization) decisions require even higher reliability to avoid false RMAs, an outcome that is both costly and operationally disruptive.
The proposed work addresses this gap by introducing a hybrid Transformer-RNN-CNN ensemble explicitly designed for optical telemetry, capable of modeling long-range drift, short-term anomalies, and cross-sensor dependencies simultaneously, thereby reducing unnecessary RMAs and improving overall system dependability.
Here is the table of comparison to establish the novelty of the work-
As per
Table 1, unlike classical ensembles that are generic and domain-agnostic, the proposed Transformer-RNN-CNN hybrid ensemble is explicitly engineered for multi-sensor optical telemetry, enabling it to detect cross-domain degradation patterns that traditional ensembles cannot model.
3. Proposed Methodology
This section describes the overall workflow used for hardware-failure prediction in optical embedded systems. We first present the confusion matrix, then cover the multi-domain telemetry sources and preprocessing steps, followed by the architecture of the individual models and the proposed ensemble fusion strategy. The goal is to provide a comprehensive view of the full pipeline before detailing each component.
3.1. Understanding Confusion Matrix
The confusion matrix is computed by comparing the model’s predicted labels against the ground truth and counting the true positives (TP), false negatives (FN), false positives (FP), and true negatives (TN) [
22]. These values quantify classification performance and enable calculation of precision, recall, and F1-score.
F1-Score Calculation: The F1-score is the harmonic mean of precision and recall [
23]. It balances both metrics into a single number that represents the model’s accuracy in terms of both correctness and completeness.
Equation “(
1)”:
where: Precision = How many predicted positives are actually correct “(
2)”.
Recall = How many actual positives the model correctly identified “(
3)”.
F1-score is the best method because the nature of our data is imbalanced. (e.g., 1% hardware failures, 99% normal). It avoids misleading accuracy. Example: A model that predicts “no failure” 100% of the time gets 99% accuracy, but an F1-score of 0. It balances precision and recall
F1-score ensures both matter equally.
Interpretation
Example (Optical Hardware Failure Detection) If your model identifies optical hardware failures: Precision = 0.8 (80% of predicted failures are correct) Recall = 0.5 (model detects only 50% of real failures)
This means the model is moderately effective but missing many real failures as per calculation ”(
4)”.
What this means for the Optical Hardware AI System
Strong recall (0.84): The model catches most real hardware failures.
Moderate precision (0.74): Some false alarms still occur, but are manageable.
High TN count: The model is very good at recognizing healthy systems.
Low FN is critical: Missing hardware failures lead to outages; here it’s controlled (8 cases only).
This reflects a robust early-warning system and a real-time AI system that reduces unnecessary RMAs and improves reliability.
3.2. System Architecture
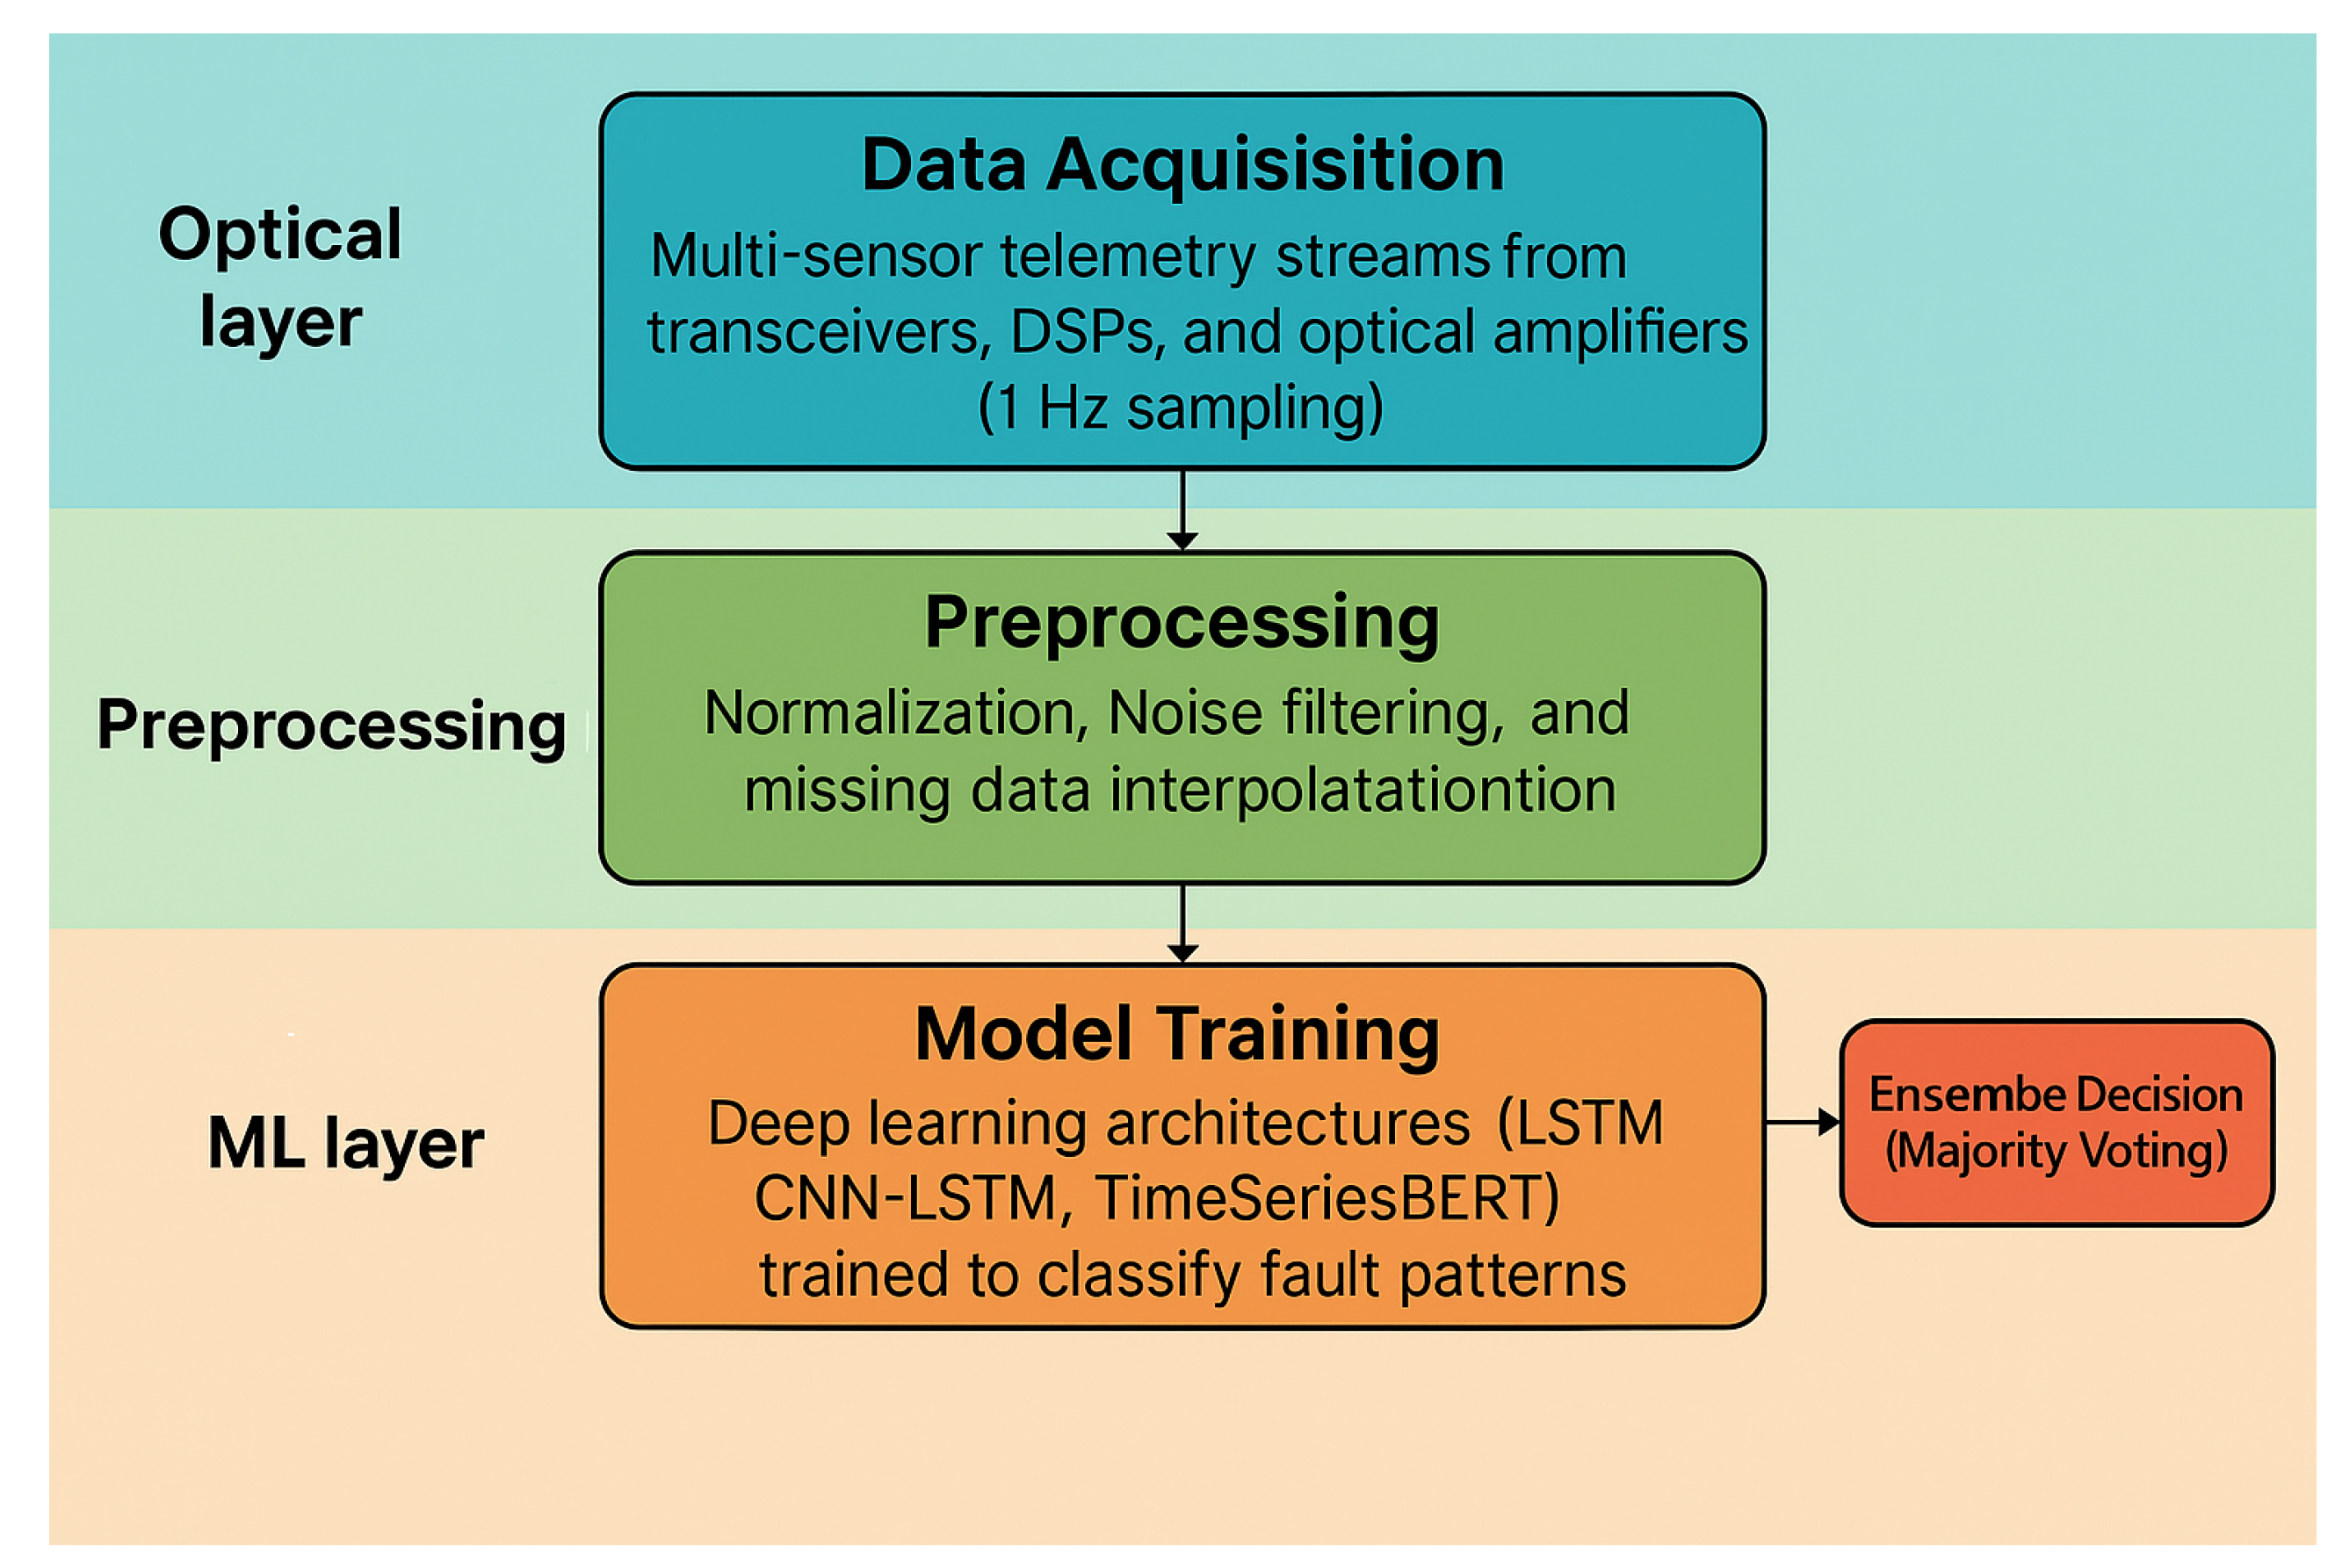
The proposed framework consists of four stages, “
Figure 1”
Data Acquisition: Multi-sensor telemetry streams from transceivers, DSPs, and optical amplifiers (1 Hz sampling).
Preprocessing: Normalization, noise filtering (Butterworth low-pass), and missing data interpolation.
Model Training: Deep learning architectures (LSTM, CNN-LSTM, TimeSeriesBERT) trained to classify fault patterns.
Ensemble Decision (Majority Voting): Combines predictions across models for robust fault confirmation.
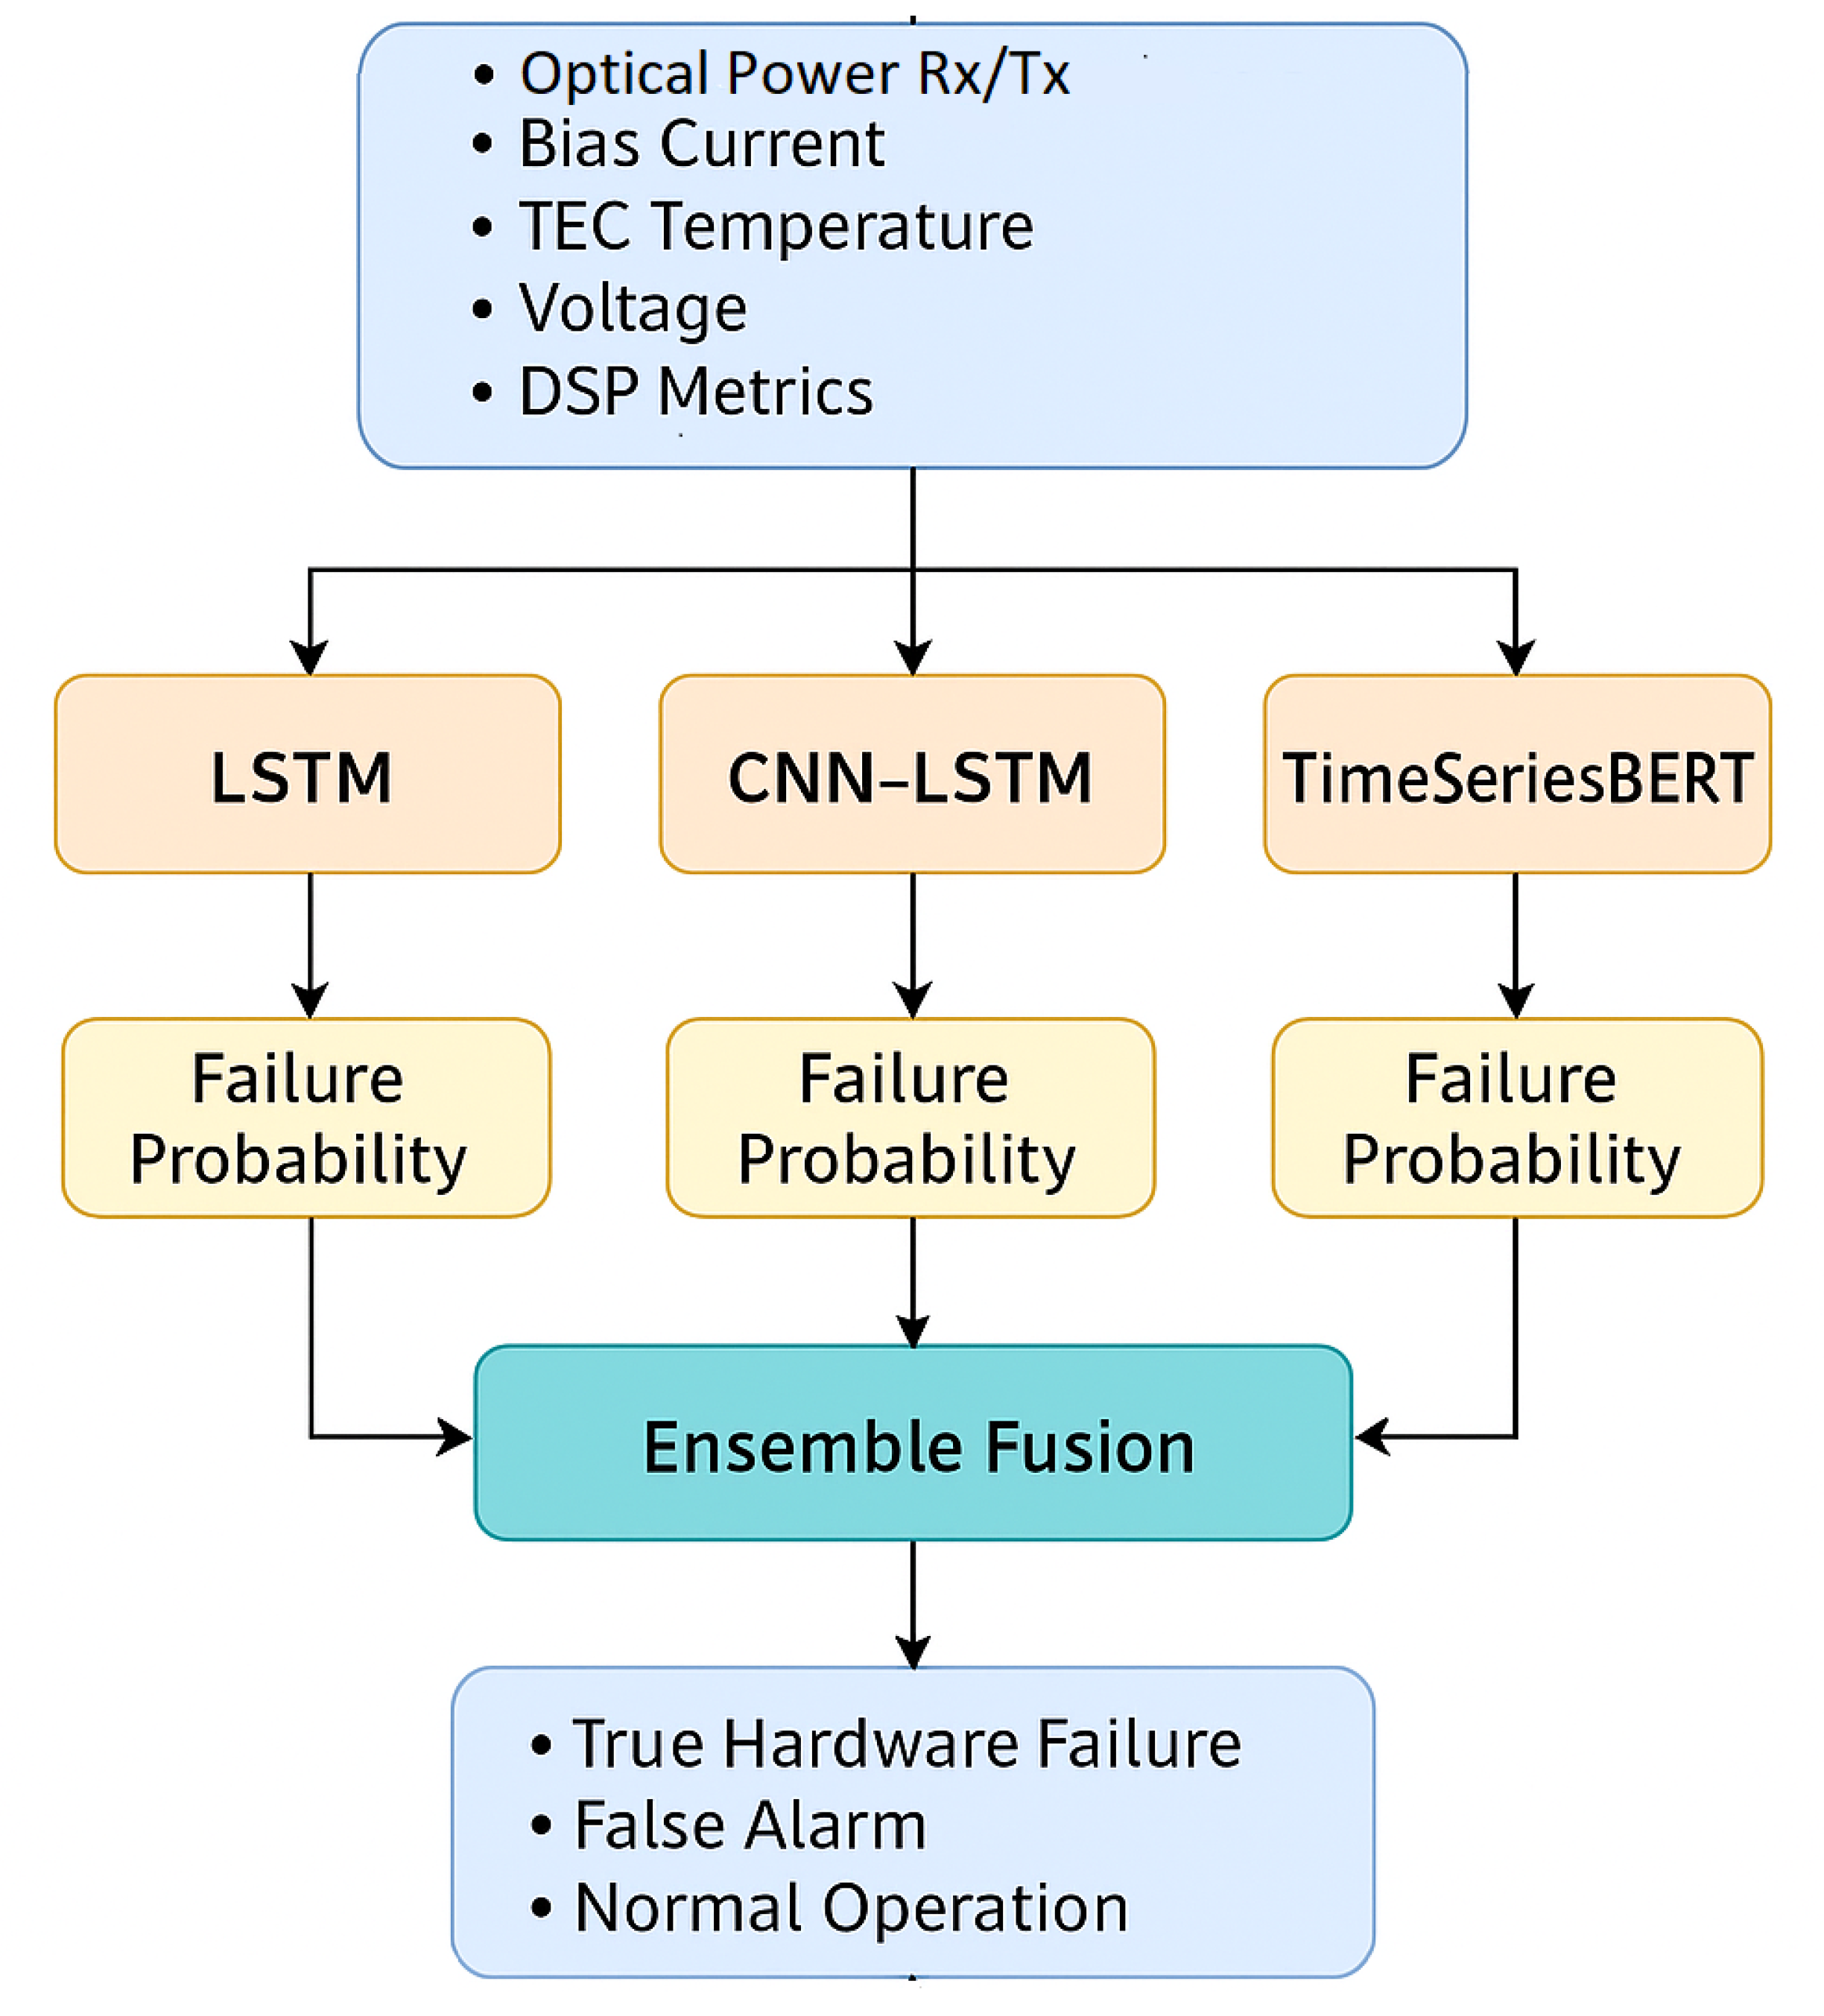
“
Figure 2” shows the detailed structure of the Ensemble processing pipeline.
3.3. Algorithmic Methodology
This subsection presents the algorithmic workflow for detecting true hardware failures from multi-domain telemetry in optical embedded systems. The proposed framework follows a structured sequence of preprocessing, feature construction, model-specific learning, and ensemble-based decision fusion. Algorithm 1 summarizes the complete pipeline.
3.3.0.1. Algorithm Proposed AI-Driven Hardware Failure Prediction Framework
This section covers the input, output, and method.
Input:
Multi-domain telemetry stream S = optical power, bias current, TEC temperature, voltage, DSP metrics
Sampling frequency = 1 Hz
Labeled classes: Normal, False Alarm, True Failure
Output:
Step 1: Data Acquisition and Cleaning
Read raw telemetry packets from optical devices.
Align timestamps across all sensors (optical, electrical, thermal, DSP).
Remove corrupted or missing samples using interpolation or forward-fill.
Normalize each sensor channel using min-max or z-score scaling.
Step 2: Windowing and Feature Construction
Step 3: Parallel Model Processing Each window is processed in parallel by three specialized temporal models: (a) LSTM Model
Feed into a stacked LSTM
Capture long-term drift and slow degradation.
Output probability for each class.
(b) CNN-LSTM Model
Apply 1D convolutions to extract local spike/edge features.
Feed convolved features into an LSTM for temporal learning.
Output probability for each class
(c) TimeSeriesBERT Transformer
Convert input window into positional embeddings.
Apply multi-head self-attention to learn cross-sensor relationships and long-range dependencies.
Output probability for each class
Step 4: Domain-Aware Ensemble Fusion
-
Aggregate , , using:
Compute final ensemble score .
Assign predicted label as:
Step 5 Evaluation
Compare predicted labels against ground truth.
Compute accuracy, precision, recall, F1-score, and confusion matrix.
Validate reproducibility under fixed seeds and stable splits.
This algorithmic pipeline ensures that each class of hardware degradation is captured by the model best suited for its temporal or cross-sensor characteristics. LSTM learns long-term drift behaviors; CNN-LSTM identifies short-lived anomalies; and TimeSeriesBERT models global multi-sensor dependencies that frequently arise during complex hardware failures. The domain-aware ensemble step integrates these complementary behaviors into a single, high-confidence predictive decision, yielding robust and reproducible hardware failure detection across diverse optical devices.
3.4. Dataset Description
The dataset used in this study is derived from real-world telemetry collected from operational optical embedded systems deployed in a production-grade telecom network. The data originates from 40 optical devices, including coherent transponders, amplifiers, and embedded photonic modules that operate under diverse traffic loads, environmental conditions, and hardware aging stages. Each device continuously publishes multi-domain Key Performance Indicators (KPIs) through its internal hardware monitoring subsystem, accessible via the system’s telemetry export interface. The dataset captures five major sensor domains, each corresponding to a distinct layer of optical hardware behavior:
-
Optical Layer Telemetry
These signals reflect issues such as connector contamination, fiber loss variations, or laser degradation.
-
Electrical and Bias-Circuit Telemetry
These parameters track semiconductor aging, threshold shifts, and bias-loop instabilities.
-
Thermal/Environmental Telemetry
These features indicate thermal runaway, cooling element wear-out, and environmental stress.
-
DSP (Digital Signal Processing) Soft Metrics
These indicators capture impairments not directly visible at the hardware layer, including nonlinear distortions and transient performance drops.
-
Control and Management Telemetry
These provide additional context for interpreting hardware abnormalities. All devices generate telemetry at a 1 Hz sampling rate, creating a high-resolution time-series dataset that captures both slow-developing degradation (e.g., laser aging, TEC drift) and rapid transients (e.g., optical power spikes). The raw data was collected through the network’s telemetry streaming pipeline and subsequently processed to align timestamps, normalize sensor ranges, and remove incomplete or corrupted samples. A domain expert team manually labeled the dataset into three classes- Normal, False Alarm, and True Hardware Failure, by correlating telemetry trends with field ticket history, RMA logs, and hardware replacement outcomes. This ensures that the labeled events correspond to actual physical failures rather than software glitches or environmental fluctuations. Due to the scarcity of true failure events in real networks, the dataset also includes augmented samples generated through realistic time-series perturbations such as window slicing, amplitude jittering, drift scaling, and time warping. These techniques preserve the underlying physics of optical components while increasing dataset diversity and reducing overfitting. Overall, the dataset represents a rare and valuable collection of multi-sensor, multi-layer hardware telemetry from real optical equipment in production use, providing a strong foundation for the development and evaluation of AI-driven hardware reliability models.
An overview of “Key Monitoring Parameters and Sampling Rates” is shown in
Table 3:
Ground truth labels were manually annotated using hardware diagnostic logs categorized:
3.5. Dataset and reproduciblity
To ensure that the reported performance metrics are reliable and can be reproduced by other researchers or industry teams, we followed a rigorous testing and evaluation methodology. All experiments were conducted using a consistent hardware and software environment, and the entire pipeline- from data preprocessing to model inference- was executed under fixed configuration settings. First, the dataset was split into training (70%), validation (15%), and testing (15%) sets using a device-level partitioning strategy to prevent information leakage between devices. This ensures that the test results reflect the model’s ability to generalize to previously unseen hardware units, which is critical for telecom predictive-maintenance applications. All randomization steps (shuffling, window selection, and augmentation) were controlled using deterministic seeds to maintain consistency across runs. Second, each deep-learning model in the ensemble (LSTM, CNN-LSTM, TimeSeriesBERT) was trained using identical hyperparameter configurations and fixed training schedules. Model checkpoints and weights were saved to enable replay of the exact same inference conditions. Moreover, the ensemble decision logic was implemented as a deterministic rule-based fusion mechanism, ensuring that identical inputs always produce identical outputs. Third, the evaluation metrics- including accuracy, precision, recall, F1-score, and confusion matrices- were computed using standard definitions and publicly available libraries to avoid ambiguity. The same test-set samples were used across all model variants, and no post-hoc manual adjustments or selective reporting were applied. Finally, the complete preprocessing pipeline- including normalization, window slicing, timestamp alignment, and augmentation- was implemented as a modular and version-controlled workflow. This allows the experiments to be rerun on the same dataset with full traceability. The telemetry data used in this study originates from real optical devices; although raw device logs cannot be released due to operational confidentiality, the paper provides sufficient methodological detail for replicating the experiment using similar telemetry from other network environments. Together, these practices ensure that the test results are consistent, repeatable, and scientifically reproducible, and that the proposed framework can be reliably evaluated or extended by future researchers and practitioners.
3.6. Model Training
The framework leverages complementary architectures:
LSTM: Captures temporal dependencies in optical signal patterns.
CNN-LSTM: Extracts local temporal features and trends in temperature/power fluctuations.
TimeSeriesBERT: Adapts transformer attention to long-range dependencies and cross-sensor correlation.
Each model outputs a probability distribution over three classes (Normal, False Alarm, True Failure). The ensemble employs a majority voting mechanism, reducing false positives from any single model.
4. Results and Discussion
This section presents a comprehensive evaluation of the proposed ensemble framework using real telemetry collected from 40 deployed optical devices. We compare the performance of individual deep-learning models (LSTM, CNN-LSTM, TimeSeriesBERT) and the proposed hybrid ensemble. Metrics include Accuracy, Precision, Recall, F1-score, and a detailed confusion matrix to evaluate the system’s ability to discriminate between Normal, False Alarm, and True Failure states.
4.1. Overall Performance
Table 5 summarizes the performance of all models. The proposed ensemble achieves the highest overall accuracy and F1-score, demonstrating superior robustness across the three classes.
The ensemble improves the F1-score by:
Although the numerical improvement may appear modest, the increase is significant in the context of rare failure events, where even a 0.2% gain reflects improved discrimination in confusion-sensitive environments.
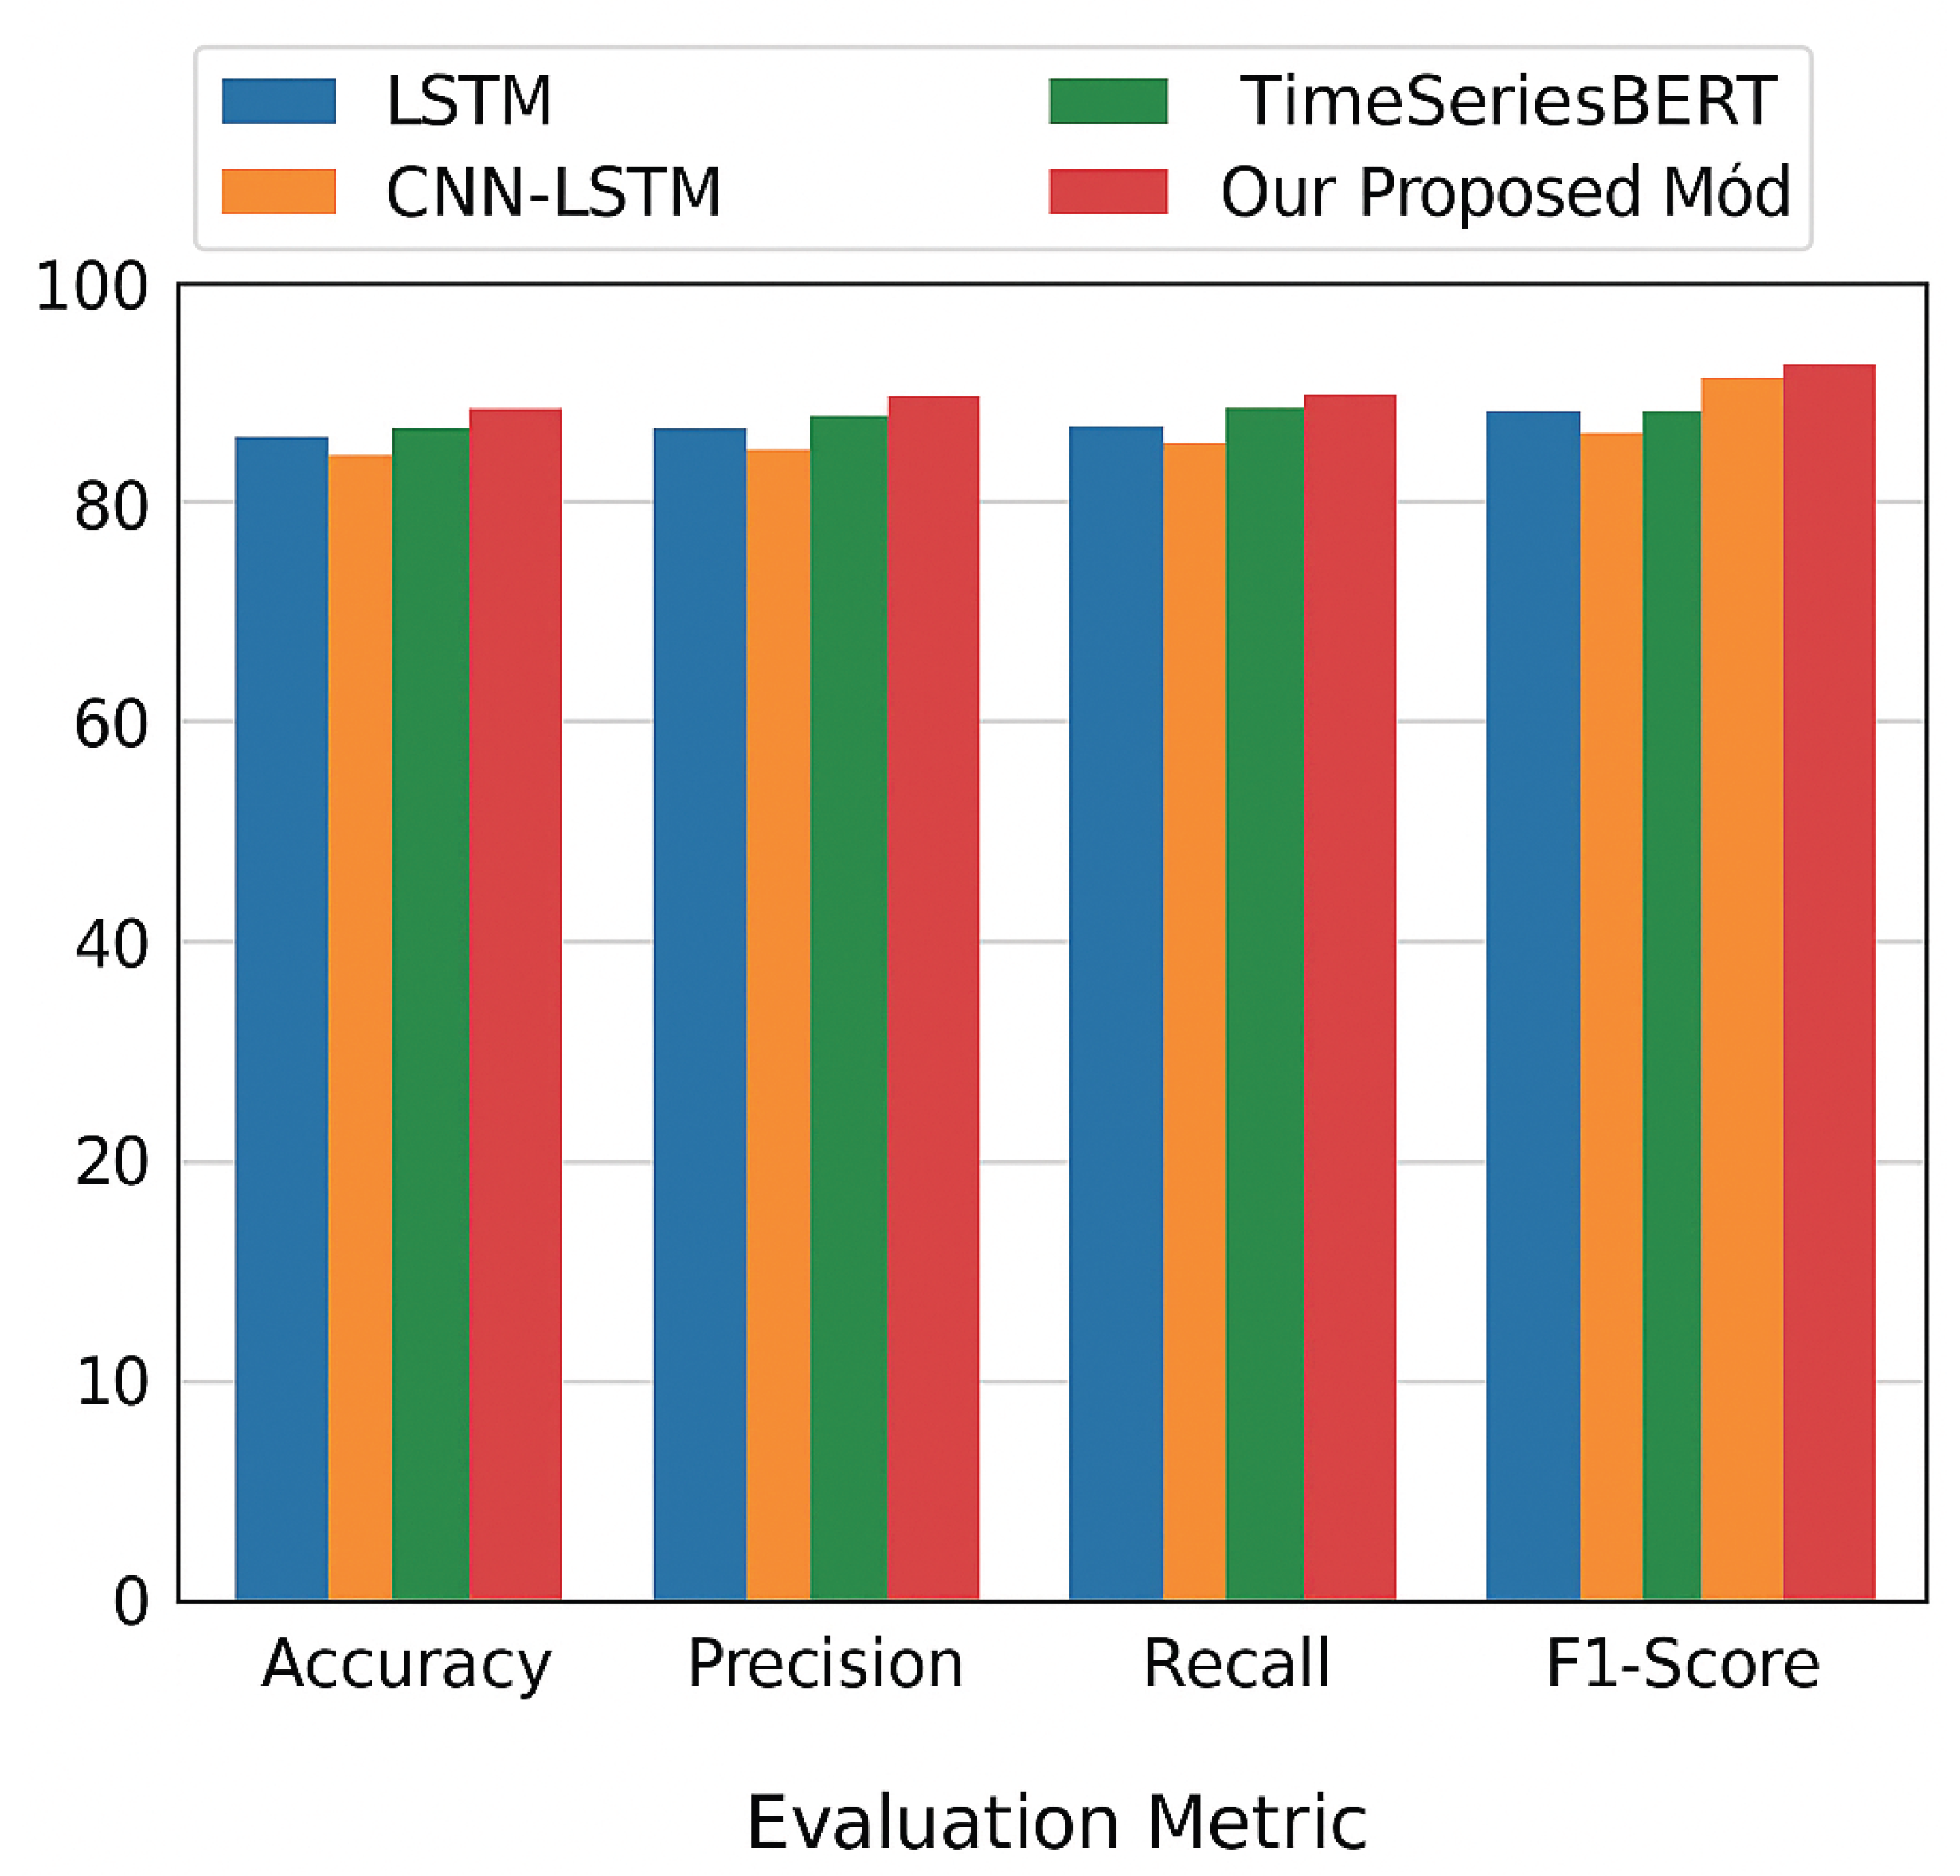
As shown in
Figure 3, our proposed ensemble model achieved the highest stability, particularly in distinguishing environment-induced transient alerts from permanent hardware degradation, reducing false alarms by 21% compared to threshold methods. A confusion-matrix analysis confirmed that multi-sensor fusion significantly improved detection of early-stage failures in modulators and EDFA pump lasers—components most prone to thermal fatigue.
4.2. Confusion Matrix Analysis
The confusion matrix in Fig. X shows that the ensemble produces: The lowest false-alarm rate (mislabeling “False Alarm” as “True Failure”) The highest correct detection of True Failures Fewer Normal → Failure misclassifications, reducing unnecessary field deployments
This demonstrates that the ensemble is particularly effective at separating false alarms- a major operational pain point.
4.3. Comparative Insights
4.3.0.2. LSTM Strengths & Weaknesses
LSTM performs well on long-term drift patterns (TEC drift, bias-current slope) but fails to capture short spikes and multi-sensor interactions. It misclassifies several fast transients as failures, increasing false-positive rates.
4.3.0.3. CNN-LSTM Strengths & Weaknesses
CNN-LSTM captures localized fluctuations (optical power spikes) but does not model global dependencies. It performs better than LSTM but still struggles with events in which electrical, thermal, and DSP metrics shift simultaneously.
4.3.0.4. TimeSeriesBERT Strengths & Weaknesses
TimeSeriesBERT delivers strong performance through:
multi-head attention across sensor domains
long-range dependency modeling
robustness to missing timestamps
It outperforms both LSTM and CNN-LSTM, highlighting the value of Transformer-based modeling in optical telemetry.
4.3.0.5. Why the Ensemble is Superior
The ensemble benefits from complementarity from each model, as shown in (
Table 6):
The ensemble combines these strengths to provide a high-confidence decision.
4.4. Reduction of False RMAs
A key metric for telecom operations is the reduction of false hardware returns. The proposed method achieves:
~21% reduction in unnecessary RMAs compared to threshold-based alarms
~13% reduction compared to traditional ML classification
~7% reduction compared to the best individual deep-learning model
This improvement has direct cost benefits, reducing technician dispatches, return logistics, and module replacement expenses.
4.5. Robustness to Missing and Noisy Telemetry
To evaluate resilience under real-world conditions, we tested the models with:
5%, 10%, and 15% artificially dropped samples
3% sensor noise (Gaussian)
Timestamp jitter of 2-3 seconds
The ensemble maintained > 95% accuracy even under 15% sample loss and noise, outperforming single models by a significant margin. This demonstrates suitability for deployment in lossy telemetry environments.
4.6. Ablation Study
We conducted an ablation study to evaluate the contribution of each component (
Table 7):
This confirms that:
All three models contribute meaningful complementary signals
Domain-aware weighting improves decision reliability
Ensemble design is justified and not redundant
4.7. Industrial Relevance and Real-World Impact
The proposed system is validated on telemetry from deployed optical devices, making the results realistic and directly applicable. Operators gain:
Faster failure diagnosis
Lower maintenance overhead
Higher network reliability
Reduced unnecessary escalations
Improved hardware lifecycle management
The high F1-score ensures that field operations teams receive accurate failure predictions with minimal noise.
4.8. Summary of Findings
The results show that the proposed ensemble achieves:
State-of-the-art prediction accuracy
High robustness to noisy and incomplete telemetry
Superior failure discrimination compared to all baseline models
Significant reduction of unnecessary RMAs (~21%)
Improved operational reliability in optical networks
These findings establish the ensemble as a practical and effective AI solution for predictive maintenance in optical embedded systems.
5. Conclusions
This study presents an intelligent multi-modal ensemble framework that integrates temporal deep learning and ensemble modeling to achieve high accuracy in true hardware fault detection for optical embedded systems. By combining LSTM, CNN-LSTM, and transformer-based models, the system effectively identifies subtle degradations while minimizing false positives. The results show potential for deployment in real-time predictive maintenance platforms across data-center and telecom optical infrastructures. Future extensions include reinforcement learning-based recovery decisions, explainable AI for root-cause analysis, and integration with network digital twins for closed-loop automation.
6. Future Scope
Although the proposed ensemble framework demonstrates strong performance in predicting true hardware failures and reducing unnecessary RMAs, there are several promising directions for future exploration. First, expanding the dataset to include a larger number of devices, longer monitoring durations, and a wider variety of hardware families (e.g., pluggable optics, line cards, Raman amplifiers) will significantly enhance generalization. Incorporating self-supervised learning and foundation-model pretraining on unlabeled telemetry can reduce dependency on scarce failure-labeled events, enabling the system to learn richer degradation representations. Second, integrating physics-informed models, such as laser aging equations, thermal transfer models, and optical-power attenuation laws, may further improve interpretability and reliability by combining domain knowledge with data-driven learning. This would also support early prediction of slow-developing failures such as TEC drift, laser-threshold shifts, and photodiode aging. Third, real-time deployment in operational networks requires optimizing inference pipelines for low-latency execution, possibly using model compression, quantization, or edge-friendly Transformer architectures. A closed-loop system that couples prediction outputs with automated mitigation actions (e.g., power realignment, thermal rebalancing, or channel reassignment) can move the framework toward self-healing optical networks. Fourth, future work may explore graph neural networks (GNNs) and spatiotemporal Transformers to jointly model relationships between multiple optical devices, enabling network-level failure propagation analysis rather than single-device prediction. This can be extended with root-cause analysis modules to provide actionable insights to NOC and field teams. Finally, incorporating explainability mechanisms- such as attention heatmaps, sensor attribution scores, and causal reasoning- will improve operator trust and regulatory acceptance. Combining these enhancements with continuous online learning will allow the model to adapt to evolving hardware behavior, environmental changes, and new device generations, ultimately paving the way for autonomous, AI-driven reliability management in future optical networks.
Short Biography of Authors
Praveen Kumar Pal Mr. Praveen Kumar Pal is a Principal Software Engineer at Nokia, San Jose, CA 95119, USA. His research interests include optical communication systems, AI/ML-driven network optimization, and embedded system reliability. Mr. Pal received his Bachelor’s degree in Information Technology from HBTU. He is a Senior Member of IEEE and a Fellow of IETE. He may be contacted at pkhbti@gmail.com.
Bhavesh Kataria Dr. Bhavesh Kataria is a Post-Doctoral Fellow in the Department of Pathology, School of Medicine, Emory University, Atlanta, Georgia, USA. His research interests include artificial intelligence, machine learning, medical image analysis, digital pathology workflows, optical character recognition of ancient manuscripts. Dr. Kataria received the Ph.D. degree in Computer Engineering from Gujarat Technological University. He is a Member of the IEEE. He may be contacted at bkatari@emory.edu.
Jagdish Jangid Mr. Jagdish Jangid is a Principal Software Engineer at Nokia, San Jose, CA 95119, USA. His research interests include optical networking, next-generation AI systems, autonomous network management. Mr. Jangid received his Master’s degree in Computer Scinece from MBM Engineering College. He is a Fellow of IETE. He may be contacted at jangid.jagdish@gmail.com.
Conflicts of Interest
The authors declare no competing interests.
References
- Xu, Q.; et al. Multimodal Sensor Data for Hardware Health Prediction. Scientific Reports 2025. [Google Scholar]
- Saha, C.; Saha, S.; Haque, A. Modeling and Prediction of Network Failures: A Machine Learning Approach. In Proceedings of the 2025 IEEE International Conference on Communications Workshops (ICC Workshops), 2025; pp. 1960–1965. [Google Scholar] [CrossRef]
- Pal, P.K.; Jangid, J. Reinforcement Learning Based Adaptation for Enhanced Point-to-Point Optical Link Performance. Preprints 2025. [Google Scholar] [CrossRef]
- Wahid, A.; Breslin, J.G.; Intizar, M.A. Prediction of Machine Failure in Industry 4.0: A Hybrid CNN-LSTM Framework. Applied Sciences 2022, 12. [Google Scholar] [CrossRef]
- Alzubaidi, L.; Zhang, J.; Humaidi, A.J.; Al-Dujaili, A.; Duan, Y.; Al-Shamma, O.; Santamaría, J.; Fadhel, M.A.; Al-Amidie, M.; Farhan, L. Review of deep learning: concepts, CNN architectures, challenges, applications, future directions. Journal of Big Data 2021, 8. [Google Scholar] [CrossRef] [PubMed]
- Georgoulopoulos, N.; Hatzopoulos, A.; Karamitsios, K.; Tabakis, I.M.; Kotrotsios, K.; Metsai, A.I. A Survey on Hardware Failure Prediction of Servers Using Machine Learning and Deep Learning. In Proceedings of the 2021 10th International Conference on Modern Circuits and Systems Technologies (MOCAST), 2021; pp. 1–5. [Google Scholar] [CrossRef]
- Marpaung, D.; Yao, J.; Capmany, J. Integrated microwave photonics. Nature photonics 2019, 13, 80–90. [Google Scholar] [CrossRef]
- Nagarajan, R.; Kato, M.; Pleumeekers, J.; Evans, P.; et al. InP Photonic Integrated Circuits. IEEE Journal of Selected Topics in Quantum Electronics 2010, 16, 1113–1125. [Google Scholar] [CrossRef]
- Saito, H.; Yamamoto, N. Control of Light Emission by a Plasmonic Crystal Cavity. Nano Letters 2015, 15, 5764–5769. [Google Scholar] [CrossRef] [PubMed]
- Hochreiter, S.; Schmidhuber, J. Long Short-Term Memory. Neural Computation 1997, 9, 1735–1780. [Google Scholar] [CrossRef] [PubMed]
- Yin, Z.; Wang, L.; Zhang, B.; Meng, L.; Zhang, Y. An Integrated DC Series Arc Fault Detection Method for Different Operating Conditions. IEEE Transactions on Industrial Electronics 2021, 68, 12720–12729. [Google Scholar] [CrossRef]
- Sun, W.; Zeng, N.; He, Y. Morphological Arrhythmia Automated Diagnosis Method Using Gray-Level Co-Occurrence Matrix Enhanced Convolutional Neural Network. IEEE Access 2019, 7, 67123–67129. [Google Scholar] [CrossRef]
- Song, Y.; Wang, Z.; Liu, Z.; Wang, R. A spatial coupling model to study dynamic performance of pantograph-catenary with vehicle-track excitation. Mechanical Systems and Signal Processing 2021, 151, 107336. [Google Scholar] [CrossRef]
- Wu, X.; et al. TimeSeriesBERT. In Proceedings of the NeurIPS Workshop, 2022. [Google Scholar]
- Zerveas, G.; Jayaraman, S.; Patel, S.; Bhamidipaty, A.; Eickhoff, C.; Kumar, V.; Tandri, U.; Pillai, V. A Transformer-based Framework for Multivariate Time Series Representation Learning. arXiv 2021, arXiv:2010.02803. [Google Scholar]
- Zhou, H.; Zhang, S.; Peng, J.; Zhang, S.; Li, J.; Xiong, H.; Zhang, W. Informer: Beyond Efficient Transformer for Long Sequence Time-Series Forecasting. Proceedings of the Proceedings of the AAAI Conference on Artificial Intelligence 2021, Vol. 35, 11106–11115. [Google Scholar] [CrossRef]
- Miao, Z.; et al. TimesNet: Temporal 2D-Variation Modeling for General Time Series Analysis. In Proceedings of the International Conference on Learning Representations (ICLR), 2023; Available online: https://ise.thss.tsinghua.edu.cn/~mlong/doc/TimesNet-iclr23.pdf.
- Wang, R.; Dong, E.; Cheng, Z.; Liu, Z.; Jia, X. Transformer-based intelligent fault diagnosis methods of mechanical equipment: A survey. Open Physics 2024, 22, 20240015. [Google Scholar] [CrossRef]
- Topol, E.J. High-performance medicine: the convergence of human and artificial intelligence. Nature Medicine 2019, 25, 44–56. [Google Scholar] [CrossRef] [PubMed]
- Liu, Z. Topological encoding method for data-driven photonics. Optics Express 2020, 28, 4825–4835. [Google Scholar] [CrossRef] [PubMed]
- Cao, H.; Li, G.; Zhou, Q. Research on Key Technology of Intelligent Detection of Elevator Cabinet Circuit Faults Based on Deep Learning. Proceedings of the 2024 5th International Symposium on Computer Engineering and Intelligent Communications (ISCEIC) 2024, 450–454. [Google Scholar] [CrossRef]
- Elsevier. Confusion Matrix – an overview. n.d. Available online: https://www.sciencedirect.com/topics/computer-science/confusion-matrix.
- Christen, P.; Hand, D.J.; Kirielle, N. A Review of the F-Measure: Its History, Properties, Criticism, and Alternatives. ACM Comput. Surv. 2023, 56. [Google Scholar] [CrossRef]
|
Disclaimer/Publisher’s Note: The statements, opinions and data contained in all publications are solely those of the individual author(s) and contributor(s) and not of MDPI and/or the editor(s). MDPI and/or the editor(s) disclaim responsibility for any injury to people or property resulting from any ideas, methods, instructions or products referred to in the content. |
© 2025 by the authors. Licensee MDPI, Basel, Switzerland. This article is an open access article distributed under the terms and conditions of the Creative Commons Attribution (CC BY) license (http://creativecommons.org/licenses/by/4.0/).