Submitted:
14 December 2025
Posted:
15 December 2025
You are already at the latest version
Abstract
SATB2 (special AT-rich binding protein-2) is a chromatin modifier and epigenetic regulator that regulates gene expression by acting as a transcriptional co-factor. The objective of this paper was to examine whether overexpression of the SATB2 gene is sufficient to induce cellular transformation in a human mesothelial cell line in vitro, and inhibition of its expression in cancer stem cells (CSCs) reverses drug resistance in mesothelioma. SATB2 was highly expressed in human mesothelioma (MPM) cell lines, but not in Met5A cells. Overexpression of the SATB2 gene in Met5A cells led to malignant transformation and stemness (induction of stem cell markers and pluripotency-maintenance factors), as evidenced by colony formation in soft agar and spheroid formation in suspension culture. By comparison, Met5A cells (Met5A/empty vector) did not form colonies and spheroids. Furthermore, overexpression of SATB2 in Met5A cells led to increased cell motility, migration, and invasion. SATB2 overexpression also resulted in the induction of EMT-related transcription factors in Met5A/SATB2 cDNA cells compared to those in Met5A/Empty Vector cells. Inhibition of SATB2 by shRNA in the MPM cell line attenuated cell growth, EMT, and stem cell-like characteristics. ChIP assay revealed SATB2 binding to the promoters of Bcl2, XIAP, KLF4, cMyc, Nanog, and Sox2. These data indicate that SATB2 can regulate several cellular functions by modulating the expression of genes involved in transformation, pluripotency, cell survival, proliferation, and EMT. Inhibition of SATB2 expression in CSCs reversed drug-resistance to cisplatin and pemetrexed by suppressing the expression of Oct4 and Sox2. In conclusion, SATB2 can be considered a therapeutic target in MPM, and inhibiting SATB2 in combination with chemotherapy may be a viable option for MPM treatment.
Keywords:
SATB2
; mesothelioma
; cancer stem cells
; transformation
; drug resistance
; chemotherapy
Introduction
Mesothelioma is a deadly disease with a poor prognosis [1,2,3,4,5,6]. It is mainly caused by asbestos exposure, and in some cases, exposure to the SV40 virus [7,8,9,10,11,12]. In the United States, about 3000 mesothelioma patients die each year [13,14]. Malignant mesothelioma is an invasive cancer that predominantly arises from the mesothelial linings of the peritoneum, pleura, and pericardium. Malignant pleural mesothelioma (MPM) is the most common form of the disease, which accounts for about 70% of the cases [4,6,15,16,17]. MPM is an aggressive disease that is associated with poor prognosis, late detection, metastasis, and resistance to therapy [4,6,9,18]. MPM is a disease of aging, as it primarily affects the elderly population [14]. Although a limited success has been made with the combination of pemetrexed and cisplatin (a standard care of therapy), the prognosis for mesothelioma patients is still very low, and median survival is between 12-17 months [19,20]. Mesothelioma has a significant impact on patients’ quality of life in both physical and emotional domains, and also substantially affects patients’ families and caregivers. The molecular events during the development of MPM are not well understood. Since there are no reliable biomarkers for detecting MPM, managing the disease becomes very challenging. Therefore, understanding the molecular mechanism by which normal mesothelial cells transform into malignant cells is of paramount importance.
SATB2 (special AT-rich binding protein-2) binds DNA in nuclear matrix attachment regions [21], and influences gene expression by modulating chromatin architecture and acting as a transcriptional co-factor [22,23]. The SATB2 gene is conserved in humans and mice. Structurally, five highly conserved domains are found in SATB2. They are: a ubiquitin-like domain (ULD), a CUT repeat-like (CUTL) domain, two CUT domains (CUT1 and CUT2), and a homeodomain (HOX) [24]. Furthermore, SATB2 contains two distinct nuclear matrix-attachment regions (MARs) and multiple ubiquitin-associated modification sites [25]. As a nuclear matrix protein, SATB2 binds to MARs, regulatory DNA sequences involved in the organization of higher-order chromatin structures [26]. SATB2 utilizes its CUT domains to anchor to the sugar-phosphate backbone of double-stranded DNA physically. This binding action serves as a molecular anchor for chromatin loops, helping to establish the physical organization of the genome. The establishment of anchored loops facilitates the recruitment of coactivators or corepressors, thereby enabling dynamic regulation of gene expression and chromatin modifications [23]. Furthermore, SATB2 functions as a scaffold protein, coordinating the assembly of other DNA-binding proteins at specific sub-nuclear sites to enhance transcriptional regulation [27]. SATB2−/− mice are defective in bone development and osteoblast differentiation [28]. These findings point to multifunctional roles of SATB2, mediating diverse biological processes, including skeletal formation, craniofacial patterning, osteoblast differentiation, nervous system development, and tumor progression [27,28,29].
SATB2 is overexpressed in colorectal, pancreatic, breast, and prostate cancer, neuroendocrine tumors, and hepatocellular carcinoma, suggesting its use as a diagnostic marker for cancer [30,31,32,33,34,35,36,37,38]. In breast cancer, SATB2 mRNA expression is significantly associated with increasing tumor grade and poorer survival [38]. Higher SATB2 expression was correlated with immune cell infiltration [31]. It inhibited T cell cytotoxicity while promoting cell migration in pancreatic cancer, suggesting its potential as a target to enhance pancreatic cancer immunotherapy. However, the tumor-promoting and metastatic roles of SATB2 in mesothelioma have never been examined.
Malignant transformation is a complex process in which a normal cell develops into a cancerous cell. This transformation can occur through several mechanisms, including genetic mutations, changes in cellular regulatory mechanisms, the generation of reactive oxygen species, and the accumulation of mutations that confer a malignant phenotype. This transformation can generate cancer stem cells (CSCs) that express stem cell markers and pluripotency-maintaining factors. Our recent work has demonstrated that overexpression of the SATB2 gene induced malignant transformation in human breast, prostate, colorectal, and pancreatic epithelial cells and hepatocytes, resulting in the generation of functional CSCs [36,37,39,40,41]. These CSCs are responsible for cancer initiation, progression, drug resistance, and chemotherapy failure [42,43,44,45,46,47]. Although the oncogenic role of SATB2 in specific cancers has been demonstrated, its biological functions in the malignant transformation of mesothelial cells have not been examined.
The objectives of this paper were to determine whether the SATB2 gene can induce cellular transformation in mesothelial cells and whether inhibiting its expression in MPM CSCs reversed drug resistance. Our data demonstrated that overexpression of SATB2 in mesothelial cells induced malignant transformation and that inhibiting its expression with shRNA in MPM cells suppressed cell growth, EMT, spheroid formation, and CSC characteristics. Inhibition of SATB2 expression in MPM CSCs by shRNA reversed drug-resistance to cisplatin and pemetrexed. SATB2 can be considered a therapeutic target in MPM, and inhibiting SATB2 in combination with chemotherapy may be a viable option for MPM treatment.
Materials and Methods
Reagents and Cell Culture Conditions
Antibodies against E-Cadherin, N-cadherin, SATB2, cMyc, Oct4, and XIAP were purchased from Cell Signaling Technology, Inc. (Danvers, MA). Anti-β-Actin antibody was purchased from Abcam (Cambridge, MA). Enhanced chemiluminescence (ECL) Western blot detection reagents were purchased from Amersham Life Sciences Inc. (Arlington Heights, IL). Human mesothelioma cell lines H2714, H2452, and H2595, and mesothelial cell line Met5A (CRL-9444) were purchased from American Type Culture Collection (ATCC), Manassas, VA. The Met5A cell line was derived from human adult pleural mesothelial cells. Mesothelioma cells were grown in Dulbecco’s Modified Eagle’s Medium supplemented with 10% fetal bovine serum and antibiotics. Met5A cells were grown in Medium 199 supplemented with FBS (10%), epidermal growth factor (10 ng/ml), hydrocortisone (400 nM), human recombinant insulin (870 nM), and 1% antibiotic-antimycotic solution. Cells were grown in a humidified incubator at 37 °C with 5% CO2.
Immunofluorescence
Cells were plated on coverslips for 24 hr and then fixed with 3.7% paraformaldehyde (Sigma) in PBS for 10 min at room temperature. After fixation, samples were permeabilized with 0.5% Triton X-100 in PBS for 15 min and thereafter blocked with 10% fetal calf serum in PBS containing 0.1% Triton X-100 (Sigma). For SATB2 staining, cells were incubated overnight at 4 °C with an anti-SATB2 antibody (Abcam), followed by 1 hour at room temperature with the secondary antibody. Nuclear DNA was stained with DAPI (Thermo Fisher Scientific). Fluorescent images were acquired using a fluorescent microscope with NIS-Elements software (Nikon).
Motility Assay
We used the scratch motility assay to monitor the horizontal movement of cells, as described elsewhere [48]. Cells were seeded in a 6-well cell culture plates. After a monolayer of cells was established, a scratch was made, resulting in an in vitro wound. Plates were washed twice with PBS and then replaced with cell culture medium. Movement of cells to the scratch area, as single cells from the confluent sides, was monitored. The width of the scratch gap is viewed under the microscope in four separate regions each day until the gap is filled in the untreated control wells.
Transwell Migration Assay
Migration assay was performed as described elsewhere [49]. In brief, mesothelioma cells (1x10⁵) were plated in the top chamber of a 24-well insert (pore size, 8 μm; Corning Costar) and allowed to migrate toward serum-containing medium in the lower chamber. After 24 hrs of incubation, cells were fixed with methanol and stained with 0.1% crystal-violet (Sigma-Aldrich). The number of cells migrated through the membrane was counted under a light microscope (Nikon).
Transwell Invasion Assay
Invasion assay was performed as described elsewhere [49]. In brief, cells (1x10⁵) were plated in the top chamber onto the Matrigel-coated Membrane (24-well insert; pore size, 8 μM; Corning Costar). Cells were plated in medium without serum or growth factors, and medium supplemented with serum was used as a chemoattractant in the lower chamber. The cells were incubated for 48 hours, and a cotton swab removed cells that did not invade through the pores. Cells on the lower surface of the membrane were fixed with methanol and stained with 0.1% crystal-violet, and counted in five independent fields/well under a light microscope (Nikon).
Immunoblotting
Cells were lysed in RIPA buffer (Thermo Fisher), including the following protease and phosphatase inhibitors: Protease Inhibitor cocktail (Sigma), Halt™ Phosphatase Inhibitor cocktail (Thermo Fisher), and phosphatase inhibitor cocktails 2 (Sigma) and 3 (Sigma). Proteins were separated in SDS-PAGE and transferred onto nitrocellulose membrane (Thermo Fisher). Membranes were blocked with 5% dry milk in TBS containing 0.05% Tween-20 at 370C for 2 hours. Nitrocellulose membranes (Amersham Biosciences, Piscataway, NJ, USA) were probed with primary antibody diluted in Tris-buffered saline (1:1000 dilutions) overnight at 4° C with gentle shaking. Proteins were visualized with ECL detection kit (GE Healthcare) as previously described (Thermo Fisher Scientific, Rockford, IL).
Quantitative Real-Time PCR
Total RNA was isolated using a RNeasy Mini Kit (Qiagen, Valencia, CA). Briefly, cDNA was synthesized using cDNA kit from Applied Biosystems according the manufacturer’s protocol. For quantification of gene amplification, Real-time PCR was performed using an ABI 7300 Sequence Detection System with SYBR Green. Target sequences were amplified at 95 °C for 10 min, followed by 40 cycles of 95 °C for 15 s and 60 °C for 1 min. HK-GAPD was used as an endogenous normalization control. All assays were performed in triplicate and were calculated based on ΔΔCt method. The n-fold change in mRNAs expression was determined according to the method of 2-ΔΔCT. PCR primers were designed using PrimerBank (http://pga.mgh.harvard.edu/ primerbank). The primer sequences were published in our earlier papers [36,37,39,40].
Chromatin Immunoprecipitation (ChIP) Assay
Chromatin Immunoprecipitation (ChIP) assay was performed as we described elsewhere [39]. In brief, Protein-DNA complexes were crosslinked with formaldehyde solution (50mM HEPES KOH, pH 7.5, 1mM EDTA, 0.5 mM EGTA, 100 mM NaCl, 11% Formaldehyde) for 10 min at room temperature. Mesothelioma cells were harvested, and cell suspensions were centrifuged. For nuclei purification, cell pellets were washed in PBS, snap-frozen in liquid nitrogen and consecutively incubated in ice-cold hypotonic wash buffer (20 mM HEPES-KOH, pH 7.5, 10% Glycerol, 20 mM KCl, 1 mM DTT, 1 mM EDTA, 1 mM EDTA, 0.1 mM PMSF) including protease inhibitors for 10 min at 4° C and lysis buffer (50 mM HEPES-KOH, pH 7.5, 140 mM NaCl, 10% Glycerol, 0.5% NP-40, 1 mM EDTA, 0.25% Triton X-100, 1mM DTT, 0.1 mM PMSF) with protease inhibitors. Nuclei were washed in ice-cold wash buffer (10 mM Tris-HCl, pH 8, 200 mM NaCl, 1 mM EDTA, 0.1 mM PMSF, 0.5 mM EGTA, 1mM DTT). Chromatin in nuclear extract was sheared by sonication, clarified by centrifugation, and the supernatant was used for immunoprecipitation. Chromatin was incubated overnight with an anti-SATB2 antibody or mouse IgG (Cell Signaling), then precipitated with 5 μl of protein A/G magnetic beads (Thermo Fisher). Protein-DNA complexes were eluted, decrosslinked at 65° C overnight, and after RNase (0.2 mg/ml) and proteinase K (0.2 mg/ml) treatment, the DNA was purified, and the DNA enrichment was measured by PCR using promoter-specific primers.
Statistical Analysis
The unpaired Student’s t-test assessed statistical significance between two groups. One-way ANOVA was used to analyze more than two groups. A two-way ANOVA was performed to analyze cell proliferation across multiple time points. GraphPad Prism 7 and 8 software (GraphPad Software, Inc., San Diego, CA) was used to perform all statistical calculations. Data is presented as mean ± SD, and a P value less than 0.05 was considered statistically significant.
Results
SATB2 Is Highly Expressed in Mesothelioma Cell Lines but Not in Normal Human Mesothelial Cells
We first compared SATB2 expression in normal human mesothelial Met5A cells and mesothelioma cell lines (H2452 and H2595) by qRT-PCR. As shown in Figure 1A, SATB2 is not expressed in Met5A cells. However, it is highly expressed in mesothelioma cell lines. We next examined SATB2 expression by immunocytochemistry (Figure 1B). Met5A did not express SATB2. By comparison, SATB2 expression was observed in H2714, H2452, and H2595 cells. The lowest and highest SATB2 expression levels were observed in H2714 and H2452, respectively. These data suggest that SATB2 expression is tightly regulated in mesothelioma cells and may represent a novel therapeutic target.
Overexpression of SATB2 in Met5A Cells Induces Cellular Transformation and Stemness
The cell transformation characteristics include high/indefinite saturation density, the absence of contact inhibition, less oriented growth, loss of tight junctions, and colony formation. To demonstrate that SATB2 induces cellular transformation and stemness, we overexpressed SATB2 in human normal mesothelial Met5A cells. Lentiviral mediated transduction of SATB2 gene in Met5A (Met5A/SATB2) cells resulted in an increased expression of SATB2 mRNA (Figure 2A). Met5A/SATB2 cells demonstrated enhanced cell growth compared to Met5A/empty vector cells (Figure 2B). We next examined whether SATB2 induces cellular transformation, and transformed cells gained stemness by expressing specific stem cell markers and pluripotency-maintaining factor. Overexpression of SATB2 in Met5A cells (Met5A/SATB2 cDNA) induces cellular transformation as evidenced by the formation of spheroids in suspension (Figure 2C). As expected, normal Met5A cells (Met5A/empty vector) are unable to form spheroids in suspension. Overexpression of SATB2 in Met5A cells resulted in the induction of stem cell markers (CD44, CD133, and CD24) and transcription factors (cMyc, KLF4, Sox2, Oct4, and Nanog) (Figure 2D and E). Overall, these data suggest that SATB2 can induce in vitro cellular transformation in Met5A cells by inducing stemness.
Overexpression of SATB2 in Met5A Cells Induces Epithelial-to-Mesenchymal Transition
Epithelial-to-mesenchymal transition (EMT) is a physiological process by which epithelial cells acquire a mesenchymal phenotype, thereby contributing directly to stemness and cancer cell metastasis [50,51]. We therefore sought to examine whether overexpression of SATB2 in normal Met5A cells enhances cell motility. As shown in Figure 3, overexpression of SATB2 gene in Met5A mesothelial cells enhanced cell motility. During the process of EMT, the expression of EMT transcription factors is induced; as a result, the expression of E-Cadherin is down-regulated, and N-Cadherin is upregulated [50,51]. We therefore compared the expression of E-cadherin, and N-cadherin in MET5A/Empty Vector and MET5A/SATB2 cDNA cells. Overexpression of SATB2 resulted in the inhibition of E-cadherin and upregulation of N-cadherin, both protein and mRNA levels, in MET5A/SATB2 cDNA cells compared to MET5A/Empty Vector cells. Furthermore, overexpression of SATB2 resulted in the induction of EMT transcription factors Slug, Snail, and Zeb1 in MET5A/SATB2 cDNA cells compared to MET5A/Empty Vector cells. These data suggest that the SATB2 gene can induce EMT in MET5A cells.
Inhibition of SATB2 in Mesothelioma Cell Lines Results in Reduced Cell Proliferation, Decreased Colony Formation, and Decreased XIAP Expression
SATB2 plays a crucial role in chromatin remodeling and gene expression regulation, and it is involved in maintaining stemness and promoting cell survival [36,37,39,40]. We next examined whether inhibition of SATB2 attenuates the growth of the mesothelioma H2452 cell line. H2452 cells were transduced with lentiviral particles expressing either scrambled or SATB2 shRNA. Knockdown of SATB2 by shRNA inhibited SATB2 expression, as measured by the qRT-PCR (Figure 4A). H2452/SATB2 shRNA cells had a lower growth rate than H2452/Scrambled cells (Figure 4B). We next examined the effects of SATB2 on colony formation. Inhibition of SATB2 expression by shRNA attenuated colony formation in H2452/SATB2 shRNA cells compared with the H2452/Scrambled group (Figure 4C). These data suggest that SATB2 knockdown in mesothelioma cells can suppress cell proliferation.
Since XIAP is one of the targets of SATB2, we measured the expression of XIAP (mRNA and protein levels), which regulates cell proliferation. H2452/SATB2 shRNA group showed less expression of XIAP compared to that of H2452/scrambled group (Figure 4D and E). These data suggest that inhibition of SATB2 expression in mesothelioma cells can suppress cell proliferation and colony formation by modulating XIAP expression.
Inhibition of SATB2 in Mesothelioma Cell Lines Suppresses Epithelial-Mesenchymal Transition
Epithelial-mesenchymal transition (EMT) is a biological process in which epithelial cells, which are typically structured, possess a defined shape and polarity, are tightly connected by junctions, and are stationary, transform into mesenchymal cells, which are more flexible, loosely coupled, highly mobile, and capable of migration. We next sought to examine the effects of SATB2 inhibition on cell motility, migration, and invasion, as well as on the expression of EMT-related genes and transcription factors. As shown in Figure 5A, H2452/SATB2 shRNA cells demonstrated lower motility than those of H2452/Scrambled cells. Similarly, the H2452/SATB2 shRNA group showed lower migration and invasion compared to the H2452/Scrambled group (Figure 5B and C). We next examine the effects of STAB2 shRNA on Cadherin expression (Figure 5D). SATB2 shRNA upregulated the expression of E-cadherin and downregulated the expression of N-cadherin, a phenomenon known as “cadherin switch”, observed during EMT. Furthermore, SATB2 shRNA inhibited the expression of EMT-inducing transcription factors (Figure 5E). These data suggest that SATB2 inhibition can suppress EMT by modulating cadherin and EMT-related gene expression.
The Side Population of Malignant Mesothelioma Cells H2452 Contains CSCs, and Inhibition of SATB2 Suppresses Stemness in Mesothelioma
Cancer stem cells (CSCs) are a small subpopulation of cells within a tumor mass that behave like stem cells. They can self-renew and generate a diverse range of cell types. CSCs are capable of cancer initiation, progression, drug resistance, and chemotherapy failure (regenerating tumors after chemotherapy). They are highly mobile and adaptable. We therefore isolated a subpopulation of CSCs by growing them in low-attachment plates in stem cell medium. We allowed them to form mesospheres, a process well known for isolating the side population of CSCs. We next examined the effects of SATB2 shRNA on mesosphere formation by CSCs and on the expression of stem cell markers and pluripotency-maintaining factors. As shown in Figure 6A, the H2452/SATB2 shRNA group showed a larger mesosphere than the H2452/Scrambled group. Inhibition of SATB2 expression by shRNA inhibited SATB2 expression in H2452 CSCs (Figure 6B). WE next examined the effects of SATB2 shRNA on the expression of stem cell markers and pluripotency-maintaining factors in CSCs. SATB2 shRNA inhibited the mRNA expression of stem cell markers (CD44, CD133, and CD24) and pluripotency-maintaining factors (cMyc, KLF4, Sox2, Oct4, and Nanog) (Figure 6C and D). Similarly, SATB2 shRNA inhibited the protein expression of cMyc, Oct4, and SATB2 (Figure 6E). These data suggest that inhibiting SATB2 expression can suppress CSC populations, and that SATB2 shRNA can be combined with chemotherapy for the treatment of mesothelioma.
SATB2 Directly Binds to Bcl2, XIAP, KLF4, cMyc, Nanog, and Sox2 in H2452 Cells
SATB2 is a transcription cofactor and chromatin modifier that regulates various biological processes such as stemness, cell proliferation, and survival [35,36,37,39,40,52]. We have shown that SATB2 directly binds the promoters of genes that play significant roles in stemness, cell growth, and survival [35,36,39,40,41]. We have used a Chromatin immunoprecipitation (ChIP) assay to determine which parts of the genome bind to a specific protein of interest. We next examined whether SATB2 directly binds Bcl2, XIAP, KLF4, cMyc, Nanog, and Sox2, which regulate stemness, cell growth, and survival, using ChIP assay in H2452 cells (Figure 7). SATB2 can directly bind to promoters of Bcl2, XIAP, KLF4, cMyc, Nanog, and Sox2. These data suggest that SATB2 can regulate several cellular functions by regulating stemness, cell proliferation, and survival genes.
The Inhibition of SATB2 Expression by shRNA Reverses Chemotherapy Resistance
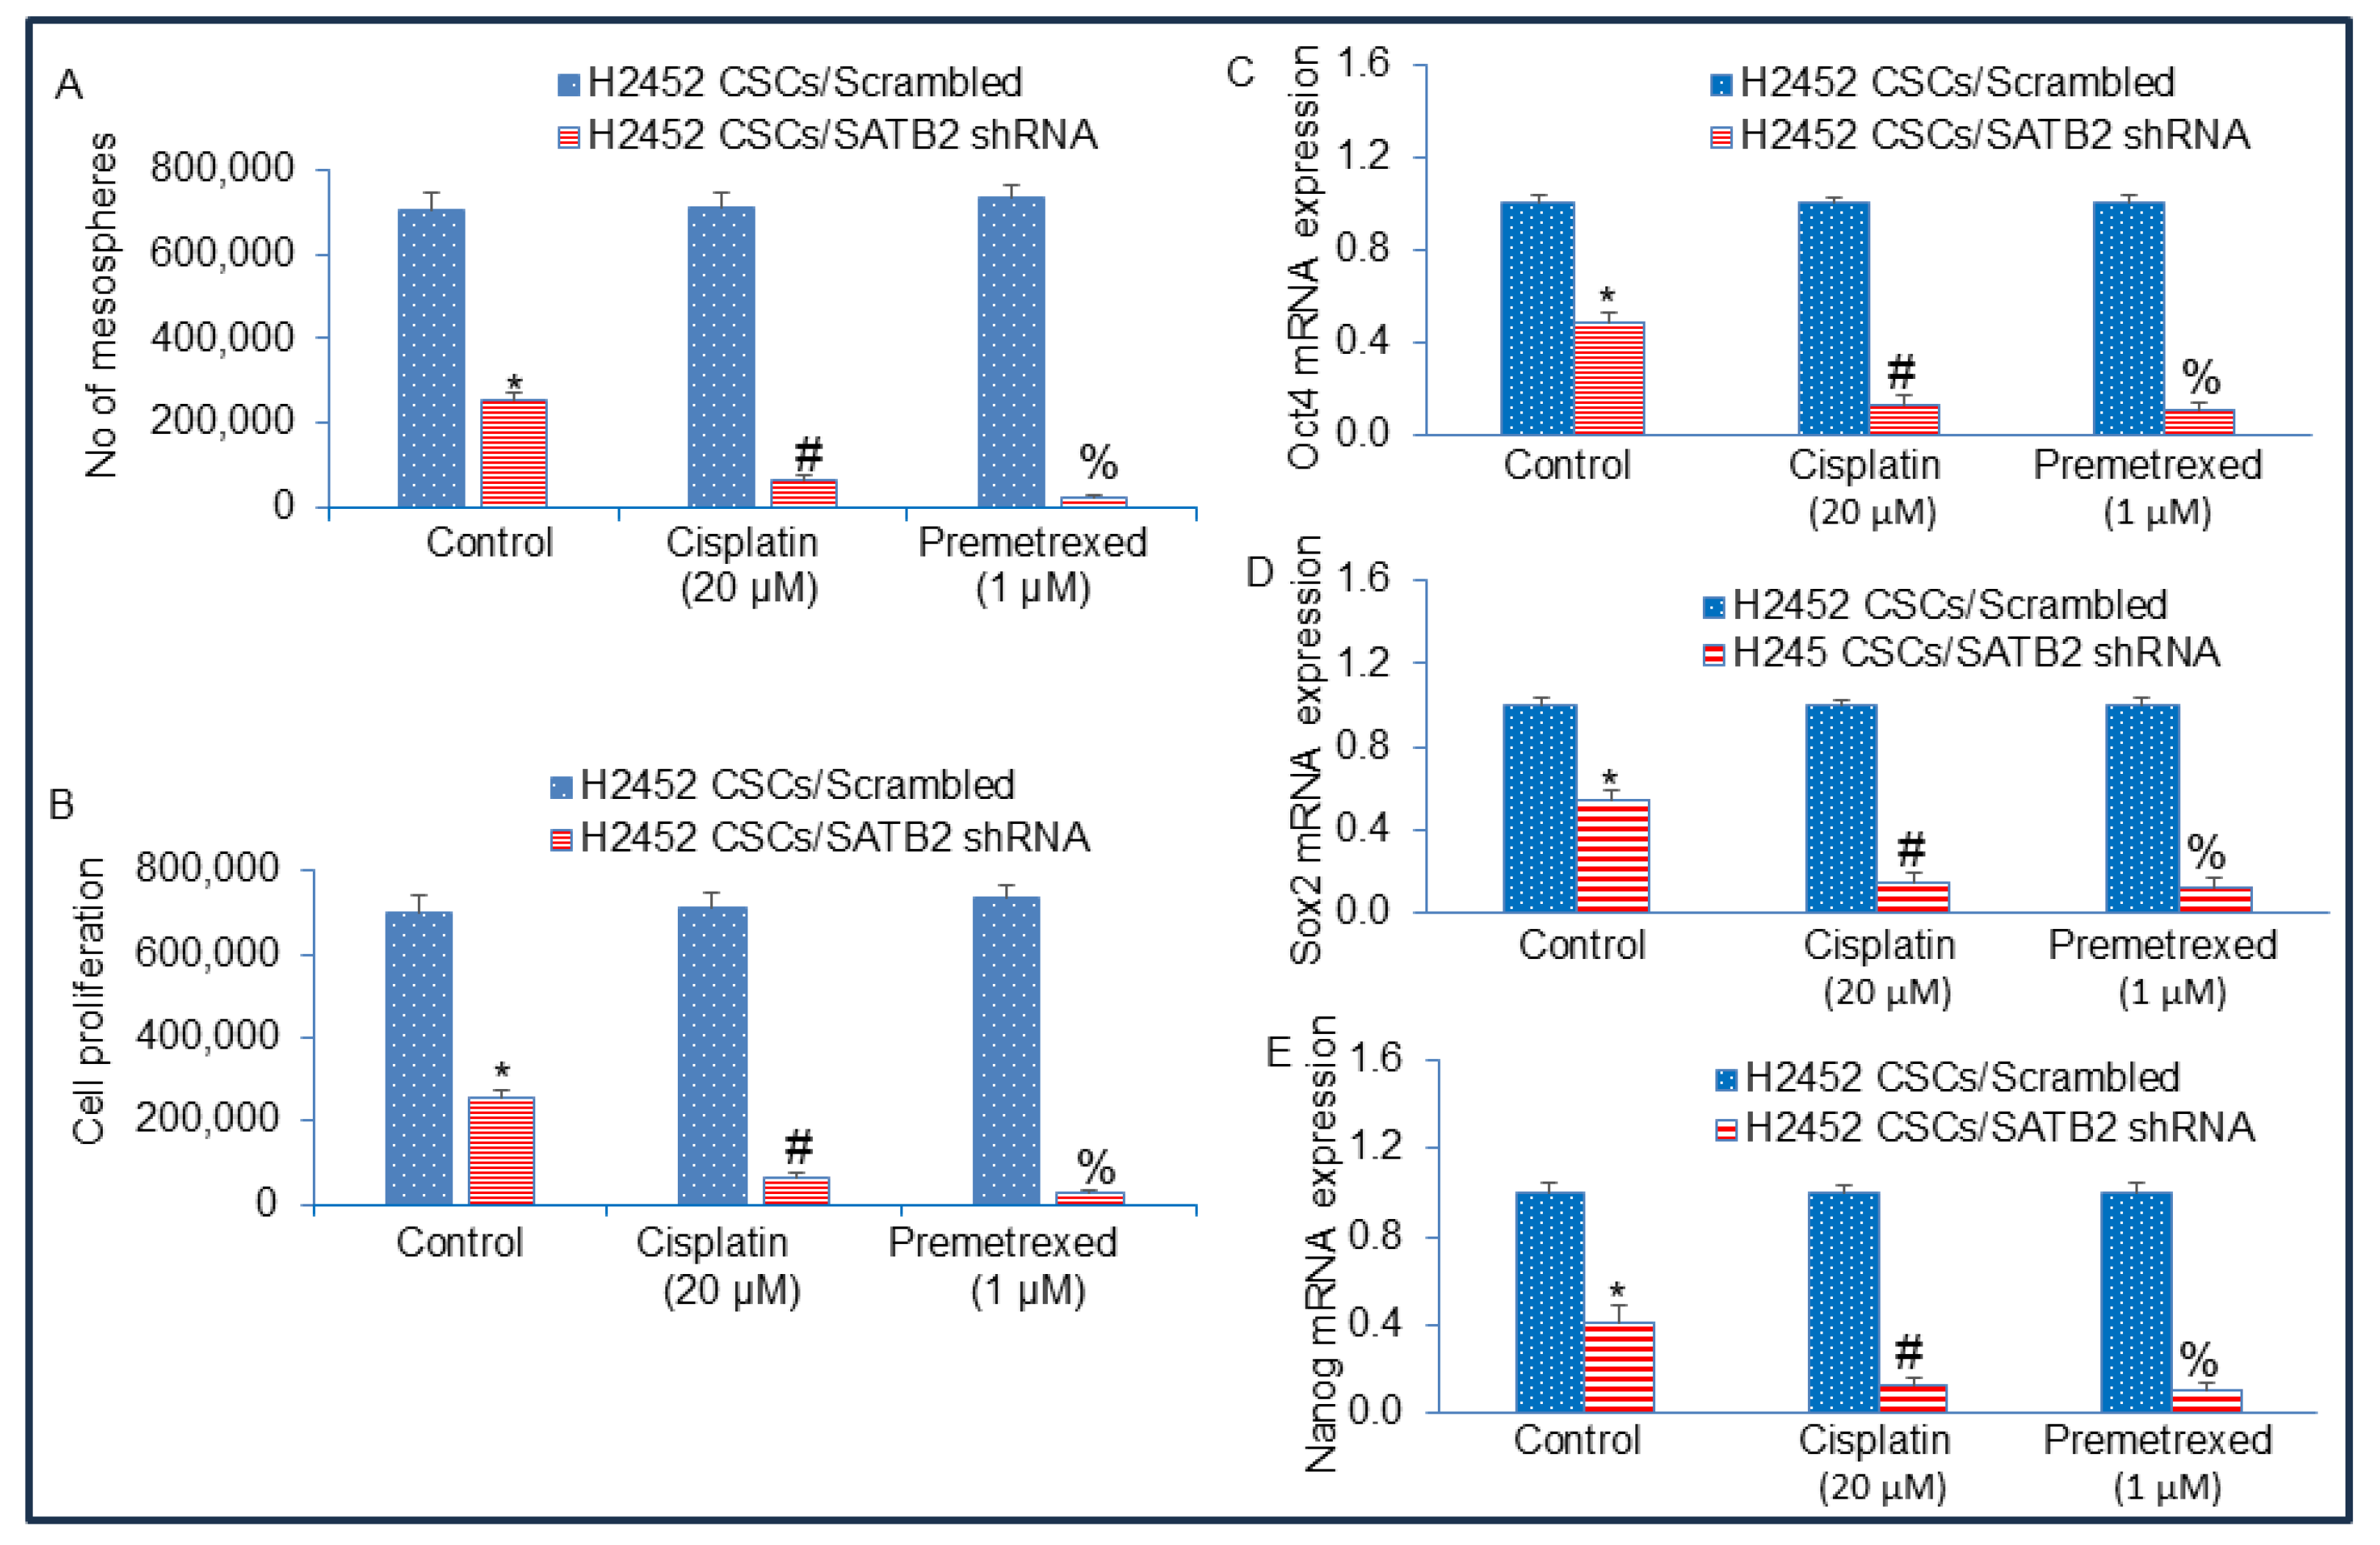
MPM patients are generally treated with cisplatin and premetrexed, but patients suffer chemotherapy failure due to the generation of CSCs. Since CSCs are responsible for drug resistance and chemotherapy failure, we next sought to examine the effects of SATB2 shRNA on cisplatin- and premetrexed-resistance in CSCs isolated from H2452 cells. Cisplatin and premetrexed had no effect on mesosphere formation by CSCs (Figure 8A). In contrast, SATB2 shRNA inhibited mesosphere formation. Furthermore, inhibition of SATB2 expression by shRNA sensitized CSCs to Cisplatin and premetrexed treatment.
We examined the cell viability in the mesosphere formed after drug treatment. Cisplatin or premetrexed did not affect mesospheres’ cell viability. SATB2 shRNA inhibited cell viability in the mesosphere compared to the scrambled group. Furthermore, SATB2 shRNA sensitized CSCs to Cisplatin or premetrexed treatment. These data suggest that (i) Induction of drug sensitivity by SATB2 shRNA resulted in a reduction in mesosphere formation and cell viability, and (ii) CSCs confer drug-resistance to cisplatin and premetrexed, and SATB2 shRNA sensitized CSCs.
Discussion
We have demonstrated, for the first time, that overexpression of SATB2 alone can induce transformation in human mesothelial cells. These transformed cells acquired the phenotypes of CSCs, as they express pluripotency-maintaining factors Nanog, Oct4, Sox2, cMyc, and KlF4. These SATB2-transformed cells formed mesospheres in suspension, a characteristic of CSCs. Also, they acquired EMT characteristics, as evidenced by down-regulation of E-cadherin and up-regulation of N-cadherin, and by enhanced cell motility, migration, and invasion. Inhibition of SATB2 with shRNA sensitized CSCs to cisplatin and premetrexed. Overall, our study suggests that the SATB2 gene alone can induce oncogenic transformation of mesothelial cells, and inhibition of its expression could be beneficial for reversing drug resistance in MPM.
SATB2 as a therapeutic target for some cancers has recently been suggested. We have previously shown that overexpression of SATB2 in human normal pancreatic, breast, colorectal, and prostate epithelial cells, and hepatocytes, induces malignant transformation by generating CSCs [36,37,39,40,53]. In the present study, we have demonstrated that overexpression of SATB2 induces Met5A cell transformation, and these transformed cells exhibit characteristics of CSCs, similar to those found in humans and mice. [54]. We also demonstrate that SATB2 is not expressed in Met5A cells, but it is highly expressed in human mesothelioma cell lines. Furthermore, inhibition of SATB2 expression in mesothelioma cells suppresses cell proliferation, colony formation, cell motility, migration, and invasion. SATB2 interacts with other transcription factors to enhance or repress gene expression [55]. In tumors, SATB2 can serve as a biomarker and a potential therapeutic target due to its role in regulating oncogenic and tumor-suppressor pathways [56]. Our ChIP assays demonstrate that SATB2 directly binds the promoters of Bcl2, Xiap, Bsp, Klf4, Myc, Hoxa2, and Nanog, which plays significant roles in cell proliferation, differentiation, EMT and stemness. Overall, our data suggests that SATB2 can promote EMT and metastasis.
Recent studies in solid organ cancers have shown that CSCs are a subset of malignant precursors responsible for initiation, progression, resistance to cytotoxic drugs, recurrence, and metastasis [57]. Malignant peritoneal mesothelioma tumors harbor stem cells with tumorigenic potential, with significant implications for understanding the cells of origin and tumor progression in MPM [47]. The side population of malignant mesothelioma cells contains CSCs that express CD9, CD24, and CD26, which could serve as novel therapeutic targets [44]. CD24 knockdown in MM CSCs led to loss of mesosphere-forming capacity and reduced tumorigenicity in immunodeficient mice [58]. The OCT4/SOX2 reporter method was used to identify CSC-enriched MM cell subpopulations that were resistant to cisplatin [59]. In another study, the cisplatin plus aldehyde dehydrogenase (ALDH) inhibitor, diethylaminobenzaldehyde (DEAB)-resistant MPM cells showed upregulated mRNA expression for ALDH1A2, ALDH1A3, and CD44, indicating the involvement of these markers in conferring chemoresistance [60]. Similarly, we showed that MPM cells can be enriched for CSCs that expressed stem cell markers and pluripotency-maintaining factors. Furthermore, induction of drug sensitivity by SATB2 shRNA resulted in reduced mesosphere formation and cell viability. Our study provides evidence of putative CSCs conferring drug resistance to cisplatin and pemetrexed in MPM. Targeting these drug-resistant MPM CSCs by SATB2 shRNA may lead to more focused and effective chemotherapeutic regimens for MPM.
In conclusion, our data suggest that SATB2 can induce cellular transformation of normal mesothelial cells into cancer stem-like cells. SATB2 can regulate several cellular functions by modulating the expression of genes involved in malignant transformation, pluripotency, cell survival, proliferation, and EMT. Induction of drug sensitivity by SATB2 shRNA resulted in reduced mesosphere formation and cell viability, and CSCs confer cisplatin- and premetrexed-resistance. Overall, targeting CSCs may be a valuable strategy to inhibit malignant progression. SATB2 can be considered a therapeutic target in MPM, and inhibiting SATB2 in combination with chemotherapy may be a viable option for MPM treatment.
Author Contributions
WY, SS, RS(1), RS(2) = performed the experiments, analyzed the data, and wrote the manuscript. JM, AS, RKS = designed the study, contributed reagents, and approved the manuscript.
Acknowledgments
We thank our lab members for their critical reading of the manuscript.
Conflicts of interest
The authors have declared that no competing interests exist.
References
- Aujayeb, A.; Astoul, P. A Diagnostic Approach to Malignant Pleural Mesothelioma. Pulm Ther 2025, 11, 503–517. [Google Scholar] [CrossRef]
- Bertuccio, F.R.; Montini, S.; Fusco, M.A.; Di Gennaro, A.; Sciandrone, G.; Agustoni, F.; Galli, G.; Bortolotto, C.; Saddi, J.; Baietto, G.; et al. Malignant Pleural Mesothelioma: From Pathophysiology to Innovative Actionable Targets. Cancers 2025, 17. [Google Scholar] [CrossRef]
- Fennell, D.A.; Sekido, Y.; Baas, P.; Husain, A.N.; Curioni-Fontecedro, A.; Lim, E.; Opitz, I.; Simone, C.B., 2nd; Brims, F.; Wong, M.C. Pleural mesothelioma. Nat Rev Dis Primers 2025, 11, 56. [Google Scholar] [CrossRef]
- Jaurand, M.C.; Fleury-Feith, J. Pathogenesis of malignant pleural mesothelioma. Respirology 2005, 10, 2–8. [Google Scholar] [CrossRef]
- Kato, T.; Tanaka, I.; Huang, H.; Okado, S.; Imamura, Y.; Nomata, Y.; Takenaka, H.; Watanabe, H.; Kawasumi, Y.; Nakanishi, K.; et al. Molecular Mechanisms of Tumor Progression and Novel Therapeutic and Diagnostic Strategies in Mesothelioma. Int J Mol Sci 2025, 26. [Google Scholar] [CrossRef]
- Cardillo, G.; Waller, D.; Tenconi, S.; Di Noia, V.; Ricciardi, S. Malignant Pleural Mesothelioma: A 2025 Update. J Clin Med 2025, 14. [Google Scholar] [CrossRef]
- Barrett, J.C.; Lamb, P.W.; Wiseman, R.W. Multiple mechanisms for the carcinogenic effects of asbestos and other mineral fibers. Environ Health Perspect 1989, 81, 81–89. [Google Scholar] [CrossRef]
- Nishimura, S.L.; Broaddus, V.C. Asbestos-induced pleural disease. Clinics in chest medicine 1998, 19, 311–329. [Google Scholar] [CrossRef] [PubMed]
- Remon, J.; Reguart, N.; Corral, J.; Lianes, P. Malignant pleural mesothelioma: new hope in the horizon with novel therapeutic strategies. Cancer Treat Rev 2015, 41, 27–34. [Google Scholar] [CrossRef] [PubMed]
- Rivera, Z.; Strianese, O.; Bertino, P.; Yang, H.; Pass, H.; Carbone, M. The relationship between simian virus 40 and mesothelioma. Current opinion in pulmonary medicine 2008, 14, 316–321. [Google Scholar] [CrossRef] [PubMed]
- Sekido, Y. Molecular pathogenesis of malignant mesothelioma. Carcinogenesis 2013, 34, 1413–1419. [Google Scholar] [CrossRef]
- Stenton, S.C. Asbestos, Simian virus 40 and malignant mesothelioma. Thorax 1997, 52, S52–S57. [Google Scholar] [CrossRef]
- Siegel, R.L.; Kratzer, T.B.; Giaquinto, A.N.; Sung, H.; Jemal, A. Cancer statistics, 2025. CA Cancer J Clin 2025, 75, 10–45. [Google Scholar] [CrossRef] [PubMed]
- Didier, A.J.; Li, M.; Gheeya, J.; Alahmadi, A.; Kaufman, J.; Memmott, R.; He, K.; Shields, P.; Carbone, D.P.; Presley, C.; et al. Trends in Mesothelioma Mortality in the United States Between 1999 and 2020. JTO Clin Res Rep 2025, 6, 100804. [Google Scholar] [CrossRef]
- Stevens, M.E.; Paustenbach, D.J.; Korchevskiy, A. Exposure-response analysis of recent epidemiological data: Proposed risk based occupational exposure limits for various mineral types of asbestos. Chem Biol Interact 2025, 419, 111645. [Google Scholar] [CrossRef]
- Yang, H.; Testa, J.R.; Carbone, M. Mesothelioma epidemiology, carcinogenesis, and pathogenesis. Current treatment options in oncology 2008, 9, 147–157. [Google Scholar] [CrossRef]
- Krevanko, C.F.; Hernandez, A.M.; Gauthier, A.M.; Vahora, M.S.; Lewis, R.C.; Pierce, J.S. Potential influence of cancer history on mesothelioma incidence: an ecologic analysis in the U.S. population. J Public Health (Oxf) 2025. [Google Scholar] [CrossRef] [PubMed]
- Bridda, A.; Padoan, I.; Mencarelli, R.; Frego, M. Peritoneal mesothelioma: a review. MedGenMed 2007, 9, 32. [Google Scholar]
- Bale, S.S.; Kwon, S.J.; Shah, D.A.; Banerjee, A.; Dordick, J.S.; Kane, R.S. Nanoparticle-mediated cytoplasmic delivery of proteins to target cellular machinery. ACS Nano 2010, 4, 1493–1500. [Google Scholar] [CrossRef]
- Garcia-Carbonero, R.; Paz-Ares, L. Systemic chemotherapy in the management of malignant peritoneal mesothelioma. Eur J Surg Oncol 2006, 32, 676–681. [Google Scholar] [CrossRef] [PubMed]
- Rodova, M.; Fu, J.; Watkins, D.N.; Srivastava, R.K.; Shankar, S. Sonic hedgehog signaling inhibition provides opportunities for targeted therapy by sulforaphane in regulating pancreatic cancer stem cell self-renewal. PLoS ONE 2012, 7, e46083. [Google Scholar] [CrossRef]
- Britanova, O.; Akopov, S.; Lukyanov, S.; Gruss, P.; Tarabykin, V. Novel transcription factor Satb2 interacts with matrix attachment region DNA elements in a tissue-specific manner and demonstrates cell-type-dependent expression in the developing mouse CNS. Eur J Neurosci 2005, 21, 658–668. [Google Scholar] [CrossRef] [PubMed]
- Gyorgy, A.B.; Szemes, M.; de Juan Romero, C.; Tarabykin, V.; Agoston, D.V. SATB2 interacts with chromatin-remodeling molecules in differentiating cortical neurons. Eur J Neurosci 2008, 27, 865–873. [Google Scholar] [CrossRef]
- Huang, X.; Chen, Q.; Luo, W.; Pakvasa, M.; Zhang, Y.; Zheng, L.; Li, S.; Yang, Z.; Zeng, H.; Liang, F.; et al. SATB2: A versatile transcriptional regulator of craniofacial and skeleton development, neurogenesis and tumorigenesis, and its applications in regenerative medicine. Genes Dis 2022, 9, 95–107. [Google Scholar] [CrossRef] [PubMed]
- Bell, R.A.V.; Al-Khalaf, M.H.; Brunette, S.; Alsowaida, D.; Chu, A.; Bandukwala, H.; Dechant, G.; Apostolova, G.; Dilworth, F.J.; Megeney, L.A. Chromatin Reorganization during Myoblast Differentiation Involves the Caspase-Dependent Removal of SATB2. Cells 2022, 11. [Google Scholar] [CrossRef]
- Podgornaya, O.I. Nuclear organization by satellite DNA, SAF-A/hnRNPU and matrix attachment regions. Semin Cell Dev Biol 2022, 128, 61–68. [Google Scholar] [CrossRef]
- Dobreva, G.; Chahrour, M.; Dautzenberg, M.; Chirivella, L.; Kanzler, B.; Farinas, I.; Karsenty, G.; Grosschedl, R. SATB2 is a multifunctional determinant of craniofacial patterning and osteoblast differentiation. Cell 2006, 125, 971–986. [Google Scholar] [CrossRef]
- Britanova, O.; Depew, M.J.; Schwark, M.; Thomas, B.L.; Miletich, I.; Sharpe, P.; Tarabykin, V. Satb2 haploinsufficiency phenocopies 2q32-q33 deletions, whereas loss suggests a fundamental role in the coordination of jaw development. Am J Hum Genet 2006, 79, 668–678. [Google Scholar] [CrossRef] [PubMed]
- Britanova, O.; de Juan Romero, C.; Cheung, A.; Kwan, K.Y.; Schwark, M.; Gyorgy, A.; Vogel, T.; Akopov, S.; Mitkovski, M.; Agoston, D.; et al. Satb2 is a postmitotic determinant for upper-layer neuron specification in the neocortex. Neuron 2008, 57, 378–392. [Google Scholar] [CrossRef]
- Magnusson, K.; de Wit, M.; Brennan, D.J.; Johnson, L.B.; McGee, S.F.; Lundberg, E.; Naicker, K.; Klinger, R.; Kampf, C.; Asplund, A.; et al. SATB2 in combination with cytokeratin 20 identifies over 95% of all colorectal carcinomas. Am J Surg Pathol 2011, 35, 937–948. [Google Scholar] [CrossRef]
- Jiang, G.; Zhou, X.; Chen, S.; Zhong, F.; Huang, G.; Wu, B.; Mou, Q.; Jiang, G.; Lin, T. SATB2 plays a critical role in pancreatic cancer cell proliferation, migration and T cell cytotoxicity. Cancer genetics 2025, 296-297, 53–64. [Google Scholar] [CrossRef]
- Helal, N.S.; Maher, S.; Samir, S.; Elmeligy, H.A.; Aboul-Ezz, M.A.; Aboushousha, T.; Moussa, M. Assessing the diagnostic potential of SATB2 and beta-catenin as biomarkers and therapeutic targets in pancreatic ductal adenocarcinoma. J Cancer Res Clin Oncol 2025, 151, 56. [Google Scholar] [CrossRef]
- Ladenheim, A.; Zheng, J.X.; Teklu, A.; Matsukuma, K. PCSK2 can be Useful in a Panel Approach to Distinguish Foregut and Midgut Neuroendocrine Tumors. International journal of surgical pathology 2025, 33, 76–84. [Google Scholar] [CrossRef]
- Roy, S.K.; Shrivastava, A.; Srivastav, S.; Shankar, S.; Srivastava, R.K. SATB2 is a novel biomarker and therapeutic target for cancer. J Cell Mol Med 2020, 24, 11064–11069. [Google Scholar] [CrossRef]
- Yu, W.; Roy, S.K.; Ma, Y.; LaVeist, T.A.; Shankar, S.; Srivastava, R.K. Higher expression of SATB2 in hepatocellular carcinoma of African Americans determines more aggressive phenotypes than those of Caucasian Americans. J Cell Mol Med 2019, 23, 7999–8009. [Google Scholar] [CrossRef] [PubMed]
- Yu, W.; Srivastava, R.; Srivastava, S.; Ma, Y.; Shankar, S.; Srivastava, R.K. Oncogenic Role of SATB2 In Vitro: Regulator of Pluripotency, Self-Renewal, and Epithelial-Mesenchymal Transition in Prostate Cancer. Cells 2024, 13. [Google Scholar] [CrossRef]
- Yu, W.; Ma, Y.; Ochoa, A.C.; Shankar, S.; Srivastava, R.K. Cellular transformation of human mammary epithelial cells by SATB2. Stem Cell Res 2017, 19, 139–147. [Google Scholar] [CrossRef]
- Patani, N.; Jiang, W.; Mansel, R.; Newbold, R.; Mokbel, K. The mRNA expression of SATB1 and SATB2 in human breast cancer. Cancer Cell Int 2009, 9, 18. [Google Scholar] [CrossRef] [PubMed]
- Yu, W.; Ma, Y.; Shankar, S.; Srivastava, R.K. Role of SATB2 in human pancreatic cancer: Implications in transformation and a promising biomarker. Oncotarget 2016, 7, 57783–57797. [Google Scholar] [CrossRef] [PubMed]
- Yu, W.; Ma, Y.; Shankar, S.; Srivastava, R.K. SATB2/beta-catenin/TCF-LEF pathway induces cellular transformation by generating cancer stem cells in colorectal cancer. Scientific reports 2017, 7, 10939. [Google Scholar] [CrossRef]
- Yu, W.; Ma, Y.; Shrivastava, S.K.; Srivastava, R.K.; Shankar, S. Chronic alcohol exposure induces hepatocyte damage by inducing oxidative stress, SATB2 and stem cell-like characteristics, and activating lipogenesis. J Cell Mol Med 2022, 26, 2119–2131. [Google Scholar] [CrossRef]
- Chew, S.H.; Toyokuni, S. Malignant mesothelioma as an oxidative stress-induced cancer: An update. Free Radic Biol Med 2015, 86, 166–178. [Google Scholar] [CrossRef]
- Cortes-Dericks, L.; Galetta, D. An Overview of Cellular and Molecular Determinants Regulating Chemoresistance in Pleural Mesothelioma. Cancers 2025, 17. [Google Scholar] [CrossRef]
- Ghani, F.I.; Yamazaki, H.; Iwata, S.; Okamoto, T.; Aoe, K.; Okabe, K.; Mimura, Y.; Fujimoto, N.; Kishimoto, T.; Yamada, T.; et al. Identification of cancer stem cell markers in human malignant mesothelioma cells. Biochem Biophys Res Commun 2011, 404, 735–742. [Google Scholar] [CrossRef] [PubMed]
- Kai, K.; D’Costa, S.; Yoon, B.I.; Brody, A.R.; Sills, R.C.; Kim, Y. Characterization of side population cells in human malignant mesothelioma cell lines. Lung Cancer 2010, 70, 146–151. [Google Scholar] [CrossRef]
- Thellung, S.; Favoni, R.E.; Wurth, R.; Nizzari, M.; Pattarozzi, A.; Daga, A.; Florio, T.; Barbieri, F. Molecular Pharmacology of Malignant Pleural Mesothelioma: Challenges and Perspectives from Preclinical and Clinical Studies. Curr Drug Targets 2015. [Google Scholar] [CrossRef] [PubMed]
- Varghese, S.; Whipple, R.; Martin, S.S.; Alexander, H.R. Multipotent cancer stem cells derived from human malignant peritoneal mesothelioma promote tumorigenesis. PLoS One 2012, 7, e52825. [Google Scholar] [CrossRef] [PubMed]
- Fu, J.; Rodova, M.; Nanta, R.; Meeker, D.; Van Veldhuizen, P.J.; Srivastava, R.K.; Shankar, S. NPV-LDE-225 (Erismodegib) inhibits epithelial mesenchymal transition and self-renewal of glioblastoma initiating cells by regulating miR-21, miR-128, and miR-200. Neuro Oncol 2013, 15, 691–706. [Google Scholar] [CrossRef]
- Fu, J.; Rodova, M.; Roy, S.K.; Sharma, J.; Singh, K.P.; Srivastava, R.K.; Shankar, S. GANT-61 inhibits pancreatic cancer stem cell growth in vitro and in NOD/SCID/IL2R gamma null mice xenograft. Cancer Lett 2013, 330, 22–32. [Google Scholar] [CrossRef]
- Iwatsuki, M.; Mimori, K.; Yokobori, T.; Ishi, H.; Beppu, T.; Nakamori, S.; Baba, H.; Mori, M. Epithelial-mesenchymal transition in cancer development and its clinical significance. Cancer Sci 2010, 101, 293–299. [Google Scholar] [CrossRef]
- Thiery, J.P.; Acloque, H.; Huang, R.Y.; Nieto, M.A. Epithelial-mesenchymal transitions in development and disease. Cell 2009, 139, 871–890. [Google Scholar] [CrossRef]
- Rosenfeld, J.A.; Ballif, B.C.; Lucas, A.; Spence, E.J.; Powell, C.; Aylsworth, A.S.; Torchia, B.A.; Shaffer, L.G. Small deletions of SATB2 cause some of the clinical features of the 2q33.1 microdeletion syndrome. PLoS ONE 2009, 4, e6568. [Google Scholar] [CrossRef] [PubMed]
- Yu, W.; Ma, Y.; Shankar, S.; Srivastava, R.K. Chronic ethanol exposure of human pancreatic normal ductal epithelial cells induces cancer stem cell phenotype through SATB2. J Cell Mol Med 2018, 22, 3920–3928. [Google Scholar] [CrossRef] [PubMed]
- Shankar, S.; Nall, D.; Tang, S.N.; Meeker, D.; Passarini, J.; Sharma, J.; Srivastava, R.K. Resveratrol inhibits pancreatic cancer stem cell characteristics in human and KrasG12D transgenic mice by inhibiting pluripotency maintaining factors and epithelial-mesenchymal transition. PLoS ONE 2011, 6, e16530. [Google Scholar] [CrossRef]
- Zhou, L.Q.; Wu, J.; Wang, W.T.; Yu, W.; Zhao, G.N.; Zhang, P.; Xiong, J.; Li, M.; Xue, Z.; Wang, X.; et al. The AT-rich DNA-binding protein SATB2 promotes expression and physical association of human (G)gamma- and (A)gamma-globin genes. J Biol Chem 2012, 287, 30641–30652. [Google Scholar] [CrossRef]
- Cheng, G.; Tian, C.; Wang, W.; Zhou, Y.; Wang, X.; Zhang, L. Advances in research on SATB2 and its role in tumor development. Cell Biosci 2025, 15, 111. [Google Scholar] [CrossRef]
- Favoni, R.E.; Daga, A.; Malatesta, P.; Florio, T. Preclinical studies identify novel targeted pharmacological strategies for treatment of human malignant pleural mesothelioma. Br J Pharmacol 2012, 166, 532–553. [Google Scholar] [CrossRef] [PubMed]
- Pasdar, E.A.; Smits, M.; Stapelberg, M.; Bajzikova, M.; Stantic, M.; Goodwin, J.; Yan, B.; Stursa, J.; Kovarova, J.; Sachaphibulkij, K.; et al. Characterisation of mesothelioma-initiating cells and their susceptibility to anti-cancer agents. PLoS One 2015, 10, e0119549. [Google Scholar] [CrossRef]
- Blum, W.; Pecze, L.; Felley-Bosco, E.; Wu, L.; de Perrot, M.; Schwaller, B. Stem Cell Factor-Based Identification and Functional Properties of In Vitro-Selected Subpopulations of Malignant Mesothelioma Cells. Stem Cell Reports 2017, 8, 1005–1017. [Google Scholar] [CrossRef]
- Cortes-Dericks, L.; Froment, L.; Boesch, R.; Schmid, R.A.; Karoubi, G. Cisplatin-resistant cells in malignant pleural mesothelioma cell lines show ALDH(high)CD44(+) phenotype and sphere-forming capacity. BMC Cancer 2014, 14, 304. [Google Scholar] [CrossRef]
Figure 1.
The expression of SATB2 in Met5A, and mesothelioma cell lines. (A), Expression of SATB2 mRNA in human normal mesothelial Met5A cells and mesothelioma cell lines. RNA was isolated, and qRT-PCR was used to measure SATB2 expression. GAPDH was used as an internal control. Data represent mean (n = 4) ± SD. * = significantly different from Met5A (P < 0.05). (B), SATB2 expression by immunocytochemistry. Mesothelial and mesothelioma Met5A, H2714, H2452, and H2595 cells were grown in coverslips, fixed, and stained with anti-SATB2 antibody (Abcam) for 24 hr at 4 0C. Cells were then stained with secondary antibody and DAPI. Coverslips were mounted onto the glass slides and visualized under a fluorescence microscope (Nikon). Green color = SATB2, Blue color = Nuclei.
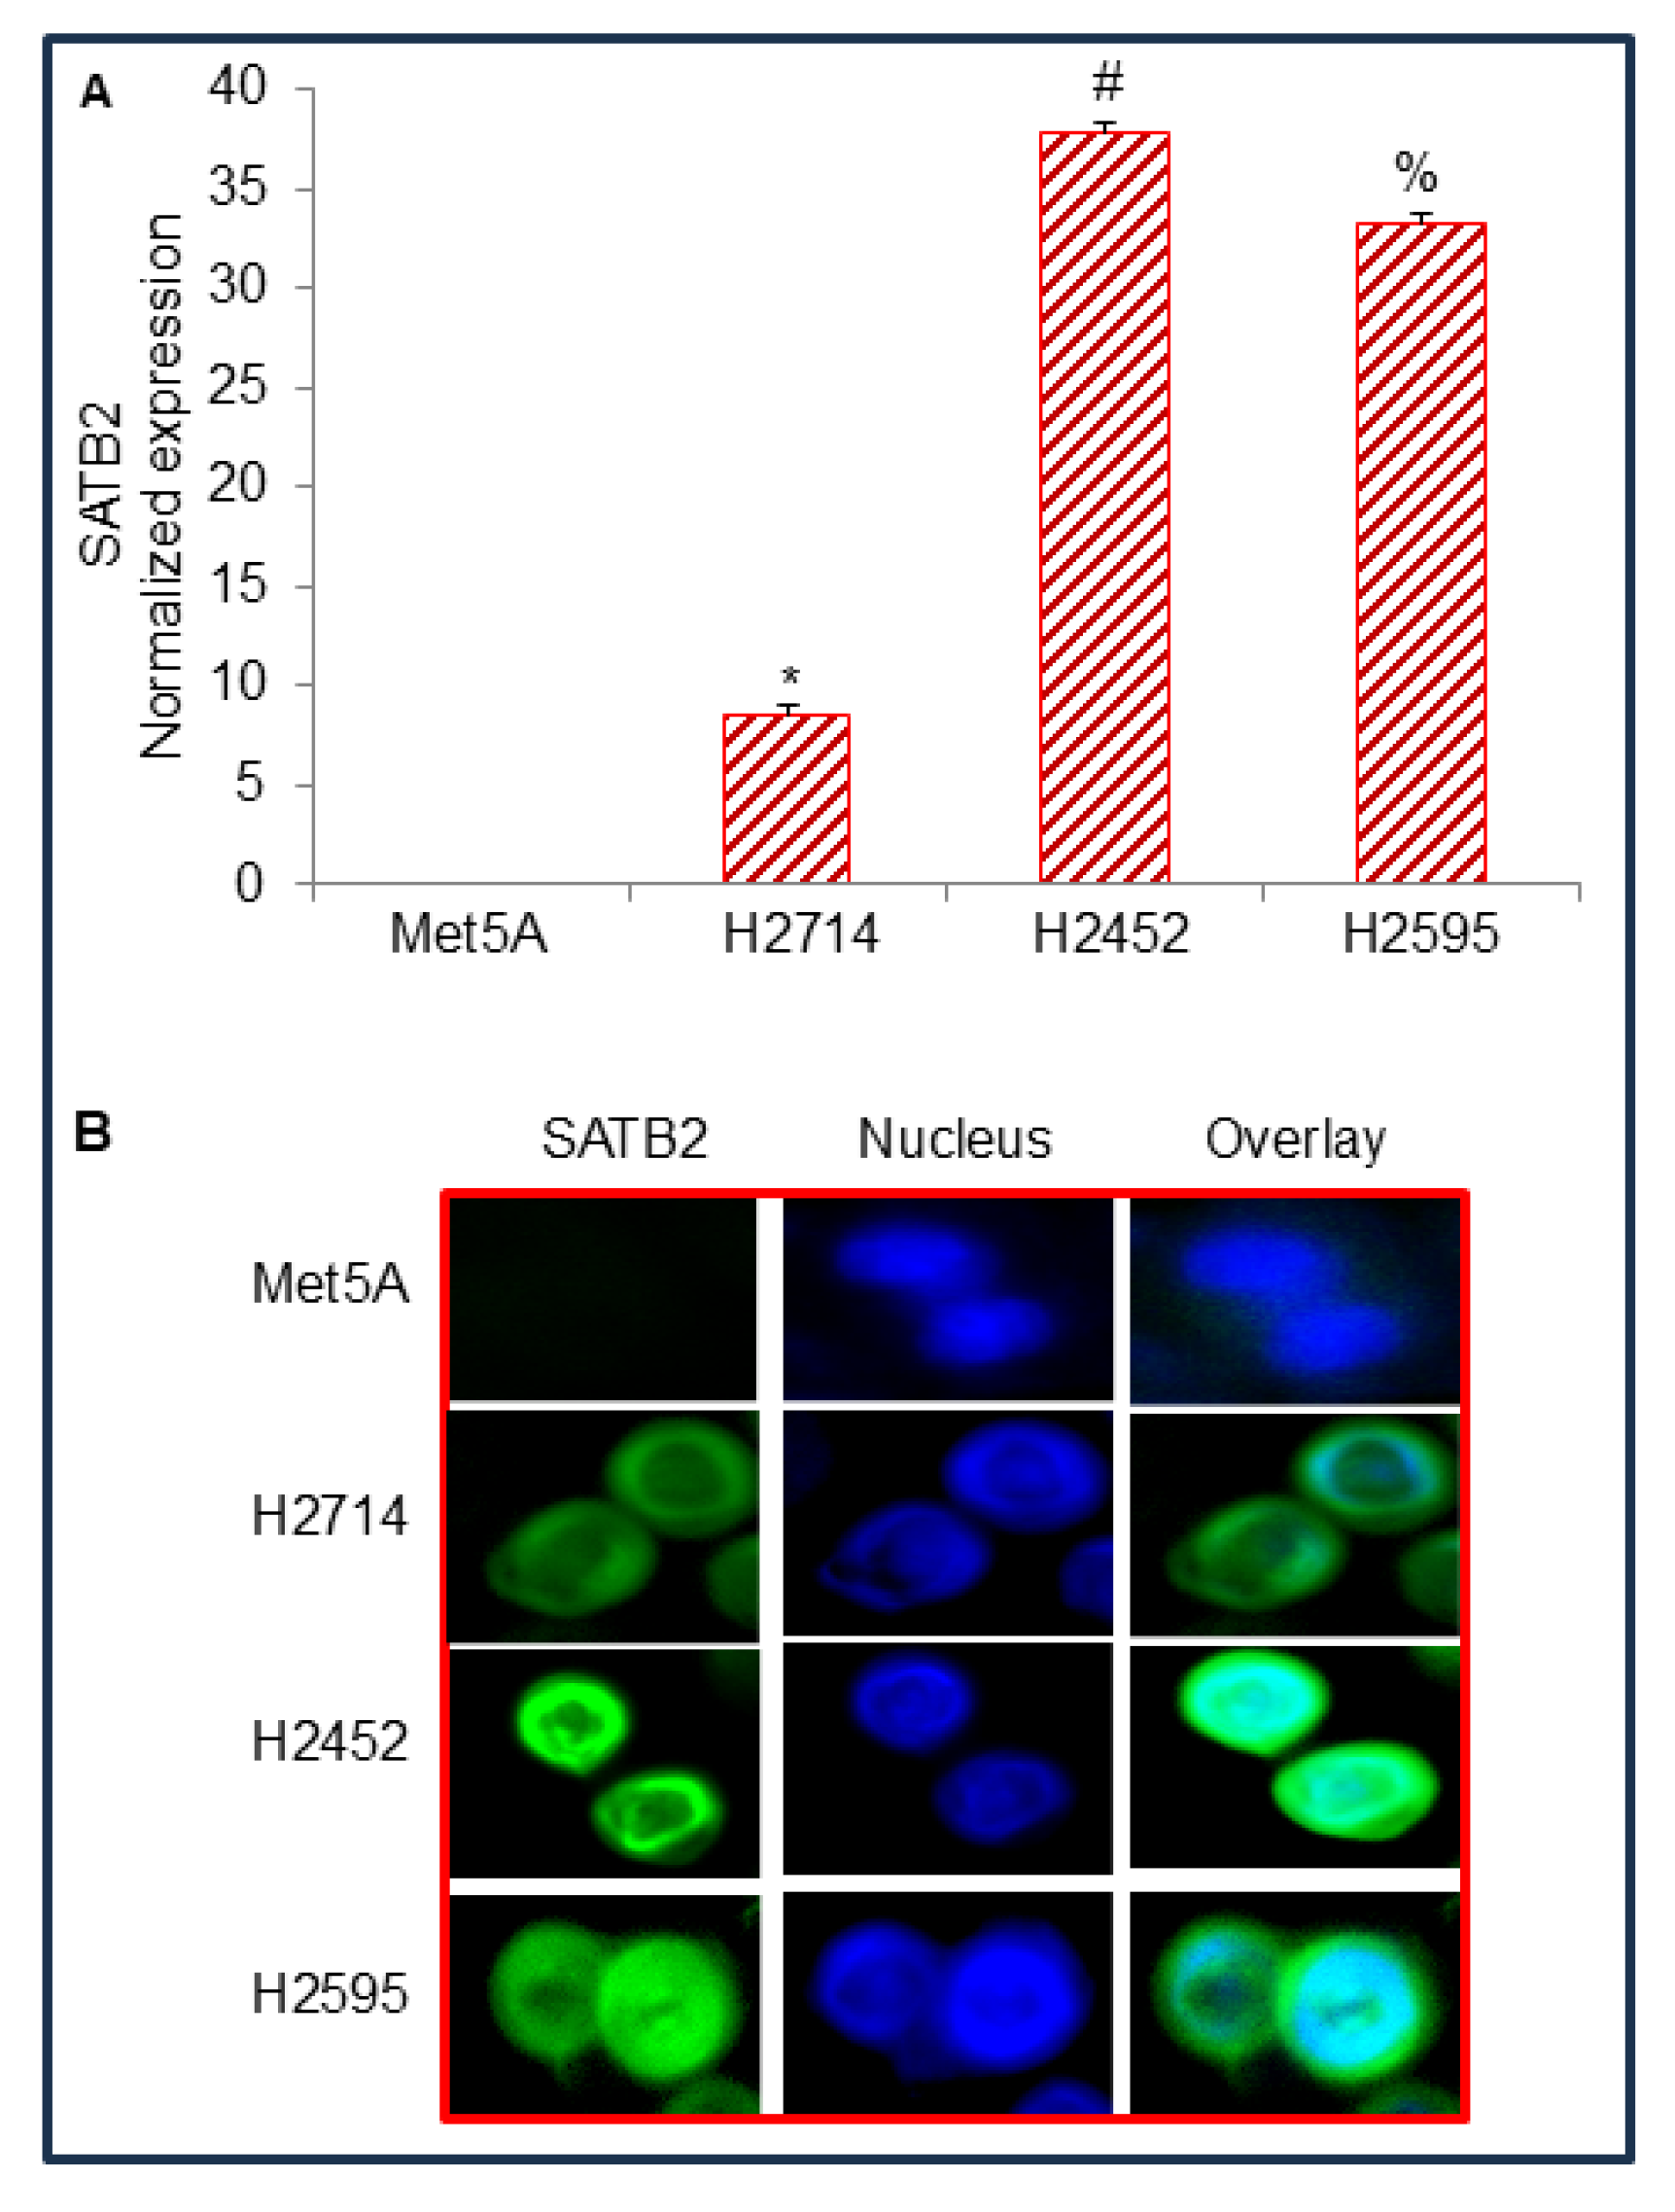
Figure 2.
Overexpression of SATB2 in Met5A cells induces cellular transformation and stemness. (A) Met5A cells were stably transduced with lentiviral particles expressing either empty vector or SATB2 cDNA. QRT-PCR measured SATB2 expression. Data represent mean (n= 4) ± SD. * = significantly different from each other, P < 0.05. (B), Cell proliferation. Met5A/Empty Vector and Met5A/SATB2 cDNA cells were grown, and cell proliferation was measured over 6 days. *, # and % = significantly different from respective empty vector group, P < 0.05. (C) Spheroid formation. Spheroid formation by Met5A/Empty Vector and Met5A/SATB2 cDNA cells in suspension was measured as we described elsewhere [37,39]. Mesospheres formed in 3 weeks were photographed. Cells transduced with an empty vector did not form any mesospheres. (D) RNA was isolated from Met5A/Empty Vector and Met5A/SATB2 cDNA cells. The expression of stem cell markers CD44, CD133, and CD24 was measured by qRT-PCR analysis. * = significantly different from Met5A/Empty Vector group (P < 0.05). Gene expression of Empty Vector was normalized to 1. (E) RNA was isolated from Met5A/Empty Vector and Met5A/SATB2 cDNA cells. The expression of pluripotency-maintaining factors (cMyc, KLF4, Sox2, Oct4, and Nanog) was measured by qRT-PCR analysis. * = significantly different from Met5A/Empty Vector group (P < 0.05).
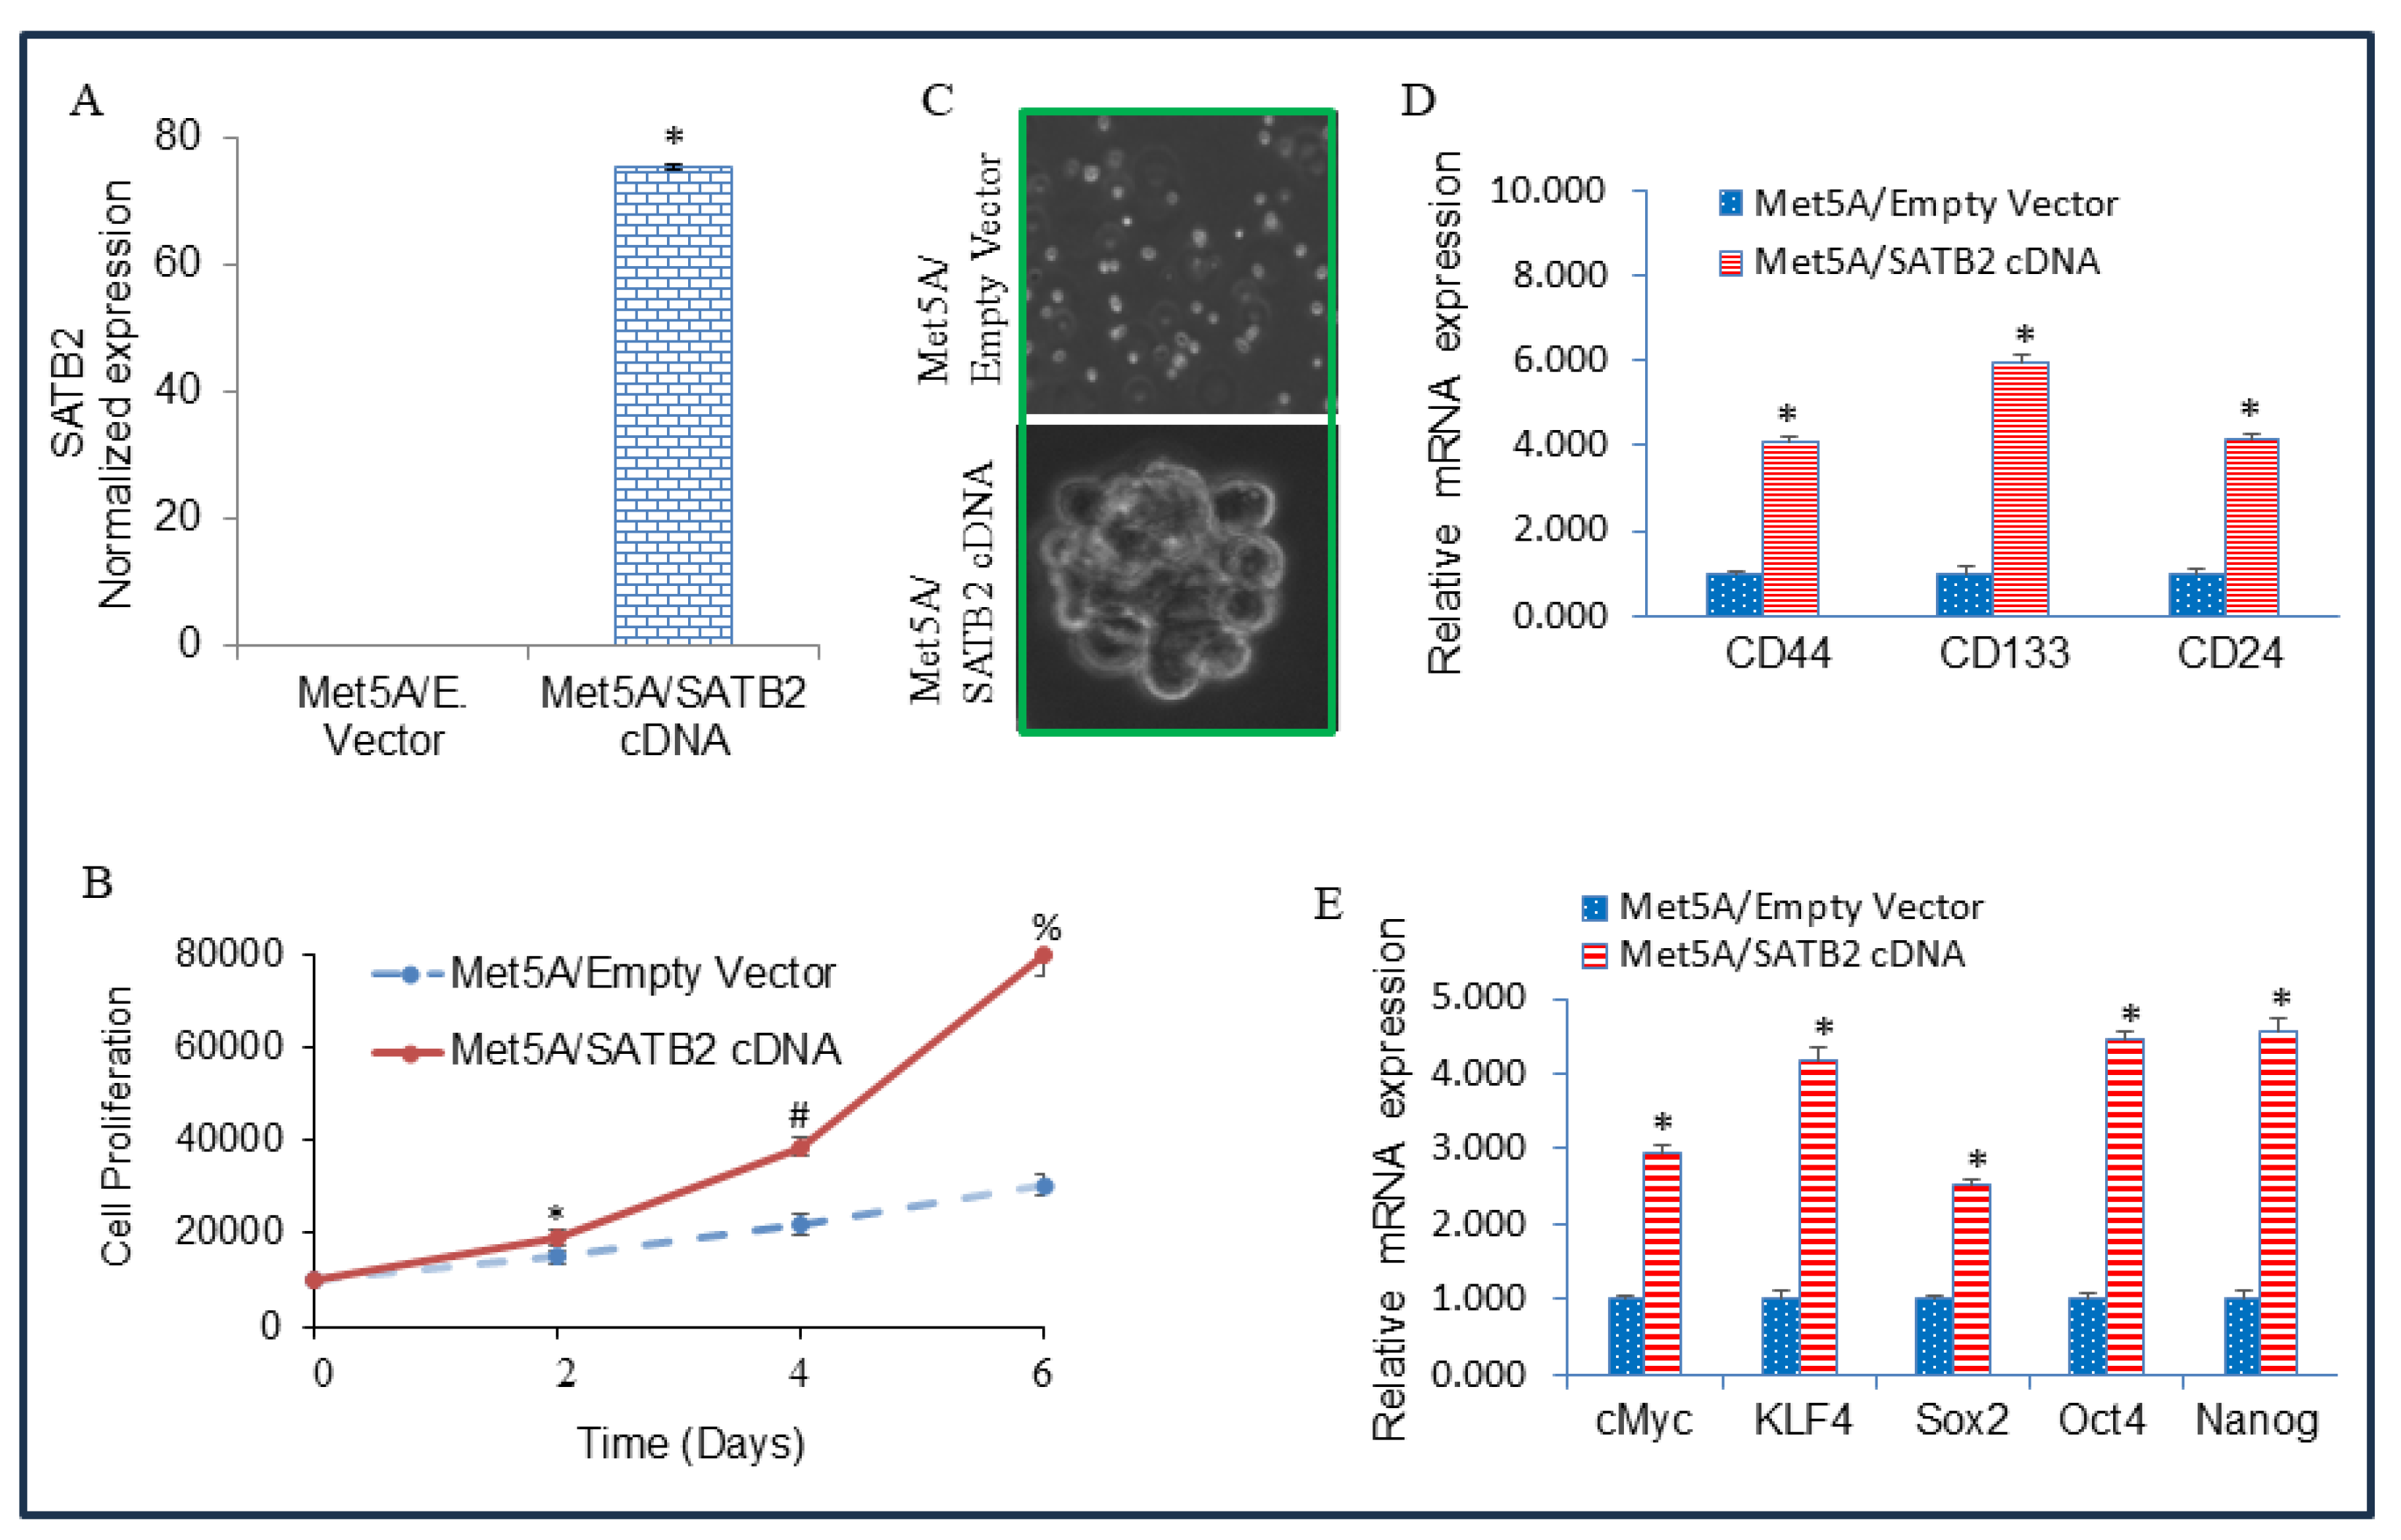
Figure 3.
Overexpression of SATB2 in MET5A cells induces EMT characteristics (A) Cell Motility assay. MET5A/Empty Vector and MET5A/SATB2 cDNA cells were grown in petri dishes. After cell attachment, scratch lines were created using fine pipette tips in both groups. Phase-contrast images of scratched dishes were captured at 0 h and 24 h. (B), Protein expression of Cadherins. Western blot analysis was performed to measure the expression of E-cadherin and N-cadherin in MET5A/Empty Vector and MET5A/SATB2 cDNA cells. β-actin was used as a loading control. (C) mRNA expression of Cadherins in MET5A/Empty Vector and MET5A/SATB2 cDNA cells. RNA was isolated, and the expression of E-cadherin and N-cadherin was measured by qRT-PCR analysis. Data represent mean (n = 4) ± SD. * = significantly different from MET5A/Empty Vector (P < 0.05). Gene expression of the Empty Vector group was normalized to 1. (D) Expression of EMT-related transcription factors in MET5A/Empty Vector and MET5A/SATB2 cDNA cells. RNA was isolated, and the expression of Snail, Slug, and Zeb1 was measured by qRT-PCR analysis. Data represent mean (n = 4) ± SD. * = significantly different from MET5A/Empty Vector (P < 0.05).
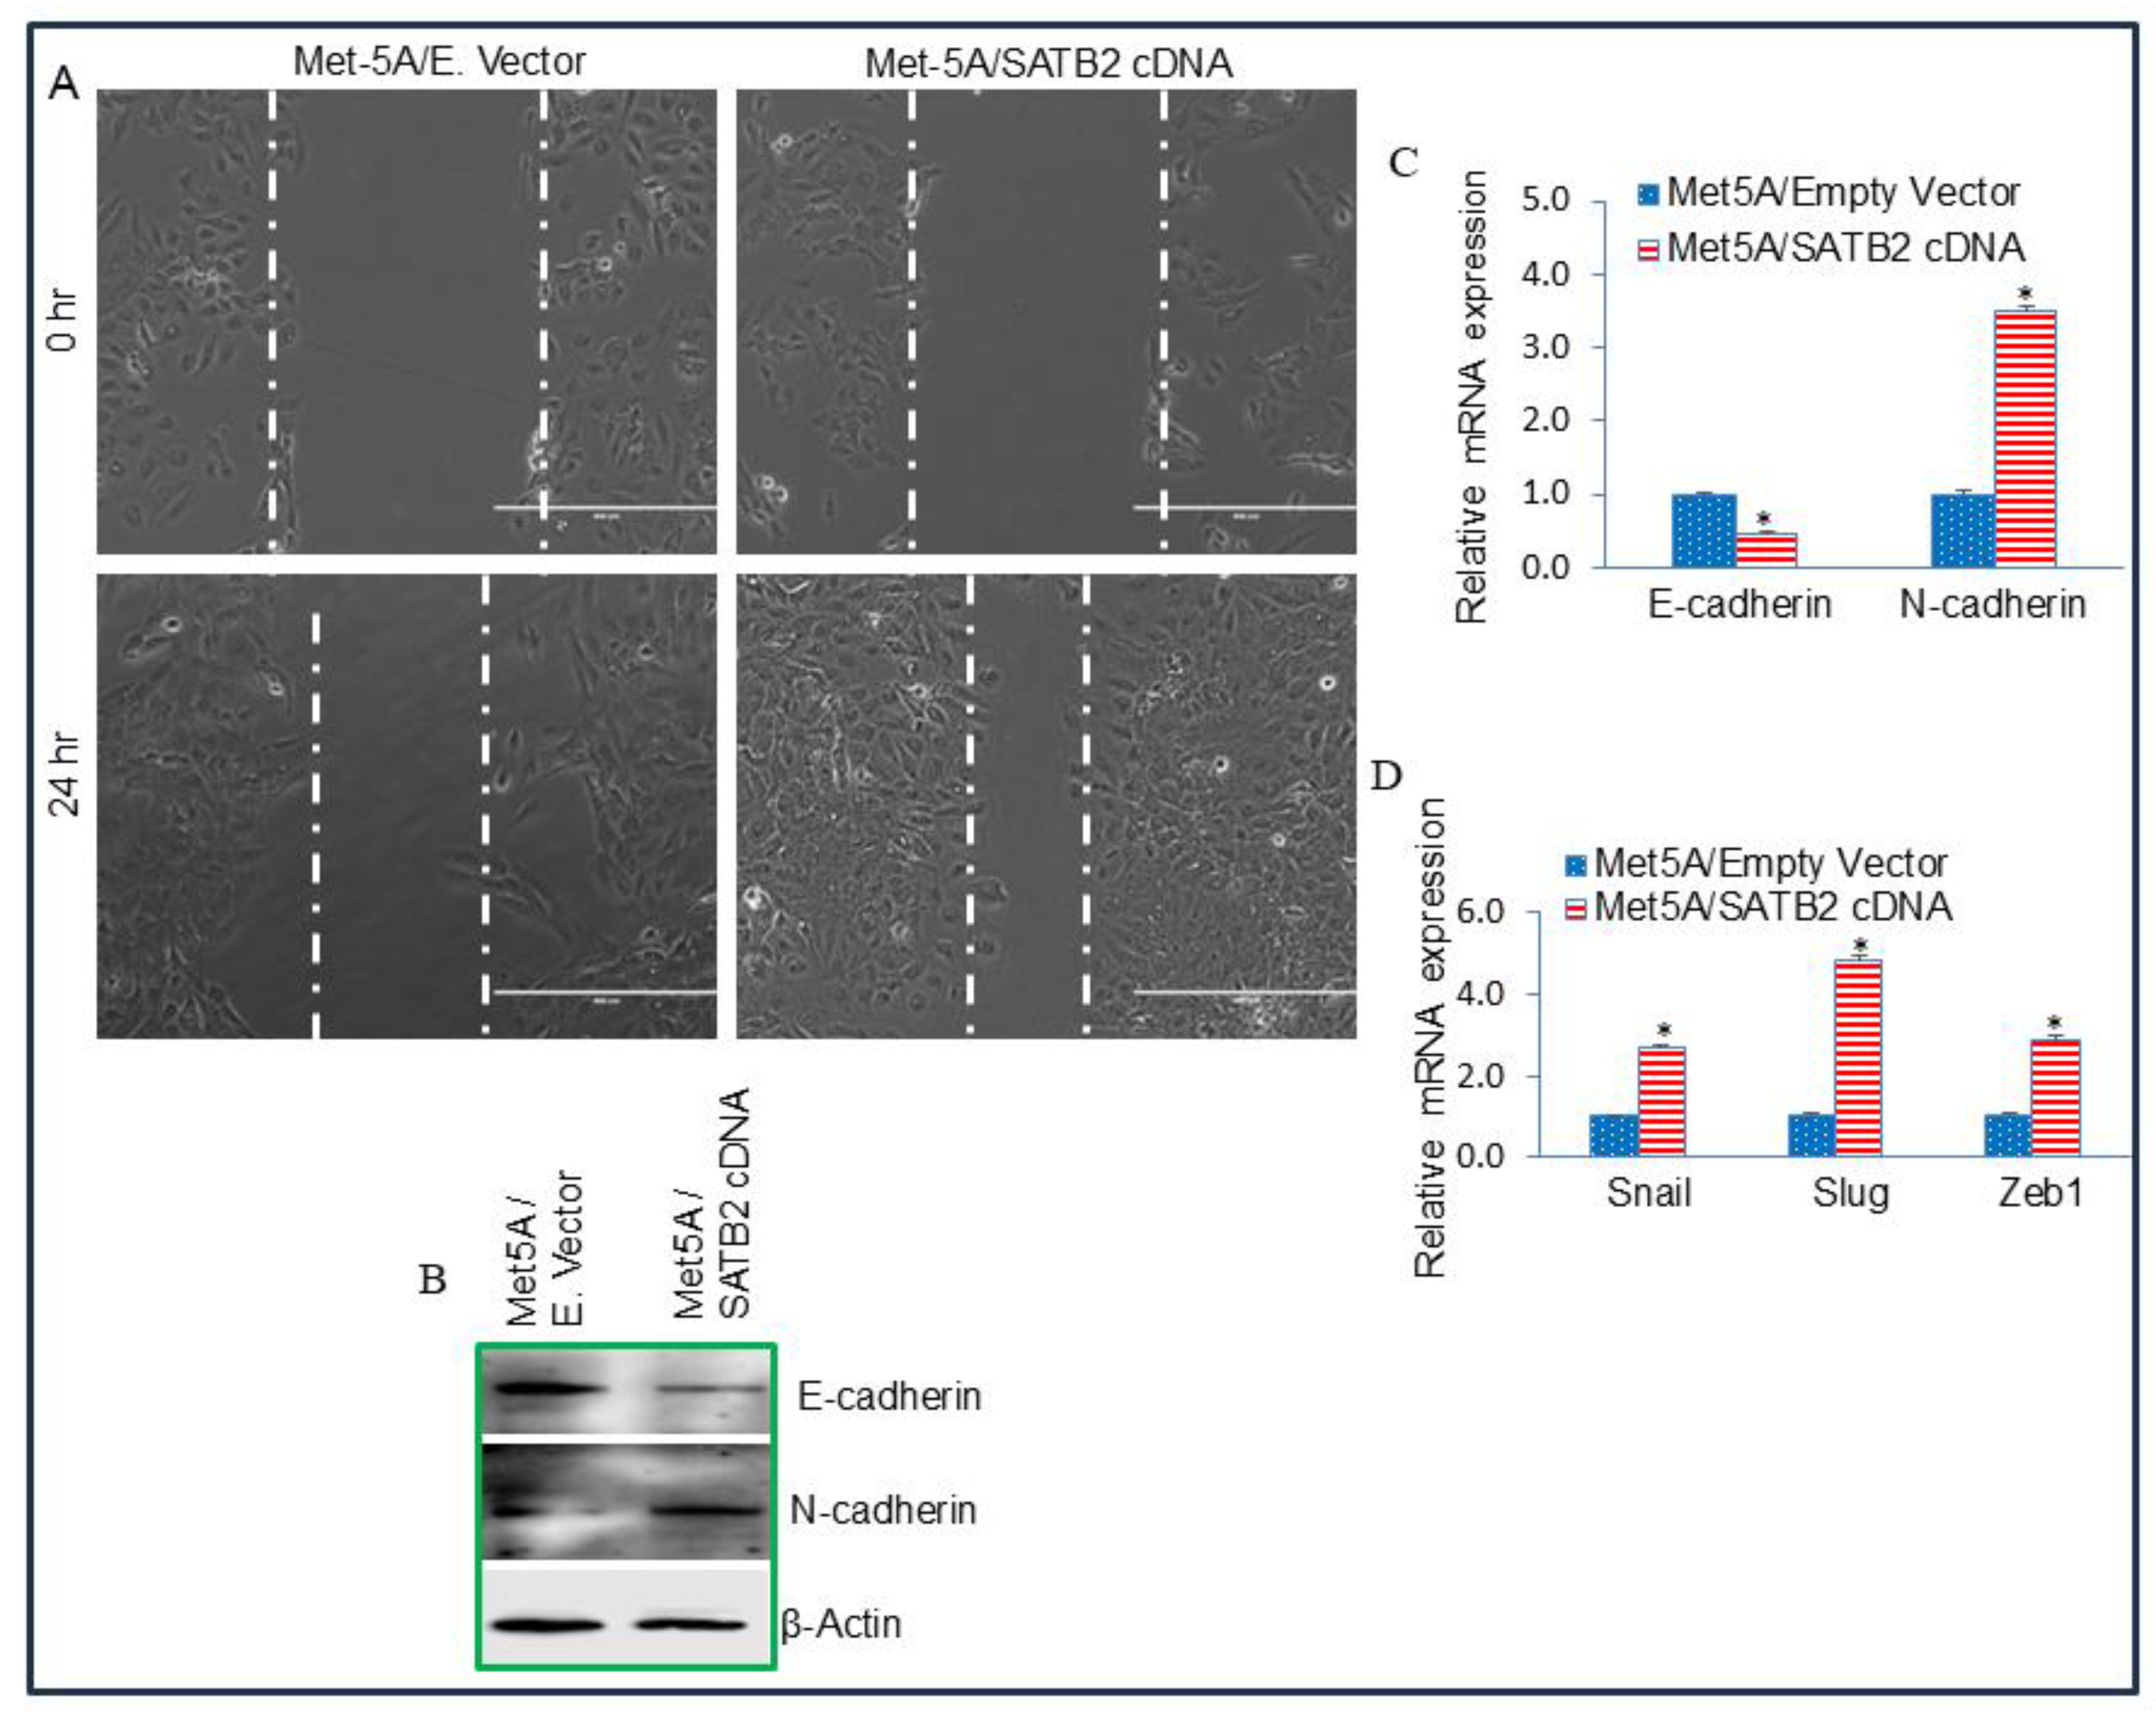
Figure 4.
SATB2 shRNA inhibits cell proliferation, colony formation, and XIAP expression in H2452/Scrambled and H2452/SATB2 cells. (A), SATB2 expression. H2452 cells were transduced with lentiviral particles expressing either scrambled or SATB2 shRNA (a mixture targeting four sites, Thermo Fisher). qRT-PCR was performed to measure SATB2 expression. Data represent mean (n = 4) ± SD. * = significantly different from H2452/Scrambled group (P < 0.05). (B), Cell proliferation of H2452/Scrambled and H2452/SATB2 shRNA groups was measured over 6-day period. *, # and @ = significantly different from H2452/Scrambled group (P < 0.05). (C), Colony formation Assay. H2452/Scrambled and H2452/SATB2 shRNA cells were seeded, and colonies formed at 21 days were photographed. (D), Expression of XIAP mRNA. RNA was isolated from H2452 CSCs/Scrambled and H2452 CSCs/SATB2 shRNA cells. XIAP expression was measured by qRT-PCR. GAPDH was used as an internal control. * = significantly different between groups (P < 0.05). (E), Expression of XIAP protein. Crude protein was isolated from H2452/Scrambled and H2452/SATB2 shRNA cells, and the Western blot analysis was performed to measure XIAP expression. β-actin was used as a loading control.
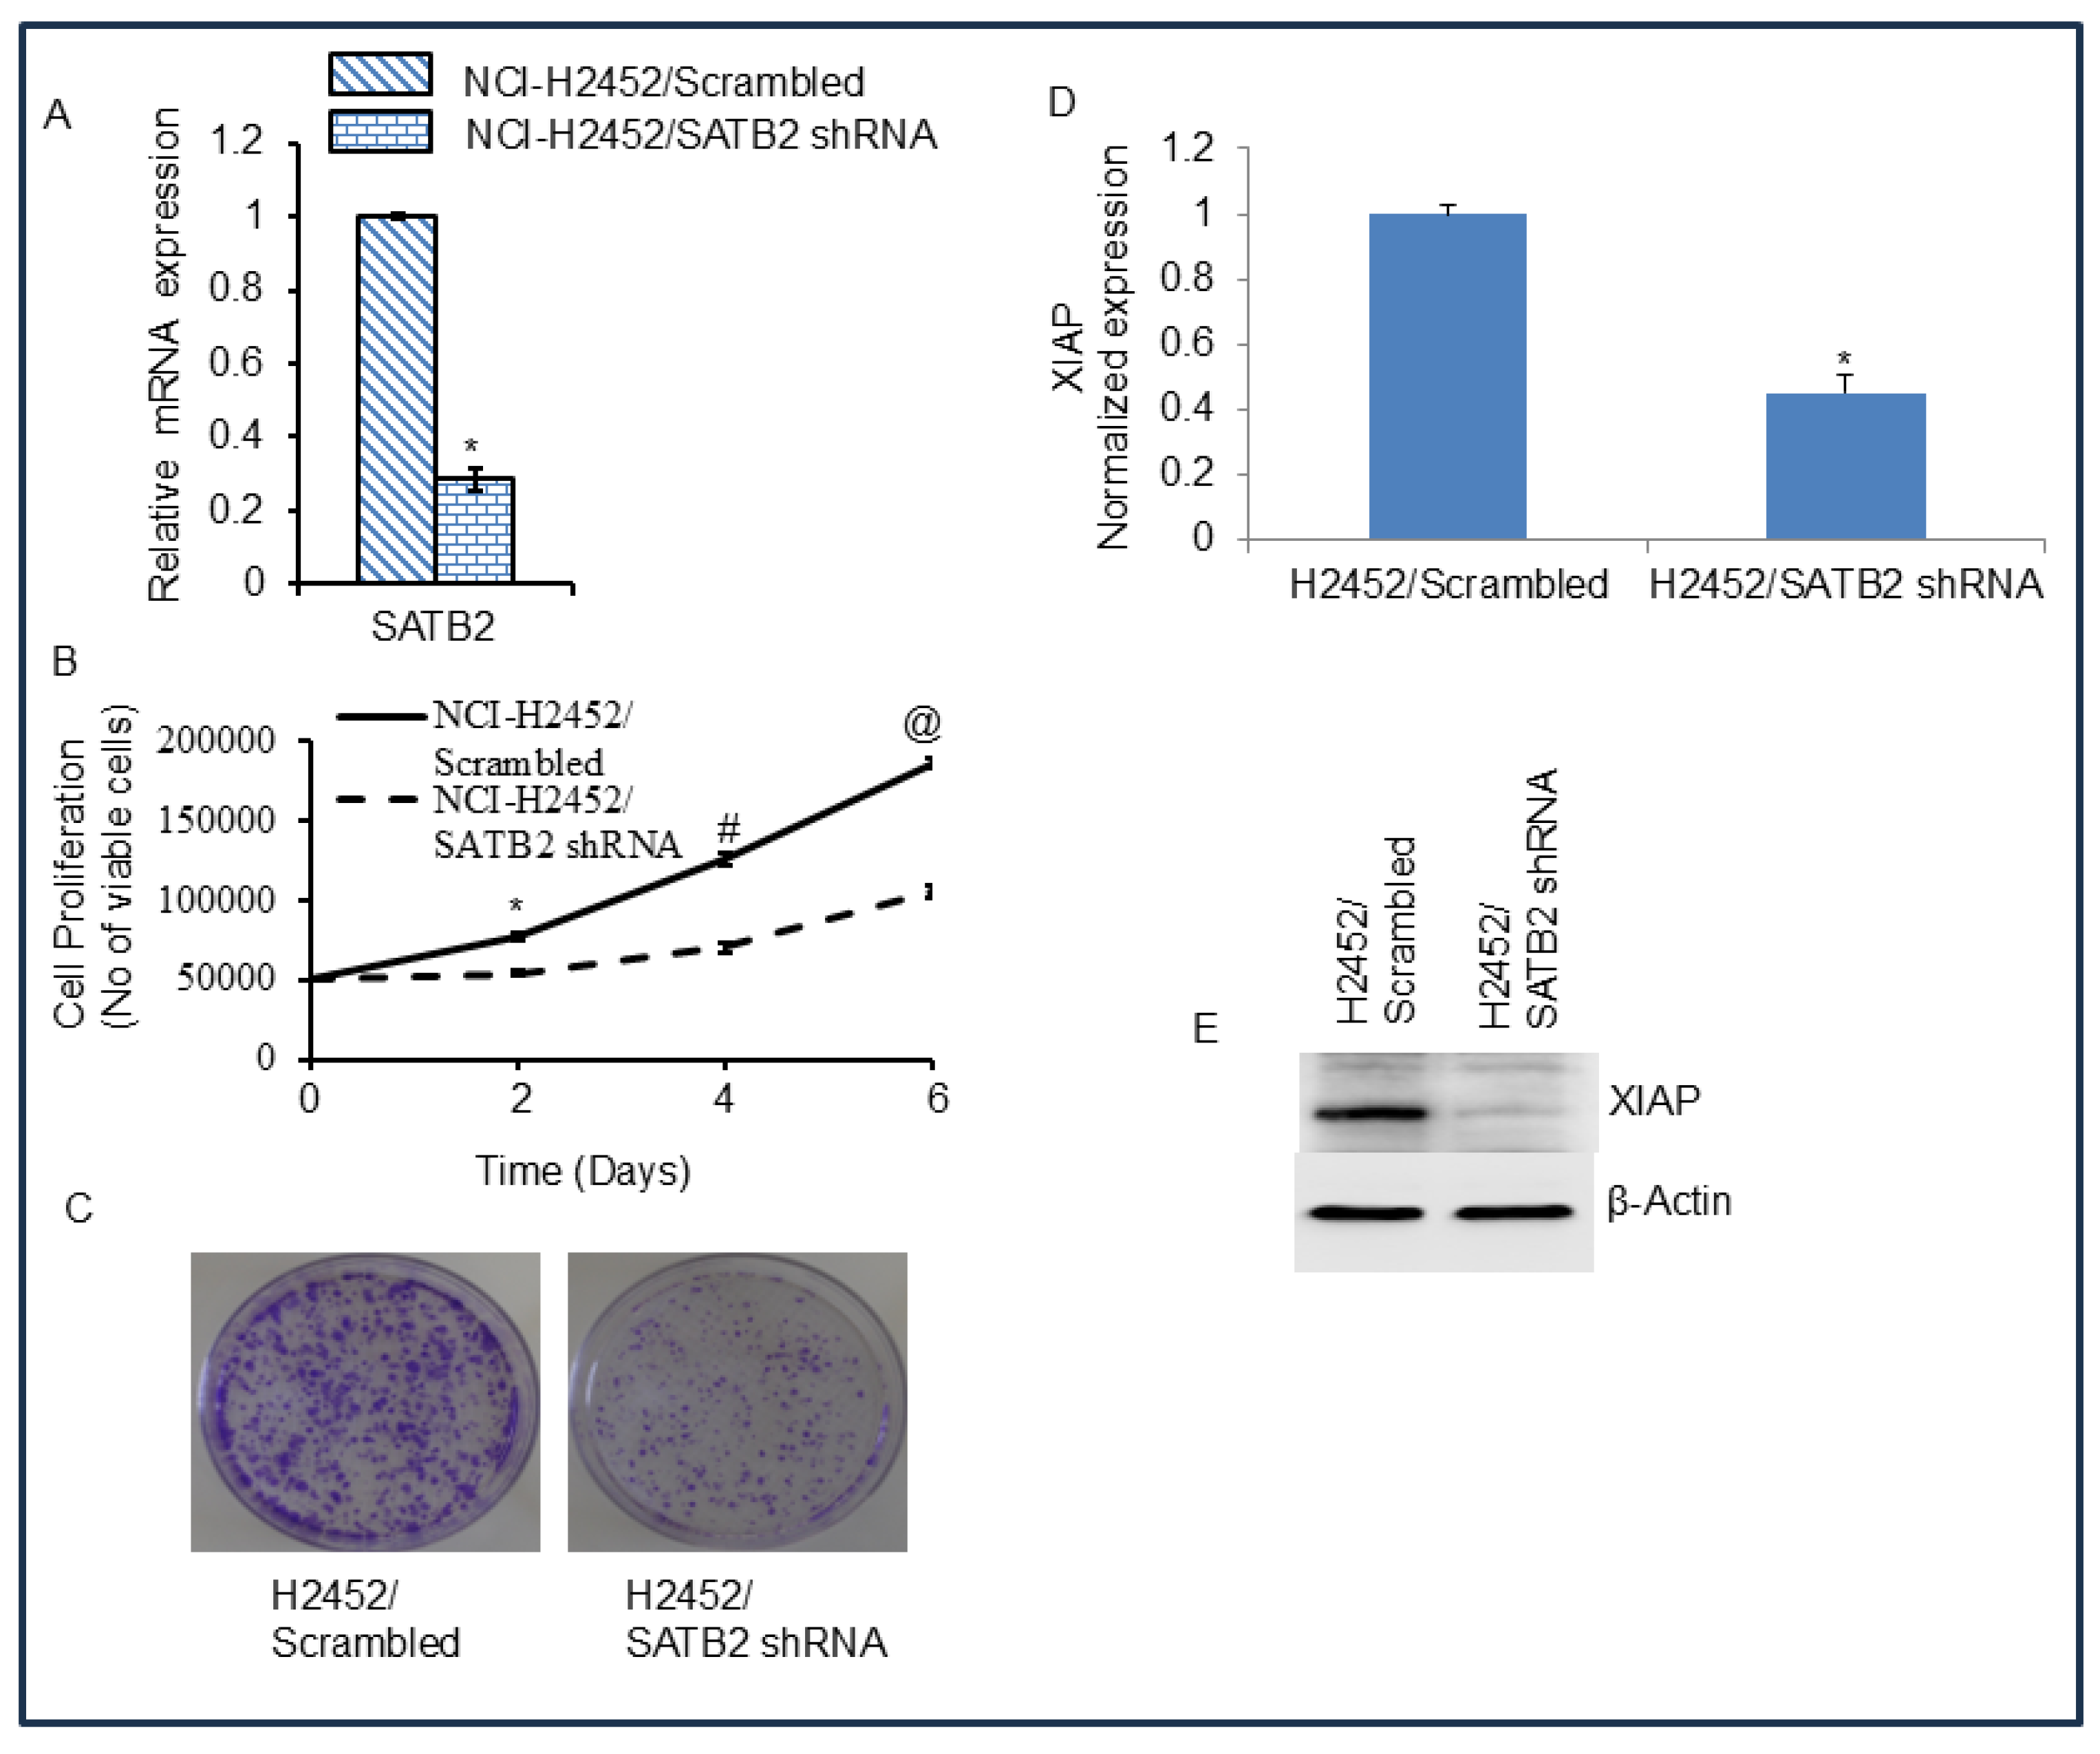
Figure 5.
SATB2 shRNA inhibits cell motility, migration, and invasion and regulates EMT-related genes and transcription factors in H2452 cells. (A), Cell Motility Assay. H2452 CSCs/Scrambled and H2452 CSCs/SATB2 shRNA cells were grown in petri dishes. The next day, the dishes were scratched with the fine pipette tips. Cells were washed with PBS, and the cultured medium was changed. Phase-contrast images of scratched dishes were captured at 0 h and 24 h. (B), Transwell Migration Assay. Transwell migration assay was performed in H2452 CSCs/Scrambled and H2452 CSCs/SATB2 shRNA cells as described in Materials and Methods. Data represent mean (n=4) ± SD. * = significantly different at P < 0.05. (C), Transwell Invasion Assay. Transwell invasion assay was performed in H2452 CSCs/Scrambled and H2452 CSCs/SATB2 shRNA cells as described in Materials and Methods. * = significantly different at P < 0.05. (D), Expression of Cadherins. RNA was isolated from H2452 CSCs/Scrambled and H2452 CSCs/SATB2 shRNA cells. The expression of E-cadherin and N-cadherin was measured by qRT-PCR. * = significantly different between groups (P < 0.05). (E), Expression of EMT-related transcription factors. RNA was isolated from H2452 CSCs/Scrambled and H2452 CSCs/SATB2 shRNA cells. The expression of Snail, Slug, and Zeb1 was measured by qRT-PCR. * = significantly different between groups (P < 0.05).
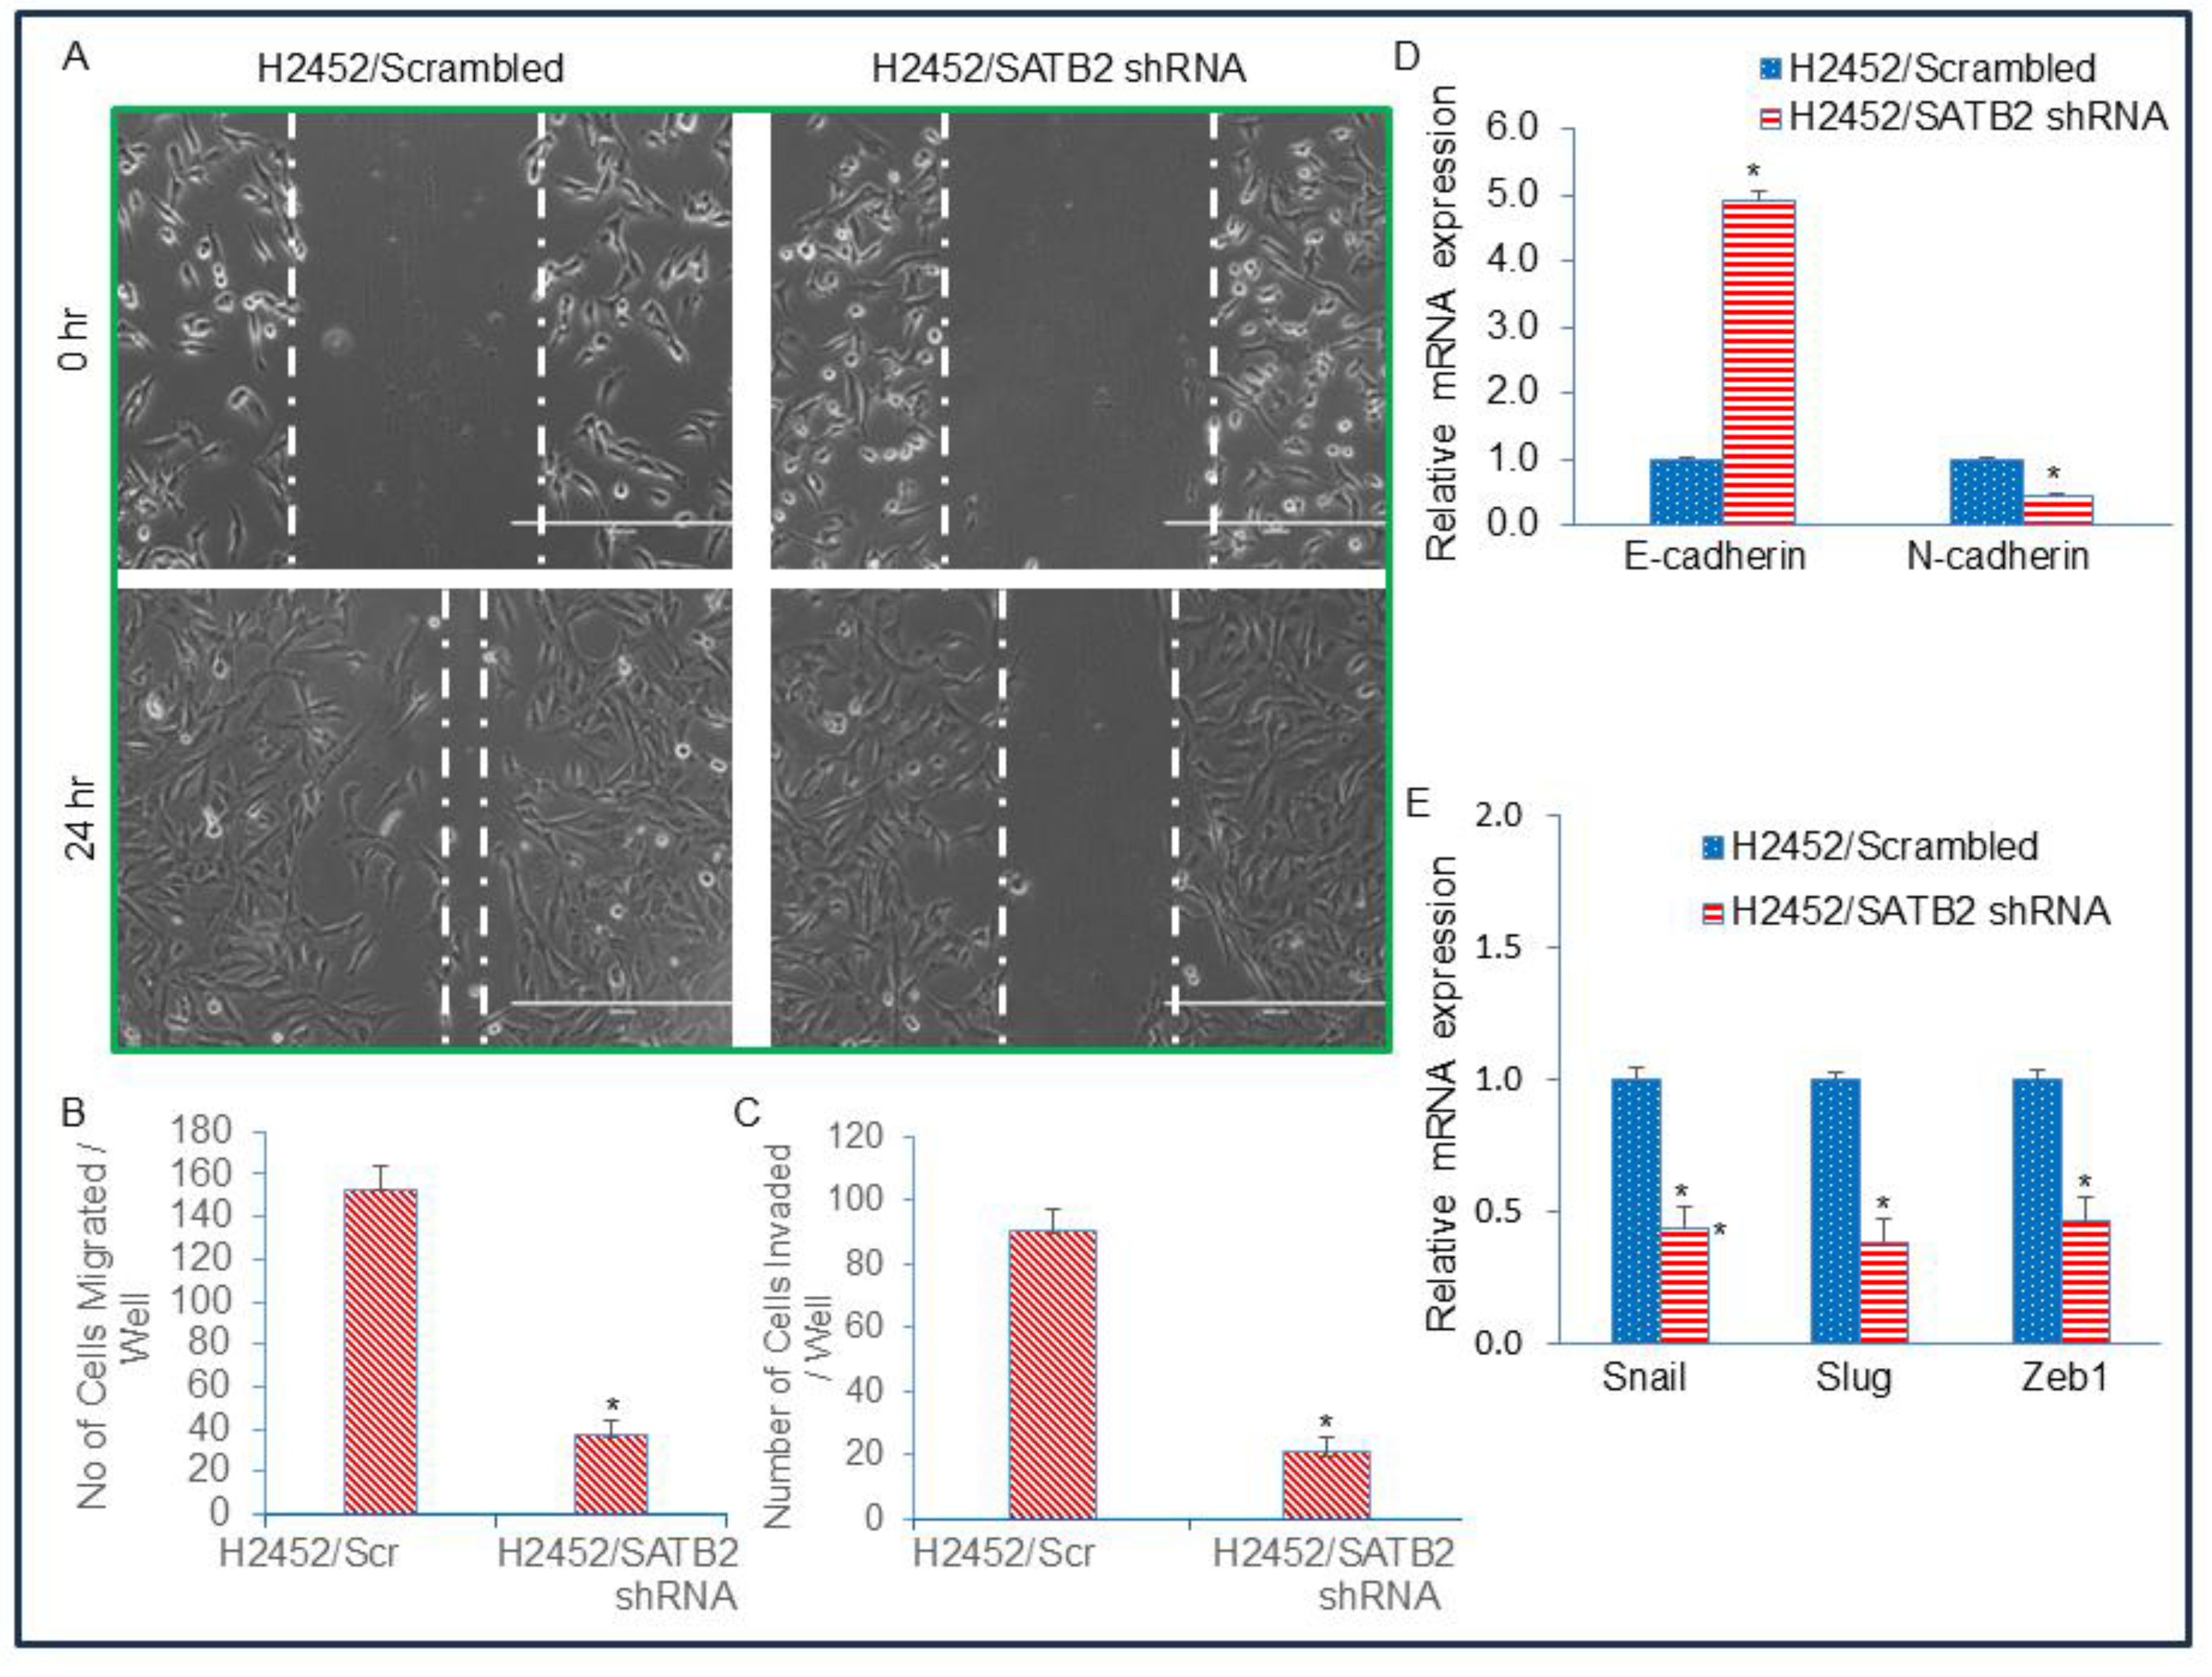
Figure 6.
SATB2 shRNA inhibits spheroid formation, and the expression of stem cell markers and pluripotency factors in CSCs generated from H2452 cells. (A), SATB2 shRNA inhibits spheroid formation in CSCs (side populations) isolated from H2452 cells. H2452 cells were transduced with lentiviral particles expressing either Scrambled (H2452 CSCs/Scrambled) or SATB2 shRNA (H2452 CSCs/SATB2 shRNA). Cells were grown in an ultra-low attachment plate containing well-defined stem cell medium for 3 weeks. This process enabled us to select and grow the side population of N2452 cells, which exhibited stem-like cell properties. At the end of the incubation period, mesospheres were photographed. (B), Expression of SATB2. RNA was isolated from H2452 CSCs/Scrambled and H2452 CSCs/SATB2 shRNA cells. qRT-PCR was performed to measure SATB2 expression. * = significantly different from H2452 CSCs/Scrambled group (P < 0.05). (C), Expression of CSC markers CD44, CD133 and CD24. RNA was isolated from H2452 CSCs/Scrambled and H2452 CSCs/SATB2 shRNA cells. qRT-PCR analysis was performed to measure the expression of CSC markers CD44, CD133, and CD24. * = significantly different from H2452 CSCs/Scrambled group (P < 0.05). (D), Expression of pluripotency maintaining factors cMyc, KLF4, Sox2, Oct4, and Nanog. RNA was isolated from H2452 CSCs/Scrambled and H2452 CSCs/SATB2 shRNA cells. qRT-PCR analysis was performed to measure the expression of cMyc, KLF4, Sox2, Oct4, and Nanog. * = significantly different from H2452 CSCs/Scrambled group (P < 0.05). (E), Protein expression of cMyc, Oct4, and SATB2. Western blot analysis was performed to measure the expression of SATB2, cMyc, and Oct4 in H2452 CSCs/Scrambled and H2452 CSCs/SATB2 shRNA cells. β-actin was used as a loading control.
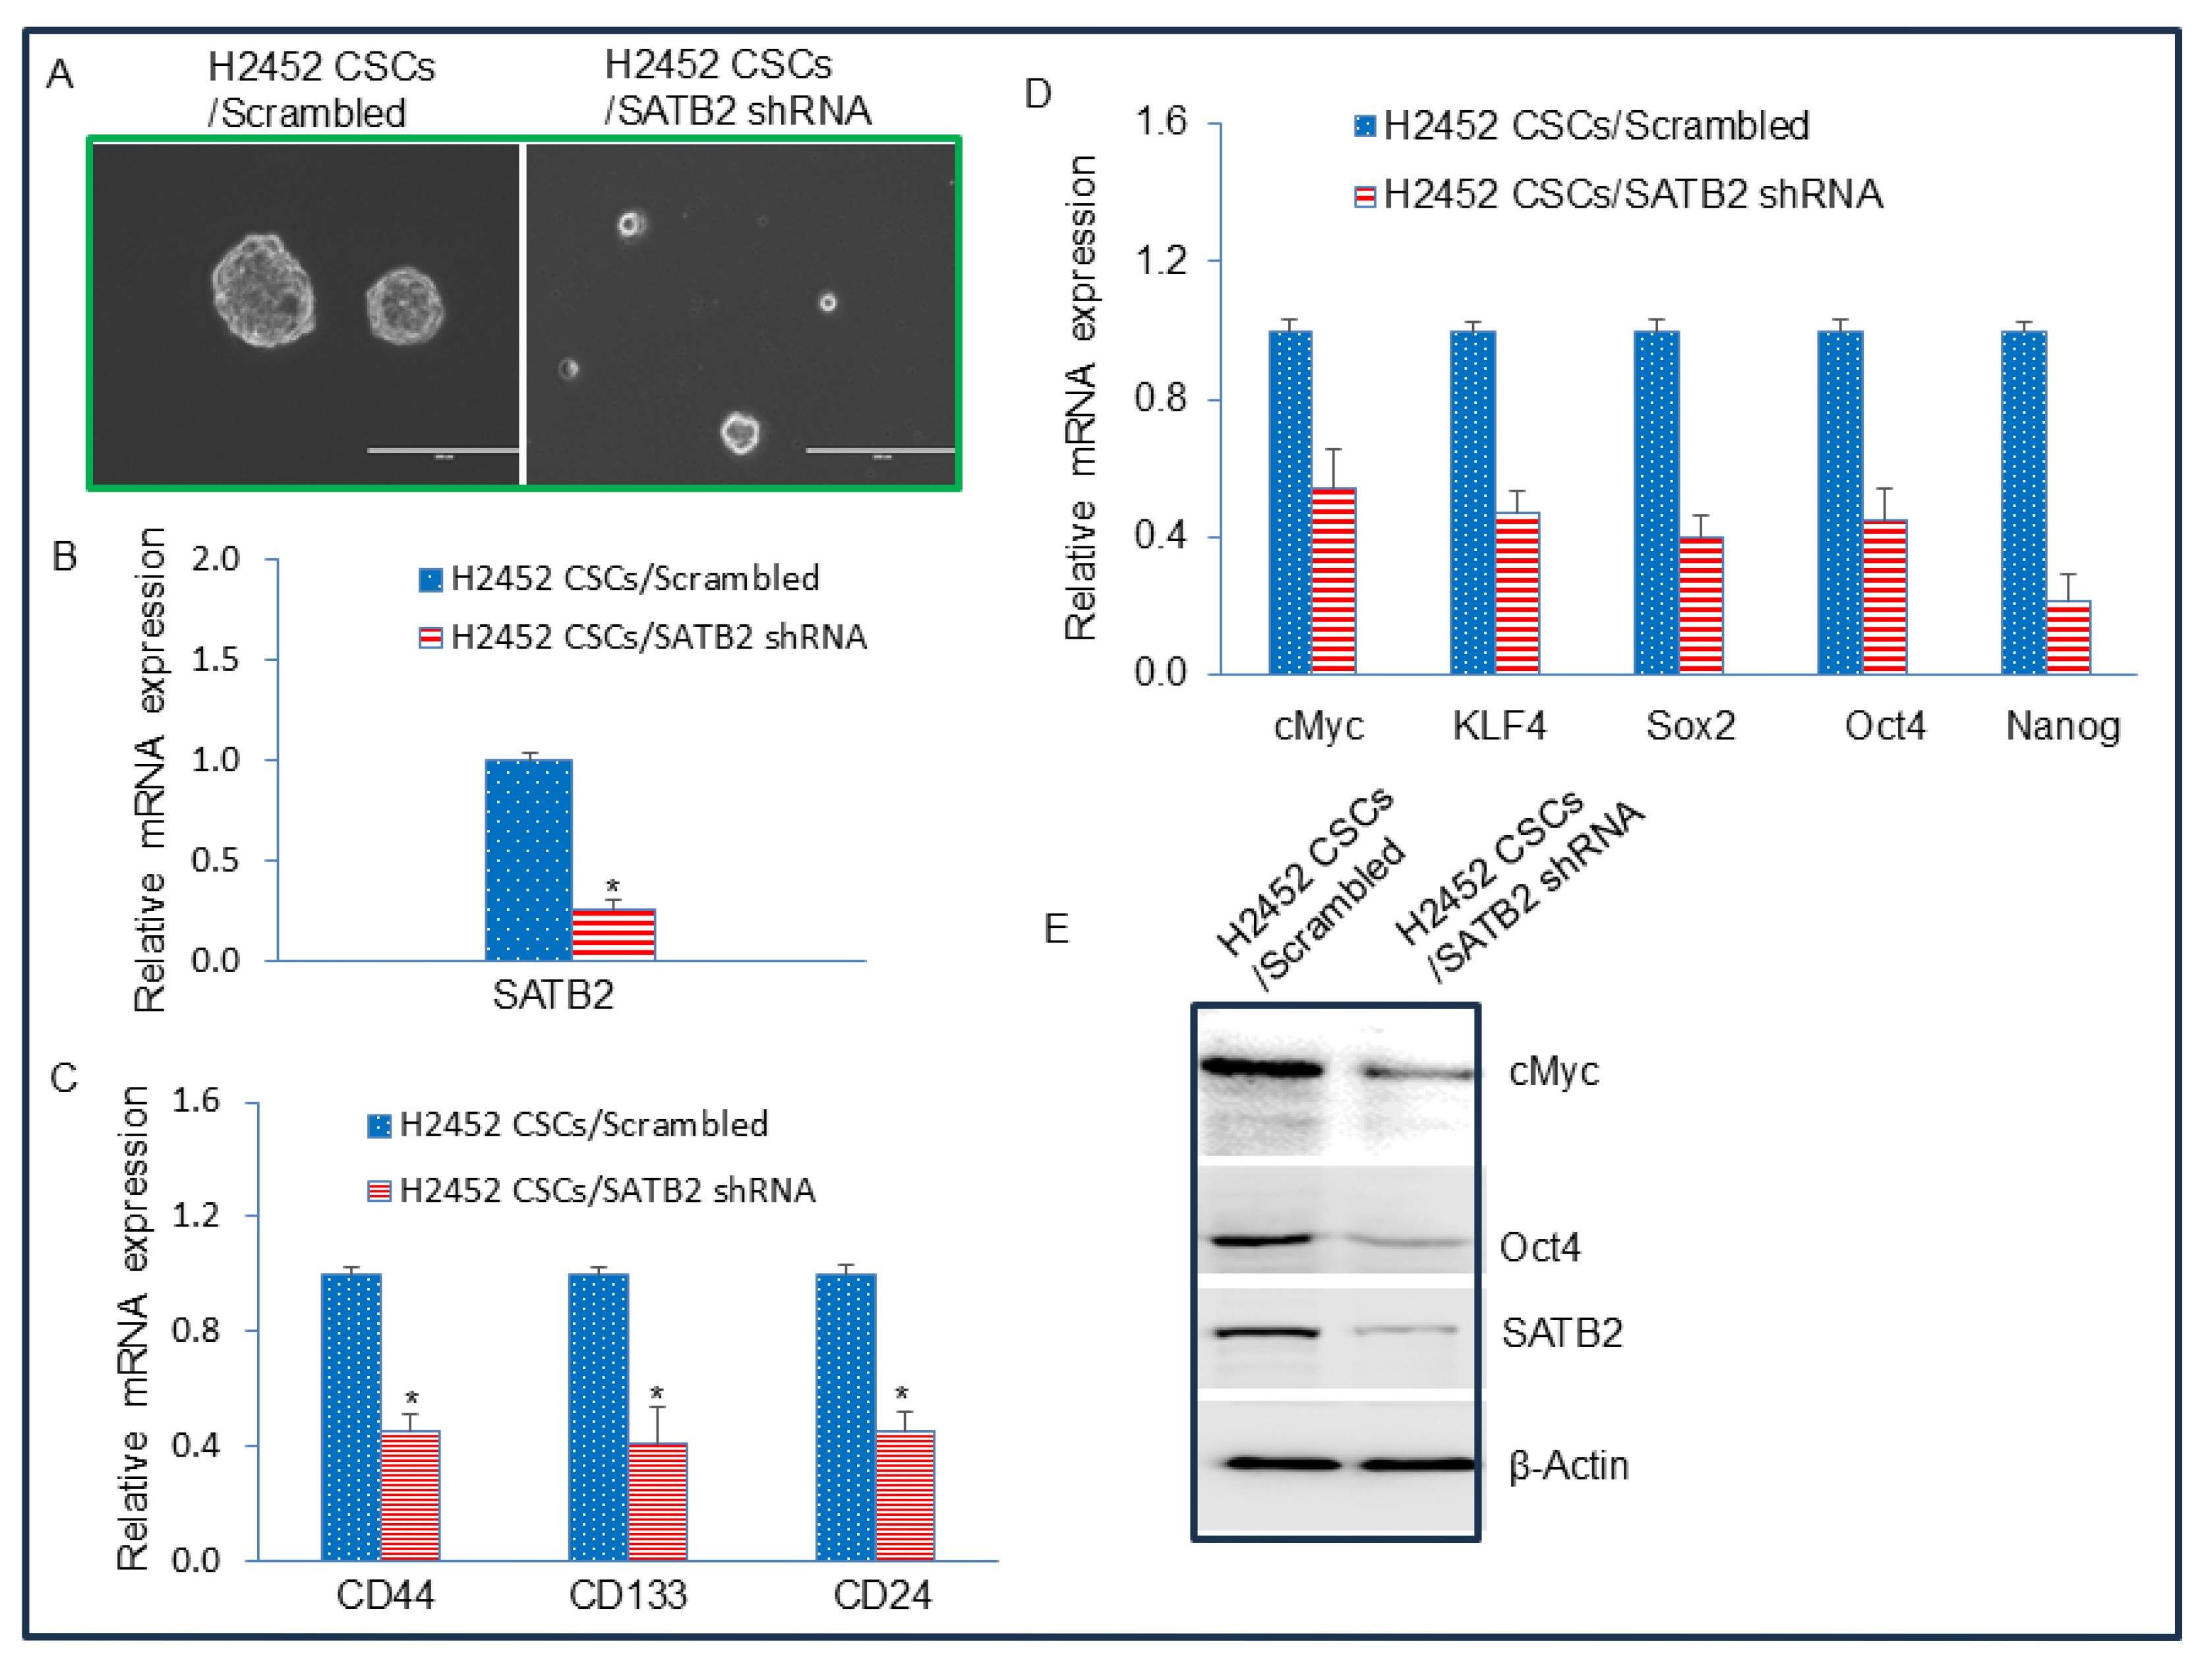
Figure 7.
Binding of SATB2 to promoters of Bcl-2, XIAP, KLF4, cMyc, Nanog, and Sox2. Nuclear extracts were prepared from H2452 CSCs. Chromatin immunoprecipitation (ChIP) assays were performed as we described in Materials and Methods. ChIP assays revealed SATB2 binding to the promoters of Bcl-2, XIAP, KLF4, cMyc, Nanog, and Sox2 in H2452 CSCs.
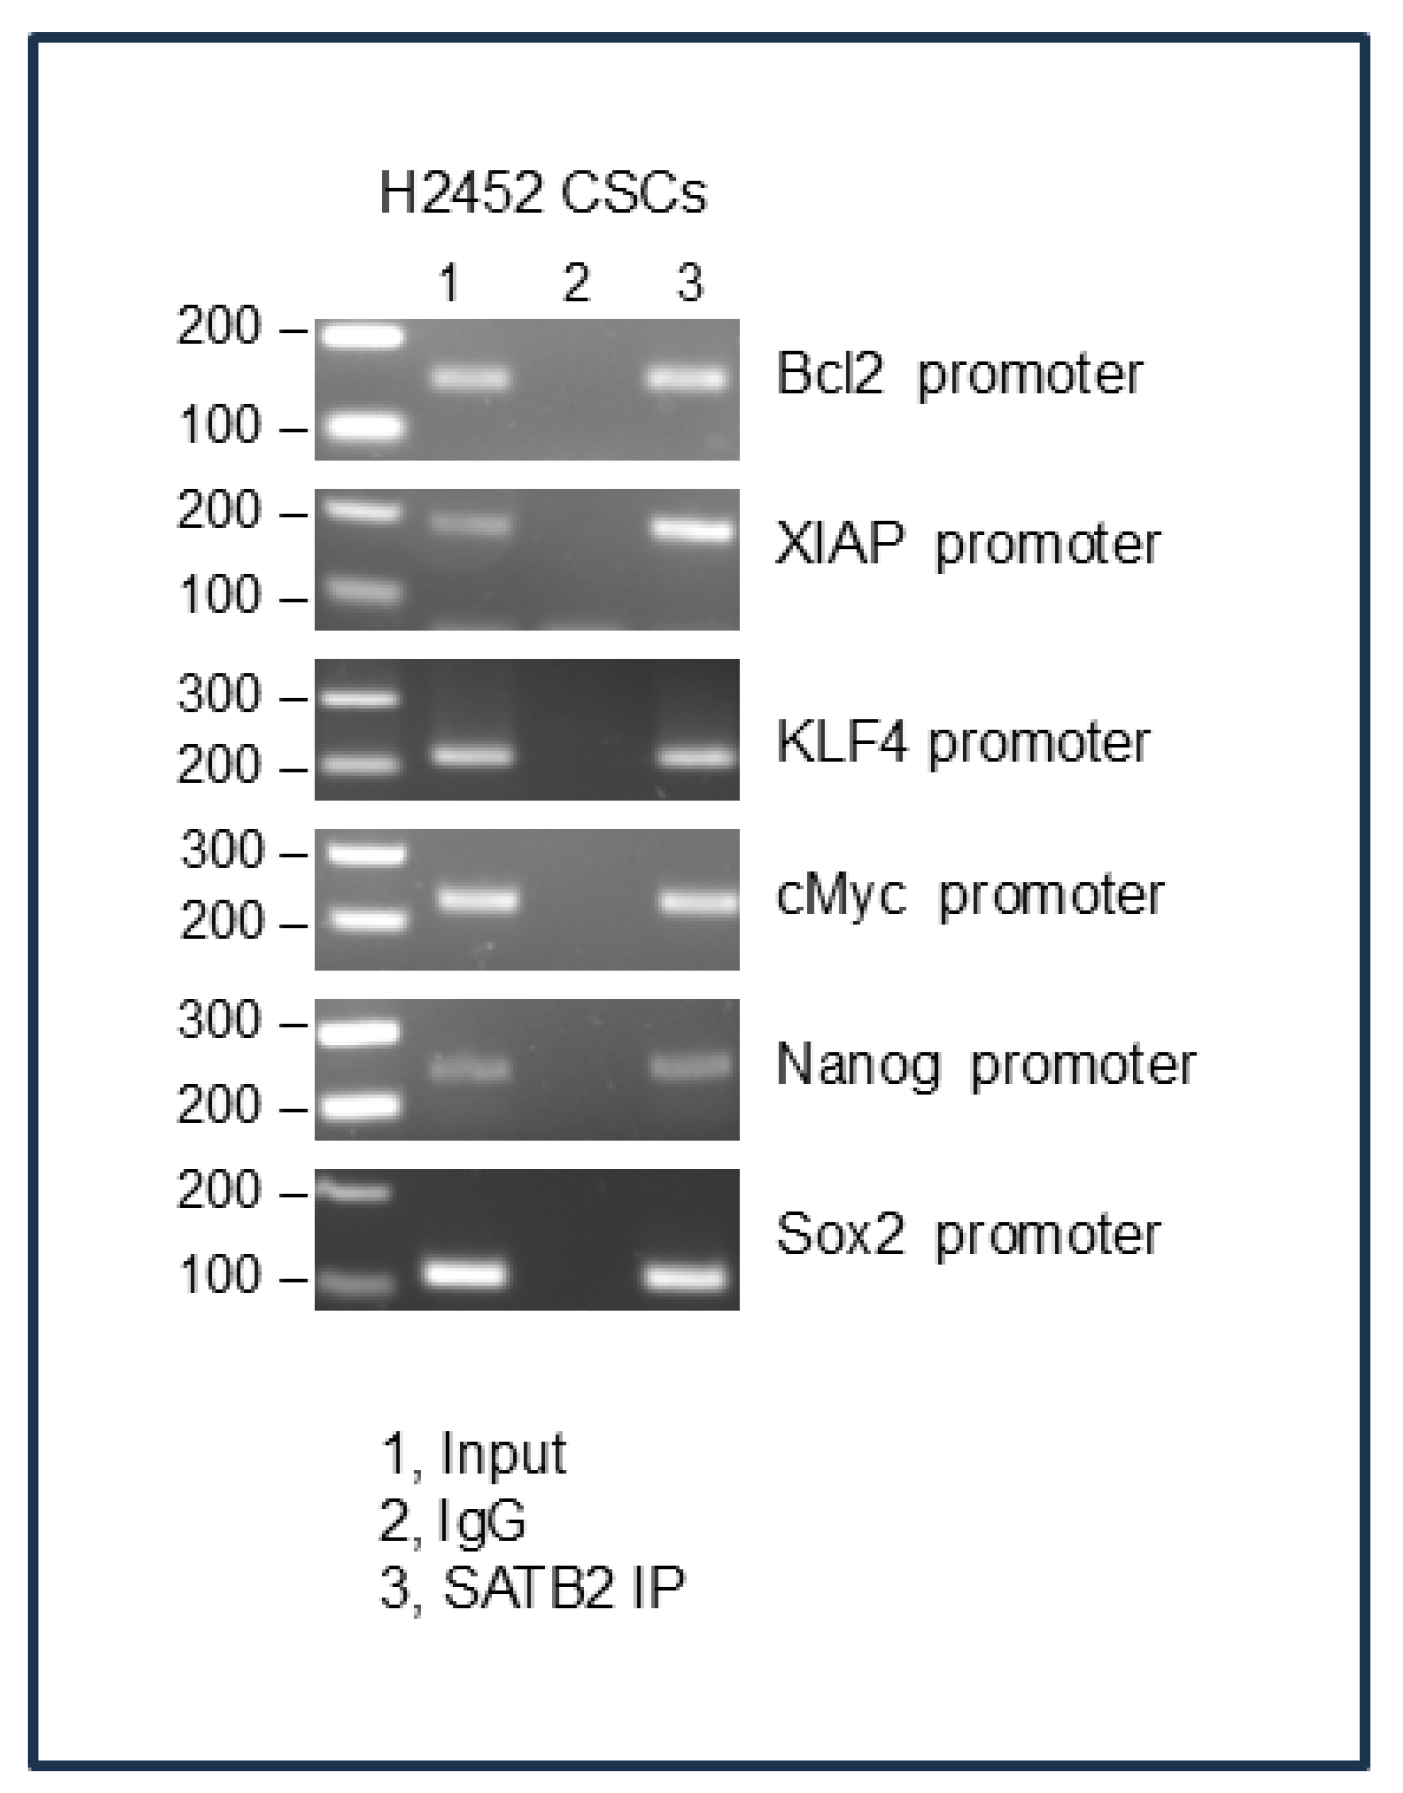
Figure 8.
Inhibition of SATB2 expression in H2452 CSCs reverses drug-resistance to cisplatin and pemetrexed. (A), H2452 CSCs/Scrambled and H2452 CSCs/SATB2 shRNA cells were grown in an ultra-low attachment plate containing well-defined stem cell medium, and treated with or without Cisplatin (20 µM) or Premetrexed (1 μM) for 3 weeks. At the end of the incubation period, the numbers of mesospheres were counted. (B), H2452 CSCs/Scrambled and H2452 CSCs/SATB2 shRNA cells were grown in an ultra-low attachment plate containing well-defined stem cell medium, and treated with or without Cisplatin (20 µM) or Premetrexed (1 μM) for 3 weeks. At the end of the incubation period, mesospheres were collected and dissociated with AccutaseTM (Stemcell Technologies). Viable cells were stained with typan blue (Invitrogen) and counted using a Countess Automated Cell Counter (Invitrogen). (C), Expression of Oct4. H2452 CSCs/Scrambled and H2452 CSCs/SATB2 shRNA cells were grown in an ultra-low attachment plate containing well-defined stem cell medium, and treated with or without Cisplatin (20 µM) or Premetrexed (1 μM) for 3 weeks. RNA was isolated from H2452 CSCs/Scrambled and H2452 CSCs/SATB2 shRNA cells. qRT-PCR was performed to measure Oct4 expression. * = significantly different from H2452 CSCs/Scrambled group (P < 0.05). (D), Expression of Sox2. H2452 CSCs/Scrambled and H2452 CSCs/SATB2 shRNA cells were grown in an ultra-low attachment plate containing well-defined stem cell medium, and treated with or without Cisplatin (20 µM) or Premetrexed (1 μM) for 3 weeks. RNA was isolated from H2452 CSCs/Scrambled and H2452 CSCs/SATB2 shRNA cells. qRT-PCR was performed to measure Sox2 expression. * = significantly different from H2452 CSCs/Scrambled group (P < 0.05). (E), Expression of Nanog. H2452 CSCs/Scrambled and H2452 CSCs/SATB2 shRNA cells were grown in an ultra-low attachment plate containing well-defined stem cell medium, and treated with or without Cisplatin (20 µM) or Premetrexed (1 μM) for 3 weeks. RNA was isolated from H2452 CSCs/Scrambled and H2452 CSCs/SATB2 shRNA cells. qRT-PCR was performed to measure Nanog expression. * = significantly different from H2452 CSCs/Scrambled group (P < 0.05).
Disclaimer/Publisher’s Note: The statements, opinions and data contained in all publications are solely those of the individual author(s) and contributor(s) and not of MDPI and/or the editor(s). MDPI and/or the editor(s) disclaim responsibility for any injury to people or property resulting from any ideas, methods, instructions or products referred to in the content. |
© 2025 by the authors. Licensee MDPI, Basel, Switzerland. This article is an open access article distributed under the terms and conditions of the Creative Commons Attribution (CC BY) license (http://creativecommons.org/licenses/by/4.0/).
Copyright: This open access article is published under a Creative Commons CC BY 4.0 license, which permit the free download, distribution, and reuse, provided that the author and preprint are cited in any reuse.


