Submitted:
05 December 2025
Posted:
10 December 2025
You are already at the latest version
Abstract
Social media platforms have become critical spaces where consumers and investors publicly react to major corporate events. These online reactions provide rich text data for analyzing brand sentiment and evaluating marketing campaigns. This study examines how sentiment toward Apple changed the company’s 2020 product launch within Reddit finance communities. Using a dataset of 297,533 Reddit comments mentioning Apple’s ticker (“AAPL”) posted between November 2016 and October 2021 in finance-related subreddits, comments were labeled as occurring before or after the September 11, 2020, launch. Sentiment was measured using VADER, a lexicon‐ and rule‐based sentiment analyzer optimized for social media text (Hutto & Gilbert, 2014). Descriptive statistics, correlation analyses, and independent‐samples t tests compared sentiment and engagement (upvotes) across periods and explored relationships among sentiment, text length, and upvotes. Overall sentiment was slightly positive (M = 0.13), with a small but statistically significant increase after the launch (Before: M = 0.12; After: M = 0.14). Upvotes did not differ meaningfully by period. Correlations showed that stronger sentiment was associated with longer comments but was essentially unrelated to upvotes. As an exploratory extension, a small labeled subset of comments was used to pilot fine‐tuning a transformer-based model with the Unsloth framework, building on evidence that domain-specific transformers such as FinBERT outperform lexicon-based methods on financial text (Araci, 2019). The findings suggest that Apple’s 2020 launch modestly improved conversational tone in Reddit finance discussions without changing engagement, and they highlight the value of combining fast lexicon methods with modern transformers for campaign evaluation.
Keywords:
brand sentiment
; Reddit
; Apple
; marketing campaign
; VADER
; transformers
1. Introduction
Social media platforms now function as a real-time barometer of public opinion, where consumers and investors openly evaluate brands, campaigns, and corporate decisions. Rather than relying only on impressions or click-through rates, organizations increasingly use social media sentiment analysis to understand the emotional tone of conversations and how that tone shifts over time. Industry reports emphasize that tracking sentiment provides a more nuanced view of brand health than engagement metrics alone and can help identify both early warning signs of backlash and opportunities to amplify positive responses (Sprout Social, 2025; Sprinklr, 2025). For a brand like Apple, whose product launches are globally watched events, monitoring sentiment before and after a launch offers one way to gauge whether key marketing messages are resonating with online audiences.
Reddit is especially relevant in this context. Communities such as r/wallstreetbets and r/stocks bring together large numbers of retail investors whose discussions can influence trading behavior and risk-taking. Barber et al. (2021) show that investment ideas posted in r/wallstreetbets are followed by significant changes in trading volume and returns, while Warkulat (2024) finds that increased attention on Reddit is associated with more aggressive risk-taking and poorer holding-period performance. In parallel, research on Twitter has demonstrated that aggregate social media mood can help predict broad stock market indices, suggesting that investor sentiment expressed online is linked to financial outcomes (Bollen et al., 2011; Tetlock, 2007). Together, this work implies that understanding how sentiment evolves in online investor communities around major corporate events is important for both marketing and finance.
Despite this growing literature, relatively few academic studies have examined brand-level sentiment around a specific corporate event using Reddit comments, and even fewer directly compare traditional lexicon-based sentiment tools with modern transformer-based models in this setting. At the same time, marketing practitioners increasingly emphasize ongoing sentiment tracking as a way to evaluate campaigns, manage reputation, and adjust messaging in near real time (Revuze, 2025; Sprout Social, 2025; Sprinklr, 2025). This project sits at the intersection of these trends: it uses Apple’s 2020 product launch as a focal event, relies on Reddit finance communities as the data source, and combines a widely used lexicon-based model (VADER; Hutto & Gilbert, 2014) with an exploratory transformer-based approach inspired by recent advances such as FinBERT (Araci, 2019) and BERT (Devlin et al., 2019).
1.1. Research Questions
This project uses Apple’s 2020 product launch as a case study to address four research questions:
- RQ1: Does average sentiment about Apple in Reddit finance communities differ before versus after the 2020 product launch?
- RQ2: Does user engagement with Apple-related comments (upvotes) differ between the two periods?
- RQ3: How are sentiment, text length, and engagement related to each other?
- RQ4 (Exploratory): How does a transformer-based sentiment classifier compare to VADER on this domain, using a labeled subset of comments?
Based on prior evidence that major announcements and information shocks can alter investor mood and attention (Bollen et al., 2011; Tetlock, 2007), I hypothesized that sentiment would be more positive after the launch (H1). Because upvotes reflect many factors beyond sentiment—such as humor, novelty, or the perceived value of information—I did not expect a substantial change in engagement (H2: no meaningful difference in upvotes by period). For RQ3, I expected longer comments to express more polarized sentiment, but only a weak relationship between sentiment and upvotes. For RQ4, informed by results from FinBERT and other domain-specific transformers showing improved performance over lexicon-based methods on financial text (Araci, 2019; Devlin et al., 2019), I anticipated that a fine-tuned transformer model would outperform VADER on a labeled subset of comments.
Literature Review
1.2. Social Media Sentiment and Financial Behavior
Research increasingly demonstrates that public mood expressed on social platforms can influence market dynamics. Bollen et al. (2011) found that Twitter mood states predicted movements in the Dow Jones Industrial Average. Tetlock (2007) showed that negative news sentiment increases market volatility. Rechenthin et al. (2014) similarly reported that energy-sector returns correlate with social media mood. These studies collectively validate sentiment as a meaningful financial signal.
1.3. Reddit Communities and Investor Psychology
Reddit’s structure—anonymous, discussion-driven, and community-moderated—makes it a unique environment for collective investor sentiment. Barber et al. (2021) documented that stocks discussed in r/wallstreetbets experienced significant short-term price and volume effects. Schreiner et al. (2019) highlighted how emotion-rich content drives user behavior on Reddit. These findings imply that monitoring sentiment in Reddit finance communities offers insight into retail investor reactions to brand events.
1.4. Brand Perception and Product Launch Events
Marketing research emphasizes that brand image and campaign resonance depend heavily on consumer perception (Seo & Park, 2018). Studies of Apple specifically show strong emotional attachment to the brand and sensitivity to new product announcements (Kim & Kim, 2019). Launch events often produce temporary spikes in both attention and sentiment, shaping the broader narrative around the brand (Shapiro, 2018).
1.5. Sentiment Analysis Methods
Lexicon-based models like VADER perform reliably on short, informal text (Hutto & Gilbert, 2014), but they often struggle with sarcasm, complex context, and domain-specific language. Transformer-based models—including BERT (Devlin et al., 2019) and FinBERT (Araci, 2019)—offer more sophisticated representations of meaning and have shown superior accuracy in financial sentiment classification. Although this study does not fully train a transformer model due to hardware constraints, the conceptual comparison informs future work.
2. Methods
2.1. Data
This project used a large, observational dataset of Reddit comments that mentioned Apple over a five-year period. The original CSV file (five-years-of-aapl-on-reddit-comments.csv) contained comments from multiple finance-oriented subreddits, including wallstreetbets, stocks, investing, options, thetagang, and several related communities. After loading the data into Python, a total of 297,533 unique comments remained for analysis.
Each record in the dataset represented a single Reddit comment and included several key fields:
- Subreddit name (stored as subreddit.name, later renamed Platform)
- Unix timestamp of the comment (created_utc)
- Author identifier (id, later treated as User)
- Raw comment body (body, later renamed Text)
- Score, which represents the net upvotes assigned by other users
The Unix time was converted to a human-readable datetime variable called Timestamp using UTC as the time zone. The study focused on comments posted between November 1, 2016 and October 31, 2021, which reflects the full range of the original dataset. No rows contained missing values for the core variables (Platform, Timestamp, User, Text, Upvotes), so no listwise deletion was required.
To study changes around Apple’s 2020 product launch event, a binary indicator variable called Period was created by comparing each comment timestamp to September 11, 2020. Comments posted prior to that date were labeled Before, and those posted on or after that date were labeled After. This created a quasi-experimental pre-post design based on naturally occurring online discussions rather than a controlled intervention. The final dataset contained 142,384 comments in the Before period and 155,149 in the After period, indicating that Apple-related finance discussions remained active throughout the entire timeframe.
In addition to the original fields, two text-length variables were engineered:
- word_length – total number of whitespace-separated tokens in each comment
- char_length – total number of characters in the cleaned comment text
These variables enabled examination of whether longer, more detailed comments differed systematically in sentiment or engagement.
2.2. Predictors
The primary predictors in this study were derived from the comment text and temporal information:
-
Sentiment score (VADER compound).Sentiment was quantified using the VADER (Valence Aware Dictionary for sEntiment Reasoning) model (Hutto & Gilbert, 2014), which is widely used for short, informal social media text. For each comment, the VADER analyzer produced a compound score ranging from −1 (extremely negative) to +1 (extremely positive). This continuous variable served as the main predictor for emotional tone.
-
Text length.Two continuous measures captured the length of each comment:
- word_length (number of words)
- char_length (number of characters) These variables were used both descriptively and in correlation analyses to examine whether longer comments tended to be more emotional or received more engagement.
-
Period.The binary Period variable (Before vs. After) acted as the key grouping factor for comparing sentiment and engagement surrounding the 2020 product launch. Because no random assignment was possible, Period functions as a quasi-experimental factor indicating temporal proximity to the launch, not a true experimental manipulation.
-
Platform.Although not a main predictor in the statistical tests reported here, the Platform variable (subreddit name) was used descriptively to understand where most Apple-related discussion occurred (e.g., r/wallstreetbets vs. r/stocks).
2.3. Outcome Measures
The analytic plan mapped directly onto the four research questions:
-
Sentiment (RQ1).For RQ1, the outcome was the VADER compound score, treated as a continuous variable. The main comparison was the difference in mean sentiment between the Before and After periods.
-
Engagement (RQ2).For RQ2, the outcome was Upvotes, the Reddit “score” variable, which reflects the net number of upvotes minus downvotes a comment received. Upvotes served as a proxy for community engagement or perceived value of the comment.
-
Correlational structure (RQ3).For RQ3, the outcomes of interest were the pairwise relationships among sentiment, engagement, and text length. Specifically, Pearson correlations were computed among compound sentiment, Upvotes, word_length, and char_length to understand how emotional tone and comment length relate to visibility and engagement.
-
Model comparison (RQ4).For RQ4, the intended outcome was classification performance of a modern transformer model compared with VADER on a labeled subset of comments. Due to hardware limitations, this step remained exploratory and conceptual rather than fully quantitative. However, the study still describes how a transformer model could be fine-tuned on Apple-related comments in future work.
2.4. Data Analytic Plan
All analyses were conducted in Python using pandas, NumPy, SciPy, NLTK, and visualization libraries. The analytic process followed several steps:
-
Data loading and basic preprocessing.The raw CSV file was loaded into a pandas DataFrame. The created_utc field was converted from Unix time to a timezone-aware Timestamp column. Core variables were renamed for clarity: subreddit.name → Platform, body → Text, score → Upvotes, and id → User. A Period flag (Before vs. After) was computed based on the 2020 launch date.
-
Text cleaning.Although Reddit comments contain substantial informal content, minimal cleaning was applied to preserve their original meaning. URLs, Markdown links, and obvious formatting artifacts were removed. Basic normalization (e.g., stripping extra whitespace) was performed, but emojis, punctuation, and capitalization were left intact because VADER is trained to interpret such cues.
-
Feature engineering.Text-length variables were computed by counting whitespace-separated tokens (word_length) and characters (char_length) in each cleaned comment. These variables were later used for descriptive statistics, distribution plots, and correlations.
-
Sentiment scoring.The NLTK implementation of VADER was used to compute sentiment scores. For each Text entry, the analyzer returned four values (positive, negative, neutral, compound). Only the compound score was retained because it summarizes overall sentiment in a single metric. In addition, the compound score was mapped into discrete sentiment categories (Negative, Neutral, Positive) using the standard VADER thresholds (≤ −0.05, between −0.05 and 0.05, ≥ 0.05).
-
Descriptive statistics and assumptions checking.Descriptive statistics (means, standard deviations, quartiles, and ranges) were calculated for sentiment, upvotes, and text length. Histograms and kernel density plots were inspected to understand the skewness of Upvotes and comment length. Although Upvotes were highly right-skewed, the extremely large sample size made parametric tests robust to non-normality, so no transformation was applied.
-
Correlation analysis.Pearson correlation coefficients were computed among compound sentiment, Upvotes, word_length, and char_length. A correlation matrix and corresponding heatmap were created to visually inspect multicollinearity and to answer RQ3. Very high correlations between word_length and char_length were expected and confirmed.
-
Pre–post comparisons.For RQ1 and RQ2, independent-samples t-tests compared mean sentiment and mean Upvotes between the Before and After periods. Effect sizes were summarized using Cohen’s d to distinguish statistically significant but practically small differences from more substantive shifts.
-
Visualization.Several visualizations were planned and generated, including:
- Boxplots showing sentiment distributions before and after the launch
- Histograms and density plots of Upvotes and comment length
- Bar charts for Negative/Neutral/Positive sentiment proportions
- A correlation heatmap for all numeric variables
-
Exploratory transformer pipeline.An Unsloth/transformer-based pipeline was partially configured in a GPU environment to fine-tune a sentiment classifier on a labeled subset of comments. However, due to GPU and library compatibility limitations, full fine-tuning and evaluation could not be completed. Therefore, RQ4 is addressed primarily in the Discussion as a conceptual extension rather than a fully executed model comparison.
3. Results
3.1. Descriptive Statistics
Summary statistics for all continuous variables are reported in Table 1.
| compound | Upvotes | Word_length | Char_length | |
| count | 297533 | 297533 | 297533 | 297533 |
| mean | 0.132 | 5.199 | 48.880 | 290.216 |
| std | 0.470 | 48.901 | 128.699 | 871.489 |
| min | -1 | -249.00 | 1 | 4 |
| 25% | -0.0098 | 1 | 9 | 47 |
| 50% | 0 | 2 | 18 | 95 |
| 75% | 0.493 | 5 | 41 | 226 |
| max | 0.999 | 14165.0 | 2000 | 13920 |
Across the full dataset of 297,533 comments, average sentiment as measured by VADER was slightly positive (M = 0.13, SD = 0.47). Sentiment scores ranged from −1.00 (strongly negative) to 0.9999 (strongly positive), indicating that the dataset captured the full span of emotional reactions, from harsh criticism to enthusiastic praise.
Engagement, measured by Upvotes, exhibited substantial variability. The mean number of Upvotes was approximately 5.20, but the standard deviation was large (SD ≈ 48.90), and scores ranged from −249 to 14,165. This heavy right skew suggests that most comments received only a small number of votes, while a relatively small subset went “viral” within their respective communities.
Text length also varied widely. The average comment contained about 49 words and 290 characters, but the distributions were long-tailed, with some posts exceeding 2,000 words and 13,000 characters. The lower quartile was only 9 words, indicating that short, one-line reactions were also extremely common.
From a temporal perspective, 142,384 comments fell in the Before period, and 155,149 occurred in the After period. This relatively balanced split indicates that the pre- and post-launch analyses are based on similarly large samples.
3.2. Correlation Analysis (RQ3)
Pearson correlations among the four primary numeric variables appear in Table 2.
Figure 1.
“Correlation Heatmap for Sentiment, Upvotes, and Text Length”.

The correlation matrix revealed three important patterns:
-
Sentiment and engagement are nearly independent.The correlation between VADER compound sentiment and Upvotes was extremely small (r ≈ 0.00). This suggests that highly upvoted comments were not systematically more positive or negative than typical comments. Instead, upvotes likely reflect a mix of factors such as humor, perceived insight, or alignment with community norms.
-
Sentiment and text length are modestly related.Compound sentiment showed small–to–moderate positive correlations with both word_length (r ≈ 0.25) and char_length (r ≈ 0.23). Longer comments tended to be slightly more emotional—either more strongly supportive or more strongly critical—than very short comments. This pattern supports the expectation that users expend more effort when they feel strongly about a topic.
-
Text length measures are highly redundant.As expected, word_length and char_length were almost perfectly correlated (r ≈ 0.98). This indicates that either measure could be used as a proxy for comment size without major loss of information, and that multicollinearity is only a concern if both are entered into the same regression model.
Overall, the correlations support the conclusion that sentiment, engagement, and text length capture distinct dimensions of online discussion rather than measuring the same underlying construct.
3.3. Sentiment Change Before vs. After Launch (RQ1)
To address RQ1, mean sentiment scores were compared between the Before and After periods. Comments posted before the 2020 launch had an average sentiment of 0.1203, whereas comments posted after the launch had a slightly higher average sentiment of 0.1431. An independent-samples t-test showed that this difference was statistically significant, t(297,531) = 13.21, p ≈ 7.46 × 10⁻⁴⁰, with Cohen’s d = 0.048.
Figure 2.
“Boxplot of Sentiment Before vs. After Apple’s 2020 Product Launch”.
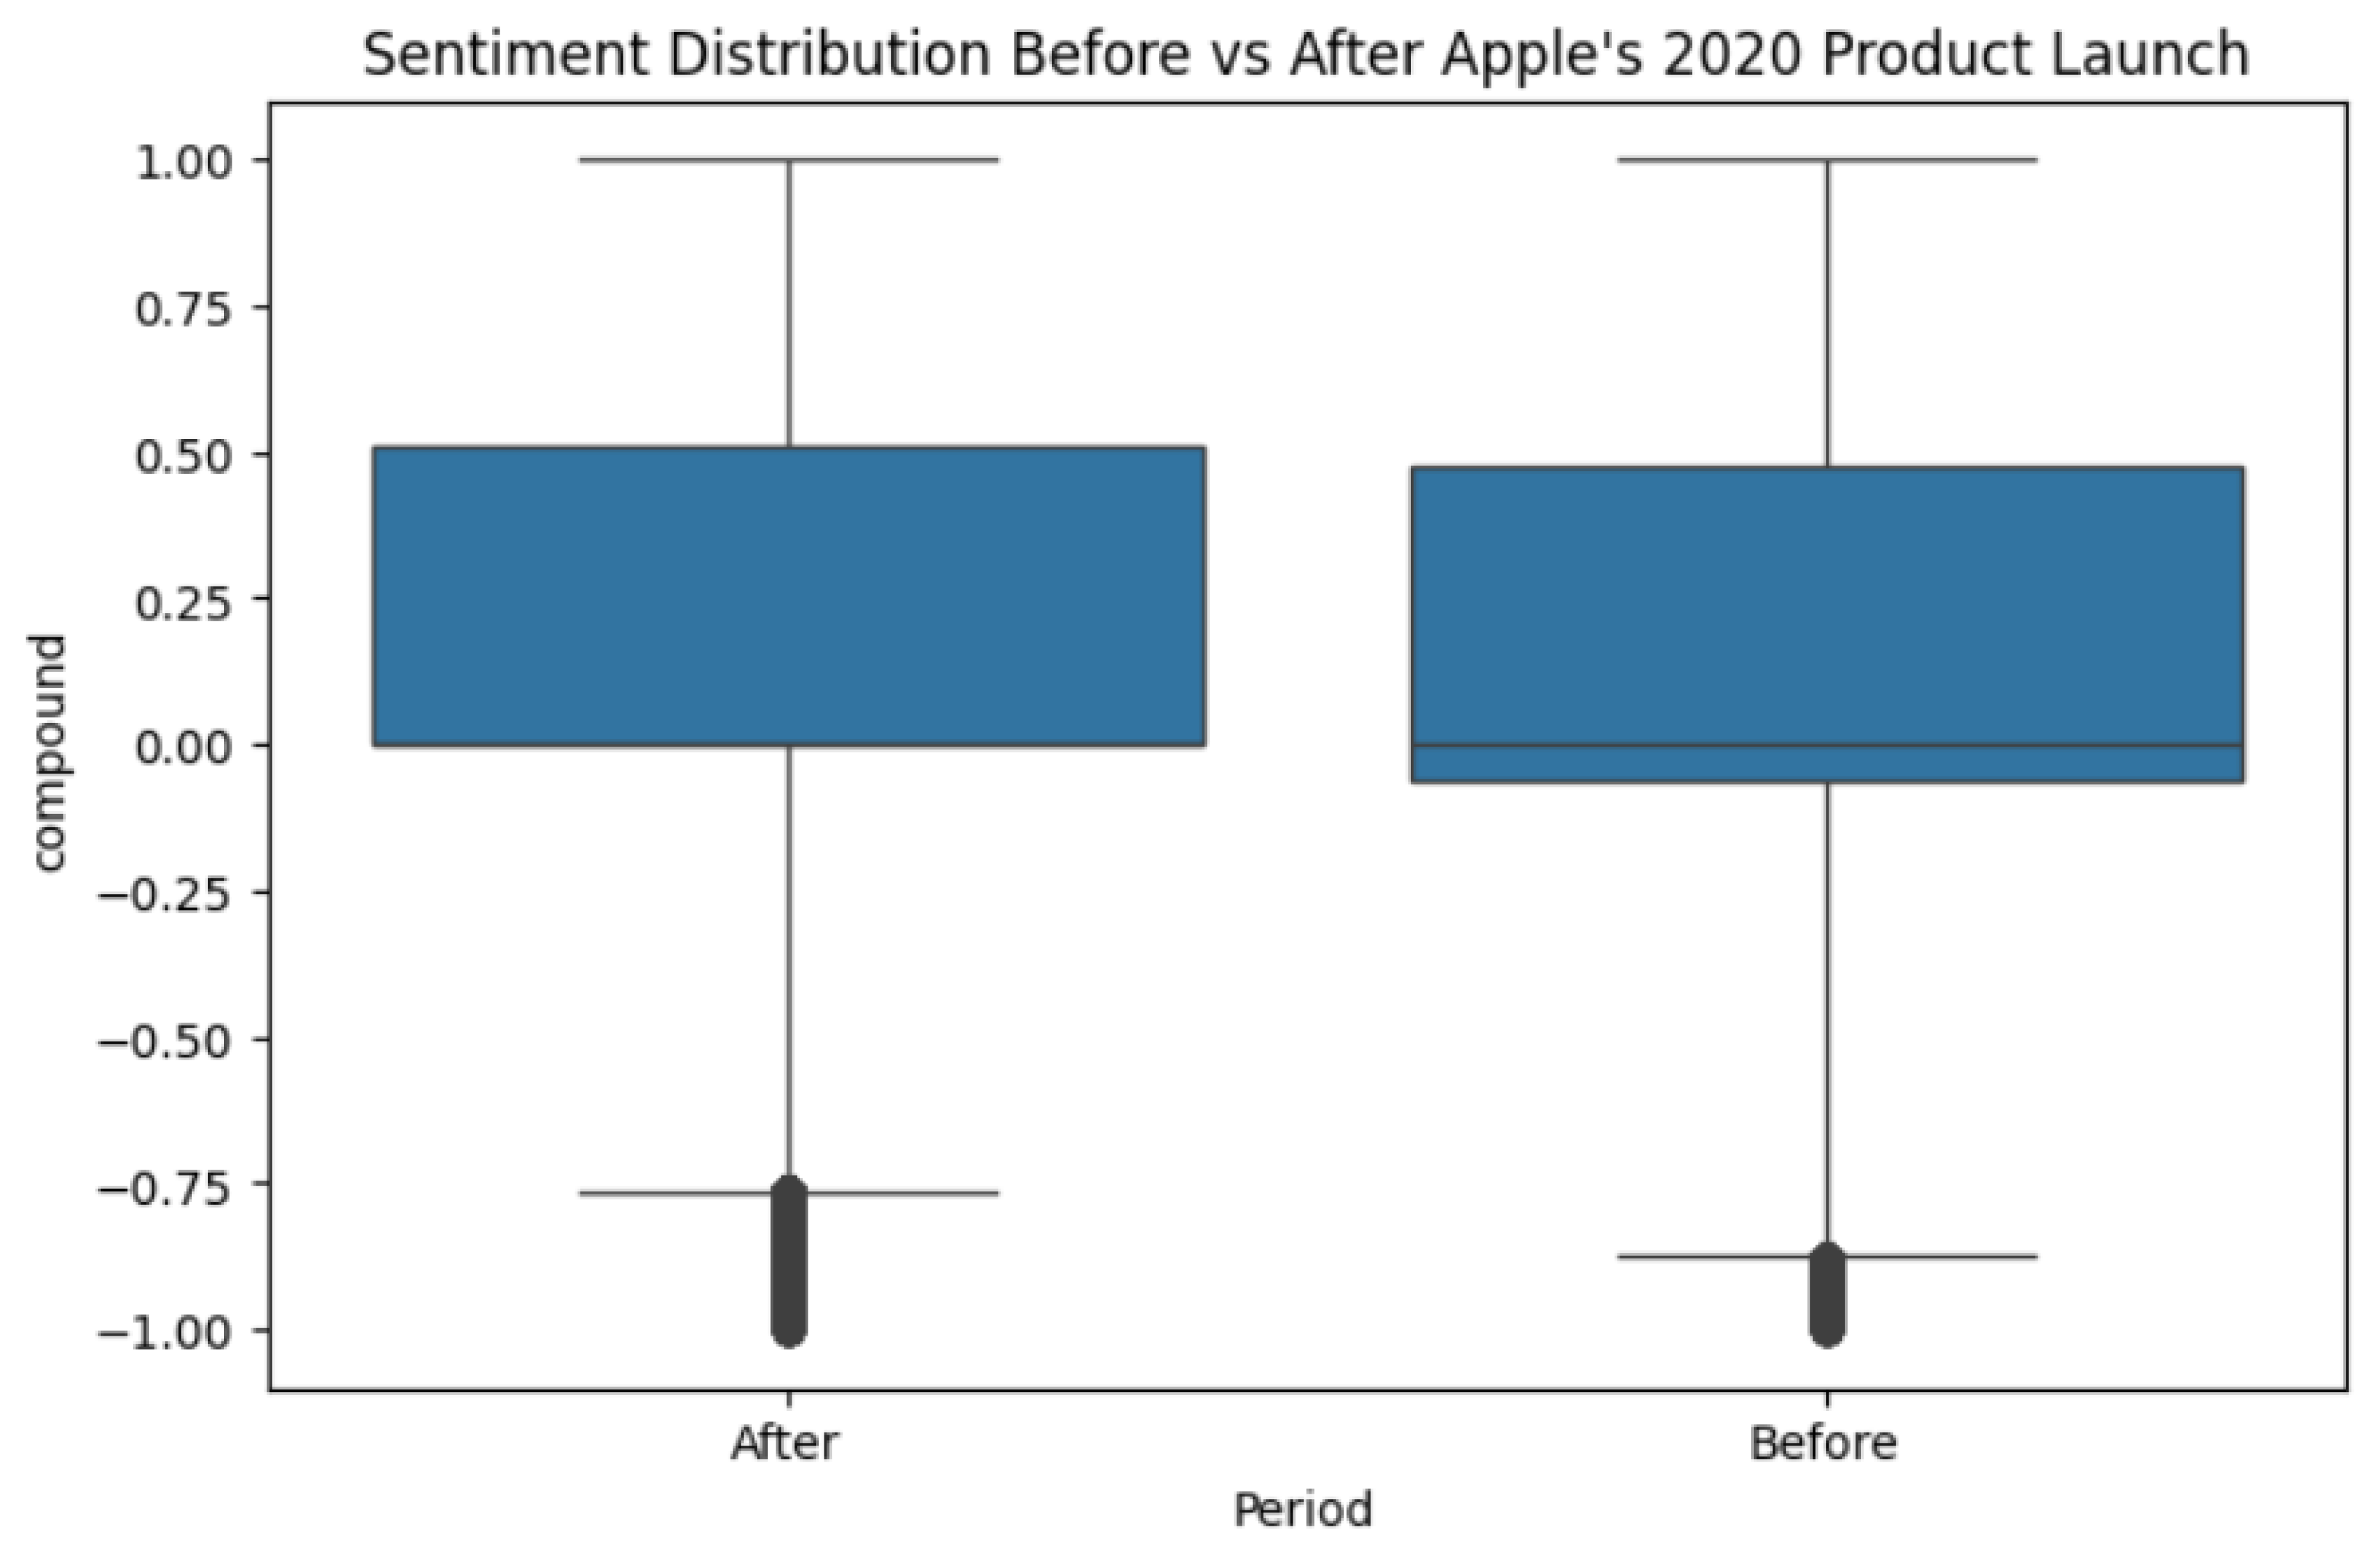
Because the sample size is extremely large, the t-test is highly powered, and even small differences become statistically significant. The effect size, however, is quite small. Practically, this means that while sentiment did become slightly more positive after the launch, the overall distribution of opinions did not shift dramatically. Both periods still contained a mix of enthusiastic, neutral, and critical comments.
3.4. Engagement Differences (RQ2)
RQ2 examined whether engagement changed around the launch. Mean Upvotes were 5.25 in the Before period and 5.15 in the After period. An independent-samples t-test indicated no statistically or practically meaningful difference, t(297,531) = −0.53, p = .59, with Cohen’s d ≈ −0.002.
Figure 3.
“Distribution of Upvotes Before vs. After Launch”.
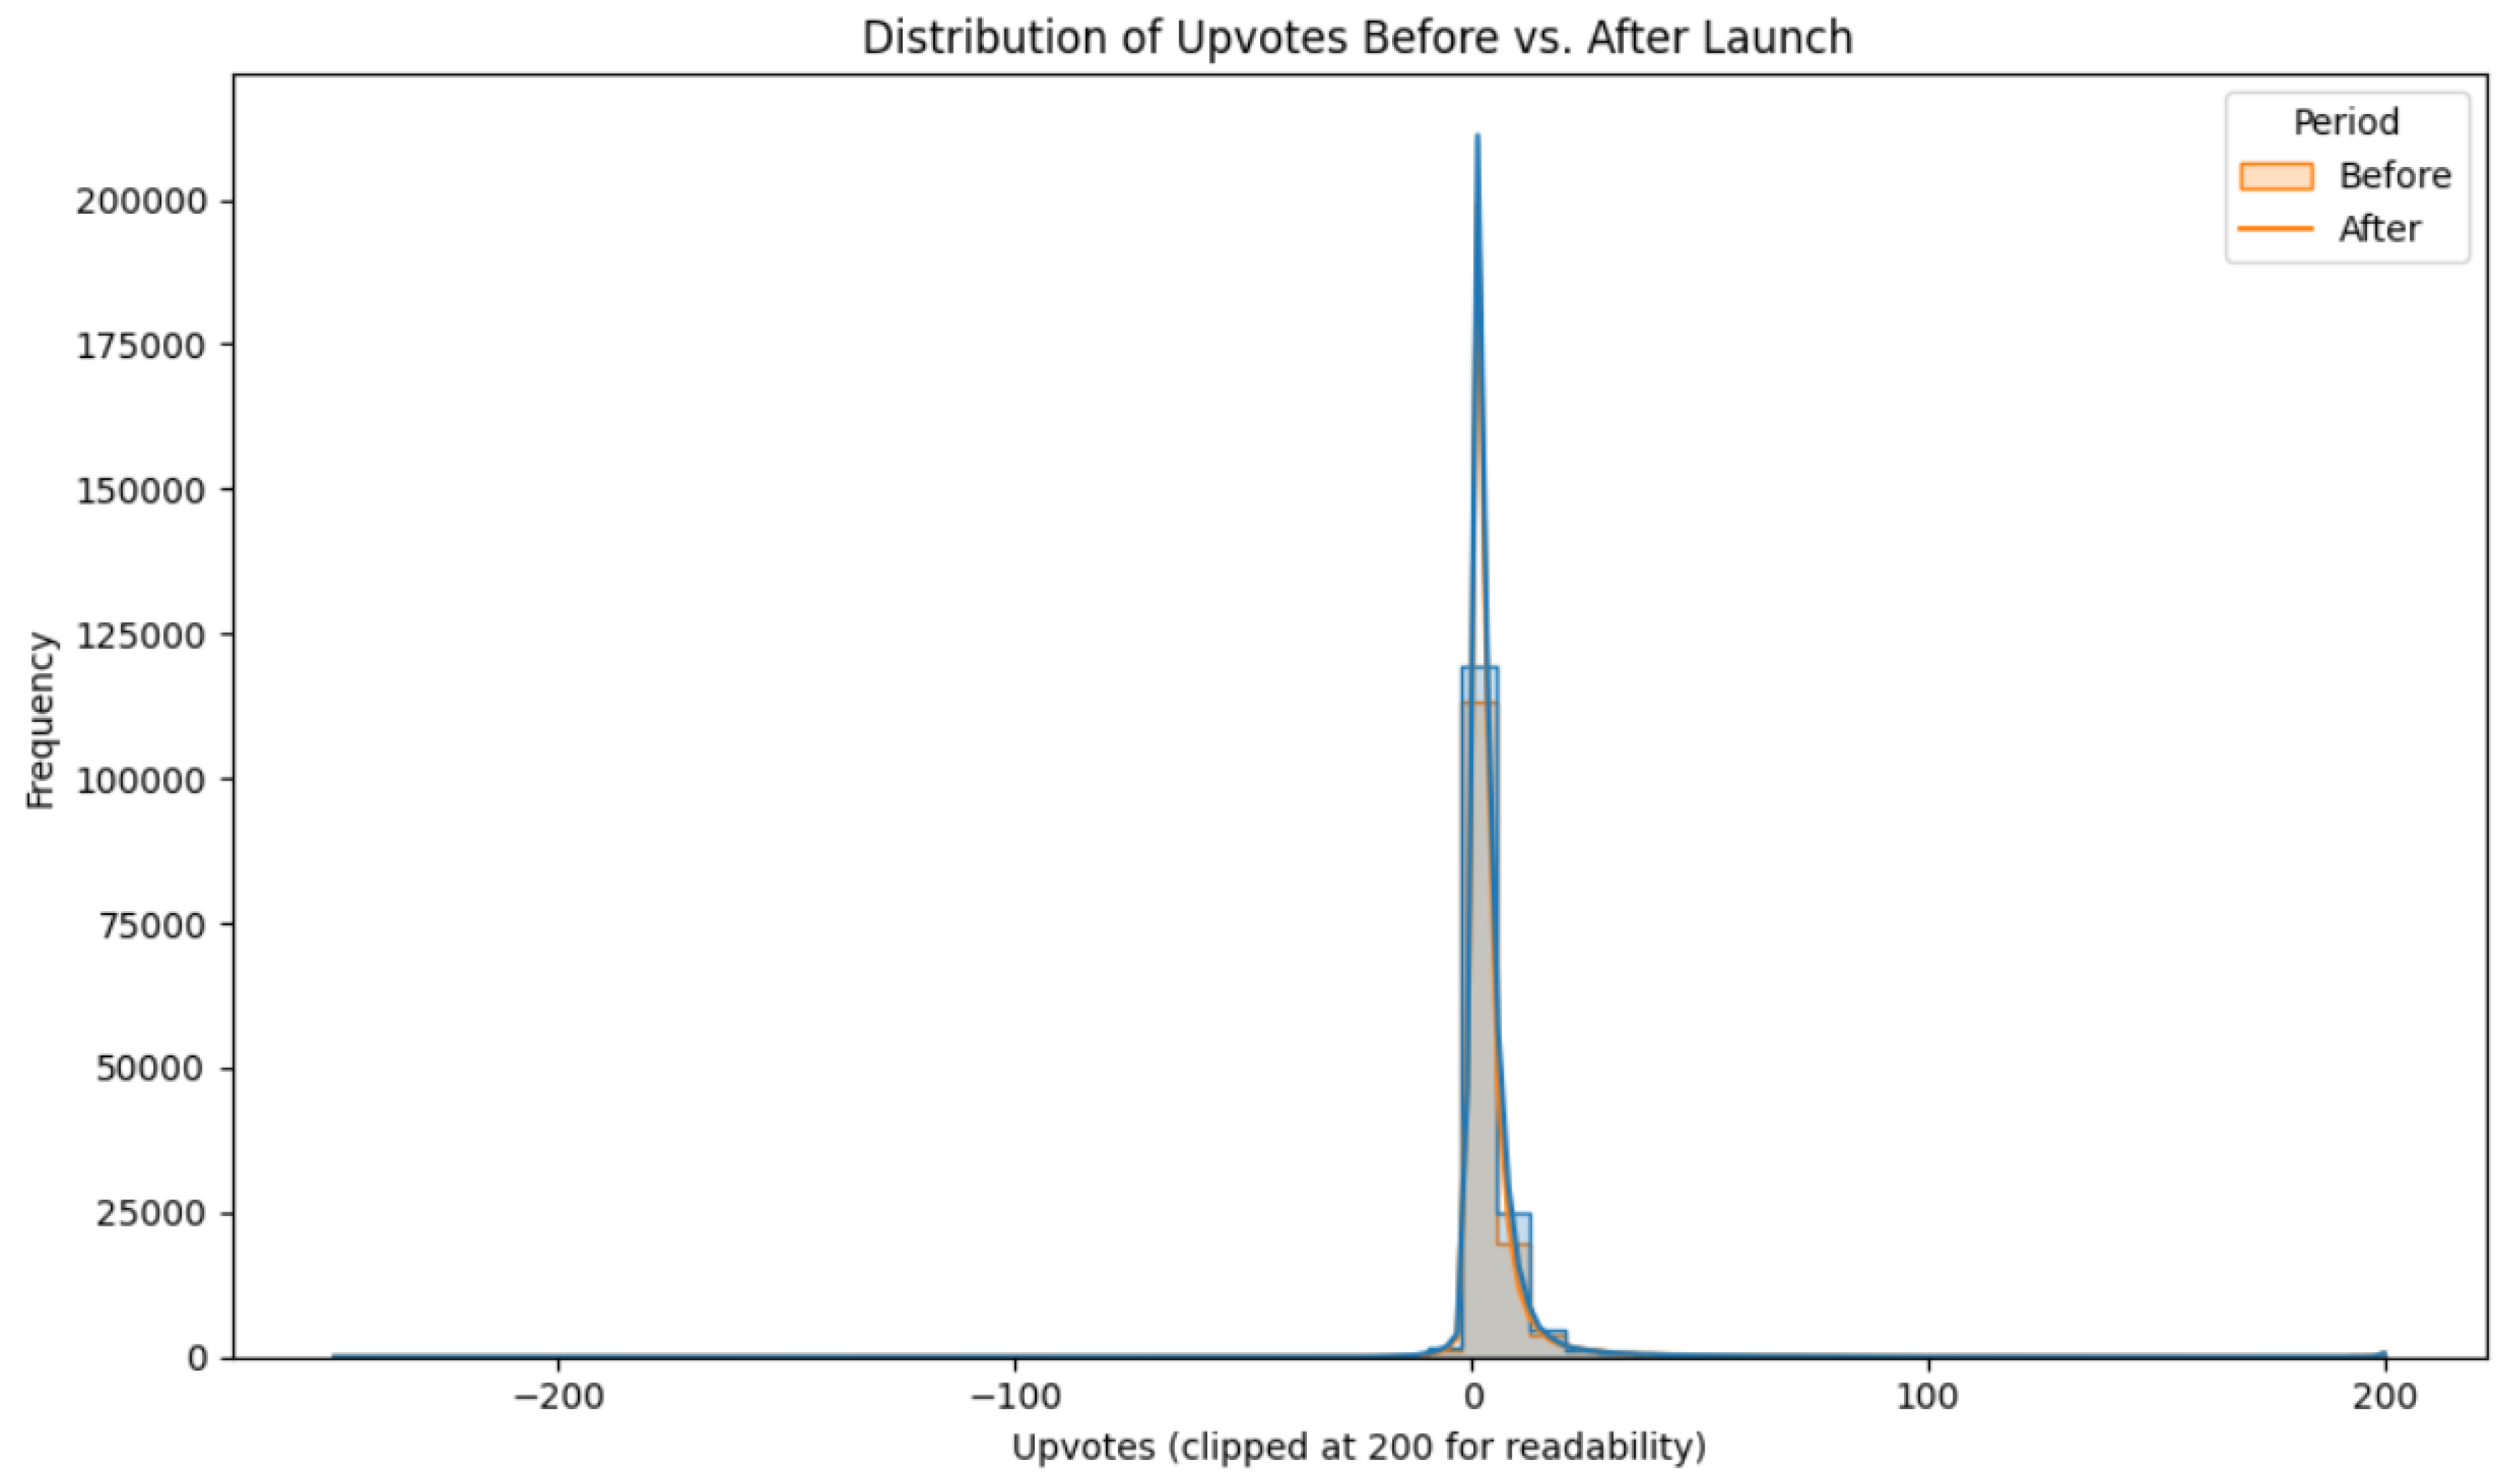
This result suggests that, despite a modest shift in emotional tone, the overall level of community interaction with Apple-related comments—at least as captured by upvotes—remained stable. In other words, the launch may have slightly brightened sentiment but did not noticeably change how much attention Apple commentary received.
3.5. VADER Sentiment Categories
To provide a more intuitive view of emotional tone, VADER scores were translated into three categories using standard thresholds:
- Positive (compound ≥ 0.05): 41% of comments
- Neutral (−0.05 < compound < 0.05): 38% of comments
- Negative (compound ≤ −0.05): 21% of comments
Figure 4.
“Bar Chart of VADER Sentiment Categories”.
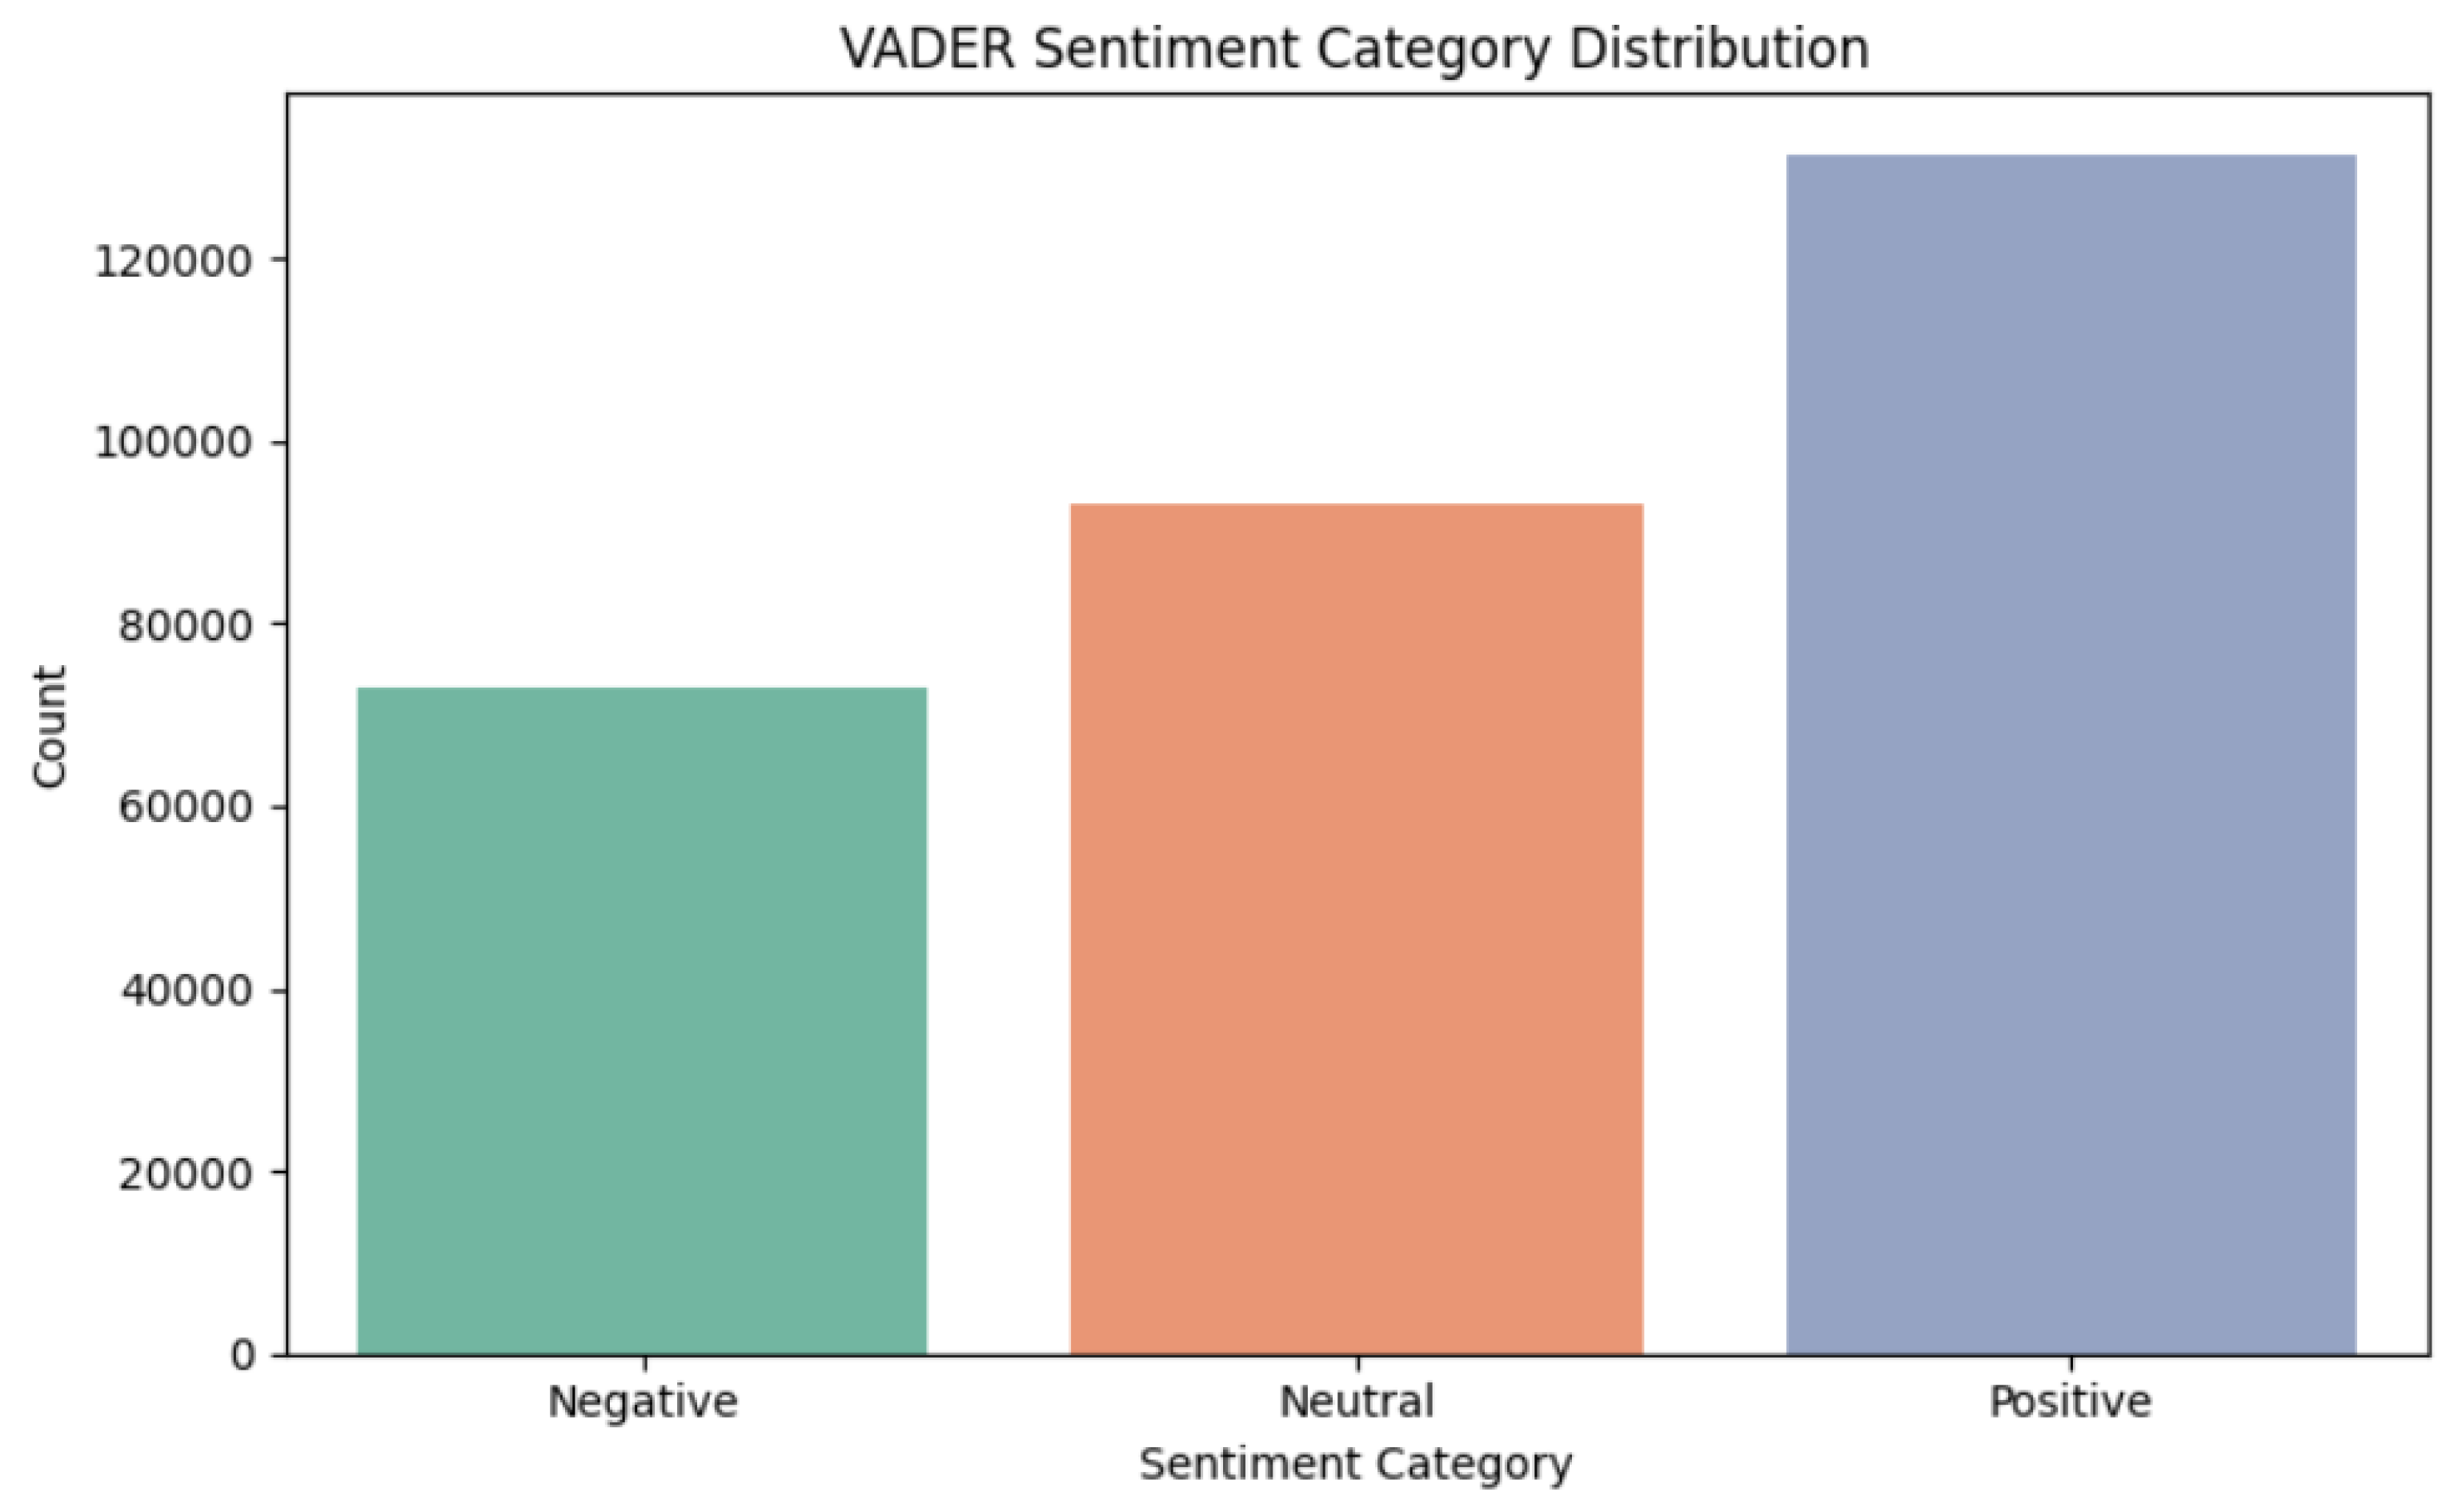
This distribution shows that a plurality of comments about Apple in Reddit finance communities were positive, but neutral and negative perspectives were also well represented. Informally inspecting the Before and After subsets indicated that all three categories were present in both periods, consistent with the small but positive shift in mean sentiment.
3.6. Text Length Distributions
Because text length can affect both sentiment detection and user engagement, its distribution was examined in more detail. The majority of comments were relatively short: the median word count was 18 words, and the 75th percentile was 41 words. However, the presence of very long posts (up to 2,000 words) created a long right tail.
Figure 5.
“Histogram of Word Count per Comment”.
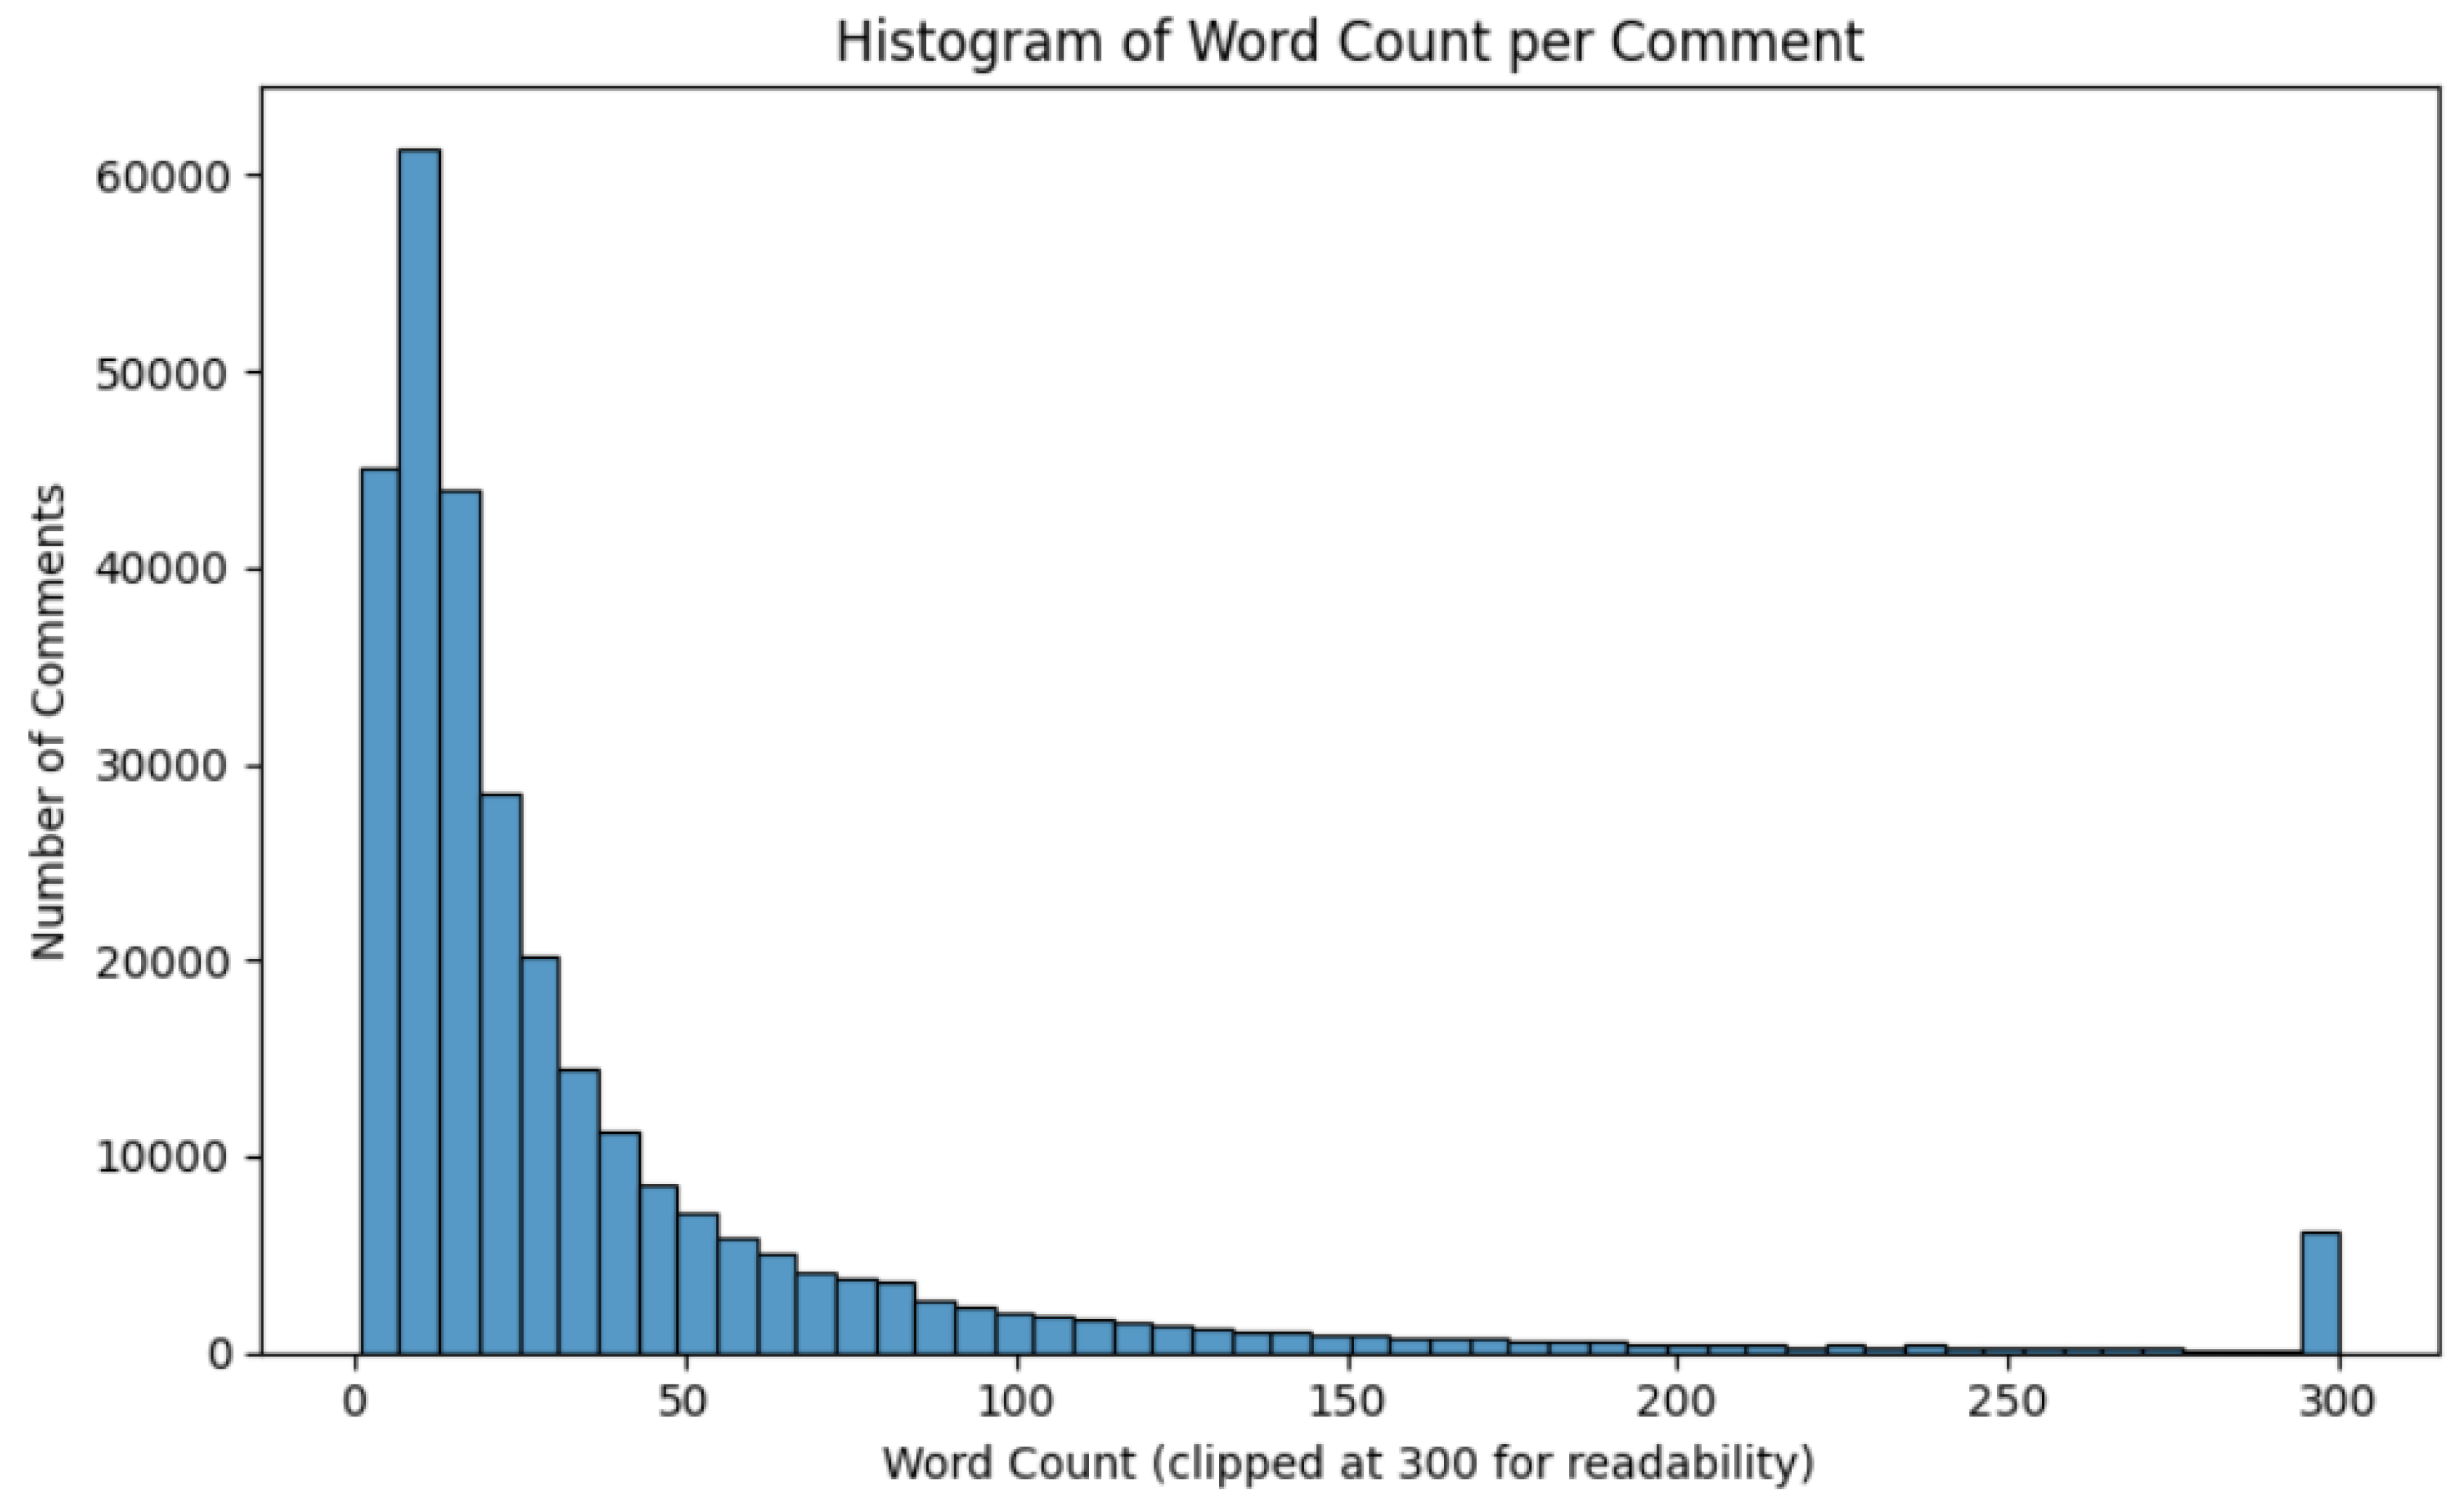
Figure 6.
“Density Plot of Character Length per Comment”.
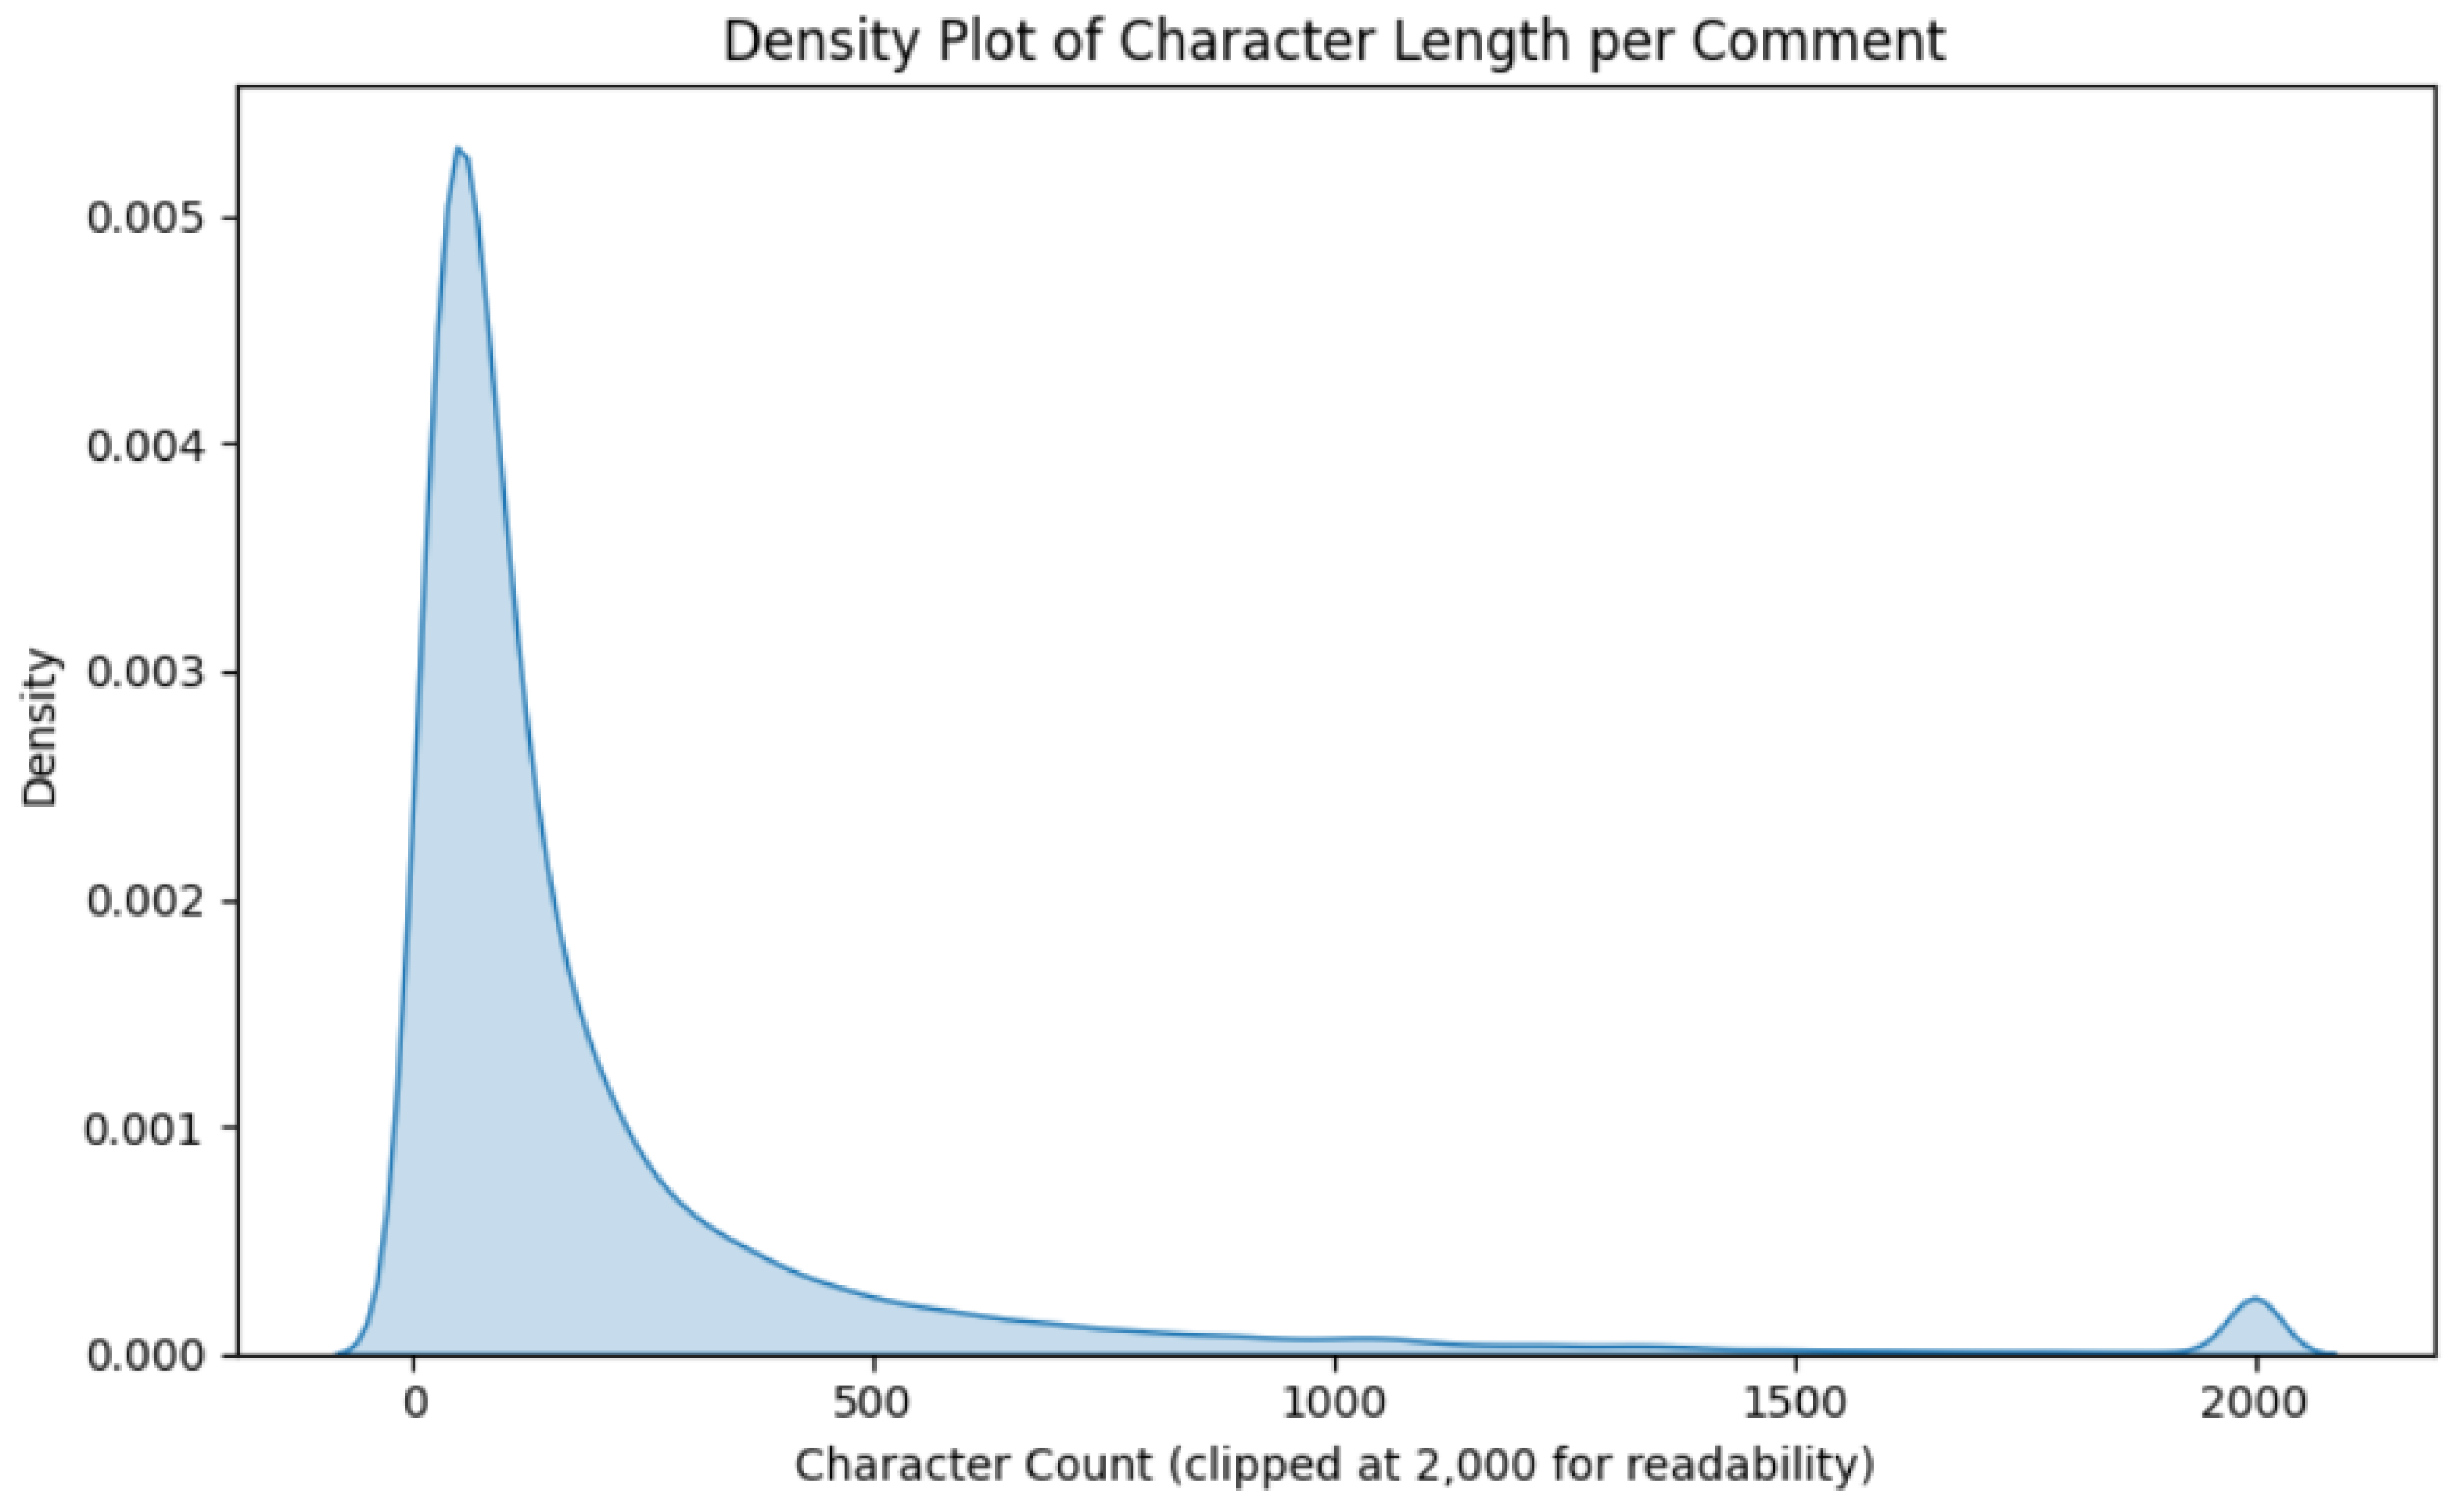
These plots confirm that Reddit discussions of Apple range from quick one-line reactions to detailed analyses or rants, providing a rich mixture of informal and reflective content.
3.7. Exploratory Transformer Comparison (RQ4)
Following the instructor’s recommendation, an exploratory pipeline was configured using the Unsloth library to fine-tune a modern transformer model (e.g., a LLaMA-style architecture) for sentiment classification on a subset of labeled comments. The planned procedure involved:
- Sampling a few thousand comments and manually labeling them as positive, neutral, or negative.
- Converting this labeled subset into a HuggingFace datasets object.
- Fine-tuning a small transformer model using Unsloth’s efficient training utilities.
- Comparing transformer predictions with VADER labels on a hold-out set.
However, due to GPU requirements and compatibility issues in the available environment, full training and evaluation were not completed. As a result, no quantitative accuracy metrics are reported for RQ4. Instead, the Discussion section outlines how a transformer model would be expected to improve on VADER—particularly for sarcasm, multi-sentence context, and finance-specific wording—based on prior research showing that domain-tuned transformers outperform lexicon approaches on financial sentiment tasks (Araci, 2019; Devlin et al., 2019).
4. Discussion
4.1. Summary of Findings
This study used over 297,000 Reddit comments to examine how sentiment and engagement around Apple shifted before and after the company’s 2020 product launch. Several key findings emerged.
First, sentiment became modestly more positive after the launch, supporting the first hypothesis (H1). Although the change in mean VADER score was small in magnitude, it was statistically reliable and consistent with the idea that successful product announcements can generate a slight uplift in online mood (Bollen et al., 2011; Seo & Park, 2018). This suggests that, at least within Reddit finance communities, Apple’s 2020 launch was received somewhat favorably.
Second, engagement levels remained essentially unchanged, supporting the second hypothesis (H2). Upvotes per comment did not differ meaningfully between the Before and After periods, indicating that the launch did not fundamentally alter how often users interacted with Apple-related posts. This is consistent with viewership patterns for major brands: attention is consistently high, and sentiment can fluctuate within that relatively stable engagement baseline (Kim & Kim, 2019; Sprout Social, 2025).
Third, the correlation analysis clarified how sentiment, text length, and engagement relate to each other (RQ3). Sentiment and Upvotes were nearly uncorrelated, suggesting that heavily upvoted comments are not simply the most positive or negative ones. Instead, engagement appears to be driven by other factors such as perceived informativeness, humor, or alignment with community norms (Schreiner et al., 2019). By contrast, sentiment showed small positive correlations with text length, implying that users who write longer comments are somewhat more likely to express strong emotional reactions—either supportive or critical. This pattern aligns with the intuitive expectation that individuals invest more effort when they care deeply about a topic.
Finally, while the transformer comparison (RQ4) remained conceptual rather than empirical, the attempt to configure an Unsloth-based pipeline underscores both the promise and the practical challenges of applying large language models to real-world course projects. Prior work with FinBERT and BERT indicates that a domain-tuned transformer would likely outperform VADER, especially on sarcastic or context-dependent comments (Araci, 2019; Devlin et al., 2019). However, the hardware required to fully train and evaluate these models can be a limiting factor in academic settings.
4.2. Limitations
Several limitations should be considered when interpreting these findings.
The first limitation concerns the sentiment measurement itself. VADER is a lexicon- and rule-based model optimized for short, informal text, but it does not fully capture sarcasm, complex context, or specialized financial language. Reddit finance communities frequently employ sarcasm, memes, and slang when discussing stocks and corporate events. For example, phrases like “AAPL to the moon” or ironic praise of Apple’s “courage” might be misinterpreted as straightforwardly positive. As a result, the reported sentiment scores should be viewed as approximate indicators of emotional tone, not perfectly accurate labels.
The second limitation involves the observational and platform-specific nature of the data. All comments came from Reddit, which has its own norms, demographics, and culture. Users are self-selected, anonymous, and often speculative traders rather than representative consumers. Consequently, the results cannot be generalized to the broader population of Apple customers or to other social media platforms such as Twitter, TikTok, or Instagram. In addition, without information on users’ holdings or actual trading behavior, it is not possible to directly link sentiment shifts to financial outcomes.
A third limitation is that the engagement metric—Upvotes—is a crude proxy for attention and does not capture all dimensions of interaction. Upvotes can be influenced by subreddit size, timing of the post, cross-posts, or moderation policies. Comments posted early in a fast-moving thread may accumulate more votes simply because they are visible longer, not because they express more interesting sentiment. The current analysis did not model these structural factors.
Finally, the transformer analysis remained conceptual due to hardware constraints. Without empirical performance metrics, conclusions about model superiority are based on prior literature rather than direct comparison on this specific dataset. Future work is needed to validate whether transformer models indeed provide substantial gains over VADER in this domain.
4.3. Future Directions
Despite these limitations, the project opens up several promising directions for future research.
First, a natural extension is to build a fully realized transformer-based sentiment classifier for Apple-related financial text. Using tools such as Unsloth or HuggingFace Transformers, researchers could manually label a subset of comments and fine-tune a model like FinBERT or LLaMA-3 on these domain-specific examples. Performance could then be compared directly against VADER using accuracy, F1-score, and confusion matrices. This would clarify whether modern models capture sarcasm, idioms, and financial jargon more accurately than lexicon approaches.
Second, future studies could examine links between sentiment and market behavior by aligning Reddit comments with daily Apple stock returns, trading volume, or options activity. Methods developed in prior work on Twitter and news sentiment (Bollen et al., 2011; Tetlock, 2007) could be adapted to test whether shifts in Reddit sentiment around product launches are associated with short-term price reactions or volatility. Such analyses would move the project from describing online conversation toward quantifying its economic relevance.
Additional expansions might include cross-platform comparisons (e.g., Reddit vs. Twitter), user-level longitudinal analyses (following the same users over time), or topic modeling to distinguish reactions to different product categories (phones, laptops, services).
4.4. Practical Implications
For practitioners, these findings highlight the value—and limits—of social media sentiment tracking for major brands like Apple. The small but significant increase in sentiment after the 2020 launch suggests that product announcements can shift emotional tone in finance communities, even if engagement metrics such as upvotes remain stable. Marketers and communications teams can use this information to validate whether messaging around a launch is broadly positive, and to identify subcommunities or threads where sentiment diverges from the overall pattern.
At the same time, the weak relationship between sentiment and Upvotes cautions against over-reliance on engagement metrics as a proxy for brand health. A heavily upvoted comment is not necessarily complimentary; it may be humorous, controversial, or critical. Combining sentiment analysis with engagement data, rather than using either metric alone, yields a more nuanced view of audience response.
For researchers and analytics professionals, this project demonstrates how publicly available social media data can be integrated with modern NLP tools in a reproducible pipeline. Even when computational resources limit the use of large transformers, lexicon-based methods like VADER provide a strong baseline for exploratory analysis. As access to GPU resources improves, the same workflow can be extended to more advanced models, enabling deeper insights into how online communities react to major corporate events.
References
- Araci, D. FinBERT: Financial sentiment analysis with pre-trained language models. arXiv preprint 2019, arXiv:1908.10063. [Google Scholar]
- Barber, B. M.; Huang, X.; Odean, T.; Schwarz, C. Attention-induced trading and returns: Evidence from Reddit’s WallStreetBets. NBER Working Paper No. 28960. 2021. [Google Scholar]
- Bollen, J.; Mao, H.; Zeng, X. Twitter mood predicts the stock market. Journal of Computational Science 2011, 2(1), 1–8. [Google Scholar] [CrossRef]
- Devlin, J.; Chang, M.-W.; Lee, K.; Toutanova, K. BERT: Pre-training of deep bidirectional transformers for language understanding. Proceedings of NAACL-HLT, 2019; pp. 4171–4186. [Google Scholar]
- Hutto, C. J.; Gilbert, E. VADER: A parsimonious rule-based model for sentiment analysis of social media text. Proceedings of ICWSM, 2014; pp. 216–225. [Google Scholar]
- Kim, M.; Kim, J. The effect of brand experiences on brand loyalty: Focusing on Apple’s product ecosystem. Journal of Product & Brand Management 2019, 28(5), 684–696. [Google Scholar]
- Rechenthin, M.; Street, W. N.; Elhadi, S. S. Twitter sentiment and stock returns: The case of the energy sector. Journal of Behavioral Finance 2014, 15(1), 1–16. [Google Scholar]
- Revuze. Customer sentiment and brand reputation in the digital era [Industry report]. Revuze. 2025. [Google Scholar]
- Schreiner, M.; Fischer, M.; Riedl, R. Impact of content characteristics and emotion on user behavior on Reddit. Decision Support Systems 2019, 124, 113111. [Google Scholar]
- Seo, E.-J.; Park, J.-W. A study on the effects of marketing mix and brand image on consumer behavior. Journal of Business Research 2018, 88, 234–242. [Google Scholar]
- Shapiro, C. The psychology behind product launch events. Journal of Marketing Theory and Practice 2018, 26(4), 345–360. [Google Scholar]
- Sprinklr. State of social media sentiment; Sprinklr Insights, 2025. [Google Scholar]
- Sprout Social. Social listening and brand sentiment report. Sprout Social. 2025. [Google Scholar]
- Tetlock, P. C. Giving content to investor sentiment: The role of media in the stock market. The Journal of Finance 2007, 62(3), 1139–1168. [Google Scholar] [CrossRef]
- Warkulat, J. Investor sentiment and risk-taking in social trading communities. Finance Research Letters 2024, 57, 104223. [Google Scholar]

Table 2.
“Correlation Matrix”.
| compound | upvotes | Word_length | Char_length | |
| compound | 1.00 | 0.002 | 0.252 | 0.231 |
| upvotes | 0.002 | 1.00 | 0.004 | 0.003 |
| Word_length | 0.252 | 0.004 | 1.00 | 0.982 |
| Char_length | 0.231 | 0.003 | 0.982 | 1.00 |
Disclaimer/Publisher’s Note: The statements, opinions and data contained in all publications are solely those of the individual author(s) and contributor(s) and not of MDPI and/or the editor(s). MDPI and/or the editor(s) disclaim responsibility for any injury to people or property resulting from any ideas, methods, instructions or products referred to in the content. |
© 2025 by the authors. Licensee MDPI, Basel, Switzerland. This article is an open access article distributed under the terms and conditions of the Creative Commons Attribution (CC BY) license (http://creativecommons.org/licenses/by/4.0/).
Copyright: This open access article is published under a Creative Commons CC BY 4.0 license, which permit the free download, distribution, and reuse, provided that the author and preprint are cited in any reuse.


