Submitted:
05 December 2025
Posted:
08 December 2025
You are already at the latest version
Abstract
Prolonged +Gz acceleration during high-performance flight exposes pilots to the risk of G-induced loss of consciousness (G-LOC), a dangerous condition that compromises operational safety. To enable early detection without intrusive sensors, we present a vision-based warning system that analyzes facial action units (AUs) as physiological indicators of impending G-LOC. Our approach combines computer vision with physiological modeling to capture subtle facial microexpressions associated with cerebral hypoxia using widely available RGB cameras. We propose a novel Graph Convolution-Augmented Vision Transformer (GC-ViT) network architecture that effectively captures dynamic AU variations in pilots under G-LOC conditions by integrating global context modeling with vision Transformer. The proposed framework integrates a vision-semantics collaborative Transformer for robust AU feature extraction, where EfficientNet-based spatiotemporal modeling is enhanced by Transformer attention mechanisms to maintain recognition accuracy under high-G stress. Building upon this, we develop a graph-based physiological model that dynamically tracks interactions between critical AUs during G-LOC progression. By learning the characteristic patterns of AU co-activation during centrifugal training. Experimental validation on centrifuge training datasets demonstrates strong performance, achieving an AUC-ROC of 0.898 and an AP score of 0.96, confirming the system’s ability to reliably identify characteristic patterns of AU co-activation during G-LOC events. Overall,this contact-free system offers an interpretable solution for rapid G-LOC detection, or as a complementary enhancement to existing aeromedical monitoring technologies. The non-invasive design demonstrates significant potential for improving safety in aerospace physiology applications without requiring modifications to current cockpit or centrifuge setups.
Keywords:
G-LOC
; graph convolutionalnetwork (GCN)
; AUs
; biomedical image processing
; aerospace physiology
; medical monitoring
; control
1. Introduction
High G maneuvers (9–10 +Gz) in advanced aircraft can cause G-LOC due to reduced cerebral blood flow, leading to 20 seconds of unconsciousness and minutes-long recovery. This endangers flight safety, especially during precision maneuvers. U.S. Air Force data reports 559 G-LOC cases, with 30–50 annual crashes linked to it. Post-G-LOC symptoms include cognitive impairment, headaches, and vision issues, highlighting the need for better pilot training to mitigate risks.
Real-world flight training is crucial for enabling pilots to develop the ability to withstand high-G loads and reduce the risk of G-LOC. However, this training entails inherent safety risks, and the rapid variations in acceleration make it difficult to measure the forces experienced precisely. This challenge complicates the assessment of training program effectiveness. To address these limitations, high-performance human centrifuges (HPHC) have emerged as invaluable tools for simulating high-G conditions in a controlled environment. By providing realistic high-G exposures, HPHC allows pilots to gradually adapt to the physiological stresses of high-G environments, thereby improving their tolerance and reducing the incidence of G-LOC during actual flights.
HPHC training is typically overseen by aeromedical operators, who continuously monitor the pilots through video surveillance that records the pilots’ real-time images. Based on the responses of the trainees, the training intensity can be adjusted to optimize performance while minimizing the risk of G-LOC. Ideally, training should be halted as soon as symptoms of G-LOC are identified, such as lack of eye contact, increased facial stress, or mild muscle tension in the face. AO issued a medical stop order when early signs were detected, halting the centrifuge from continuing to exert acceleration. However, G-LOC often develops subtly and may occur before any obvious symptoms become apparent. The rapid progression and transient nature of these early signs make it exceptionally challenging for aeromedical operators (AO) to detect and interpret them in real time, even with extensive experience.
Owing to enhanced signal-to-noise ratio and information transfer rate, brain-computer interfaces (BCIs) and electroencephalogram (EEG) technology have been increasingly applied in neural state monitoring in recent years [1]. Recent studies have employed machine learning to analyze biosensor data for objectively assessing an individual’s state in PTSD, moving beyond traditional self-reporting methods [2]. Similar to this approach, G-LOC research leverages biosensor data to detect pre-syncopal autonomic nervous system instability, providing a parallel for using physiological markers rather than self-reports for objective diagnosis. In an effort to reduce reliance on subjective human judgment among aeromedical operators, researchers have explored the use of machine learning techniques to predict G-LOC. Current methods for G-LOC prediction often depend on sensor-based equipment, such as EEG [3,4], electromyography (EMG) [5], and eye tracking devices [6]. Notably, pupil diameter and EEG features, particularly the power measured at the parietal site, were identified as critical indicators for the early detection of G-LOC [7]. Previous studies have demonstrated the potential of combining physiological indicators with physical manifestations to assess a pilot’s precursor state of consciousness. Despite these advancements, current methods often rely on sensor-based equipment, which can interfere with training and limit practicality [8]. Despite the performance advantages of deep learning algorithms, their deployment on mobile and wearable devices faces challenges due to limited computational power, memory capacity, and battery life, which restrict the local execution of complex models. Moreover, the reliance on multiple sensors increases operational complexity and cost, limiting the scalability of these solutions [9].
The inherent challenges in detecting early signs of G-LOC during high-G training highlight the need for more nuanced physiological monitoring systems. While AO traditionally rely on observable symptoms like facial tension or loss of eye contact, these indicators often appear too late to prevent an impending loss of consciousness. This is where Facial Action Coding System (FACS) AUs based micro-expression analysis can play a transformative role [10]. By focusing on subtle, involuntary facial muscle movements that precede overt symptoms, AUs analysis provides a more granular and objective assessment of a pilot’s physiological state.
Microexpressions captured through AU coding, such as brow furrowing or eyelid tightening, can serve as early biomarkers of cerebral hypoxia long before conscious impairment becomes apparent. These micro-level facial actions are difficult for human observers to consistently detect in real time due to their fleeting nature, but computer vision algorithms trained in AU recognition can identify these patterns with high precision. When integrated with existing monitoring systems, AU analysis could enable earlier intervention by correlating specific facial action units with declining cognitive function.
The application of AU analysis in this context represents a shift from reactive to predictive monitoring. By detecting the earliest physiological precursors to G-LOC often before the pilot is even aware of them, this technology could provide critical extra seconds for preventive measures. As high-performance aviation continues to push physiological limits, such advanced biometric monitoring may become indispensable for maintaining pilot safety during extreme maneuvers. The integration of AU-based systems with traditional aeromedical oversight could significantly reduce G-LOC-related risks while optimizing high-G training protocols.
To address these limitations, we propose an innovative, image-based method for real-time G-LOC prediction during HPHC training. Unlike existing sensor-based approaches, we propose a novel Vision Transformer (ViT) framework for AU feature extraction. The core innovation lies in its visual-semantic collaborative modeling architecture, which effectively integrates convolutional neural networks (CNNs) with vision Transformers. Specifically, the framework employs ResNet at the bottom layer to process image sequences, capturing spatiotemporal dynamics of facial microexpressions. Leveraging the long-range interaction capabilities of self-attention and cross-attention mechanisms in Transformers, we introduce a semantic-embedded label query network and an instance-conditioned code language model. The label query network adopts an encoder-decoder structure, where each AU label is represented as a learnable query.
Furthermore, we develop a graph convolutional hybrid network tailored for G-LOC prediction. This network innovatively combines graph convolution with physiological prior knowledge to construct an AU correlation graph. By incorporating a dynamic graph learning mechanism, the model adaptively adjusts inter-AU relationship strengths while preserving physiological plausibility.
To address these problems and build upon previous experiences, a new method for G-LOC detection based on facial action units is proposed. The contributions are as follows:
- We introduce the pioneering non-invasive, sensor-free G-LOC prediction system leveraging AUs as physiological biomarkers. In contrast to traditional methods requiring physical attachments, our framework relies uniquely on RGB cameras to capture subtle microexpressions related to AU linked to cerebral hypoxia.
- We propose a novel vision-semantics collaborative Transformer for AU feature extraction, combining spatiotemporal modeling with the attention mechanisms of Transformer’s. By encoding each AU label as a learnable query, which dynamically interacts with visual features via cross-attention, our approach achieves precise AU recognition even under high-stress conditions.
- We propose a novel GC-ViT framework for G-LOC detection through AU analysis. The model incorporates motivated graph structures where nodes represent key AUs and edges capture their dynamic interactions during G-LOC. Evaluated on centrifuge training data, the framework achieves strong performance with an AUC-ROC of 0.898 and an AP of 0.96.
The remainder of this paper is structured as follows: Section II reviews related work on AU detection and the application of GCNs in AU recognition. Section III introduces the proposed GC-ViT architecture, designed for accurate recognition of G-LOC related facial movements. Section IV validates the effectiveness of the proposed system through ablation studies and generalization experiments. Finally, Section V summarizes the overall work and provides a comprehensive conclusion regarding the model’s performance.
2. Related Research Progress
2.1. Facial AU Detection
Deep learning has revolutionized AU feature extraction, with CNNs becoming the standard tool. The DRML network by Zhao et al. [11] took an interesting approach. It chopped faces into 64 identical blocks (8 × 8 grid) and processed each with dedicated convolutional filters. While this localized processing showed promise, its biggest flaw was treating all facial regions equally, completely overlooking the anatomical insights from FACS that could have dramatically improved results. Wei Li et al. [12] introduced EAC-Net, an approach designed to focus specifically on AU activation centers through enhancement and cropping techniques. While effective at localizing individual AUs, the method has two key limitations: it fails to capture interdependencies between different AUs, and its region-of-interest detection lacks precise supervision, resulting in only approximate localization.
Wu et al. developed an innovative CNN-based approach that learns discriminative features by comparing neutral facial expressions with AU-activated ones. Their contrastive learning framework effectively captures the subtle facial changes triggered by AU activation, creating a robust foundation for detection [13]. Building on regional analysis, Yao Xia’s TRA-Net takes a structured approach by segmenting the face into three vertical zones (upper, middle, lower). The architecture employs a cascaded attention mechanism that refines features within each anatomical region, allowing for precise AU classification based on spatial distribution patterns [14].
2.2. Graph Convolutional Network Modeling
Graph convolutional networks have developed along two main theoretical lines: spatial approaches and spectral methods. The spatial paradigm implements convolution directly on graph nodes and their local neighborhoods through various aggregation schemes. For example, Atwood et al. [15] designed diffusion-convolutional networks using transition matrices to define dynamic node neighborhoods, while Niepert et al. [16] introduced a normalized fixed-size neighborhood sampling method to establish uniform receptive fields. On the spectral side, researchers have leveraged graph Fourier transforms derived from Laplacian eigendecomposition, with Bruna et al. [17] pioneering this approach through their spectral network formulation that performs convolution in the frequency domain. Building upon these foundations, recent work by Li et al. [18] successfully combined gated graph networks with facial action unit recognition in their SRERL framework, demonstrating how these fundamental graph convolution techniques can be adapted for specific computer vision tasks while maintaining their theoretical underpinnings.
3. Methodology
3.1. Model Architecture Overview
This study presents an enhanced Transformer-based architecture for AU detection, designed to capture subtle facial expressions in HPHC training scenarios. As illustrated in Figure 1, the proposed GC-ViT architecture adopts an encoder-decoder framework with multi-stage feature extraction and semantic-guided attention mechanisms to achieve precise recognition of G-LOC-related facial movements.
To further exploit inter-dependencies among AUs, we incorporate GCN-based relationship modeling within the GC-ViT framework. The GCN module utilizes the initially detected AU probabilities as node features, while incorporating established AU correlations as prior knowledge for graph construction. Through stacked graph convolution operations performed on this relational graph, the model produces updated feature representations that reflect learned AU interdependencies. These enhanced features are subsequently utilized for the final classification task of determining pilot consciousness states.
As shown in the GC-ViT Architecture, the proposed system systematically integrates visual feature extraction, semantic-visual interaction, and structured AU relationship modeling to enhance the detection of G-LOC in HPHC training scenarios. The refined AU representations, enriched by graph-based dependency learning, serve as discriminative features for assessing the pilot’s G-LOC state. By capturing subtle facial movements and their interdependencies, our GC-ViT Architecture provides a robust framework for real-time consciousness monitoring under high-G conditions.
3.2. ViT for AU Detetion
The encoder module employs a ResNet-50 backbone network to extract hierarchical visual features from the input image . Through five convolutional blocks, the network generates a feature map with spatial dimensions and , where denotes the channel depth. To adapt these features for Transformer-based processing, a convolutional layer reduces the channel dimension to , yielding . The spatial features are then flattened into a sequence representation , where corresponds to the number of spatial positions.
For positional encoding, we implement learnable 2D position embeddings that preserve spatial structure while avoiding potential inductive biases associated with traditional sinusoidal encoding:
where contains learnable positional parameters. This approach maintains critical spatial relationships between facial regions while allowing flexible adaptation to varying input resolutions.
The encoder’s primary function is to enhance visual features corresponding to key facial regions including eyelids, eyebrows, and perioral areas that exhibit characteristic muscle movement patterns during G-LOC episodes. Through hierarchical feature extraction and spatial encoding, the encoder captures both: Local muscle activation patterns. The encoded features thus contain rich, position-aware representations of facial dynamics essential for subsequent AU-specific decoding. The encoder architecture effectively transforms raw pixel data into a structured, high-level representation suitable for analyzing subtle neuromuscular changes characteristic of G-LOC progression. Subsequent cross-attention mechanisms in the decoder can then focus on clinically relevant spatial-temporal patterns within this optimized feature space.
The decoder module employs a set of C learnable AU query vectors denoted as , where each query vector encapsulates the semantic representation of a specific AU (e.g., encodes "AU01=inner brow raiser"). These query vectors interact with the encoded visual features through a cross-attention mechanism, formally expressed as:
Here, denotes the baseline ocular region embedding and represents a learnable displacement vector. The model further employs multi-head attention (with 8 parallel attention heads) to capture heterogeneous feature subspace relationships, where each attention head computes:
This equation computes the h-th attention head’s output in a multi-head attention layer. Here, , , and are the query, key, and value matrices for head h, while d is the feature dimension and H is the number of attention heads. The scaled dot-product attention first measures similarity between queries and keys, then applies softmax to get attention weights, which are used to weight the values.
This section presents a Transformer-based framework for AUs feature extraction. The model employs learnable AU query vectors to enhance visual feature encoding through self-attention mechanisms in the encoder module. Subsequently, cross-attention operations are applied to extract AU-specific semantic representations from the encoded visual features. The incorporation of multi-head attention further enables the model to capture heterogeneous interactions across different feature subspaces, thereby strengthening its discriminative capacity for G-LOC-relevant micro-expression AUs.
3.3. GCN for AU Relationships Modelling
AUs are controlled by facial muscles and constrained by facial anatomy, resulting in inherent relationships between their intensities. During anti-G straining maneuvers under high-G conditions, pilots activate specific AUs. To assess training effectiveness, this study develops an intensity correlation model to capture the interactions between different AUs. Co-occurrence relationships arise when certain AUs are frequently activated together due to muscle interactions, such as cheek raising and lip corner pulling. Conversely, mutual exclusion relationships describe AUs that rarely co-occur, such as brow lowering and lip corner stretching in natural expressions. The structural dependencies among AUs influence not just their activation but also their intensity relationships. For instance, AU01 (inner brow raiser) and AU02 (outer brow raiser), both controlled by the muscle, typically activate together with correlated intensities. The Pearson correlation coefficient is calculated as:
where Y denotes facial action unit indices, and are the standard deviation and mean of sample X, respectively. The Pearson correlation coefficient is derived from the covariance divided by the product of standard deviations.
The coefficient ranges from -1 to 1. Values approaching 1 indicate strong co-activation relationships, while values near -1 suggest mutual exclusion. A coefficient of 0 implies no linear relationship between AU intensities. Based on centrifuge training video data of pilots performing anti-G straining maneuvers, we computed a heatmap of Pearson correlation coefficients to visualize these inter-AU relationships. This quantitative analysis enables objective evaluation of G-force respiratory training effectiveness through facial muscle activation patterns.
The inputs , , …, are fed into the graph convolutional network of the facial action unit learning module. Through learning in the two-layer graph convolutional network, the outputs , , …, are obtained. The formula for the graph convolutional network is as shown in:
Here, represents the output of the graph convolutional network, i.e., , , …, . represents the input of the graph convolutional network, i.e., , , …, . denotes the adjacency matrix, which is a dependency matrix derived from statistical analysis of facial action unit dependencies in the dataset. and are the parameters of the graph convolutional network, and Relu represents the activation function.
The 12×1 AU feature vector learned through graph convolutional networks is fed into a fully connected layer for feature transformation. This dense layer linearly maps the 12 dimensional AU feature space to a 2-dimensional space, corresponding to the binary classification task of determining whether a pilot experiences G-LOC. The output of the fully connected layer represents unnormalized class scores. These logits are then processed by a softmax layer for probability normalization. The softmax function applies exponential transformation and normalization to the logits, ensuring that the sum of the two output class probabilities strictly equals 1, thereby generating precise probabilistic estimates of G-LOC occurrence.
The GCN of the AU learning module further incorporates a dynamic graph modeling mechanism to adapt to the time-varying characteristics of AU interaction patterns during high-G training. Its core lies in designing dynamic update logic based on the phased features of the G-LOC training process—unlike update methods driven by video frame sampling frequency, this study treats 20 consecutively extracted AU-specific semantic representations (each containing 12-dimensional AU intensity features, anatomical weight features, and timestamp information) as a dynamic update unit. That is, the adjacency matrix weights are dynamically adjusted once per input batch of AU semantic sequences (corresponding to a continuous action phase in G-LOC training, such as the anti-G force maintenance phase or overload increment adaptation phase). This design not only aligns with the non-instantaneous characteristics of facial muscle responses under high-G overload (the evolution of muscle synergy patterns requires a certain time window to manifest) but also avoids noise accumulation caused by frame-by-frame updates, ensuring the model focuses on physiologically meaningful trends in AU association evolution.
The construction of the dynamic adjacency matrix integrates a hierarchical strategy of anatomical prior initialization, data-driven weight update, and adaptive sparsification filtering: First, constrained by facial muscle anatomical associations (e.g., frontalis muscle synergy for -, zygomaticus muscle linkage for -), an initial adjacency matrix is constructed by combining the Pearson correlation coefficients of AU intensities in the training set. The element is defined as the weighted fusion of the anatomical association weight and statistical correlation coefficient between and :
where denotes the fusion coefficient (set to via 5-fold cross-validation to balance anatomical priors and data statistical features). Subsequently, for each input batch of AU semantic representation sequences , the dynamic association strength between AUs within the current batch is calculated, which fuses cosine similarity in the feature space and mutual information in the time series to capture spatiotemporal correlations:
where represents the cosine similarity of AU feature vectors, and denotes the mutual information of the intensity sequences of and ( indicates the probability distribution). The adjacency matrix weights are then updated as follows:
where is the Sigmoid function (utilized to normalize the association strength to the interval ). Finally, top-K sparsification filtering is implemented not by predefining a fixed range for K, but by adaptively determining K based on the feature discriminability criterion of each AU node in the current batch , where lower entropy indicates more focused node associations). Experimental validation across multiple groups demonstrates that when retaining the top-K connections for each AU node by association strength, the node discriminability entropy reaches a minimum at ; thus, is ultimately determined. The filtered adjacency matrix satisfies:
where denotes the set of the top three AU nodes with the strongest association to . The calculation of dynamic graph convolution remains based on the original framework, but the adjacency matrix is replaced with the real-time updated sparsified matrix :
This design enables the model to dynamically capture synergistic and antagonistic relationships between AUs throughout the G-LOC training process, avoiding the over-smoothing problem caused by fully connected graph structures while anchoring key physiological associations through the combination of anatomical priors and data-driven learning. This provides more discriminative feature representations for the subsequent G-LOC binary classification task.
3.4. Loss Function for The Model
The complete loss function consists of two components: AU detection loss and graph-based G-LOC state prediction loss. The first component measures the discrepancy between predicted AU intensities and ground truth labels using visual Transformer features:
where represents the continuous ground-truth intensity of facial action units, denotes the visual Transformer’s output features for the i-th sample, and is the sigmoid activation function.
The second component represents the graph classification loss for G-LOC state prediction, computed using the predicted AU vectors as input features:
where indicates the true G-LOC state (0 for non-G-LOC, 1 for G-LOC), and is the predicted probability of G-LOC state derived from graph neural network processing of AU features.
The total loss combines both components with balancing coefficients:
where controls the relative importance between AU detection and G-LOC state prediction tasks. This multi-task learning framework enables joint optimization of facial action unit recognition and G-LOC state classification through feature sharing between the visual Transformer and graph neural network.
4. Discussion
4.1. Dataset Processing and Model Training
The DISFA dataset [19] consists of video recordings from 27 participants (12 females and 15 males), containing over 100,000 annotated frames. Each frame is annotated with intensity scores ranging from 0 to 5 for 12 AUs. Following the experimental protocols established in [20,21,22], we conduct subject-exclusive 3-fold cross-validation on all 12 AUs (AU01, AU02, AU04, AU05, AU06, AU09, AU12, AU15, AU17, AU20, AU25, AU26, etc.). For binary classification, samples with intensity ≥2 are designated as positive instances, while others are considered negative.
Our own dataset comprises 40 real-world videos capturing 32 pilots undergoing centrifuge training, during which G-LOC incidents were recorded. These videos, acquired at 30 fps, yielded a total of 15,000 frames, with 10% randomly selected for evaluation in the test set. Both datasets were constructed following standardized protocols to ensure data consistency and reliability.
The experimental framework was implemented using PyTorch, a widely adopted deep learning platform. To accelerate model training, we utilized a high-performance computing system equipped with dual NVIDIA GeForce RTX 4090 GPUs, each featuring 32GB of video memory.
4.2. Analysis of Backbone Architectures for ViT Models
In this ablation study, we systematically investigate the impact of different backbone networks on the performance of ViT models. To comprehensively evaluate the feature extraction capabilities of backbone networks, we selected five representative architectures for comparison: ResNet50, DenseNet169, MobileNetV3, VGG-16, and EfficientNetB0. As shown in Table 1, these networks exhibit distinct performance characteristics in our experiments. ResNet50, as a classical residual network, offers excellent feature extraction capability and training stability. DenseNet169 achieves feature reuse through dense connections, theoretically enhancing feature propagation efficiency. MobileNetV3 employs lightweight designs like depthwise separable convolutions, making it suitable for examining the trade-off between computational efficiency and model performance. VGG-16, as an early deep network, helps analyze the impact of network depth on feature extraction through its simple stacked structure. EfficientNetB0 represents the state-of-the-art compound scaled network, validating how advanced network designs can enhance Transformer performance.
The experimental results demonstrate that different backbone networks significantly impact Transformer model performance. ResNet50 and DenseNet169 achieve a good balance between accuracy and computational cost, with DenseNet169 particularly excelling in few-shot learning tasks due to its dense connection properties. Notably, EfficientNetB0 achieves the best accuracy among all compared models, verifying the effectiveness of compound scaling strategy in feature extraction. VGG-16 performs relatively poorly, which relates to its shallower feature extraction capability and significant parameter redundancy, further confirming the importance of modern network architecture design.
In summary, EfficientNet-B0 is the optimal backbone for ViT due to its exceptional balance of accuracy and efficiency. With only 0.39B FLOPs and 5.3M parameters, its compound scaling optimizes depth, width, and resolution synergistically, while MBConv blocks with depthwise convolutions and squeeze-excitation ensure robust feature extraction at minimal computational cost.
4.3. AU-GCN Performance in G-LOC State Classification
4.3.1. Context-Aware Fused Dynamic Graph Enhances Facial AU Clustering: t-SNE Analysis
To validate the architectural design of AU-GCN, we conducted systematic ablation studies by comparing its performance against traditional MLP baselines (which lack explicit modeling of AU dependencies) and evaluating three graph initialization strategies (fixed correlation-based, fully connected, and identity matrix), while further introducing an optimized dynamic graph variant that fuses biologically inspired AU prior correlations with G-LOC context-aware adjacency matrices. This comprehensive experimental design aimed to assess whether integrating data-driven relational priors, physiological knowledge, and scenario-specific constraints could outperform rigid static graph or unstructured MLP/CNN feature processing approaches, with t-SNE visualizations and convex hull area quantifications providing intuitive and quantitative insights into AU clustering performance across different models.
In Figure 2, the top-left corresponds to the MLP baseline, which exhibits severe convex hull overlap among three predefined AU groups—Eyes (AU01, 02, 05, 06), Mouth (AU10, 12, 15, 23, 26), and Others (AU04, 20, 25)—accompanied by excessively large convex hull areas (Eyes: 2.18, Mouth: 9.43, Others: 5.57). This dispersion confirms that MLPs treat AUs as isolated features, lacking the capacity to model either anatomical groupings (e.g., co-activated eyebrow-eye muscles) or G-LOC contextual associations. Notably, the Mouth group—comprising physiologically synergistic actions was the most scattered, highlighting traditional neural networks’ inherent inability to leverage natural facial muscle coordination patterns. In contrast, the top-right denotes the fixed-adjacency GCN initialized via Pearson correlations, which demonstrates significant improvements in clustering compactness with drastically reduced convex hull areas (Eyes: 0.92, Mouth: 1.90, Others: 1.09). This validates that static graph structures encoding biologically plausible AU relationships (e.g., AU01-AU02 co-activation in eyebrow movement) effectively constrain feature learning toward anatomically meaningful groupings. However, the static nature of the adjacency matrix introduces inherent limitations: it cannot adapt to dynamic interactions such as the coordination between AU06 (eye closure) and AU12 (lip corner raising) in G-LOC scenarios, revealing a critical trade-off between prior knowledge encoding and dynamic adaptability.
The bottom-left represents the vanilla dynamic graph model, which further compresses intra-group dispersion through adaptive edge updates, achieving convex hull areas of Eyes: 1.00, Mouth: 1.53, and Others: 0.61. It selectively strengthens physiologically meaningful connections while suppressing spurious correlations, enabling superior isolation of infrequent AUs in the "Others" group. Nevertheless, its reliance solely on data-driven dynamic learning occasionally overlooks stable anatomical priors, leading to marginal compromises in the clustering consistency of core AU pairs. More importantly, the bottom-right corresponds to the optimized dynamic graph fusing AU biological priors with G-LOC context-aware adjacency matrices, which achieves the optimal clustering performance. It exhibits the smallest and most compact convex hull areas across all groups (Eyes: 0.61, Mouth: 1.22, Others: 0.34) with non-overlapping convex hulls. This breakthrough stems from its dual mechanism: leveraging physiological priors to preserve stable anatomical synergies and integrating G-LOC scenario constraints to adaptively model dynamic, context-dependent interactions (e.g., AU06-AU12 coordination during impending consciousness loss).
Collectively, these findings underscore the critical role of structured graph modeling in capturing facial AU synergies, as unstructured MLP and locally constrained CNN approaches fail to model non-local dependencies and anatomical groupings. The optimized AU-GCN architecture, in particular, achieves structured clustering aligned with human facial anatomy, dynamic adaptability to scenario-specific AU interactions, and efficient noise suppression that avoids the over-smoothing of fully connected graphs and spurious correlations of vanilla dynamic graphs. By integrating biological priors and G-LOC context, this model effectively captures both stable anatomical dependencies and dynamic, non-local interactions, laying a critical foundation for accurate detection of impending loss of consciousness via facial muscle coordination patterns.
The comprehensive evaluation results illustrated in Figure 3 (encompassing F1 Score, AUC-ROC, PR, and DET metrics) demonstrate substantial performance disparities among the five models MLP, Fixed Adj GCN, DGL (Identity), DGL (Top-3), and DGL (Full) across all evaluation dimensions, with graph-based models consistently outperforming the baseline MLP model. Notably, the dynamic Top-3 graph convolution model DGL (Top-3) achieves the most prominent performance across all metrics, supported by robust quantitative and qualitative evidence.
In terms of the AUC-ROC metric (Figure 3 AUC-ROC panel), the DGL (Top-3) model achieves the highest AUC value of 0.898, with the random baseline serving as a reference. This indicates that graph-based models possess stronger capability in distinguishing critical action unit (AU) combinations associated with impending loss of consciousness from normal facial movements compared to the conventional MLP, and the dynamic Top-3 graph structure further optimizes this discriminative power.
The PR curve analysis (Figure 3 PR panel) complements the AUC-ROC results by quantifying the model’s precision-recall trade-off, with the Average Precision (AP) serving as a key indicator. The DGL (Top-3) model attains an exceptional AP of 0.96, outperforming all other models. This high AP value robustly validates the model’s ability to accurately identify critical AU combinations while minimizing false positive predictions, which is crucial for distinguishing subtle transitional facial movements preceding loss of consciousness from irrelevant facial activities.
Regarding the F1 Score evolution with training iterations (Figure 3 F1 Score panel), the DGL (Top-3) model exhibits remarkable convergence efficiency and superior final performance: it rapidly converges to a high F1 Score as the training epochs progress (from 1 to 101), maintaining a leading position among all models. In contrast, the DGL (Identity) model, which adopts the identity matrix as the adjacency matrix, suffers from excessively slow convergence, failing to reach the F1 Score level of DGL (Top-3) even after extensive training. The MLP, Fixed Adj GCN, and DGL (Full) models demonstrate intermediate convergence rates and final F1 Scores, all of which are lower than those of the DGL (Top-3) model, highlighting the advantage of the dynamic Top-3 graph construction strategy in accelerating model convergence and enhancing classification performance.
Furthermore, the DET curve (Figure 3 DET panel) confirms the operational reliability of the DGL (Top-3) model. In practical scenarios where both false alarms (False Positive Rate) and missed detections (False Negative Rate) incur significant consequences, the DGL (Top-3) model exhibits the optimal DET curve, indicating superior balance between reducing false positives and avoiding missed detections compared to the other four models. This reliability is particularly critical for the detection of impending loss of consciousness, where operational robustness directly impacts clinical or safety outcomes.
Collectively, these results collectively indicate that the dynamic graph architecture effectively learns the transitional facial muscle coordination patterns that signal impending loss of consciousness, outperforming conventional approaches in detecting this specific physiological state.
4.3.2. Dynamic Graph Learning Improves AU Modeling for G-LOC Detection
Through comparative analysis of AU relationship heatmaps, we examined the differences between fixed AU adjacency matrices and those generated by dynamic AU graph convolutional methods upon model convergence. The heatmaps visually represent the association strength between AU pairs through color coding (red for positive correlation/synergistic effects, blue for negative correlation/antagonistic effects) and grid size.
As shown in Figure 4, the fixed AU adjacency matrix computed from the dataset highlights four key AU pairs (AU01-AU02, AU06-AU12, AU12-AU25, and AU23-AU25) with purple arrows. Based on prior knowledge in aerospace medicine, we focused on analyzing these key AU pairs relevant to pilots’ facial movements. In contrast, the right figure in Figure 4 presents the learned AU adjacency matrix obtained via dynamic AU-GCN upon model convergence.
Experimental results demonstrate that while the fixed adjacency matrix precomputed from static datasets exhibits global positive correlations, it shows two notable limitations: the lack of significantly discriminative action unit combinations, and the inclusion of numerous weakly correlated relationships with low signal-to-noise ratios that may interfere with G-LOC state recognition. More importantly, its learnable adjacency matrix parameterization mechanism automatically achieves feature space sparsification, effectively suppressing interference from non-significant AU correlations while capturing nonlinear interaction patterns across varying G-load conditions through time-varying characteristics.
4.3.3. Nonlinear Impact of Fusion Coefficient on Model Performance
The fusion coefficient mediates the balance between the adjacency matrix weight derived from the Pearson correlation coefficient and the physiologically meaningful anatomical weight of facial muscles 1-. As shown in Figure 5, varies from 0.1 to 1.0 with a step size of 0.05, the model’s classification performance metrics (AUC-ROC, AP, F1-score, Accuracy) and early warning reliability metrics (FAR, FRR) exhibit a consistent "rise-first-then-fall" nonlinear trend, fully revealing regulatory role in model performance. When ranges from 0.1 to 0.65, all classification performance metrics show a steady upward trend, while the early warning reliability metrics continuously decline—FAR decreases from 18.2% to 7.9% and FRR drops from 16.5% to 6.8%. This performance improvement stems from the synergistic effect of the two weights: the adjacency matrix derived from the Pearson correlation coefficient captures the statistical association patterns of AUs in high-G training data, while the anatomical weight anchors physiologically plausible AU combinations (e.g., AU01-AU02 controlled by the frontalis muscle and AU06-AU12 linked to the zygomaticus muscle). Their balanced collaboration enhances the model’s ability to distinguish G-LOC precursor features from normal facial movements. The core cause of this performance degradation is that an excessively high overemphasizes statistical correlations in the data, which may include spurious associations unrelated to G-LOC physiological mechanisms. Meanwhile, the weakened anatomical weight 1- can no longer constrain the model through facial muscle synergy priors, leading to a reduction in the model’s generalization ability for dynamic AU interactions under varying G-load conditions.
Experimental results confirm =0.65 as the optimal configuration, where the model achieves the peak of comprehensive performance—attaining the highest classification accuracy and the lowest error rates (FAR=7.9%, FRR=6.8%). This ratio means allocating 65% of the weight to the Pearson correlation-derived adjacency matrix fully leverages data-driven statistical patterns, while 35% of the anatomical prior weight ensures the model’s consistency with physiological reality. Mechanistically, this optimal balance addresses two key challenges in G-LOC detection: the Pearson correlation-based weight captures dynamic AU co-activation patterns observed in centrifuge training data , and the anatomical weight constrains the model to prioritize biologically meaningful AU combinations, avoiding overfitting to noise in the training data.
This nonlinear influence law provides important guidance for the practical deployment of G-LOC early warning systems: when is below 0.65, insufficient utilization of data-driven patterns results in suboptimal classification performance and high error rates, which may impair the system’s ability to detect subtle G-LOC precursors. In contrast, when is above 0.65, over-reliance on statistical correlations increases the risk of false alarms and missed detections in real-world aviation scenarios—outcomes that could trigger unnecessary flight interventions or fail to alert to impending G-LOC. In summary, the fusion coefficient exerts a significant nonlinear impact on model performance by mediating the balance between data-driven statistical patterns and physiology-based anatomical priors, with the optimal configuration =0.65 maximizing the synergy of these two weights.
5. Conclusions
Our study introduces a G-LOC early warning system centered on the GC-ViT architecture, which combines visual transformer-based feature extraction with graph-constrained modeling of action unit relationships. The proposed AU-GCN network within this framework dynamically learns the relational patterns among facial action units, with specialized attention to modeling strongly correlated AU pairs that serve as key physiological indicators of impending G-LOC. This approach addresses a significant challenge in machine vision-based G-LOC detection during centrifuge training. Experimental results on centrifuge training datasets demonstrate promising performance, achieving an AUC-ROC of 0.898 and an AP score of 0.96. These findings suggest that our method may contribute to improving pilot safety in high-G centrifuge training scenarios. Overall, our framework advances the methodology for G-LOC prediction and presents promising advantages over traditional approaches, paving the way for improved aerospace physiological monitoring systems.
Data Availability Statement
Dataset available on request from the authors
Conflicts of Interest
The authors declare no conflict of interest.
Abbreviations
The following abbreviations are used in this manuscript:
| AU | Action Units |
| G-LOC | G-induced Loss of Consciousness |
| AO | Aeromedical Operators |
| EEG | Electroencephalogram |
| EMG | Electromyography |
| FACS | Facial Action Coding System |
| GC-ViT | Graph Convolution-Augmented Vision Transformer |
| DGL | Dynamic Graph Learning |
| FAR | False Acceptance Rate |
| FRR | False Rejection Rate |
References
- Angrisani, L.; Arpaia, P.; De Benedetto, E.; Duraccio, L.; Lo Regio, F.; Tedesco, A. Wearable brain–computer interfaces based on steady-state visually evoked potentials and augmented reality: a review. IEEE Sens. J. 2023, 23, 16501–16514. [Google Scholar] [CrossRef]
- Othmani, A.; Brahem, B.; Haddou, Y.; Mustaqeem. Machine-learning-based approaches for post-traumatic stress disorder diagnosis using video and EEG sensors: a review. IEEE Sens. J. 2023, 23, 24135–24151. [Google Scholar] [CrossRef]
- Blacker, K.; Dooley, C. Neutral markers of G-induced loss of consciousness (G-LOC) and recovery. Aerosp. Med. Hum. Perform. 2024, 95. [Google Scholar]
- Rinkel, B.; Dooley, C.; Blacker, K.; Gallo, M.; Cates, K.; Potter, L.; Kohne, H.; Lammert, A. G-induced loss of consciousness (G-LOC) predictive model development. Aerosp. Med. Hum. Perform. 2024, 95. [Google Scholar]
- Li, Y.; Yang, J.; Li, B.; Jin, Z.; Zhang, L.; Yang, M. Investigation of early warning of EMG on human G-LOC under centrifuge high G load. In Proceedings of the Journal of Physics: Conference Series; IOP Publishing: Bristol, UK, 2024; Vol. 2898, p. 012003. [Google Scholar]
- Gallo, M.; Kohne, H.; Potter, L.; Dooley, C. Modeling G-induced loss of consciousness (G-LOC): determination by audiovisual clues-agree to disagree. Aerosp. Med. Hum. Perform. 2024, 95. [Google Scholar]
- Kumagai, et al. Effective monitoring for early detection of hypoxia in fighter pilots. Int. J. Aerosp. Psychol. 2023, 33, 174–181. [Google Scholar] [CrossRef]
- Kuo, M.-H.; Lin, Y.-J.; Huang, W.-W.; Chiang, K.-T.; Tu, M.-Y.; Chu, C.-M.; Lai, C.-Y.; et al. G tolerance prediction model using mobile device–measured cardiac force index for military aircrew: observational study. JMIR mHealth UHealth 2023, 11, e48812. [Google Scholar] [CrossRef] [PubMed]
- Durmaz Incel, Ö.; Bursa, S. Ö. On-device deep learning for mobile and wearable sensing applications: a review. IEEE Sens. J. 2023, 23, 5501–5512. [Google Scholar] [CrossRef]
- Ekman, P.; Rosenberg, E. L. What the Face Reveals: Basic and Applied Studies of Spontaneous Expression Using the Facial Action Coding System (FACS); Oxford University Press: New York, NY, USA, 1997. [Google Scholar]
- Zhao, K.; Chu, W.-S.; Zhang, H. Deep region and multi-label learning for facial action unit detection. In Proceedings of the 2016 IEEE Conference on Computer Vision and Pattern Recognition (CVPR), Piscataway, NJ, USA, 2016; IEEE; pp. 3391–3399. [Google Scholar]
- Li, W.; Abtahi, F.; Zhu, Z.; Yin, L. EAC-Net: a region-based deep enhancing and cropping approach for facial action unit detection. In Proceedings of the 2017 12th IEEE International Conference on Automatic Face & Gesture Recognition (FG 2017), 2017; IEEE Computer Society: Los Alamitos, CA, USA; pp. 103–110. [Google Scholar]
- Wu, B.-F.; Wei, Y.-T.; Wu, B.-J.; Lin, C.-H. Contrastive feature learning and class-weighted loss for facial action unit detection. In Proceedings of the IEEE Int. Conf. Syst., Man Cybern. (SMC), 2019; IEEE: Piscataway, NJ, USA; pp. 2478–2483. [Google Scholar]
- Xia, Y. Upper, middle and lower region learning for facial action unit detection. arXiv [cs.CV] 2020, arXiv:2002.04023. [Google Scholar]
- Atwood, J.; Towsley, D. Diffusion-convolutional neural networks. In Advances in Neural Information Processing Systems; Curran Associates, Inc.: Red Hook, NY, USA, 2016; Vol. 29. [Google Scholar]
- Niepert, M.; Ahmed, M.; Kutzkov, K. Learning convolutional neural networks for graphs. arXiv [cs.LG] 2016, arXiv:1605.05273. [Google Scholar]
- Bruna, J.; Zaremba, W.; Szlam, A.; LeCun, Y. Spectral networks and locally connected networks on graphs. arXiv [cs.LG] 2014, arXiv:1312.6203. [Google Scholar]
- Li, G.; Zhu, X.; Zeng, Y.; Wang, Q.; Lin, L. Semantic relationships guided representation learning for facial action unit recognition. arXiv [cs.CV] 2019, arXiv:1904.09939. [Google Scholar] [CrossRef]
- Mavadati, S. M.; Mahoor, M. H.; Bartlett, K.; Trinh, P.; Cohn, J. F. DISFA: a spontaneous facial action intensity database. IEEE Trans. Affect. Comput. 2013, 4, 151–160. [Google Scholar] [CrossRef]
- Shao, Z.; Liu, Z.; Cai, J.; Ma, L. JAA-NET: joint facial action unit detection and face alignment via adaptive attention. arXiv [cs.CV] 2020, arXiv:2003.08834. [Google Scholar] [CrossRef]
- Zhao, K.; Chu, W.-S.; Zhang, H. Deep region and multi-label learning for facial action unit detection. In Proceedings of the 2016 IEEE Conference on Computer Vision and Pattern Recognition (CVPR), Piscataway, NJ, USA, 2016; IEEE; pp. 3391–3399. [Google Scholar]
- Li, W.; Abtahi, F.; Zhu, Z.; Yin, L. EAC-NET: deep nets with enhancing and cropping for facial action unit detection. IEEE Trans. Pattern Anal. Mach. Intell. 2018, 40, 2583–2596. [Google Scholar] [CrossRef]
Figure 1.
The proposed GC-ViT architecture for G-LOC detection. The framework integrates ViT for pilot visual feature extraction, GCN with AU correlation priors for relationship modeling.
Figure 1.
The proposed GC-ViT architecture for G-LOC detection. The framework integrates ViT for pilot visual feature extraction, GCN with AU correlation priors for relationship modeling.
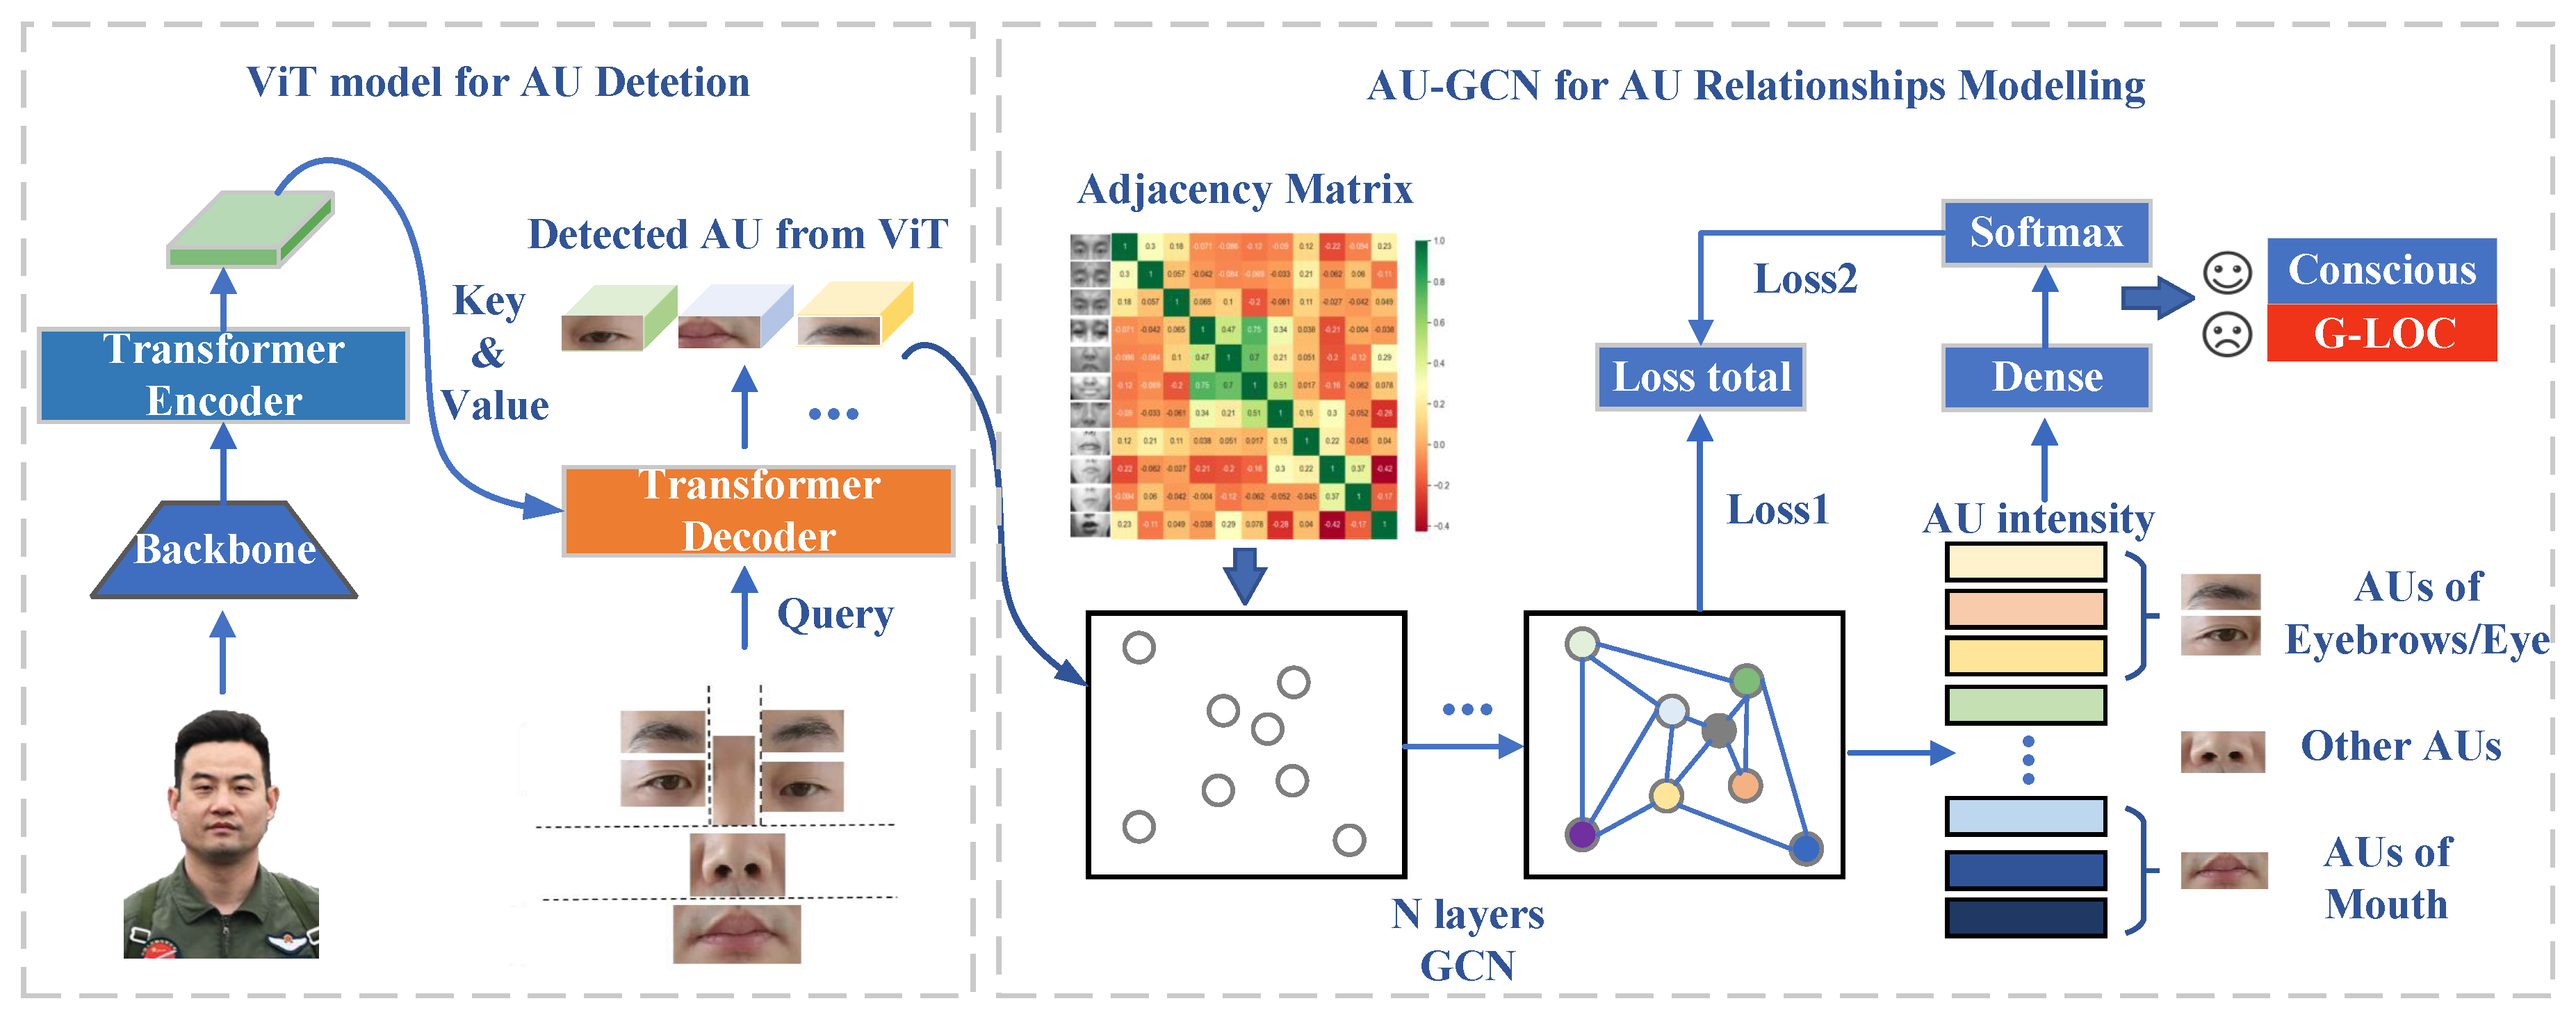
Figure 2.
t-SNE visualization of AU clustering (2×2 layout). Top-left: Multi-Layer Perceptron (MLP) baseline with scattered and overlapping AU clusters; Top-right: Fixed-adjacency GCN initialized via Pearson correlations with improved clustering compactness but limited dynamic adaptability; Bottom-left: Vanilla dynamic graph that adaptively strengthens physiological associations but overlooks partial anatomical priors; Bottom-right: Optimized dynamic graph fusing biological priors and G-LOC context with the most compact and non-overlapping clusters, balancing static anatomical structure and dynamic scenario adaptability.
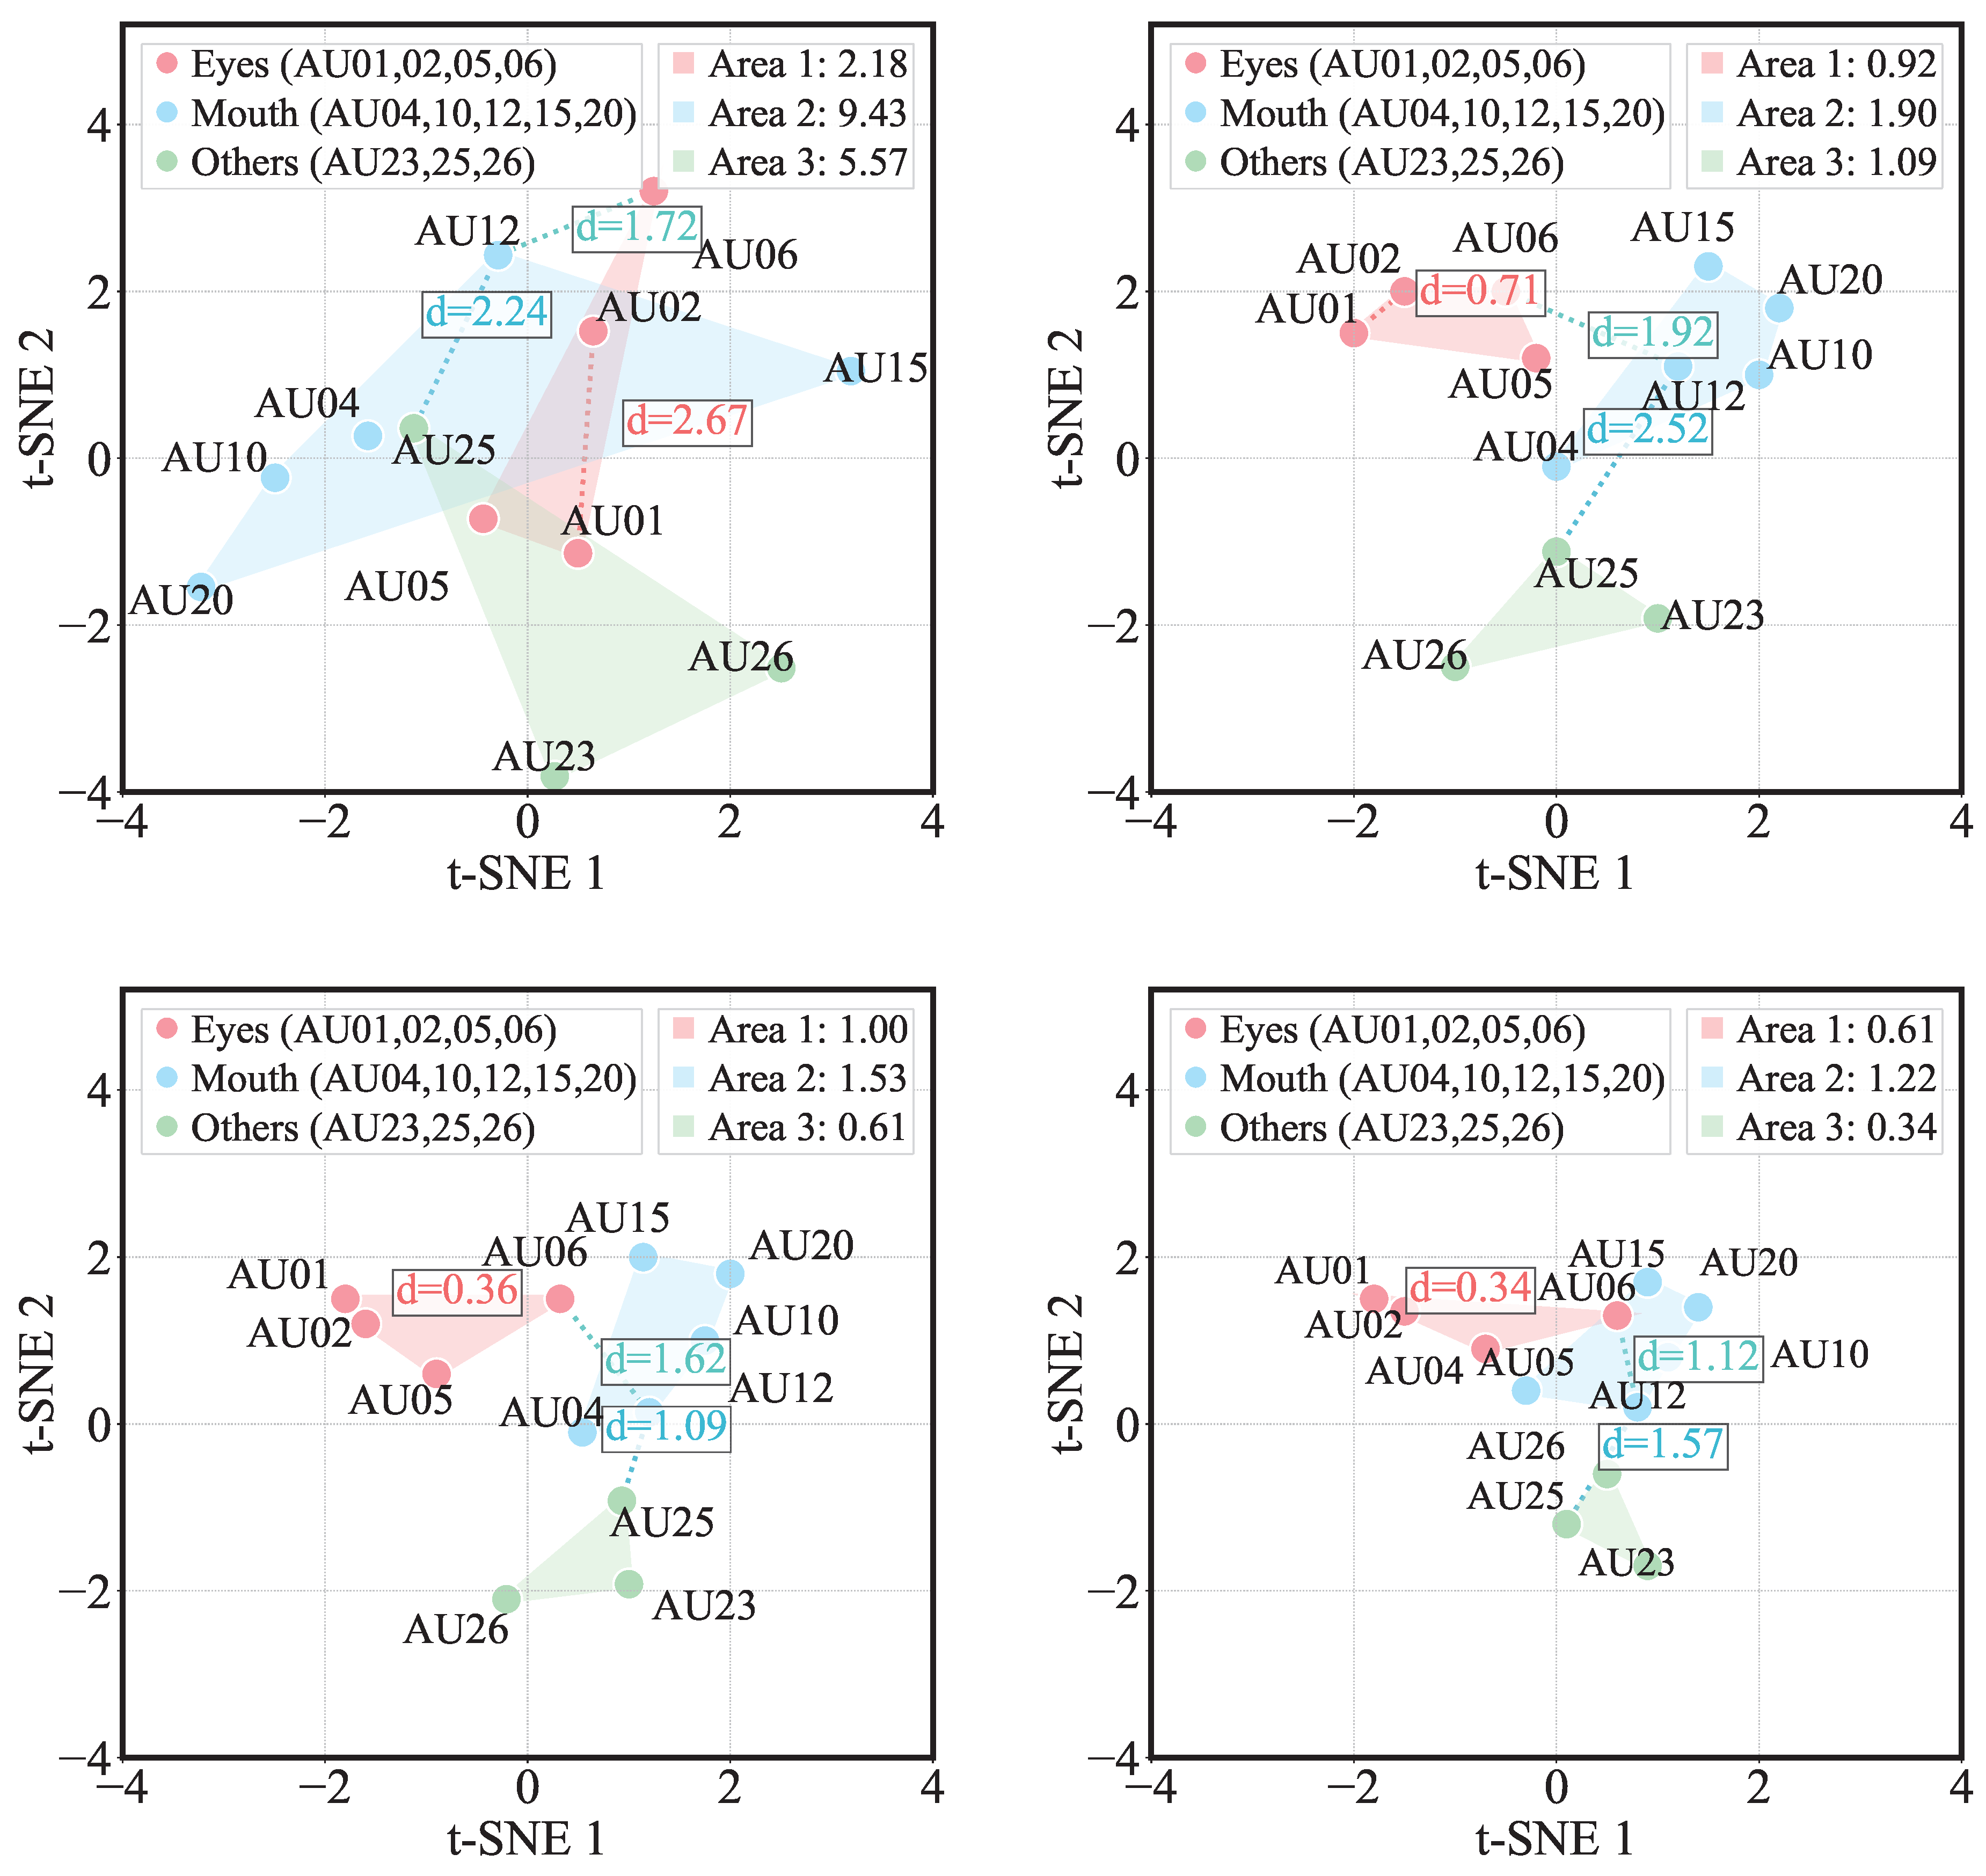
Figure 3.
Performance comparison of five models MLP, Fixed Adj GCN, DGL (Identity), DGL (Top3), DGL (Full) for impending loss of consciousness detection, including F1 score over training epochs, AUC-ROC, precision-recall (PR) with average precision (AP), and DET curves.
Figure 3.
Performance comparison of five models MLP, Fixed Adj GCN, DGL (Identity), DGL (Top3), DGL (Full) for impending loss of consciousness detection, including F1 score over training epochs, AUC-ROC, precision-recall (PR) with average precision (AP), and DET curves.
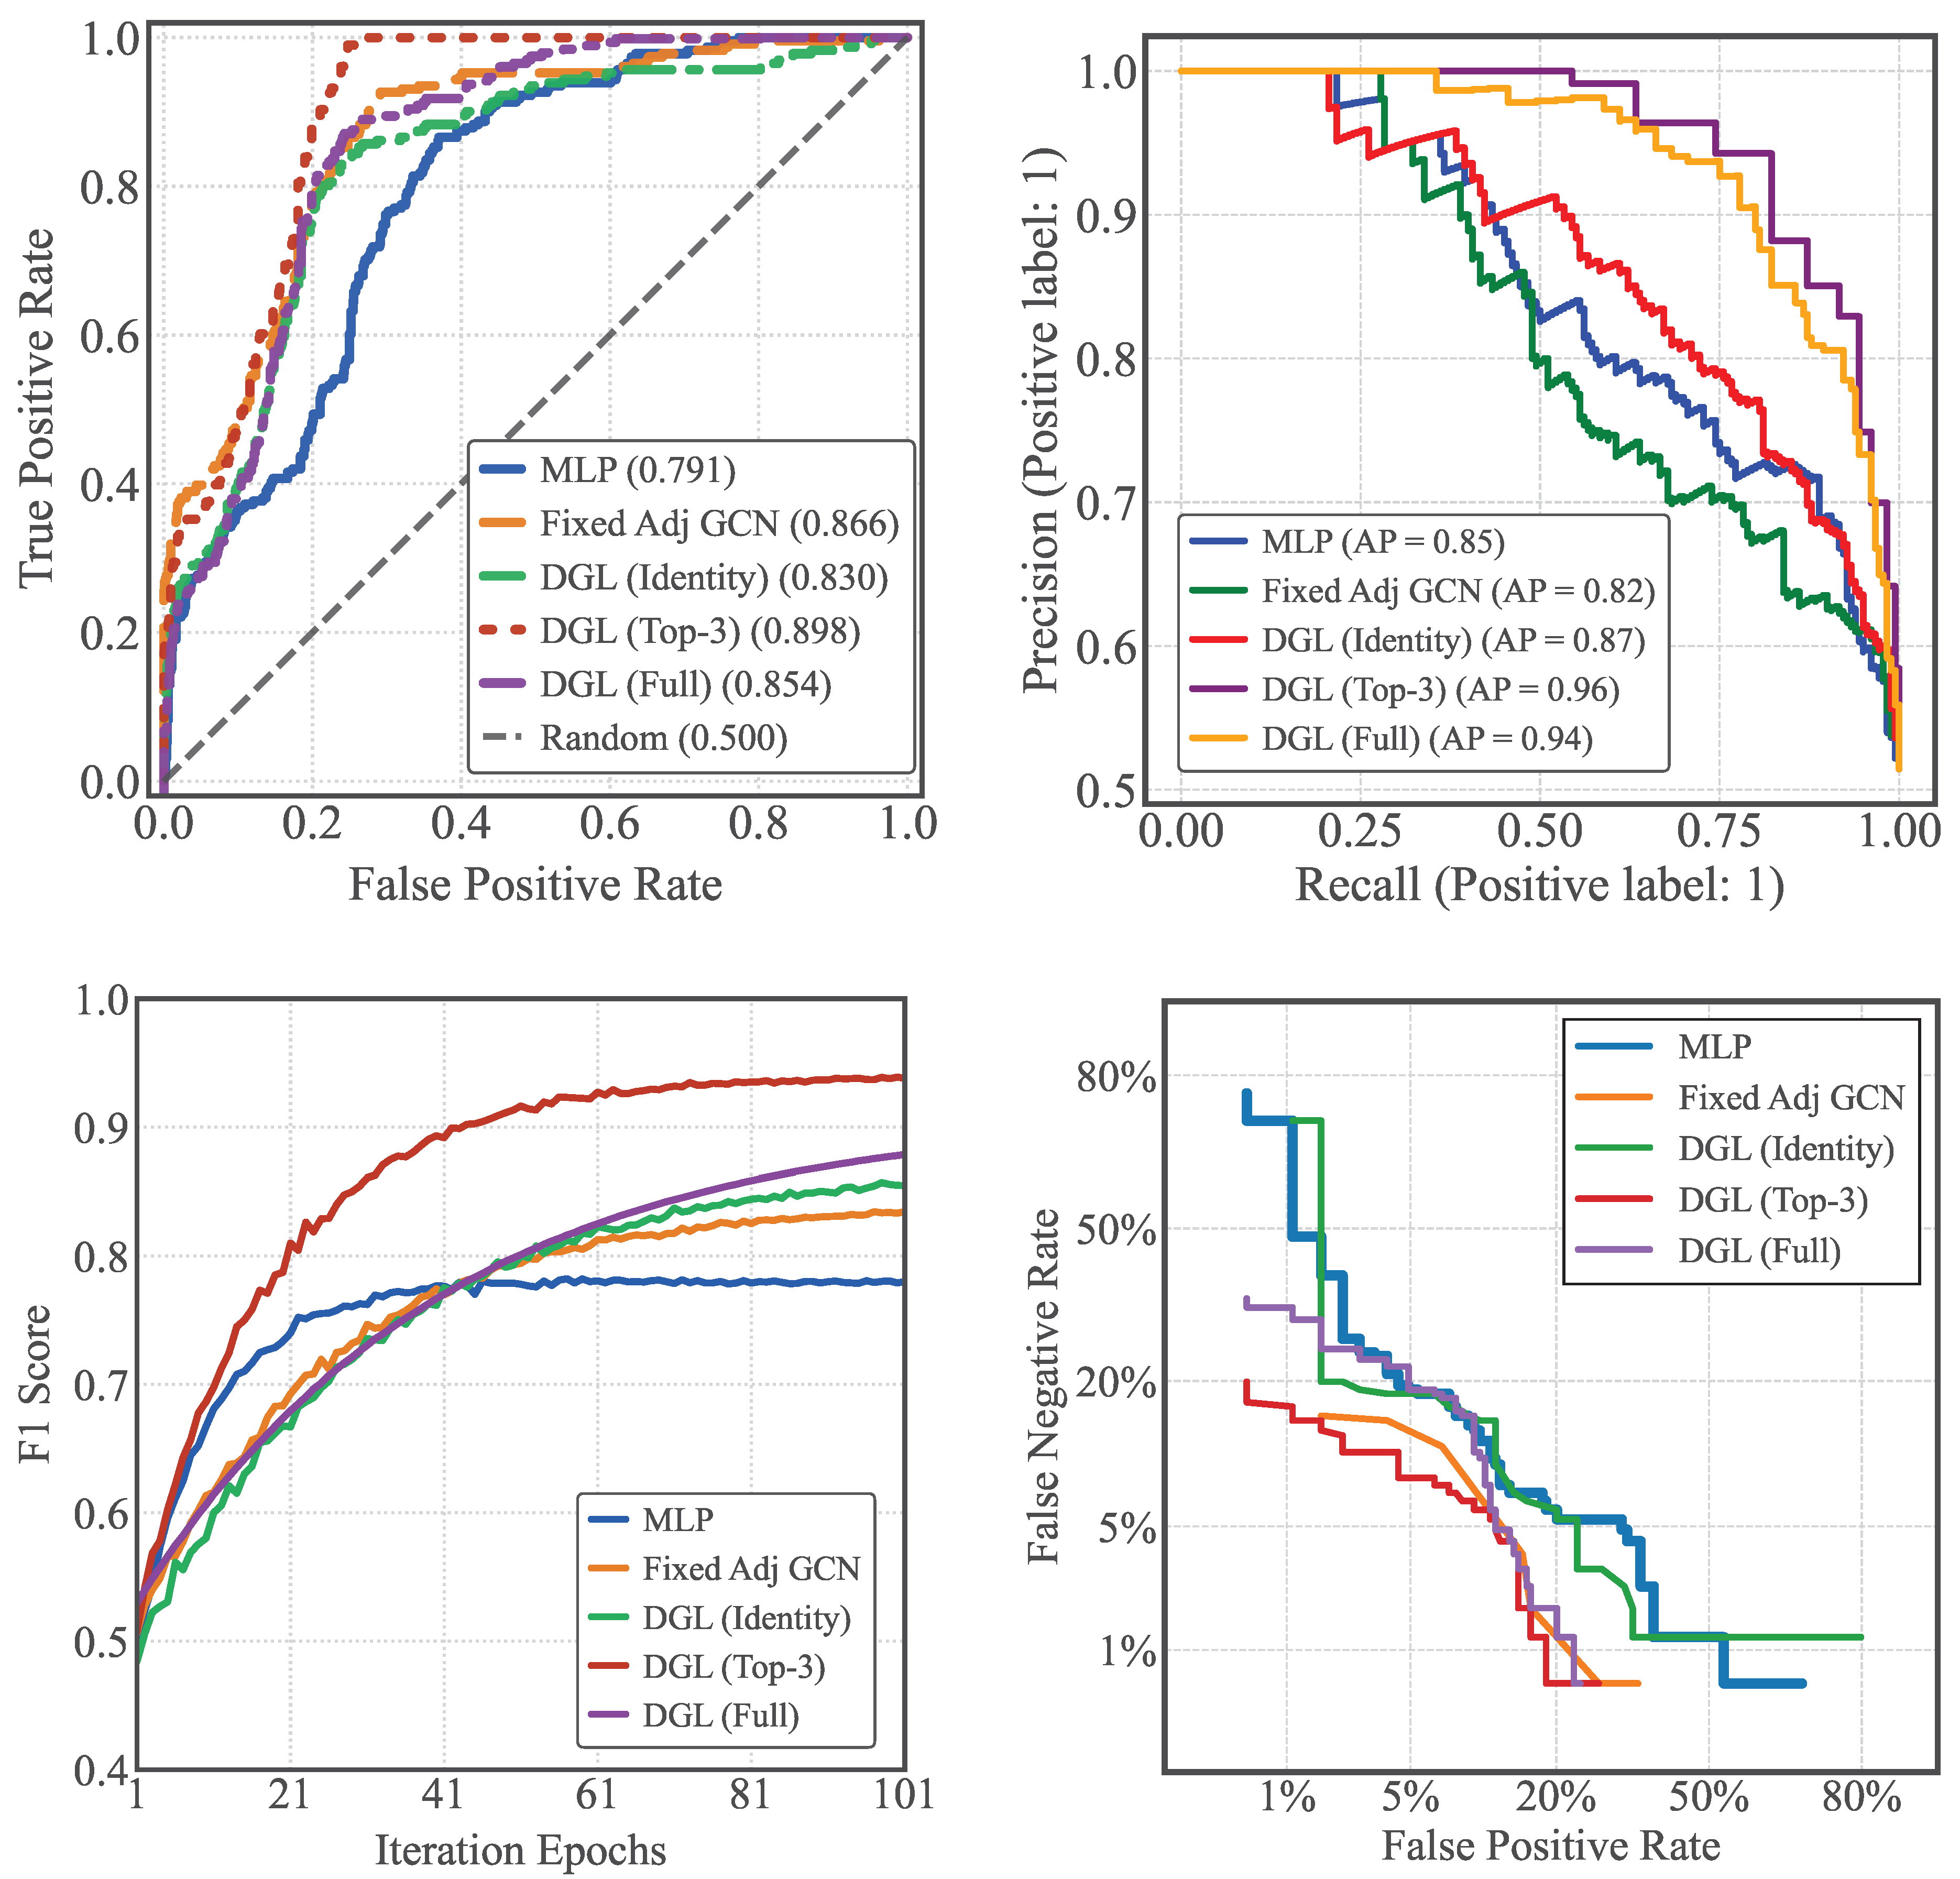
Figure 4.
Fixed AU adjacency matrix computed from the dataset (left), highlighting four key AU pairs (AU01-AU02, AU06-AU12, AU12-AU25, and AU23-AU25) with purple arrows; Learned AU adjacency matrix obtained via dynamic AU-GCN upon model convergence (right)
Figure 4.
Fixed AU adjacency matrix computed from the dataset (left), highlighting four key AU pairs (AU01-AU02, AU06-AU12, AU12-AU25, and AU23-AU25) with purple arrows; Learned AU adjacency matrix obtained via dynamic AU-GCN upon model convergence (right)
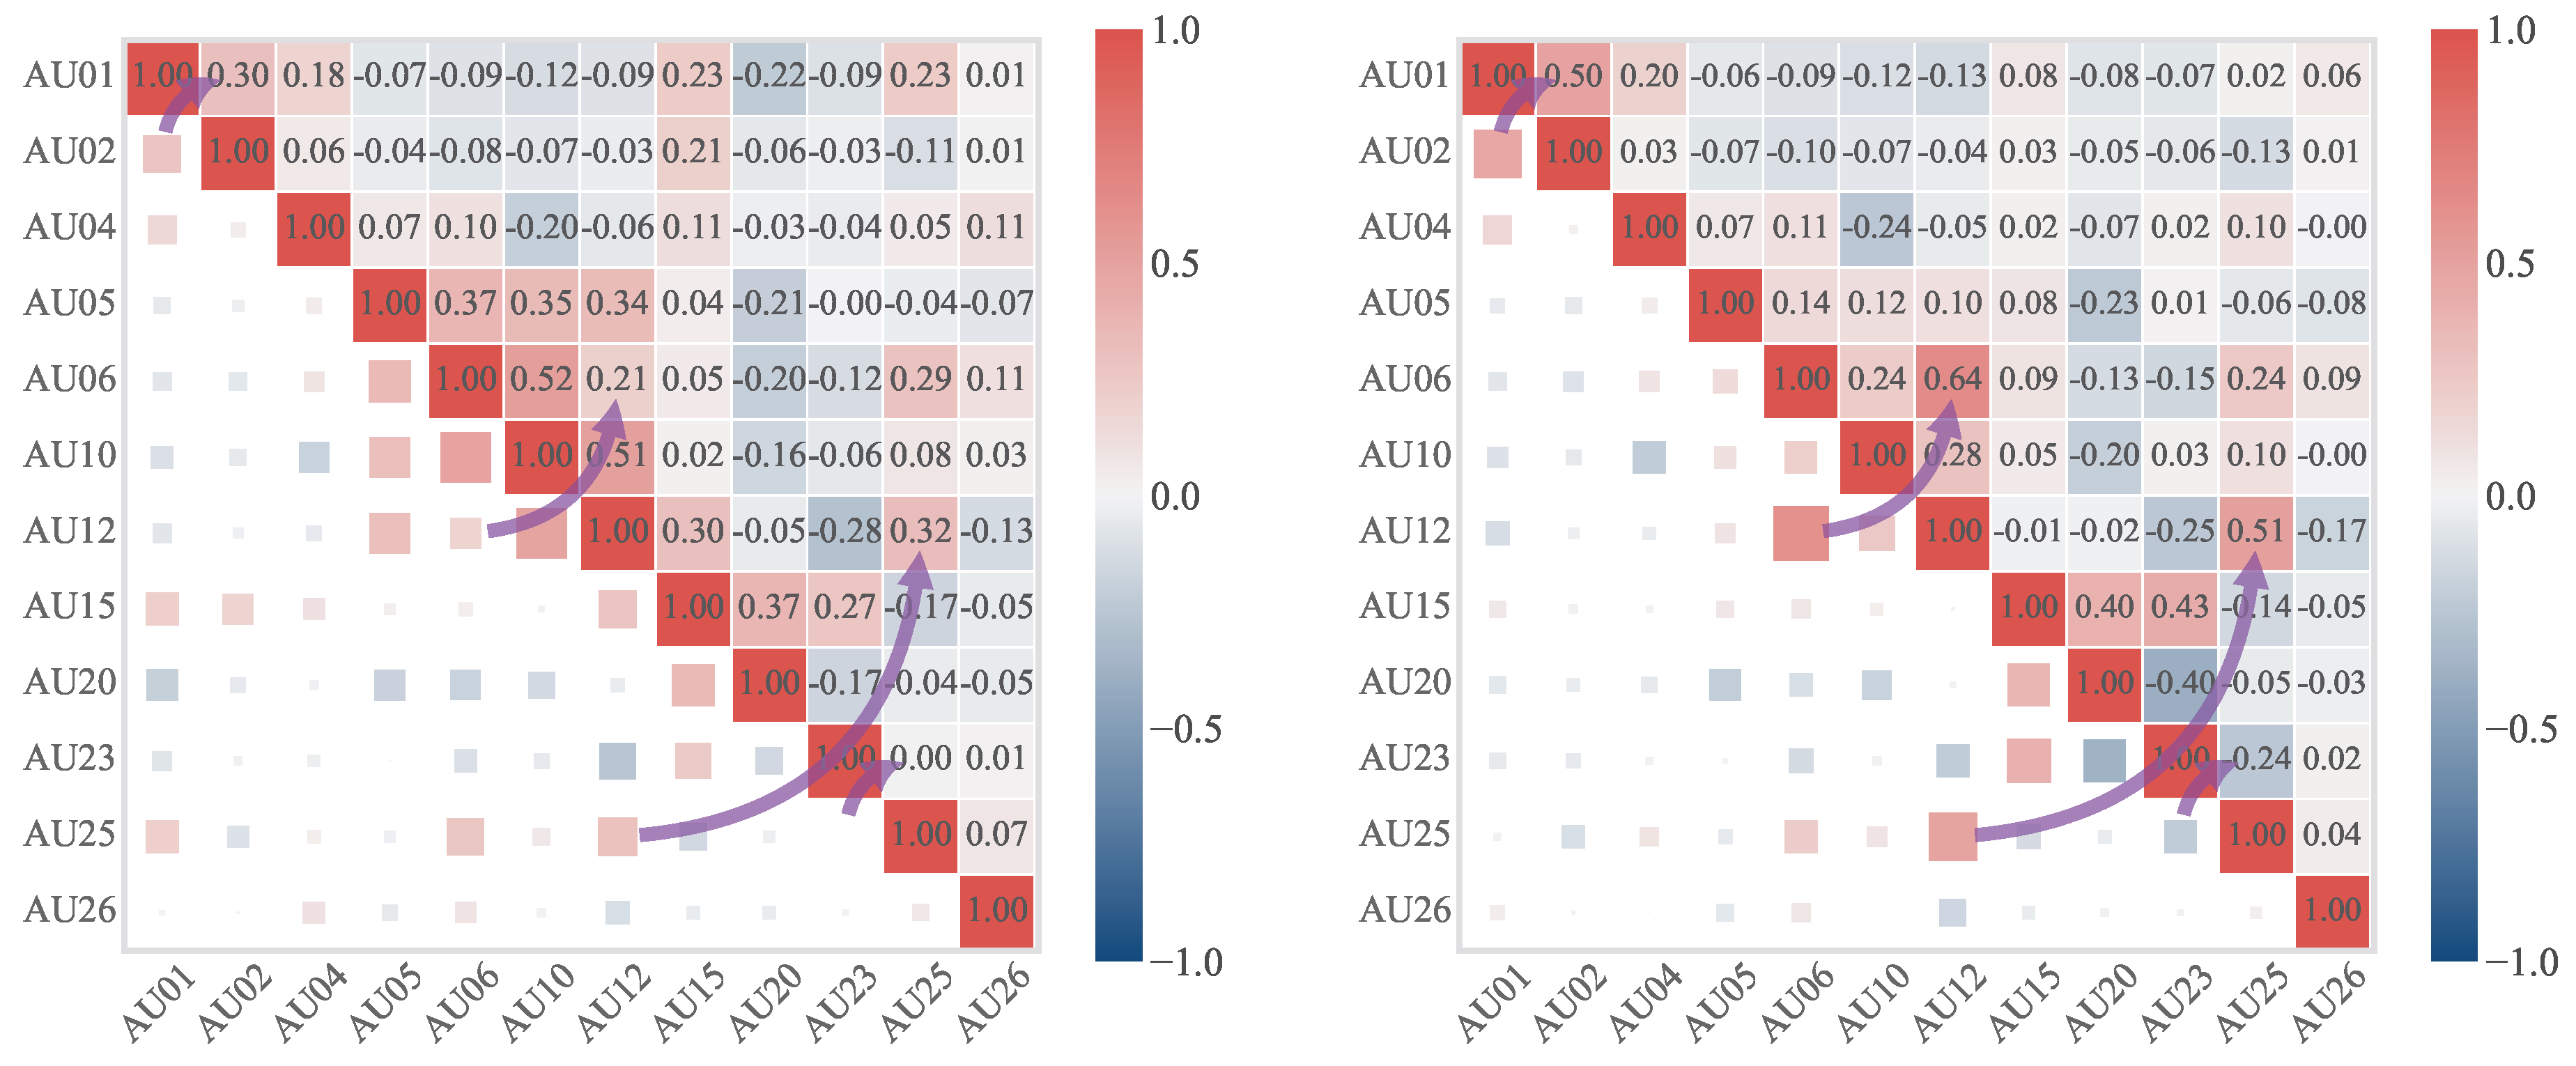
Figure 5.
Variations of classification performance metrics (AUC-ROC, AP, F1-score, Accuracy, FAR, FRR) with the fusion coefficient (step size = 0.05).
Figure 5.
Variations of classification performance metrics (AUC-ROC, AP, F1-score, Accuracy, FAR, FRR) with the fusion coefficient (step size = 0.05).
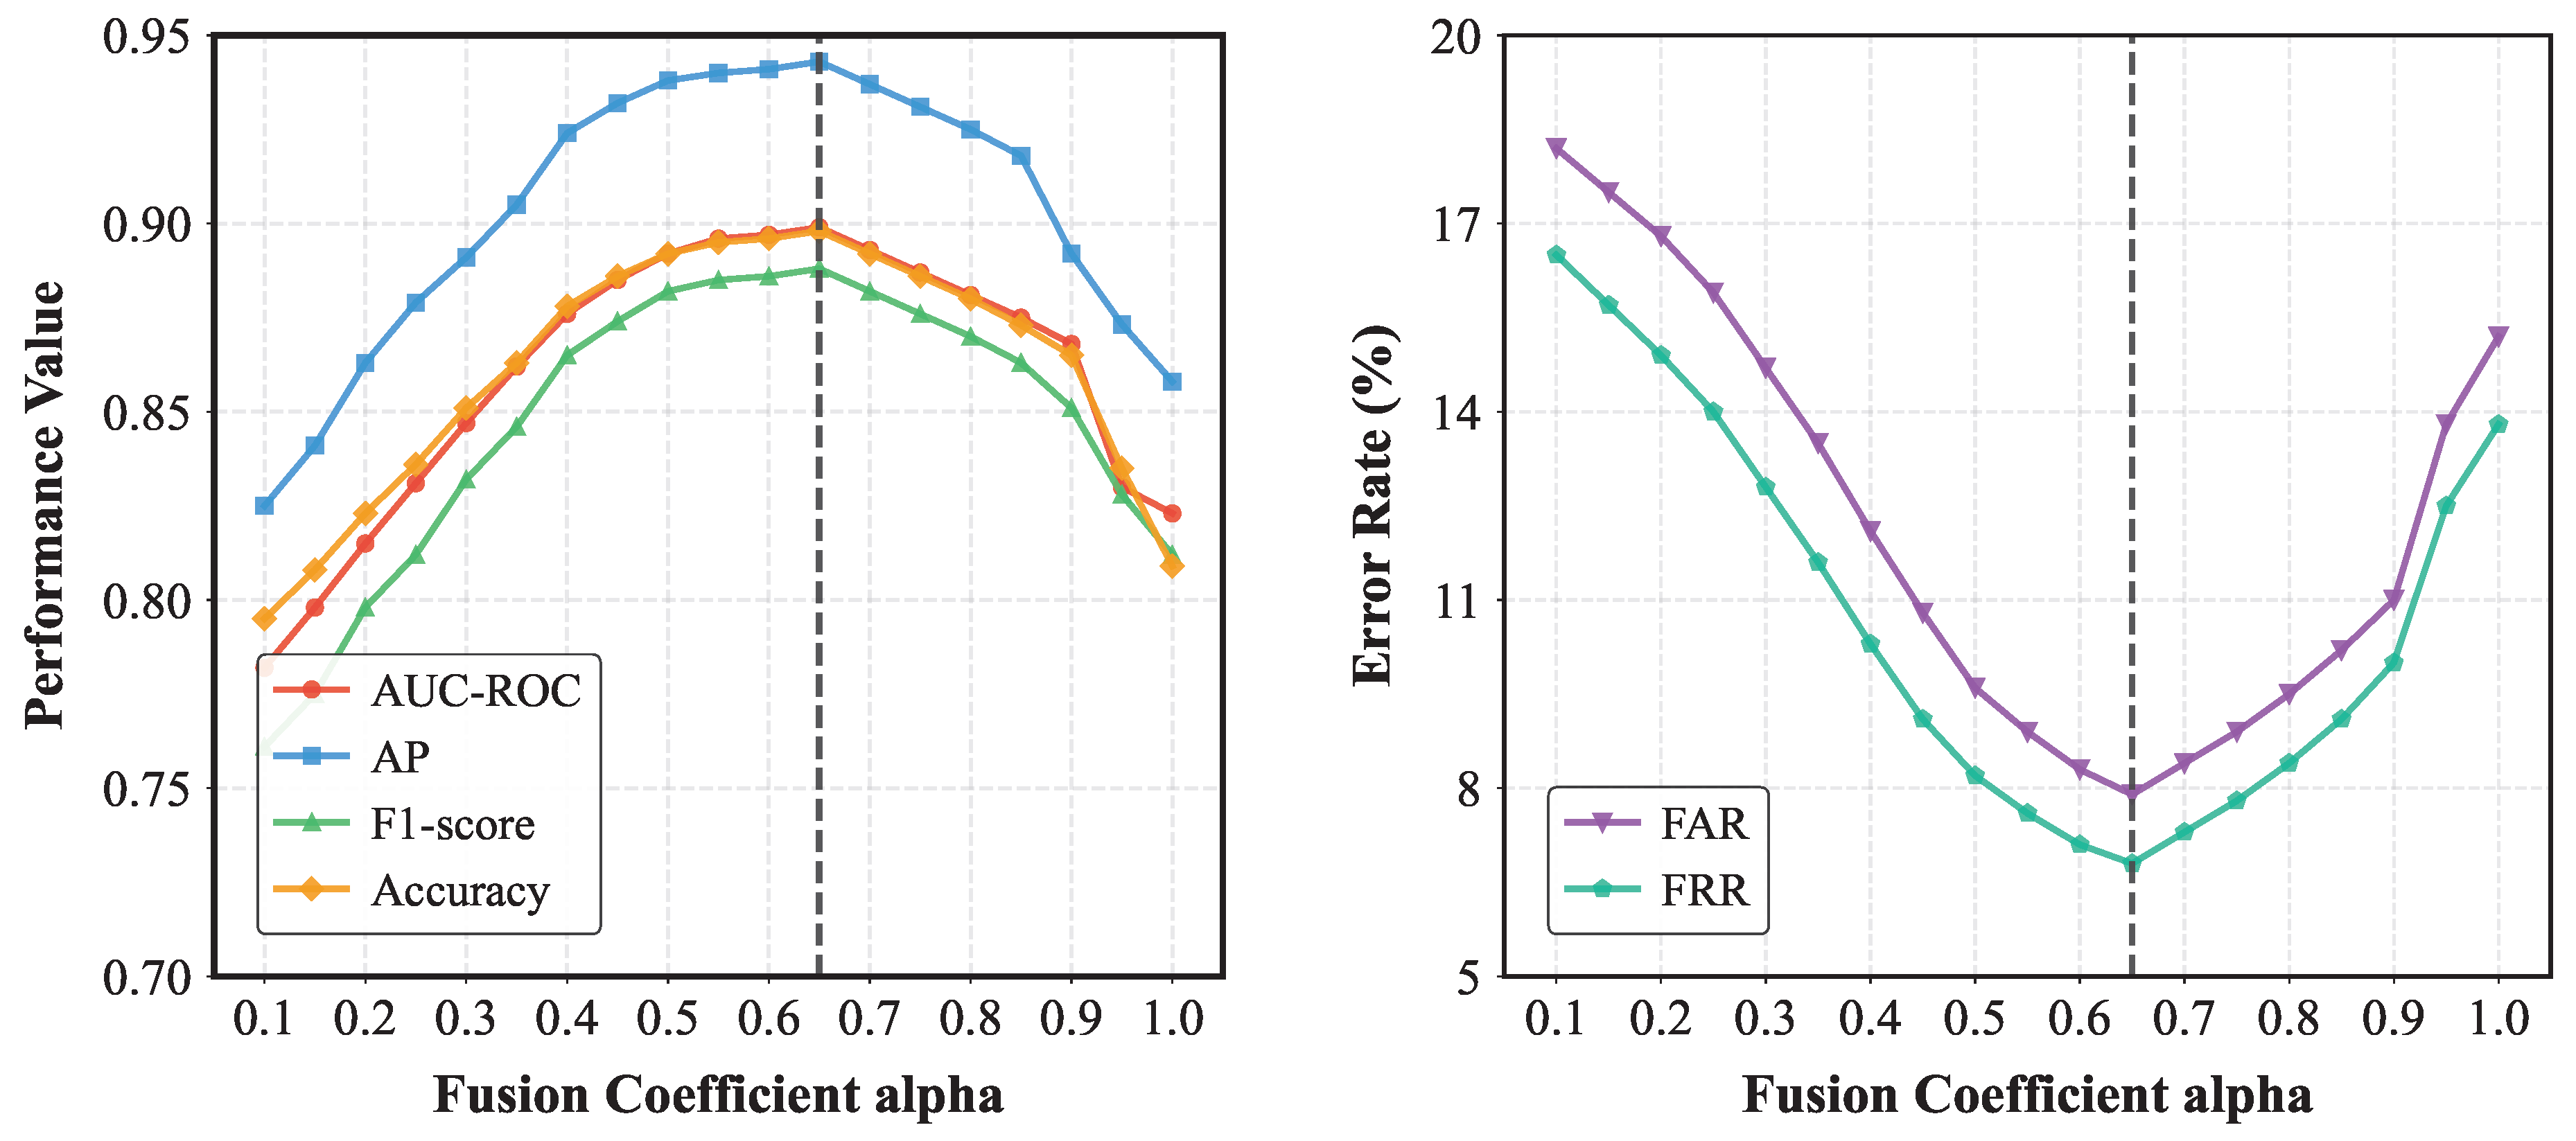

Table 1.
ViT Backbone Network Performance Comparison.
| Model Type | FLOPs | Training Loss | Val AUC | Val F1 |
|---|---|---|---|---|
| ResNet50 | 4.1G | 0.884 | 0.894 | 0.788 |
| DenseNet169 | 3.8G | 0.858 | 0.873 | 0.773 |
| MobileNetV3 | 0.6G | 0.912 | 0.851 | 0.742 |
| EfficientNetB0 | 0.39G | 0.833 | 0.934 | 0.819 |
| VGG16 | 15.5G | 0.905 | 0.903 | 0.807 |
Disclaimer/Publisher’s Note: The statements, opinions and data contained in all publications are solely those of the individual author(s) and contributor(s) and not of MDPI and/or the editor(s). MDPI and/or the editor(s) disclaim responsibility for any injury to people or property resulting from any ideas, methods, instructions or products referred to in the content. |
© 2025 by the authors. Licensee MDPI, Basel, Switzerland. This article is an open access article distributed under the terms and conditions of the Creative Commons Attribution (CC BY) license (http://creativecommons.org/licenses/by/4.0/).
Copyright: This open access article is published under a Creative Commons CC BY 4.0 license, which permit the free download, distribution, and reuse, provided that the author and preprint are cited in any reuse.


