Submitted:
02 December 2025
Posted:
04 December 2025
You are already at the latest version
Abstract
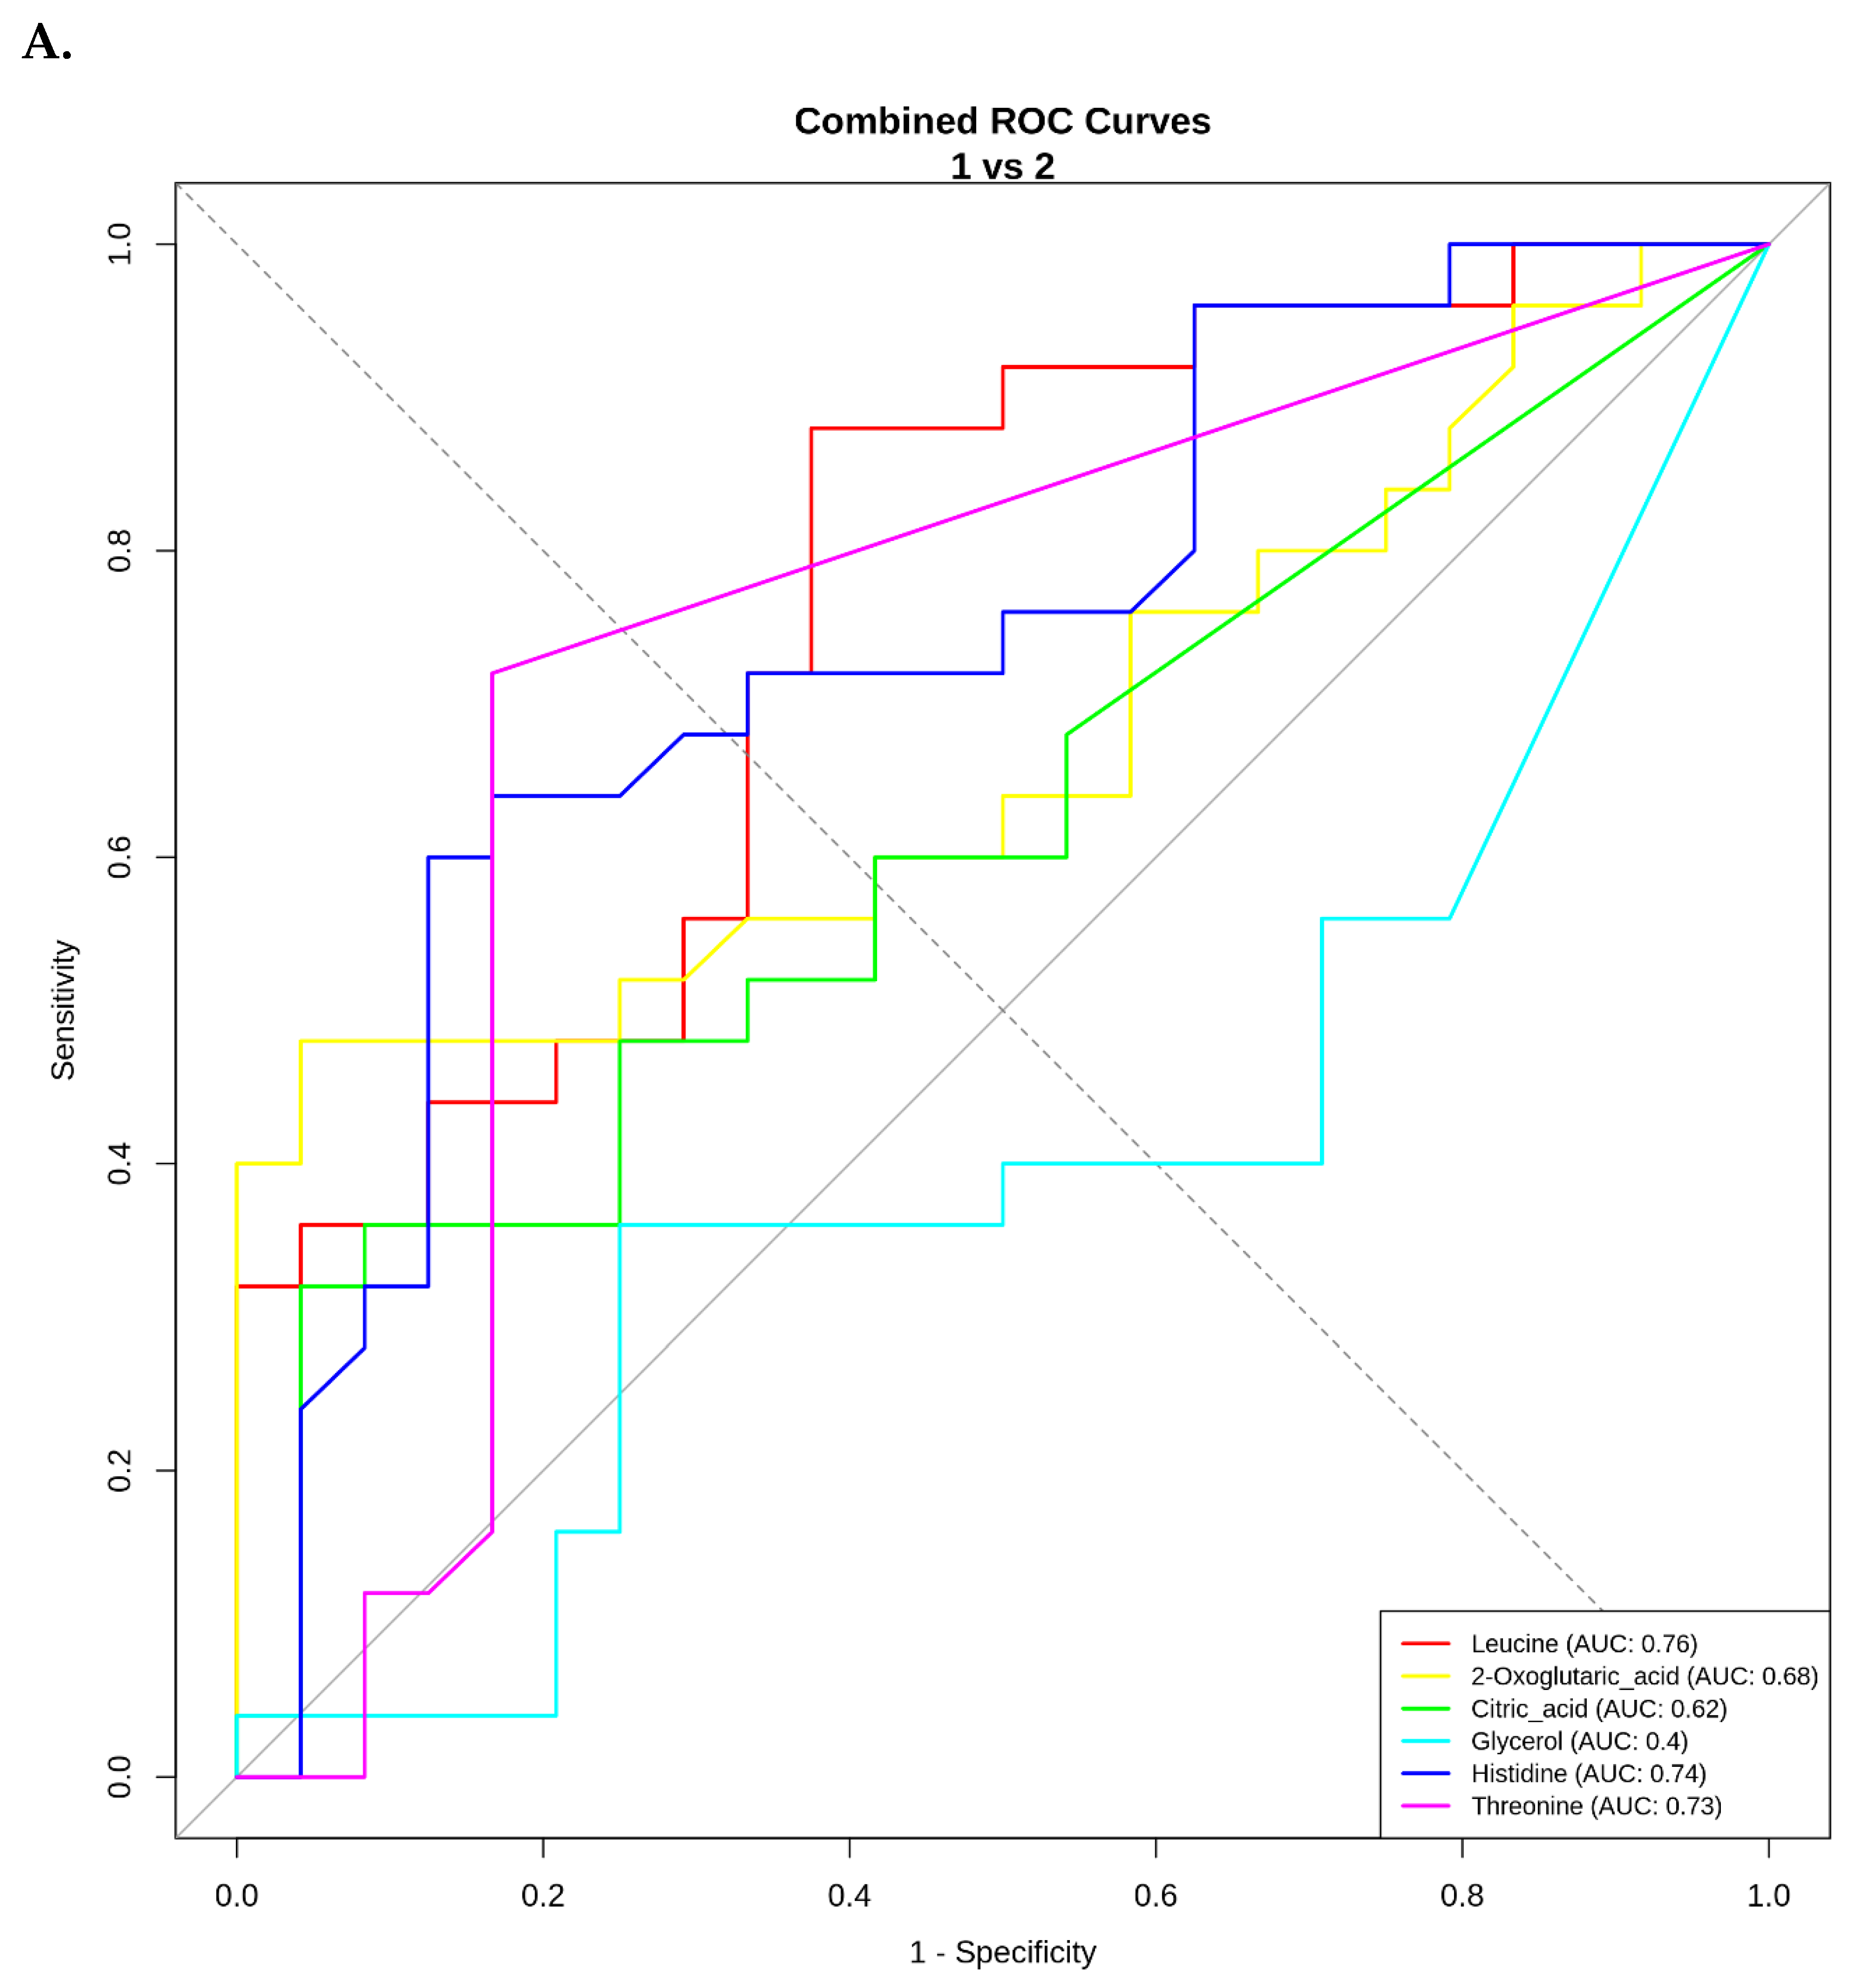
Cerebrospinal fluid (CSF) oligoclonal band (OCB) analysis is central to the diagnostic evaluation of neuroinflammatory diseases of the central nervous system (CNS), yet its reliance on lumbar puncture limits utility in screening and longitudinal monitoring. Serum metabolomics provides a minimally invasive approach to capture peripheral correlates of intrathecal immune activity. This study extends our previous two-group comparison by incorporating all five classical OCB patterns to delineate serum metabolic gradients associated with varying degrees of intrathecal immunoglobulin synthesis. A total of 92 adults undergoing diagnostic evaluation for suspected CNS inflammatory disorders were stratified by OCB Type (1–5). Serum samples were analysed using targeted ¹H-NMR spectroscopy on a Bruker Avance Neo 600 MHz platform and processed with Bruker’s IVDr pipeline. Statistical analyses included Kruskal–Wallis testing with FDR correction, PCA, PLS-DA with VIP scoring, and ROC-AUC modelling. Six metabolites exhibited significant or near-significant differences, led by Leucine (p = 0.0047, q = 0.073) and 2-Oxoglutaric acid (p = 0.0022, q = 0.069). PLS-DA identified five key discriminators with VIP > 1.5: Leucine, 2-Oxoglutaric acid, Histidine, Valine, and Glycine. A combined logistic model (Leucine + Histidine + Citric acid) achieved an AUC of 0.83 for distinguishing OCB Type 1 from Type 2. This first targeted serum ¹H-NMR metabolomic evaluation across all OCB patterns reveals a graded biochemical trajectory reflective of intrathecal immune activation. Amino-acid and TCA-cycle intermediates emerge as promising minimally invasive candidates for neuroinflammatory stratification and precision evaluation beyond traditional MS paradigms.
Keywords:
Introduction
Methods
Study Design and Participants
Ethical Approval
Serum Sample Preparation for ¹H-NMR Spectroscopy
NMR Data Acquisition
- Number of scans: 32
- Spectral width: 30 ppm
- Dummy scans: 4
- Relaxation delay: 4 s
- Total acquisition time: 4 min 4 s
Metabolite Identification and Quality Control
- residual water peak interference,
- baseline distortions,
- line broadening,
- contamination artefacts.
Statistical Analysis
- Normality was evaluated using the Shapiro–Wilk test.
- Group comparisons across OCB Types 1–5 used the Kruskal–Wallis test with Dunn post-hoc tests, adjusted with Benjamini–Hochberg FDR.
- Correlation analysis used Spearman’s ρ.
- PCA (FactoMineR) and PLS-DA (mixOmics) were employed for multivariate pattern identification.
- Discriminatory metabolites were defined as VIP > 1.5.
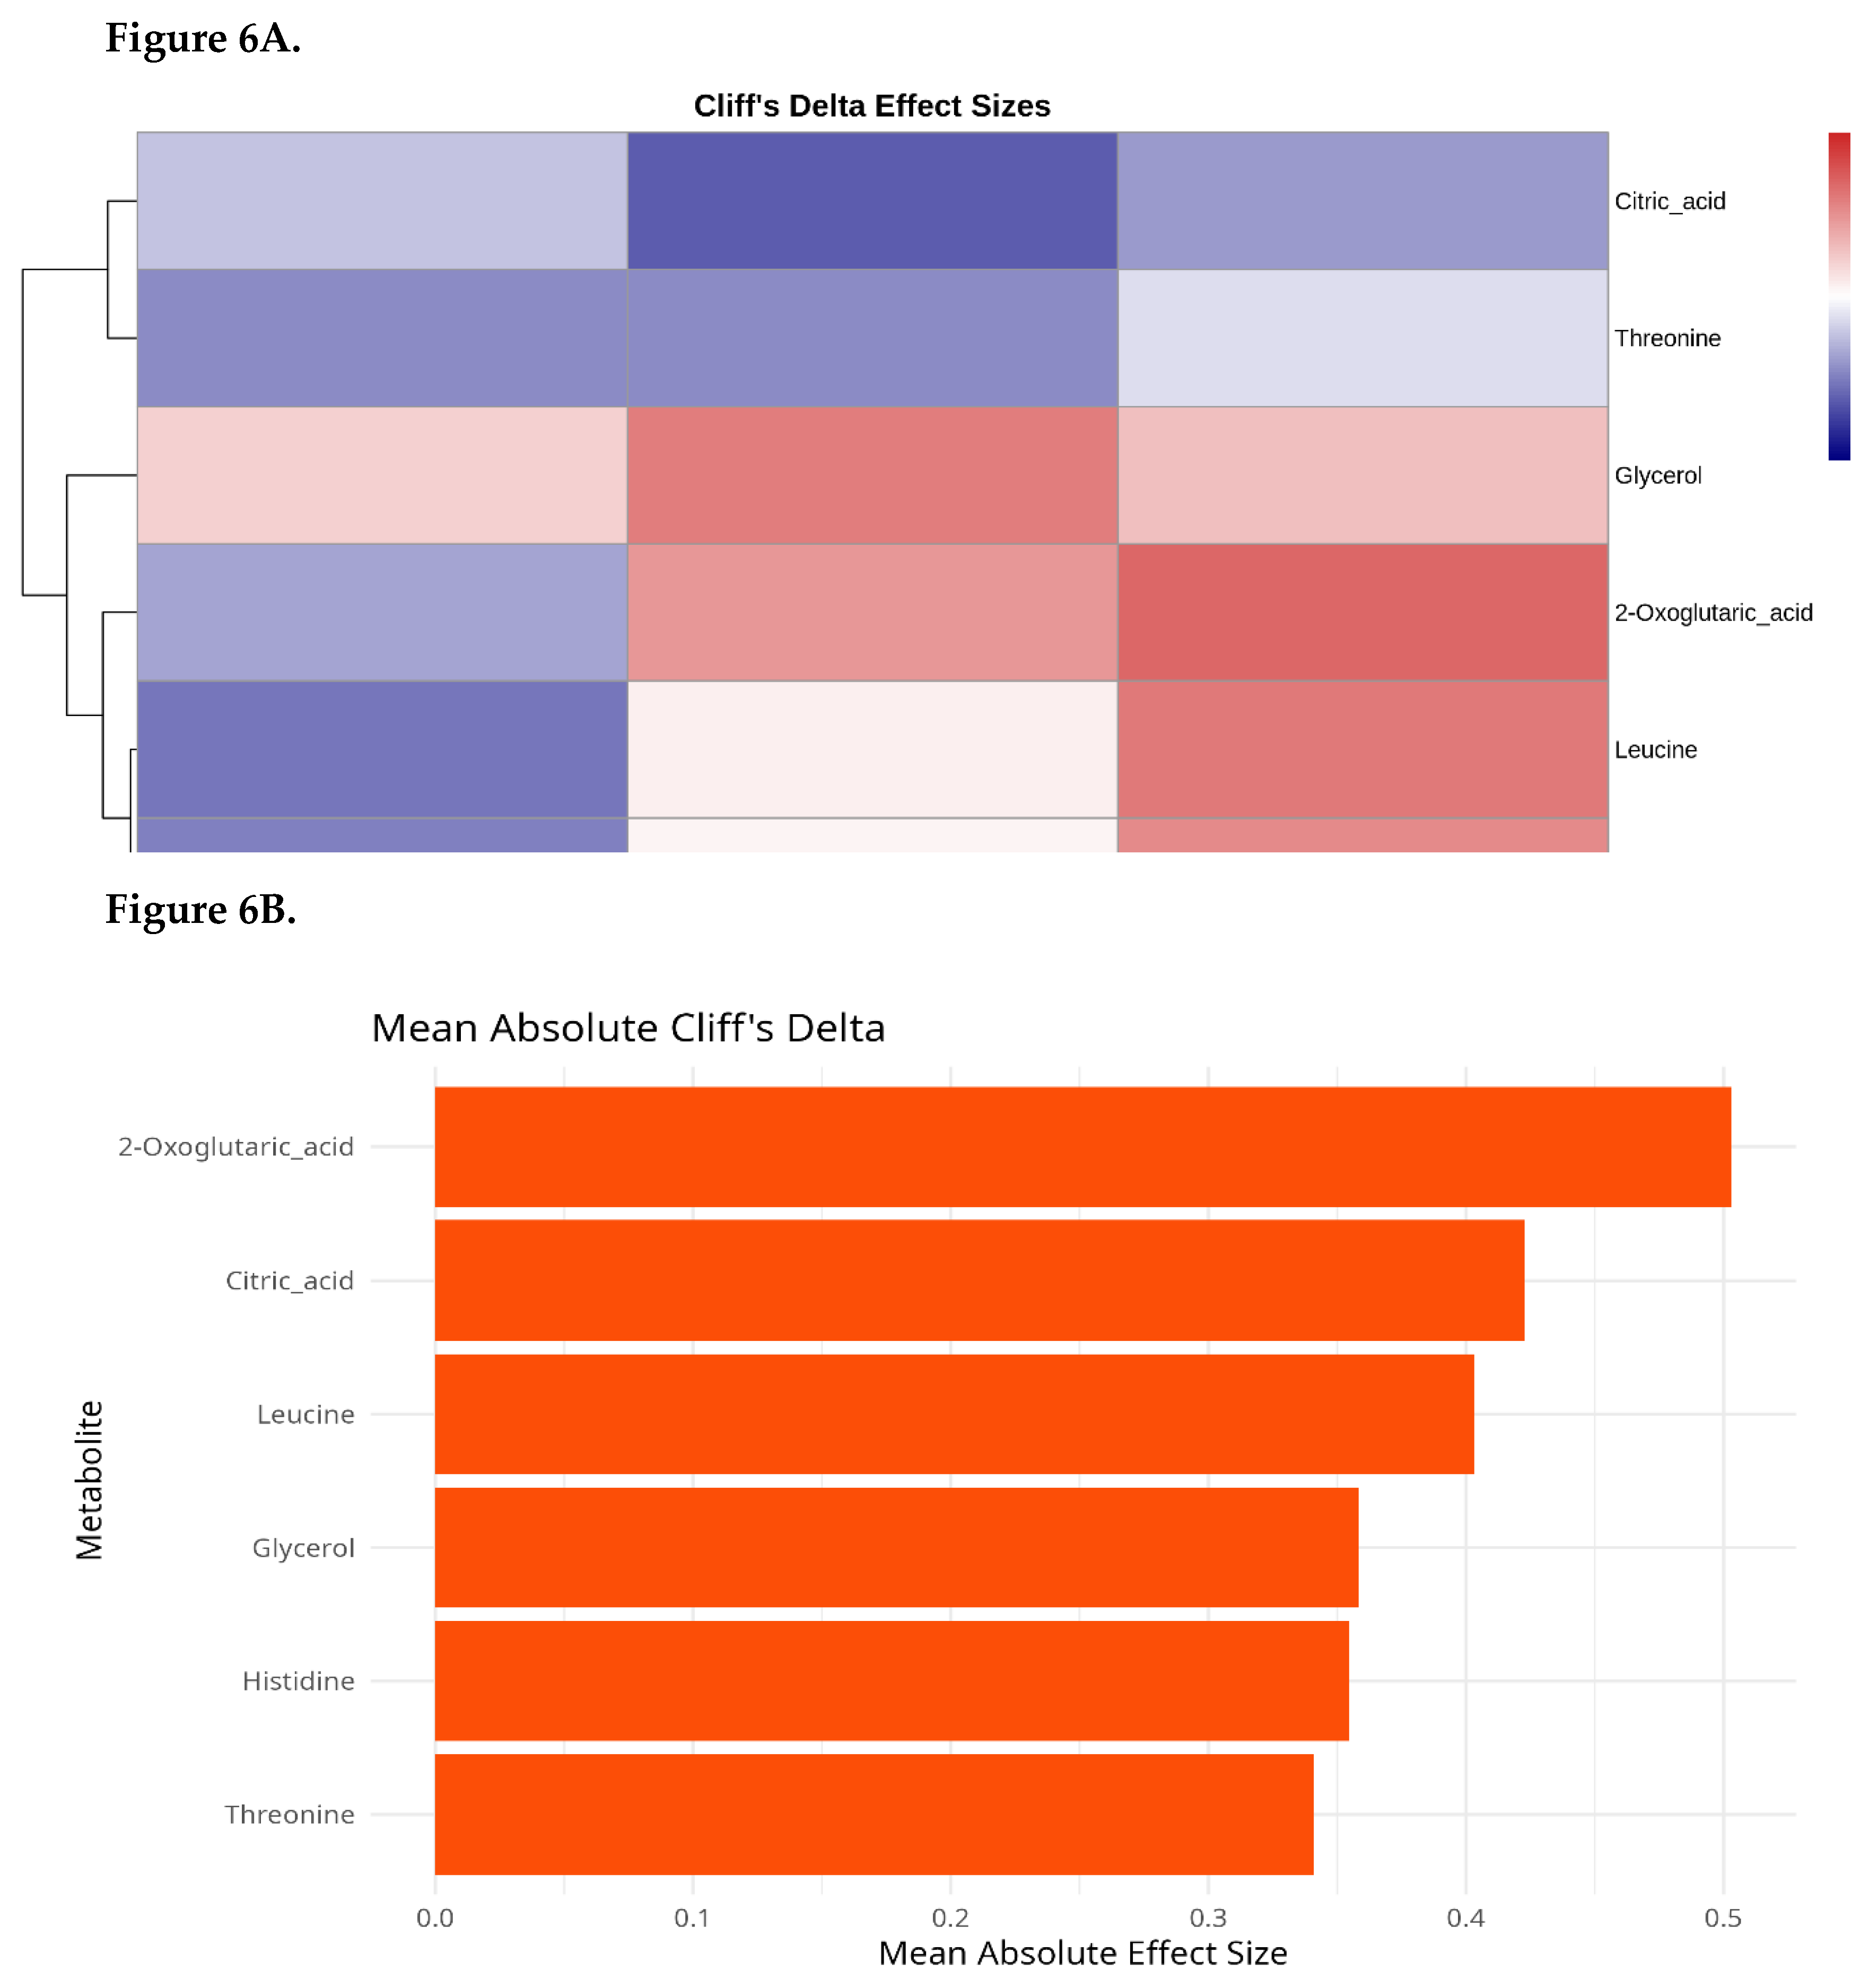
- Cliff’s delta (δ) quantified effect sizes for pairwise contrasts.
- ROC curves and AUC values assessed classification performance using pROC.
- Figures were generated with ggplot2 and ComplexHeatmap.
Results
Participant Demographics

| OCB Type | n | Age | Female | Male | IgG index | IgG serum | IgG ratio | Albumin serum | Albumin ratio ×10⁻³ |
| Type 1 | 24 | 44.0 ± 17.1 | 14 | 9 | 0.50 ± 0.05 | 1103 ± 265 | 2.67 ± 0.86 | 3622 ± 629 | 5.29 ± 1.52 |
| Type 2 | 25 | 32.7 ± 12.2 | 17 | 8 | 0.95 ± 0.45 | 1131 ± 265 | 4.42 ± 3.09 | 4141 ± 373 | 4.51 ± 1.95 |
| Type 3 | 21 | 46.6 ± 16.5 | 10 | 10 | 1.35 ± 1.12 | 1060 ± 352 | 19.31 ± 25.09 | 3679 ± 487 | 13.00 ± 7.80 |
| Type 4 | 10 | 63.5 ± 10.3 | 3 | 7 | 0.57 ± 0.08 | 931 ± 279 | 7.35 ± 5.36 | 3376 ± 546 | 12.81 ± 8.64 |
| Type 5 | 12 | 64.8 ± 10.1 | 4 | 8 | 0.52 ± 0.06 | 1123 ± 265 | 3.97 ± 2.00 | 3691 ± 455 | 7.68 ± 3.95 |
Univariate Analysis
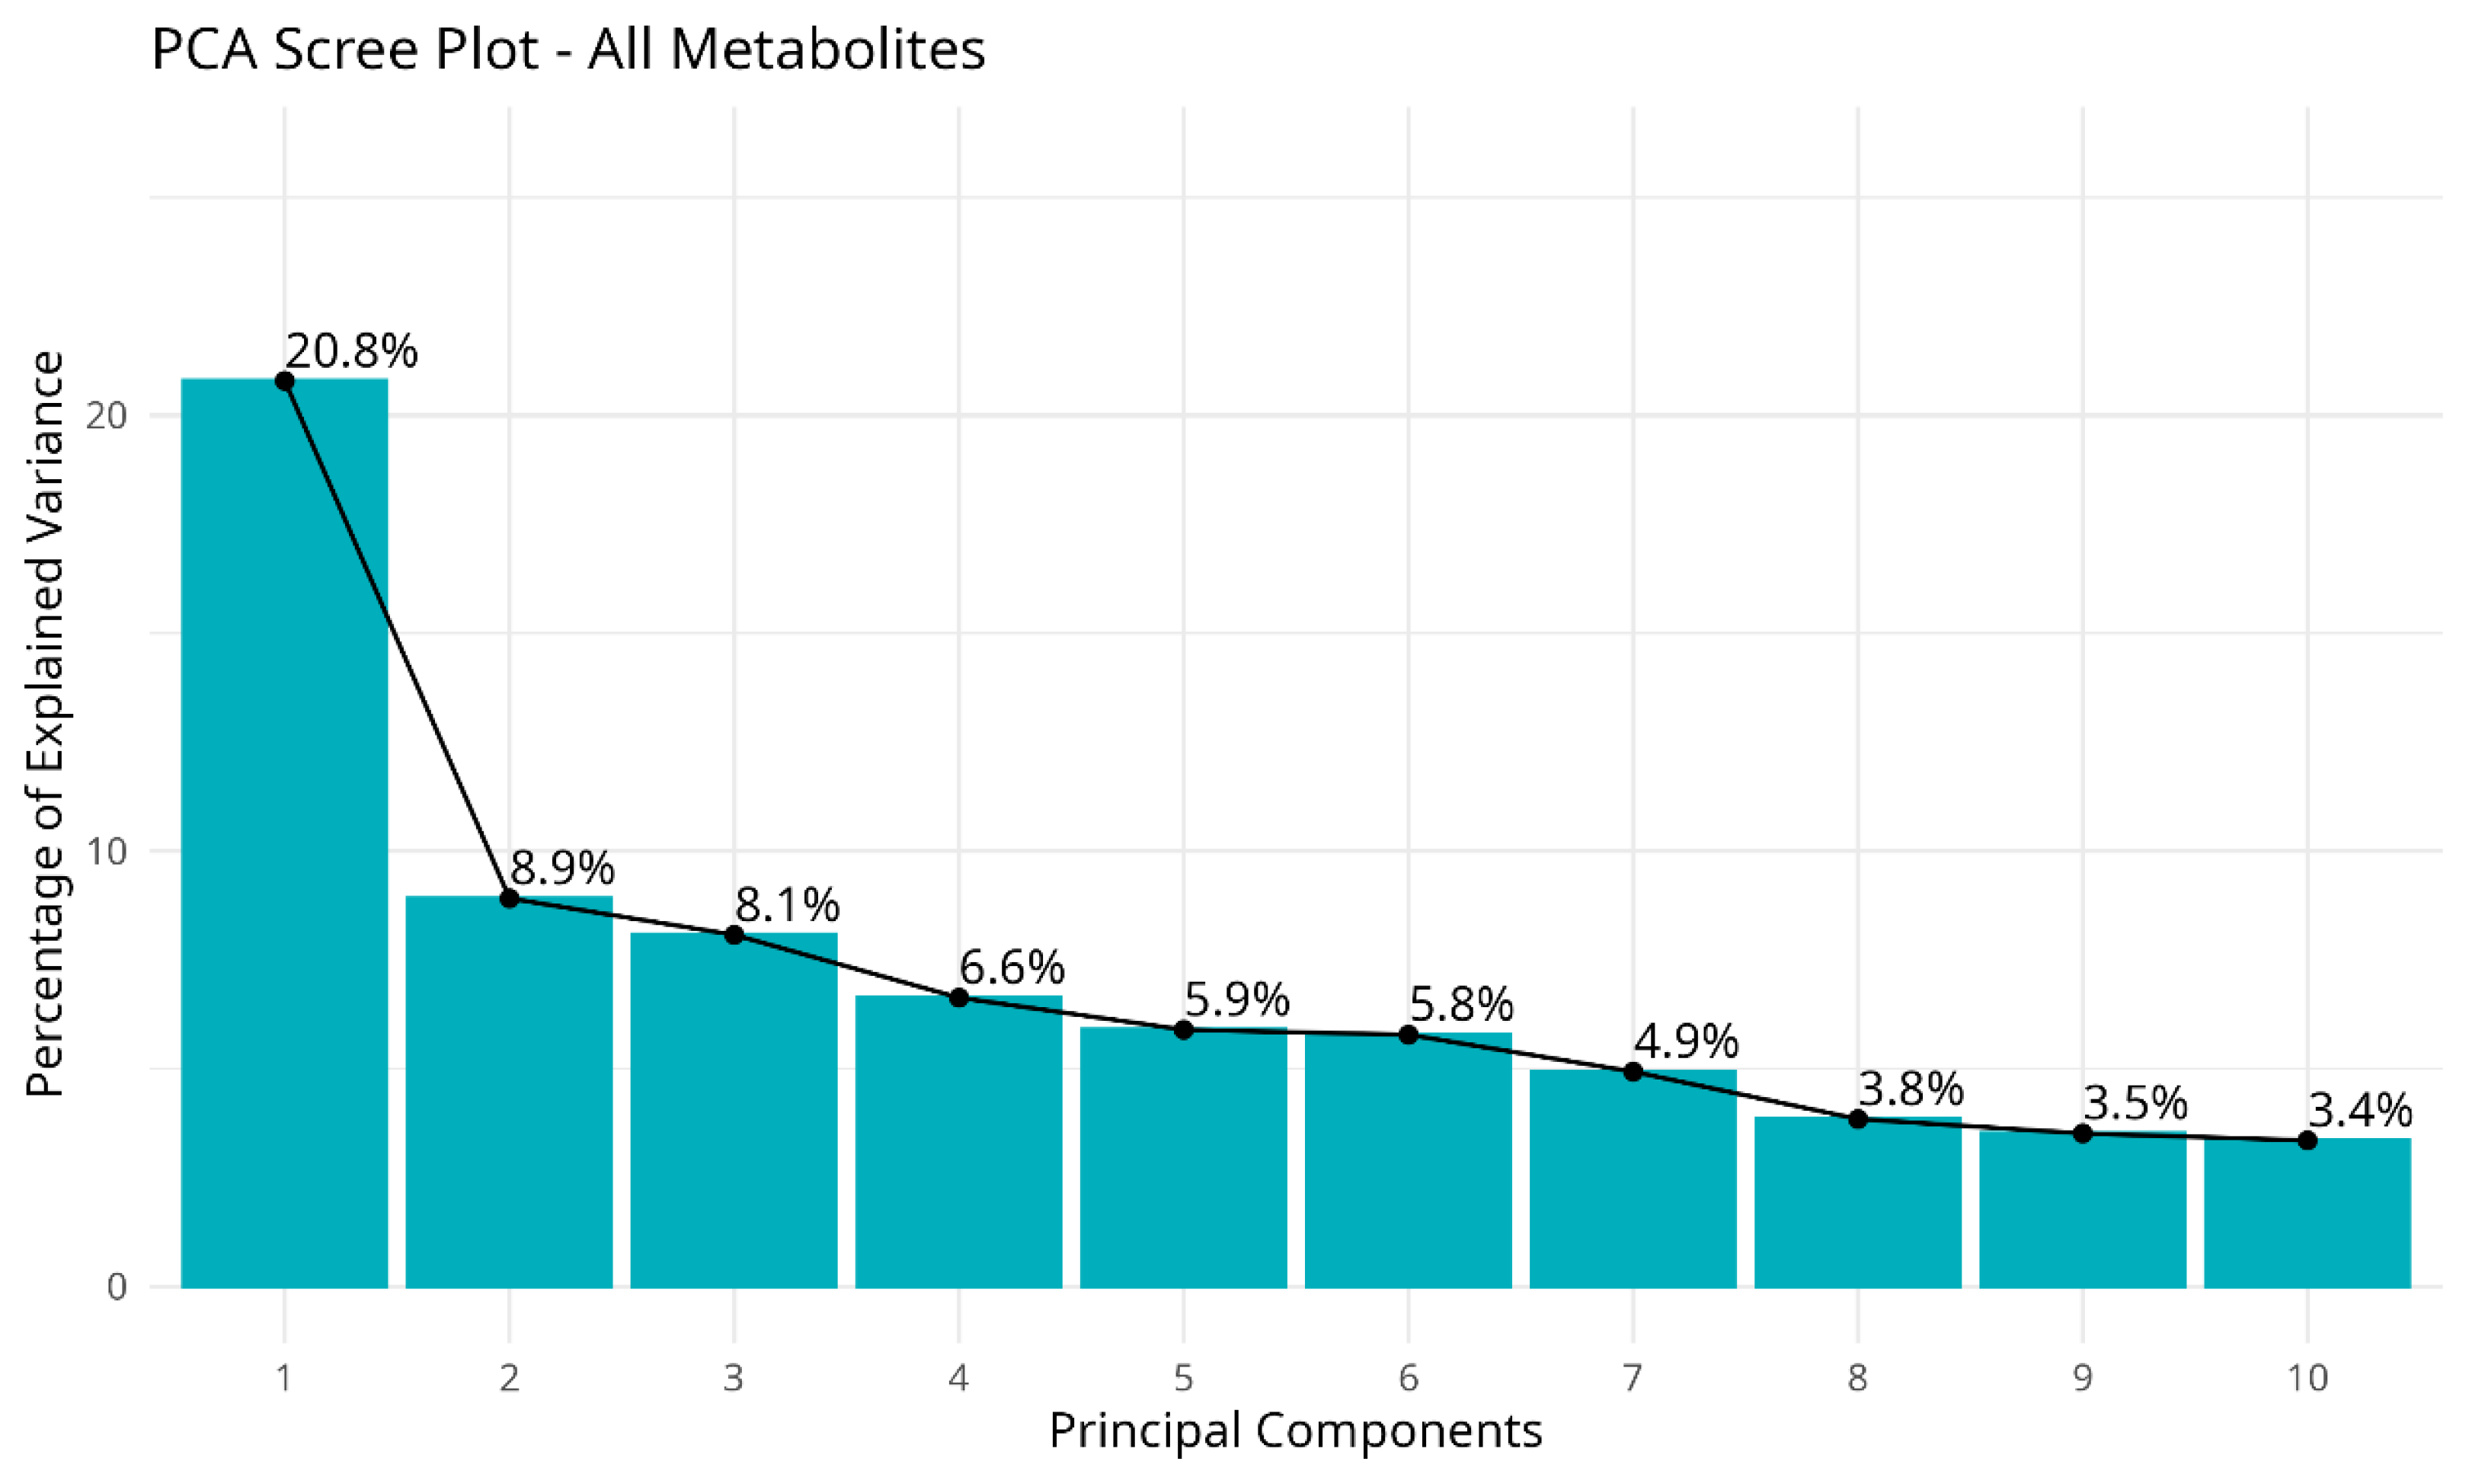
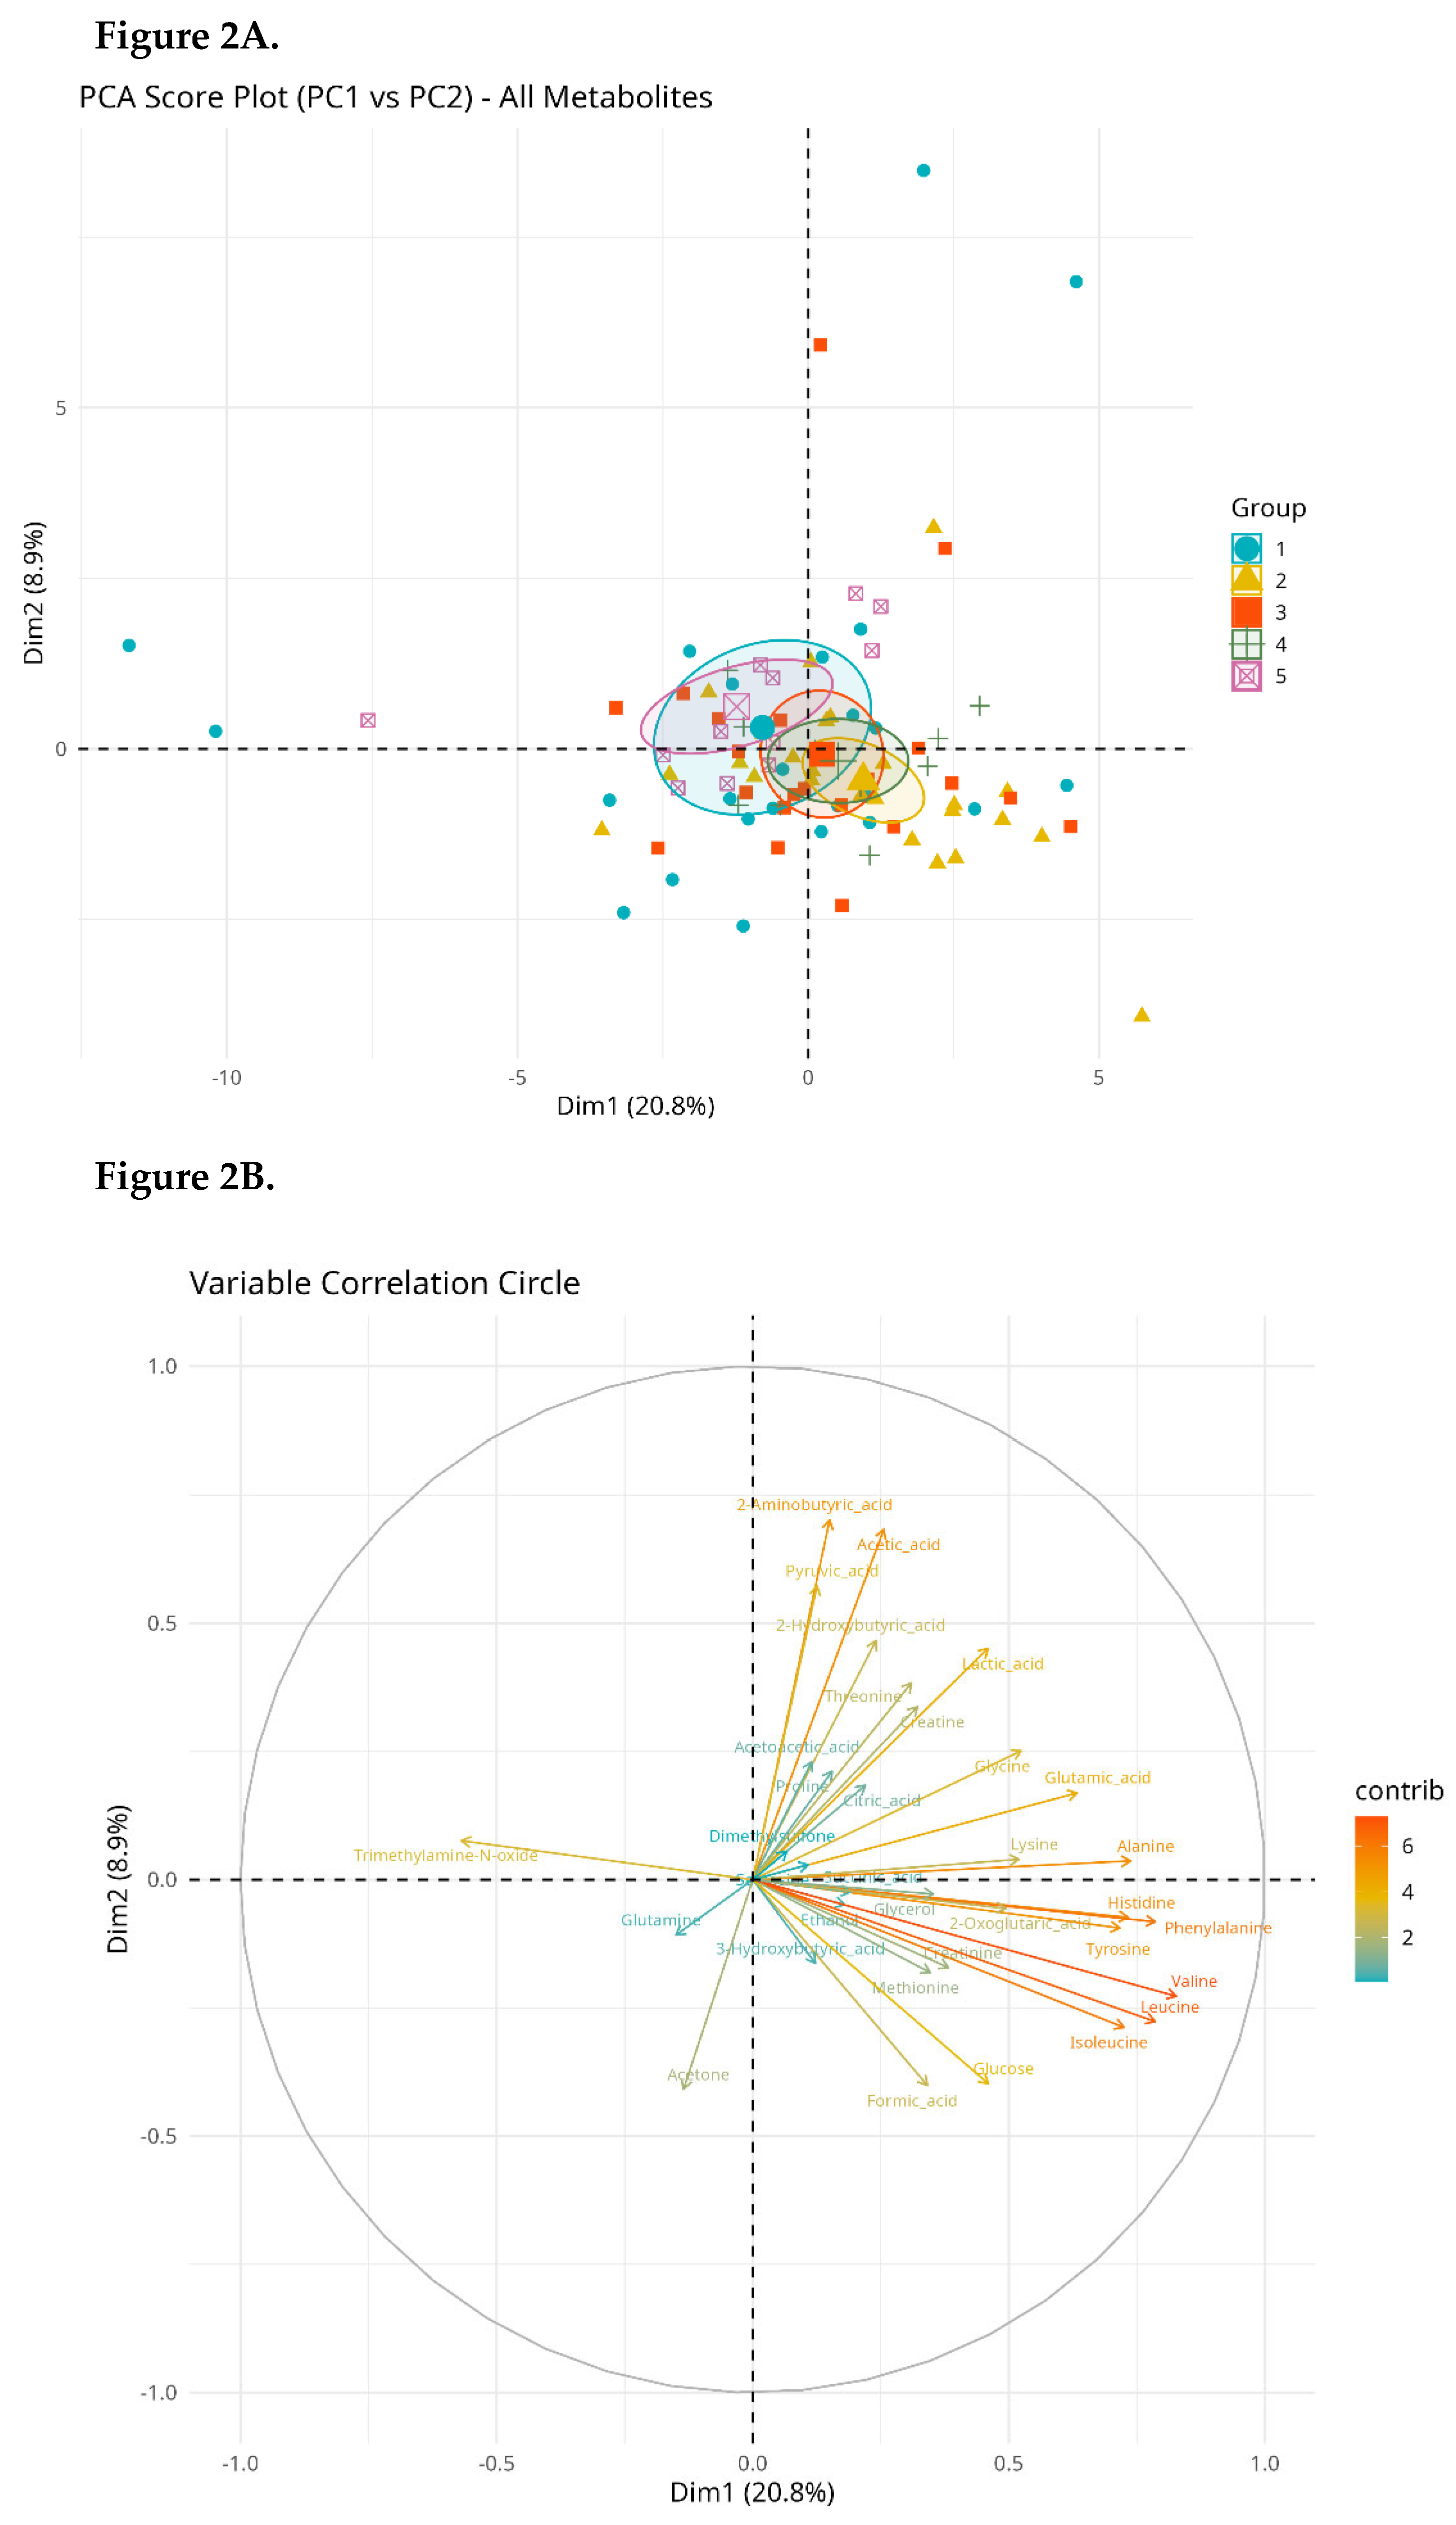
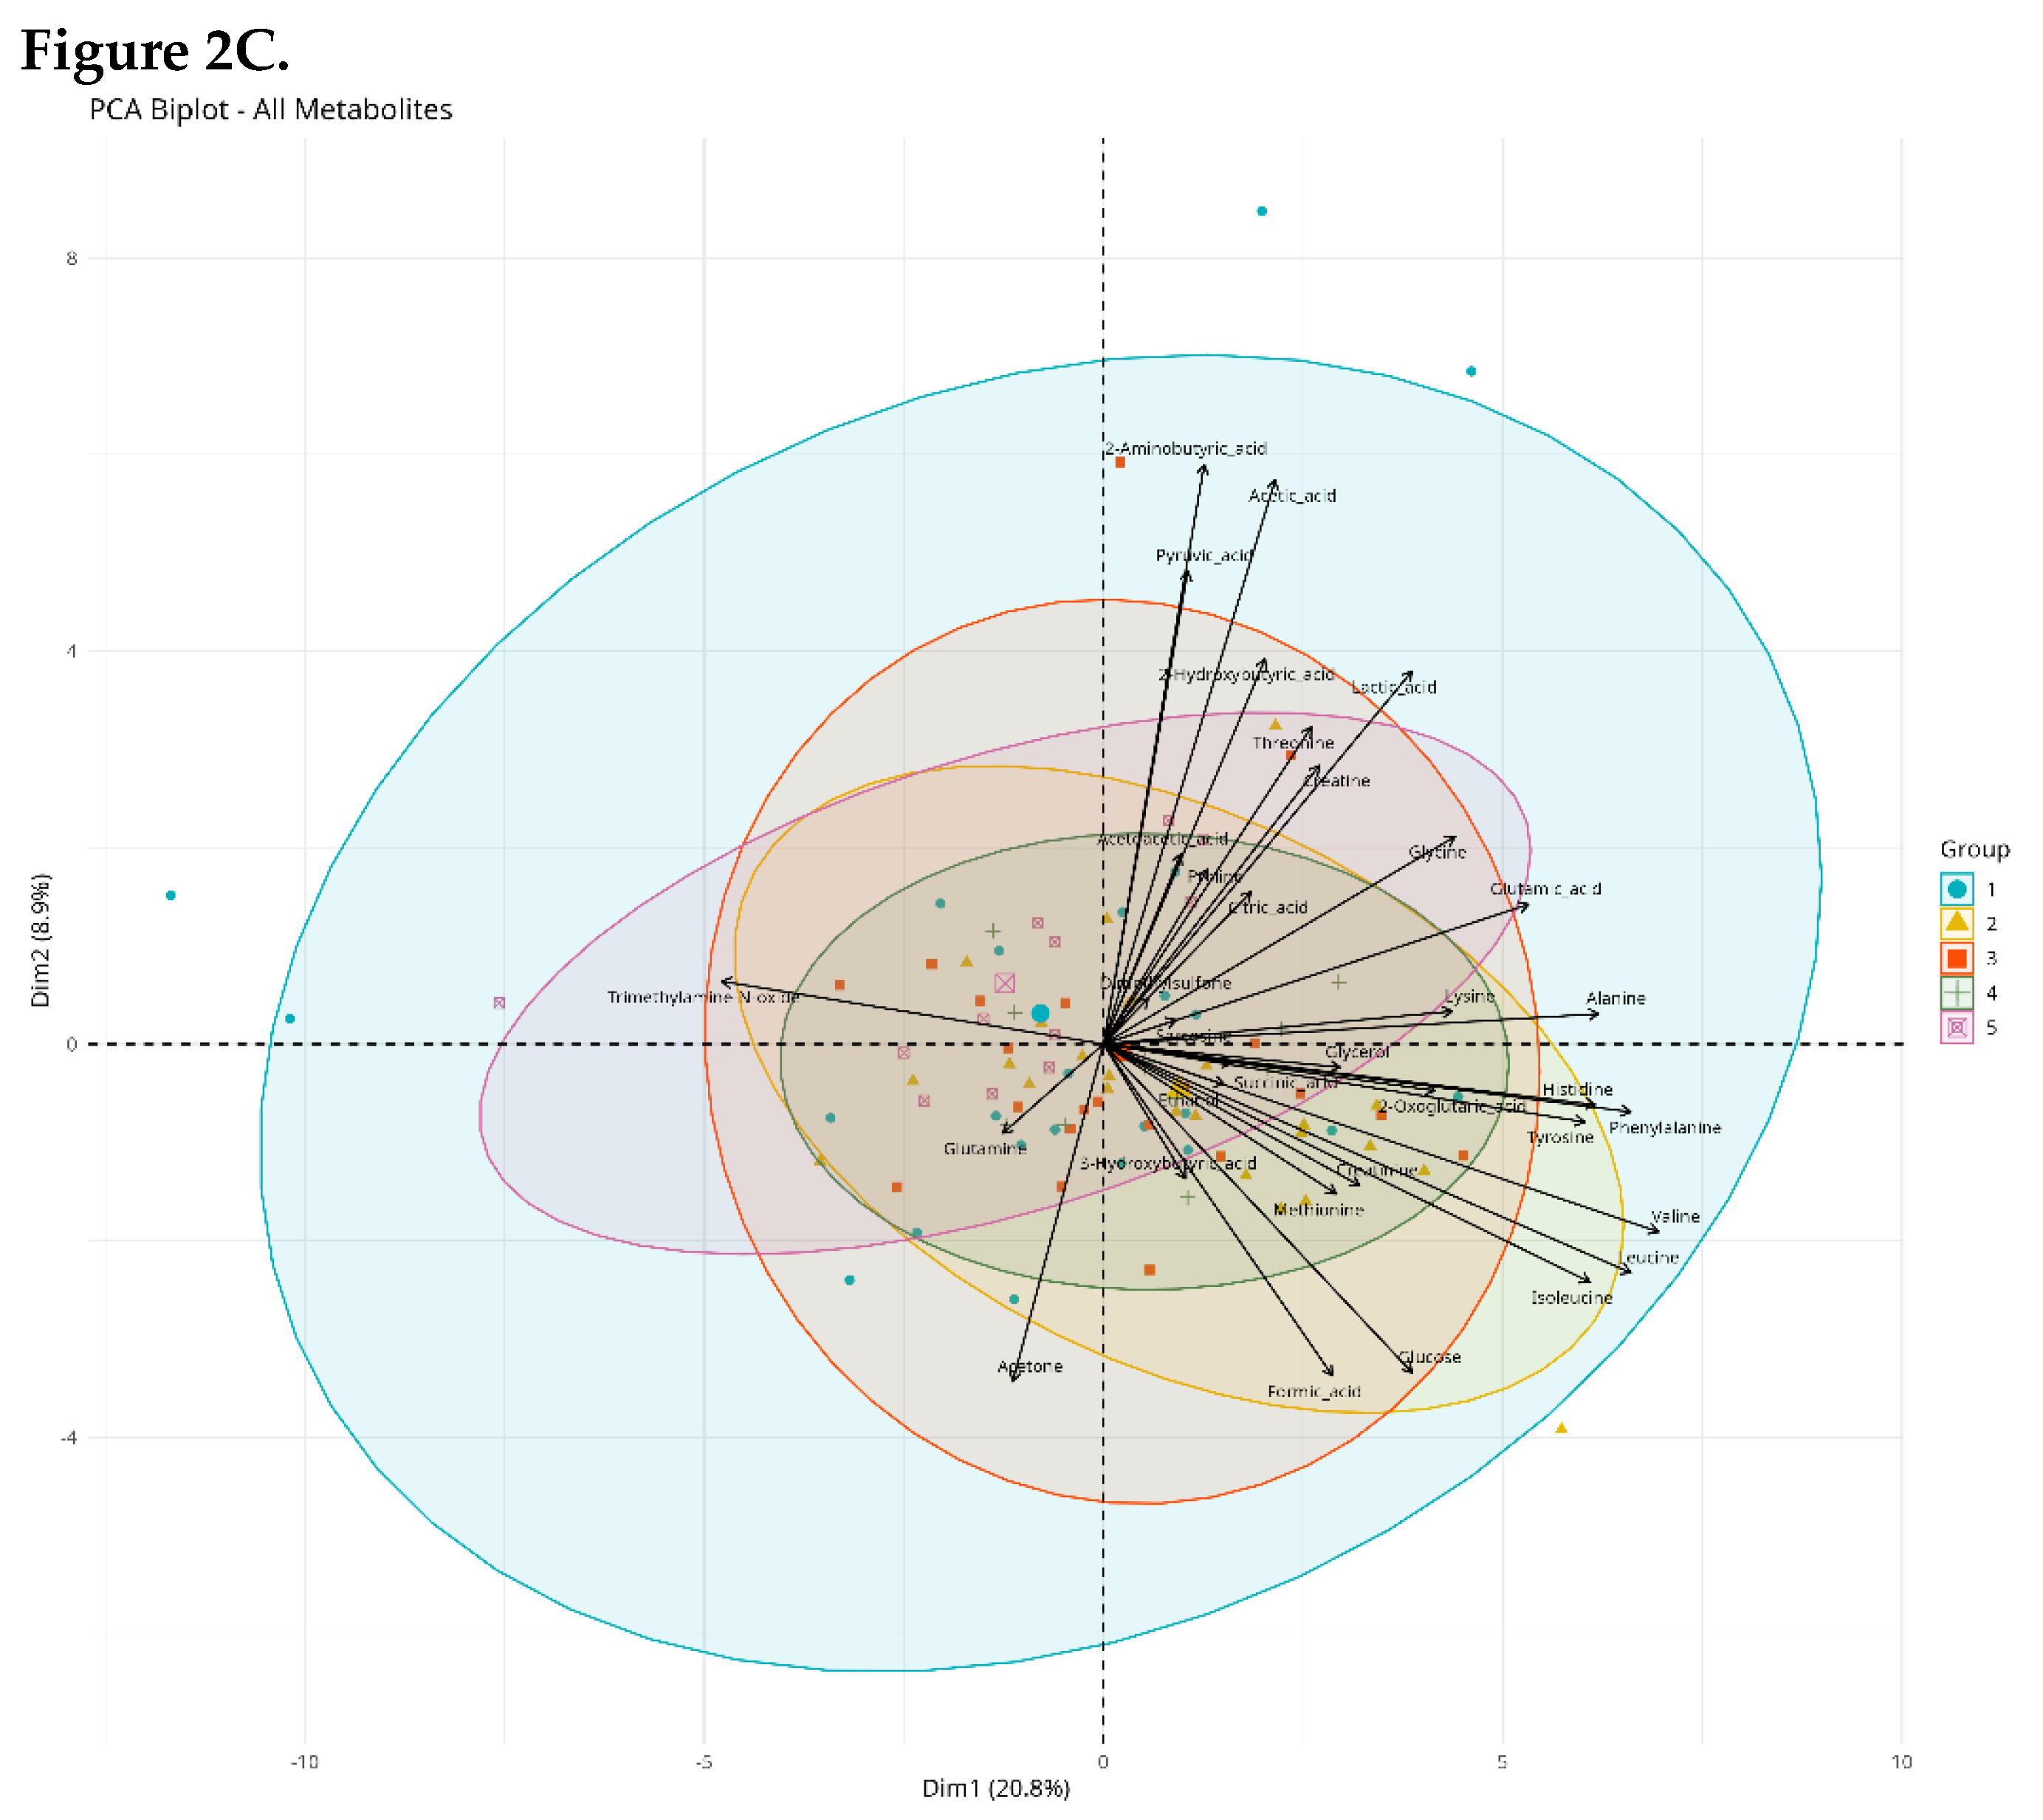
Multivariate Analysis (PCA)

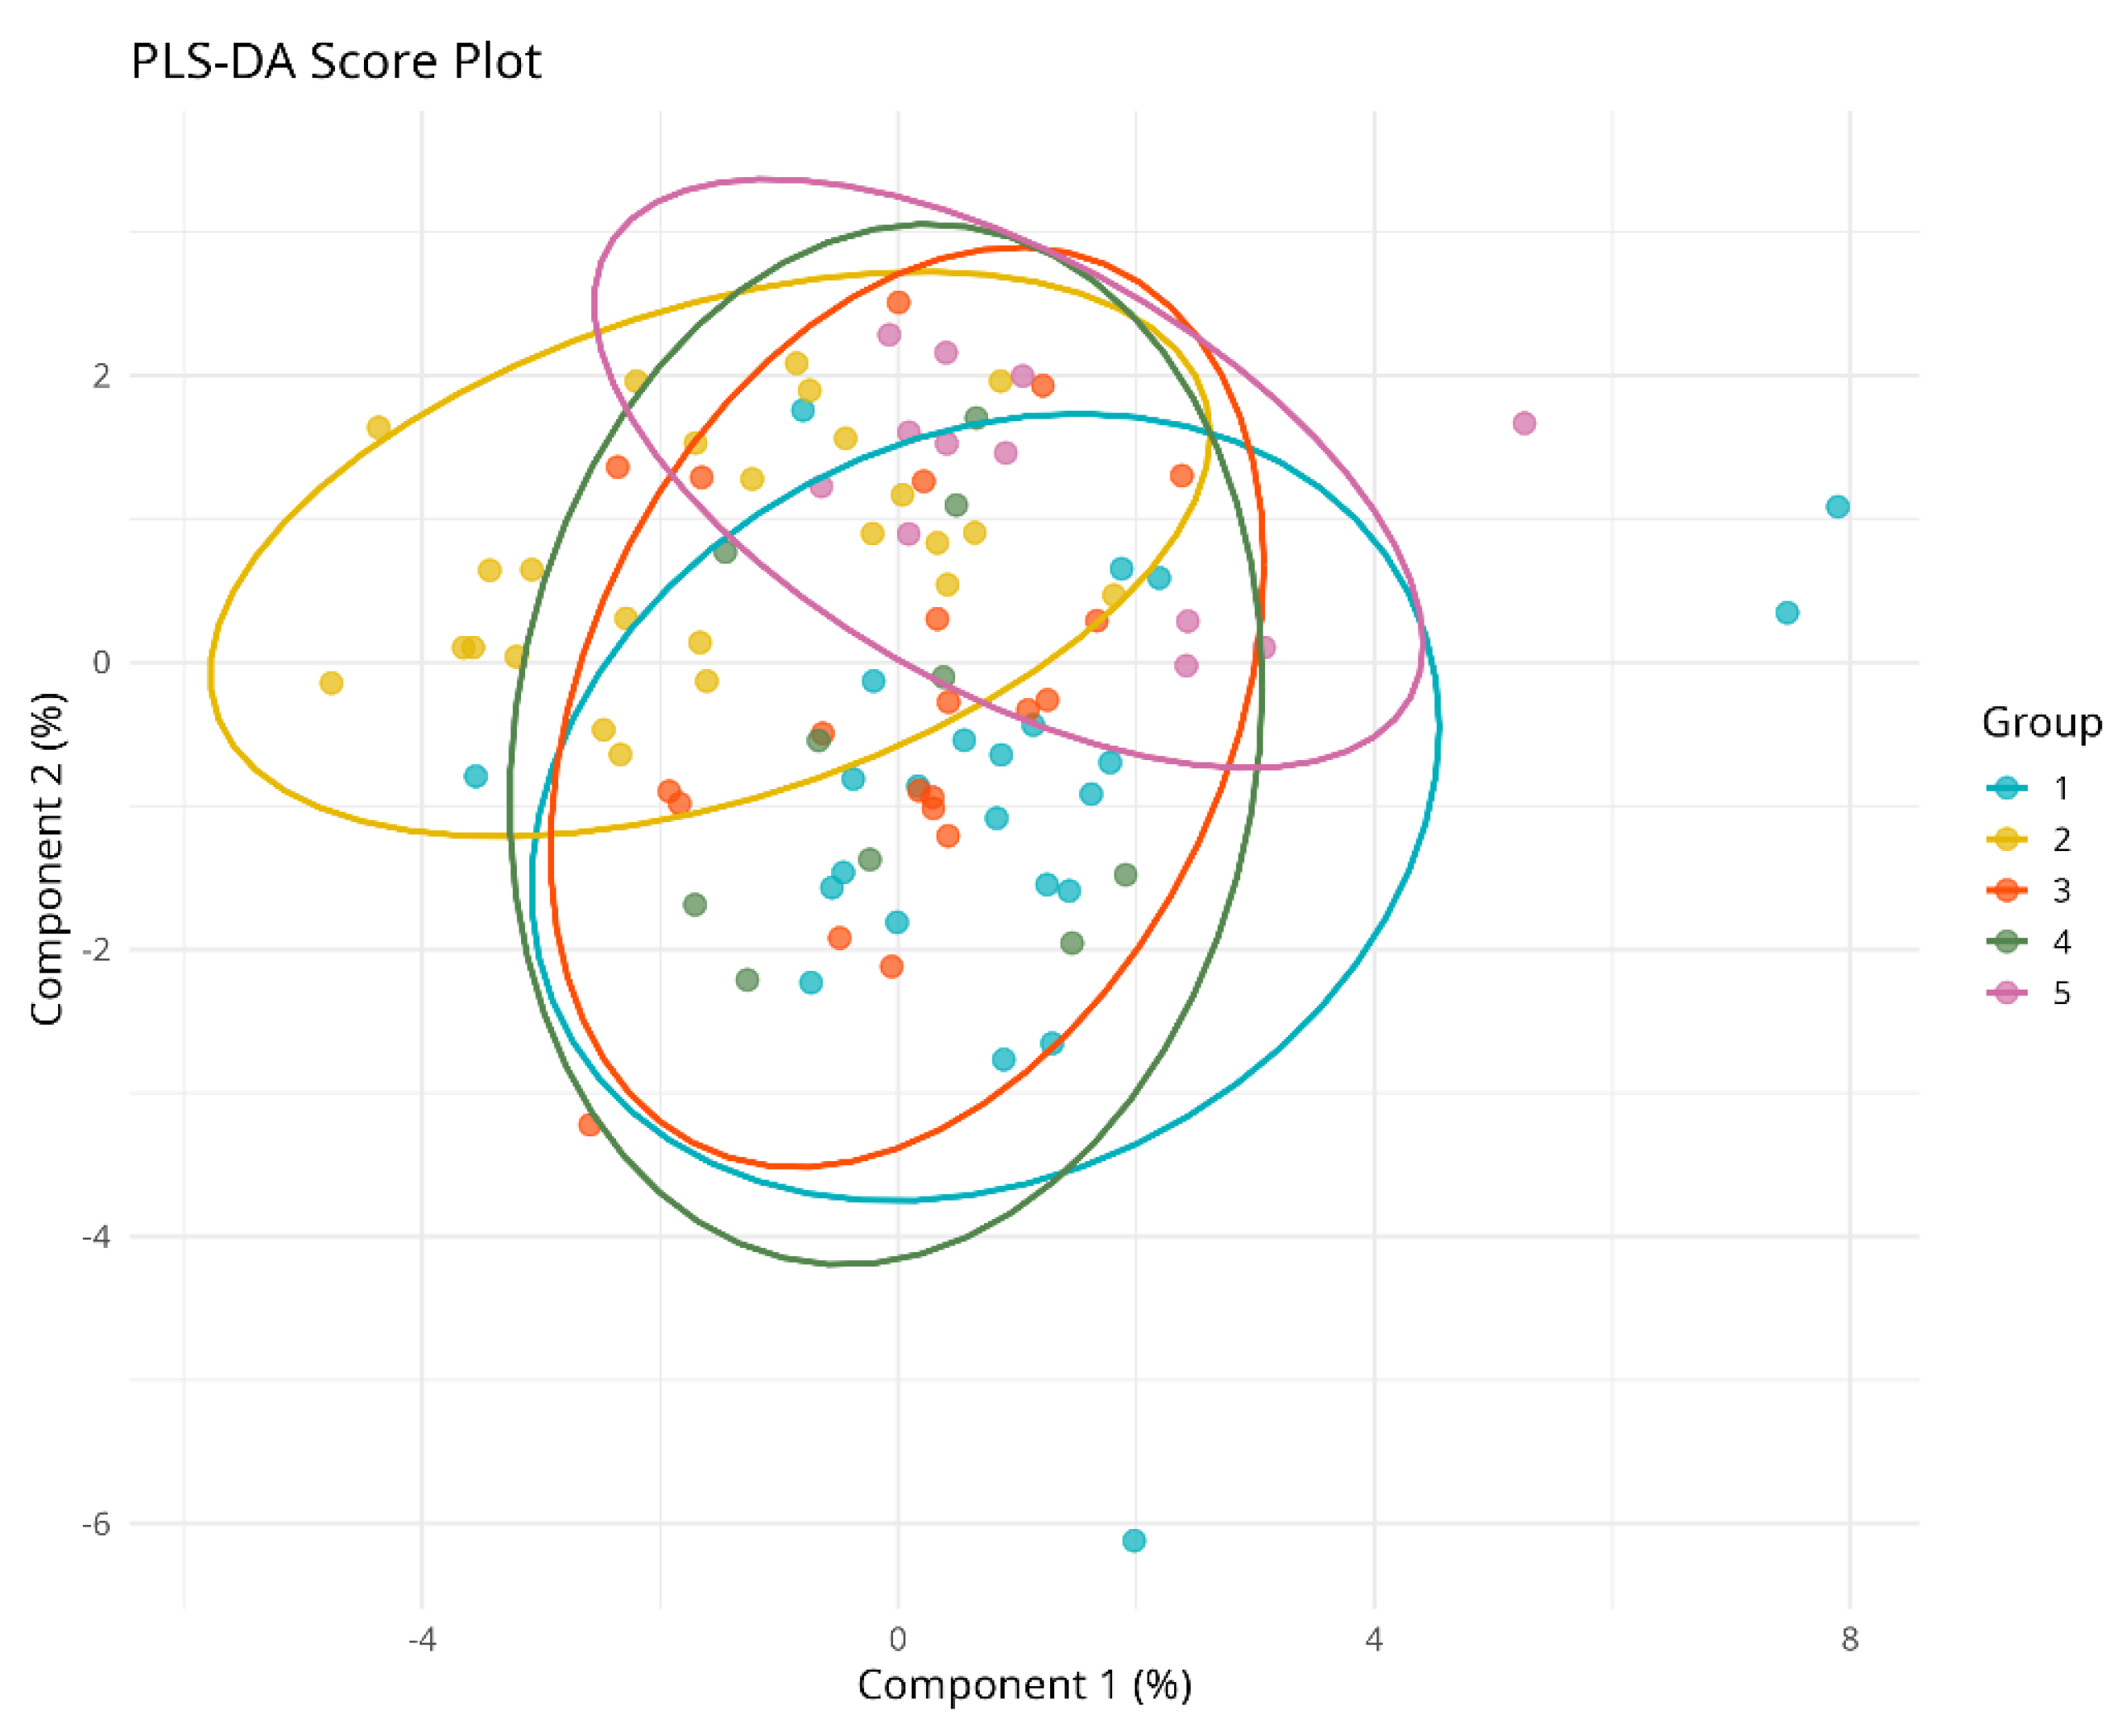
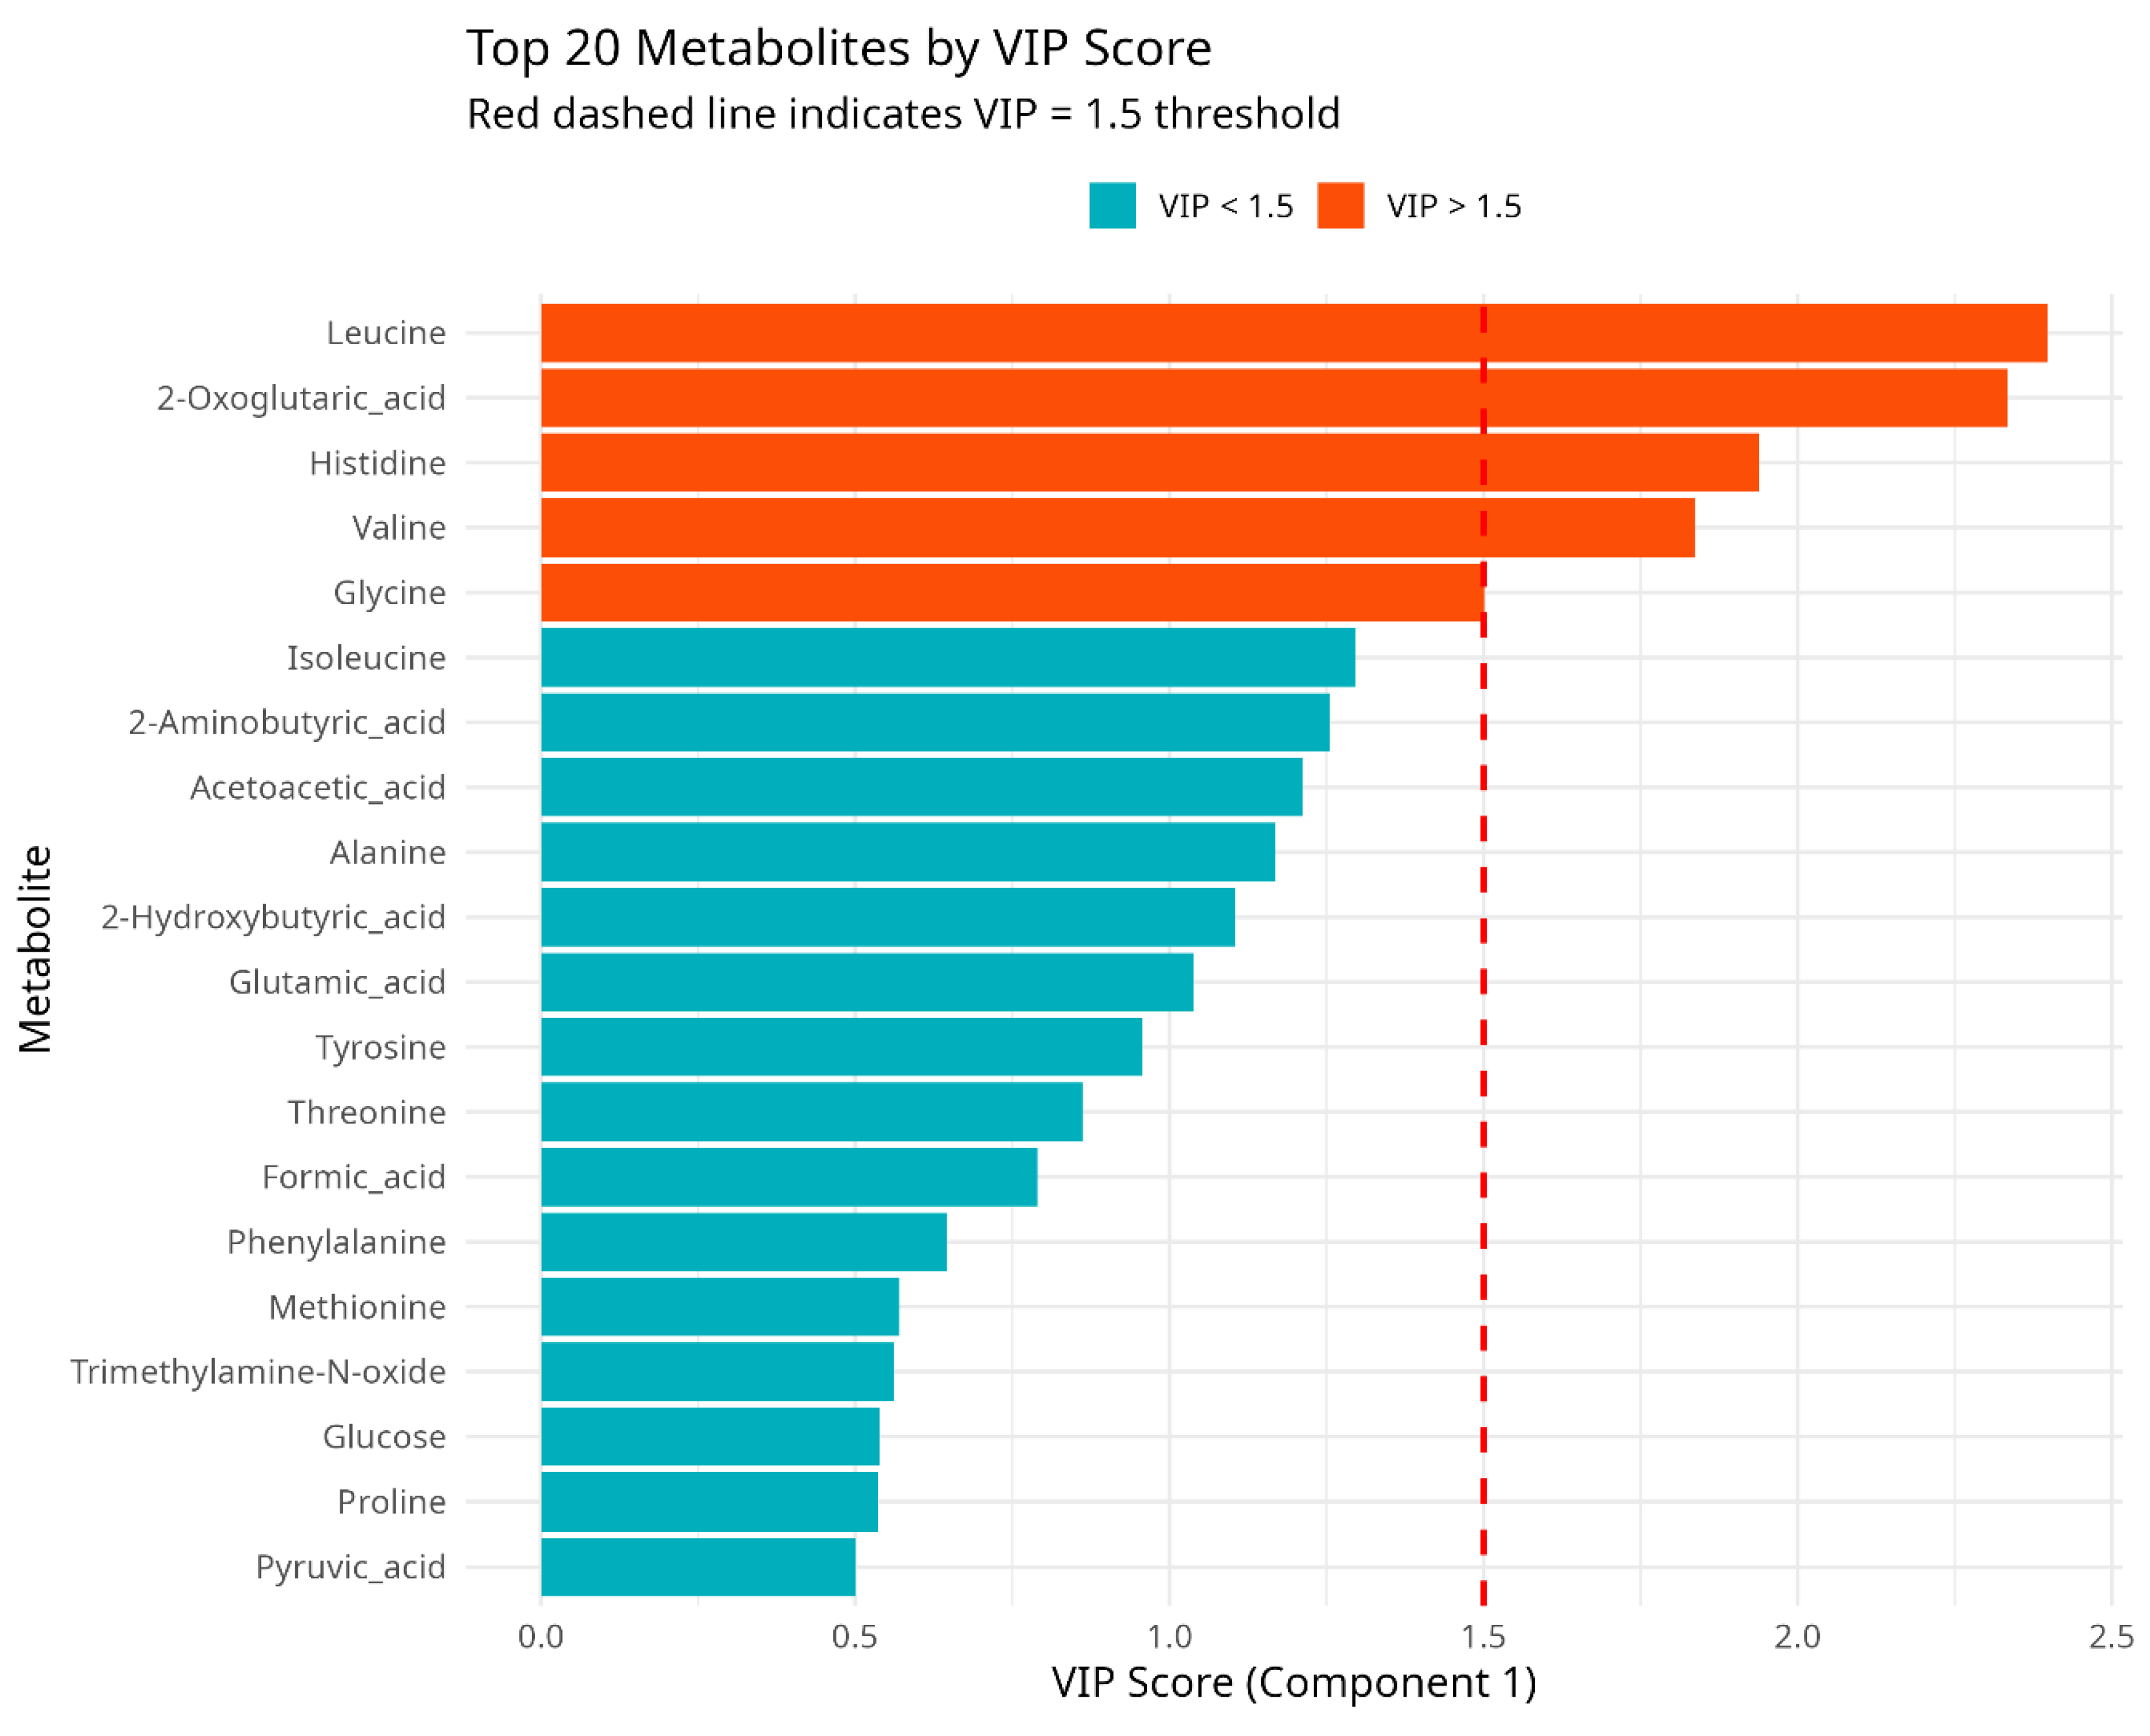
PLS-DA and VIP Analysis
- Leucine (VIP = 2.41)
- 2-Oxoglutaric acid (VIP = 2.32)
- Histidine (VIP = 1.95)
- Valine (VIP = 1.78)
- Glycine (VIP = 1.51)
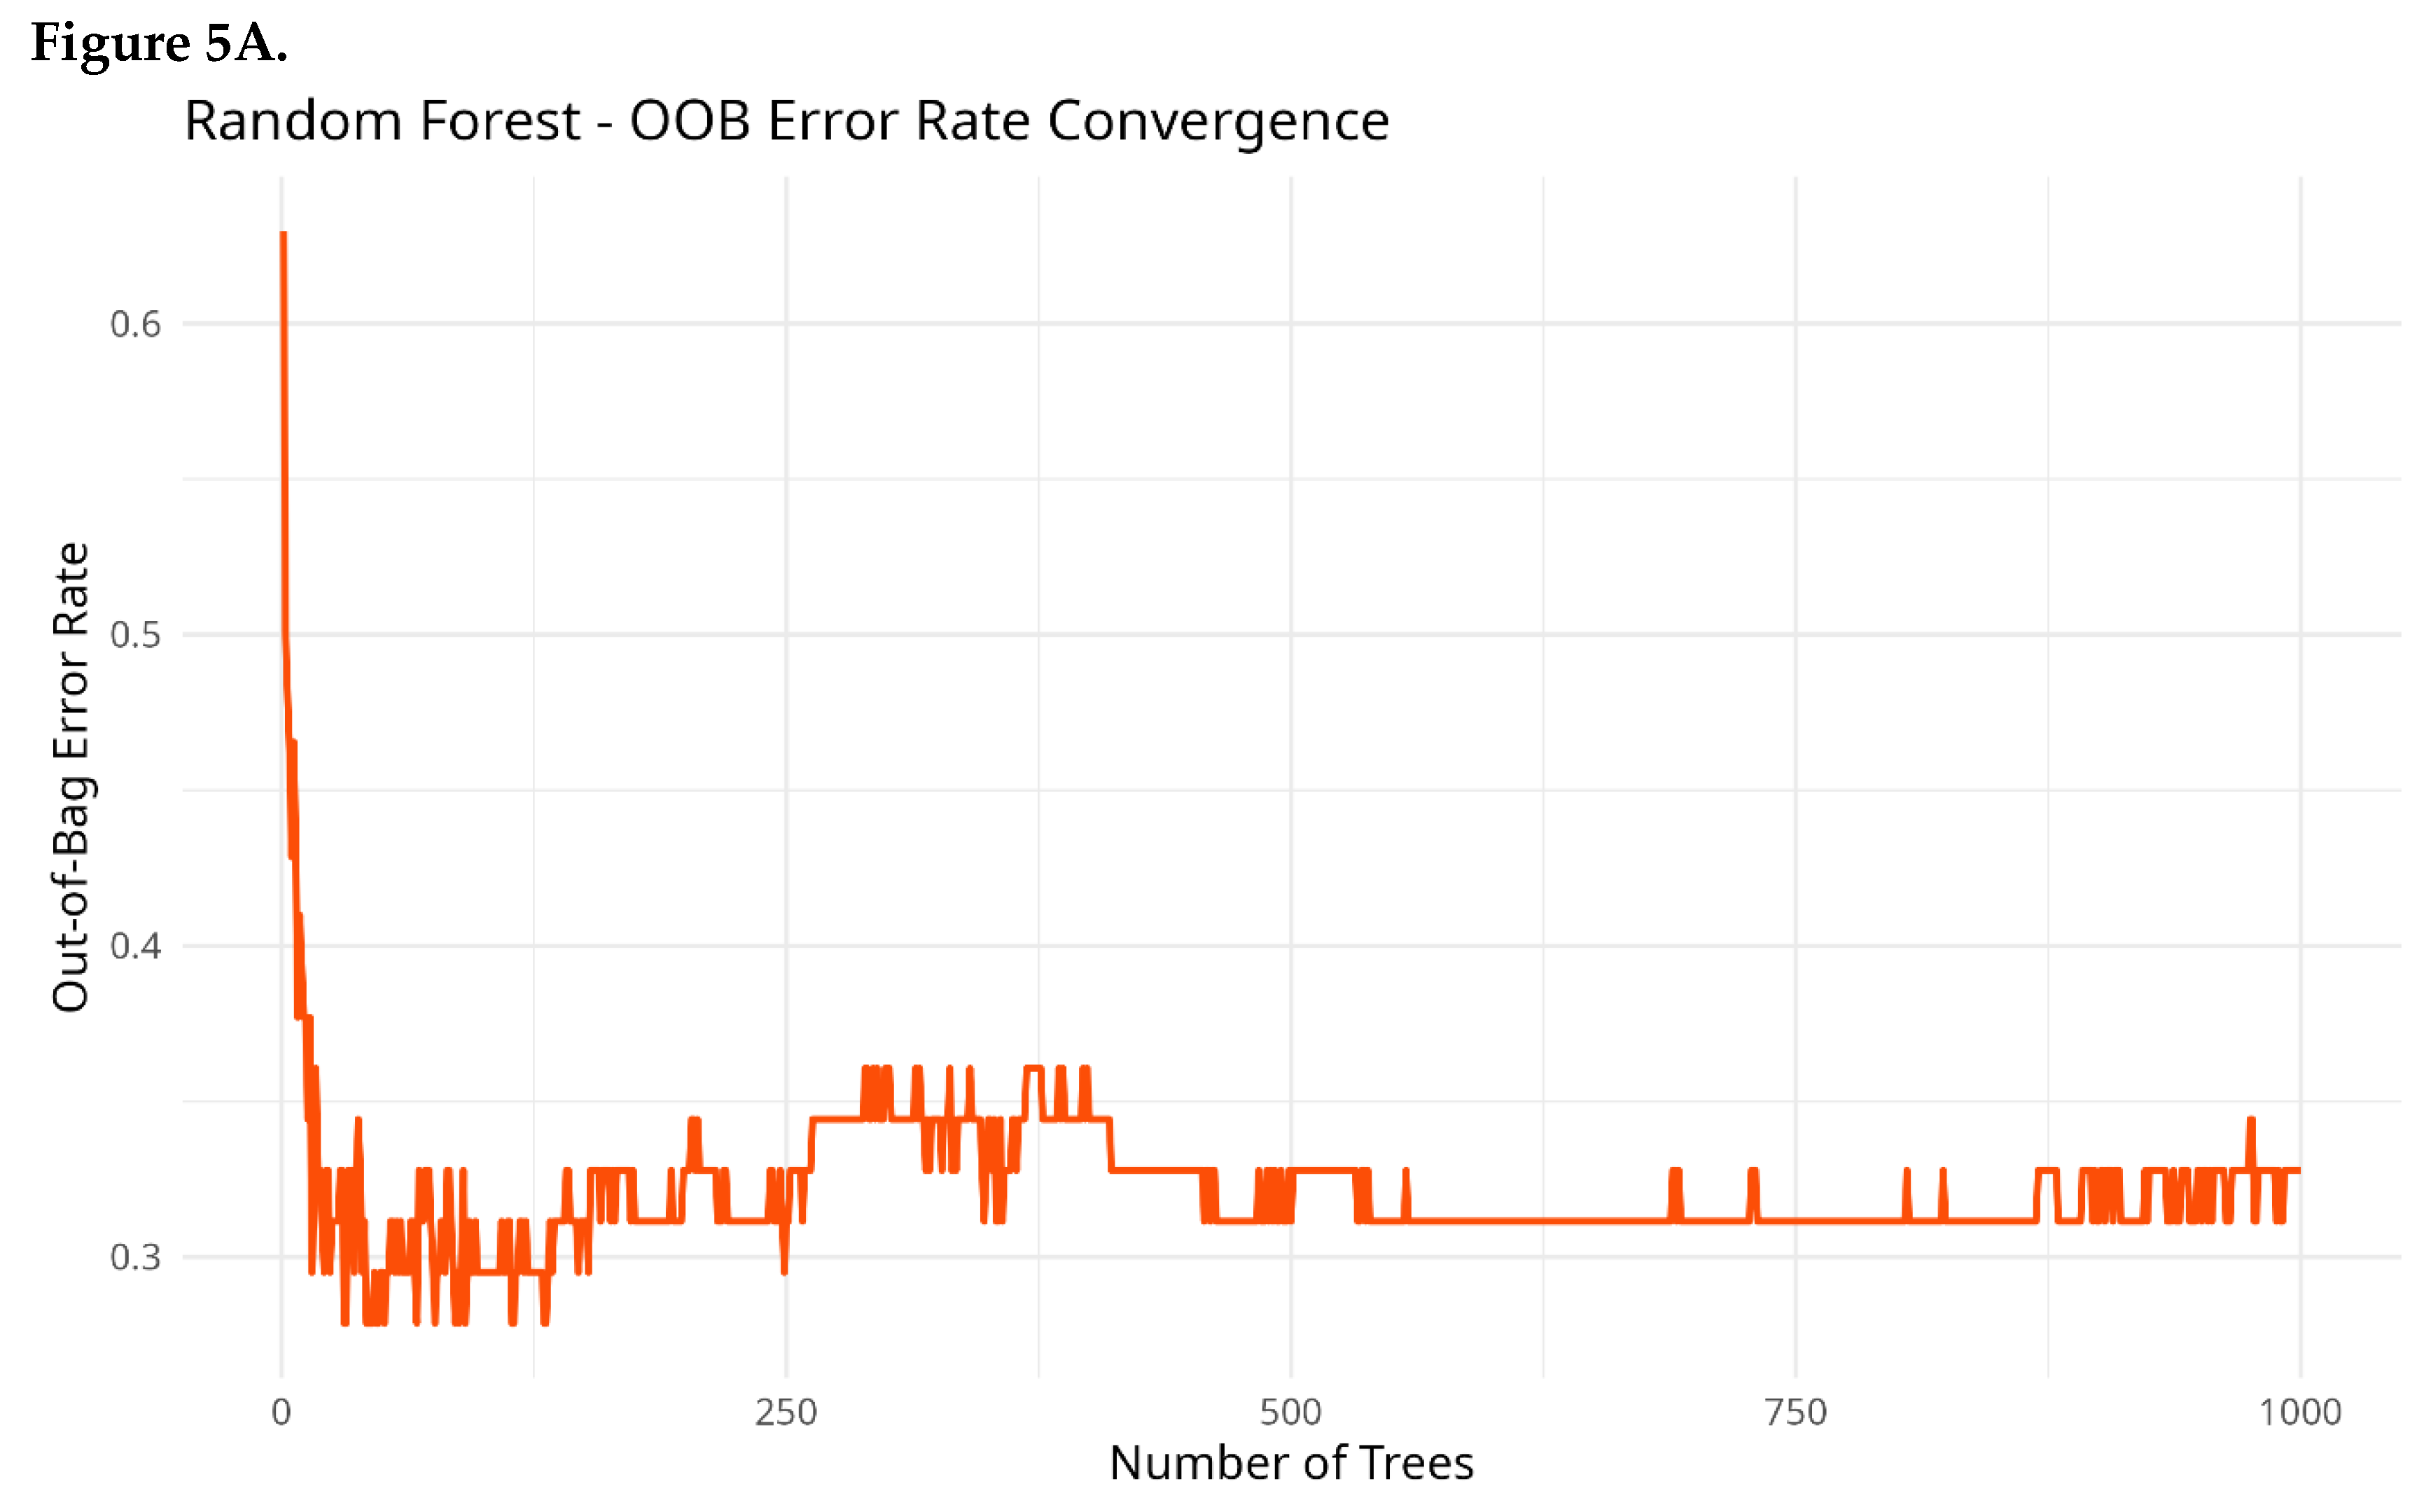
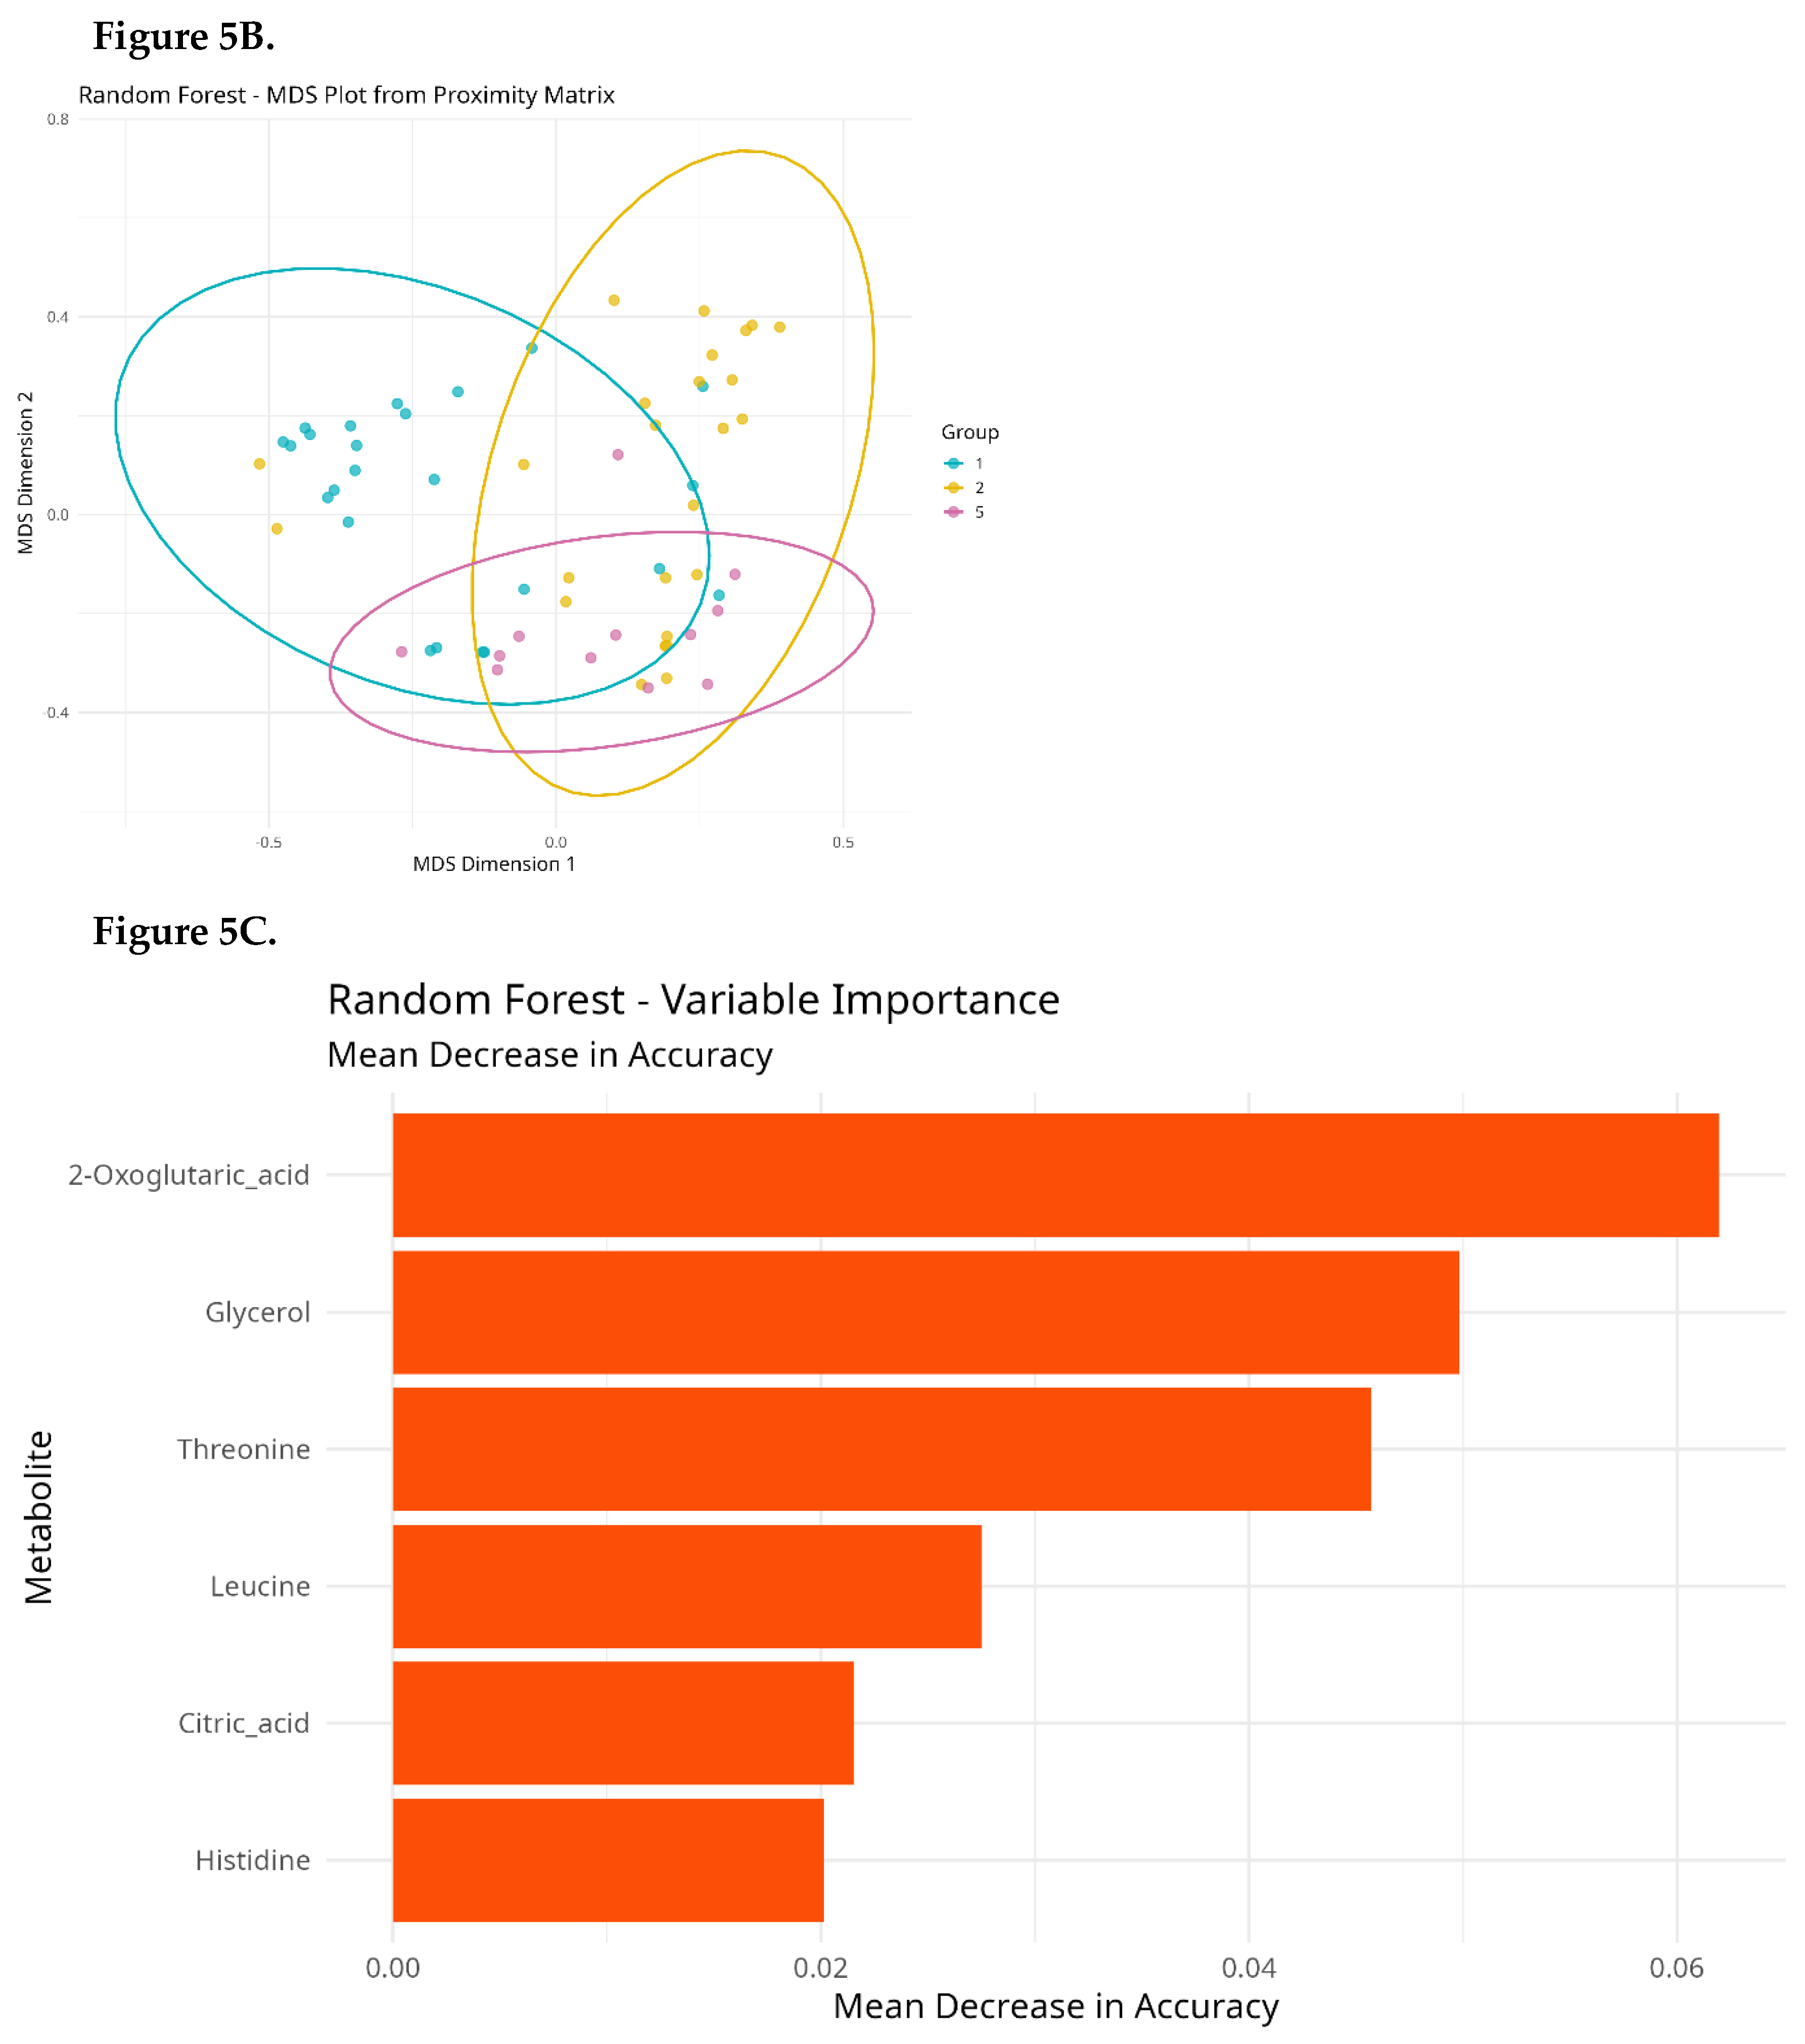
Random Forest Classification
Effect Size Analysis (Cliff’s Delta)
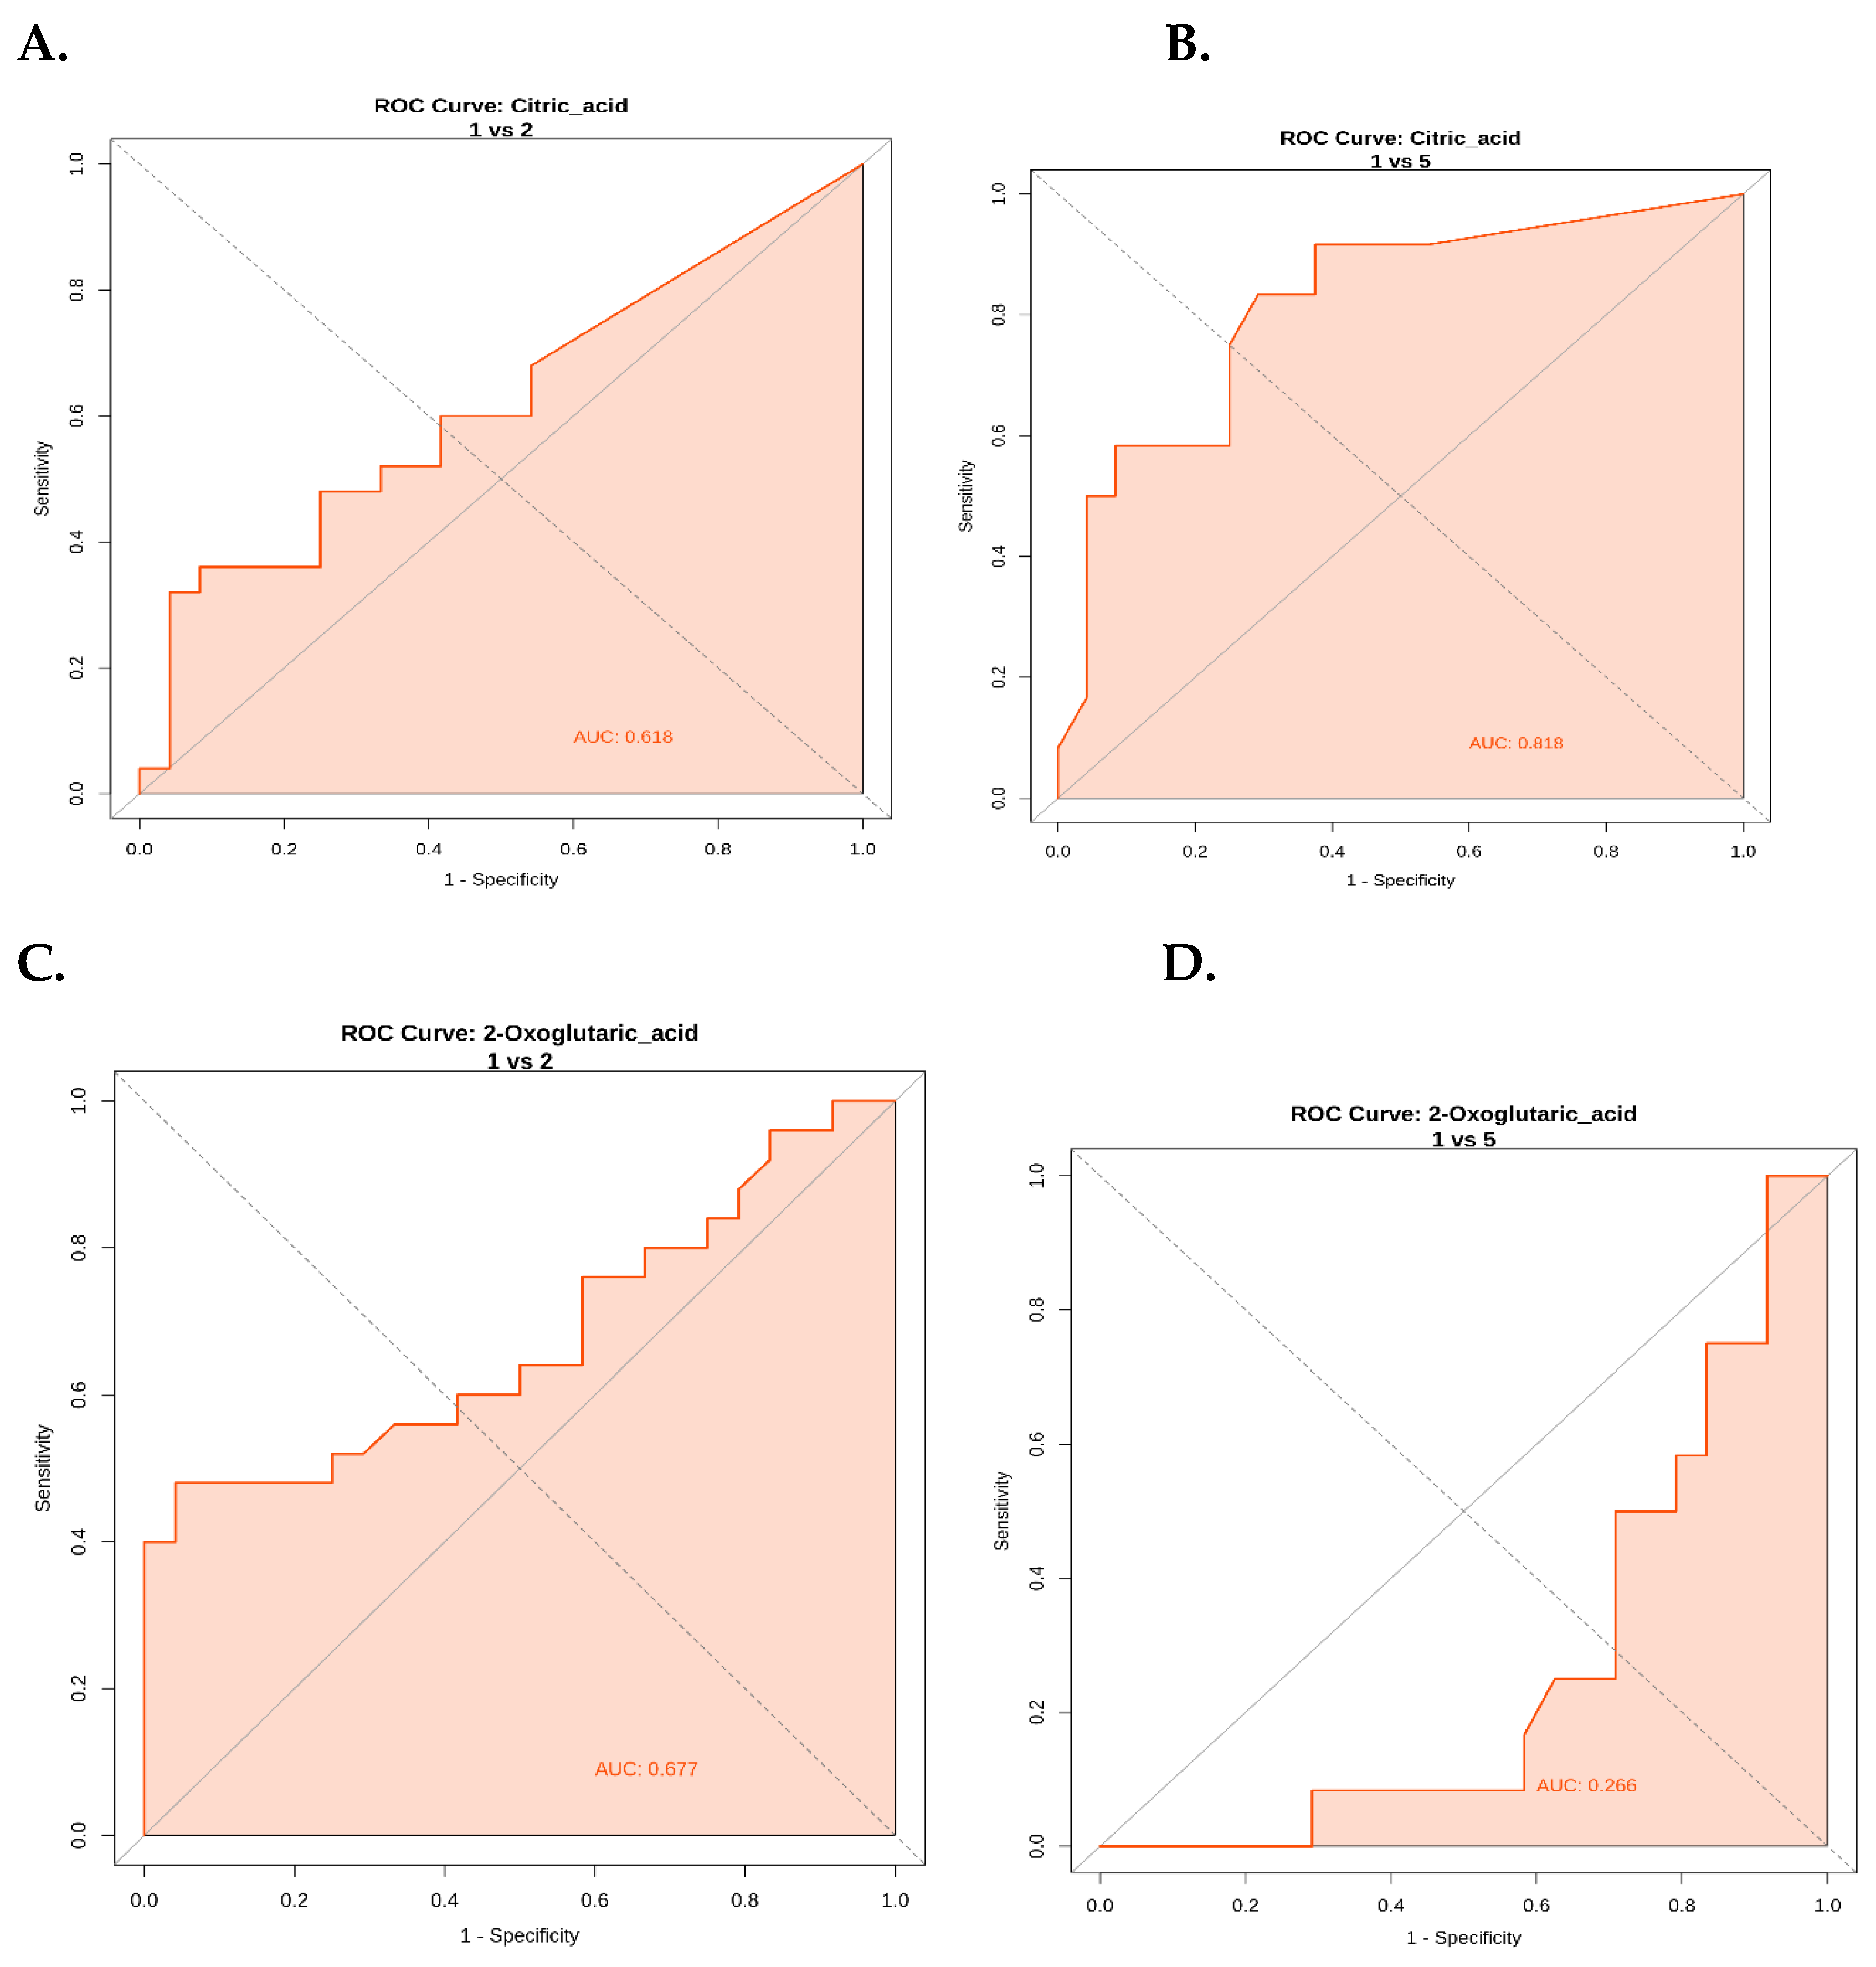
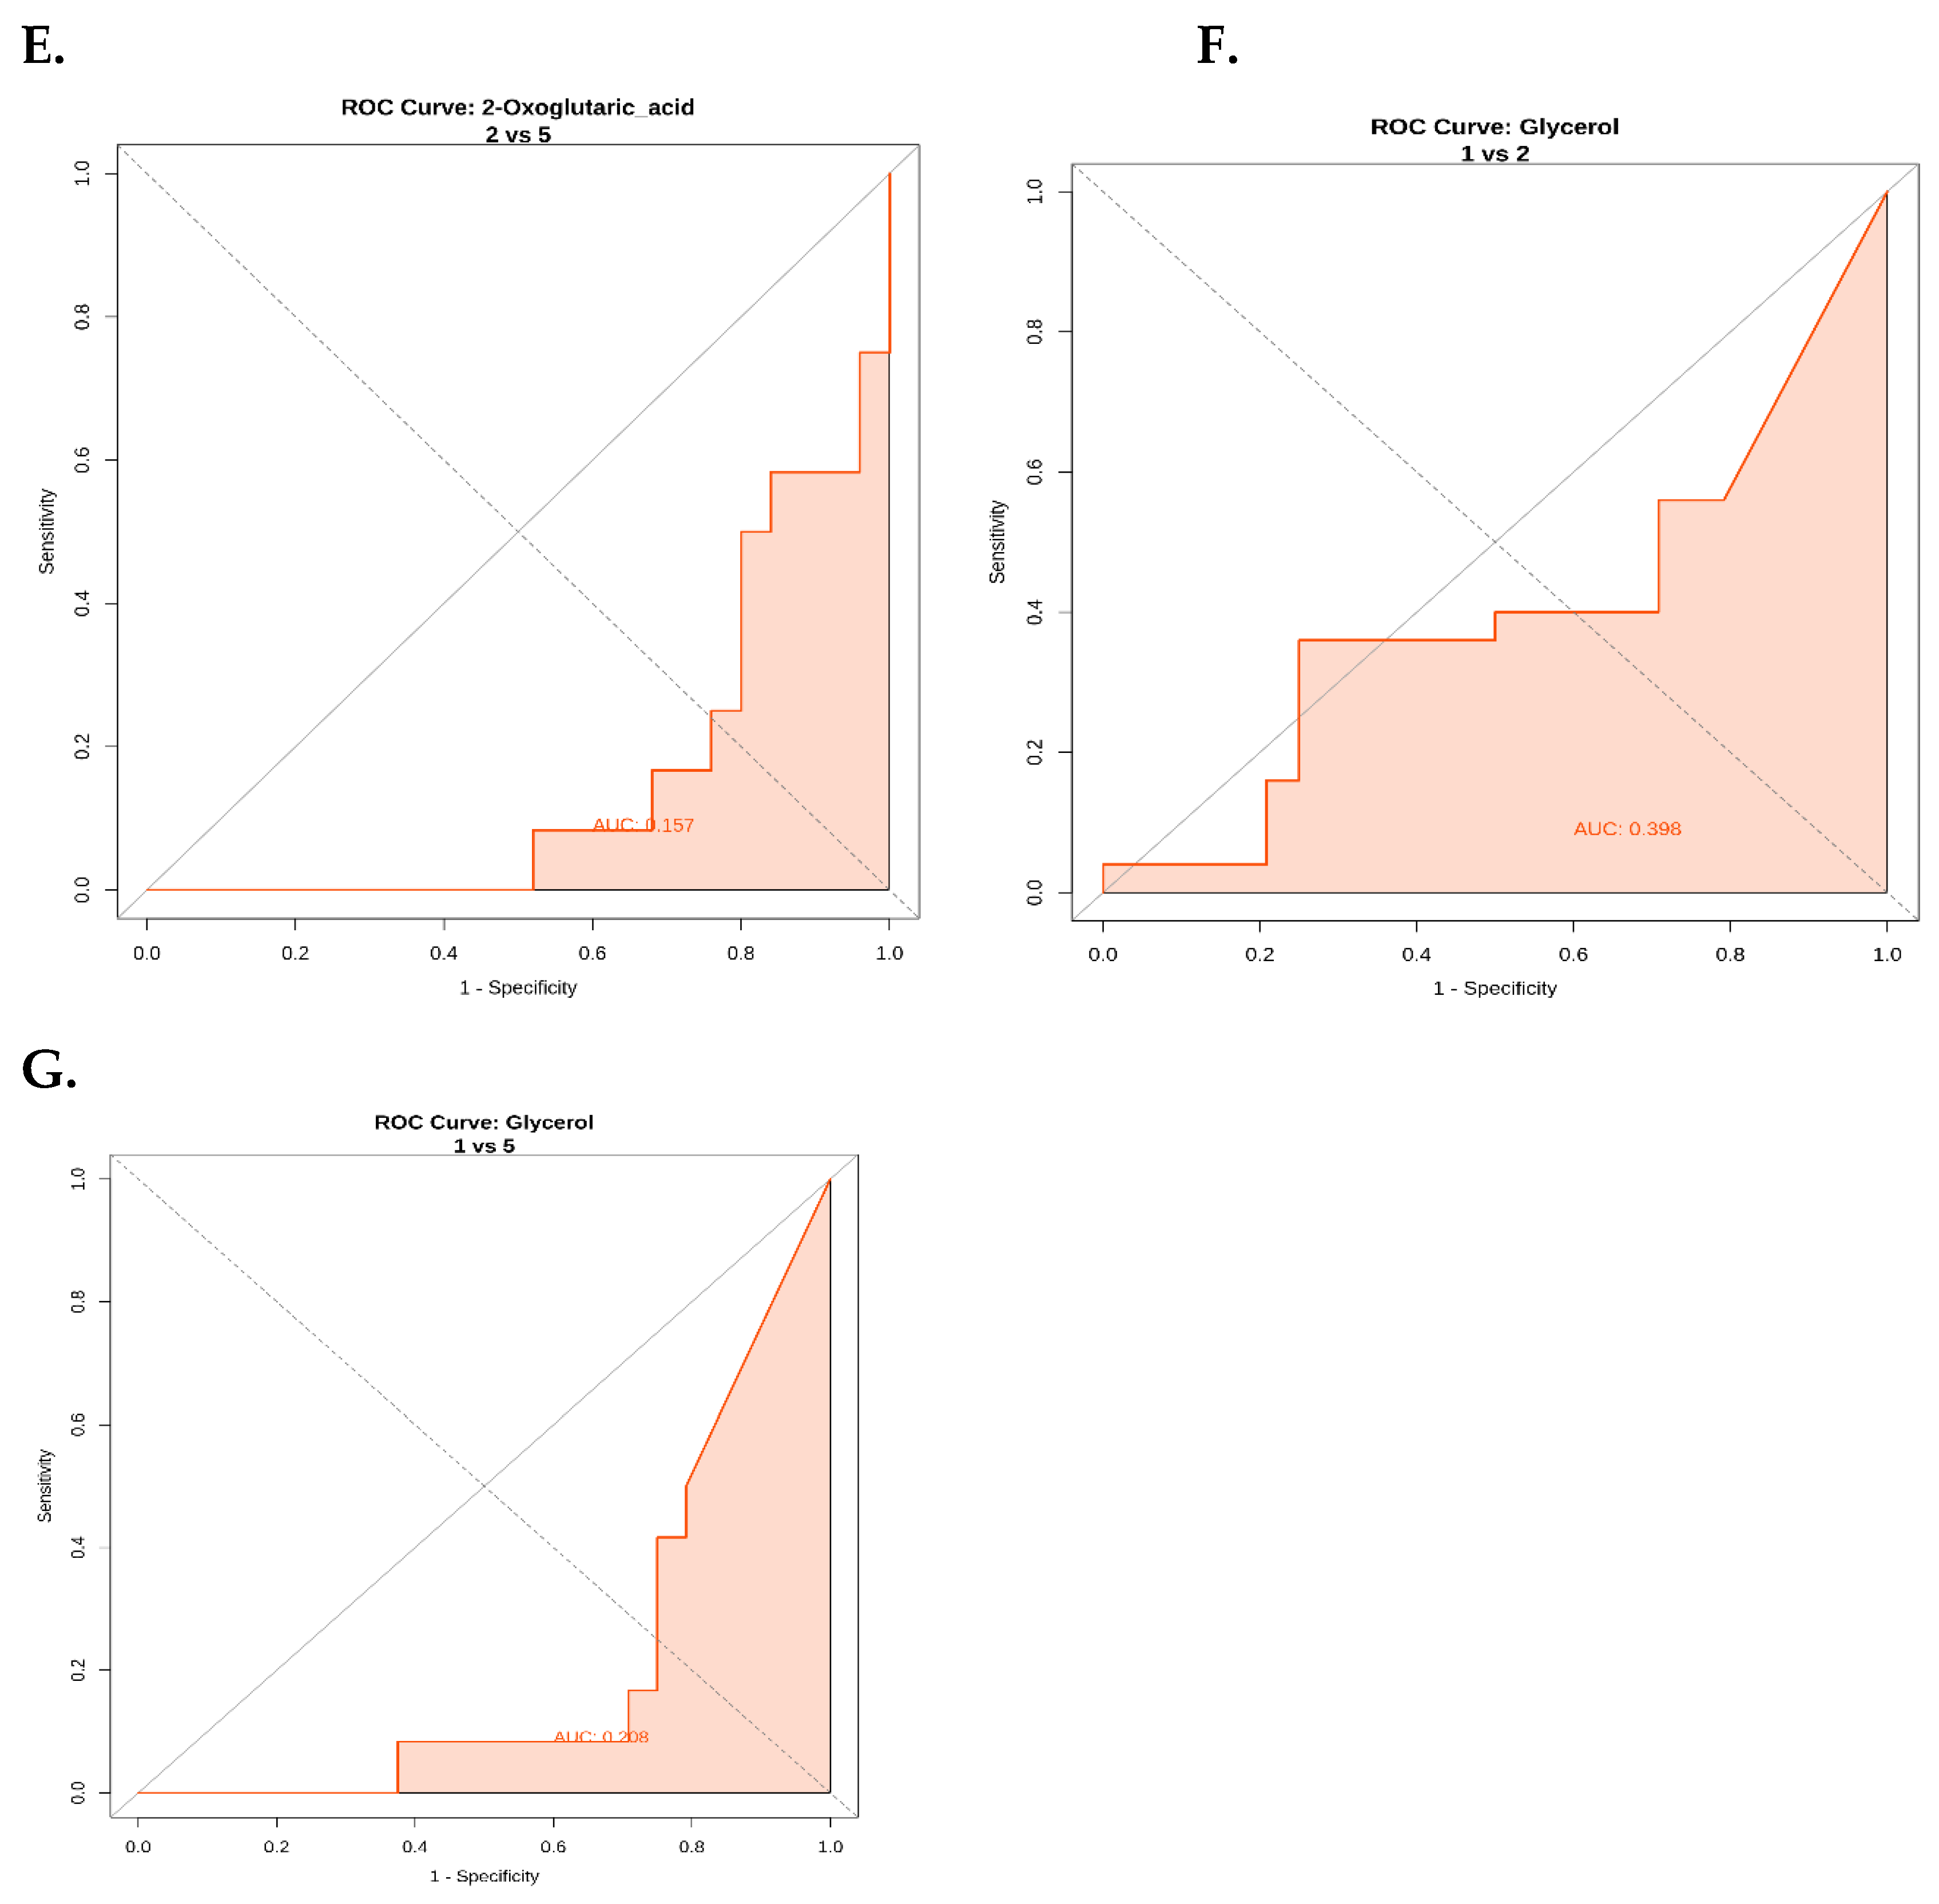
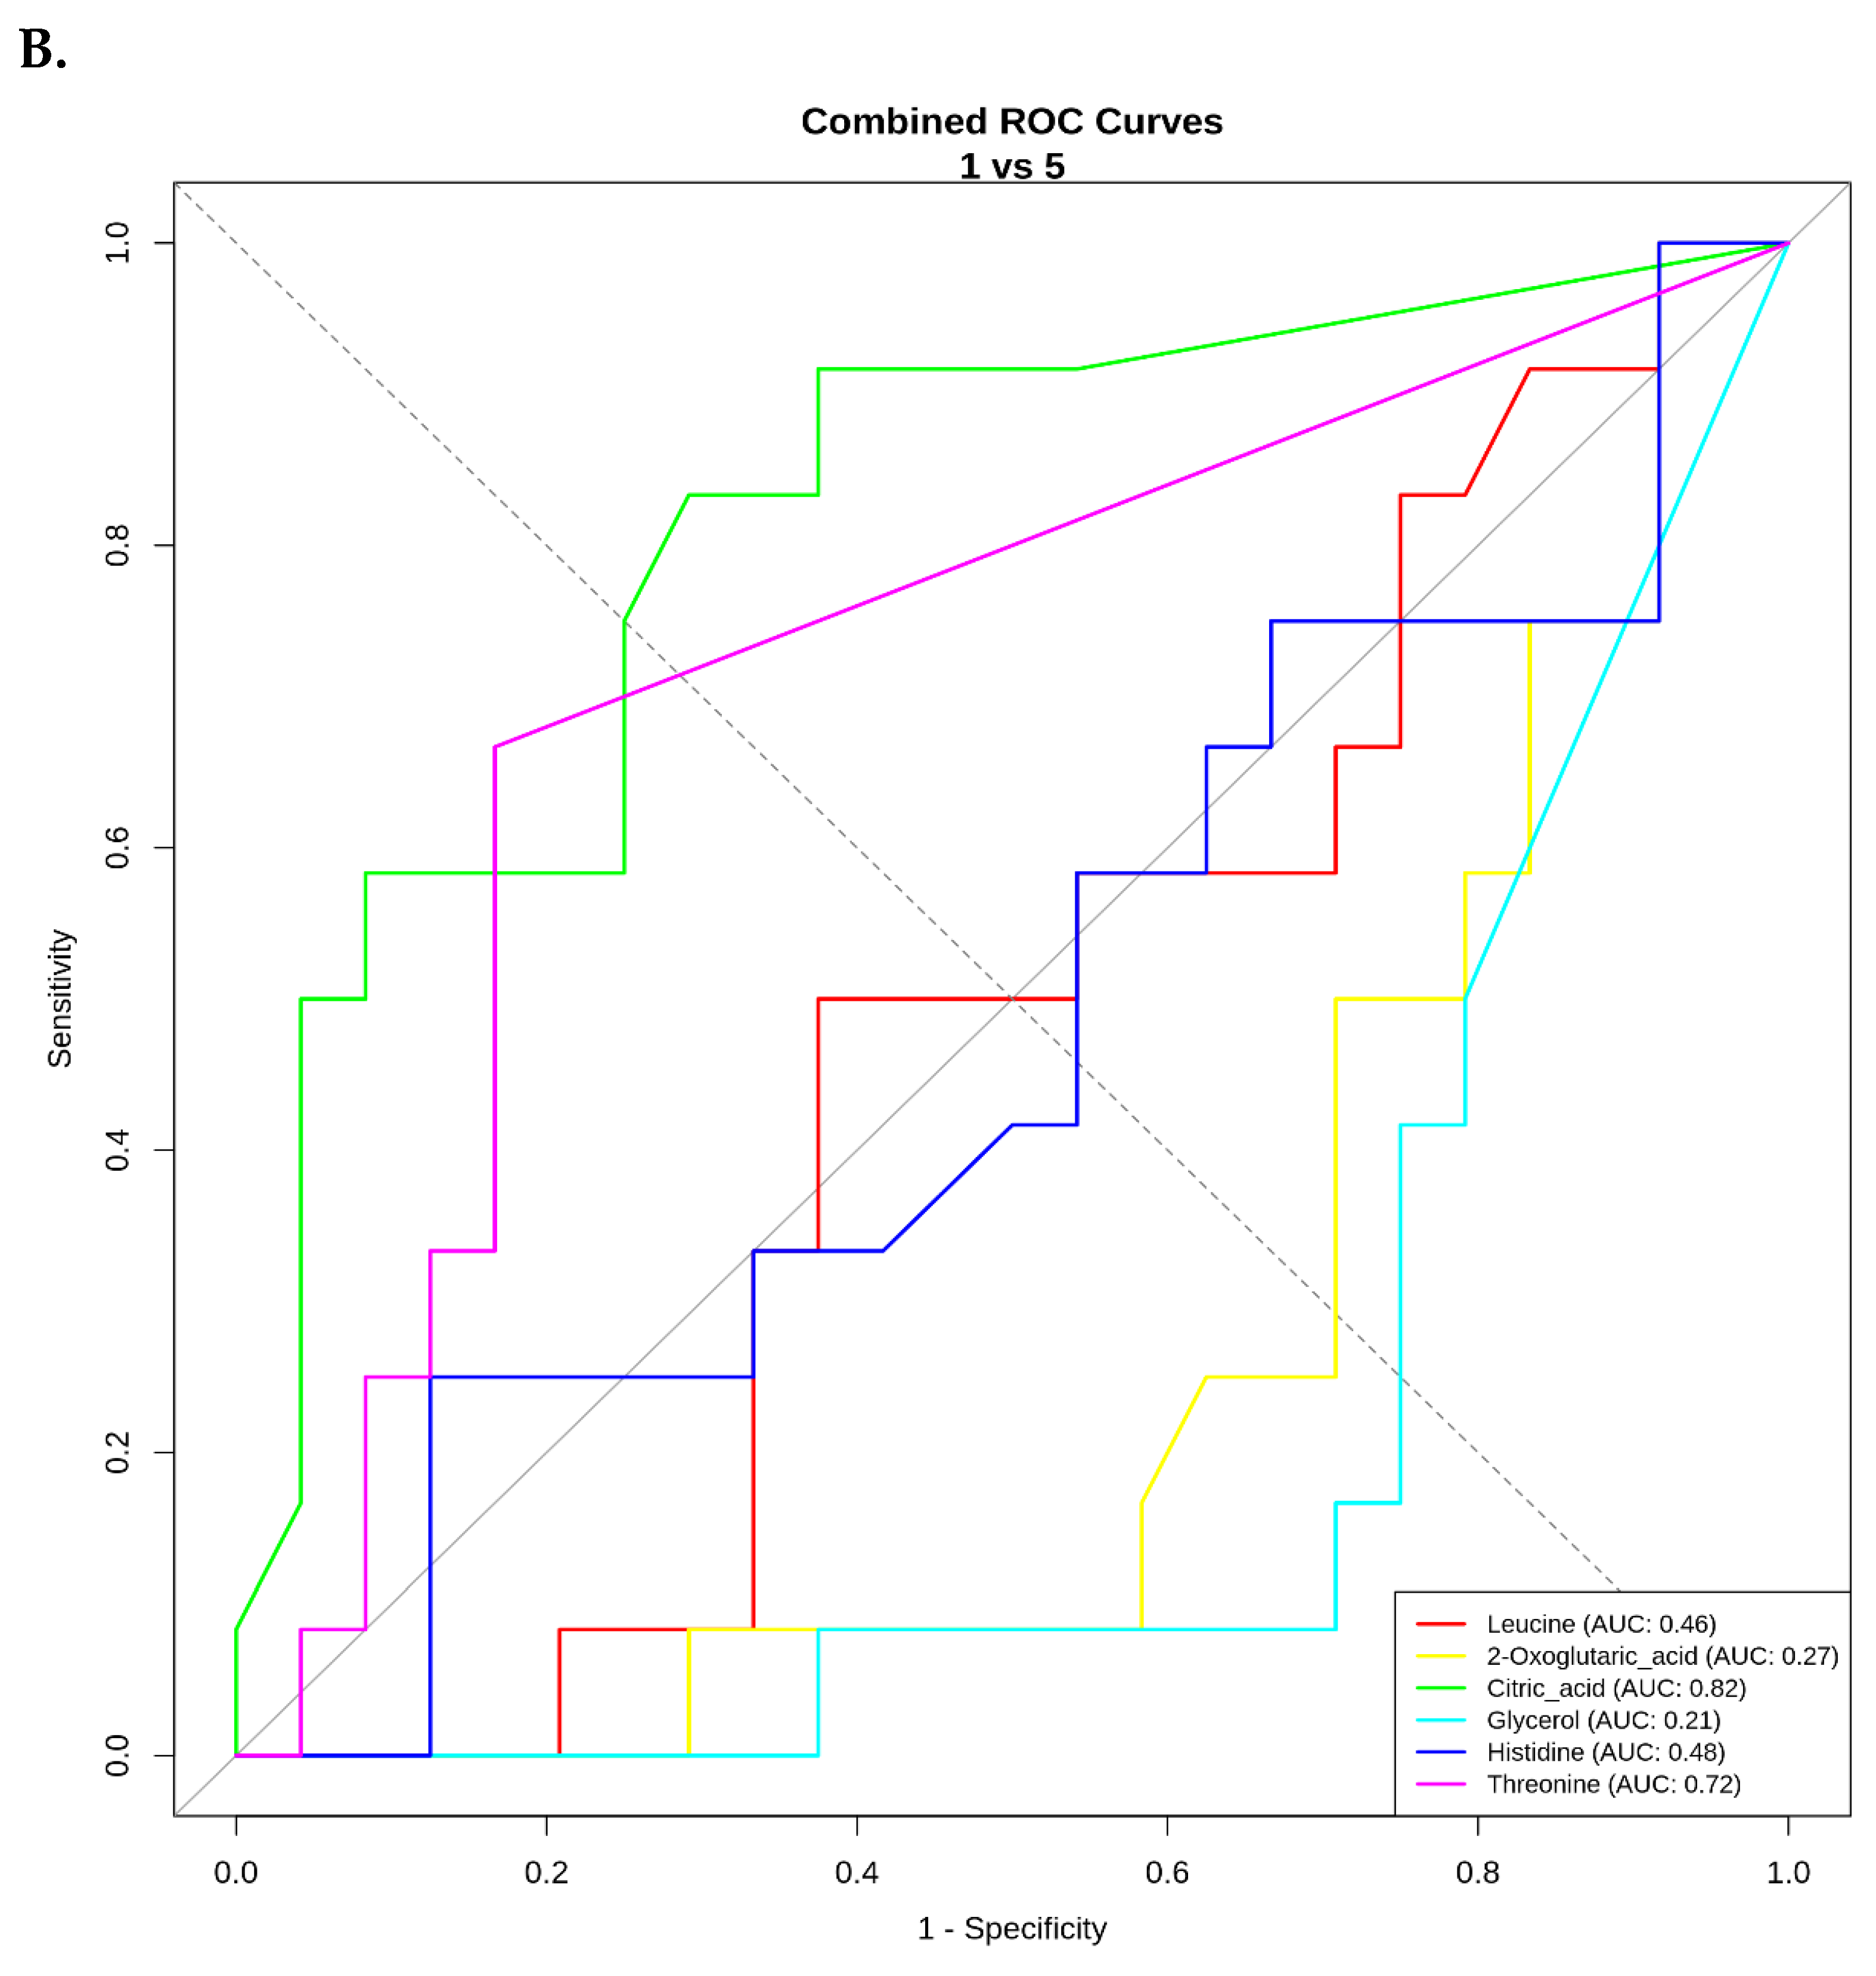
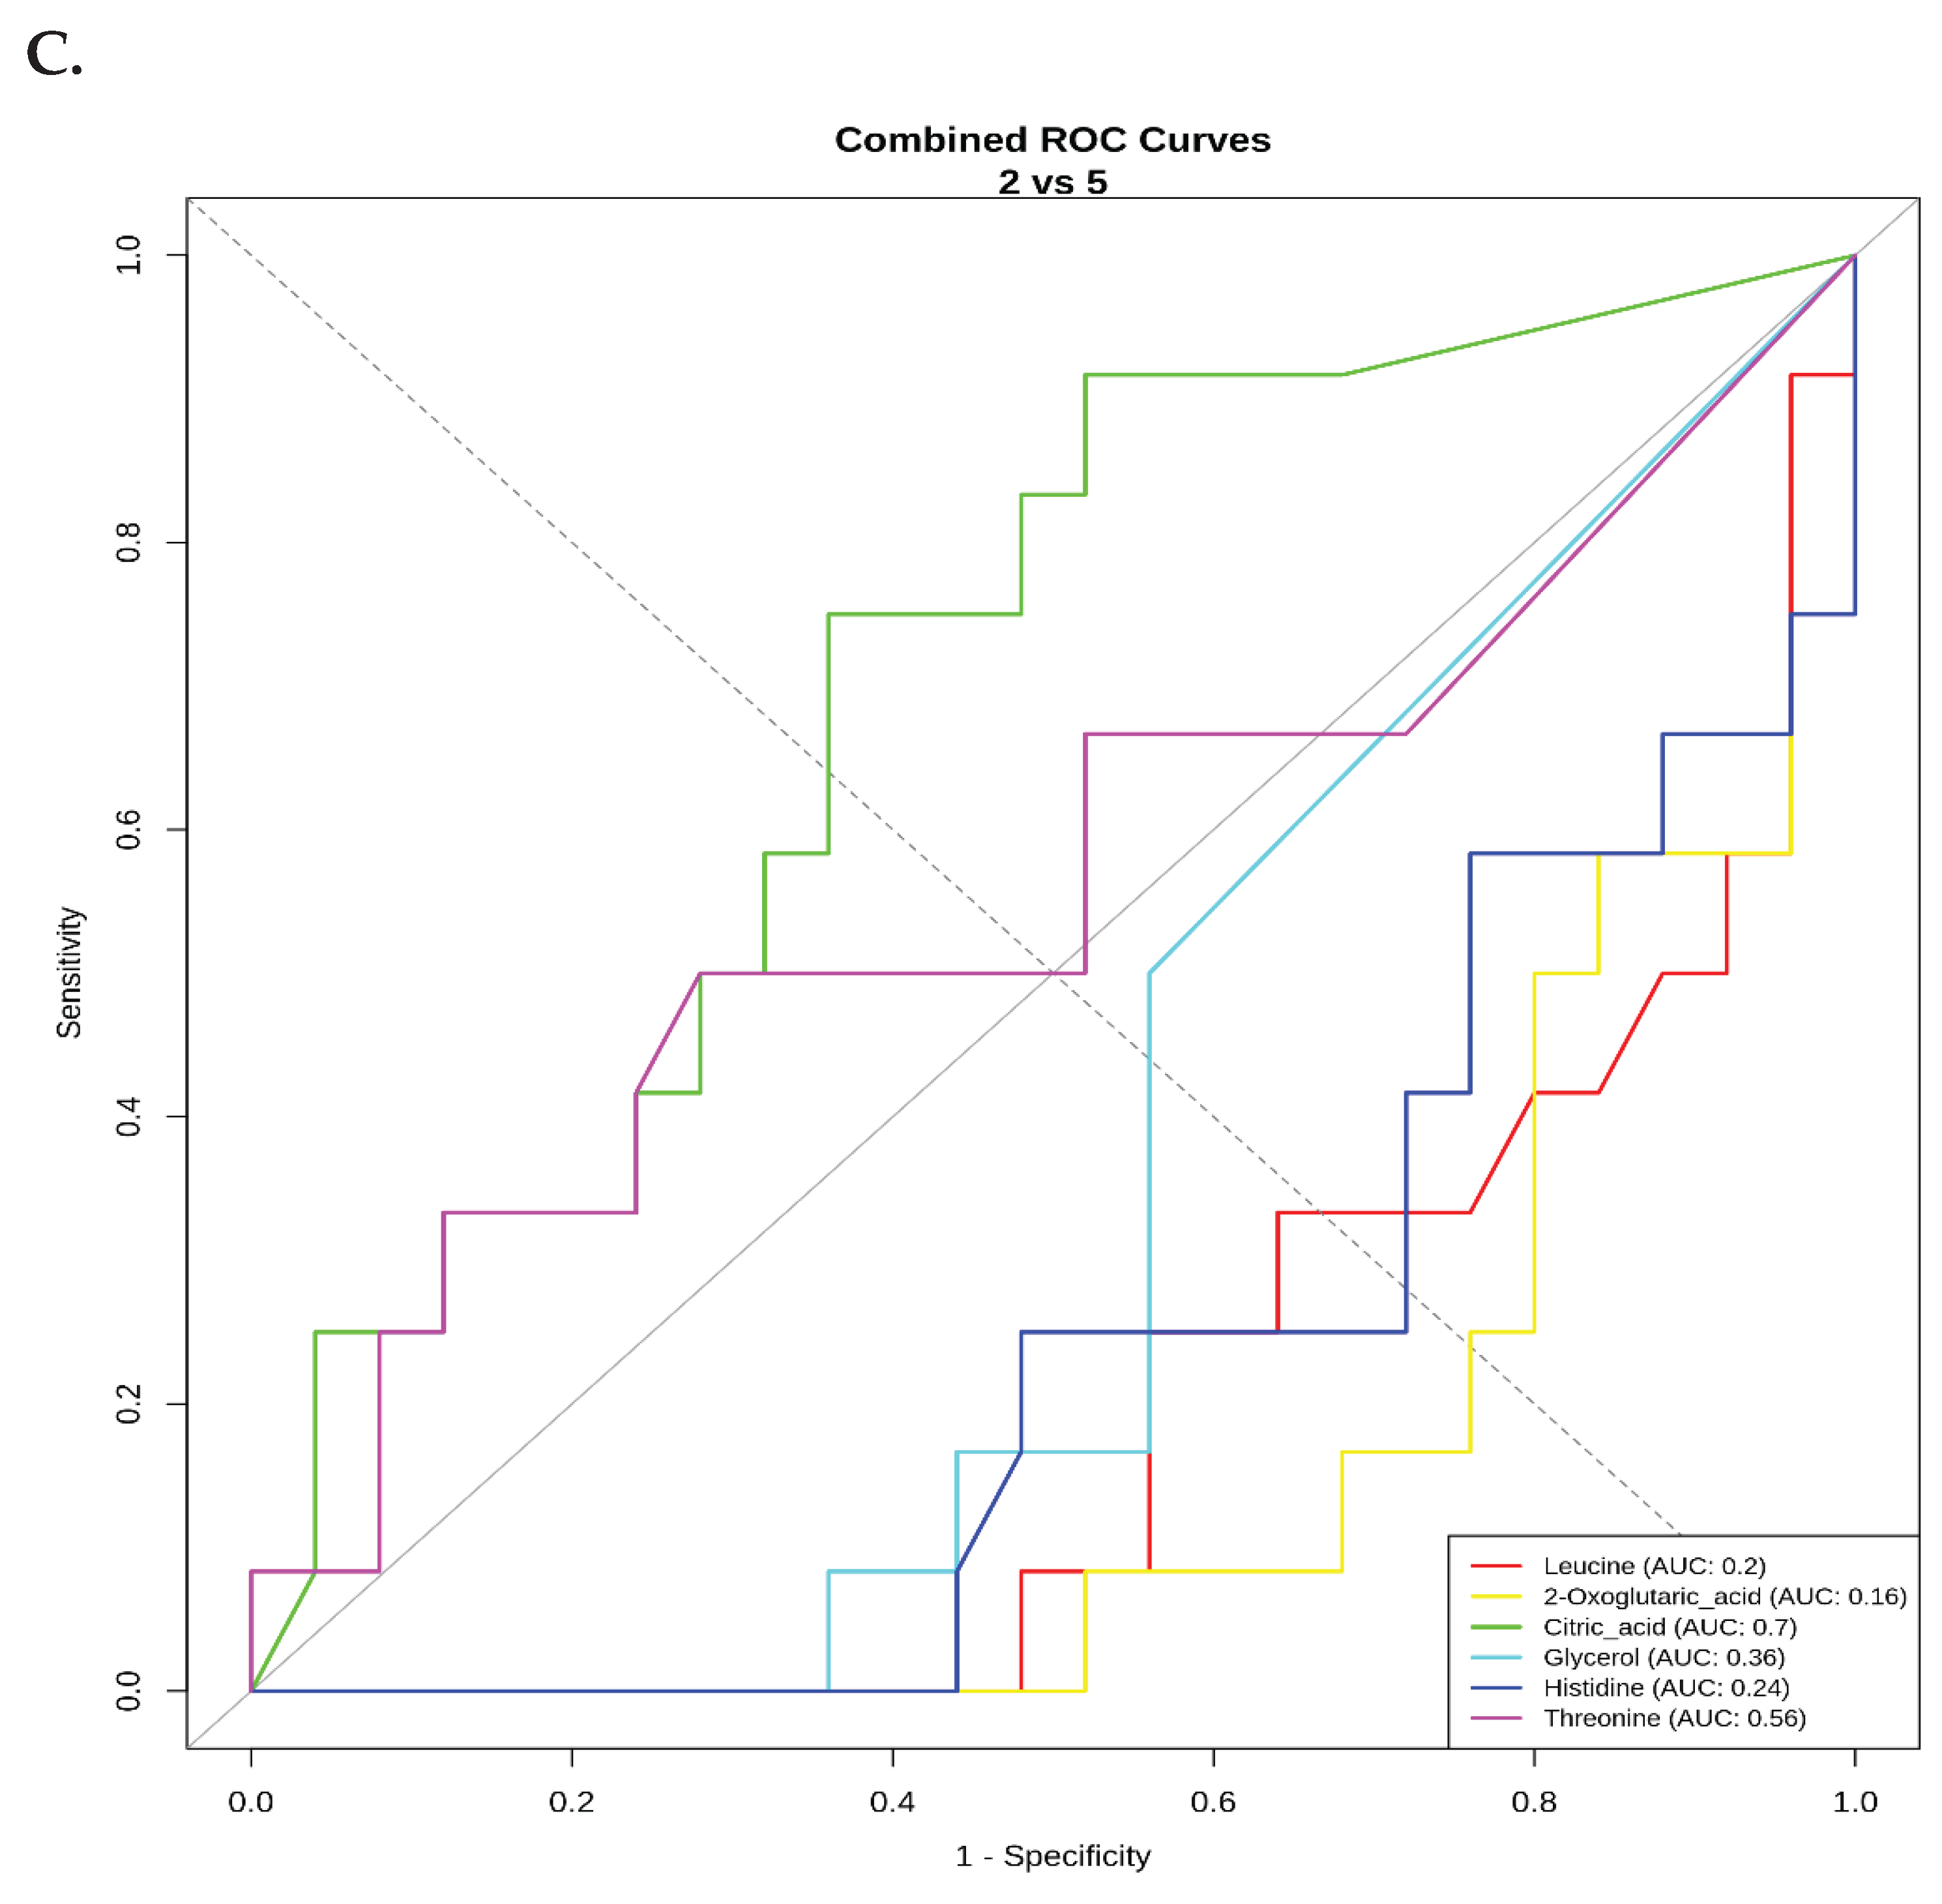
ROC Curve Analysis
Discussion
Conclusions
Acknowledgements
References
- Alwahsh, M.; Nimer, R.M.; Dahabiyeh, L.A.; Hamadneh, L.; Hasan, A.; Alejel, R.; Hergenröder, R. NMR-based metabolomics identification of potential serum biomarkers of disease progression in patients with multiple sclerosis. Sci. Rep. 2024, 14, 1–13. [Google Scholar] [CrossRef] [PubMed]
- Atallah, R.; Gindlhuber, J.; Heinemann, A. Succinate in innate immunity: linking metabolic reprogramming to immune modulation. Front. Immunol. 2025, 16, 1661948. [Google Scholar] [CrossRef] [PubMed]
- Carta, S.; Ferraro, D.; Ferrari, S.; Briani, C.; Mariotto, S. Oligoclonal bands: clinical utility and interpretation cues. Crit. Rev. Clin. Lab. Sci. 2022, 59, 391–404. [Google Scholar] [CrossRef] [PubMed]
- Dobson, R.; Ramagopalan, S.; Davis, A.; Giovannoni, G. Cerebrospinal fluid oligoclonal bands in multiple sclerosis and clinically isolated syndromes: a meta-analysis of prevalence, prognosis and effect of latitude. J. Neurol. Neurosurg. Psychiatry 2013, 84, 909–914. [Google Scholar] [CrossRef] [PubMed]
- ECTRIMS. Revisions to McDonald diagnostic criteria for multiple sclerosis published. 18 September 2025a. Available online: https://ectrims.eu/press/revisions-to-mcdonald-diagnostic-criteria-for-multiple-sclerosis-published/.
- ECTRIMS. 2024 McDonald Criteria — Slide deck. 6 October 2025b. Available online: https://ectrims.eu/app/uploads/2025/10/2024-McDonald-Criteria_Slide-Deck_06102025.pdf.
- Hanley, J.A.; McNeil, B.J. The meaning and use of the area under a receiver operating characteristic (ROC) curve. Radiology 1982, 143, 29–36. [Google Scholar] [CrossRef] [PubMed]
- Huang, H.; Li, G.; He, Y.; Chen, J.; Yan, J.; Zhang, Q.; Li, L.; Cai, X. Cellular succinate metabolism and signaling in inflammation: implications for therapeutic intervention. Front. Immunol. 2024, 15, 1404441. [Google Scholar] [CrossRef]
- Jin, H.; Lu, Q.; Gao, F.; Hao, H. Application of oligoclonal bands and other cerebrospinal fluid variables in multiple sclerosis and other neuroimmunological diseases: a narrative review. Ann. Transl. Med. 2023, 11, 282–282. [Google Scholar] [CrossRef] [PubMed]
- Montalban, X.; Lebrun-Frénay, C.; Oh, J.; Arrambide, G.; Moccia, M.; Amato, M.P.; Amezcua, L.; Banwell, B.; Bar-Or, A.; Barkhof, F.; et al. Diagnosis of multiple sclerosis: 2024 revisions of the McDonald criteria. Lancet Neurol. 2025, 24, 850–865. [Google Scholar] [CrossRef]
- Pilarska, E.; Kopyta, I.; Szurowska, E.; Radoń-Proskura, J.; Irga-Jaworska, N.; Kozera, G.; Sabiniewicz, R.; Emich-Widera, E.; Wojczal, J. Polish recommendations for diagnosis and therapy of paediatric stroke. Neurol. i Neurochir. Polska 2023, 57, 243–260. [Google Scholar] [CrossRef]
- Schwenkenbecher, P.; Pul, R.; Wurster, U.; et al. Oligoclonal bands in CNS disorders beyond multiple sclerosis: Clinical relevance and differential diagnostic potential. Frontiers in Immunology 2022, 13, 901945. [Google Scholar] [CrossRef]
- Smusz, J.; Mojsak, P.; Matys, P.; Mirończuk, A.; Tarasiuk, J.; Grubczak, K.; Starosz, A.; Kochanowicz, J.; Kułakowska, A.; Ruszczyńska, K.; et al. Metabolomics in Multiple Sclerosis: Advances, Challenges, and Clinical Perspectives—A Systematic Review. Int. J. Mol. Sci. 2025, 26, 9207. [Google Scholar] [CrossRef] [PubMed]
- Şengül, P.; Baykal, A.T.; Serteser, M. Serum Metabolomic Profiling in Possible Early-Stage Multiple Sclerosis: A Targeted 1H-NMR Comparison of OCB Type 1 and Type 2 Patterns. J. Mol. Neurosci. 2025, 75, 1–14. [Google Scholar] [CrossRef] [PubMed]
| Metabolite | Mean | SD | Median | IQR | Min–Max |
| 2-OG | 0.249 | 0.116 | 0.245 | 0.147 | 0.000–0.677 |
| Citric_acid | 0.091 | 0.079 | 0.076 | 0.121 | 0.000–0.282 |
| Glycerol | 0.462 | 0.424 | 0.424 | 0.583 | 0.000–2.095 |
| Histidine | 0.138 | 0.042 | 0.143 | 0.047 | 0.010–0.257 |
| Leucine | 0.169 | 0.060 | 0.161 | 0.078 | 0.000–0.403 |
| Threonine | 0.077 | 0.079 | 0.081 | 0.097 | 0.000–0.283 |
| metabolite | Group1 | Group2 | n1 | n2 | statistic | p | p.adj | p.adj.signif |
| 2-OG | 2 | 5 | 25 | 12 | 253.0 | 0.000882 | 0.009 | ** |
| Citric_acid | 1 | 5 | 24 | 12 | 52.5 | 0.002 | 0.019 | * |
| Glycerol | 1 | 5 | 24 | 12 | 228.0 | 0.004 | 0.045 | * |
| Histidine | 1 | 2 | 24 | 25 | 154.5 | 0.004 | 0.037 | * |
| Leucine | 1 | 2 | 24 | 25 | 141.0 | 0.002 | 0.015 | * |
| Leucine | 2 | 5 | 25 | 12 | 241.0 | 0.003 | 0.017 | * |
| Threonine | 1 | 2 | 24 | 25 | 163.5 | 0.003 | 0.029 | * |
Disclaimer/Publisher’s Note: The statements, opinions and data contained in all publications are solely those of the individual author(s) and contributor(s) and not of MDPI and/or the editor(s). MDPI and/or the editor(s) disclaim responsibility for any injury to people or property resulting from any ideas, methods, instructions or products referred to in the content. |
© 2025 by the authors. Licensee MDPI, Basel, Switzerland. This article is an open access article distributed under the terms and conditions of the Creative Commons Attribution (CC BY) license (https://creativecommons.org/licenses/by/4.0/).


