Preprint
Article

This version is not peer-reviewed.

Machine Learning–Based Prediction of Heart Disease Using Logistic Regression, Support Vector Machine, and Random Forest Classifier

Submitted:

24 November 2025

Posted:

25 November 2025

You are already at the latest version

Abstract

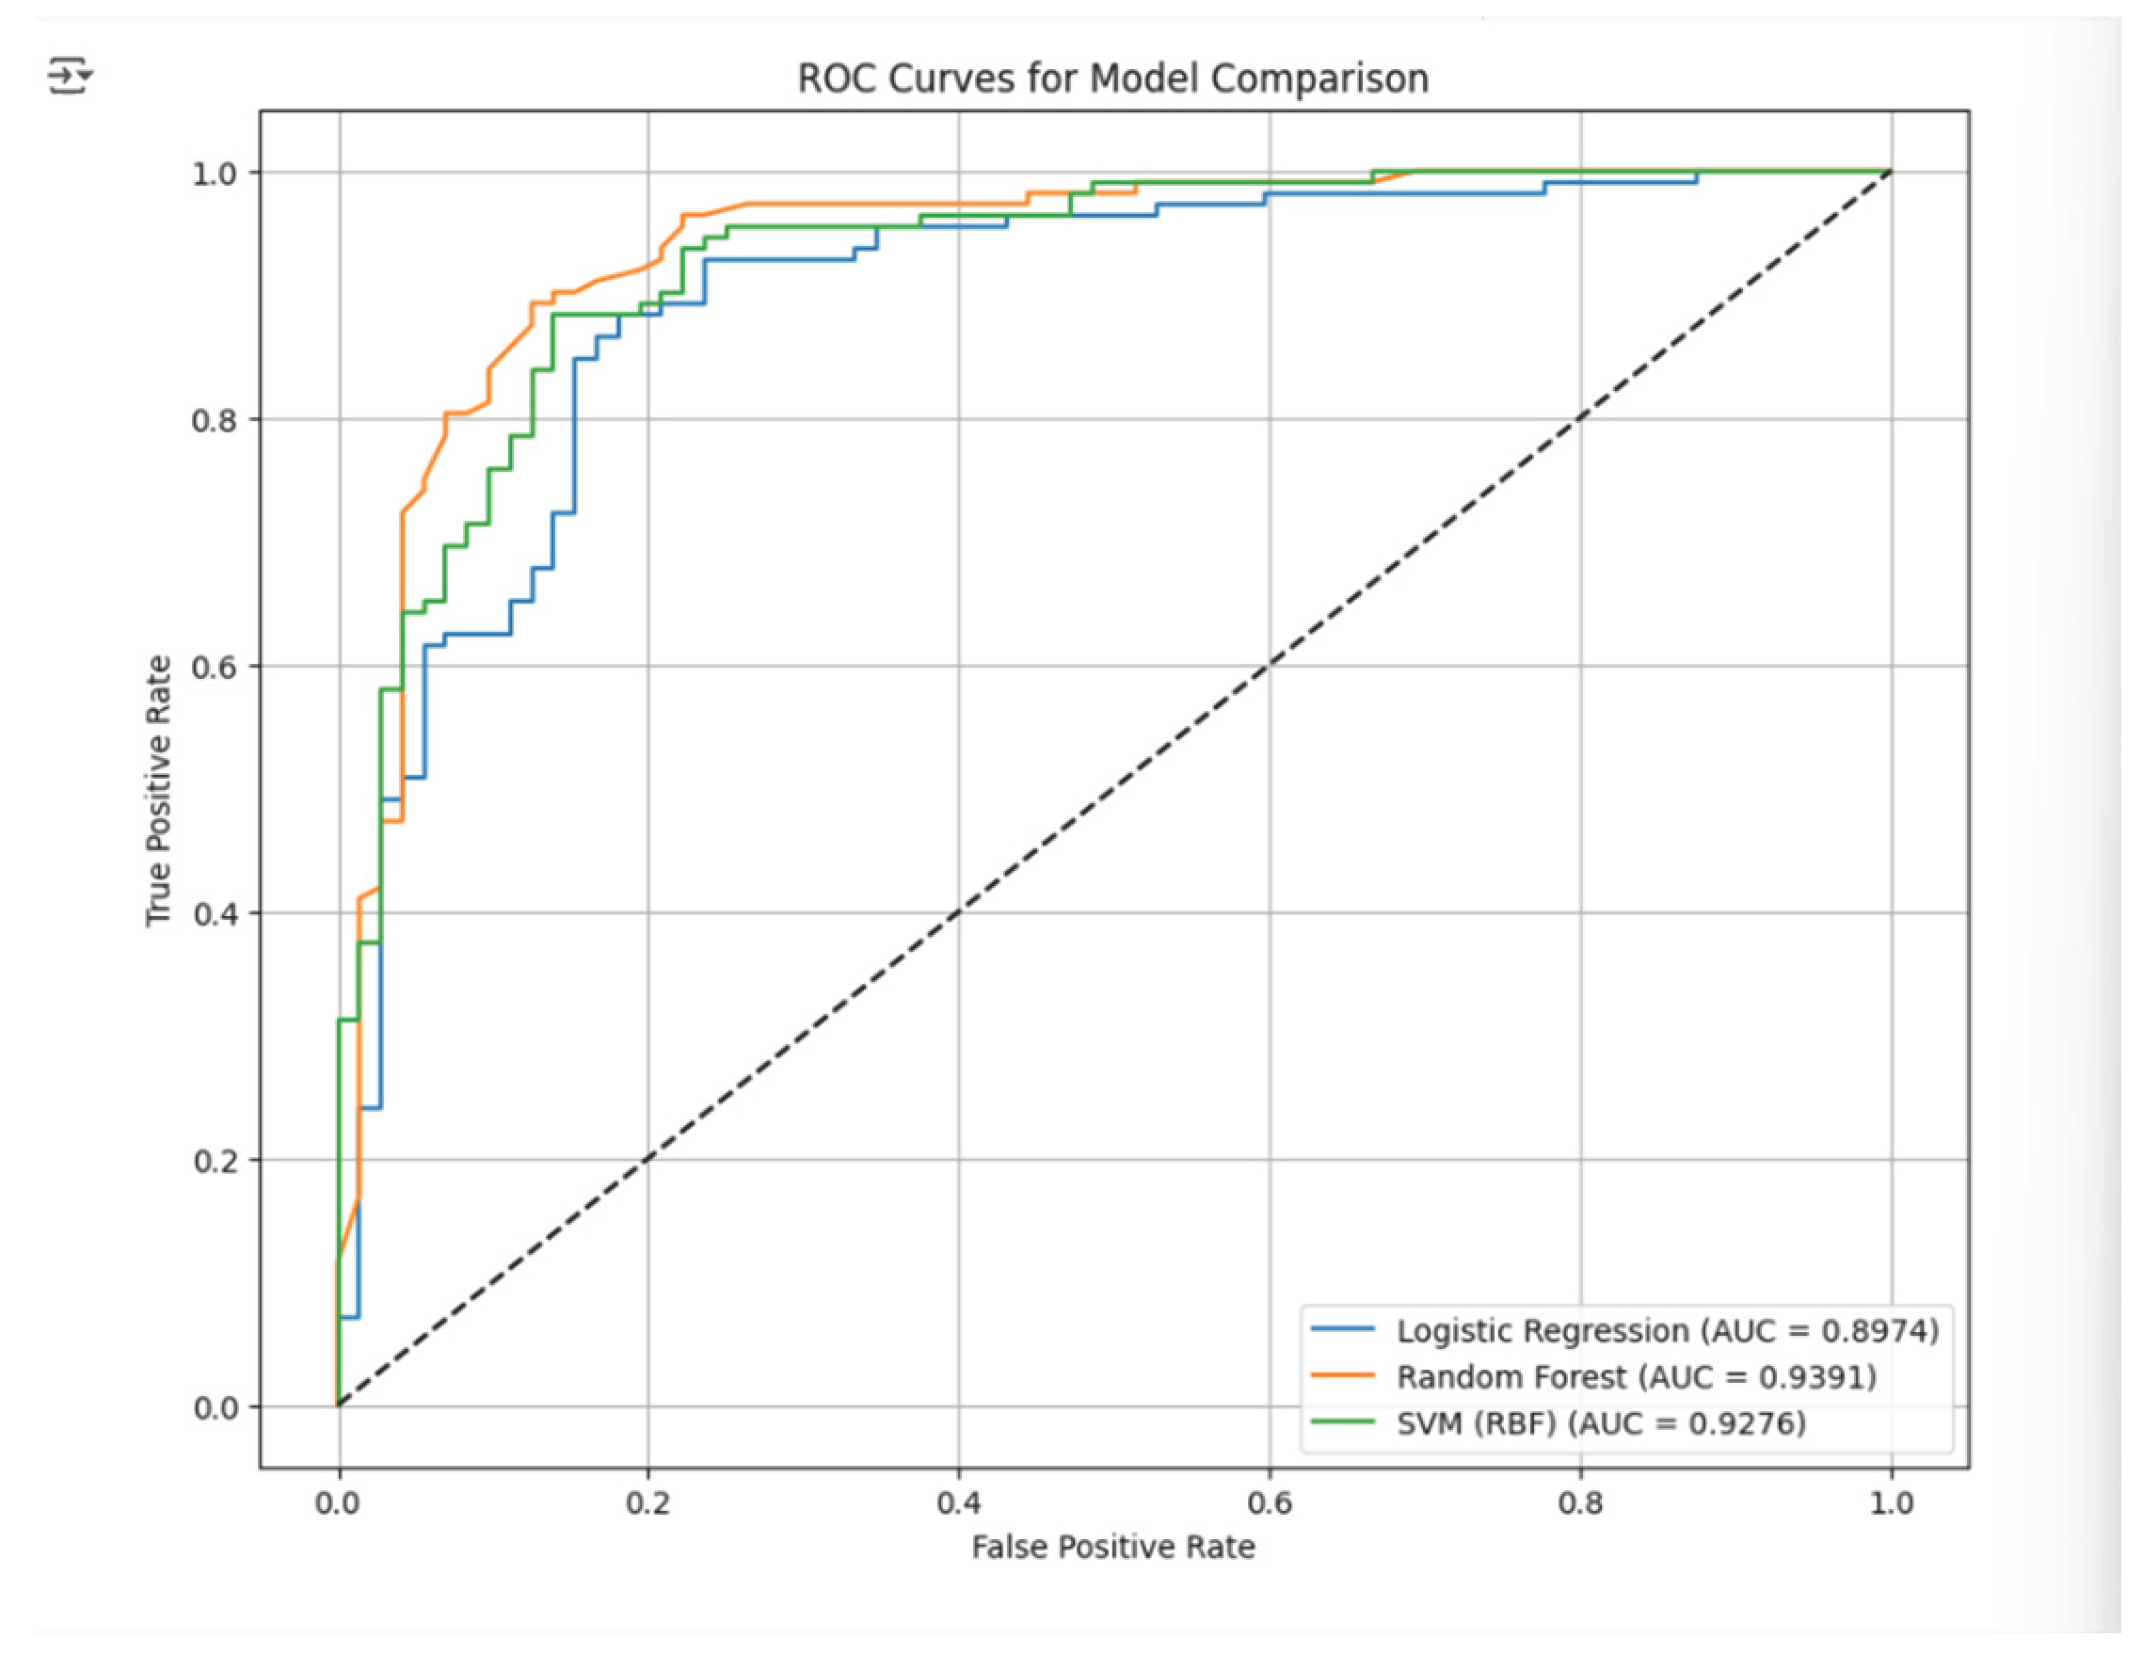
Heart disease is still at the top of the list of causes of deaths around the globe, which shows that there is a great need for early and accurate diagnostic methods that will aid clinical decision-making. A machine learning–based predictive system for heart disease will be developed and evaluated in this project using a real-world Heart Failure Prediction dataset that contains 918 anonymized patient records and 11 clinical attributes. As part of data preprocessing, medically impossible values were identified and treated, invalid cholesterol readings were replaced with the median, non-sensical entries were removed, categorical variables were encoded, and feature standardization was done to ready the dataset for model training. Accordingly, Logistic Regression, Support Vector Machine (SVM) with an RBF kernel, and Random Forest were three supervised learning algorithms implemented to evaluate their performances in binary classification. To guarantee data quality and model trustworthiness, Exploratory Data Analysis (EDA) and cross-validation were done. Model performance evaluation included the use of accuracy, precision, recall, F1-score, confusion matrices, and ROC–AUC metrics. The results indicate that the Random Forest classifier produced the best overall performance with an accuracy of 87.50%, precision of 91.59%, recall of 87.50%, F1-score of 89.50%, and an AUC of 0.9391, thus beating both SVM and Logistic Regression. Though Logistic Regression gave a comprehensible baseline, its greater false-negative rate made it less suitable for high-risk clinical applications. SVM displayed excellent non-linear classification power but needed more computational tuning. Taken together, these results show that Random Forest is the most dependable and robust model for heart disease prediction with this dataset. The next step should be incorporating wider lifestyle factors, using improved data collection methods, sophisticated outlier handling, additional machine learning models, and possibly deployment as a clinical decision-support tool through web or mobile applications.

Keywords: 
;  ;  ;  ;  ;  

1. Background of the Study

Cardiovascular disease, commonly referred to as heart disease, encompasses a range of conditions that affect the heart and blood vessels. It is one of the primary causes of mortality globally, contributing to a substantial number of deaths annually. According to Baxani and Edinburgh (2022), approximately 26 million individuals worldwide are affected by heart disease, with around 3.6 million new cases diagnosed each year.
The timely identification and prevention of heart diseases are essential strategies for mitigating their impact and enhancing patient outcomes. This initiative aims to develop a predictive model for diagnosing heart disease utilizing a machine learning algorithm applied to a real-world dataset. The database features anonymous clinical data where age, cholesterol, blood pressure, and ECG results are among the most common parameters that are usually considered for assessing the heart's health status. These factors are well-known medical risk factors associated with cardiovascular disease (Rimal et.al, 2025).
Figure 1 shows the heart disease prediction workflow diagram is displayed in Figure 1 above.
This initiative will employ a comparable and methodical approach to the detection of heart diseases, based on traditional machine learning principles. The approach includes the stages of preprocessing, feature selection, and supervised learning with cross-validation, all of which are illustrated in the process diagram. Through the training, validation, and eventual application of a classifier, a systematic and reliable prediction regarding the presence or absence of heart disease is assured, adhering to clinical modeling standards.

2. Introduction

Cardiovascular disease, or heart disease as it is often called, encompasses a diverse range of disorders that disrupt the normal operations of the heart and blood vessels. It is still a major contributor to global mortality and morbidity, impacting a large number of patients round the year, about 26 million people being the current worldwide count for those already diagnosed with it. Moreover, every year, another 3.6 million new cases are diagnosed too. Due to its extensive reach and the fact that it can lead to death, if not addressed, the early diagnosis and prompt treatment have become crucial areas in the management of heart disease to enhance patient outcomes and to mitigate any long-term complications (Misra et.al, 2023; Saeed et.al, 2023).
The recent breakthroughs in artificial intelligence and data-driven technologies have provided new ways of improving the clinical decision-making process. Among them, machine learning models are taking a front seat progressively to give the medical staff assistance in recognizing the disease, determining the risk level, and providing preventive healthcare. Data of different dimensions are included here such as the patient’s age, cholesterol levels, blood pressure, and electrocardiogram (ECG) results, and machine learning is expected to perform detection of early signs of heart disease more efficiently than the combination of conventional approaches extant and manual assessment alone. These algorithms will not only be able to spot the existing patterns wherein clinical data of this nature might be stored but also to provide quick, consistent, and easy-to-interpret predictions which will be a great help to the healthcare providers in their decision-making (Mythili et.al, 2013; Nasution et.al, 2025; Rani et.al, 2021).
This initiative is centered around the creation of a heart disease prediction model that incorporates machine learning methodologies. The intent of the project is to develop precise and trustable models that would be capable of detecting high-risk persons for heart diseases by the utilization of supervised learning algorithms on a genuine Heart Failure Prediction dataset. The process consists of data preprocessing, feature encoding, scaling, model training, and assessment in a structured manner coupled with standard clinical prediction practices.

Rationale

The objective of the project is to utilize the readily accessible clinical data to facilitate an early and accurate prediction of heart disease. Heart disease continues to be a significant healthcare challenge globally, and early detection has the potential to save countless lives while delaying the onset of the disease in patients for an extended period. Furthermore, traditional diagnostic methods frequently rely on the interpretation of the patient's physician, who may overlook the intricate, non-linear patterns present within the clinical variables (Khan et al., 2023; Khanna et al., 2015).
On the other hand, machine learning can be considered as a powerful alternative since it can automatically detect and predict patterns based on very large datasets. Thus, the heart failure prediction dataset gives the demanded opportunity to build such models since it is made up of different and diverse clinical attributes including where people come from, bio-metric data, and ECG-related data. Unfortunately, the dataset has also presented huge challenges with medically impossible values and a mix of both categorical and numerical data which need to be cleaned before the model can be developed. By solving these issues, the dataset will be both medically meaningful and suitable to be processed by machine learning algorithms (Munmun et.al, 2025;Vijayashree and Sultana, 2018).
The picking of logistic regression, random forest, and support vector machine (SVM) is a very deliberate thing to do, as it will allow one to make a comparison between linear, ensemble and nonlinear methods. Each of the models has its own strength: Logistic Regression is good at explaining the results, Random Forest is good at being accurate and making no errors, while SVM is effective in dealing with very sophisticated data relationships. Therefore, the models’ evaluation will point out the best algorithm to use for heart disease prediction and that will certainly be improving the clinical decision-support systems (Dinesh et.al, 2024). The initiative is to bring about the gradual merging of artificial intelligence with health care by creating a predictive model based on actual clinical data. The future plan is to create a tool that is not only scalable but also easy to use and that will help doctors, improve the accuracy of diagnoses, and encourage preventive measures in the case of heart diseases.

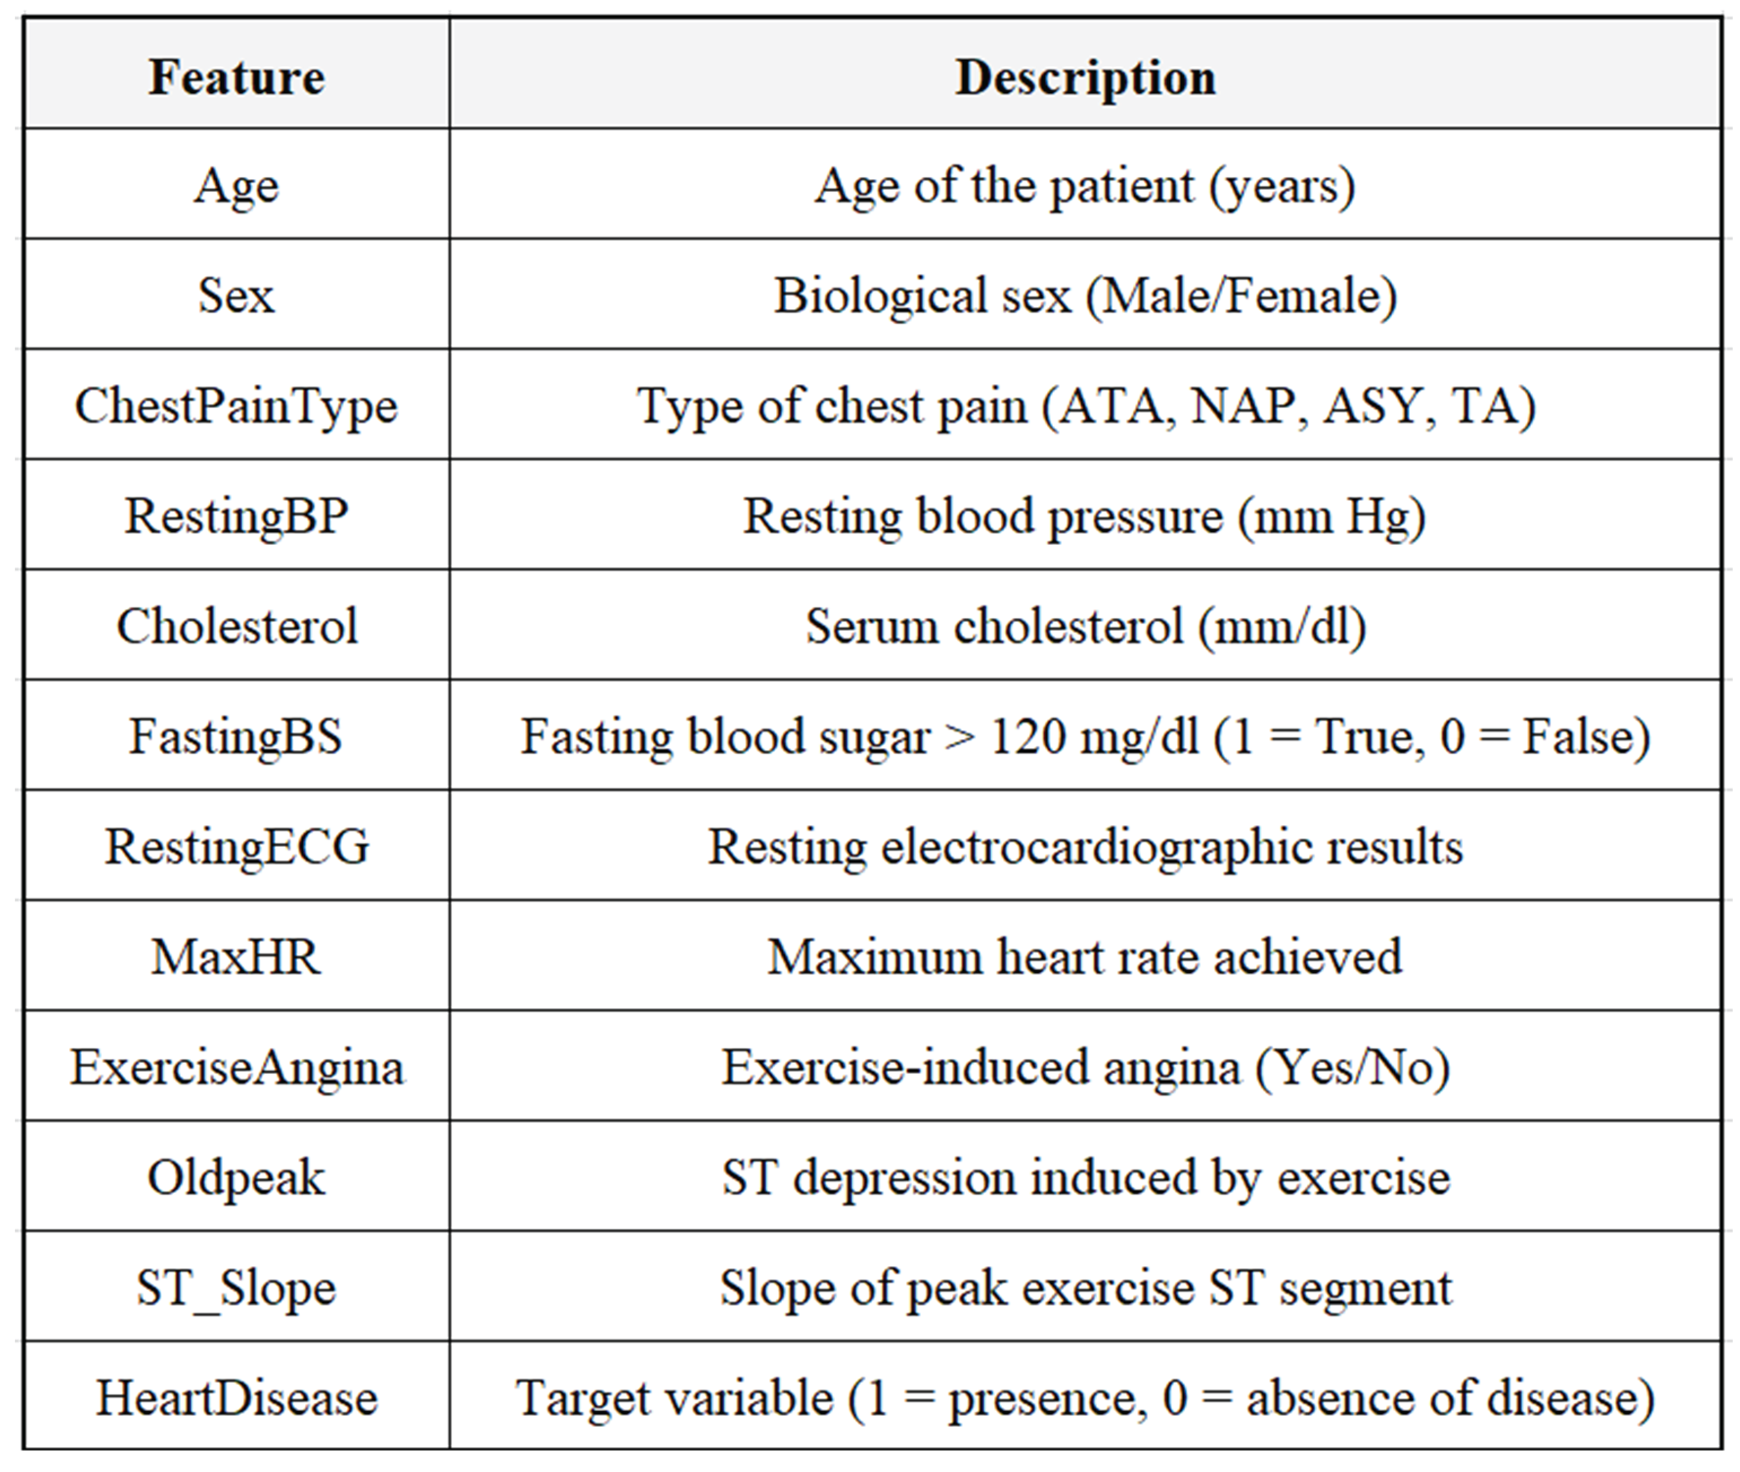
3. Data Set Description

In this project, the Heart Failure Prediction dataset taken from Kaggle has been used as the primary dataset. The dataset consists of 918 de-identified patient records, where each record is described by 11 clinical attributes and one binary target variable. The target variable signifies either the presence of heart disease (1) or its absence (0). The dataset is a mixture of demographic factors, physiological measurements, and ECG features obtained during exercise. The majority of these attributes are in numerical format, which characterizes the dataset as being very appropriate for the implementation of machine learning algorithms for the purpose of binary classification of medical cases. To the best of its availability, the dataset was found to be complete with no missing values at all, but it did contain some features that had entries which were medically not possible thereby necessitating the application of rigorous preprocessing including the deletion of invalid rows and the use of median imputation—details of which can be found in the Data-Related Issues & Preprocessing section as shown in Table 1.

4. Data-Related Issues and Pre-Processing

This part reveals the shortcomings of the data quality in the Heart Failure Prediction dataset and explains the processing steps after that to make the dataset fit for the machine learning model training.

4.1. Data-Related Issues

The first step in data exploration was the inspection for missing values, and the result was quite reassuring since the dataset already contained no missing values at all. This was confirmed by the df.isnull().sum() command in Pandas, which showed that all the columns had a total of zero missing entries. The same was done for checking duplicates by df.duplicated().sum() and the output again confirmed that there were no duplicate rows in the dataset.
Even though there were no missing or duplicate records, the dataset still needed to be cleaned up as there were some features with values that could not be medically accepted. RestingBP, Cholesterol, and MaxHR were the attributes where the problems were most pronounced. Through exploring the data and using domain knowledge together, it was found that some entries like a cholesterol value of 0 were not phylogenetically feasible and needed fixing. Cholesterol was one of the features with a lot of outliers, but not all of them were getting rid of. Outliers were divided into groups according to medical plausibility. Correcting or removing impossible values (e.g., 0) and retaining extreme but biologically reasonable values to keep the dataset's variability were the two-pronged approach that ensured that no useful patterns were lost due to over-filtering as shown in Figure 1.

4.2. Data Pre-Processing

The preprocessing step started by eliminating medically impossible values. A single invalid record in the Resting BP feature was discarded and in the Cholesterol feature 172 incorrect values were found. The deletion of all these cholesterol records would have considerably lessened the dataset size and possibly affected the performance of the model negatively. Hence, median imputation was chosen to substitute the invalid cholesterol values, thus preserving the quality of the data and the strength of the dataset. After such imputation, the dataset was again checked for no invalid values to be left behind.
To illustrate the impact of data cleaning, distribution plots for five numerical features were generated both prior to and following preprocessing. Figure 4 and Figure 5 depict the distribution of the uncleaned and cleaned datasets. Although the cleaned dataset retained some outliers, they were preserved as they fell within medically acceptable thresholds. Eliminating such values would have reduced the dataset's variability and posed a risk of overlooking significant clinical distinctions.
Subsequent to the numerical corrections, categorical features were encoded into numerical formats to facilitate machine learning model training. The dataset was subsequently partitioned into training and testing subsets, allocating 80% for model training and reserving 20% for testing purposes. A fixed random state and shuffling were implemented to guarantee reproducibility and to mitigate bias arising from the data's order. Ultimately, standard scaling was exclusively applied to the training dataset in order to prevent any possibility of data leakage. Thereafter, the same scaling parameters were utilized on the test dataset. Standardization was an essential step since a number of machine learning algorithms are dependent on feature scale, and uniform scaling increases model stability and performance. This preprocessing pipeline made certain that the dataset was not only clean but also correctly formatted and thus, fitted for a trustworthy predictive modelling as shown in Figure 2 and Figure 3.

5. Methodology

The approach of this project was to follow a step-by-step data mining and machine learning process that aimed to create a heart disease predictive model that would be very precise. The entire workflow was divided into four significant parts: EDA, data cleaning, model making, and model testing.

5.1. Exploratory Data Analysis (EDA)

The purpose of exploratory data analysis was to get a clearer view of the dataset in terms of its structure, distribution, and initial quality. Several Pandas functions—like df.head(), df.tail(), df.info(), df.describe(), df.isnull().sum(), and df.duplicated().sum()—were used for checking the data types, computing basic statistics, counting missing values, and detecting duplicates.
The analysis yielded the following findings:
  • The dataset has 918 observations and 11 clinical attributes.
  • There were neither missing values nor duplicates in the dataset.
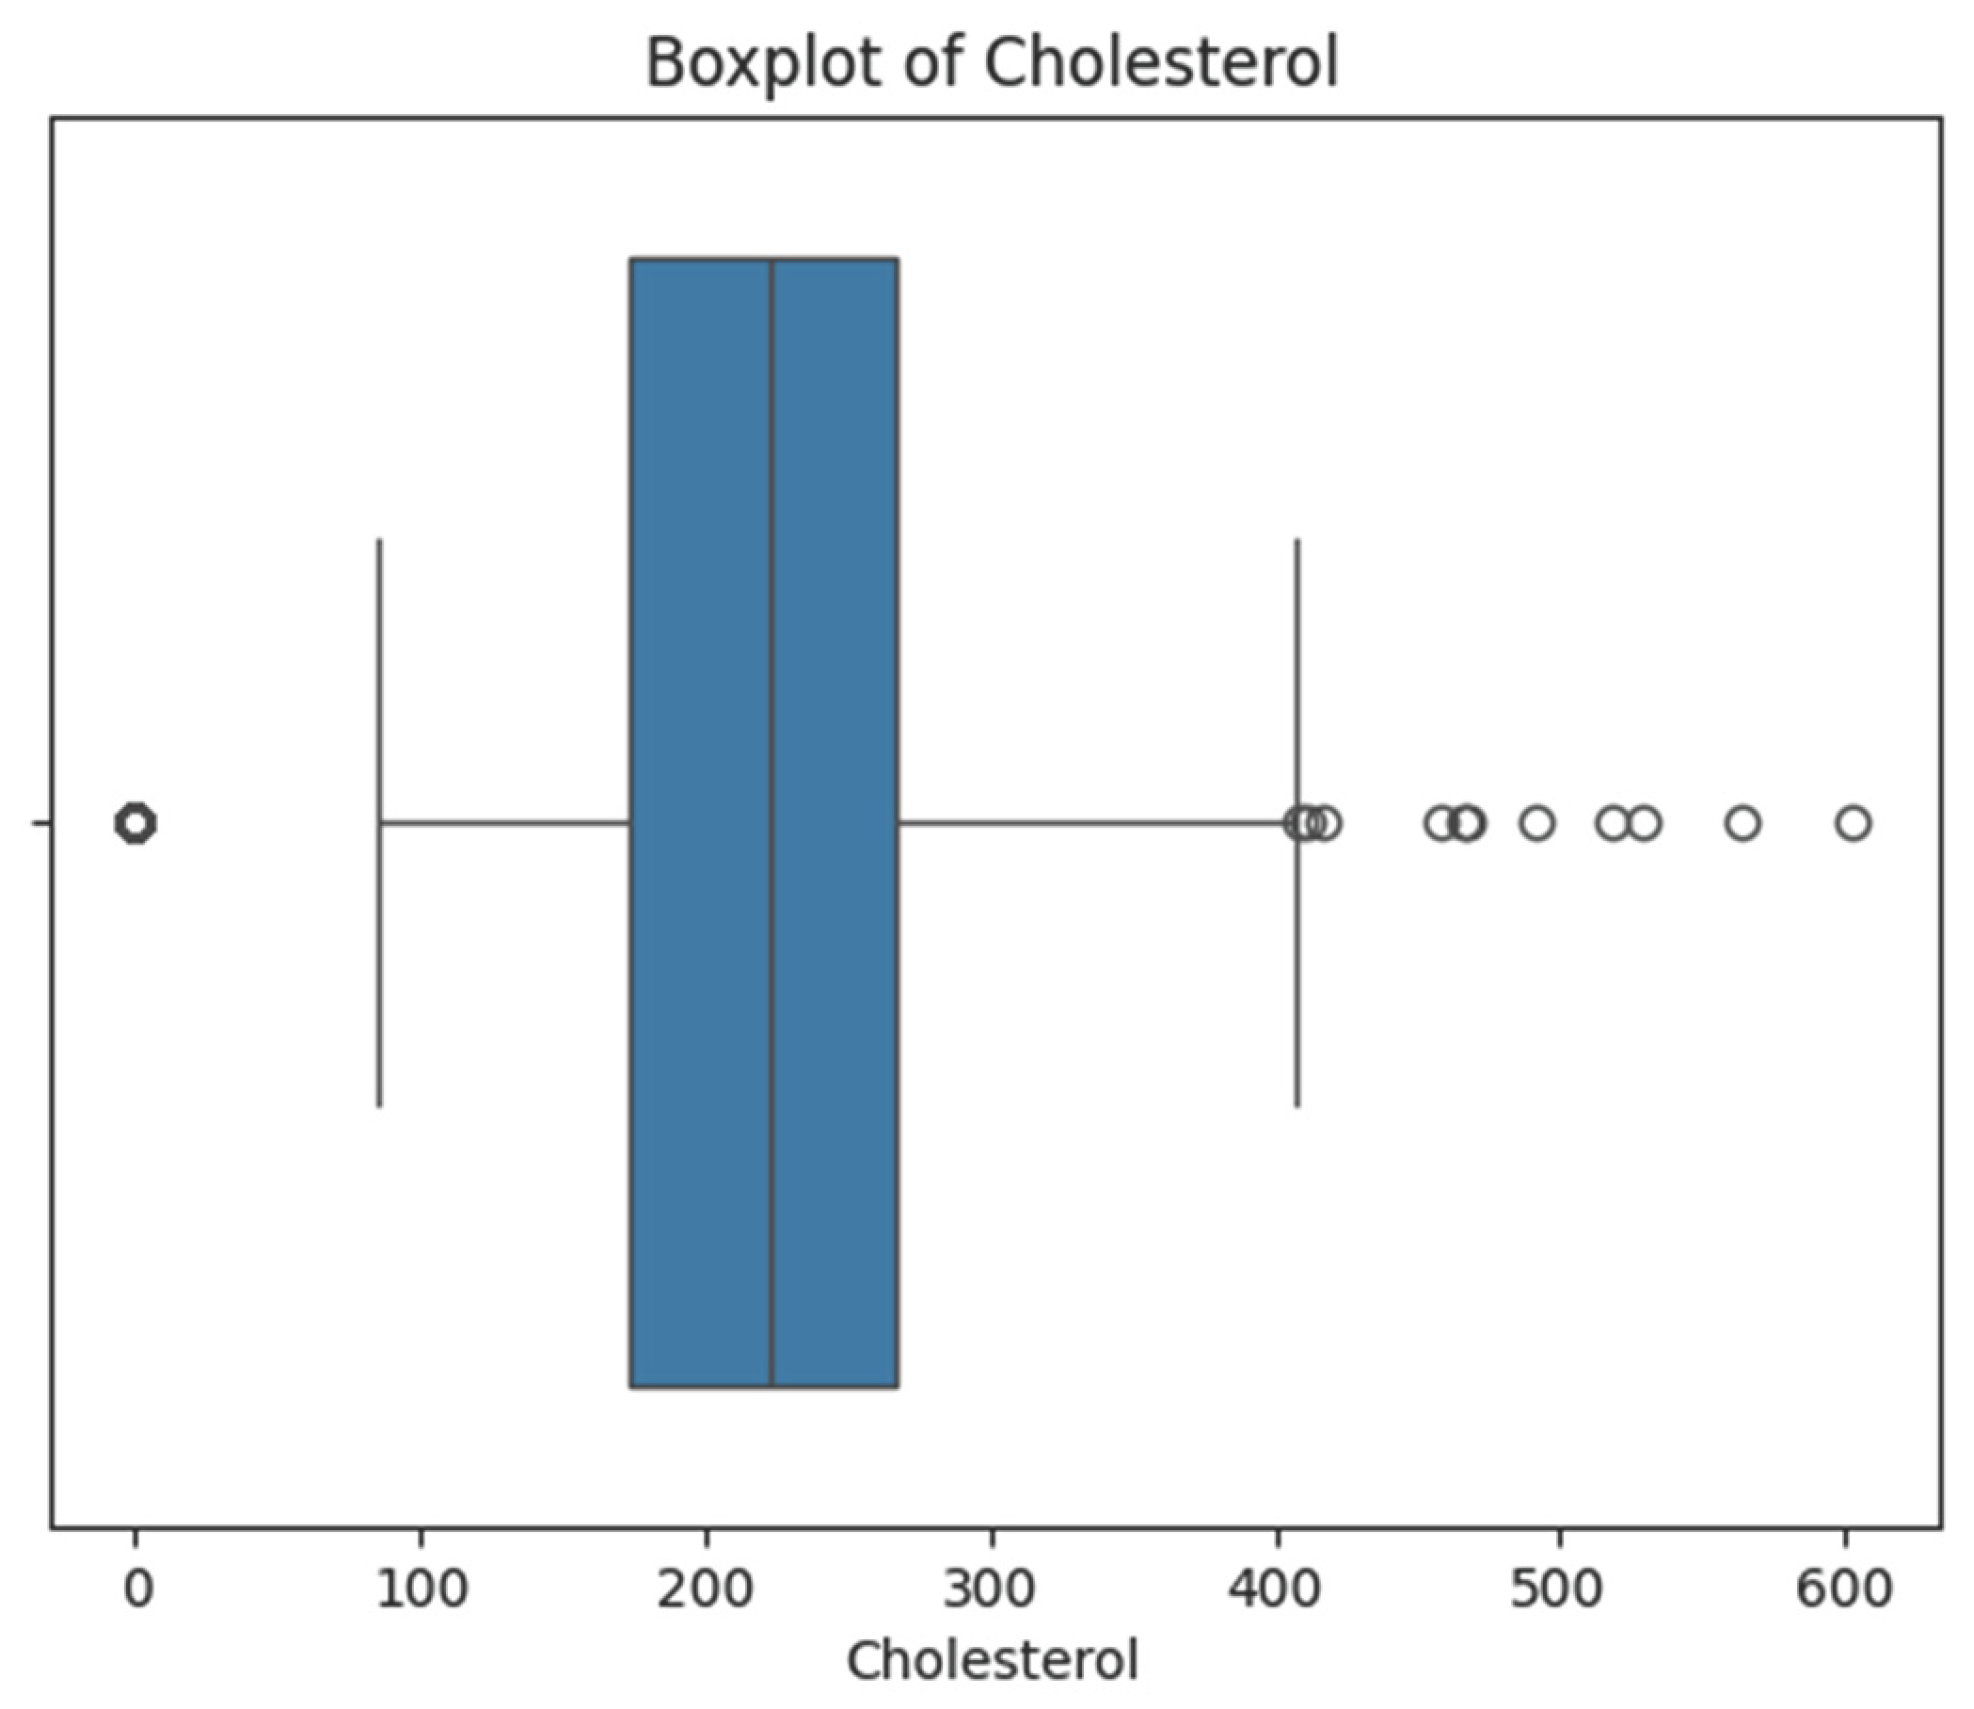
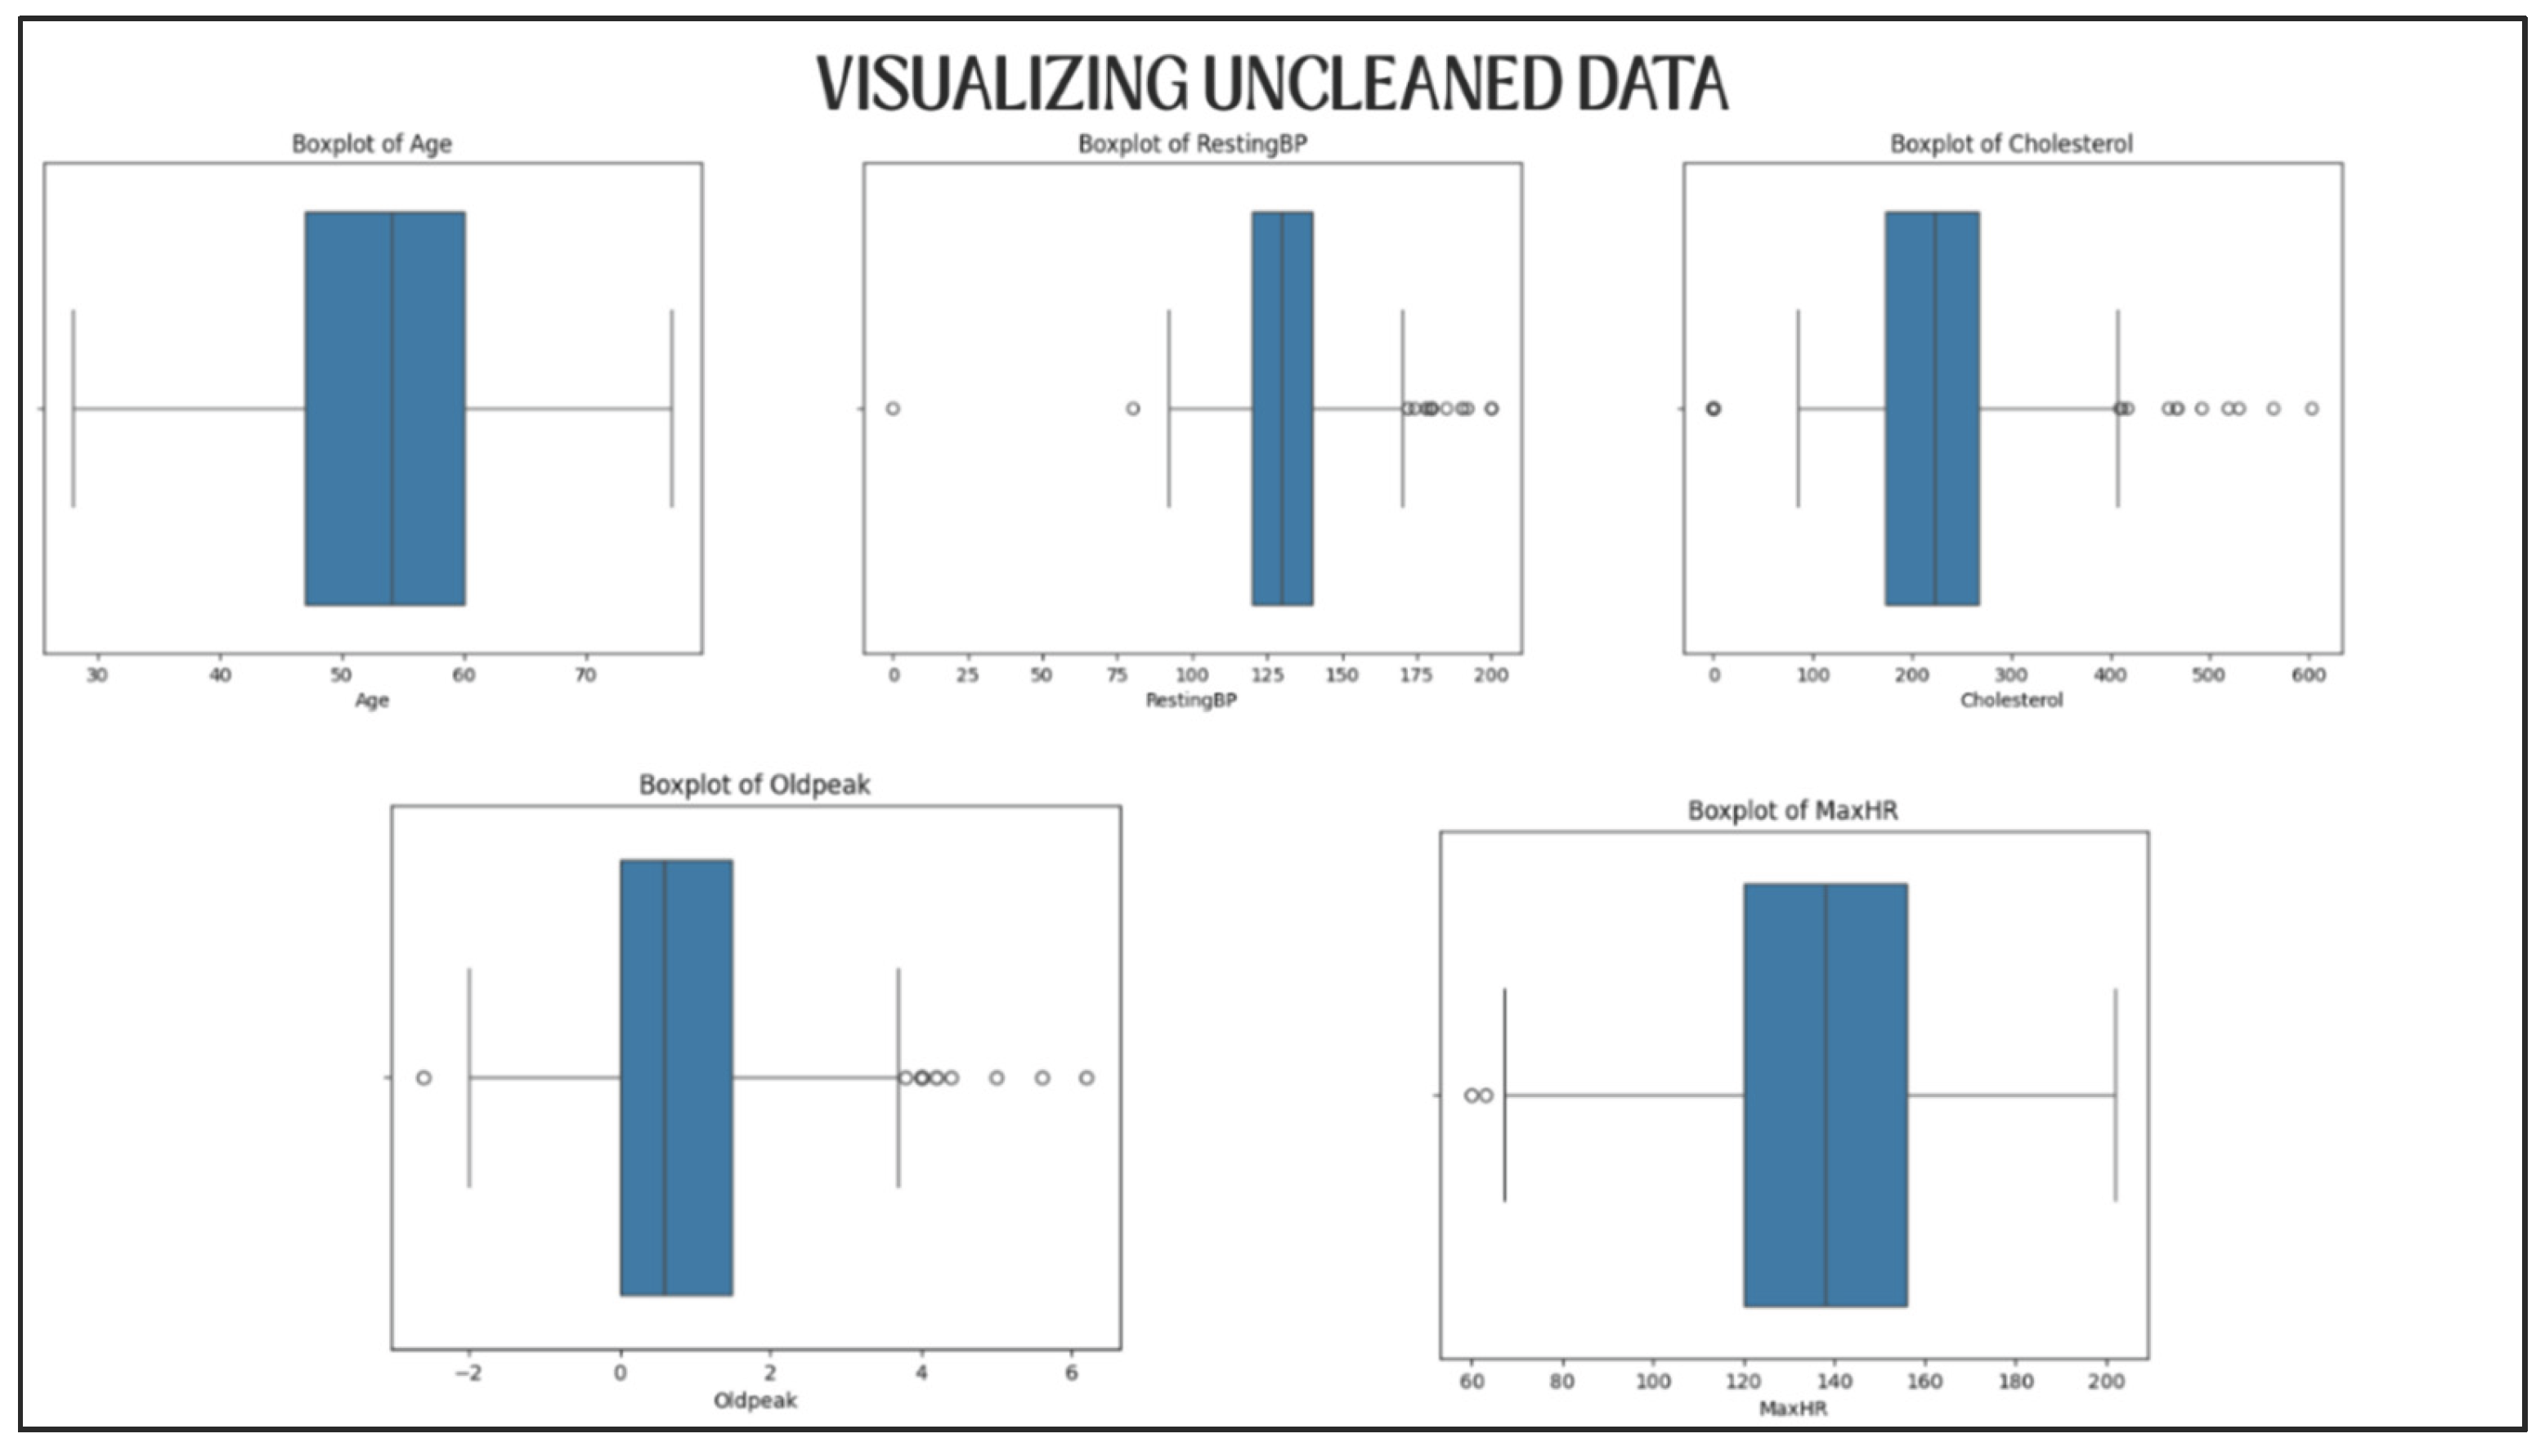
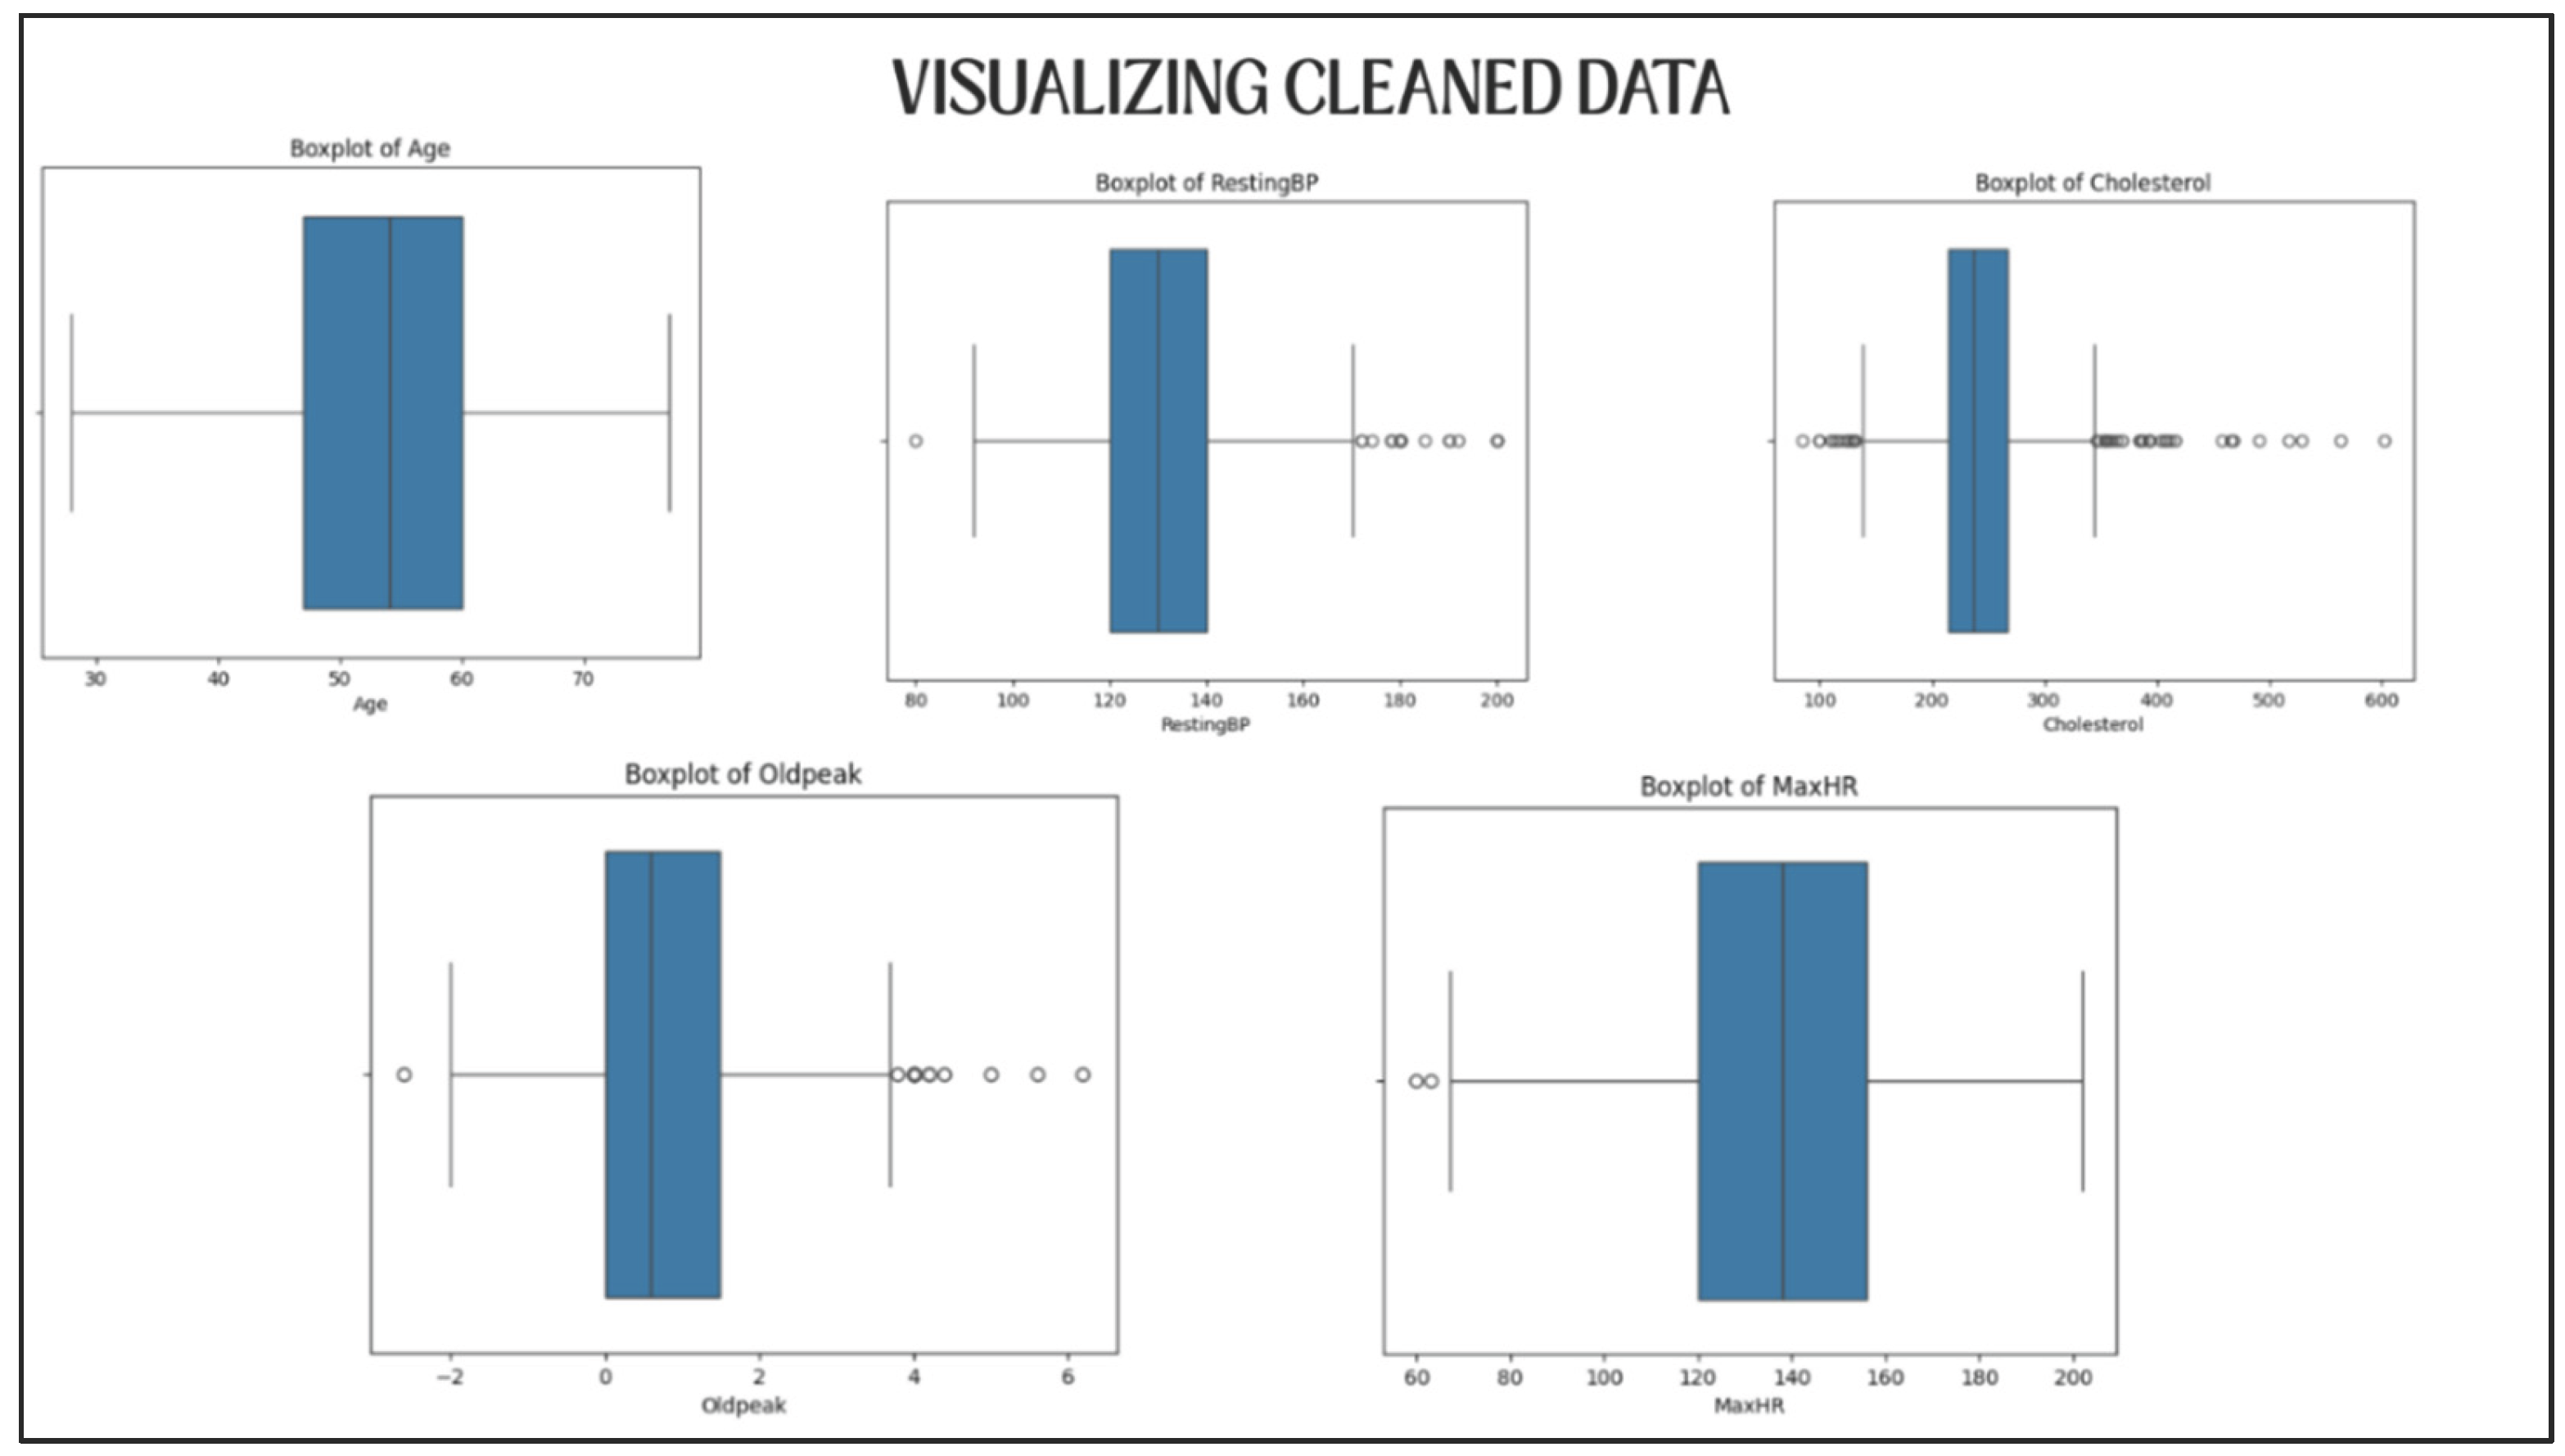
  • Some features, such as Cholesterol, RestingBP, and MaxHR, had unrealistic values or very easily perceivable outliers.
The EDA clearly pointed out the data that needed to be corrected and thus helped in deciding the preprocessing strategy.

5.2. Data Pre-Processing

Data preprocessing was the final cleaning process to remove data-quality problems and to format the dataset for applying machine learning algorithms.

5.2.1. Medically Impossible Values Handling

While there were no missing values, some features had physiologically impossible values (e.g., cholesterol = 0). The following actions were taken:
  • RestingBP: A row with an invalid value was deleted.
  • Cholesterol: 172 values were recognized as medically impossible. If all were removed, the dataset would be considerably reduced (i.e. only around 800 records left), so median imputation method was applied.
  • Max_HR: No invalid values were found.
Only medically plausible outliers were kept to maintain natural clinical variability.

5.2.2. Data Visualization for Validation

Distribution plots were plotted for each of the five numerical variables both prior and subsequent to cleaning (Figure 4 and Figure 5).
Visually these plots confirmed the following:
  • The medically implausible values had been properly replaced.
  • Some of the statistically identified outliers had been removed but their presence was considered to be clinically valid.
Thus, the data set retained its diversity, in a sense it was not too much sanitized.

5.2.3. Encoding of Categorical Variables

The categorical features like Sex, ChestPainType and ST_Slope were mapped to numerical values through label encoding, providing the compatibility with machine learning algorithms.

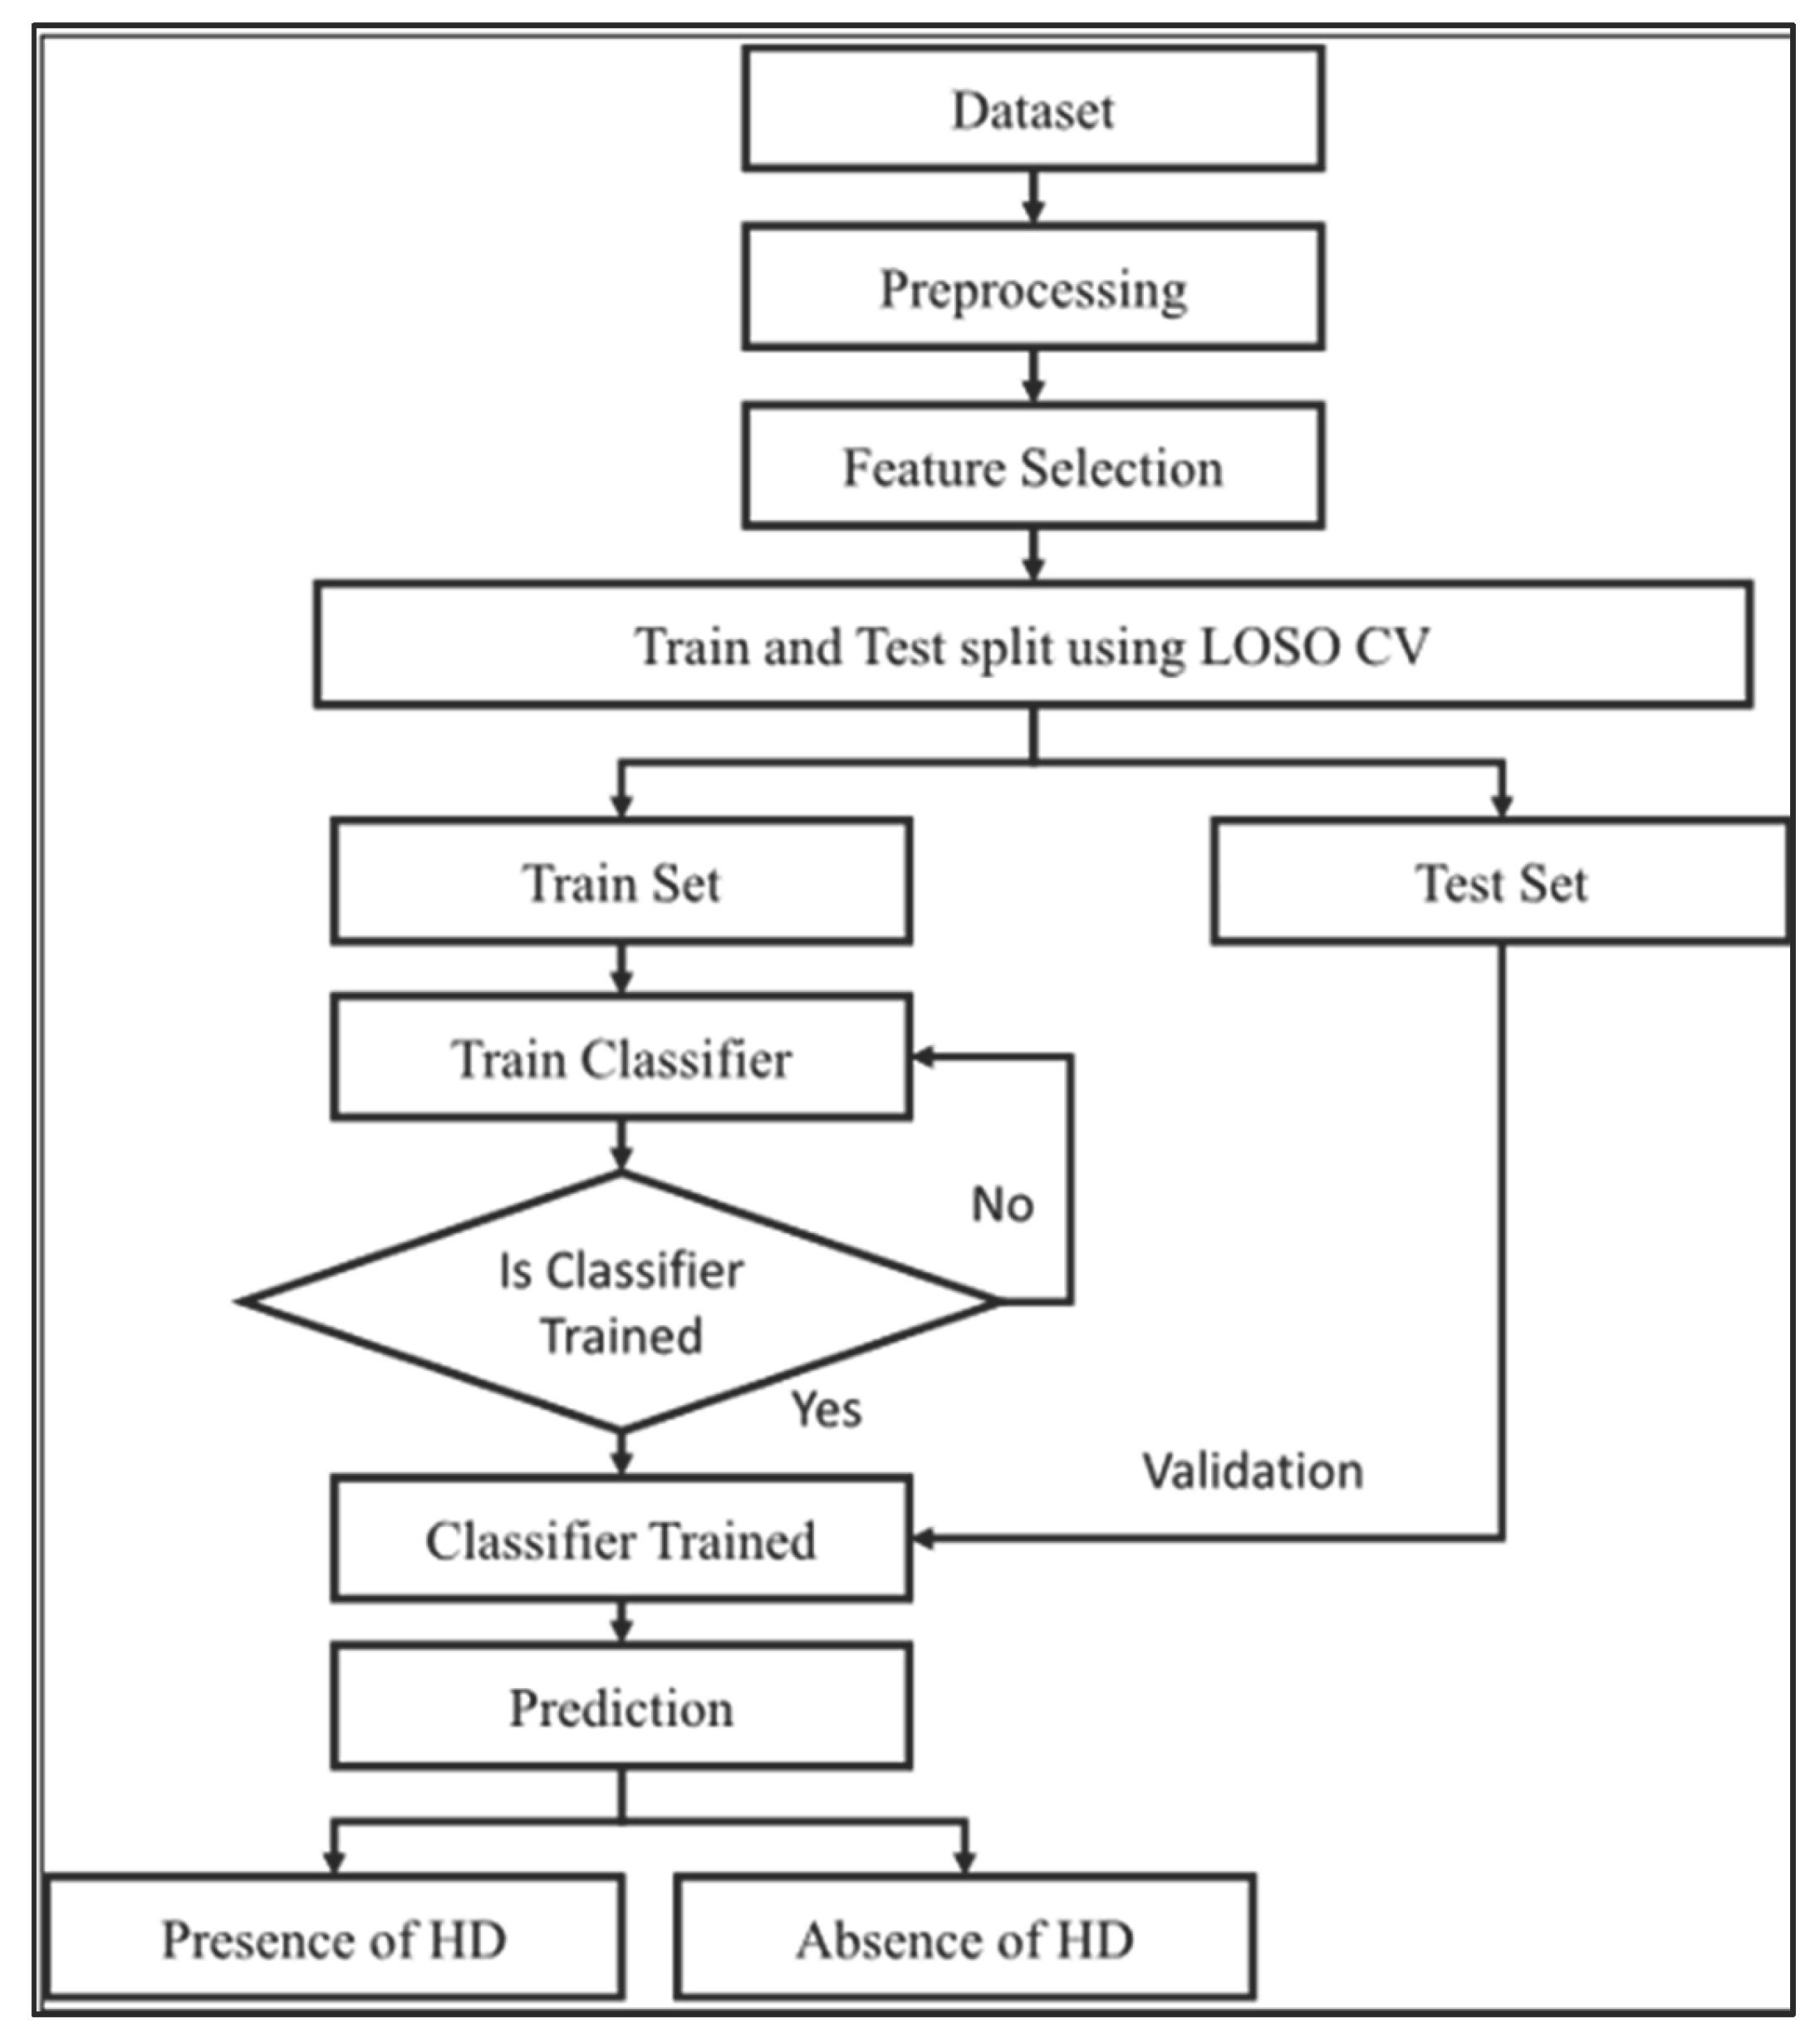
5.2.4. Train–Test Split

The dataset was separated into:
  • 80% for training
  • 20% for testing
A fixed random state along with data shuffling were implemented to achieve the purpose of reproducibility and avoiding sampling bias.

5.2.5. Feature Scaling

The training dataset received standard scaling treatment and the same scaling parameters were employed for the test set. This procedure was very important since the algorithms such as Logistic Regression and SVM are quite sensitive to feature magnitude. The method not only prevents data leakage but also provides a fair model evaluation.

5.3. Machine Learning Model and Evaluation

Heart disease prediction is the application of machine learning wherein three models are chosen according to their ability to work with structured clinical data efficiently and accurately in binary problems.

5.3.1. Logistic Regression

The model serves as a reasonable and interpretable baseline. The dependent variable, heart disease, is binary, represented as 0 for No disease and 1 for Disease, making logistic regression the most appropriate method to utilize. This approach is significant when the relationship between independent and dependent variables is predominantly linear. Additionally, it is considered interpretable within the healthcare context, thereby making it easier for physicians to understand.

5.3.2. Random Forest Classifier

The random forest classifier is a robust ensemble model that evaluates numerous decision trees and aggregates their votes to produce a final output. This model is optimal for the dataset due to its ability to manage various types of features, both numerical and categorical, without easily overfitting, and for uncovering complex interactions among risk factors such as age, cholesterol levels, and ECG signals.

5.3.3. Support Vector Machine (SVM) with RBF Kernel

To address the potential complexity and non-linear relationships among heart disease risk factors, an SVM with a radial basis function (RBF) kernel was incorporated into the system. The RBF kernel maps the original computed features into a higher-dimensional feature space, allowing for easier separation of the two classes—disease and non-disease—through the application of linear boundaries. This is particularly relevant given the overlapping characteristics present in the data.
The selection of one linear model, one ensemble-based model, and one non-linear model was made to enable a comparative analysis of the predictive capabilities of all models, as well as to identify the most appropriate model for heart disease detection datasets.

5.4. Model Validation and Evaluation

This section is dedicated to the evaluation and comparison of the performances of the three models based on several metrics. The Logistic Regression model got a fair score with 84.24% accuracy, 89.52% Precision, 83.93% Recall, and 86.64% F1 score. These metrics mean that although the models are powerful, its output is a bit lower than SVM and Random Forest Classifier. Especially, the low recall 83.93% shows that the model is missing a great number of actual positive instances detection compared to the other models, which may be crucial depending on the application scenario.
The confusion matrix reveals the true distribution of correct and incorrect classifications: 61 true negatives, 94 true positives, 11 false positives, and 18 false negatives. The model exhibits a slightly elevated false negative rate in comparison to SVM and Random Forest, suggesting that a greater number of actual positive cases are going undetected. This lack of detection can be concerning, particularly in the context of medical diagnosis. Logistic Regression remains a valuable baseline model due to its simplicity, speed, and interpretability, despite its slightly lower performance. The linear decision boundary may limit its capacity to identify complex patterns, yet it remains user-friendly and easy to explain. Furthermore, while it may not achieve the highest accuracy, Logistic Regression offers an acceptable level of accuracy and a clear understanding of model behavior.
The support vector machine (SVM) utilizing the radial basis function (RBF) kernel has demonstrated outstanding performance overall, achieving an accuracy of 86.41%, precision of 90.65%, recall of 86.61%, and an F1-score of 88.58%. When these metrics are considered collectively, they indicate that the model is proficient at identifying a significant proportion of actual positive cases (recall) while simultaneously minimizing false positives (precision). The elevated F1-score reflects a careful balance between precision and recall, making it highly relevant in scenarios where both false negatives and false positives carry serious implications. The confusion matrix indicates that 62 negatives and 97 positives were accurately identified, while 15 cases were incorrectly classified as positives and another 15 as negatives. Although the error rates are minimal, the 15 missed positive cases could be critical in a sensitive application such as heart disease prediction. In terms of model validation, SVM's performance aligns with its theoretical advantages, particularly in high-dimensional spaces and with non-linear class boundaries.
Figure 4. Confusion Matrix.
Preprints 186571 g005
Figure 4 illustrates the performance of the confusion matrix. The Random Forest classifier outperformed both Logistic Regression and Support Vector Machine across all key evaluation metrics, achieving an accuracy of 87.50%, a precision of 91.59%, a recall of 87.50%, and an F1-score of 89.50. Such high values are indicative of the model's capacity to deliver predictions that are extremely trustworthy, with good sensitivity (recall) and specificity (precision) at the same time. The balanced and high F1-score are signs that the model can cope with the classification problem with almost no trade-off between the two types of errors (false positive and false negative),
By looking into the confusion matrix, the model recorded 63 true negatives and 98 true positives, along with just 9 false positives and 14 false negatives the least misclassification of all models. It’s very low rates of false positives and false negatives signify high trustworthiness; thus, the model is very appropriate for those areas where very accurate and reliable predictions are a must.
From the validation point of view, Random Forest presents several benefits. Firstly, the ensemble method is quite effective as it combines the decision trees' predictions which helps to robustness, variance reduction, and overfitting prevention, which is very important when working with very large or noisy datasets. Secondly, it can handle both categorical and numerical data, and it automatically provides feature importance. With excellent performance across all metrics and low misclassification rates, Random Forest emerges as the most validated and reliable model among the three, as illustrated in Figure 5.
Figure 5. Receiver Operating Characteristics (ROC).
Preprints 186571 g006
The Receiver Operating Characteristics (ROC) curve is a crucial metric for evaluating the effectiveness of classification models, especially in binary classification scenarios. It illustrates the True Positive Rate (1 Sensitivity) against the False Positive Rate (-1 Specificity) across various classification thresholds. The visualization provided above aids in understanding how well a model can distinguish the positive class from the negative class. In this study, three models, specifically Logistic Regression, Support Vector Machine (SVM), and Random Forest, were employed, and their ROC curves were plotted for comparative analysis. Additionally, the ROC curve was utilized to calculate the Area Under the Curve (AUC), which acts as a singular scalar metric summarizing the model's performance. AUC values range from 0 to 1, with higher values signifying superior discrimination capability. Among the three models, the Random Forest Classifier attained the highest AUC (0.9391), demonstrating its exceptional ability to differentiate between patients with and without heart disease. The ROC curve not only validates the model’s effectiveness but also provides a reliable ranking of the models’ performances, making it an indispensable step in selecting the most appropriate model for the chosen case.

6. Conclusion and Future Recommendations

To sum up, the study aimed to classify heart disease prediction with the use of three machine learning models, which included logistic regression, support vector machine with RBF kernel and Random Forest Classifier. Evaluating each model was done through the key performance metrics of accuracy, precision, recall, F1-score and ROC/AUC. Random Forest classifier performed the best overall which was evidenced by the Accuracy of 87.50%, precision 91.59%, recall of 87.50% and an F1-score 89.50% and the highest AUC value of 0.9391. this implies that Random Forest is the most reliable model that provides the best trade-off between the correct identification of positive cases and the least number of false alarms. The ROC curves further supported this superiority, as the area under the curve for Random Forest demonstrated a superior classification capability compared to SVM and Logistic Regression.
While Logistic Regression served as a quick and easily interpretable baseline model, its lower recall and slightly elevated false negative rate indicate its limitations in high-stakes situations. SVM exhibited commendable performance, effectively managing nonlinear data through the RBF kernel; however, it required more computational resources and extensive parameter tuning. In contrast, Random Forest not only delivered greater predictive power but also maintained low misclassification rates, thereby improving its robustness and readiness for model deployment in this context. In conclusion, the model has overall been successful in reaching its aim, but some future suggestions are there that still need to be taken into account. One of the points can be the collection of more diverse data and addition of the major lifestyle factors like smoking, diet, and exercise. Time-based recording would enable better trend analysis. Development of a user-friendly web or mobile app could help in making it more available during the healthcare process. On top of that, collaboration with the medical field would also ensure predictions being not only practical but also interpretable. Burnout effects and a more polished preprocessing of the data can help increase the quality of data even further. Finally, it is demonstrated that additional models such as Decision Trees, Naive Bayes, or Neural Networks can be tried out to see which one is best in making the right predictions.

References

  1. Baxani, R., & Edinburgh, M. (2022). Heart disease prediction using machine learning algorithms logistic regression, support vector machine and random forest classification techniques. Support Vector Machine and Random Forest Classification Techniques (July 1, 2022).
  2. Rimal, Y., Sharma, N., Paudel, S., Alsadoon, A., Koirala, M. P., & Gill, S. (2025). Comparative analysis of heart disease prediction using logistic regression, SVM, KNN, and random forest with cross-validation for improved accuracy. Scientific Reports, 15(1), 13444. [CrossRef]
  3. Misra, P. K., Kumar, N., Misra, A., & Khang, A. (2023). Heart disease prediction using logistic regression and random forest classifier. In Data-Centric AI Solutions and Emerging Technologies in the Healthcare Ecosystem (pp. 83-112). CRC Press.
  4. Saeedbakhsh, S., Sattari, M., Mohammadi, M., Najafian, J., & Mohammadi, F. (2023). Diagnosis of coronary artery disease based on machine learning algorithms support vector machine, artificial neural network, and random forest. Advanced Biomedical Research, 12(1), 51. [CrossRef]
  5. Mythili, T., Mukherji, D., Padalia, N., & Naidu, A. (2013). A heart disease prediction model using SVM-decision trees-logistic regression (SDL). International Journal of Computer Applications, 68(16). [CrossRef]
  6. Nasution, N., Hasan, M. A., & Nasution, F. B. (2025). Predicting Heart Disease Using Machine Learning: An Evaluation of Logistic Regression, Random Forest, SVM, and KNN Models on the UCI Heart Disease Dataset. IT Journal Research and Development, 9(2), 140-150. [CrossRef]
  7. Rani, P., Kumar, R., Ahmed, N. M. S., & Jain, A. (2021). A decision support system for heart disease prediction based upon machine learning. Journal of Reliable Intelligent Environments, 7(3), 263-275. [CrossRef]
  8. Khan, A., Qureshi, M., Daniyal, M., & Tawiah, K. (2023). A novel study on machine learning algorithm-based cardiovascular disease prediction. Health & Social Care in the Community, 2023(1), 1406060. [CrossRef]
  9. Khanna, D., Sahu, R., Baths, V., & Deshpande, B. (2015). Comparative study of classification techniques (SVM, logistic regression and neural networks) to predict the prevalence of heart disease. International Journal of Machine Learning and Computing, 5(5), 414. [CrossRef]
  10. Munmun, Z. S., Akter, S., & Parvez, C. R. (2025). Machine Learning-Based Classification of Coronary Heart Disease: A Comparative Analysis of Logistic Regression, Random Forest, and Support Vector Machine Models. Open Access Library Journal, 12(3), 1-12. [CrossRef]
  11. Vijayashree, J., & Sultana, H. P. (2018). A machine learning framework for feature selection in heart disease classification using improved particle swarm optimization with support vector machine classifier. Programming and Computer Software, 44(6), 388-397. [CrossRef]
  12. Dinesh, P., Vickram, A. S., & Kalyanasundaram, P. (2024, May). Medical image prediction for diagnosis of breast cancer disease comparing the machine learning algorithms: SVM, KNN, logistic regression, random forest and decision tree to measure accuracy. In AIP Conference Proceedings (Vol. 2853, No. 1, p. 020140). AIP Publishing LLC.
Figure 1. Heart disease prediction system workflow using machine learning.
Preprints 186571 g001
Figure 1. Graphical representation of over-filtering.
Preprints 186571 g002
Figure 2. Visualization of Uncleaned Data.
Preprints 186571 g003
Figure 3. Visualization of Cleaned Data.
Preprints 186571 g004
Table 1. Features and Description of the dataset.
Preprints 186571 i001
Disclaimer/Publisher’s Note: The statements, opinions and data contained in all publications are solely those of the individual author(s) and contributor(s) and not of MDPI and/or the editor(s). MDPI and/or the editor(s) disclaim responsibility for any injury to people or property resulting from any ideas, methods, instructions or products referred to in the content.
Copyright: This open access article is published under a Creative Commons CC BY 4.0 license, which permit the free download, distribution, and reuse, provided that the author and preprint are cited in any reuse.
Prerpints.org logo

Preprints.org is a free preprint server supported by MDPI in Basel, Switzerland.

Subscribe

Disclaimer

Terms of Use

Privacy Policy

Privacy Settings

© 2025 MDPI (Basel, Switzerland) unless otherwise stated