Submitted:
23 November 2025
Posted:
26 November 2025
You are already at the latest version
Abstract
SERS is an emerging technique for the rapid sensing of key bioactive molecules, such as glucose, which has relatively low signal levels using normal Raman spectroscopy. SERS of glucose at extremely low concentration levels or high enhancement factors (EFs) is demonstrated here using relatively inexpensive, commercial multilayer graphene nanoplatelet (GNP) substrates produced from natural graphite. Three approaches for modifying the GNPs for SERS were used: the first method involved drop-coating of gold nanoparticles from solution on the GNPs, the second method used a combination of drop-coating the gold nanoparticles followed by the deposition of tri-ethylene glycol (TEG) layers to partition the glucose on the surfaces of the gold nanoparticles to further increase the SERS signal, and the third method used irradiation of the GNPs in a nitrogen-argon radio frequency (RF) plasma to create nitrogenous defect sites on the graphene layers to increase the SERS signal. Glucose in aqueous solutions was detected at concentrations down to 10-8 M, 10-10 M and 10-11 M, respectively, with corresponding high enhancement factors (EFs) for the three types of modified GNP substrates.
Keywords:
SERS
; graphene nanoplatelets
; gold nanoparticles
; partition layer
; plasma irradiation
1. Introduction
Surface-enhanced Raman spectroscopy (SERS) is a highly specific and sensitive analytical technique [1,2] using analytes adsorbed on nanostructured plasmonic metals or plasmonic metal coated substrates. SERS enhancement factors (EFs) obtained range from 104 due to electronic states formed by the interaction of analytes adsorbed on the metal nanoparticles to 1015 due single molecule detection levels [3,4,5] Enhancement of the Raman signal approaching single molecule levels is attributed to the local electromagnetic mechanism associated with molecules adsorbed at nanoscale “hot spots” between plasmonic metal nanoparticles.
Gold is an excellent plasmonic metal for SERS. It can be deposited as films on different substrates for SERS applications in biology, such as labels for flow cytometry detection and characterization of a population of biological cells [3]. Moreover, gold can undergo different surface functionalization reactions [6,7,8] to provide a versatile platform for use in surface chemistry and other biological applications [9,10,11]. Spherical gold particles also have large surface-to-volume ratios, size and shape-related optoelectronic properties, as well as excellent biocompatibility [12,13]. The key physical properties of gold are its excellent surface plasmon resonance, capacity to quench fluorescence, a broad range of colors in an aqueous state, flexibility in terms of core size, and a size-dependent plasmon absorption peak from 500 to 550 nm in the visible spectral range [14,15,16]. Gold nanoparticles in suspensions have narrow size distributions based on dynamic light scattering and can be produced consistently in different sizes and shapes [17]. They are useful in photodynamic therapy that can target specific tumors, provide diagnostics for detecting biomarkers, and as catalysts for various chemical reactions [18,19]. Moreover, the surface of gold nanoparticles is used for selective oxidation reactions, particularly those involving nitrogen oxides and development of colorimetric sensors to determine the suitability of certain foods for human consumption [20].
Glucose sensing has been previously performed using SERS [21,22], where the sensitivity was enhanced by the use of “partition” layers to isolate the adsorbent molecules on the surface of the gold nanoparticles[23]. For biochemical applications, the partition layer has to be biocompatible with excellent hydrophilic and hydrophobic properties [24] . Tri-ethylene glycol (TEG) terminated alkane and decanethiol films are considered as excellent partition layers because of their hydrophilic and hydrophobic properties, respectively, in aqueous media. Gold nanoparticles in nanoscale shells have also been used to obtain SERS to determine three-dimensional features, such as the conformation of thiolate poly(ethylene glycol) [25] . In addition, an indirect process for the detection of COVID-19 by SERS has been described, but direct SERS observations from the virus have not been reported [26,27].
The discovery of two-dimensional, atomically flat single layer graphene has led to its use as a new type of substrate for SERS [28,29,30,31,32,33,34,35,36]. The combined graphene/gold or silver nanoparticle structures deposited on these substrates results in high enhancement due to “hot” spots formed between gaps on single or few layer metal-graphene islands.
Here, we report more optimized SERS from glucose using multilayer graphene nanoplatelets (GNPs) obtained commercially from natural graphite, which had shown high SERS sensitivity for glucose in earlier, preliminary experiments [37]. The GNP substrates were drop-coated for SERS with gold nanoparticles formed in solution and by TEG partition layers without and with radio-frequency plasma irradiation to create structural defects on the substrates to add to the SERS effect.
2. Materials and Methods
2.1. Chemicals and Reagents
All chemicals and reagents were analytical grade or higher and used as received without further purification. Gold (III) chloride trihydrate (99.9%), dehydrated sodium citrate ( 99 %), and anhydrous 96% alpha D-glucose, 96% were purchased from Sigma-Aldrich. The GNPs from natural graphite used as substrates in this work were obtained from Graphene Laboratories Inc (https://www.graphene-info.com/graphene-laboratories). Tri(ethylene glycol) mono tri(ethylene glycol)-11-mercaptoundecyl ether, 95% was purchased from Sigma-Aldrich.
(Triethylene glycol mono-11-mercaptoundecyl ether monolayer
2.2. Preparation of gold nanoparticles
Gold nanoparticles were prepared by reduction of gold (III) chloride trihydrate with sodium citrate as described by Turkevich [38] and Ferns [39]. Briefly, an aqueous solution of gold (III) chloride tri-hydrate (0.5M, 25 ml) was heated to 98oC, stirred and 1 ml of 1% aqueous sodium citrate solution added to it. The mixture obtained was kept at 95oC and continuously stirred for 30 minutes to give a dark red solution with gold nanoparticles at a concentration of 0.04 M from which gold nanoparticles were deposited on the GNP substrates. Aqueous solutions of glucose with concentrations from 1 M to 10-11 M were prepared for use in the SERS measurements. The solutions were freshly prepared for each set of measurements.
2.3. Preparation of the SERS substrates
Three types of SERS substrates were prepared using as-received GNPs as shown schematically in Figure 1.
2.3.1. GNPs without partition layer
Several drops of gold nanoparticles from a suspension prepared as described in sub-section 2.2. were drop-coated on the GNP substrates. After drying, drops from glucose stock solutions with different concentrations were deposited followed by drying at 35oC in an oven. After drying, SERS from the coated GNPs were obtained for each concentration.
2.3.2. GNPs with partition layer
Gold nanoparticles were first deposited by drop-coating on the GNP substrates. Then a few drops of the partition layer tri-ethylene glycol mono-11-mercapto undecyl ether monolayer (TEG) were deposited and dried in a vacuum for 24 hrs. After drying, drops from a glucose stock solution at different concentrations were added and dried at 35oC in an oven. SERS of the glucose-containing partition layer coated GNPs were then recorded for different glucose concentrations.
2.3.3. GNPs modified by radio frequency plasma exposure
Plasma irradiation at 60W power was carried out for 60 minutes using an apparatus for radio frequency (rf) plasma radiation described by Benchafia et al [40] with a plasma generator. The impedance matching box attached to the system was adjusted to deliver 65-100 W of power during irradiation. The temperature monitored by a thermocouple floating above the substrate ranged between 200o and 300oC with no external heating. A 50% nitrogen-50% argon mixture was fed into the plasma chamber after evacuation to a pressure of less than 1 Torr. The GNP substrates were placed in a quartz boat and subjected to plasma irradiation at nitrogen-argon flow rates of 10 to 15 sccm (standard cubic centimeters per minute) for 2 and 3 hours.
Several drops of gold nanoparticles were deposited on the GNP substrates. Then, a few drops of the TEG partition layers were deposited and dried in a vacuum for 24 hours. After drying, glucose test solutions at different concentrations were deposited on the different substrates for SERS measurements.
2.4. Scanning electron microscopy (SEM)
SEM images of the pristine and modified nanoplatelet substrates were obtained with a VP-1530 Carl Zeiss LEO (Carl Zeiss, Peabody, MA, USA) field-emission SEM coupled to an Oxford energy dispersive x-ray spectroscopic (EDS) detector. The samples were mounted on aluminum stubs using double-sided carbon tape with an additional sputter coating of carbon to prevent charging.
2.5. Raman spectroscopy
Measurements were performed with a ThermoScientific DXR micro-Raman spectrometer (ThermoScientific Inc, Waltham, MA, USA) using 532-nm diode pumped solid state laser excitation and a microscope with an objective at a spatial resolution of 10 μm. The instrumental slits were set to provide a spectral resolution of 2 cm-1.
The calculation of the normalized SERS-enhanced Raman intensity ISERS, where normalization is performed with the molecules binding to the metallic gold-GNP substrate, NSERS, subsequently divided by the Raman intensity, Ivol; the normalization of the latter was performed by the number of molecules in the excitation volume, Nvol. The SERS enhancement factors (EFs) for an ensemble of nanoparticles is obtained by the ratio for an ensemble of nanoparticles calculated by the ratio of the SERS cross-section (σGlucose:SERS) of glucose on nanoparticles and the normal substrate, respectively. The enhancement factors and the lower limit of detection obtained are given in Table 1 in the Results and Discussion section. The EF is expressed by the following equation [41] :
SERS EF [Raman Shift (cm-1)] = (1),
where, Nvol is the number of molecules in the probed volume area, Nsers is the number of molecules adsorbed and Ivol is the intensity of the Raman signal from the probed volume and Isers is the intensity of the Raman signal from the SERS substrate.
3. Results and discussion
Pristine graphene nanoplatelets (GNPs) produced from natural graphite consist of extremely flat and defect-free multilayer graphene as indicated by the near-absence of the graphitic defect D mode at 1360 cm-1 and the appearance of a very narrow graphitic G mode at 1600 cm-1 in its normal Raman spectrum using 532 nm laser excitation (Figure 2). The GNPs, which are produced by thermal shock and shear can have the potential to be used as novel, cost-effective graphene-like SERS substrates for sensing applications. SERS using graphene have typically been performed on single or few layer graphene deposited on or transferred to free-standing substrates, such as silicon or a polymer, by relatively expensive laboratory-scale methods [27,28,29].
The as-received, pristine GNPs were first examined by normal Raman spectroscopy and also after radio-frequency argon-nitrogen plasma irradiation (Figure 2). SERS for glucose detection was performed after deposition of gold nanoparticles and partition layers to isolate the glucose analyte to improve the glucose signal. Radio frequency (RF) argon-nitrogen plasma irradiation was used to create defects on the GNP surface as indicated by scanning electron microscopic (SEM) images shown in Figure 3. The GNP substrates were also examined by energy dispersive spectroscopy (EDS) to determine the Au content after deposition of Au nanoparticles on the substrates.
The normal Raman spectrum for pristine GNPs (Figure 2(a)] showed the graphene lines: 2D at ~2700 cm-1 and G at ~1605 cm-1 [27]. However, as evident from Figure 2(a) and in contrast to the Raman spectrum of single layer graphene, the G line in GNPs at 1605 cm-1 shows a much higher peak intensity than that of the 2D line at 2700 cm-1 which is broader and weaker compared to that of single layer graphene. It also has a lower wavenumber shoulder due to its multilayer microstructure. An extremely weak defect- or disorder-induced D line near 1360 cm-1 is observed showing that the pristine GNP substrates have a very low concentration of defects as noted above. The Raman spectrum of the GNPs after nitrogen-argon radio-frequency plasma treatment at 60 W for one hour shows substantial changes, as evident from Figure 2(b) and (c) taken from two different locations on a plasma-treated GNP. The plasma treatment results in the emergence of the D line with increased intensity near 1360 cm-1 due to defect formation, a shift of a component of the G line to a lower wavenumber at 1583 cm-1 due to doping of the graphene layers with the heavier nitrogen atoms to break the symmetry of the carbon-based graphene lattice and the formation of sp3-bonded pyrrolic-N moieties [34].
SEM images showing the morphology of the pristine and Au nanoparticle coated GNP substrates are displayed in Figure 3 (a-g). Figure 3 (a) shows a top-down view of a pristine GNP substrate, whereas Figure 3 (b) shows a top-down view of a GNP substrate with deposited gold nanoparticles. SEM images of GNPs show pure and transparent flakes indicating that each flake is composed of a graphene sheets. In addition, SEM image for the graphene nanoplates show the higher porosity in the sample is located between the sheets as shown in the figure 3(a,b)
The percentage of gold nanoparticles determined by EDS was found to be about 4.6%. The gold nanoparticles show lighter contrast on the graphene nanoplatelet surface [38]. Figure 2(c and d) depict cross-sectional SEM images from a pristine GNP substrate and a gold-coated GNP substrate. Cracks where defects due to nitrogen doping of graphene are likely to occur after the plasma treatment is evident in SEM images shown in Figures 3(f and g). Cracks formed on the substrate surface are indicated by arrows shown in Figure 3(g).
Figure 4(a) displays the normal Raman spectrum of crystalline glucose in agreement with the glucose lines reported by Yonzon et al [41], and Figure 4(b) shows the SERS results at different concentrations of glucose from 10-3 to 10-8 M deposited on Au-coated GNP substrates. The lines observed in the SERS spectrum in a 10-3 M aqueous solution are within a few wavenumbers of the lines observed in the normal spectrum of crystalline glucose. Time constants of 15 s to 120 s were typically used in collecting the SERS data. If higher time constants were used glucose would convert to gluconic acid due to catalytic breakdown by gold nanoparticles [24]. Moreover, at very low glucose concentrations an open chain structure of glucose with an aldehyde group can form to give gluconic acid [42]. Citrate-reduced gold nanoparticles are stable on the GNP substrates because the electromagnetic field between individual gold nanoparticles is reduced, leading to increased stability and increase in the SERS signal [43]. Moreover, the aggregation of gold nanoparticles produced by the citrate process results in the distance between Au nanoparticles to be reduced, which creates hot spots to give higher SERS signals [44,45].
Figure 5 displays the SERS data for different concentrations of glucose on partition layers formed by triethylene glycol mono-11-mercaptoundecyl ether (TEG, chemical structure shown above Figure 5) deposited on a graphene-like substrate, using 532 nm laser irradiation with a 30s. The SERS data display lines due to the normal crystalline spectrum of glucose shown in Figure 4(a). The SERS peaks are observed to be within 1.0 to 19 cm-1 of the peaks due to glucose at 402, 512, 835, 900, 1063, 1118, 1341, and 1463 cm-1 in Figure 4 (a). Increasing the acquisition time for glucose detection was necessary to avoid self-assembled monolayers (SAMs) for TEG on AuNPs.
SERS for glucose on the TEG-Au/GNP substrate showed significantly higher intensities from the data in Figure 6 recorded on the substrate without a partition layer. The SERS signal enhancement due to the addition of the partition layer is likely to be due to interactions between the OH group in TEG and glucose, as well as by the interactions between the SH group in the partition layer and the gold nanoparticles. The line at 1575 cm-1 is associated with the partition layers and shows SERS enhancement. The TEG moiety also binds to the surface of the Au nanoparticles either by chemisorption and hydrophobic interactions, or electrostatic attraction. The interaction strength between the gold nanoparticle surfaces and the thiol (-SH) group in the partition layer is ~ 50 kcal mol-1 which also provides a stable nanostructure [46]. Furthermore, Au nanoparticles are coated with citrates which ensures stabilization and static repulsion in order to prevent aggregation [47]. Citrate reduction during the fabrication of the gold particles provides a protective organic layer on the surface of the gold particles required to ensure that glucose is attached by charges on the surface and not by direct interaction between glucose and gold [48,49,50,51].
The SERS efficiency for glucose detection using the TEG-Au-graphene-like sheet is 2 orders of magnitude higher than that of the Au-graphene-like sheet without the partition layer. As shown by the data in Figure 5 and Table 1, the Au-graphene-like sheet with the TEG- partition layer provided a very low limit of detection for glucose at a concentration of 10-10 M corresponding to an enhancement factor of 1011. Another feature of this substrate is its long-term SERS stability as shown in Figure 5 (c).
A third type of the graphene nanoplatelet functionalization was obtained by nitrogen-argon plasma treatment of the substrates followed by gold nanoparticle and plasma partition layer deposition (Figure1). SERS for glucose on TEG-Au coated on a plasma modified graphene-like sheet shown in Figure 6 indicates an order of magnitude increase in the lower limit of detection and corresponding increase in the enhancement factor. The Raman signal for glucose is enhanced as a result of nitrogen doping that result in the creation of hydrophilic polar sites where the gold nanoparticles can deposit to create hot spots. The creation of the hot spots is facilitated by the interactions between Au, and pyrrolic and pyridinic nitrogen atoms. In addition, using nitrogen doping graphene enhance Raman signals with AuNPs, due to the better charge transfer interaction with target molecule [30,52]. Moreover, defective (probably nitrogen doped) graphene enhances the molecular adsorption affinity with target.
The enhancement factors for the three types of graphene-like substrates are given in Table 1 as calculated by equation (1) above. The enhancement factor for the nitrogen-argon plasma treated substrate is the highest achieved in this study (see Table 1).
Figure 9 shows the linear dependence of the SERS intensity of the 1340 cm-1 glucose line assigned to the C-C-H bending mode with glucose concentration for the three types of graphene-like substrates. The linear fit calibration results in R2 = 0.83 with error bars is illustrated in Figure 9. The intensities of the SERS spectra of glucose are proportional to the logarithm of the concentrations of the glucose in. The good linear response of SERS is obtained from 10-2 to 10-12 M.
Figure 7.
Intensity of the glucose Raman peak at 1340 cm−1 versus the glucose concentrations on Glucose/TEG/Au plasma-modified GNF substrates which can be used as a calibration plot for sensor applications. Determined error bars are indicated on the data points.
Figure 7.
Intensity of the glucose Raman peak at 1340 cm−1 versus the glucose concentrations on Glucose/TEG/Au plasma-modified GNF substrates which can be used as a calibration plot for sensor applications. Determined error bars are indicated on the data points.

4. Conclusions
This work demonstrates that economical, commercially available multilayer graphene nanoplatelets (GNPs) can be engineered into high-performance SERS substrates for glucose detection. By systematically comparing three surface-modification strategies—(i) Au nanoparticles (AuNPs) on GNPs, (ii) AuNPs plus a triethylene-glycol (TEG) partition layer, and (iii) nitrogen/argon RF-plasma modification of GNPs followed by AuNPs and TEG we achieved limits of detection down to 10⁻⁸, 10⁻¹⁰, and 10⁻¹¹ M, respectively, with corresponding enhancement factors of ~2.4×10⁹, 5.5×10¹¹, and 6.4×10¹². The best-performing architecture leverages three synergistic effects: (a) electromagnetic “hot spots” from closely spaced AuNPs, (b) molecular partitioning and interfacial organization by TEG that increases the effective local concentration of glucose near AuNPs, and (c) defect- and heteroatom-induced adsorption sites generated by nitrogen/argon plasma that promote AuNP anchoring and facilitate analyte localization [53,54].
Beyond sensitivity, the platform exhibits practical attributes desirable for sensing. It is fabricated from inexpensive, commercially sourced GNPs using simple drop-coating and plasma processes suitable for large-scale production. The system demonstrated signal stability for up to three weeks, confirming robust interfacial bonding and structural integrity. Moreover, the linear correlation (R² ≈ 0.83) between the SERS intensity of the 1340 cm⁻¹ glucose band and the logarithm of glucose concentration (10⁻²–10⁻¹² M) establishes the quantitative potential of this GNP-based sensor for trace-level glucose monitoring.
The findings align with previous studies on graphene-based SERS sensors, where the defect density and surface chemistry of graphene derivatives play a pivotal role in modulating enhancement factors and analyte–substrate interactions [54,55,56]. In the broader context of nanostructured materials for molecular sensing, these results are also consistent with performance trends reported for silver-based plasmonic systems [57], further supporting the importance of surface morphology and heteroatom doping in achieving reproducible high-field enhancements .
Despite the strong performance, limitations remain: spectral interference from the graphene G-band near 1600 cm⁻¹, the need to control acquisition times to avoid glucose oxidation, and the variation in enhancement due to non-uniform plasma-induced defects. Addressing these through process standardization, optimized AuNP spacing, and improved surface passivation could yield even more stable and reproducible sensors.
In conclusion, this study establishes a low-cost, scalable, and highly sensitive SERS platform for glucose detection down to 10⁻¹¹ M, with performance comparable to or exceeding that of single- or few-layer graphene systems. The combination of multilayer GNPs, partition-layer engineering, and plasma-induced defect control represents a versatile approach that could be extended to other biomolecules and environmental analytes. Future work will focus on refining substrate uniformity, integrating microfluidic handling, and testing bimetallic (Au–Ag) plasmonic systems to further enhance signal intensity and long-term operational stability[50,58,59,60,61].
Funding
This work was supported and funded by the Deanship of Scientific Research at Imam Mohammad Ibn Saud Islamic University (IMSIU) (grant number IMSIU-DDRSP2501).
Conflicts of Interest
The authors have no conflicts of interest to declare.
References
- D. Cialla, A. März, R. Böhme, F. Theil, K. Weber, M. Schmitt and J. Popp, Anal. Bioanal. Chem., 403, 27-54 (2012). [CrossRef]
- S. Schlücker, Angewandte Chemie International Edition, 53, 4756-4795 (2014). [CrossRef]
- C.M. MacLaughlin, N. Mullaithilaga, G. Yang, S.Y. Ip, C. Wang and G.C. Walker, Langmuir, 29, 1908-1919 (2013). [CrossRef]
- C. Hrelescu, T.K. Sau, A.L. Rogach, F. Jäckel and J. Feldmann, Applied Physics Letters, 94 (2009). [CrossRef]
- K. Hering, D. Cialla, K. Ackermann, T. Dörfer, R. Möller, H. Schneidewind, R. Mattheis, W. Fritzsche, P. Rösch and J. Popp, Analytical and bioanalytical chemistry, 390, 113-124 (2008). [CrossRef]
- H. Yuan, A.M. Fales, C.G. Khoury, J. Liu and T. Vo-Dinh, JRS., 44, 234-239 (2013).
- C. Hrelescu, T.K. Sau, A.L. Rogach, F. Jäckel and J. Feldmann, Appl. Phys. Lett., 94, 153113 (2009). [CrossRef]
- Y. Hu, H. Cheng, X. Zhao, J. Wu, F. Muhammad, S. Lin, J. He, L. Zhou, C. Zhang and Y. Deng, ACS nano, 11, 5558-5566 (2017). [CrossRef]
- S. Boca, D. Rugina, A. Pintea, N. Leopold and S. Astilean, J Nanotechnology, 2012 (2012). [CrossRef]
- M.M. Kemp, A. Kumar, S. Mousa, T.-J. Park, P. Ajayan, N. Kubotera, S.A. Mousa and R.J. Linhardt, Biomacromolecules, 10, 589-595 (2009). [CrossRef]
- N. Duan, M. Shen, S. Qi, W. Wang, S. Wu and Z. Wang, Spectrochimica Acta Part A: Molecular and Biomolecular Spectroscopy, 230, 118103 (2020). [CrossRef]
- X. Su, J. Zhang, L. Sun, T.-W. Koo, S. Chan, N. Sundararajan, M. Yamakawa and A.A. Berlin, Nano letters, 5, 49-54 (2005). [CrossRef]
- L.A. Wali, K.K. Hasan and A.M. Alwan, Spectrochimica Acta Part A: Molecular and Biomolecular Spectroscopy, 206, 31-36 (2019). [CrossRef]
- S.P. Mulvaney, M.D. Musick, C.D. Keating and M.J. Natan, Langmuir, 19, 4784-4790 (2003). [CrossRef]
- T. Wang, X. Hu and S. Dong, J. Phys. Chem. B, 110, 16930-16936 (2006). [CrossRef]
- R. Liu, S. Li and J.-F. Liu, TrAC Trends Anal. Chem. (2017). [CrossRef]
- B. Kuestner, M. Gellner, M. Schuetz, F. Schoeppler, A. Marx, P. Stroebel, P. Adam, C. Schmuck and S. Schluecker, Angew. Chem., Int. Ed., 48, 1950-1953 (2009). [CrossRef]
- X. Qian, X.-H. Peng, D.O. Ansari, Q. Yin-Goen, G.Z. Chen, D.M. Shin, L. Yang, A.N. Young, M.D. Wang and S. Nie, Nat. Biotechnol., 26, 83 (2008). [CrossRef]
- S. Suvarna, U. Das, K. Sunil, S. Mishra, M. Sudarshan, K.D. Saha, S. Dey, A. Chakraborty and Y. Narayana, PloS one, 12, e0178202 (2017). [CrossRef]
- S. Pang, (2016).
- D.A. Stuart, C.R. Yonzon, X. Zhang, O. Lyandres, N.C. Shah, M.R. Glucksberg, J.T. Walsh and R.P. Van Duyne, Anal. Chem., 77, 4013-4019 (2005). [CrossRef]
- D.A. Stuart, J.M. Yuen, N. Shah, O. Lyandres, C.R. Yonzon, M.R. Glucksberg, J.T. Walsh and R.P. Van Duyne, Analytical chemistry, 78, 7211-7215 (2006). [CrossRef]
- O. Lyandres, N.C. Shah, C.R. Yonzon, J.T. Walsh, M.R. Glucksberg and R.P. Van Duyne, Analytical chemistry, 77, 6134-6139 (2005). [CrossRef]
- C.R. Yonzon, C.L. Haynes, X. Zhang, J.T. Walsh and R.P. Van Duyne, Analytical Chemistry, 76, 78-85 (2004). [CrossRef]
- C.S. Levin, S.W. Bishnoi, N.K. Grady and N.J. Halas, Anal. Chem., 78, 3277-3281 (2006). [CrossRef]
- S. Yadav, M.A. Sadique, P. Ranjan, N. Kumar, A. Singhal, A.K. Srivastava and R. Khan, ACS Applied Bio Materials, 4, 2974-2995 (2021). [CrossRef]
- C. Awada, M.M.B. Abdullah, H. Traboulsi, C. Dab and A. Alshoaibi, Sensors, 21, 4617 (2021). [CrossRef]
- X. Ling, L. Xie, Y. Fang, H. Xu, H. Zhang, J. Kong, M.S. Dresselhaus, J. Zhang and Z. Liu, Nano letters, 10, 553-561 (2010). [CrossRef]
- S. Xu, S. Jiang, J. Wang, J. Wei, W. Yue and Y. Ma, Sensors and Actuators B: Chemical, 222, 1175-1183 (2016). [CrossRef]
- W. Xu, J. Xiao, Y. Chen, Y. Chen, X. Ling and J. Zhang, Advanced Materials, 25, 928-933 (2013). [CrossRef]
- Y. Du, Y. Zhao, Y. Qu, C.-H. Chen, C.-M. Chen, C.-H. Chuang and Y. Zhu, Journal of Materials Chemistry C, 2, 4683-4691 (2014). [CrossRef]
- A.C. Ferrari, J.C. Meyer, V. Scardaci, C. Casiraghi, M. Lazzeri, F. Mauri, S. Piscanec, D. Jiang, K.S. Novoselov and S. Roth, Physical review letters, 97, 187401 (2006). [CrossRef]
- L.M. Malard, M.A. Pimenta, G. Dresselhaus and M.S. Dresselhaus, Physics reports, 473, 51-87 (2009). [CrossRef]
- Y.-F. Lu, S.-T. Lo, J.-C. Lin, W. Zhang, J.-Y. Lu, F.-H. Liu, C.-M. Tseng, Y.-H. Lee, C.-T. Liang and L.-J. Li, ACS nano, 7, 6522-6532 (2013). [CrossRef]
- M. Rybin, A. Pereyaslavtsev, T. Vasilieva, V. Myasnikov, I. Sokolov, A. Pavlova, E. Obraztsova, A. Khomich, V. Ralchenko and E. Obraztsova, Carbon, 96, 196-202 (2016). [CrossRef]
- A. Jilani, M.H.D. Othman, M.O. Ansari, S.Z. Hussain, A.F. Ismail, I.U. Khan and Inamuddin, Environmental chemistry letters, 16, 1301-1323 (2018). [CrossRef]
- L. Al-qarn and Z. Iqbal, European Pharmaceutical Review, 22, 23-26 (2017).
- J. Turkevich, Gold Bulletin, 18, 86-91 (1985). [CrossRef]
- G. Frens, Nature physical science, 241, 20-22 (1973). [CrossRef]
- Z.Y. E.M. Benchafia, G. Yuan, T. Chou, H. Piao, X. Wang, Z. Iqbal. Cubic gauche polymeric nitrogen under ambient conditions. Nat. Communications. 8(1) (2017) 930. [CrossRef]
- C.L. Haynes and R.P. Van Duyne, MRS Online Proceedings Library (OPL), 728, S10. 7 (2002). [CrossRef]
- L. Ascherl, T. Sick, J.T. Margraf, S.H. Lapidus, M. Calik, C. Hettstedt, K. Karaghiosoff, M. Döblinger, T. Clark and K.W. Chapman, Nature Chemistry, 8, 310-316 (2016). [CrossRef]
- S.R. Maple and A. Allerhand, Journal of the American Chemical Society, 109, 3168-3169 (1987). [CrossRef]
- Q. Hao, S.M. Morton, B. Wang, Y. Zhao, L. Jensen and T. Jun Huang, Applied physics letters, 102 (2013). [CrossRef]
- M.A. Van Huis, L.T. Kunneman, K. Overgaag, Q. Xu, G. Pandraud, H.W. Zandbergen and D. Vanmaekelbergh, Nano letters, 8, 3959-3963 (2008). [CrossRef]
- S.E. Bell and N.M. Sirimuthu, The Journal of Physical Chemistry A, 109, 7405-7410 (2005). [CrossRef]
- J.C. Love, L.A. Estroff, J.K. Kriebel, R.G. Nuzzo and G.M. Whitesides, Chemical reviews, 105, 1103-1170 (2005). [CrossRef]
- S. Suvarna, U. Das, S. Kc, S. Mishra, M. Sudarshan, K.D. Saha, S. Dey, A. Chakraborty and Y. Narayana, PloS one, 12, e0178202 (2017). [CrossRef]
- F. Benetti, M. Fedel, L. Minati, G. Speranza and C. Migliaresi, Journal of nanoparticle research, 15, 1-9 (2013).
- C. Munro, W. Smith, M. Garner, J. Clarkson and P. White, Langmuir, 11, 3712-3720 (1995). [CrossRef]
- F. Porcaro, Y. Miao, R. Kota, J. Haun, G. Polzonetti, C. Battocchio and E. Gratton, Langmuir, 32, 13409-13417 (2016). [CrossRef]
- J. Pulit and M. Banach, Digest Journal of Nanomaterials & Biostructures (DJNB), 8 (2013).
- G.V. Bianco, M.M. Giangregorio, M. Losurdo, A. Sacchetti, P. Capezzuto and G. Bruno, Journal of Nanomaterials, 2016, 9-9 (2016). [CrossRef]
- M.E. Ayhan and N. Emeller, Fullerenes, Nanotubes and Carbon Nanostructures, 32, 223-231 (2024).
- P.A. Pandey, G.R. Bell, J.P. Rourke, A.M. Sanchez, M.D. Elkin, B.J. Hickey and N.R. Wilson, Small, 7, 3202-3210 (2011). [CrossRef]
- L.S. Alqarni and M.D. Alghamdi, Journal of Science: Advanced Materials and Devices, 101015 (2025). [CrossRef]
- R.A. Alzahrani, F.G. Alhaddad, E.O. Alshammari, F.S. Alsowaileh, M.D. Alghamdi, A. Modwi, N.G. Mohamed and L.S. Alqarni, Journal of Science: Advanced Materials and Devices, 100964 (2025). [CrossRef]
- F.-r. MA, K. LIU, Y. ZHANG and S. PAN, The Journal of Light Scattering, 1, 002 (2007).
- L. Alqarni, (New Jersey Institute of Technology: 2019).
- T. Kostadinova, N. Politakos, A. Trajcheva, J. Blazevska-Gilev and R. Tomovska, Molecules, 26, 4775 (2021). [CrossRef]
- X. Liu, T. Li, Y. Han, Y. Sun, A. Zada, Y. Liu, J. Chen and A. Dang, Applied Surface Science, 654, 159513 (2024). [CrossRef]
Figure 1.
Schematic overview diagram showing steps in the preparation of the three modified SERS substrates used in this work: (a) Au coated graphene nanoplatelet substrate, (b) Au coated graphene nanoplatelet substrate + TEG-partition layer, and (c) Nitrogen/argon-radio frequency plasma irradiated nanoplatelet substrate followed by Au and TEG-partition layer depositions.
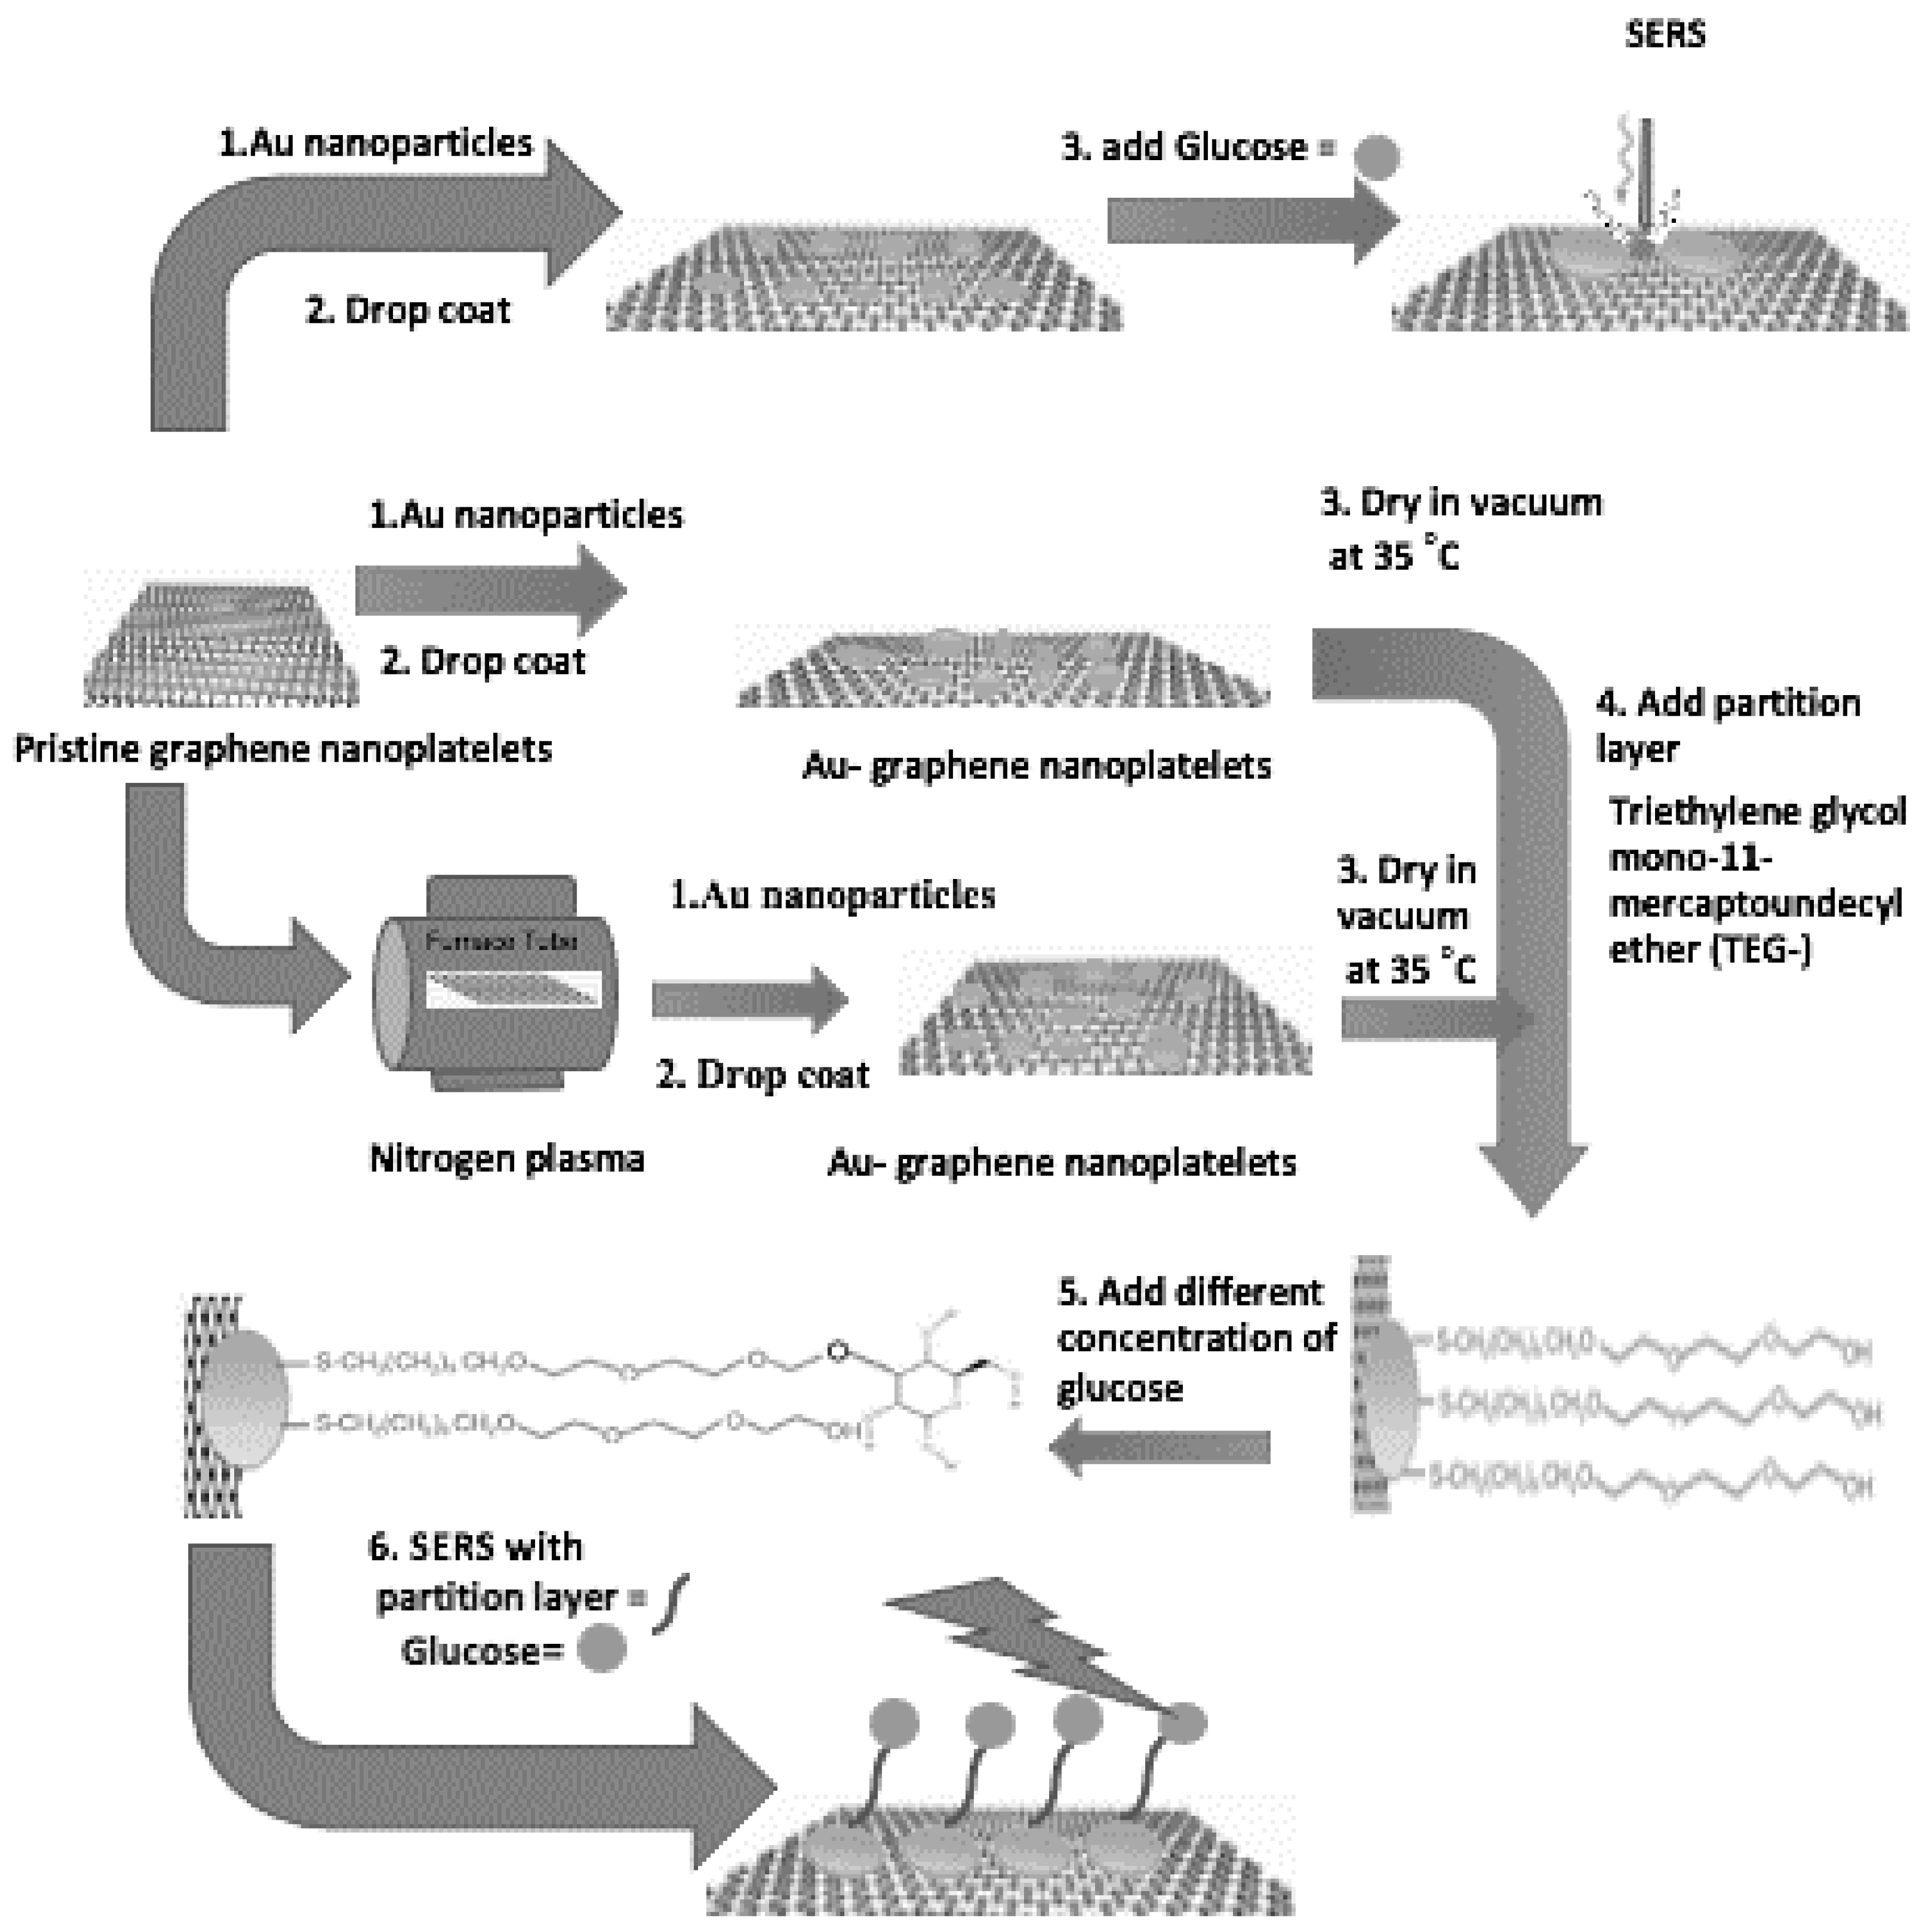
Figure 2.
(a) Normal Raman spectrum from a pristine graphene nanoplatelet (GNP); (b) and (c) show normal Raman spectra from two randomly selected defected locations on the GNPs after RF plasma treatment. The spectra were recorded using 532 nm laser excitation with laser power =10 mW, acquisition time = 45s, 50x microscope objective, and 0.50 µm spectrometer slits. .
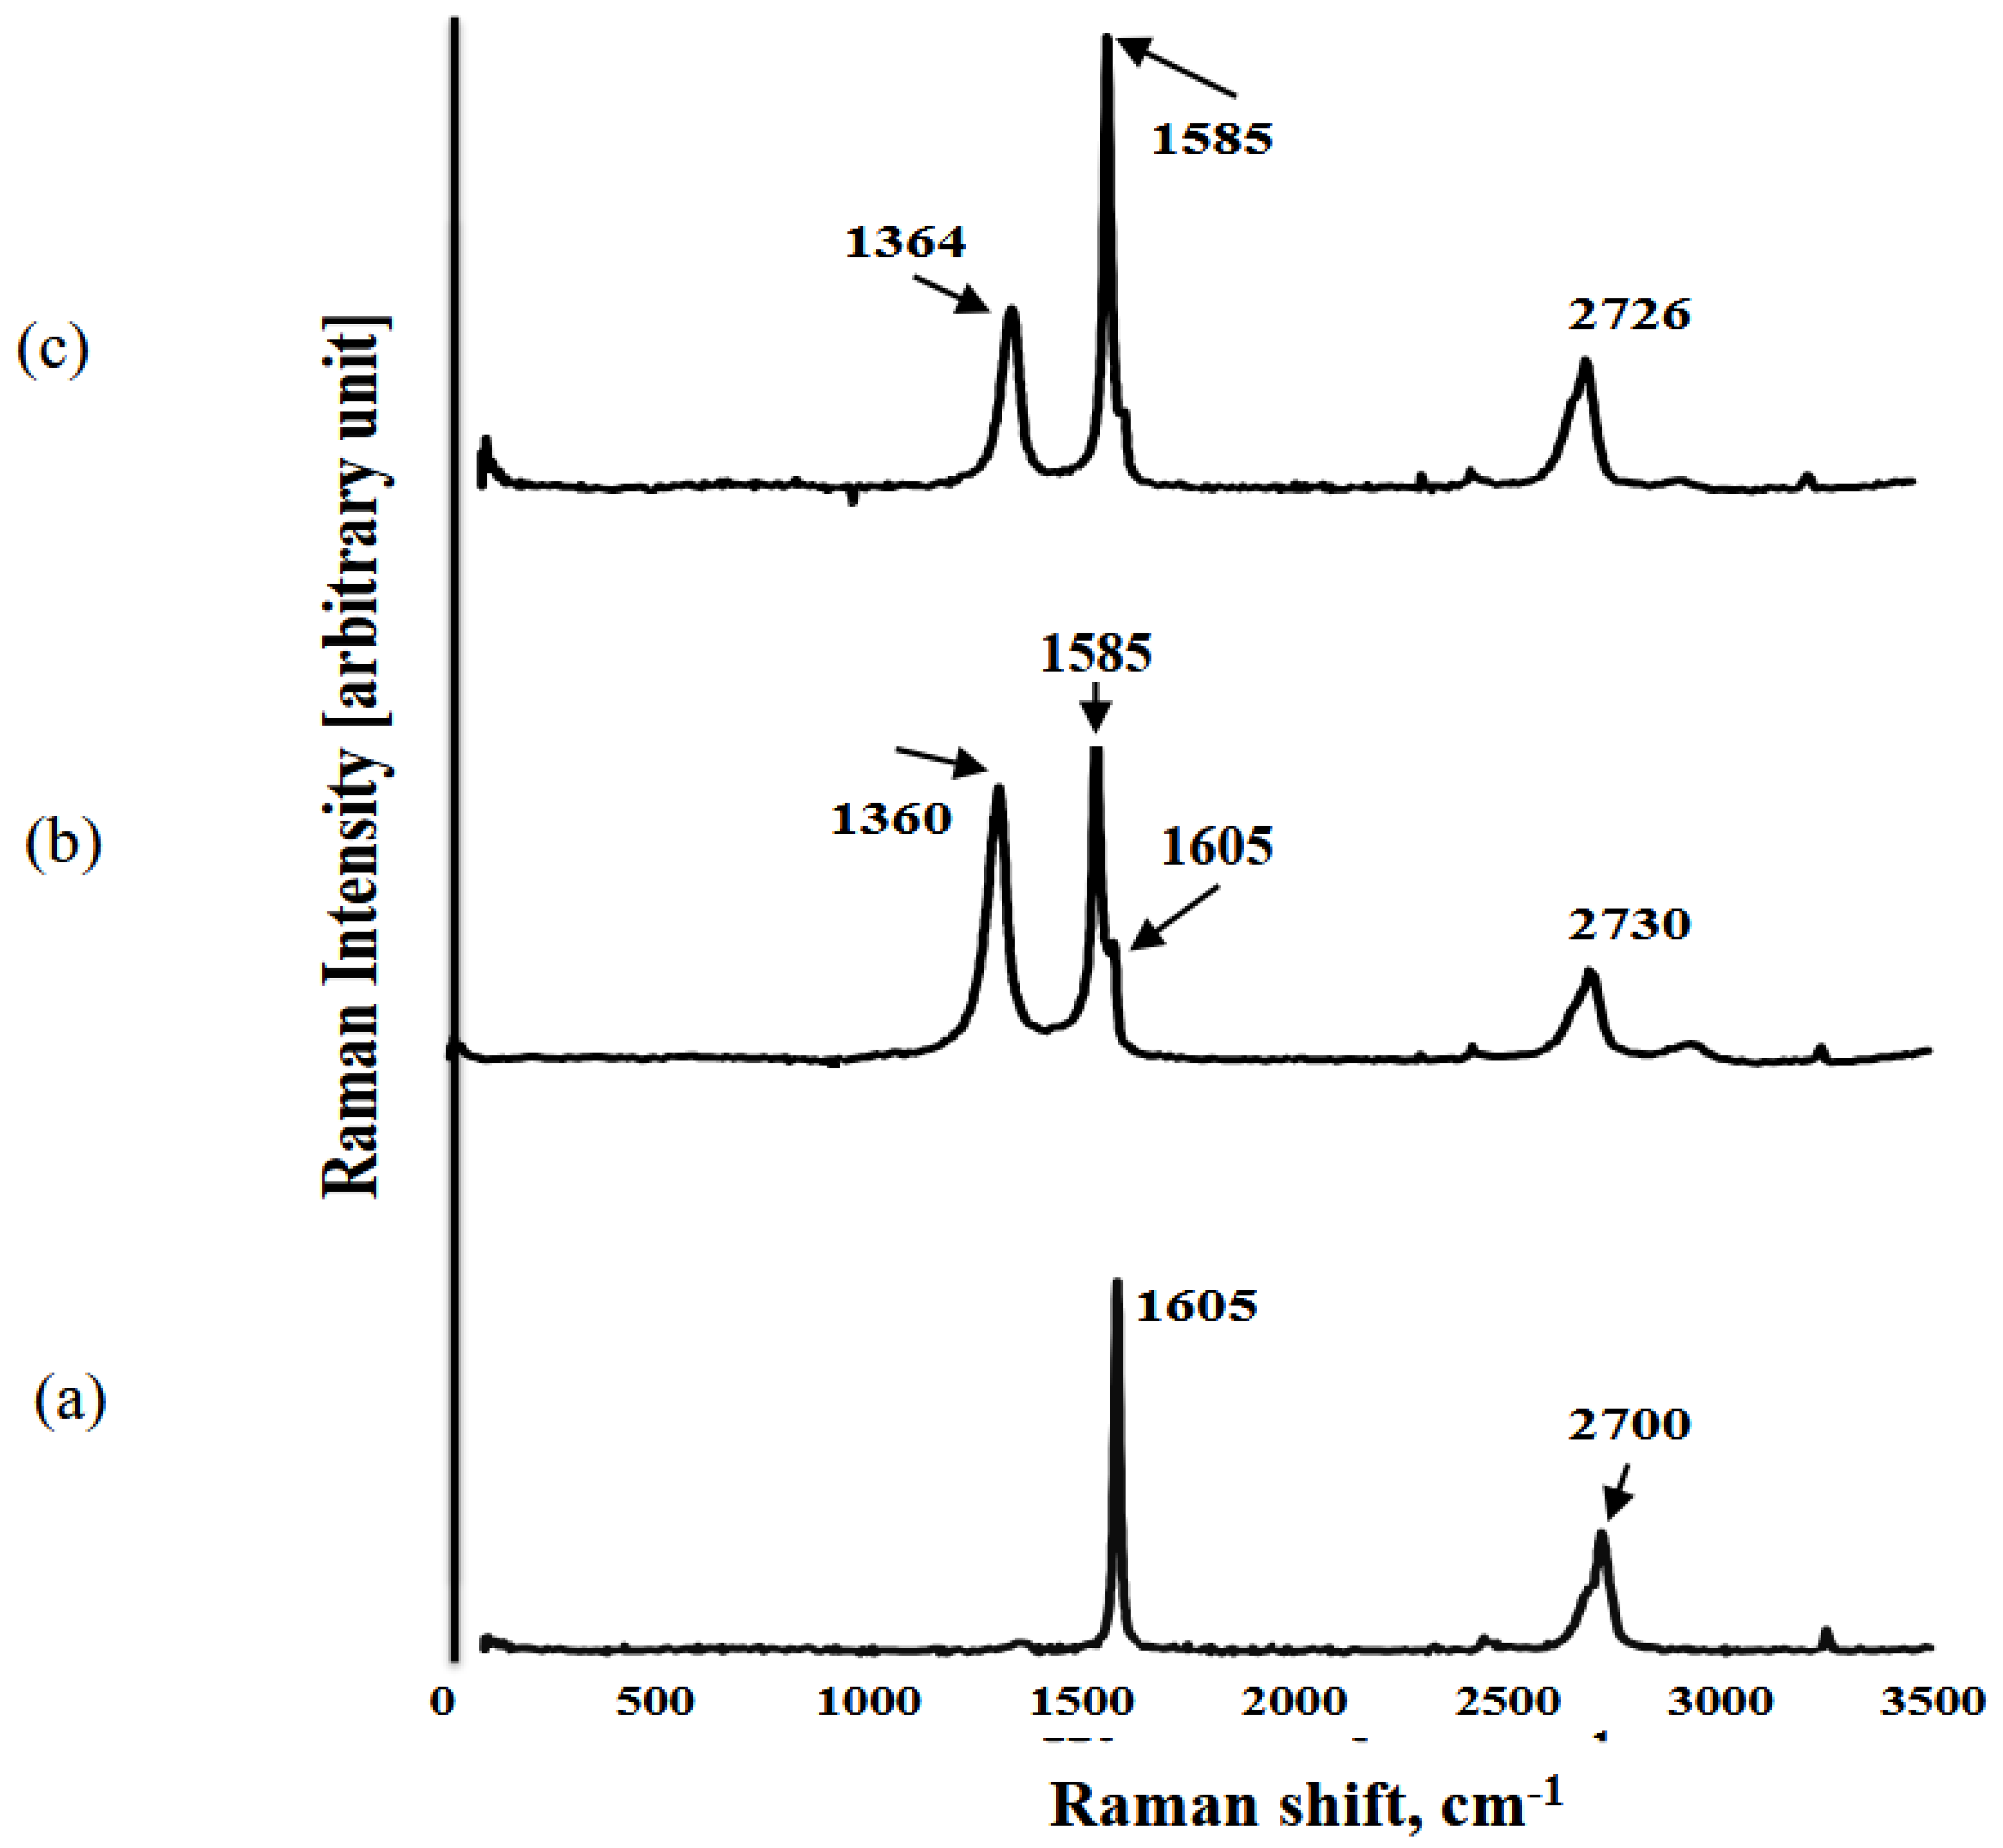
Figure 3.
(a) Top down SEM image of a pristine graphene nanoplatelet (GNP) at a magnification of 46.3 K; (b) Top down SEM image showing a GNP coated with gold nanoparticles (indicated by arrows), at a magnification of 46.3 K; (c) Cross-sectional SEM image of a pristine GNP showing its multi-layer microstructure at a magnification of 25.0 K; (d) Cross-sectional image of a GNP after gold and TEG partition layer deposition, at a magnification of 1.0 K; (e) Top down SEM image at a magnification of 10.0 K of a gold nanoparticle coated GNP after partition layer deposition; (f and g) Top down SEM images of plasma-irradiated pristine GNP showing different areas– one area shown at 10.0 K magnification in image (f) and another area at a magnification of 15.0 K shown in image (g) where cracks indicated by arrows are evident on a plasma-irradiated GNP as discussed in the text. Scale bars are indicated on each of the images; (h) SEM image showing increased gold particle distribution between nanoplatelets (arrowed); and (i) Shows the energy dispersive spectrum (EDS) taken from the gold coated GNP similar to the pristine one shown in image (b), which corresponds to a gold content of 4.6%. .
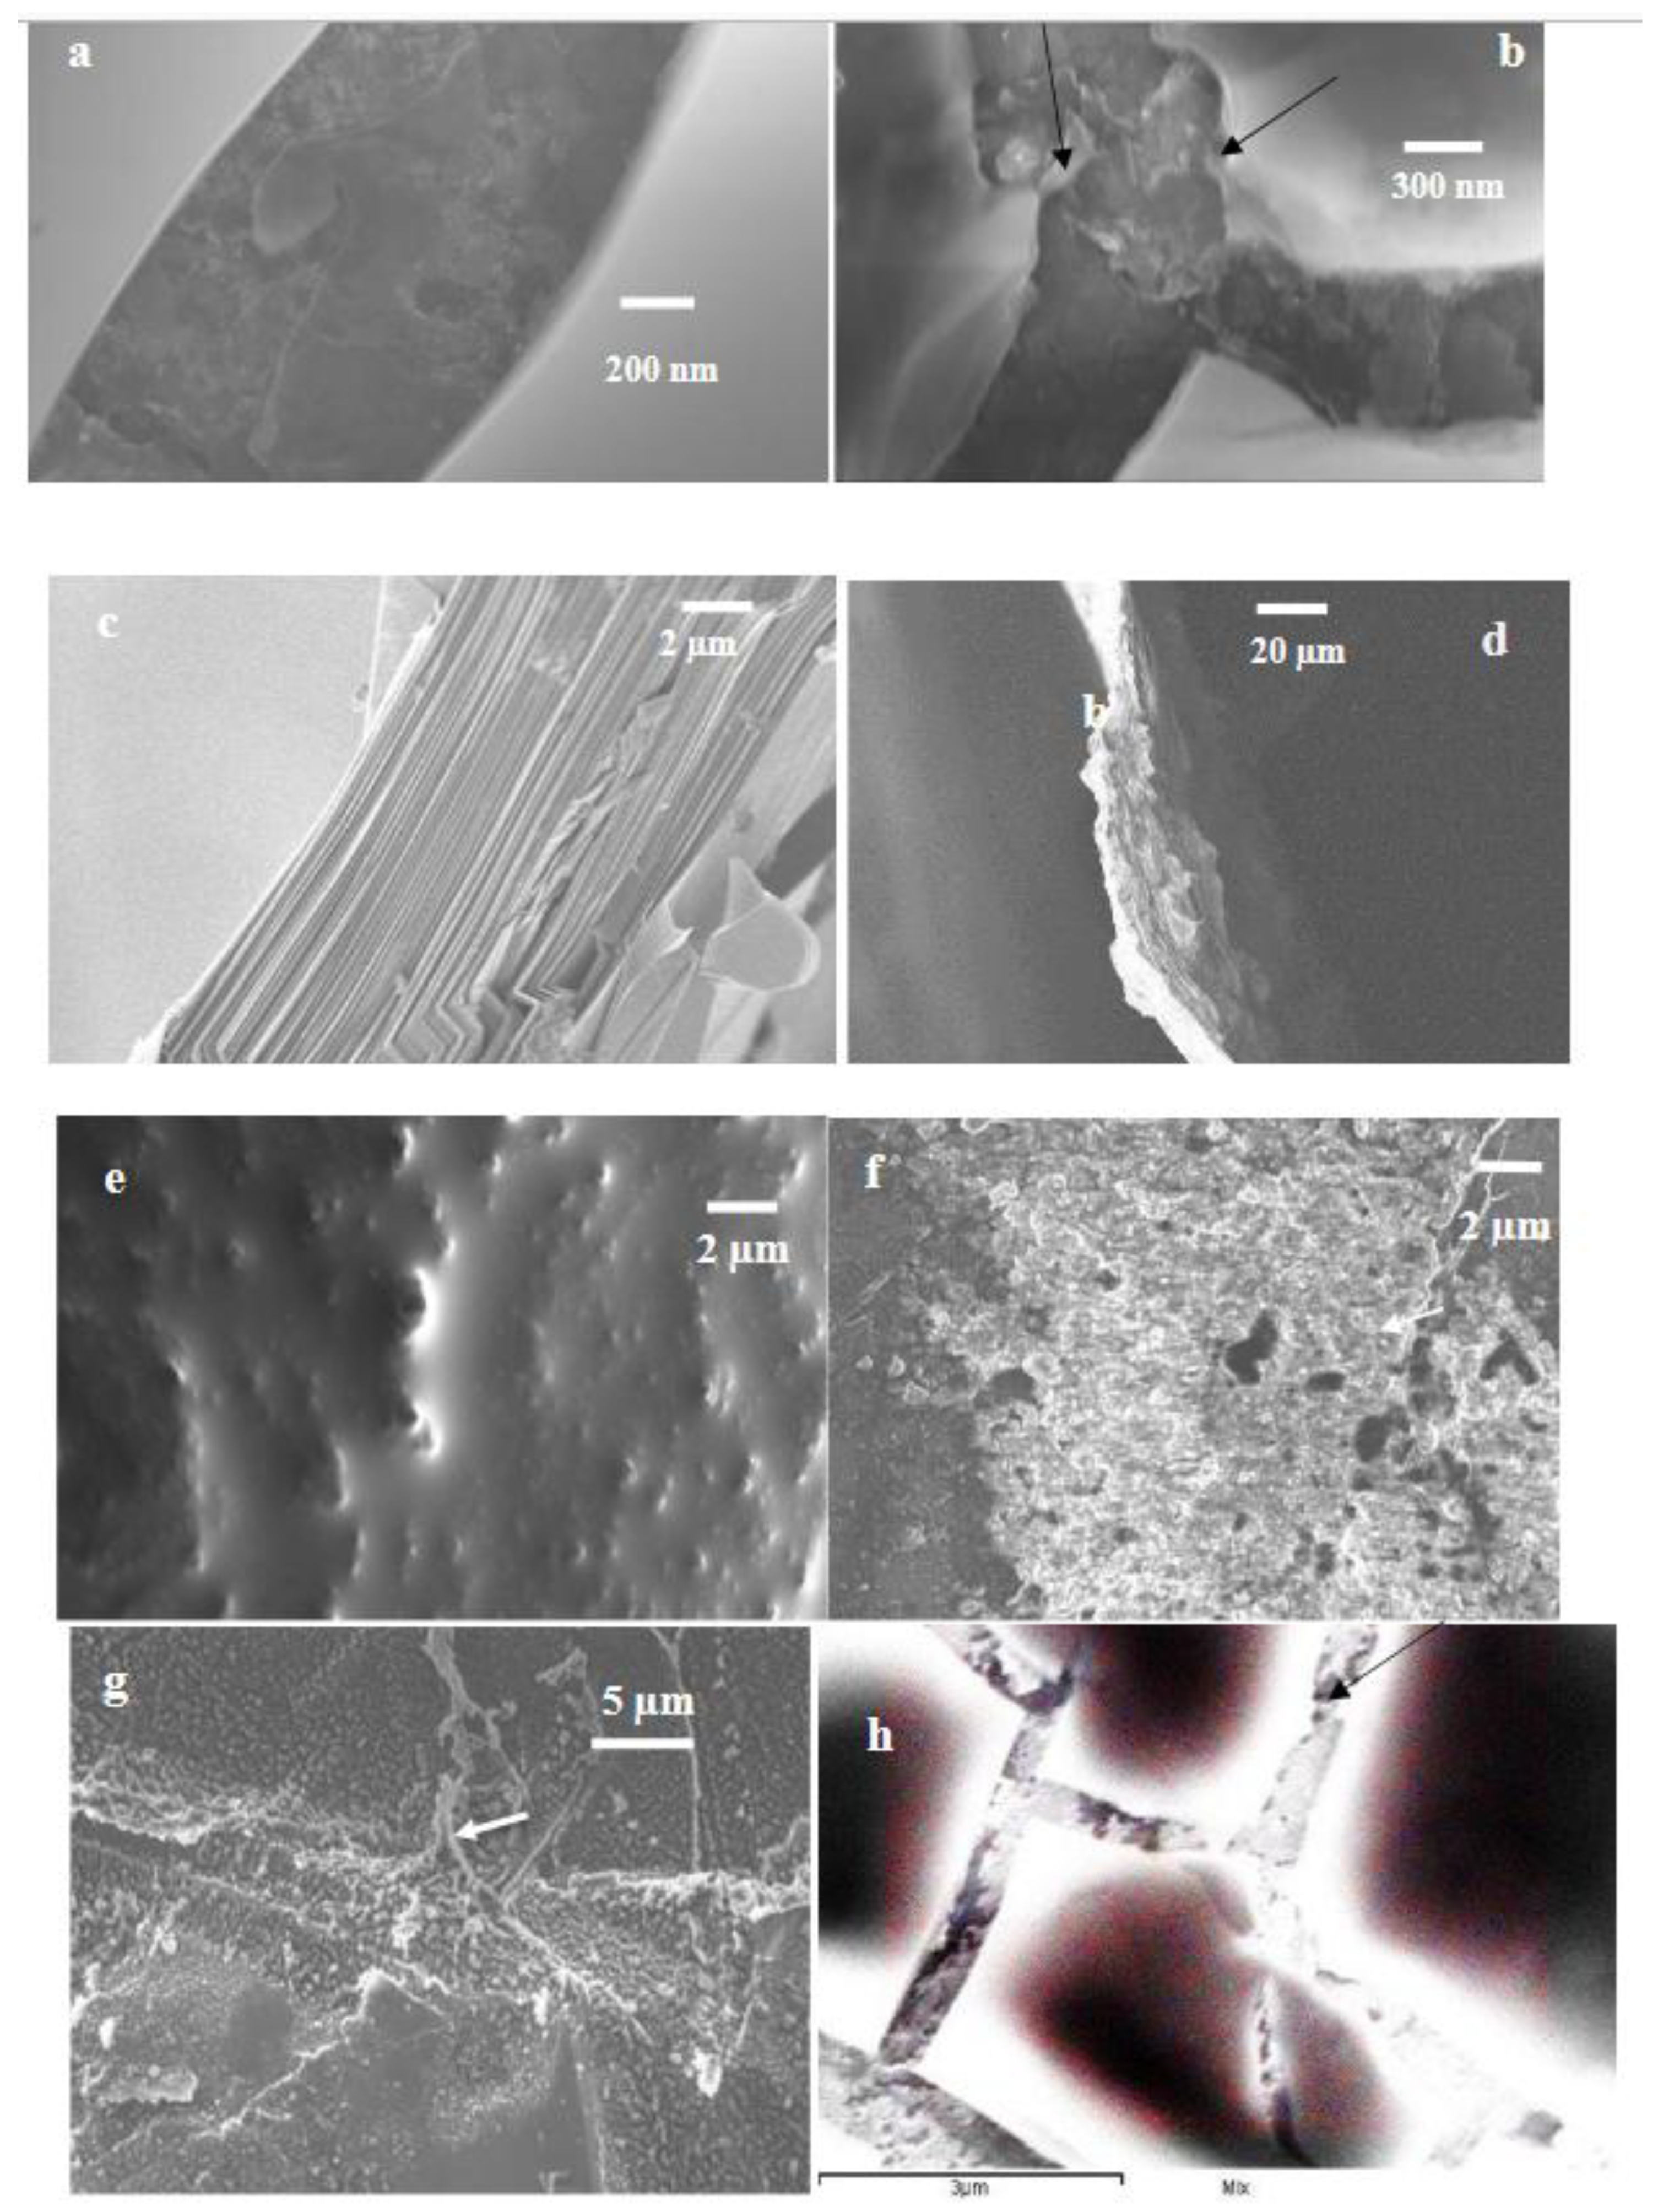
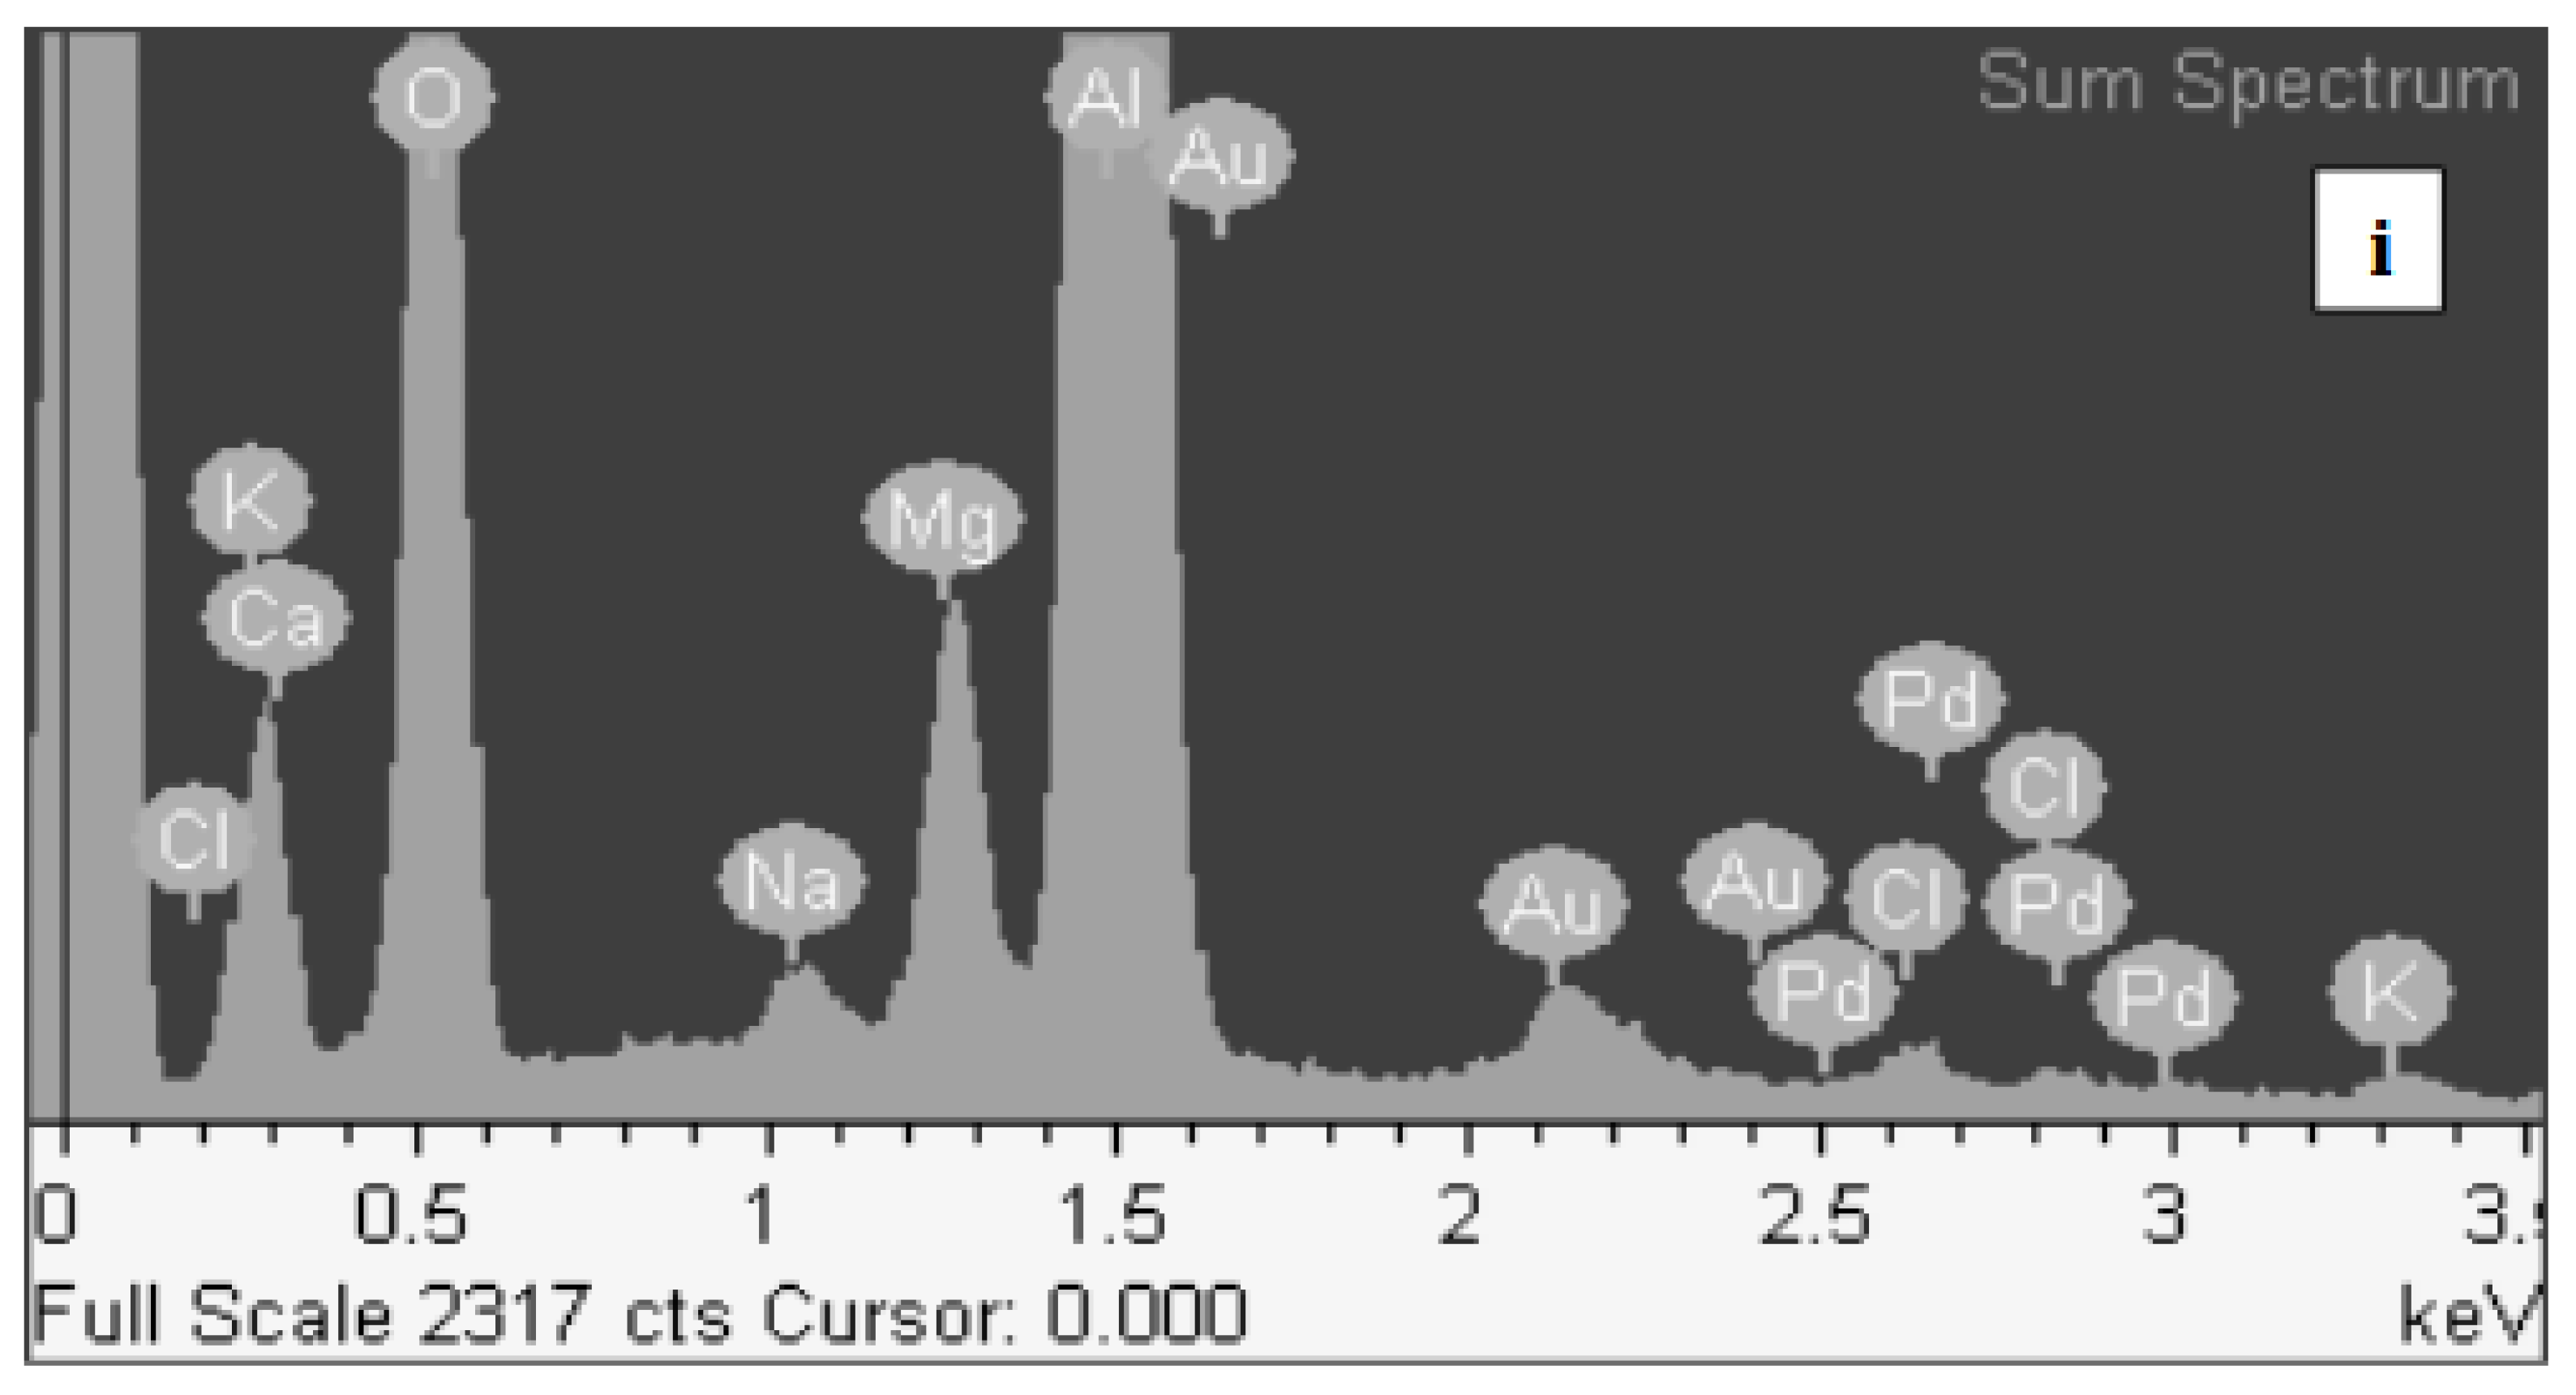
Figure 4.
(a) Normal Raman spectrum of pure crystalline glucose powder in the 400 to 1500 cm-1 fingerprint region; and (b) SERS for different aqueous concentrations of glucose on Au coated GNP substrates with laser excitation at λex=532nm, laser power=10mW, acquisition time = 45s. Lines marked with asterisks correspond to those in the Raman spectrum of crystalline glucose shown in 4(a). Line near 1600 cm-1 indicated by an arrow is due to the parasitic appearance of the graphene G line from the GNP substrate due to the porosity of the analyte film (see Figure 2a). .
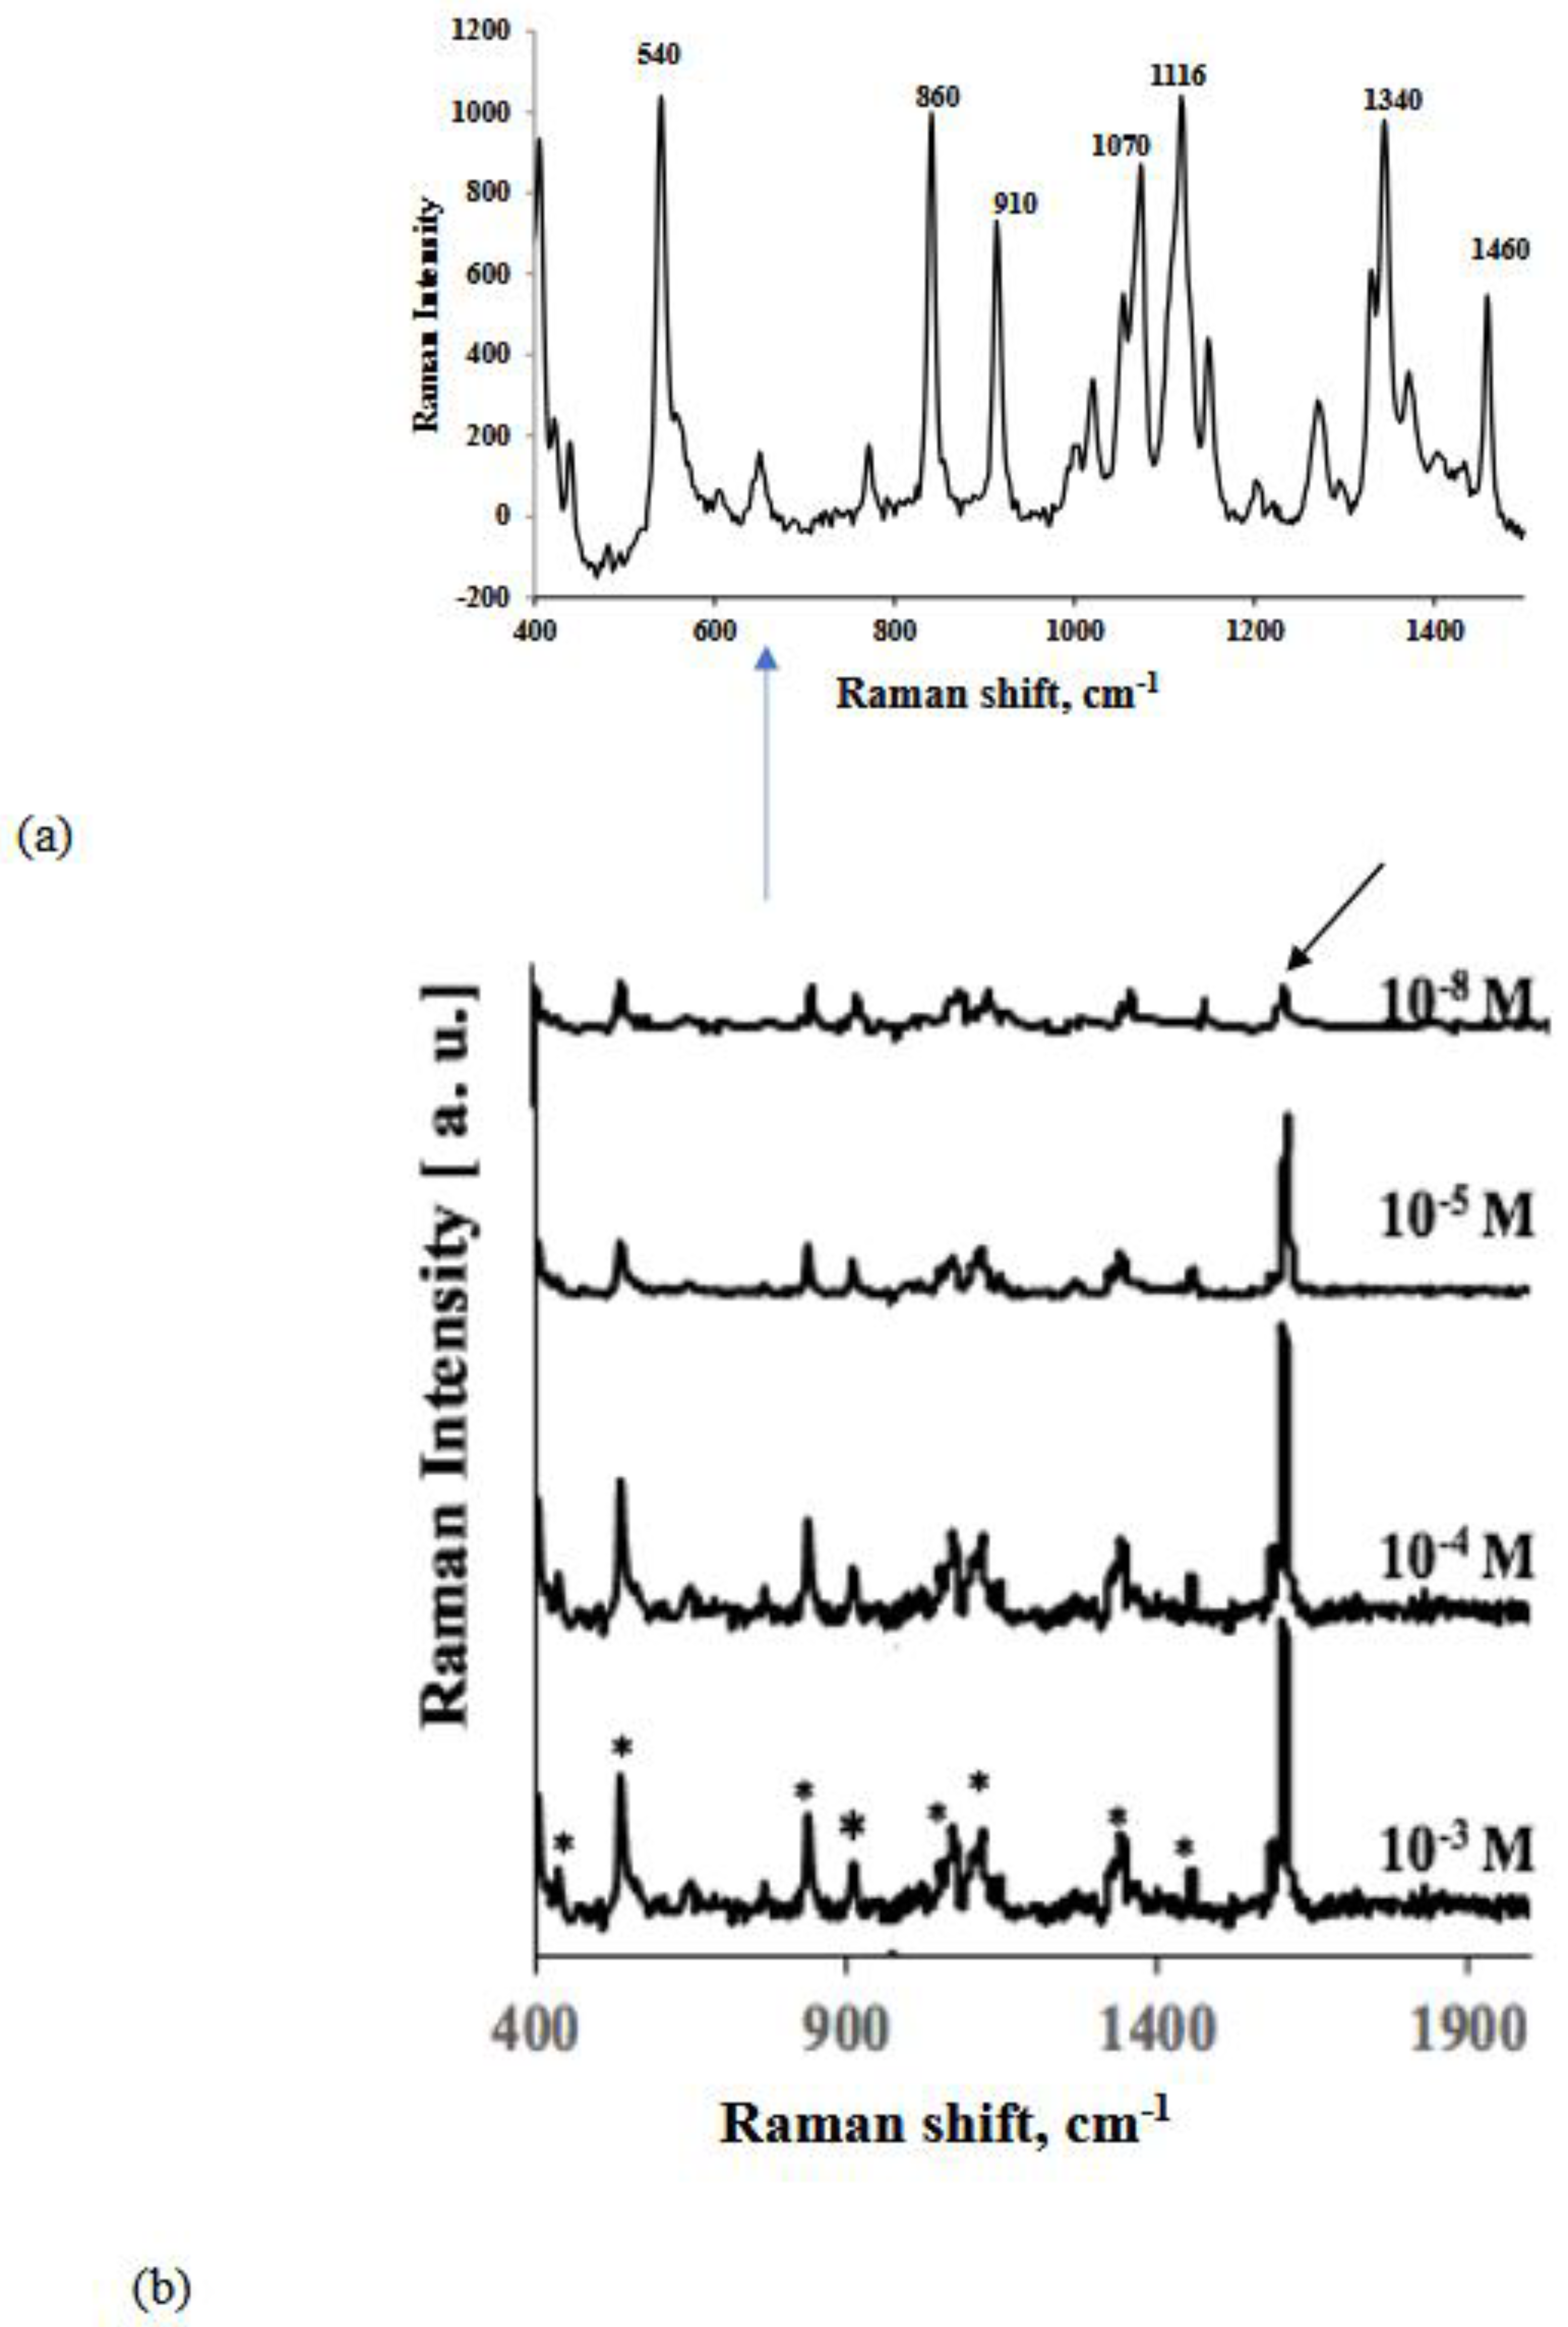
Figure 5.
a) Raman spectrum for Triethylene glycol mono-11-mercaptoundecyl ether (TEG) on graphene nanoplatelet (GNP) substrates using 780 laser for an acquisition time of 30s, b) SERS for different concentrations of glucose on Au/GNP substrates with partition layer using λex=532nm with laser power=10 mW, and acquisition times for the different concentrations from 10-1 to 10-10M at 10, 20, 30, 45, 60, 70 and 90 s respectively. The peaks shown with asterisks in the SERS spectrum for glucose concentration of 10-2 M corresponds to those in the Raman spectrum of crystalline glucose shown in Figure 4(a). The chemical structure of TEG- (triethylene glycol mono-11-mercaptoundecyl ether) is shown on top of the figure; c) SERS from 1×10⁻¹M glucose adsorbed on TEG-Au using λex=532nm, laser power=10mW, acquisition time=15 s, average of 3 scans taken as a function of time up to 4 weeks. Lines shown in the SERS spectrum at 402, 512, 835, 900, 1063, 1299, 1336 and 1449 cm-1 correspond to the fingerprint Raman lines of crystalline glucose, whereas the lines above 2000 cm-1 are associated with the C-H stretching vibrations of glucose. The strong line near 1600 cm-1 (arrowed for each spectral set) is from the GNP substrate.
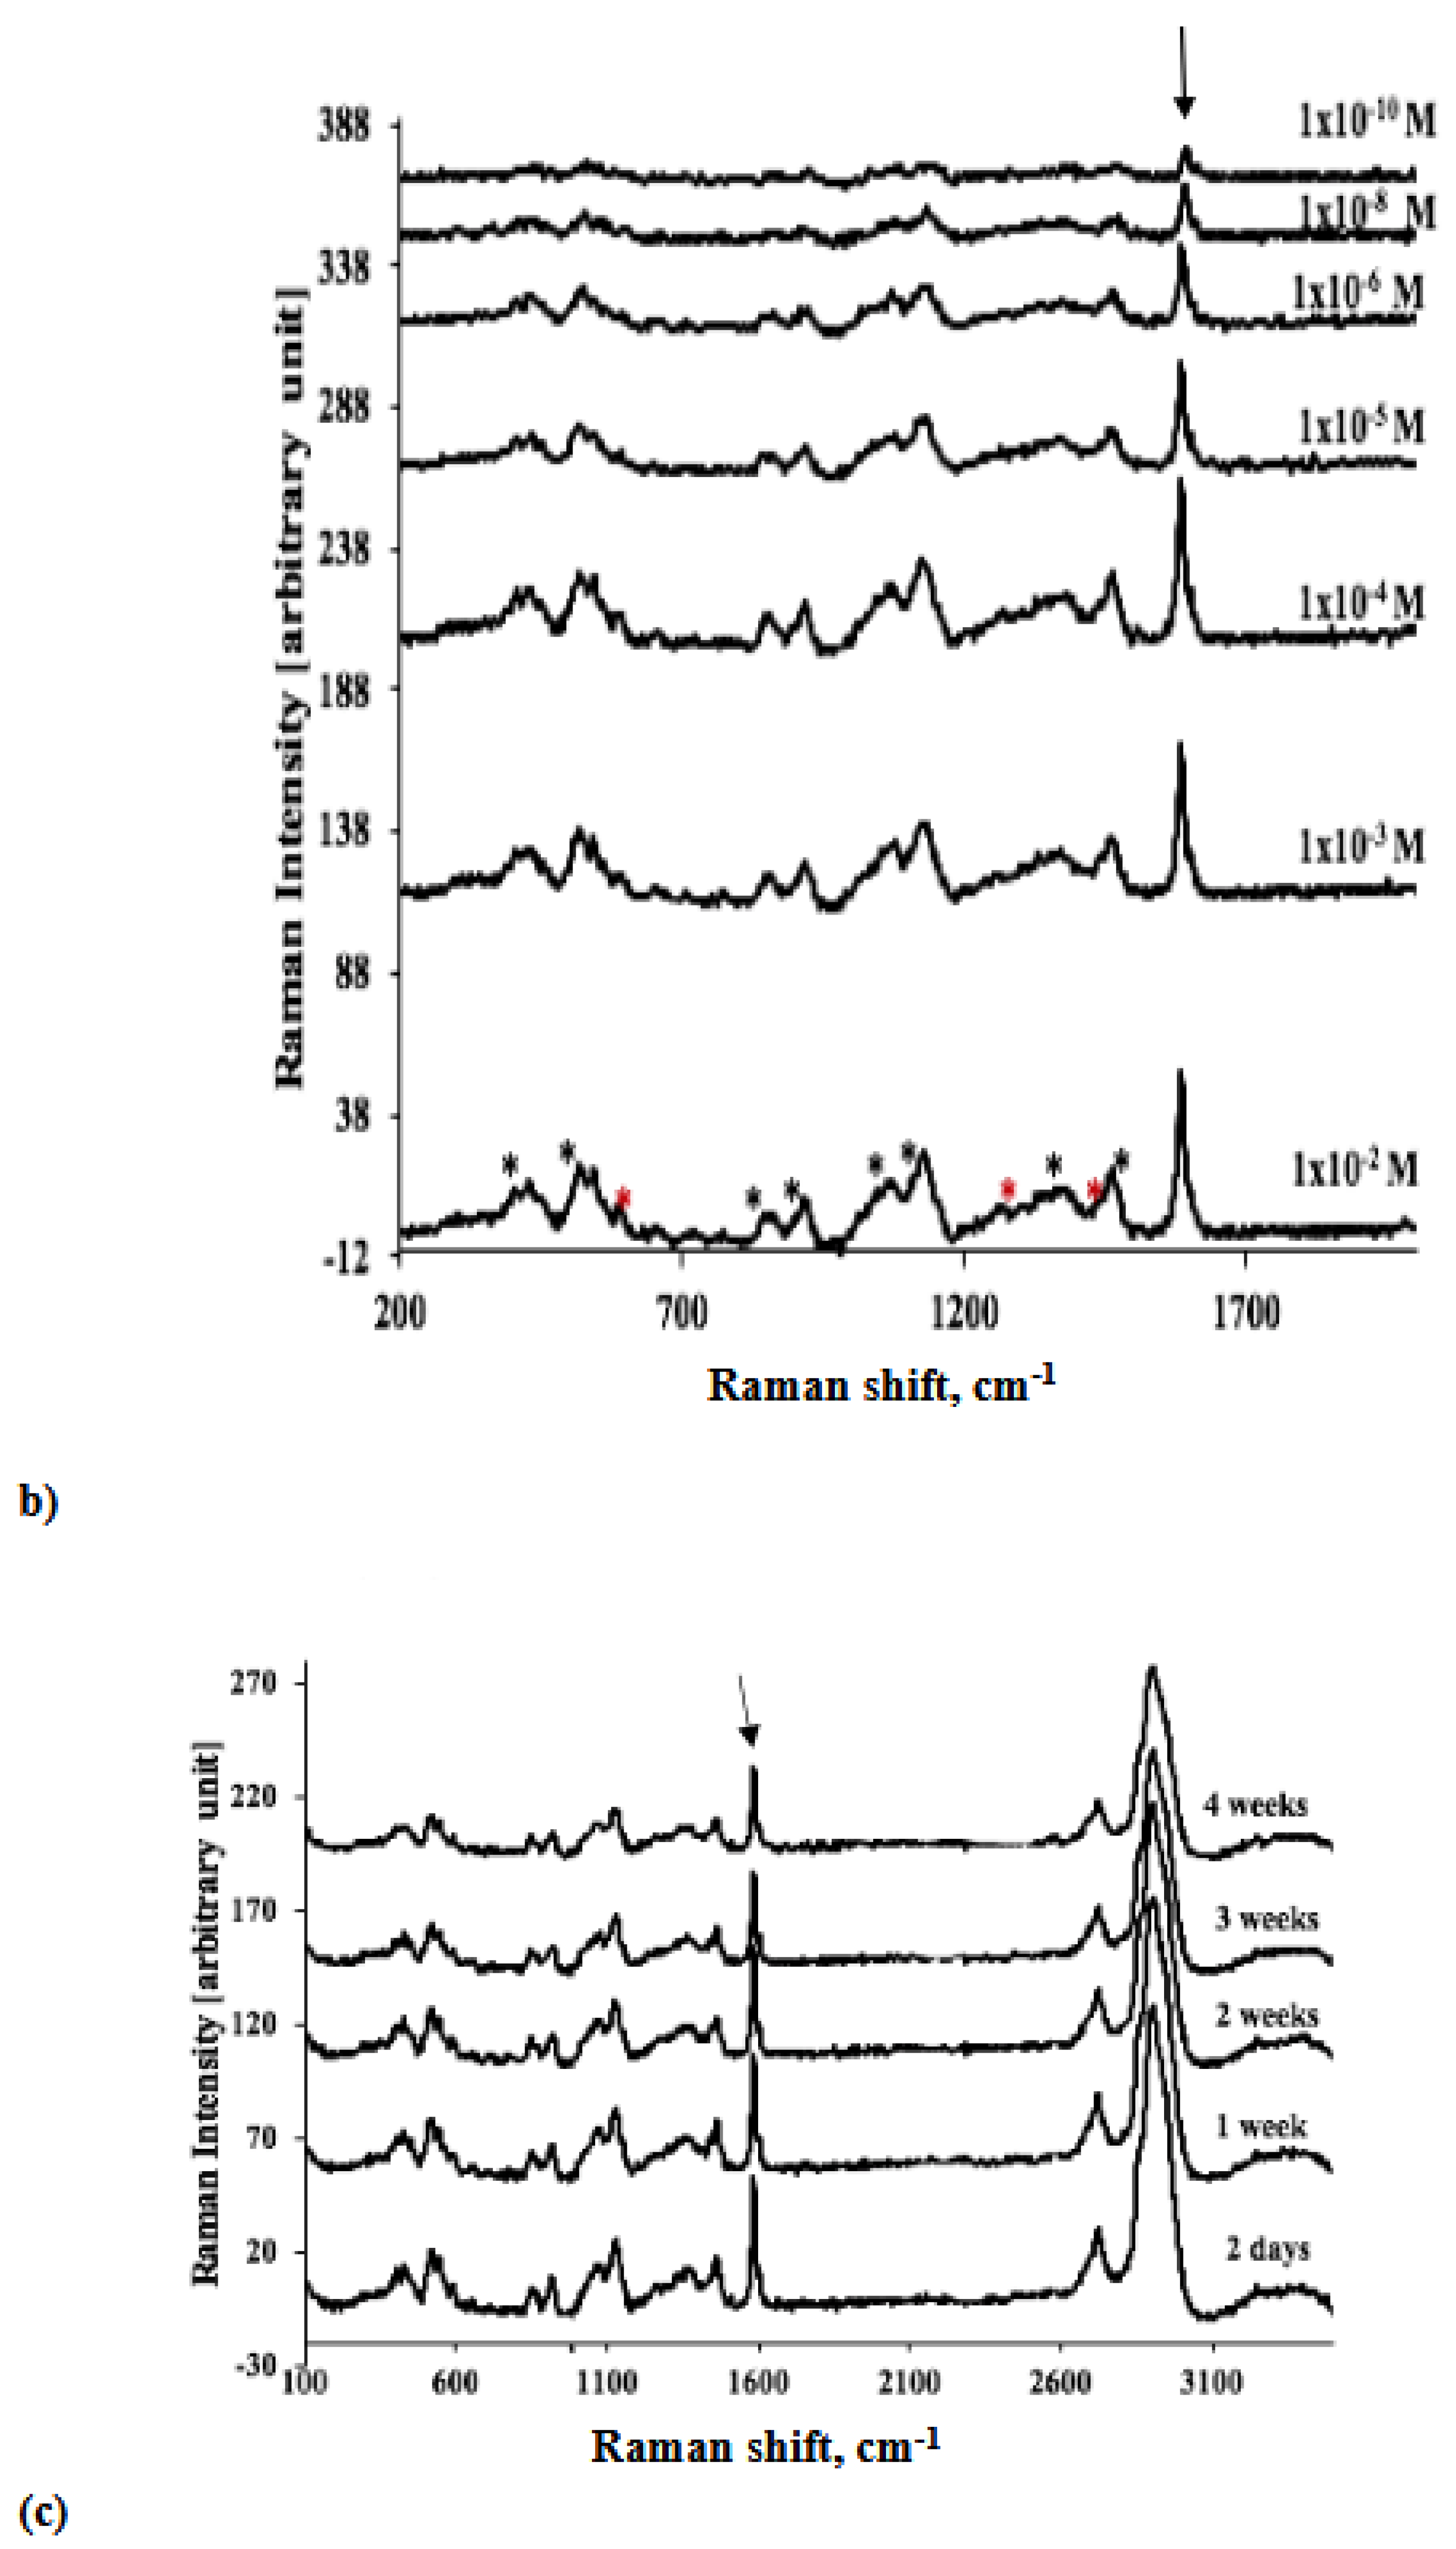
Figure 6.
SERS for different concentrations of glucose on Au/graphene nanoplatelet substrates with TEG- partition layer lines identified by red asterisks, after exposure of the pristine substrates to a nitrogen plasma. The Raman data were obtained using λex=532nm, laser power = 10mW and acquisition times = 15 s for 1 x 10⁻¹M glucose concentration, 20 s for 1x10⁻³ M glucose concentration, 30 s for 1x10⁻⁴ M glucose concentration , 40 s for 1x10⁻⁵M glucose concentration, 45 s for 1x10⁻⁶ M glucose concentration , 60 s for 1x10⁻⁸ M glucose concentration, 90 s for 1x10⁻¹⁰ M glucose concentration, and 120 s for 1x10-11M glucose concentration..
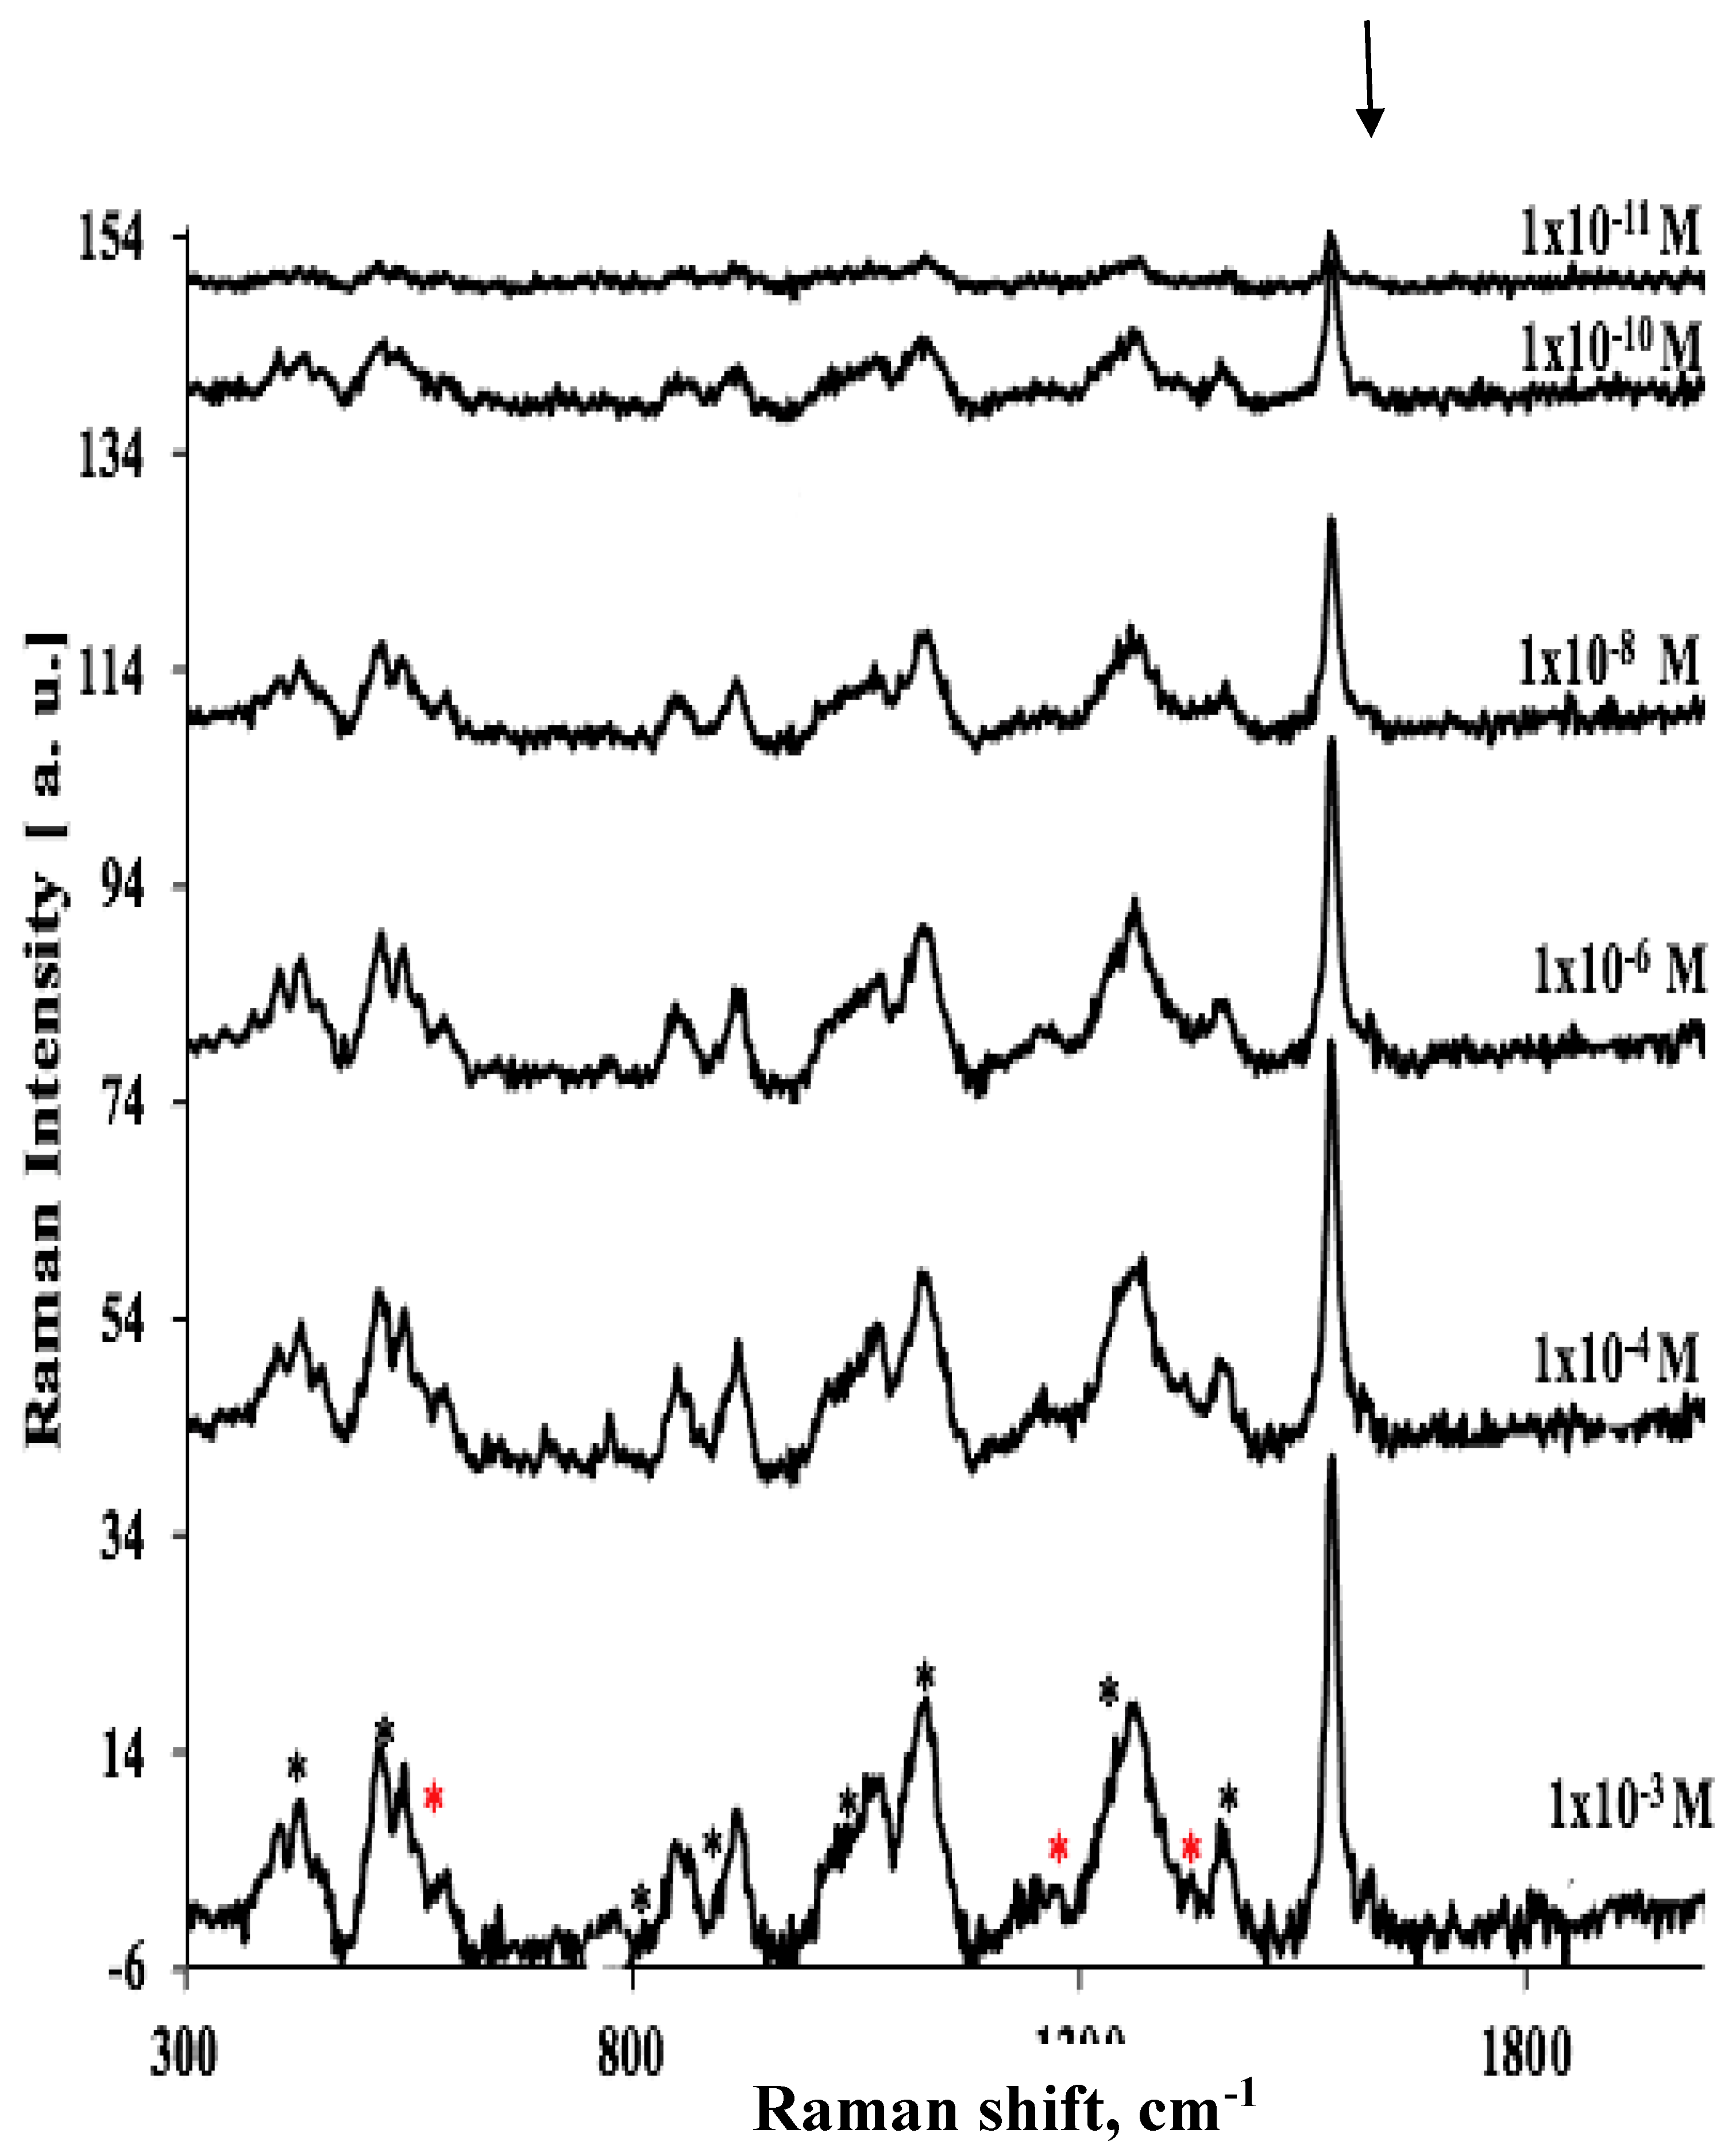

Table 1.
Lower limit of detection and enhancement factors for glucose by SERS on the three types of modified GNF substrates.
Table 1.
Lower limit of detection and enhancement factors for glucose by SERS on the three types of modified GNF substrates.
| Analyte/Substrate | Lower limit of detection | Enhancement Factors |
| Glucose/Au GNP substrate | 1x10⁻⁸ M | 2.4x10⁹ |
| Glucose/TEG-/Au GNP substrate | 1x10⁻¹⁰M | 5.5x10¹¹ |
| Glucose/TEG-/Au GNP substrate after plasma treatment | 1x10-11M | 6.4x10¹² |
Disclaimer/Publisher’s Note: The statements, opinions and data contained in all publications are solely those of the individual author(s) and contributor(s) and not of MDPI and/or the editor(s). MDPI and/or the editor(s) disclaim responsibility for any injury to people or property resulting from any ideas, methods, instructions or products referred to in the content. |
© 2025 by the authors. Licensee MDPI, Basel, Switzerland. This article is an open access article distributed under the terms and conditions of the Creative Commons Attribution (CC BY) license (http://creativecommons.org/licenses/by/4.0/).
Copyright: This open access article is published under a Creative Commons CC BY 4.0 license, which permit the free download, distribution, and reuse, provided that the author and preprint are cited in any reuse.


