Submitted:
23 November 2025
Posted:
24 November 2025
You are already at the latest version
Abstract
Atmospheric rivers (ARs) bring much of the winter precipitation to the western United States and are important for water supply and flood hazards. This study analyzes the clustering of ARs and evaluates how seasonal cycles and climate modes influence their frequency and spacing. Daily precipitation records and reanalysis data from 1980–2021 were used to detect ARs with an integrated vapor transport threshold, and events were grouped when two or more ARs occurred within a 7-day window. The results show that models capture the general occurrence of ARs but underestimate clustering by about 20–30%, with larger errors in winters affected by El Niño and La Niña. Sensitivity tests show that cluster measures depend on threshold and time window choices, while regional differences are linked to topography and circulation. The results suggest that persistence and spacing should be studied as separate measures, and that higher-resolution models are needed to represent narrow moisture plumes and rapid sequences. Although limited by dataset length and resolution, this study provides guidance for improving seasonal forecasts and for supporting water and flood management in AR-prone regions.
Keywords:
atmospheric rivers
; clustering
; seasonal cycles
; climate modes
; western United States
; precipitation extremes
; flood risk
1. Introduction
Atmospheric rivers (ARs) are narrow bands of strong water-vapor transport that deliver a substantial fraction of cool-season precipitation to the western United States and frequently trigger hydrological extremes, including floods and landslides [1]. Recent advances in AR detection and tracking have clarified their contribution to regional water supply and extreme precipitation statistics, supporting improved seasonal hydrological assessment [2]. A notable characteristic of AR behavior is temporal clustering—when multiple ARs arrive within a short period—intensifying flood hazards, reducing recovery time between storms, and complicating reservoir and emergency operations [3]. AR clustering is modulated by regional circulation and larger-scale modes of climate variability, such as the El Niño–Southern Oscillation (ENSO), Pacific Decadal Oscillation (PDO), and Madden–Julian Oscillation (MJO) [4]. During El Niño episodes, ARs tend to occur more frequently and with enhanced moisture flux along the U.S. West Coast, whereas La Niña phases are often associated with shifts in landfall latitude and event intensity [5]. Seasonal dependence is also evident: AR activity peaks during midwinter, and the probability of clustered sequences likewise increases during this period [6]. A recent study demonstrated that seasonality and major climate modes jointly shape the temporal clustering of unique ARs across the western United States, underscoring the need to account for both mechanisms in quantifying AR recurrence and related hydrologic impacts [7]. Despite progress, key gaps remain. Long observational records are limited and uneven across regions, constraining robust assessment of long-term clustering trends [8]. Further, differences among AR detection algorithms lead to divergent event counts and clustering statistics, hampering intercomparison [9]. Climate models and reanalyses often reproduce the mean frequency and landfall characteristics of ARs but still underestimate clustered sequences, particularly when modulated by ENSO, PDO, or MJO signals [10]. These biases reflect persistent challenges in representing synoptic- and mesoscale processes governing AR duration, propagation, and recurrence, thereby limiting the utility of current products for flood prediction and seasonal water-resource planning [11]. Clustering is especially relevant because short event spacing increases soil saturation and antecedent hydrologic loading, raising runoff efficiency and elevating flood risk beyond what can be explained by individual AR intensity alone [12]. The compounding nature of clustered ARs influences reservoir flood-control operations, snowpack evolution, and water-supply reliability—critical considerations in regions reliant on winter precipitation for seasonal storage [13]. Yet the interplay among climate modes, seasonal variability, and AR recurrence remains insufficiently characterized, particularly regarding systematic differences in spacing and persistence during El Niño versus La Niña winters [14].
This study provides a comprehensive assessment of how seasonal variability and major climate modes regulate the frequency, spacing, and persistence of AR clustering across the western United States. Using observational and reanalysis records, we quantify the sensitivity of clustering behavior to ENSO phases and seasonal transitions, and highlight how warm- and cool-phase conditions alter clustering characteristics. The study also evaluates implications for hydrological risk and predictive capability. By linking climate modes, seasonal structure, and AR recurrence, this work builds on prior regional analyses and offers new evidence supporting improved flood forecasting and water-resource planning under present and future climate variability.
2. Materials and Methods
2.1. Study Area and Data Samples
This study focuses on the western United States, where atmospheric rivers (ARs) are a primary source of winter precipitation and contribute strongly to hydrological extremes. A total of 42 years of daily precipitation data (1980–2021) were collected from NOAA gauge networks and supplemented with ERA5 reanalysis to ensure regional coverage. The dataset includes coastal and inland stations distributed across California, Oregon, and Washington. Sampling was restricted to the cool season from November to March, when AR activity is most frequent and clustering signals are strongest.
2.2. Experimental Design and Control Setup
The analysis was designed to compare clustering patterns across different seasonal phases and under contrasting climate modes. The “experiment group” was defined as years influenced by strong El Niño or La Niña conditions, based on Oceanic Niño Index thresholds of ±1.0. The “control group” included neutral years with no strong ENSO signal. This design allows the influence of ENSO to be isolated from internal variability. Additional stratification was applied to early winter (November–December) and mid-to-late winter (January–March) to examine seasonal dependence.
2.3. Measurement Methods and Quality Control
AR events were identified using an integrated vapor transport (IVT) threshold of 250 kg m-1 s-1 sustained over 24 hours, following recent detection standards. Events were linked into clusters when at least two ARs occurred within a 7-day moving window. Precipitation data underwent quality control by removing stations with more than 10% missing days per season and applying cross-validation with reanalysis fields. Outliers greater than three standard deviations from the seasonal mean were checked manually against nearby stations to ensure consistency.
2.4. Data Processing and Model Formulation
Clustering metrics were quantified using two measures: the mean cluster length (MCL), defined as the number of consecutive AR days, and the inter-event spacing (IES), defined as the days between AR events. Statistical relationships between climate modes and clustering indices were tested using linear regression and composite analysis. The regression model is expressed as [15]:
2.5. Methodological Rationale
The chosen metrics and thresholds follow established practices in AR research while addressing the specific focus on clustering. By combining observational and reanalysis data, the study balances temporal depth and spatial coverage. The separation of ENSO phases provides a natural experiment to evaluate climate forcing, while the use of MCL and IES captures both persistence and spacing of ARs. This approach ensures that clustering patterns are described in a way that is both physically meaningful and suitable for hydrological applications.
3. Results and Discussion
3.1. Overall Performance and Event Representation
The models reproduce the general frequency of atmospheric rivers (ARs) and the seasonal peak, but their ability to capture event spacing and persistence is weaker. Composite analysis shows that AR properties change with climate mode and season. Under El Niño and La Niña years, differences in landfall direction and near-coastal winds alter storm spacing and increase the chance of successive events. The contrast in wind direction and integrated vapor transport (IVT) between these phases is clear in Figure 1, and supports the view that clustering is more frequent in certain years even when seasonal totals are similar [17].
3.2. Sensitivity of Clustering Metrics
Tests show that clustering indices depend on the IVT threshold, the length of the grouping window, and the choice of climate index. A higher IVT threshold reduces the number of ARs but increases the average cluster length of remaining events. Expanding the grouping window from 5 to 7 days merges short gaps and yields longer clusters. When years are divided by ENSO or PDO phase, the baseline spacing between events also shifts. For example, El Niño winters favor landfalls in the south, which reduces spacing along parts of the coast, while neutral winters show wider variation. These outcomes show that persistence and spacing need to be reported separately to improve consistency across studies [18].
3.3. Regional and Physical Patterns
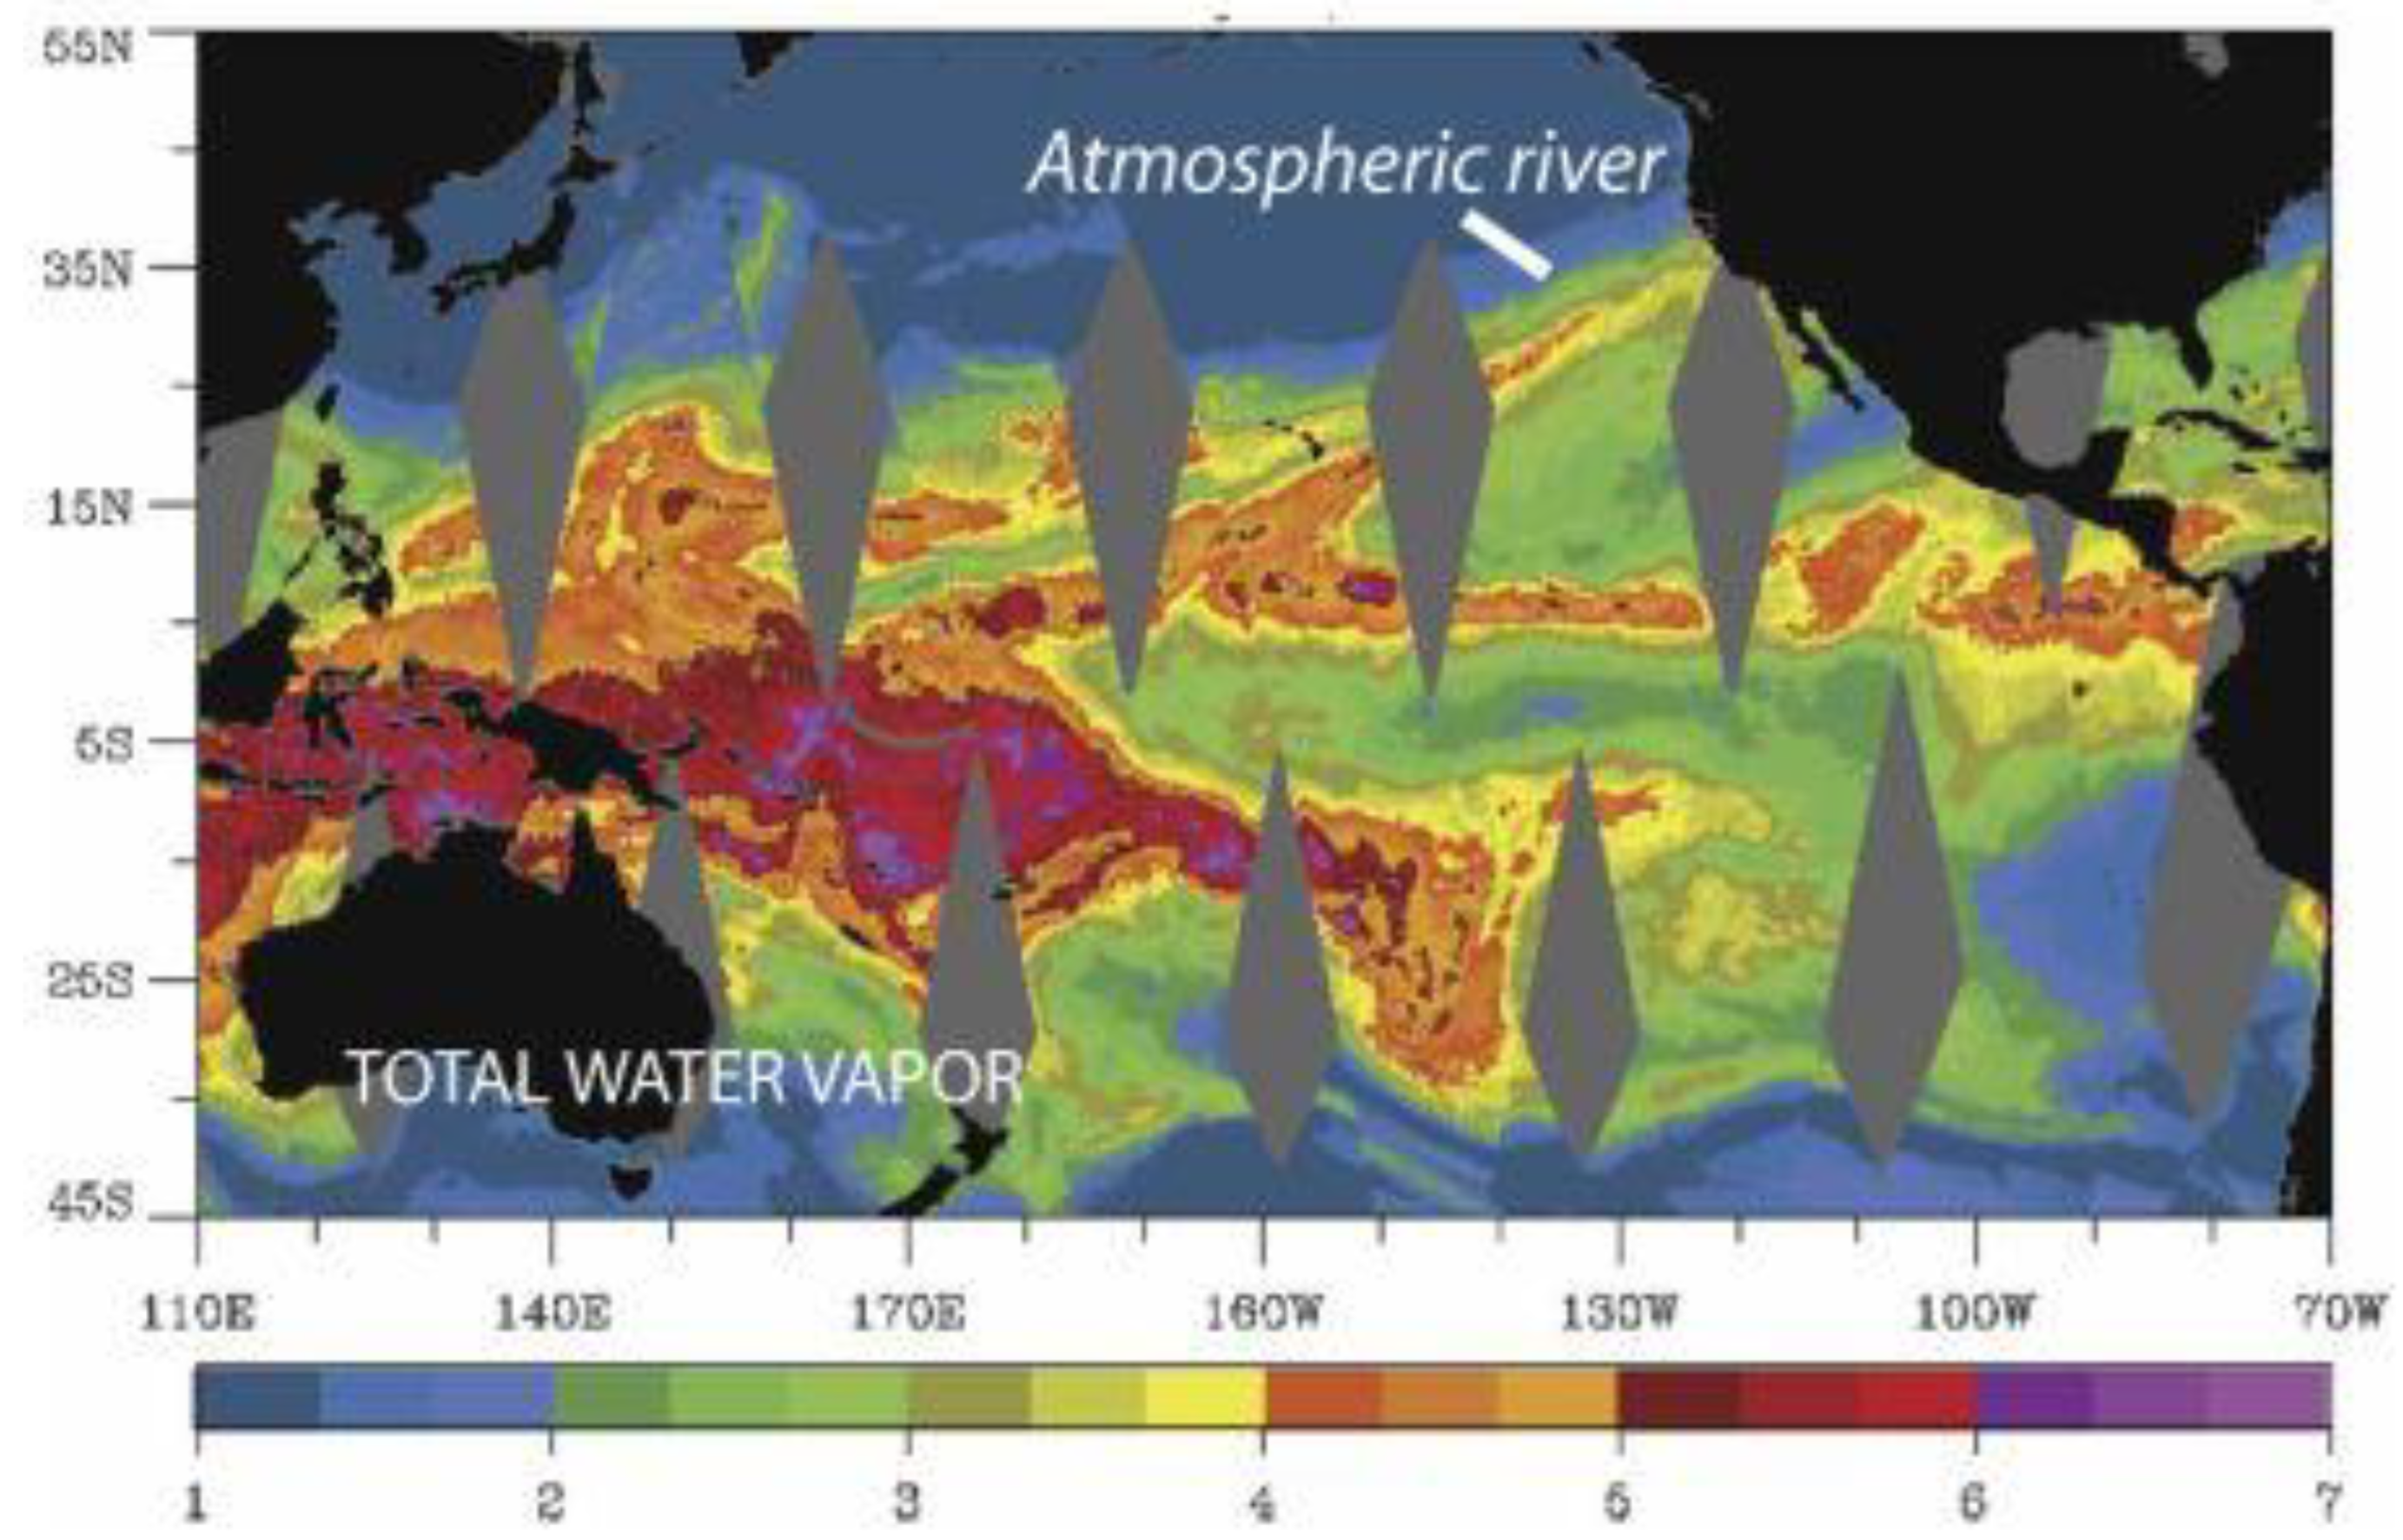
Maps of IVT and moisture transport during well-studied storms show how orientation and intensity of moisture corridors affect event recurrence. The 1–2 January 1997 case shows a long and narrow plume with strong southwesterly flow into California. This pattern produced prolonged precipitation over coastal mountains and short gaps between events while the jet remained stable. As shown in Figure 2, clustering can occur without major changes in daily totals when the moisture corridor persists and cores pass along adjacent parts of the coast. These features provide a physical explanation for clustering and can guide threshold choices for different subregions [19].
3.4. Broader Insights and Remaining Gaps
Compared with earlier research on AR seasonality, this study links mode-dependent landfall orientation to cluster statistics and shows where seasonal predictability may support flood planning. The main value is in separating persistence from spacing and in stratifying winters by climate phase. Two gaps remain [20]. First, gridded observations and reanalyses may smooth narrow moisture features, which reduces the apparent number of short gaps. Second, the results are based on one set of thresholds and grouping rules, which may influence counts. Future work should use convection-permitting models and consistent detection schemes to test whether higher resolution reduces biases in cluster length and spacing, and to improve their value for reservoir planning.
4. Conclusions
This study analyzed the clustering of atmospheric rivers in the western United States and explored how seasonal cycles and climate modes influence their frequency and persistence. The results show that models capture the broad occurrence of atmospheric rivers but often underestimate short gaps between events, with larger biases during winters affected by El Niño and La Niña. The analysis also shows that clustering is sensitive to threshold settings and grouping rules, while local topography and circulation further shape event spacing. By treating persistence and spacing as separate measures and linking them to climate drivers, this work builds a clearer basis for studying clustering behavior. The findings suggest that better detection methods and higher-resolution models are needed to represent narrow moisture plumes and multi-event sequences.
References
- Dettinger, M.D.; Lavers, D.A.; Compo, G.P.; Gorodetskaya, I.V.; Neff, W.; Neiman, P.J.; Ramos, A.M.; Rutz, J.J.; Viale, M.; Wade, A.J.; et al. Effects of atmospheric rivers. Atmospheric rivers, 141-177.
- Anghileri, D.; Pianosi, F.; Soncini-Sessa, R. Trend detection in seasonal data: from hydrology to water resources. J. Hydrol. 2014, 511, 171–179. [Google Scholar] [CrossRef]
- Sun, X. , Meng, K., Wang, W., & Wang, Q. (2025, March). Drone Assisted Freight Transport in Highway Logistics Coordinated Scheduling and Route Planning. In 2025 4th International Symposium on Computer Applications and Information Technology (ISCAIT) (pp. 1254-1257). IEEE.
- Sukhdeo, R. (2024). Precipitation Variability over the Northeastern United States: Large-Scale Drivers and Large-Scale Meteorological Patterns (Doctoral dissertation, University of California, Davis).
- Guirguis, K.; Gershunov, A.; Shulgina, T.; Clemesha, R.E.S.; Ralph, F.M. Atmospheric rivers impacting Northern California and their modulation by a variable climate. Clim. Dyn. 2018, 52, 6569–6583. [Google Scholar] [CrossRef]
- Wang, Y.; Shen, M.; Wang, L.; Wen, Y.; Cai, H. Comparative Modulation of Immune Responses and Inflammation by n-6 and n-3 Polyunsaturated Fatty Acids in Oxylipin-Mediated Pathways. World J. Innov. Mod. Technol. 2024, 7, 139–144. [Google Scholar] [CrossRef] [PubMed]
- Yang, Z.; DeFlorio, M.J.; Sengupta, A.; Wang, J.; Castellano, C.M.; Gershunov, A.; Guirguis, K.; Slinskey, E.; Guan, B.; Monache, L.D.; et al. Seasonality and climate modes influence the temporal clustering of unique atmospheric rivers in the Western U.S. Commun. Earth Environ. 2024, 5, 1–16. [Google Scholar] [CrossRef] [PubMed]
- Whitmore, J.; Mehra, P.; Yang, J.; Linford, E. Privacy Preserving Risk Modeling Across Financial Institutions via Federated Learning with Adaptive Optimization. Front. Artif. Intell. Res. 2025, 2, 35–43. [Google Scholar] [CrossRef]
- Grotjahn, R.; Black, R.; Leung, R.; Wehner, M.F.; Barlow, M.; Bosilovich, M.; Gershunov, A.; Gutowski, W.J.; Gyakum, J.R.; Katz, R.W.; et al. North American extreme temperature events and related large scale meteorological patterns: a review of statistical methods, dynamics, modeling, and trends. Clim. Dyn. 2015, 46, 1151–1184. [Google Scholar] [CrossRef]
- Xu, K.; Lu, Y.; Hou, S.; Liu, K.; Du, Y.; Huang, M.; Feng, H.; Wu, H.; Sun, X. Detecting anomalous anatomic regions in spatial transcriptomics with STANDS. Nat. Commun. 2024, 15, 1–23. [Google Scholar] [CrossRef] [PubMed]
- Luna-Niño, R.; Gershunov, A.; Ralph, F.M.; Weyant, A.; Guirguis, K.; DeFlorio, M.J.; Cayan, D.R.; Williams, A.P. Heresy in ENSO teleconnections: atmospheric rivers as disruptors of canonical seasonal precipitation anomalies in the Southwestern US. Clim. Dyn. 2025, 63, 1–11. [Google Scholar] [CrossRef]
- Cohen, J.S.; Zeff, H.B.; Herman, J.D. Adaptation of multiobjective reservoir operations to snowpack decline in the WESTERN United States. J. Water Resour. Plan. Manag. 2020, 146, 04020091. [Google Scholar] [CrossRef]
- Wang, C.; Chakrapani, V. Environmental Factors Controlling the Electronic Properties and Oxidative Activities of Birnessite Minerals. ACS Earth Space Chem. 2023, 7, 774–787. [Google Scholar] [CrossRef]
- Luna-Niño, R.; Gershunov, A.; Ralph, F.M.; Weyant, A.; Guirguis, K.; DeFlorio, M.J.; Cayan, D.R.; Williams, A.P. Heresy in ENSO teleconnections: atmospheric rivers as disruptors of canonical seasonal precipitation anomalies in the Southwestern US. Clim. Dyn. 2025, 63, 1–11. [Google Scholar] [CrossRef]
- Singh, A.; Thakur, S.; Adhikary, N.C. Influence of climatic indices (AMO, PDO, and ENSO) and temperature on rainfall in the Northeast Region of India. SN Appl. Sci. 2020, 2, 1–15. [Google Scholar] [CrossRef]
- Melsen, L.A.; Puy, A.; Torfs, P.J.J.F.; Saltelli, A. The rise of the Nash-Sutcliffe efficiency in hydrology. Hydrol. Sci. J. 2025, 70, 1248–1259. [Google Scholar] [CrossRef]
- Teale, N.; Robinson, D.A. Patterns of water vapor transport in the eastern United States. J. Hydrometeorol. 2020, 21, 2123–2138. [Google Scholar] [CrossRef]
- Smith, C.D.; Scarf, D. Spacing repetitions over long timescales: a review and a reconsolidation explanation. Front. Psychol. 2017, 8, 962–962. [Google Scholar] [CrossRef] [PubMed]
- Tuel, A.; Martius, O. Weather persistence on sub-seasonal to seasonal timescales: a methodological review. Earth Syst. Dyn. 2023, 14, 955–987. [Google Scholar] [CrossRef]
- Miles, V.; Esau, I. Seasonal and spatial characteristics of urban heat islands (UHIs) in northern West Siberian cities. Remote. Sens. 2017, 9, 989. [Google Scholar] [CrossRef]
Figure 1.
Wind direction, wind speed, and IVT during atmospheric river events in El Niño and La Niña years.
Figure 1.
Wind direction, wind speed, and IVT during atmospheric river events in El Niño and La Niña years.
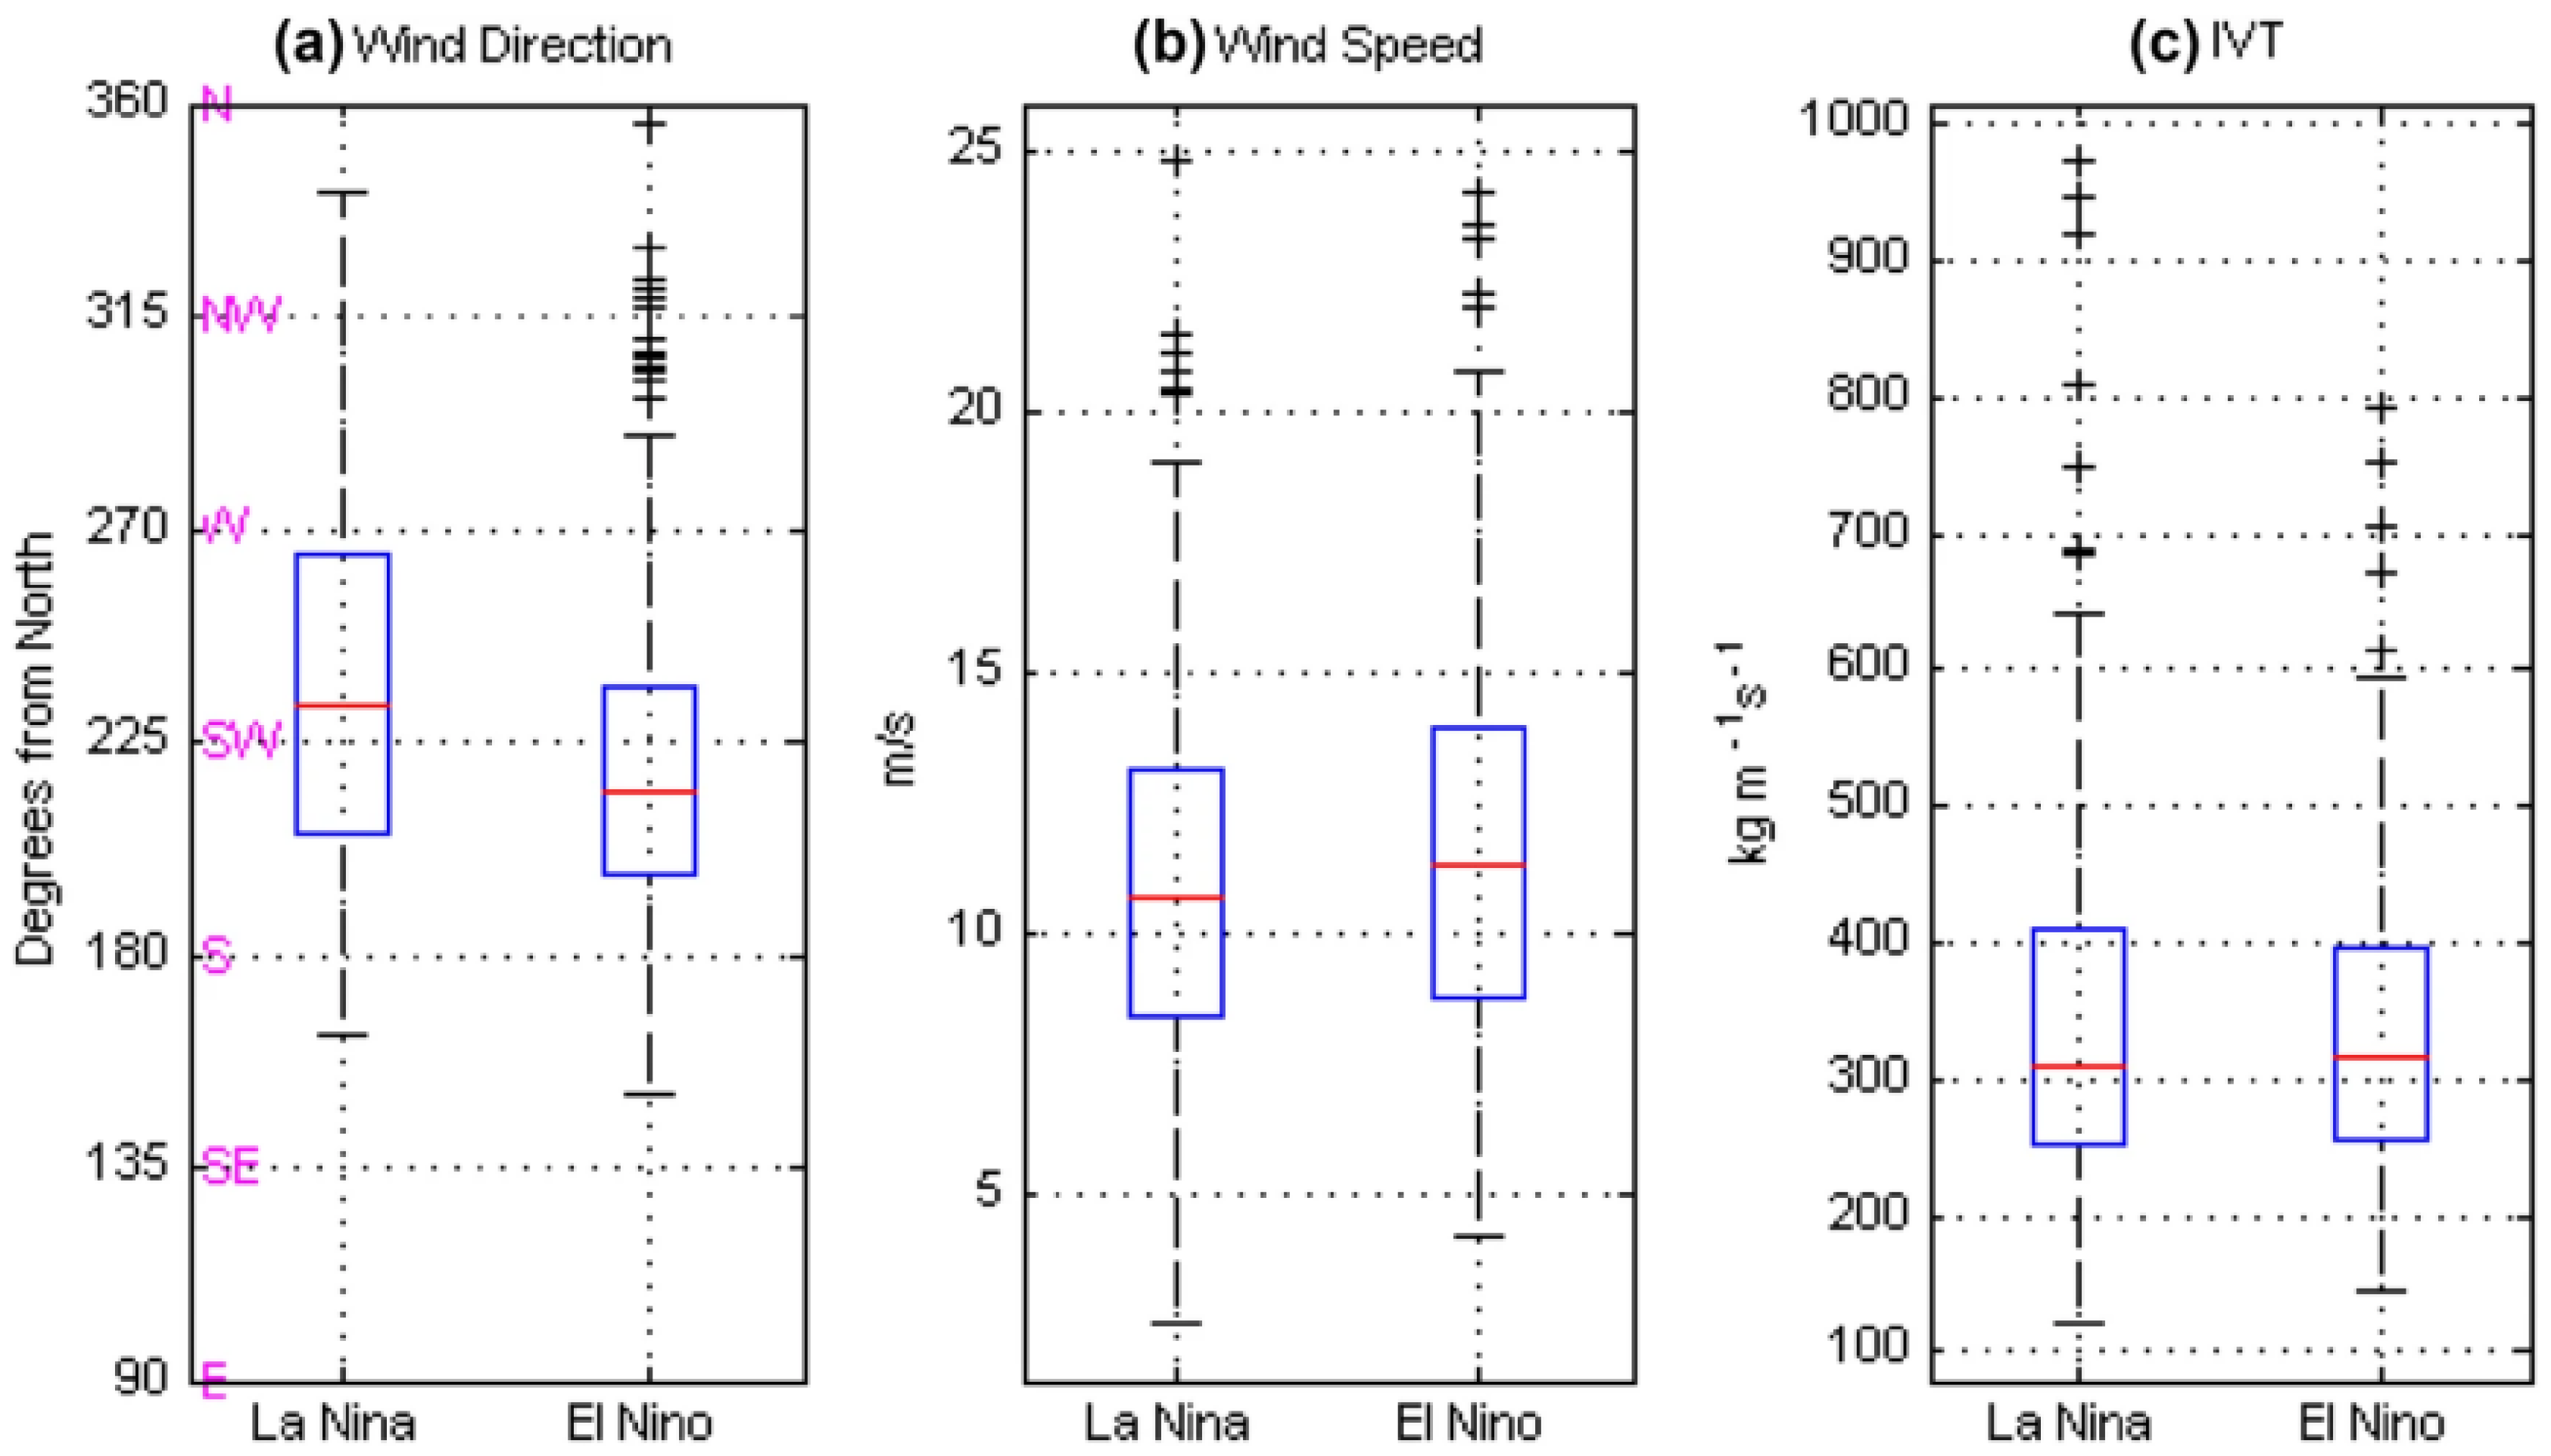
Figure 2.
Moisture plume and IVT fields from the atmospheric river of 1–2 January 1997 over California.
Figure 2.
Moisture plume and IVT fields from the atmospheric river of 1–2 January 1997 over California.
Disclaimer/Publisher’s Note: The statements, opinions and data contained in all publications are solely those of the individual author(s) and contributor(s) and not of MDPI and/or the editor(s). MDPI and/or the editor(s) disclaim responsibility for any injury to people or property resulting from any ideas, methods, instructions or products referred to in the content. |
© 2025 by the authors. Licensee MDPI, Basel, Switzerland. This article is an open access article distributed under the terms and conditions of the Creative Commons Attribution (CC BY) license (http://creativecommons.org/licenses/by/4.0/).
Copyright: This open access article is published under a Creative Commons CC BY 4.0 license, which permit the free download, distribution, and reuse, provided that the author and preprint are cited in any reuse.


