
Submitted:
19 November 2025
Posted:
20 November 2025
You are already at the latest version
Abstract
Spatial heterogeneity in economic benefits of water use provides crucial evidence for the evaluation of water diversion projects and the spatial equilibrium of water resource allocation. However, research focusing on the economic benefits of water use in major industries within Chinese cities remains insufficient. We collected water use and value added data of agriculture, industry, and service sectors of 334 Chinese cities in 2017, and used the benefit allocation coefficient method to calculated the economic benefit of water use in the three sectors. Then we analyzed spatial heterogeneity in the economic benefits of water use: for agricultural sector, the high economic benefit of water use regions are primarily concentrated on both sides surrounding of the “Hu Huanyong Line”; regions with high economic benefit of industrial water use are mainly found in the North China Plain, the middle and lower Huanghe River basin, the Yangtze River Delta, the Pearl River Delta, Chongqing and Chengdu; and the economic benefit of service water use is higher in the north than in the south. Based on the fundamental distribution of water resources and the spatial heterogeneity in the economic benefits of water use, potential water diversion areas can be preliminarily identified: the Haihe River Basin in the North China Plain and some areas in the southeast coastal region are potential receiving areas, and the eastern regions of Southwest China with abundant water resources and lower elevations, along with the middle and lower reaches of the Yangtze River are potential source areas. Further research about marginal benefits and water use costs, along with dynamic updates, is required for water resource allocation of China.
Keywords:
economic benefits of water use
; spatial heterogeneity
; urban-scale analysis
; benefit allocation coefficient method
; China
1. Introduction
As one of the most critical challenges of the 21st century in the world, water scarcity is intensified by the synthetic impacts of climate change and anthropogenic activities [1,2]. This challenge is mainly stemmed from the disparities between the inherent spatiotemporal heterogeneity of water resources and the geographical distribution of socio-economic activities [3]. As the world’s largest developing economy, China profoundly faces such challenge can be profoundly. This is mainly because the substantial economic and demographic footprint in China is concentrated on the east of the “Hu Huanyong Line”, but this pattern is fundamentally mismatched with the country’s naturally uneven water distribution between the north and the south [4]. The water governance philosophy of “spatial equilibrium” has been instituted as China’s guiding principle for a new era, seeking to foster a harmonious coexistence between water resources and the development of population, economy and the society [5,6,7,8]. According to the general equilibrium theory and the spatial equilibrium theory, the essence of the spatial equilibrium of water resources allocation is the marginal benefit equilibrium under the conditions that considering of the cost of water transfer between two places. A critical step forward is to develop a diagnostic metric of spatial allocation economic benefit, grounded in rigorous, sector-specific economic valuations of water[9]. This study focuses on the spatial heterogeneity in economic benefits of water use, which provides crucial evidence for the evaluation of water diversion projects and the spatial equilibrium of water resource allocation.
Accurately assessing the economic value of water resources is a prerequisite for conducting spatial equilibrium analysis. Methodologically, the production function approach, mathematical programming, and the benefit attribution method represent three mainstream techniques for estimating the economic value of water resources [10]. For instance, Peng, Yin [11] developed a computable general equilibrium model for water-receiving areas of water diversion projects, using Beijing as a case study to quantitatively evaluate the socio-economic impacts of such initiatives. Similarly, Wu, Bai [12] employed an improved particle swarm optimization algorithm to solve a multi-objective optimization model, examining the trade-offs between economic and ecological benefits under changing environmental conditions in the context of the Hanjiang-to-Weihe River Water Diversion Project. In a broader assessment, Yu, Wang [13] adopted an integrated analytical approach to investigate the economic, environmental, and social implications of water transfer projects across China. Notably, the benefit attribution method—also referred to as the residual value method—has been widely applied in evaluating water use benefit at regional and sectoral scales, owing to its straightforward data requirements and computational procedure [14]. Internationally, researchers have employed similar principles to assess water productivity in sectors such as agriculture and industry [15,16,17]. In China, this method has been successfully implemented both at the provincial level [18]and within river basin contexts [19], confirming its validity and applicability. For example, Wang, Jia [19] established an integrated quantitative framework incorporating the benefit attribution method, productivity change analysis, and an economic loss estimation model for water pollution, to evaluate the comprehensive social, environmental, and economic benefits of the Water Diversion from Yangtze River to Taihu Lake Project for the year 2011.
Despite considerable progress, significant knowledge gaps persist in enabling a spatially nuanced equilibrium analysis of water use in China [20,21]. A primary limitation is the coarse resolution of existing assessments, which are largely confined to the provincial or major river-basin level. This obscures critical inter-city heterogeneity and impedes a mechanistic understanding of water-use economic benefit at the level where key policy interventions are implemented—the prefectural city [17].Furthermore, the prevalent application of the benefit-sharing method often overlooks a fundamental source of bias: the spatiotemporal heterogeneity of the allocation coefficient [18,22]. Compelling evidence indicates that water’s marginal contribution to economic output is not a universal constant but is intrinsically modulated by local resource endowments and climatic regimes [23]. In agriculture, for instance, this coefficient is markedly higher in arid regions or during drought years compared to humid conditions. The use of a static, uniform value risks a systematic misestimation of water use economic benefits in water-scarce contexts, thereby distorting the true landscape of regional economic benefit disparities.
This study established a sectoral-city level analytical framework to reveal the spatial heterogeneity in economic benefits of water use across China. The objectives are as follows: (1) to collect sectoral (agriculture, industry and service) water use and value added data of 334 Chinese cities in 2017, and to calculate the economic benefit of water use in the three sectors, (2) to analyze the regional and structural differences in economic benefits of water use; and (3) to explore the reference of spatial heterogeneity in economic benefits of water use for water diversion projects and the spatial equilibrium of water resource allocation in China.
2. Materials and Methods
2.1. Dataset
Here we establish 2017 as the baseline year and select 334 cities (the scope covers mainland China, excluding cities below the prefecture level and Hainan province.) in China as our research samples. The study focuses on three key sectors: agriculture (crop cultivation), industry, and services. Sector classification follows the “Industrial Classification for National Economic Activities” (GB/T 4754—2011/2017). Sector-specific value added data were primarily compiled from provincial (municipal) statistical yearbooks, while the amount of sectoral water use data were obtained from provincial (municipal) water resources bulletins or related yearbooks. For partially missing data, government information is available upon request through channels such as telephone and email. If data remained incomplete, interpolation was performed using data from adjacent regions or years.
2.2. Method for Calculating the Economic Benefit of Water Use
We employed the allocation coefficient method to quantify water use benefit across sectors. This approach allocates economic benefits proportionally according to the contribution of production factors, offering both conceptual clarity and practical data accessibility. For non-agricultural sectors, the allocation coefficient is typically determined by either the investment-based or fixed-asset-based method, owing to data availability. In agricultural sector, the coefficient is derived from long-term experimental parameters. To make the calculation simple, we assumed that the water benefit allocation coefficients do not differ across cities. The economic benefit of water use can be calculated as below (Equation (1)):
Here, is the economic benefit of water use; represents the value added; is the amount of water use; is the water benefit allocation coefficient; and is the water use sectors.
This study employed the benefit allocation coefficient method. Specifically, the economic benefit of water use in a given sector is calculated as the ratio of its value added to the amount of water use (i.e., benefit per unit of water) multiplied by a corresponding water benefit allocation coefficient). The determination of allocation coefficients draws upon established research: a coefficient of 0.035 is adopted for industrial water use (Tu, 1998), and 0.04 for the service sector [19]. For agriculture, the range of coefficient is between 0.4 and 0.6, although Wang, Jia [19] applied a higher value of 0.53, we conservatively assign a coefficient of 0.4. This adjustment accounts for the relatively higher precipitation observed in 2017 in northern China (e.g., the Yellow River Basin), which is likely to reduce agricultural dependence on irrigation.
3. Results and Analysis
3.1. Spatial Heterogeneity of Economic Benefit of Agricultural Water Use
The text continues here. Regional analysis reveals that agricultural water use in China is disproportionately concentrated in several key regions, including much of Xinjiang, Jiuquan City in the Hexi Corridor, north-central Jiangsu (Figure 1, Figure 2), Bayannur City in the Hetao Plain, and the periphery of the Sanjiang Plain in Northeast China. Significant usage is also observed in parts of Sichuan, Guangxi, Hunan, Hubei, and Jiangxi (Figure 1a). At the city level, the prefectures of Kashi, Aksu, and Jiamusi exhibit the highest use, each exceeding 5 billion m³. Kashi’s usage (9.478 billion m³) surpasses that of Aksu (7.192 billion m³) by nearly one-third. Notably, Xinjiang accounts for eight of the top thirty cities by water use. Within the Sanjiang Plain, cities like Jiamusi, Harbin, Qiqihar, Jixi, and Suihua represent a significant proportion of high water-use areas. In Jiangsu, Yancheng and Xuzhou cities are the primary water users, with several other cities also exhibiting substantial usage. Other major consumers include Chengdu, Guilin, Nanning, Changde, Yichang, and Jiuquan, alongside multiple cities in Jiangxi province. Conversely, minimal agricultural water use is largely confined to the high-altitude terrains of the Qinghai-Tibet and Yunnan-Guizhou plateaus, the Loess Plateau, and specific areas such as the mountainous Baishan City or the archipelagic Zhoushan (Figure 2a).
As illustrated in Figure 1b, high agricultural value added is concentrated in southeastern China and parts of northwestern Xinjiang, with a distribution approximating the “Hu Huanyong Line” and the monsoon boundary. Leading regions include Heilongjiang, Hebei, Shandong, Jiangsu, Henan, Sichuan, and Hunan. A distinct northeast-southwest belt of high-value cities spans China’s second and third topographic steps, heavily represented by provinces like Henan and Shandong (Figure 2b).
Analysis of water use benefit (Figure 1c) identifies two distinct scenarios. The highest economic benefit values are found in regions with minimal water use, such as Yushu, Alxa League, and Golog. More critically, high economic benefit driven by substantial value added is concentrated in Shandong, Henan, Anhui, Hubei, and Chongqing—areas that form the core of China’s productive agricultural belt. In contrast, the lowest efficiencies are prevalent in semi-arid and arid regions with underdeveloped agriculture. A notable finding is the concentration of ten low-economic benefit cities within Xinjiang, a region characterized by high water use and high output. This indicates a paradoxical coexistence of water profligacy and irrigation deficits, likely stemming from inefficient irrigation infrastructure, significant canal leakage, and lagging water conservancy projects. Similarly, the Northeast Plain exhibits high water use and output but suboptimal economic benefit. Despite these inefficiencies, both Xinjiang and the Northeast Plain hold strategic importance for China’s national food security (Figure 2c).
For agriculture, the high economic benefit of water use regions are primarily concentrated on both sides surrounding of the “Hu Huanyong Line”. Regions with high value added and high irrigation water use do not achieve high economic benefit of water use. For instance, areas such as Northeast China, Southeast China, and Xinjiang have high agricultural output but also use substantial amount of water. Given that China’s agricultural production relies primarily on irrigation, the area surrounding the line yields higher economic benefit of water use.
3.2. Spatial Heterogeneity of Economic Benefit of Industrial Water Use
Figure 3a illustrates the spatial distribution of industrial water use in China. Regions with high industrial water use are predominantly located along the middle and lower reaches of the Yangtze River Economic Belt, as well as in certain coastal cities of Fujian and Guangdong. Shanwei City recorded the highest industrial water use, reaching 7.40 billion m³. In southwestern China, Chongqing and Chengdu stand out with industrial water uses of 3.04 billion m³ and 1.28 billion m³, respectively. In southern China, besides of Guangzhou and Foshan in Guangdong province, Nanning also shows relatively high industrial water use, at 869 million m³. Among the cities with high industrial water use, six are from Jiangsu province, while Anhui and Hubei contribute four cities respectively. In contrast, cities with low industrial water use are mainly concentrated in northwestern and southwestern China. Qinghai, Tibet, Gansu, and Xinjiang account for five, six, five, and four such cities, respectively, all with water use below 32 million m³ (Figure 4a).
Figure 3b shows the spatial distribution of industrial value added. Most cities with high industrial output are situated at the east of the “Hu Huanyong Line”, particularly in the Pearl River Delta, Yangtze River Delta, and other coastal areas in the east and southeast area, as well as in the Yangtze River Mid-Reach and Chengdu-Chongqing urban agglomerations. Western regions generally exhibit lower levels of industrial value added. In the southwest, Chongqing and Chengdu lead with industrial value added of 658.708 billion RMB and 521.720 billion RMB, ranking fourth and eighth, respectively. Cities with high industrial output are mostly municipalities, provincial capitals, or sub-provincial cities, with notable concentrations in Jiangsu (six cities), Guangdong (four), and Shandong (four). In northeastern China, Changchun is the only city with relatively high industrial value added, at 266.777 billion RMB, ranking the 25th. Cities with low industrial output are largely concentrated in western China, including several in Xinjiang, Tibet, Qinghai, and Gansu, each with industrial value added below 5.6 billion RMB. Yunnan also has four autonomous prefectures with low output, while Yichun and Heihe in Heilongjiang province show similarly low levels. Overall, the distribution of industrial value added strongly correlates with regional economic development (Figure 4b).
Figure 3c depicts industrial water use benefit, which shows a different spatial pattern from that of water use or industrial output, generally exhibiting higher values in northern China. Regions with high economic benefit are mainly found in the North China Plain, the middle and lower Huanghe River basin, the Yangtze River Delta, the Pearl River Delta, Chongqing and Chengdu. Some areas in northeast of China also show relatively high economic benefit. Notably, cities in Shandong—such as Yantai, Dongying, Qingdao, and Weihai—demonstrate particularly high industrial water use benefit, all exceeding 60 RMB/m³ and ranking among the top five nationally. Shenzhen, which ranks the fourth in industrial value added, also shows high economic benefit at 62.81 RMB/m³. Four cities in Hebei province exhibit moderate economic benefit, ranging between 30–35 RMB /m³. In contrast, Shanwei city, which has the highest industrial water use nationwide, shows the lowest economic benefit, at only 0.17 RMB/m³. Cities with economic benefit below 3.30 RMB/m³ are widely distributed, with six each in Tibet and Anhui, and others scattered across coastal, central, southern, southwestern, northeastern, and northwestern regions. Some regions, such as Hainan and Huangnan prefectures in Qinghai province and the Greater Khingan Range area in Heilongjiang province, exhibit high economic benefit primarily due to their low industrial water use (Figure 4c).
The amount of industrial water use and value added are both high in the southeastern coastal regions. However, to a certain extent the economic benefit in the north is higher than in the south. Industrial water use encompasses both fresh water and non-conventional sources, while internal recirculated water volumes are excluded. This may partially account for the observed higher economic benefit of water use in northern regions compared with southern areas.
3.3. Spatial Heterogeneity of Economic Benefit of Service Water Use
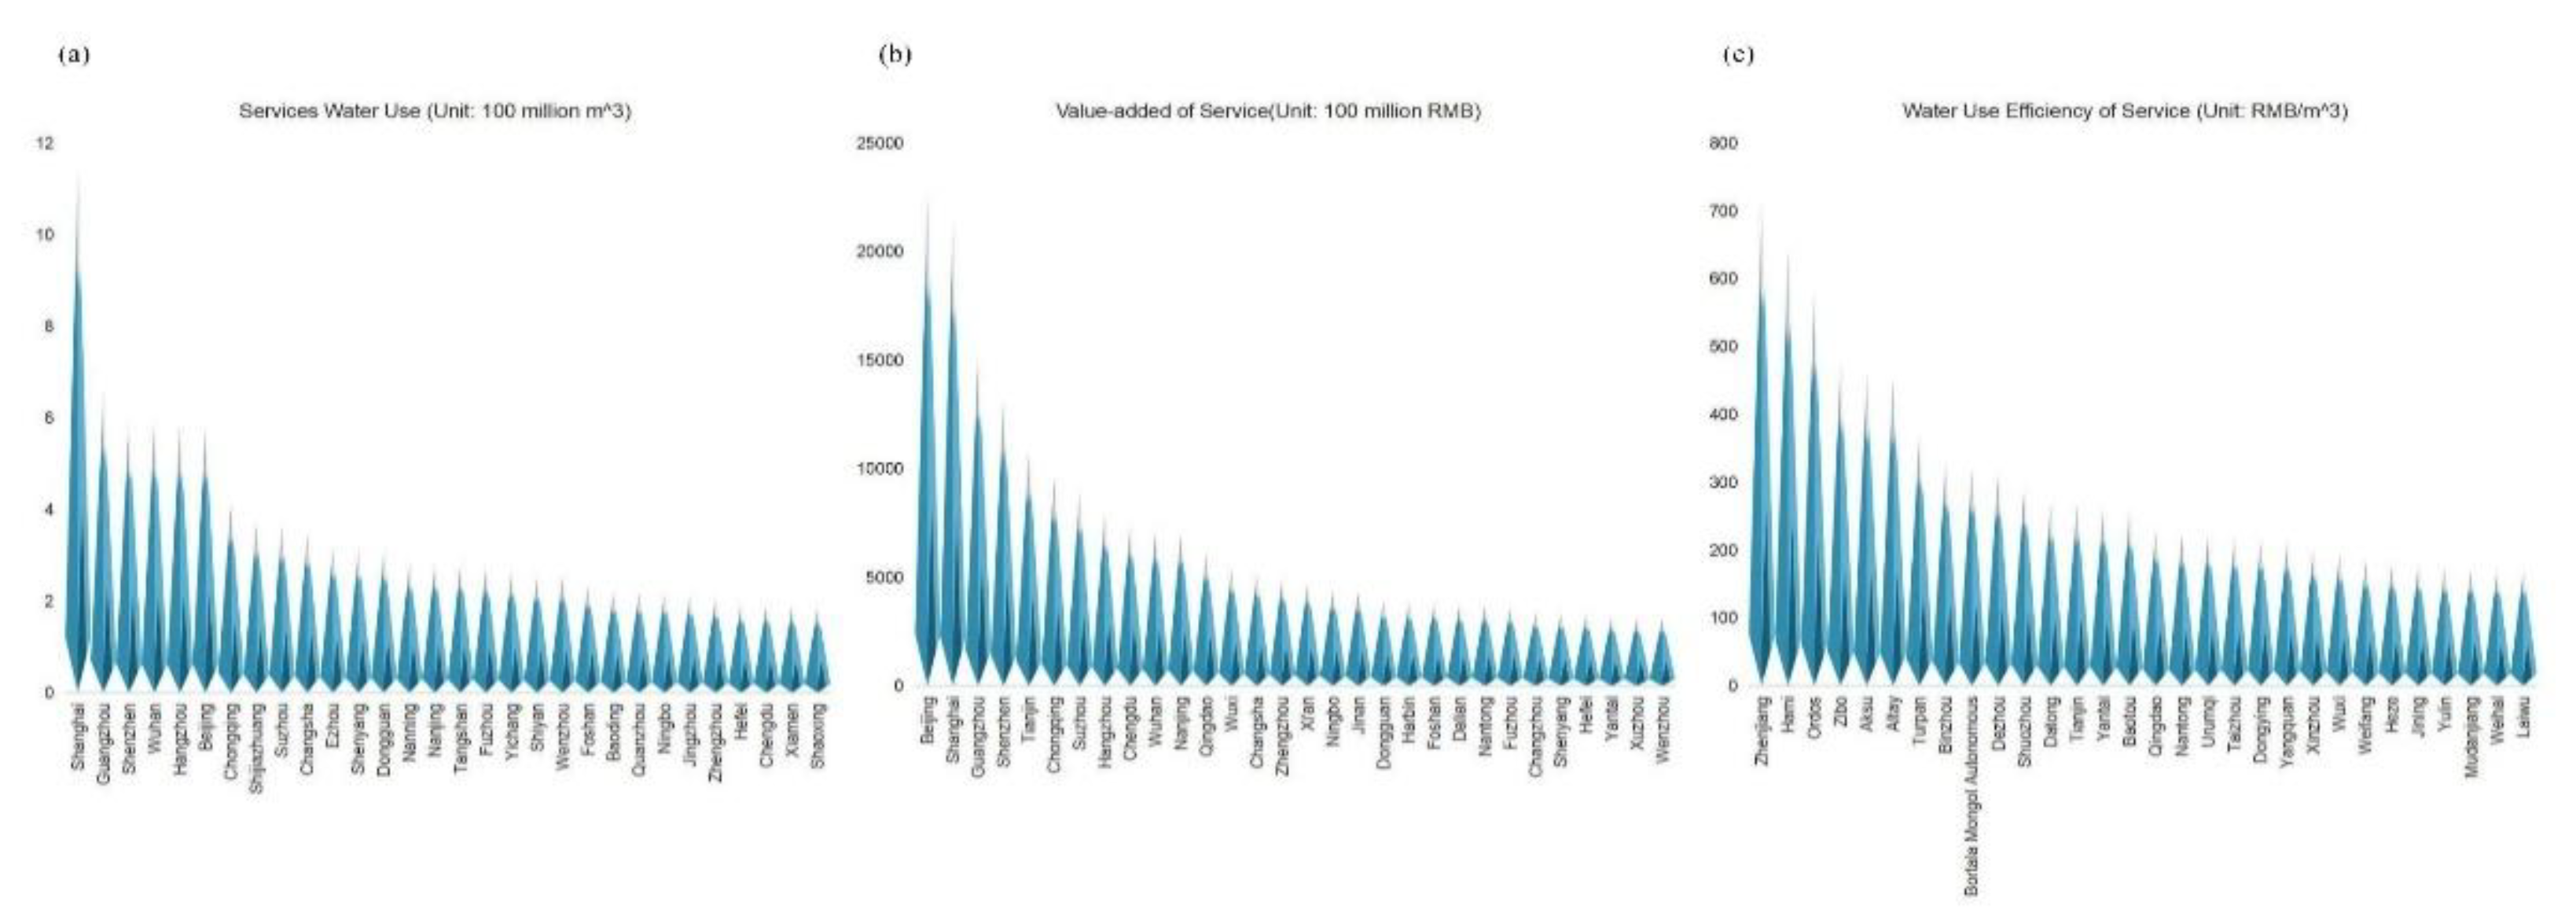
As illustrated in Figure 5a, the amount of water use in China’s service sector exhibits pronounced regional disparities. High water-use regions are predominantly concentrated in the southeastern coastal areas, the Beijing–Tianjin–Hebei region, the Sichuan–Chongqing area, as well as Hunan and Hubei provinces. In contrast, water use in the service sector is considerably low in western China, particularly in the west of the “Hu huanyong Line”. Shanghai ranks the highest in service-sector water use, reaching 1.134 billion m³—73% higher than that of Guangzhou, the second-ranked city. It is followed by Shenzhen, Wuhan, Hangzhou, Beijing, and Chongqing, all of which exceed 400 million m³ in water use. Hubei province contains five cities with high water use, while Guangdong and Zhejiang each contribute four. Cities with the lowest water use—all below 10 million m³—are largely concentrated in Xinjiang (eight cities) and Qinghai (five cities). Notably, water use in Shanghai exceeds that of the lowest-consuming region, Hami Prefecture, by a factor of more than 1,000, underscoring substantial spatial inequality in service-sector water use across China (Figure 6a).
The spatial distribution of value added generated by the service sector (Figure 5b) largely mirrors that of water use, displaying a similar southeast–northwest gradient. High value added areas are mainly distributed along the southeastern coast, in the Beijing–Tianjin–Hebei region, and around cities such as Chongqing and Harbin. Conversely, Qinghai and Tibet report the lowest outputs. Beijing leads with a service-sector value added of 2,256.78 billion RMB, closely followed by Shanghai at 2,119.15 billion RMB. It is noteworthy that although Beijing’s service-sector output surpasses that of Shanghai, its water use is only half that of Shanghai. Other major contributors include Guangzhou, Shenzhen, Tianjin, and Chongqing, each with value added exceeding 900 billion RMB. The low added values are observed in Qinghai, Tibet, Xinjiang, Yunnan, Gansu, and Ningxia. (Figure 6b).
In contrast to the distributions of water use and value added, which is higher in the southeast and lower in the northwest, the economic benefit of service water use (Figure 5c) is higher in the north than that in the south. Zhenjiang City in Jiangsu Province exhibits the highest economic benefit, at 711.16 RMB/m³ of water. Regions with high water-use economic benefit are mainly found in Xinjiang, Shandong, Jiangsu, the middle reaches of the Yellow River, northeastern China, and parts of Yunnan. Several prefectures in Xinjiang (Hami, Aksu, Altay, Turpan, Bortala), Ordos City in Inner Mongolia, as well as Zibo, Binzhou, and Dezhou in Shandong also rank highly. Conversely, low-economic benefit areas are concentrated in Hubei, Tibet, and Guangxi. (Figure 6c).
The service sector encompasses a wide variety of industries, which are characterized by relatively high economic benefit of water use and significant differences. For instance, the catering industry being a relatively low economic benefit sector within the service industry, it remains consistently above 5 RMB across the cities in southern Xinjiang. Nevertheless, the water use of service sector remains comparatively low in relation to that of other industries, resulting in its marginal consideration in the context of water resource allocation. With the upgrading of the industrial structure, the service sector may receive greater attention.
3.4. Preliminary Identification of Potential Water Diversion Areas
Based on the fundamental distribution of water resources and the spatial heterogeneity of economic benefit of water use, potential water diversion areas can be preliminarily identified. The Haihe River Basin in the North China Plain is a potential water-receiving area, some areas along the southeast coast can be included in the potential transfer area depending on the degree of water shortages. The eastern part of Southwest China is rich in water resources and has a low altitude, as well as the middle and lower reaches of the Yangtze River (which have actually already been used as the exporting area of the East and Middle Lines of the South-to-North Water Diversion Project and the subsequent planning of the first phase of operation and subsequent planning) is a potential exporting area. The actual situation is that the reference for water diversion areas encompass not only economic benefits of water use but also social benefits, ecological benefits, and costs, among other factors.
4. Discussion
4.1. Spatial Heterogeneity in Economic Benefit of Water Use and Water Resource Allocation of China
According to the equilibrium conditions of the general equilibrium theory and the spatial equilibrium theory, the essence of the spatial equilibrium of water resource allocation is the marginal benefit equilibrium under the condition of considering the cost of water transfer between two places. The marginal benefit of water is determined by the inefficient water users, or in the case of administratively-dominant allocation, it is determined by the main purposes of water transfer. Spatial equilibrium is dynamic, and it is necessary to evaluate the current situation and analyze the future situation. The water diversion project needs the cost-benefit analysis of relevant areas. The findings of this study currently indicate the potential diversion regions. However, further research about marginal benefits and water use costs, along with dynamic updates, is required for water diversion projects and the spatial equilibrium of water resource allocation.
Our analysis reveals significant spatial heterogeneity in sectoral water use benefit across China, a pattern intrinsically linked to regional disparities in water resource endowment, economic development, and industrial structure. Crucially, the geographic distributions of high-economic benefit agricultural and high-economic benefit industrial and service sectors are not fully aligned. This spatial disparityunderscores a central dilemma in Chinese water governance: the trade-off between efficiency and regional equity [15,16,17,24]. Within the agricultural sector, we found that regions with substantial water use, such as Xinjiang and Northeast China, exhibited relatively low water use benefit. However, the ‘irrigation economic benefit paradox’ highlighted by Grafton, Williams [9] serves as a critical warning. Singularly pursuing higher efficiency or economic benefit—for instance, through technological advances that reduce irrigation withdrawals—does not guarantee increased water availability at the basin scale and may instead intensify regional water stress by incentivizing the expansion of irrigated area [21,25,26]. Consequently, water allocation policies for strategic granaries like Xinjiang and Northeast China must look beyond mere ‘efficiency’. The imperative of ‘equity’—in this context, their vital role in safeguarding national food security—must be integral to the calculus [20,27,28].
The spatial patterns of water use benefit in the industrial and service sectors are equally complex [23]. Industrial economic benefit displays a ‘high-North, low-South’ gradient. Certain southern coastal cities (e.g., Shanwei) register considerable industrial output, but their elevated water use suppresses overall economic benefit, suggesting a history of less intensive water use in some southern developments. Notably, the highest service sector economic benefit is found not in megacities like Beijing or Shanghai, but in cities such as Zhenjiang and Ordos. This indicates that while super-sized cities generate immense service sector economic value, their water resource use may be approaching saturation, with limited gains in marginal economic benefit. This finding resonates with Wang et al. [29], who documented pronounced regional heterogeneity in the socio-economic impacts of water resource changes in China. A region cannot solely develop its advanced industries, nor can all regions develop high value added industries. It is necessary to explore the establishment of a strategic water reserve system for the northern regions. Furthermore, the water reallocation strategy must be coupled with careful designed compensation mechanisms to mitigate inter-regional ‘equity’ conflicts that may arise from the redistribution of water rights [22,29,30].
4.2. Applicability of the Apportionment Coefficient Method and Insights from Cross-Sectoral Comparison
The allocation coefficient method employed in this study offers a feasible framework for the unified quantification of water use benefits across multiple sectors. However, its application inherently raises important discussions concerning methodological applicability and the interpretation of results [14,31,32]. The value assigned to the allocation coefficient is central to this method and constitutes the primary source of uncertainty. This study adopts an agricultural allocation coefficient of 0.40, based on historical calculations at the national scale [19]. Nonetheless, numerous studies highlighted significant spatiotemporal heterogeneity in the allocation coefficient of water resources to economic output. Within the agricultural sector, this coefficient is highly dependent on climatic conditions. For instance, in arid and semi-arid regions or during drought years, where water becomes the most critical limiting factor of production, the coefficient can rise substantially (e.g., to 0.5–0.6), whereas it decreases markedly in years of abundant precipitation [9,33]. For the industrial and service sectors, we applied relatively low and fixed coefficients (0.035 and 0.04, respectively), aligning with parameters used by Wang, Jia [19] in assessing the benefits of water transfer projects. In contrast, Yin, Wang [18] employed a coefficient of 0.05 for both industrial and domestic water use. This discrepancy in parameter selection underscores the need for considerable caution when directly comparing results across different studies, particularly in the absence of a standardized measurement protocol. Actually, the data availiability in the industrial sectordata is limited at the city level is limited, considering that refining regional allocation coefficients would introduce more errors, fixed allocation coefficients were therefore used. Future research should focus on developing dynamic allocation coefficient systems that adapt to technological progress, climatic variations and shifts in industrial structure [14,31,32]. Additionally, we can try to conduct a joint comparative analysis with the results related to the city-level input-output table.
Despite the aforementioned uncertainties, the trend revealed by the striking disparities in cross-sectoral water use benefit is both clear and robust. Our results unequivocally demonstrate that the economic benefit per unit of water in industrial and service sectors is typically one to two orders of magnitude higher than in agricultural sector. This substantial gap provides a powerful economic rationale for the reallocation of water resources from agriculture towards higher value added sectors, which underpins the high expectations placed on market mechanisms for water allocation [22,34,35,36]. However, the ecological and social boundaries of such transfers must be rigorously scrutinized. First, agricultural water use, particularly the use of “green water” for maintaining soil moisture and regulating regional climate, carries significant ecosystem service value. This value is not adequately captured by the allocation coefficient method based purely on economic output [37]. Second, the transfer of agricultural water rights must carefully consider its impacts on rural livelihoods and social stability [2,16,38,39]. Consequently, our findings should not be simplistically interpreted as advocating for “diverting water from agriculture to support industry.” Instead, they underscore the urgent need to establish a multifaceted system for evaluating water resource value [4,40,41]. In policy practice, moving beyond the economic benefit focus of this study, it is crucial to incorporate ecosystem service values. Methods such as the Contingent Valuation Method (CVM) and other non-market valuation techniques should be leveraged to quantify the benefits of ecological water use, thereby providing a more comprehensive and multi-dimensional scientific basis for complex water resource decision-making [5,34,42,43].
5. Conclusions
This study develops a methodological framework centered on the apportionment coefficient method to systematically evaluate water-use economic benefit and its spatial heterogeneity across agricultural, industrial, and service sectors at the city level in China for the year 2017. The sectoral water-use economic benefit in China exhibits pronounced spatial heterogeneity. Moreover, the spatial distribution of economic benefit of water use is not entirely consistent with the level of economic development of the city. Given that China’s agricultural production relies primarily on irrigation, the high economic benefit of water use regions are primarily concentrated on both sides surrounding of the “Hu Huanyong Line”. Regions with high economic benefit of industrial water use are mainly found in the North China Plain, the middle and lower Huanghe River basin, the Yangtze River Delta, the Pearl River Delta, Chongqing and Chengdu. However, industrial water use encompasses both fresh water and non-conventional sources, while internal recirculated water volumes are excluded, which may have an impact on the result. The economic benefit of service water use is higher in the north than in the south area. Nevertheless, the water use of service sector remains comparatively low in relation to that of other industries, resulting in its marginal consideration in the context of water resource allocation. With the upgrading of the industrial structure, the service sector may receive more attention.
Based on the fundamental distribution of water resources and the spatial heterogeneity of economic benefit of water use, potential water diversion areas can be preliminarily identified. The Haihe River Basin in the North China Plain is a potential water-receiving area, some areas along the southeast coast can be included in the potential transfer area depending on the degree of water shortages. The eastern part of Southwest China is rich in water resources and has a low altitude, as well as the middle and lower reaches of the Yangtze River (which have actually already been used as the exporting area of the East and Middle Lines of the South-to-North Water Diversion Project and the subsequent planning of the first phase of operation and subsequent planning) is a potential exporting area. Further research about marginal benefits and water use costs, along with dynamic updates, is required for water diversion projects and the spatial equilibrium of water resource allocation.
References
- Rockström, J., et al., The unfolding water drama in the Anthropocene: towards a resilience-based perspective on water for global sustainability. Ecohydrology, 2014. 7(5): p. 1249-1261. [CrossRef]
- Lyu, H.D., H.F. Xing, and T.X. Duan, Optimizing Water Resource Allocation for Food Security: An Evaluation of China’s Water Rights Trading Policy. Sustainability, 2024. 16(23). [CrossRef]
- Hoekstra, A.Y. and M.M. Mekonnen, Reply to Ridoutt and Huang: From water footprint assessment to policy. Proceedings of the National Academy of Sciences of the United States of America, 2012. 109(22): p. E1425-E1425. [CrossRef]
- Liu, D., et al., Water rights trading and corporate productivity: Evidence from a quasi-natural experiment of China’s pilot policy. Journal of Economic Surveys, 2024. 38(5): p. 1846-1872. [CrossRef]
- Chen, Y., et al., Dynamics and Drivers of Ecosystem Service Values in the Qionglai-Daxiangling Region of China’s Giant Panda National Park (1990-2020). Systems, 2025. 13(9). [CrossRef]
- Dong, T., et al., Evaluation and Diagnosis of Water Resources Spatial Equilibrium Under the High-Quality Development of Water Conservancy. Journal of the American Water Resources Association, 2025. 61(2). [CrossRef]
- Lou, Y.Q., et al., Spatial Equilibrium Evaluation of the Water Resources in Tai’an City Based on the Lorenz Curve and Correlation Number. Water, 2023. 15(14). [CrossRef]
- Li, F., et al., Spatial equilibrium evaluation of water resources in the water-receiving area of the central route of the South-to-North water diversion project in Henan province. Water Science and Technology, 2025. 92(7): p. 1021-1049. [CrossRef]
- Grafton, R.Q., et al., The paradox of irrigation efficiency. Science, 2018. 361(6404): p. 748-750. [CrossRef]
- Young, H.P., N. Okada, and T. Hashimoto, Cost Allocation in Water-Resources Development. Water Resources Research, 1982. 18(3): p. 463-475. [CrossRef]
- Peng, Z.Y., et al., Assessment of the Socio-Economic Impact of a Water Diversion Project for a Water-Receiving Area. Polish Journal of Environmental Studies, 2020. 29(2): p. 1771-1784. [CrossRef]
- Wu, L.Z., T. Bai, and Q. Huang, Tradeoff analysis between economic and ecological benefits of the inter basin water transfer project under changing environment and its operation rules. Journal of Cleaner Production, 2020. 248. [CrossRef]
- Yu, M., et al., Sustainability of mega water diversion projects: Experience and lessons from China. Science of the Total Environment, 2018. 619: p. 721-731. [CrossRef]
- Ju, Y.S., et al., Cost Apportionment Method for Transmission and Distribution Projects Based on Multiple Apportionment Factors. Sustainability, 2024. 16(20). DOI: ARTN 884410.3390/su16208844.
- He, G., S.Y. Zhang, and S.Y. Zhang, Analysis of Decoupling State between Water Use Efficiency and Economic Development under Rank-Sum Score Hierarchy -Anhui Province as an Example. Polish Journal of Environmental Studies, 2025. [CrossRef]
- Liu, B., et al., Development of a conceptual regional industrial water use efficiency model driven by economic development level. Journal of Hydrology-Regional Studies, 2024. 55. [CrossRef]
- Quan, Z.M., et al., A multi-index comprehensive evaluation method for assessing the water use balance between economic society and ecology considering efficiency-development-health-harmony. Scientific Reports, 2024. 14(1). [CrossRef]
- Yin, Y.Y., et al., Quantifying Water Scarcity in Northern China Within the Context of Climatic and Societal Changes and South-to-North Water Diversion. Earths Future, 2020. 8(8). [CrossRef]
- Wang, D., et al., Study on benefits evaluation of water diversion project: Case study in water transfer from the Yangtze River to Lake Taihu. 5th International Conference on Water Resource and Environment (Wre 2019), 2019. 344. [CrossRef]
- Ni, Y.K. and Y. Chen, Does the implementation sequence of adaptive management countermeasures affect the collaborative security of the water-energy-food nexus? A case study in the Yangtze River Economic Belt. Ecological Indicators, 2024. 163. [CrossRef]
- Ilyas, A., T. Manzoor, and A. Muhammad, A Dynamic Socio-Hydrological Model of the Irrigation Efficiency Paradox. Water Resources Research, 2021. 57(12). [CrossRef]
- Shi, C.F., et al., Research on the impact of China’s new urbanization on industrial water utilization efficiency - based on spatial spillover effects and threshold characteristics. Water Science and Technology, 2023. 87(8): p. 1832-1852. [CrossRef]
- Ding, X.H., Z. Fu, and H.W. Jia, Study on Urbanization Level, Urban Primacy and Industrial Water Utilization Efficiency in the Yangtze River Economic Belt. Sustainability, 2019. 11(23). [CrossRef]
- Xu, W.J., et al., Study on the Coupling Coordination Relationship between Water-Use Efficiency and Economic Development. Sustainability, 2020. 12(3). [CrossRef]
- Lankford, B.A., Resolving the paradoxes of irrigation efficiency: Irrigated systems accounting analyses depletion-based water conservation for reallocation. Agricultural Water Management, 2023. 287. [CrossRef]
- Cai, W.J., et al., Spatial scale effect of irrigation efficiency paradox based on water accounting framework in Heihe River Basin, Northwest China. Agricultural Water Management, 2023. 277. [CrossRef]
- Kalvani, S.R. and F. Celico, Analysis of Pros and Cons in Using the Water-Energy-Food Nexus Approach to Assess Resource Security: A Review. Sustainability, 2024. 16(7). [CrossRef]
- Zhu, Y., C.Z. Zhang, and D.C. Huang, Assessing Urban Water-Energy-Food Security: A Case of Yangtze River Delta Urban Agglomeration. Social Indicators Research, 2024. 175(2): p. 487-516. [CrossRef]
- Wang, X.X., et al., Gainers and losers of surface and terrestrial water resources in China during 1989-2016. Nature Communications, 2020. 11(1). [CrossRef]
- Zou, D.L. and H.B. Cong, Evaluation and influencing factors of China’s industrial water resource utilization efficiency from the perspective of spatial effect. Alexandria Engineering Journal, 2021. 60(1): p. 173-182. [CrossRef]
- Okamoto, S., et al., A Factor-Analysis Multiple-Regression Model for Source Apportionment of Suspended Particulate Matter. Atmospheric Environment Part a-General Topics, 1990. 24(8): p. 2089-2097. [CrossRef]
- Yu, E.R., et al., Source apportionment and influencing factors of surface water pollution through a combination of multiple receptor models and geodetector. Environmental Research, 2024. 263. [CrossRef]
- Berrittella, M., et al., The economic impact of restricted water supply: A computable general equilibrium analysis. Water Research, 2007. 41(8): p. 1799-1813. [CrossRef]
- Czyzewski, B., et al., Does Increasing Agricultural Efficiency Contribute to Food Security-Trade-Offs of Value Addition in Crop Production? Sustainable Development, 2025. [CrossRef]
- Fu, P. and Y. Zhang, Enhancing resource efficiency and value addition in food and agricultural by-product processing: a green recycling approach. Frontiers in Sustainable Food Systems, 2025. 9. [CrossRef]
- Qamar, Z., et al., Experimental and Numerical Simulations of a Solar Air Heater for Maximal Value Addition to Agricultural Products. Agriculture-Basel, 2023. 13(2). [CrossRef]
- Keesstra, S., et al., The superior effect of nature based solutions in land management for enhancing ecosystem services. Science of the Total Environment, 2018. 610: p. 997-1009. [CrossRef]
- Fang, L. and L. Zhang, Does the trading of water rights encourage technology improvement and agricultural water conservation? Agricultural Water Management, 2020. 233. [CrossRef]
- Lyu, J., et al., Seeking a pathway towards a more sustainable human-water relationship by coupled model - From a perspective of socio-hydrology. Journal of Environmental Management, 2024. 368. [CrossRef]
- Xu, X.H., et al., Sustainable management of agricultural water rights trading under uncertainty: An optimization-evaluation framework. Agricultural Water Management, 2023. 280. [CrossRef]
- Lyu, F., et al., Tracking and assessing water behaviors in the management of irrigation districts’ water rights trading through water accounting. Agricultural Water Management, 2025. 318. [CrossRef]
- Tembo, G., et al., Direct market valuation method to evaluate economic value of provisioning ecosystem services on household income in Zambia’s Bangweulu Wetland. Frontiers in Environmental Science, 2025. 13. [CrossRef]
- Song, Z., et al., Evaluation of ecosystem service value based on land use change and analysis of driving forces in Ningxiang City, a representative county in the metropolitan hinterland in Hunan Province, China. Frontiers in Environmental Science, 2025. 13. [CrossRef]
Figure 1.
Spatial distribution of (a) the amount of water use, (b) value added, and (c) economic benefit of water use in agricultural sector across major cities in China.
Figure 1.
Spatial distribution of (a) the amount of water use, (b) value added, and (c) economic benefit of water use in agricultural sector across major cities in China.
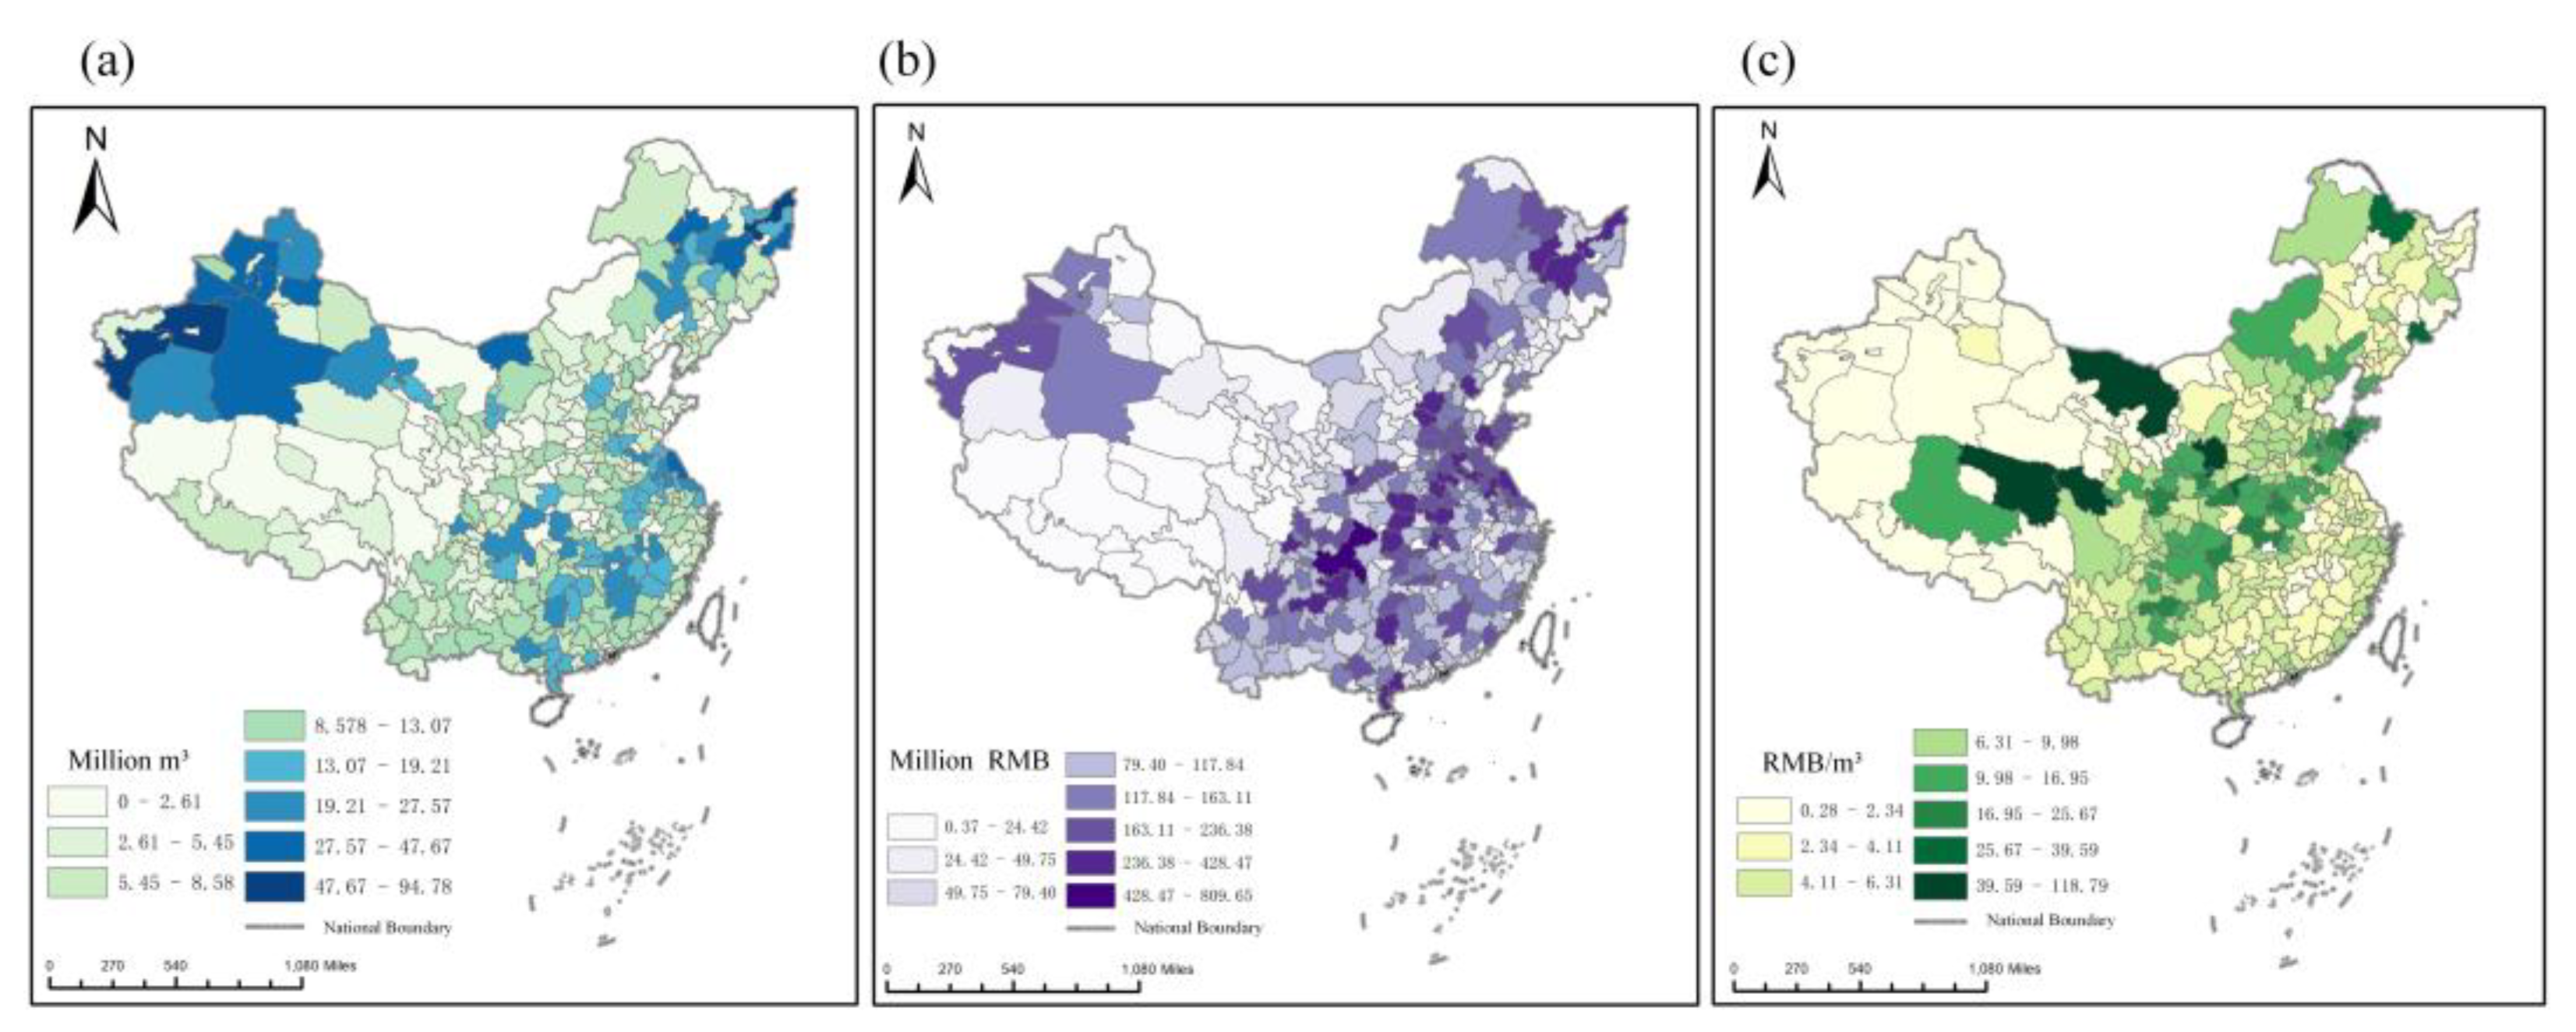
Figure 2.
The top 30 cities by value of (a) water use, (b) value added, and (c) economic benefit of water use in agricultural sector across major cities in China.
Figure 2.
The top 30 cities by value of (a) water use, (b) value added, and (c) economic benefit of water use in agricultural sector across major cities in China.
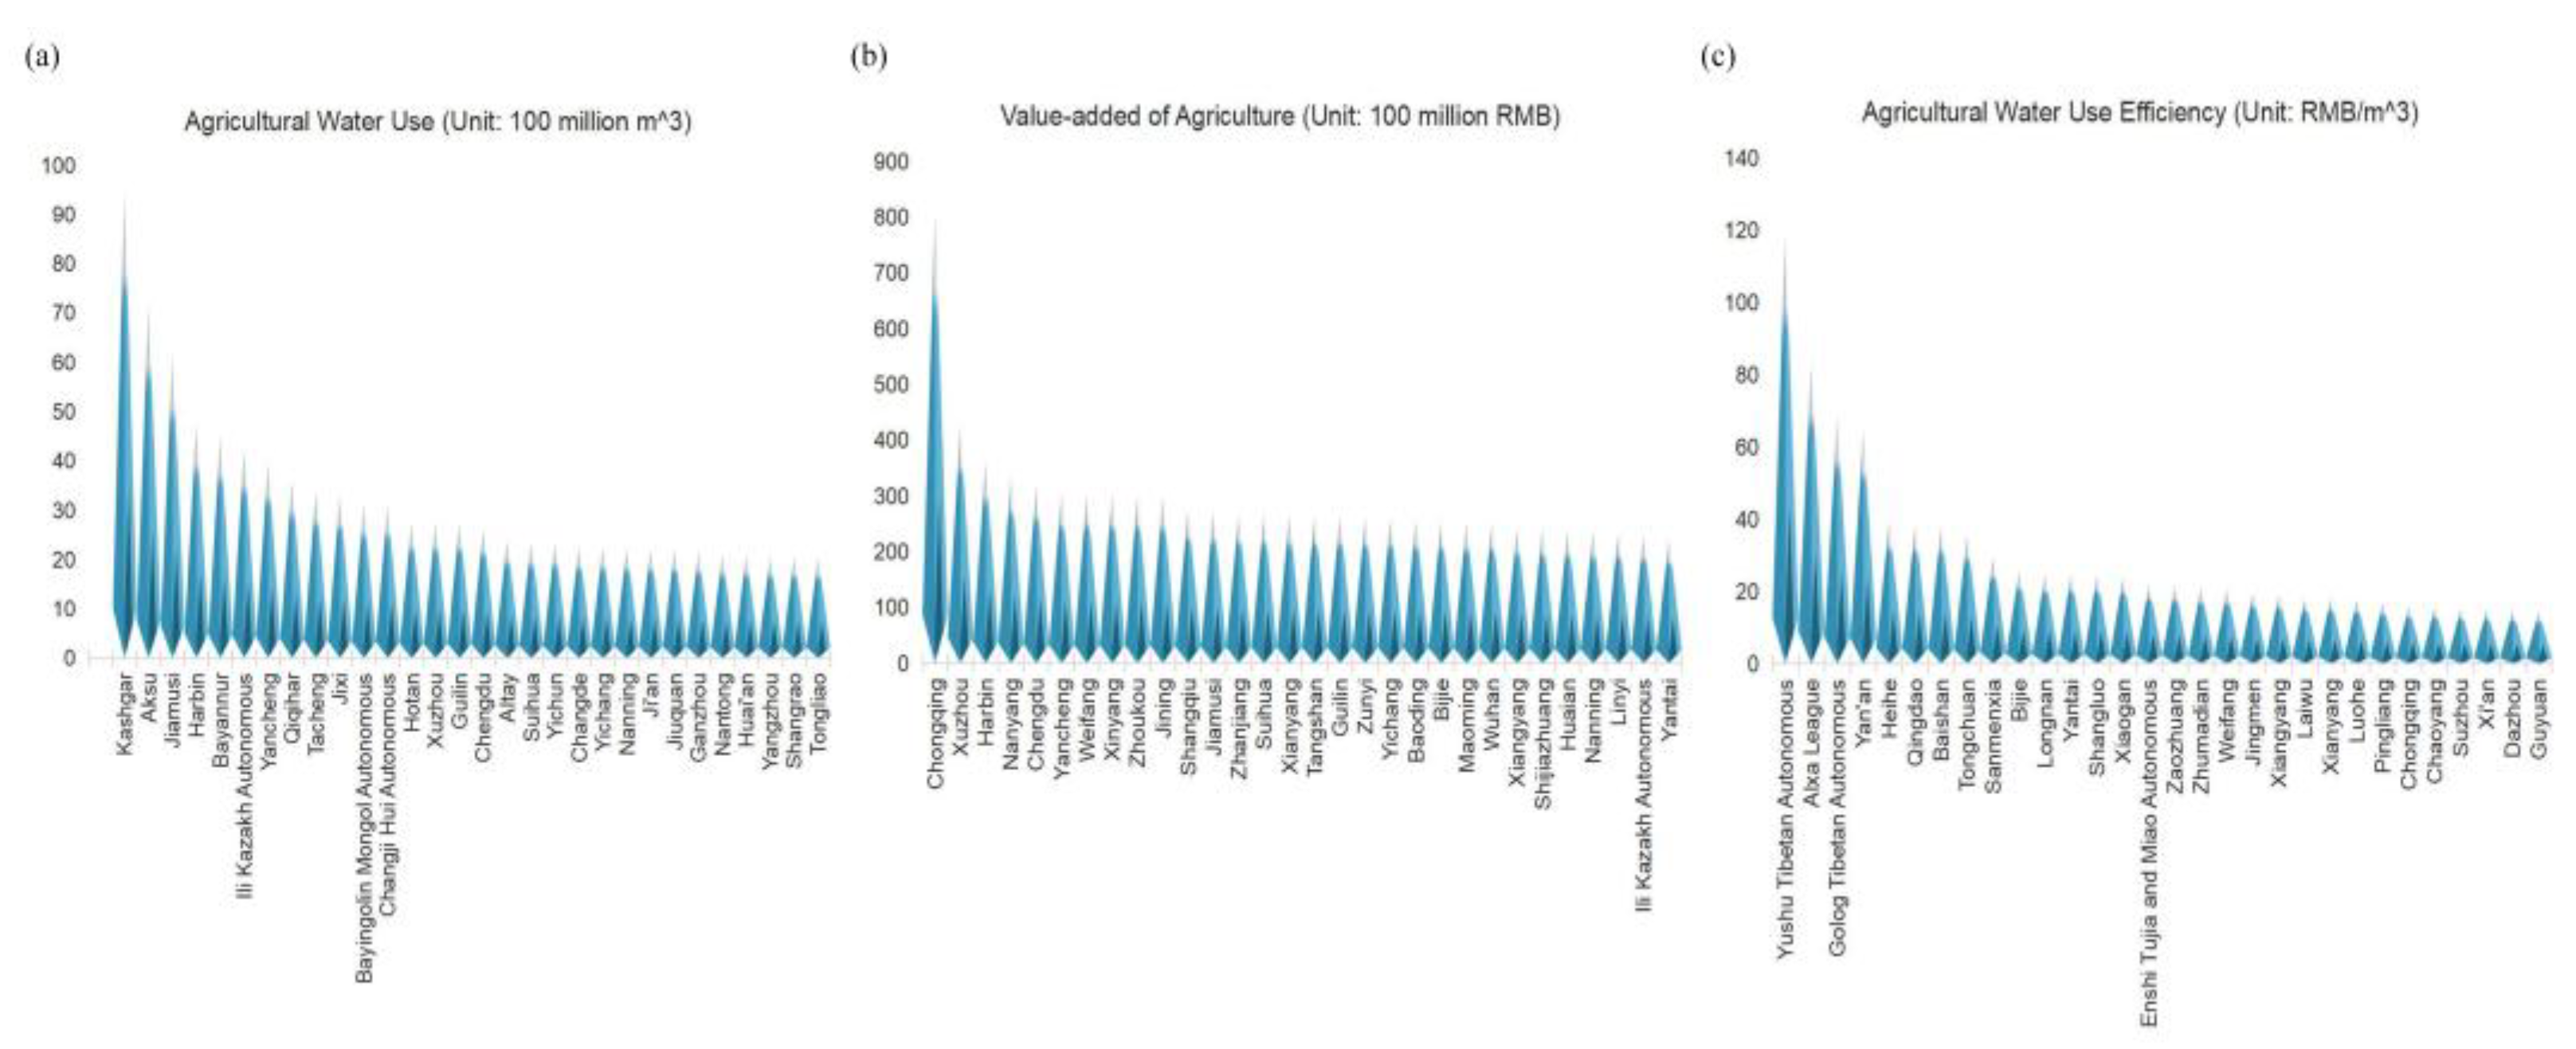
Figure 3.
The spatial patterns of (a) the amount of water use, (b) value added, and (c) economic benefit of water use in industrial sector across major cities in China.
Figure 3.
The spatial patterns of (a) the amount of water use, (b) value added, and (c) economic benefit of water use in industrial sector across major cities in China.
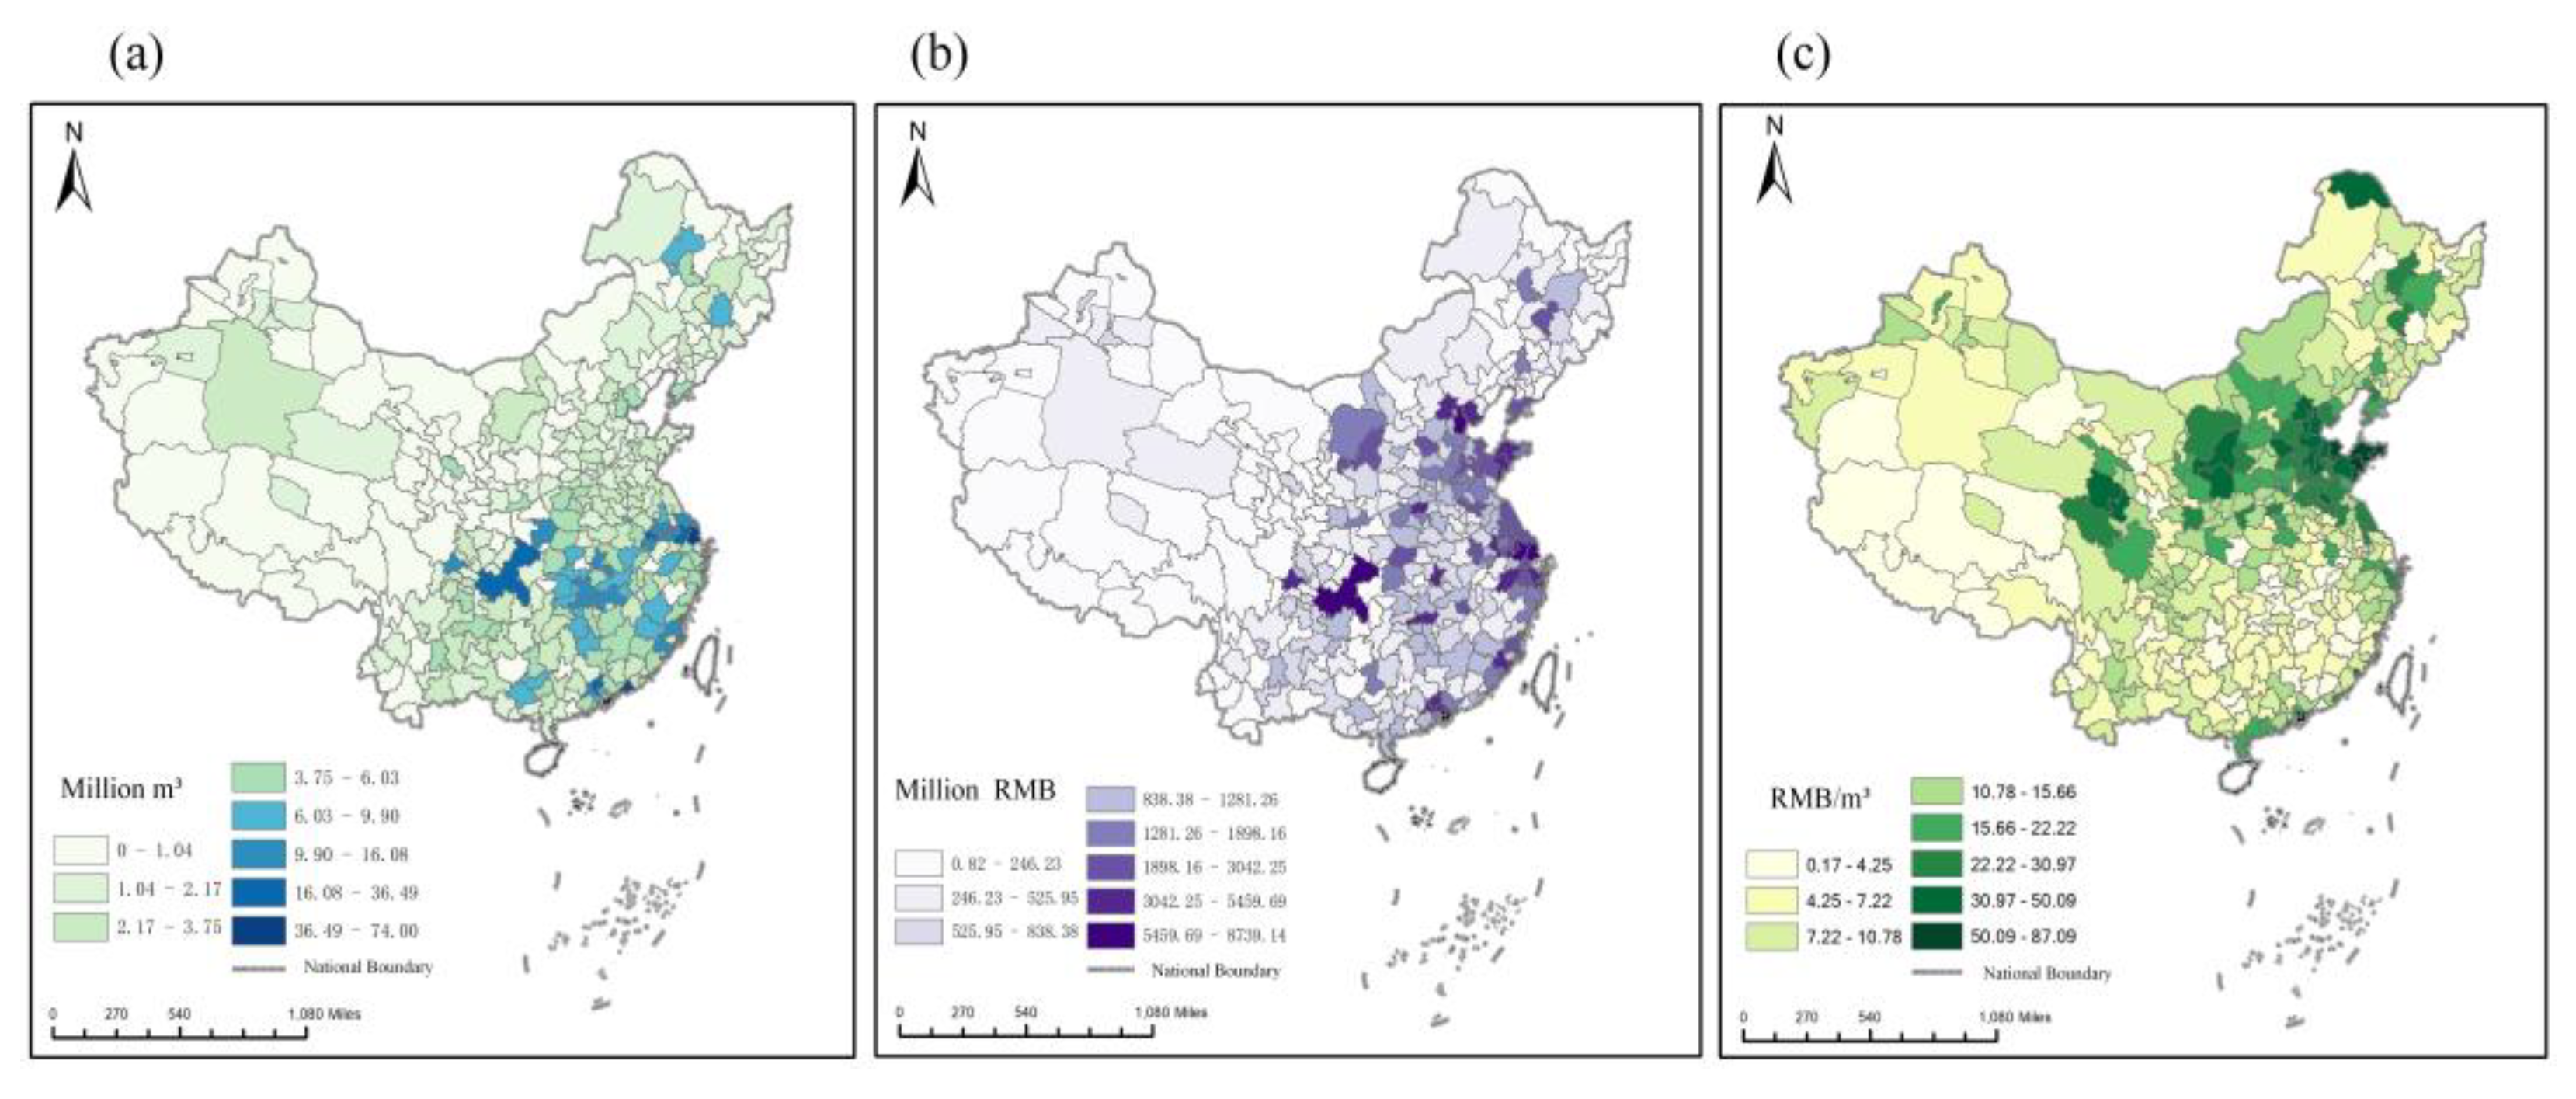
Figure 4.
The top 30 cities by value of (a) water use, (b) value added, and (c) economic benefit of water use in industrial sector across major cities in China.
Figure 4.
The top 30 cities by value of (a) water use, (b) value added, and (c) economic benefit of water use in industrial sector across major cities in China.
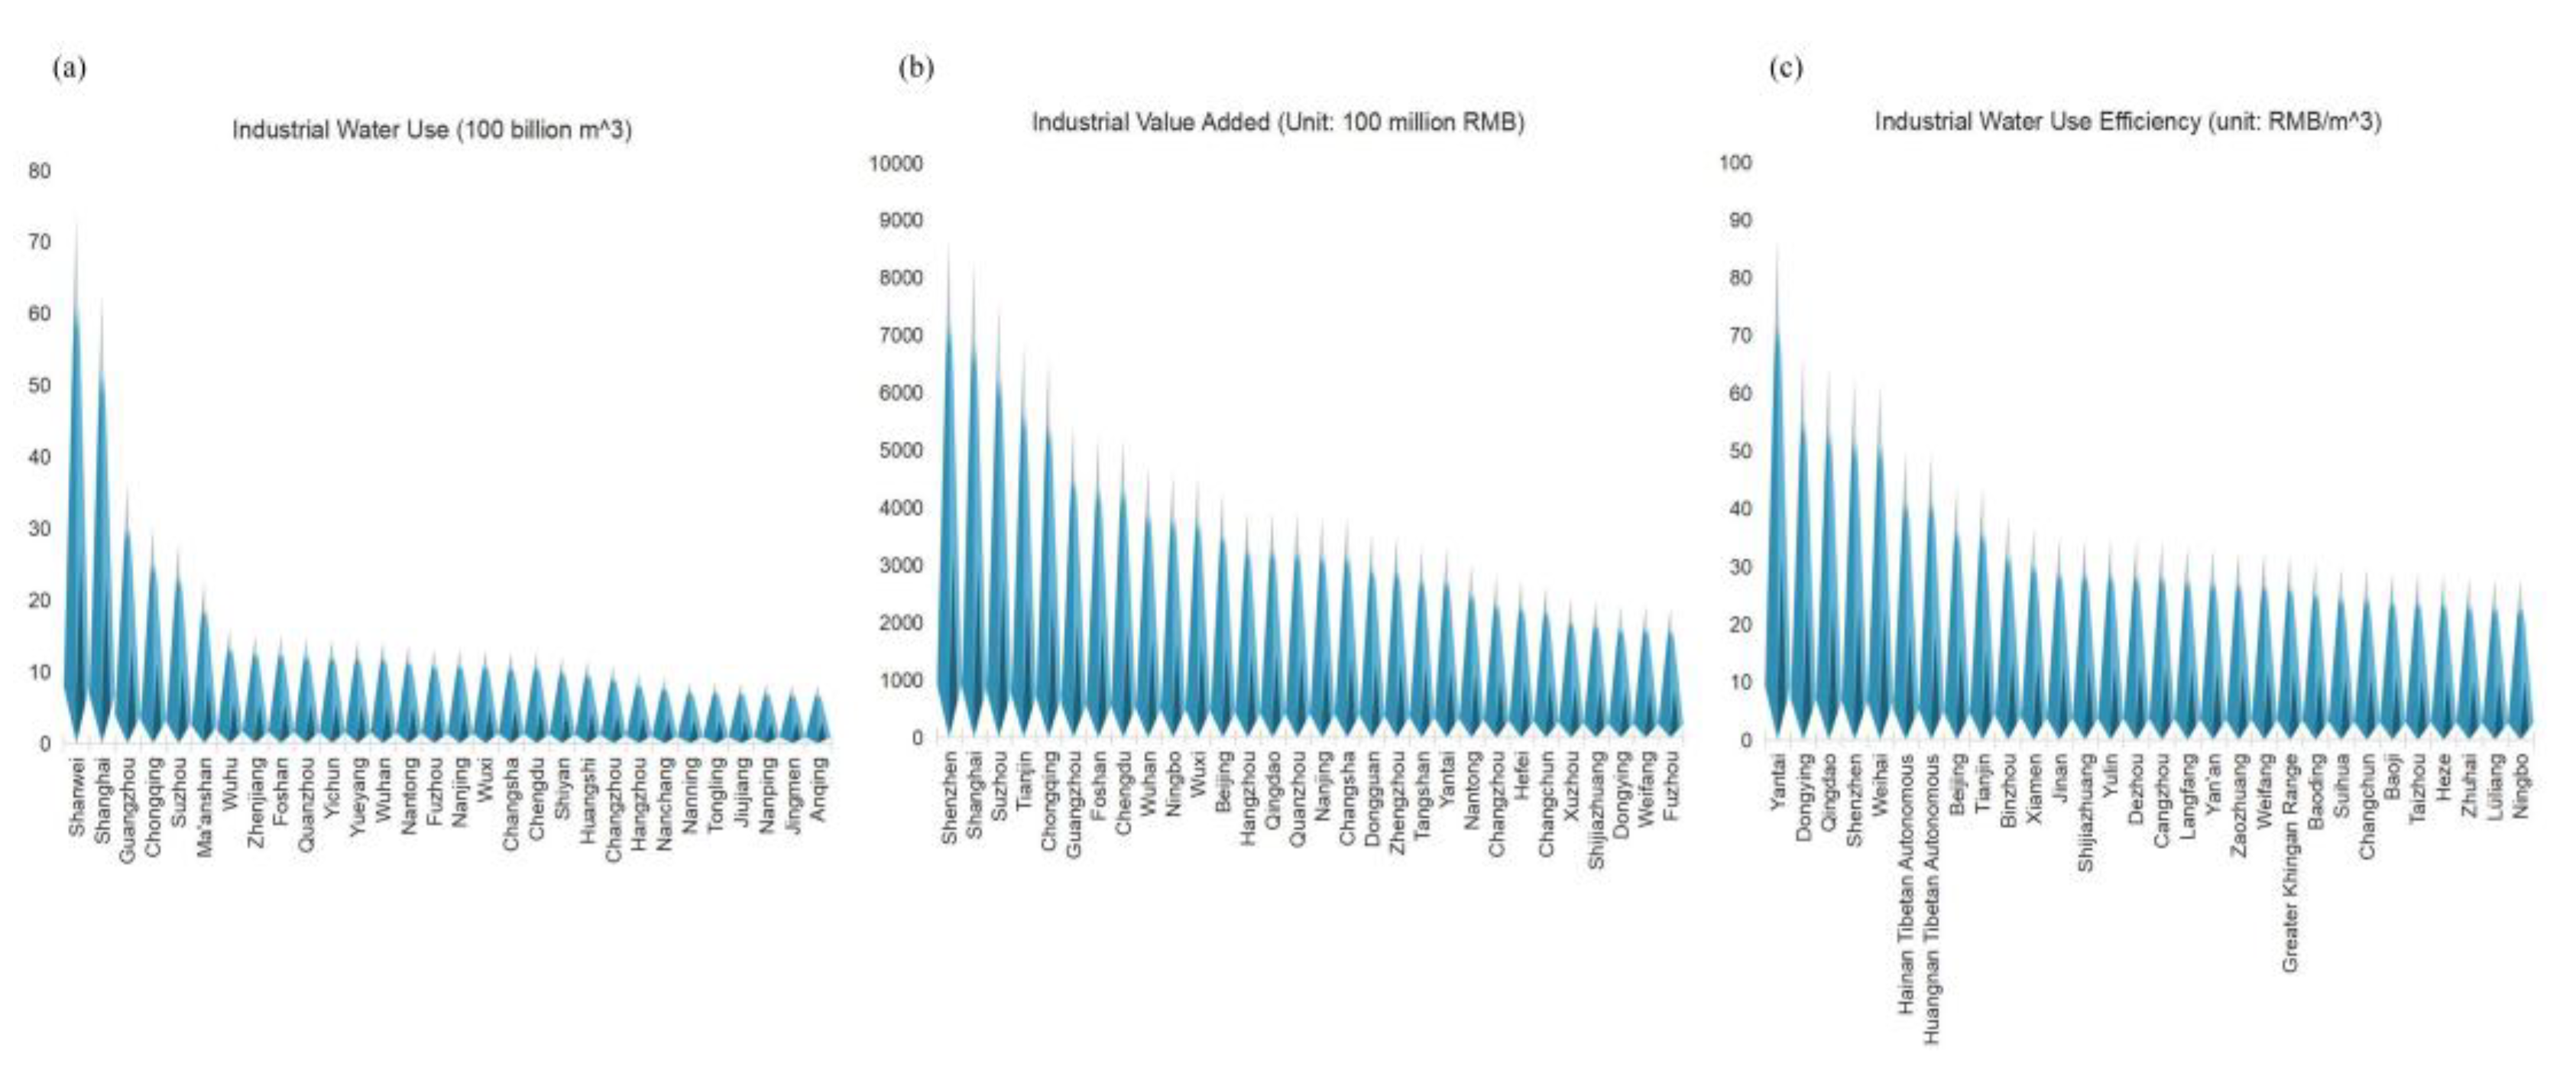
Figure 5.
The spatial patterns of (a) the amount of water use, (b) value added, and (c) economic benefit of water use in service sector across major cities in China.
Figure 5.
The spatial patterns of (a) the amount of water use, (b) value added, and (c) economic benefit of water use in service sector across major cities in China.
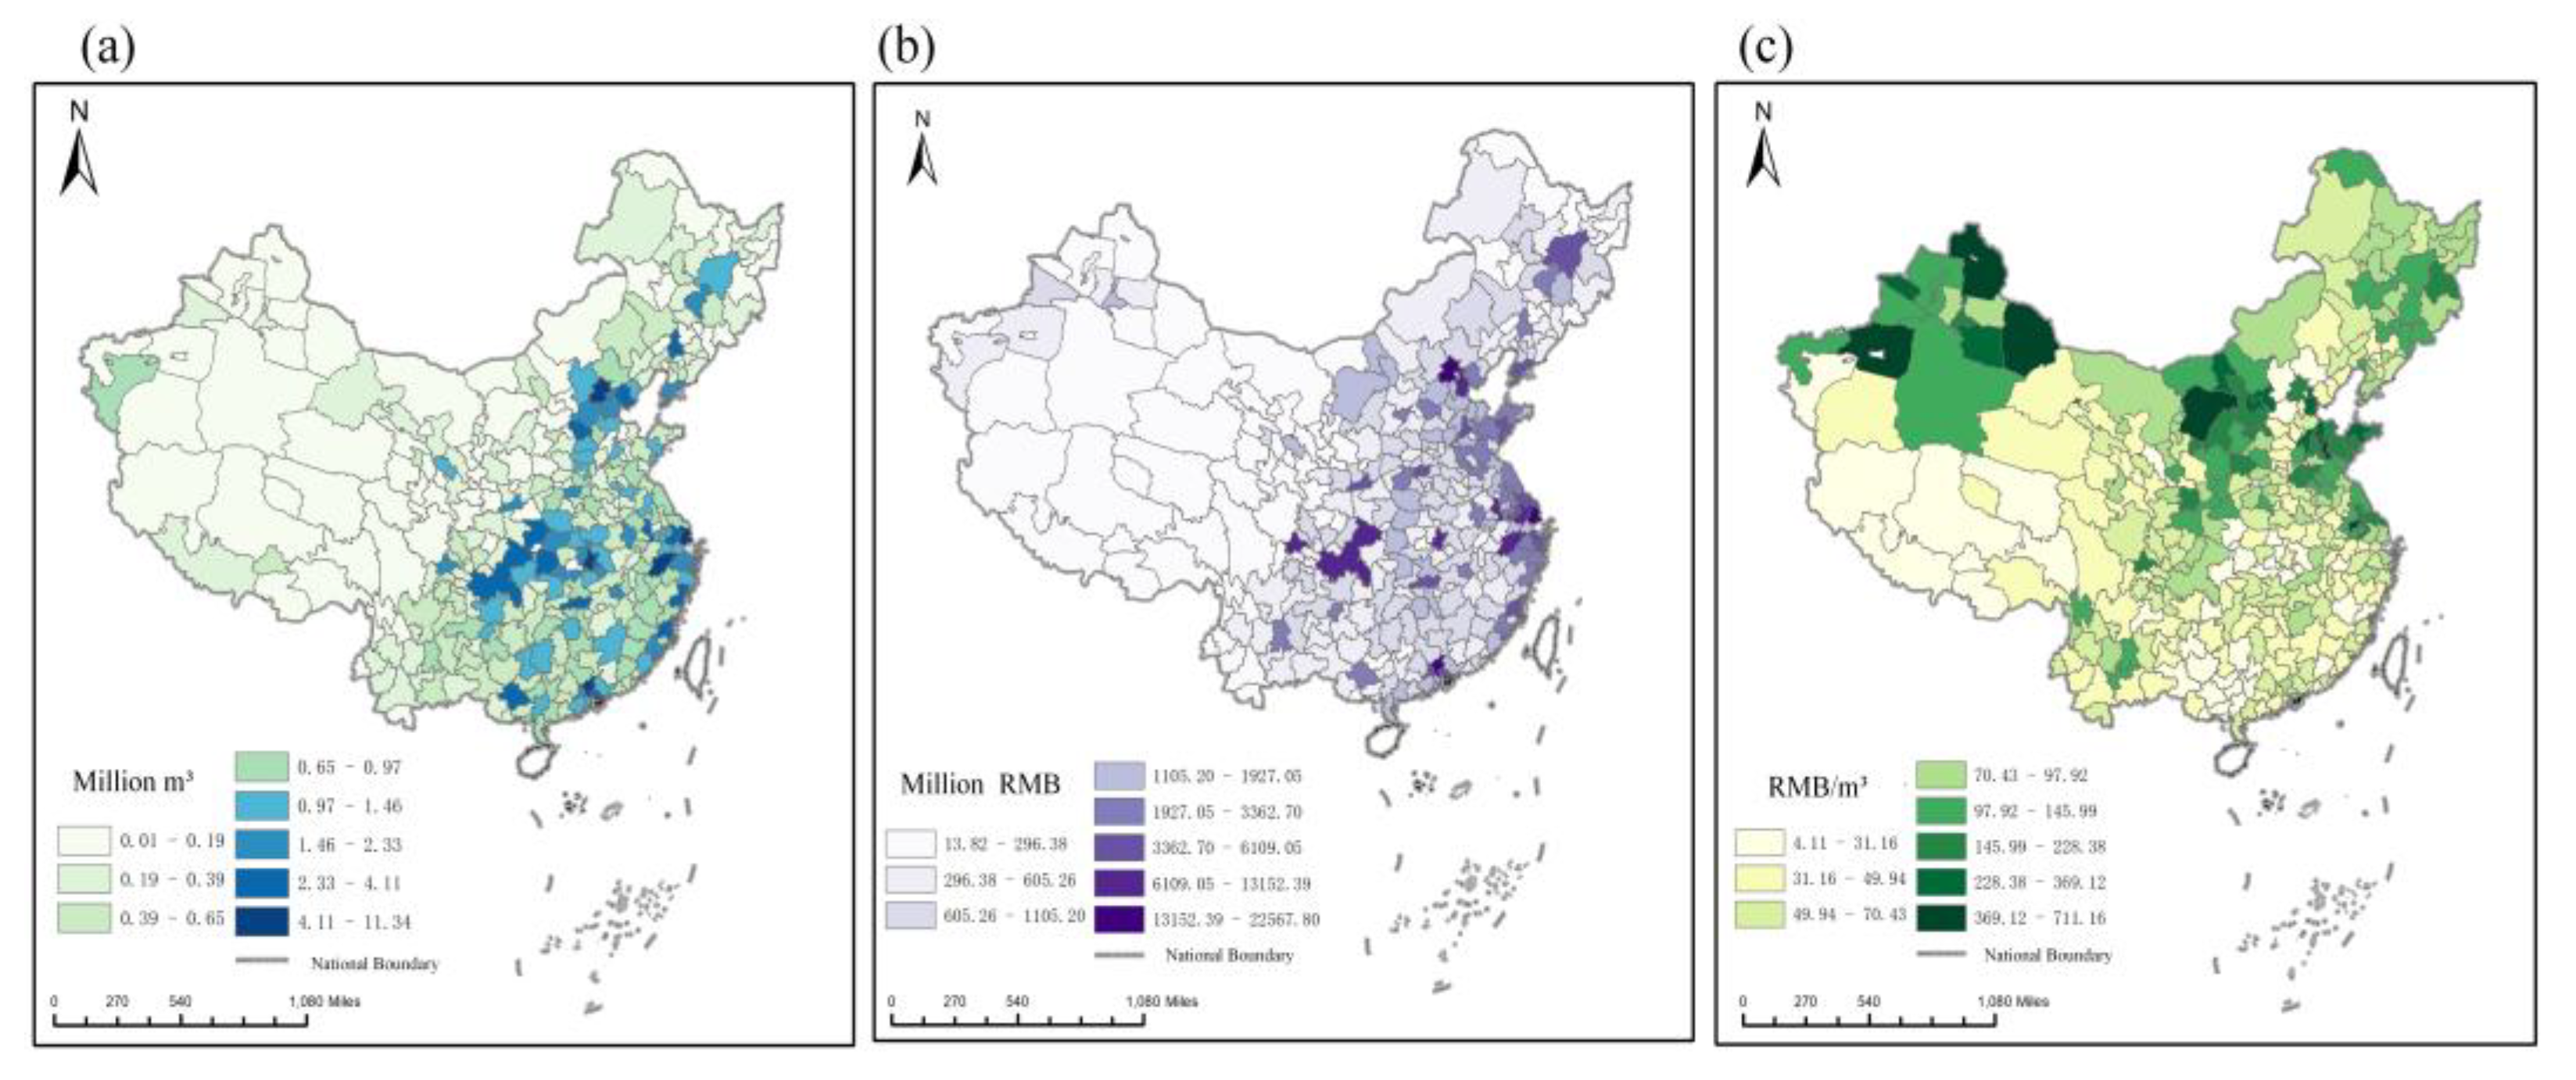
Figure 6.
The top 30 cities by value of (a) water use, (b) value added, and (c) economic benefit of water use in service sector across major cities in China.
Figure 6.
The top 30 cities by value of (a) water use, (b) value added, and (c) economic benefit of water use in service sector across major cities in China.
Disclaimer/Publisher’s Note: The statements, opinions and data contained in all publications are solely those of the individual author(s) and contributor(s) and not of MDPI and/or the editor(s). MDPI and/or the editor(s) disclaim responsibility for any injury to people or property resulting from any ideas, methods, instructions or products referred to in the content. |
© 2025 by the authors. Licensee MDPI, Basel, Switzerland. This article is an open access article distributed under the terms and conditions of the Creative Commons Attribution (CC BY) license (http://creativecommons.org/licenses/by/4.0/).
Copyright: This open access article is published under a Creative Commons CC BY 4.0 license, which permit the free download, distribution, and reuse, provided that the author and preprint are cited in any reuse.


