
Submitted:
19 November 2025
Posted:
21 November 2025
You are already at the latest version
Abstract
The friction law, which requires that the friction stress is a constant fraction of the local yield shear stress, is widely used for modeling bulk metal forming processes. Determining the friction factor involved in this friction law requires experiment and its theoretical description. It is advantageous if the latter is not based on the finite element or similar methods, since the friction factor is unknown prior to the calculation. The present paper suggests using a plane strain compression test. The experimental setup is slightly more complicated than the standard ring compression test. However, its advantage lies in the availability of relatively simple and accurate theoretical solutions for a broad class of constitutive equations, which overcomes the experimental disadvantage. The present paper is limited to isotropic strain-hardening materials. The experimental research is conducted on aluminum alloy AA 6026 and steel C45. The friction factor is determined for three types of lubricant.
Keywords:
friction law
; friction factor
; metal forming
; plane strain compression
1. Introduction
Friction between the tool and the workpiece inevitably appears in nearly all metal forming processes. The accuracy of the friction law has a significant impact on the accuracy of theoretical solutions, including finite element solutions. One of the friction laws widely used for modeling cold bulk metal forming processes postulates that the friction stress is a fraction of the local shear yield stress. This law contains one constitutive parameter, the friction factor. A theoretical-experimental method is required to determine this factor.
Until now, the ring compression test proposed in [1] has been one of the most widely used methods for determining the friction factor. In particular, paper [2] has emphasized adhesive friction. This paper has determined the strain hardening behavior from the same test. The initial geometry of the ring may play a significant role, especially if the friction factor is sufficiently large. The standard geometry is classified by the ratios ‘outer diameter : the inner diameter : the height = 6 : 3 : 2.’ However, the friction law at sliding is invalid where the material sticks to the tool. In some cases, this sticking region occupies the entire friction surface, and the theoretical solution becomes insensitive to the increasing friction factor [3]. Generally, the sticking region enlarges with the friction factor, but also depends on geometric parameters. Therefore, the standard ratios above are sometimes replaced with the ratios ‘outer diameter : the inner diameter : the height = 6 : 3 : 1’ in case of high friction [4]. The performance of several lubricants commonly used in metal forming processes has been evaluated using the ring compression test in [5]. It has been emphasized in [6] that the friction factor may change as the deformation proceeds. The hot ring compression test is also used for applications to metal forming processes at elevated temperatures [7]. The barrel compression test proposed in [8] can be regarded as a simplified version of the ring compression test.
A friction test, which essentially differs from the ring compression test, has been proposed in [9]. The test is based on a double backward extrusion process.
Independent of the experimental procedure, a theoretical solution is required to determine the friction factor. It is worth noting that this solution must be repeated multiple times because the friction factor is unknown and must be determined through this solution and experimental results. Therefore, it is desirable to employ a theoretical method that can quickly produce accurate solutions. Typically, the upper bound technique is adopted (for example, [8,10,11] among numerous publications). However, this technique provides reliable results only at the initial instant. One must use the sequential limit analysis to account for strain hardening and shape change [12]. The efficiency and simplicity of the classical limit analysis are lost in this case. Therefore, it is desirable to develop a method for determining the friction factor that is relatively simple experimentally and allows for a relatively simple and accurate theoretical solution to be found for a large class of material models.
The method proposed in this paper is plane strain compression between parallel platens, assuming that the specimen’s thickness is much smaller than its width and length. An approximate analytical solution for perfectly plastic materials is well known [13] (p. 226). It is also known that this solution is very accurate [14]. Moreover, the solution for perfectly plastic materials has been generalized to many material models [15,16,17,18]. Particularly, continued compression of a strip of strain hardening materials has been considered in [16], assuming linear hardening. This solution is extended to non-linear strain hardening in the present paper. Then, this solution, combined with the experimental results also obtained in the present paper, determines the friction factor for two materials (AA 6062 and C 45) and several frictional conditions.
2. Methodology
A schematic diagram of the experimental setup is shown in Figure 1, with the specimen in its initial position. The initial thickness, width, and length of the specimen are 2t0, 2b0, and 2a0, respectively. The width remains constant throughout the deformation process. The ratio t0 / a0 is supposed to be small enough so that the solutions in [16] are good approximations. The lateral contact surfaces between the specimen and the die must be treated to minimize friction. No special treatment is required for the other contact surfaces, where the friction factor is determined. It is convenient to choose the time-like parameter, which determines the stage of deformation, as
where 2t is the current thickness of the specimen. The compression force F is measured as a function of this parameter.
The material is supposed to be rigid-plastic, exhibiting strain-hardening behavior. The strain-hardening behavior is determined from the cylinder compression test by employing the Rastegaev method [19].
The theoretical dependence of the compression force on η is computed employing the solution in [16], the data of the standard tensile test, and several guessed friction factors. Comparison with the corresponding experimental curves allows for an estimation of the friction factor.
3. Plane Strain Compression
3.1. Experiment
Two materials are used in the current study: aluminum alloy AA 6026 and steel C45. The specimens for plane strain compression were machined from 32 mm diameter rods. The initial dimensions of specimens were 2a0 = 25 mm, 2b0 = 14 mm, and 2t0 = 6 mm (Figure 1). The frictional conditions varied using two types of lubricants and no lubricant. To conveniently describe the experimental conditions and results, the different frictional conditions are denoted by three groups:
- MOLUB HK cold forging oil (ISO 6743/7, L – MHE; ISO/TS 12927), manufactured by Oil Refinery Modriča, Bosnia and Herzegovina – group O,
- Mixture of MoS₂ grease and stearin – group GS,
- No lubricant – group D.
Three tests were conducted for each combination of the materials and the frictional conditions (a total of 18 tests).
A CAD model of the experimental setup is shown in Figure 2. The tests were conducted on a Sack & Kieselbach hydraulic press, equipped with an ejector. The variation of the compression force F with the die stroke S was continuously recorded during the compression process using a Spider 8 Hottinger Baldwin Messtechnik electronic measuring system. The tests were carried out at room temperature with a punch speed of 0.015 mm/s.
The specimens of the different groups were treated differently for testing. The cleaned specimens of Group O were immersed in a container with the oil. The die’s working surfaces were also covered with the same oil before each test. The cleaned specimens of Group GS were first coated with MoS₂ grease and then sprinkled with stearin powder. The die’s working surfaces were coated with the same mixture. The specimens of Group D were washed with benzene and then dried before testing. The die was disassembled, thoroughly cleaned, and washed of previous lubricants, and the die’s working surfaces were cleaned with benzene.
3.2. Theory
A solution for plane strain compression of a rigid-plastic, linear strain-hardening material has been provided in [16]. However, a significant part of this solution does not use a specific hardening law. Therefore, it is straightforward to generalize the final result to non-linear hardening. Owing to symmetry, it is sufficient to consider the domain and (Figure 8).
The current length of the strip is denoted as 2a. The speed of each die is V. The equivalent strain rate is defined as
where , , and are the strain rate components referred to the Cartesian coordinate system. The equivalent strain is calculated from the following equation:
where is the material derivative. The plane strain yield criterion is
where k is the shear yield stress, k0 is its initial value, and is an arbitrary function of the equivalent strain satisfying the conditions and for all . The friction law is
where τf is the friction stress, kf is the value of k at the friction surface, and m is the friction factor. Let be the value of the equivalent strain at the friction surface. Then, equations (4) and (5) combine to give
The complete system of equations consists of (3), (4), the associated flow rule, and the stress equilibrium equations. It has been shown in [16] that the solution of this system is facilitated by introducing the following variable φ:
where . The equivalent strain rate defined in (2) is given by
It has also been shown in [16] that equation (3) transforms to
Eliminating here the equivalent strain rate employing (8), further eliminating φ employing (7), and replacing differentiation with respect to t with differentiation with respect to η using (1), one gets
where . Since and at the friction surface, equation (10) leads to
The solution of this equation satisfying the initial condition at is
This equation allows one to represent as a function of η. Therefore, equation (10) can be solved numerically for any value of μ in the interval employing the initial condition at . Having this solution for the equivalent strain, it is straightforward to calculate the through-thickness distribution of .
The load on each die has been calculated in [16] as
Replacing here integration with respect to y with integration with respect to yields
It follows from the equation of incompressibility and (1) that
Equations (14) and (15) combine to give
where .
4. Cylinder Compression Test
The strain hardening behavior of the materials was determined using the cylinder compression test by Rastegaev’s method [19]. The specimen’s geometry before testing is shown in Figure 9. The specific geometric parameters are H0 = 20 mm, d0 = 20 mm, u = 0.6 mm, and h0 = 19.4 mm. Three nominally identical specimens of each material were tested. The variation of the compression force F with the die stroke S was continuously recorded during the compression process using a Spider 8 Hottinger Baldwin Messtechnik electronic measuring system. The corresponding curves are depicted in Figure 10. Assuming that the deformation is homogeneous and considering the plastic incompressibility of the materials, one can calculate the current area A and the flow stress K as
The equivalent Mises strain is
5. Determination of the Friction Factor
The yield stress required by the theoretical solution in Section 3.2 is replaced with the proof strength σ02, as is commonly accepted. The value of σ02 was determined using the experimental data in Figure 11. As a result, σ02 = 302 MPa for AA 6062 and σ02 = 575 MPa for C45. Assuming the von Mises yield criterion, one gets .
The relationship between the equivalent strain εeq and the Mises equivalent strain φe is
The functions for the two materials were represented by interpolating functions of the first order using equation (19) and the experimental data in Figure 11. Figure 12 and Figure 13 depict the variation of f with η for several m-factors computed by employing the theoretical solution in Section 3.2. The same figures display the experimental data obtained using Figure 6 and Figure 7, the definition of f in (16), the equation , and the values of σ02 mentioned above. The theoretical curves were computed within the range of the experimental data in the cylinder compression test (i.e., no extrapolation was used). The leftmost points of the theoretical curves correspond to the value of the equivalent strain at the friction surface equal to the maximum value of the equivalent strain in the cylinder compression test.
It is seen from Figure 12 and Figure 13 that the friction law in (5) does not represent the real frictional behavior, except for the steel specimens compressed with no lubricant. In the latter case, in the range of the equivalent strain covered by the experiment, except for a small range at the beginning of the process. It is not surprising because it is commonly accepted that the friction factor varies as the deformation of a subsurface layer proceeds [20]. There are several reasons for that, such as the change of surface roughness, the change of lubricant’s properties, the rise of temperature, etc. Nevertheless, the study conducted allows for comparing the efficiency of the used lubricants and determining the initial friction factor. Particularly, Figure 12 and Figure 13 show that the lubricant denoted as Group GS is more efficient than the lubricant denoted as Group O under all the conditions investigated. Table 1 depicts the experimental values of f at the initial instant under the different conditions used. Note that the ideal frictionless compression requires f = 2 at the initial instant. Therefore, the lubricant denoted as Group GS exhibits a frictional behavior that is relatively close to this ideal condition at the beginning of the process. On the other hand, it is expected that the stick-slip phenomenon occurs when the specimens made of AA 6062 are compressed with no lubricant. Particularly, the theoretical value of f computed at m = 0.97 is f = 3.63, which is still lower than the experimental value shown in Table 1. However, it follows from (12) that as , which is a consequence of the general theory that requires the regime of sticking for strain-hardening materials if m = 1 [21]. A similar frictional behavior at the beginning of the process occurs when steel specimens are compressed without a lubricant. The initial values of m for all the cases not mentioned above were computed employing interpolating functions constructed using the calculated values of f for discrete values of m (Figure 12 and Figure 13). These values are summarized in Table 1.
6. Conclusions
From this work, the following conclusions can be drawn:
- The proposed method is efficient for evaluating the friction law (5) as the theoretical solution is relatively simple.
- The friction law (5) is not a good approximation of the friction stress, except for the steel specimens deformed with no lubricant.
- The lubricant denoted as Group GS is more efficient than that denoted as Group O.
- The overall structure of the theoretical solution suggests that it can be extended to a generalized friction law that accounts for the variation in the friction factor as deformation proceeds, providing a theoretical basis for further research.
Author Contributions
Conceptualization, S.A., and D.V.; methodology, D.V. and M.V.; software, M.R. and M.V.; validation, S.A., D.V. Y.L. and M.V.; formal analysis, Y.L., and M.V.; investigation, S.A., D.V., M.R., and N.D.; resources, D.V., N.D. and M.V.; data curation, S.A., and M.R.; writing—original draft preparation, S.A., D.V., Y.L. and M.V.; writing—review and editing, S.A. and M.V.; visualization, N.D. All authors have read and agreed to the published version of the manuscript.
Funding
Please add: This research received no external funding.
Conflicts of Interest
The authors declare no conflicts of interest.
References
- Male, A.T.; Cockcroft, M.G. A method for the determination of the coefficient of friction of metals under conditions of bulk plastic deformation. J. Inst. Met. 1964–1965, 93, 38–46. [Google Scholar]
- Li, W.Q.; Ma, Q.X. Evaluation of Rheological Behavior and Interfacial Friction under the Adhesive Condition by Upsetting Method. Int. J. Adv. Manuf. Technol. 2015, 79, 255–263. [Google Scholar] [CrossRef]
- Alexandrov, S.; Lyamina, E.; Jeng, Y.-R. A General Kinematically Admissible Velocity Field for Axisymmetric Forging and Its Application to Hollow Disk Forging. Int. J. Adv. Manuf. Technol. 2017, 88, 3113–3122. [Google Scholar] [CrossRef]
- Kakkeri, S.; Patil, N.A.; Singh, S. Validation of Experimental Conditions with Standard Friction Models during Al 6061 Ring Compression Test under Various Interfacial Conditions. J. Mech. Sci. Technol. 2025, 39, 2609–2614. [Google Scholar] [CrossRef]
- Fukugaichi, S.; Suga, Y.; Noura, S.; Takeyama, K.; Kitamura, K.; Aono, H. Frictional Property of Anionic-Surfactant-Loaded MgAl-Layered Double Hydroxide Films on Aluminum Alloy Using a Ring Compression Test. Tribol. Int. 2025, 210, 110810. [Google Scholar] [CrossRef]
- Zhang, D.; Liu, B.; Li, J.; Cui, M.; Zhao, S. Variation of the Friction Conditions in Cold Ring Compression Tests of Medium Carbon Steel. Friction 2020, 8, 311–322. [Google Scholar] [CrossRef]
- Hwang, Y.-M.; Lu, C.-Y.; Lin, G.-D.; Wang, C.-C. Die Design and Finite-Element Analysis for the Hot Forging of Automotive Wheel Frames Made of Aluminium Alloy. Int. J. Adv. Manuf. Technol. 2025, 137, 2681–2695. [Google Scholar] [CrossRef]
- Ebrahimi, R.; Najafizadeh, A. A New Method for Evaluation of Friction in Bulk Metal Forming. J. Mater. Process. Technol. 2004, 152, 136–143. [Google Scholar] [CrossRef]
- Buschhausen, A.; Weinmann, K.; Lee, J.Y.; Altan, T. Evaluation of Lubrication and Friction in Cold Forging Using a Double Backward-Extrusion Process J. Mater. Process. Technol. 1992, 33, 95–108. [Google Scholar] [CrossRef]
- Avitzur, B.; Van Tyne, C.J. Ring Forming: An Upper Bound Approach. Part 1: Flow Pattern and Calculation of Power. J. Eng. Ind. 1982, 104, 231–237. [Google Scholar] [CrossRef]
- Avitzur, B.; Van Tyne, C.J. Ring Forming: An Upper Bound Approach. Part 2: Process Analysis and Characteristics. J. Eng. Ind. 1982, 104, 238–247. [Google Scholar] [CrossRef]
- Yang, W.H. Large Deformation of Structures by Sequential Limit Analysis. Int. J. Solids. Struct. 1993, 30, 1001–1013. [Google Scholar] [CrossRef]
- Hill, R. The Mathematical Theory of Plasticity, Oxford University Press, Oxford, 1950.
- Hill, R.; Lee, E.H.; Tupper, S.J. A Method of Numerical Analysis of Plastic Flow in Plane Strain and Its Application to the Compression of a Ductile Material Between Rough Plates. J. Appl. Mech. 1951, 18, 46–52. [Google Scholar] [CrossRef]
- Marshall, E.A. The Compression of a Slab of Ideal Soil between Rough Plates. Acta Mech. 1967, 3, 82–92. [Google Scholar] [CrossRef]
- Collins, I.F.; Meguid, S.A. On the Influence of Hardening and Anisotropy on the Plane-Strain Compression of Thin Metal Strip. J. Appl. Mech. 1977, 44, 271–278. [Google Scholar] [CrossRef]
- Adams, M.J.; Briscoe, B.J.; Corfield, G.M.; Lawrence, C.J.; Papathanasiou, T.D. An Analysis of the Plane-Strain Compression of Viscoplastic Materials. J. Appl. Mech. 1997, 64, 420–424. [Google Scholar] [CrossRef]
- Alexandrov, S.; Jeng, Y.-R. Extension of Prandtl’s Solution to a General Isotropic Model of Plasticity Including Internal Variables. Meccanica 2024, 59, 909–920. [Google Scholar] [CrossRef]
- Reiss, W.; Pöhlandt, K. The Rastegaev Upset Test-A Method To Compress Large Material Volumes Homogeneously. Exp. Tech. 1986, 10, 20–24. [Google Scholar] [CrossRef]
- Schey, J.A. Tribology in Metalworking: Friction, Lubrication, and Wear, American Society for Metals, Metals Park, 1983.
- Alexandrov, S.; Alexandrova, N. On The Maximum Friction Law for Rigid/Plastic, Hardening Materials. Meccanica 2000, 35, 393–398. [Google Scholar] [CrossRef]
Figure 1.
Schematic diagram of the experimental setup before assembling.
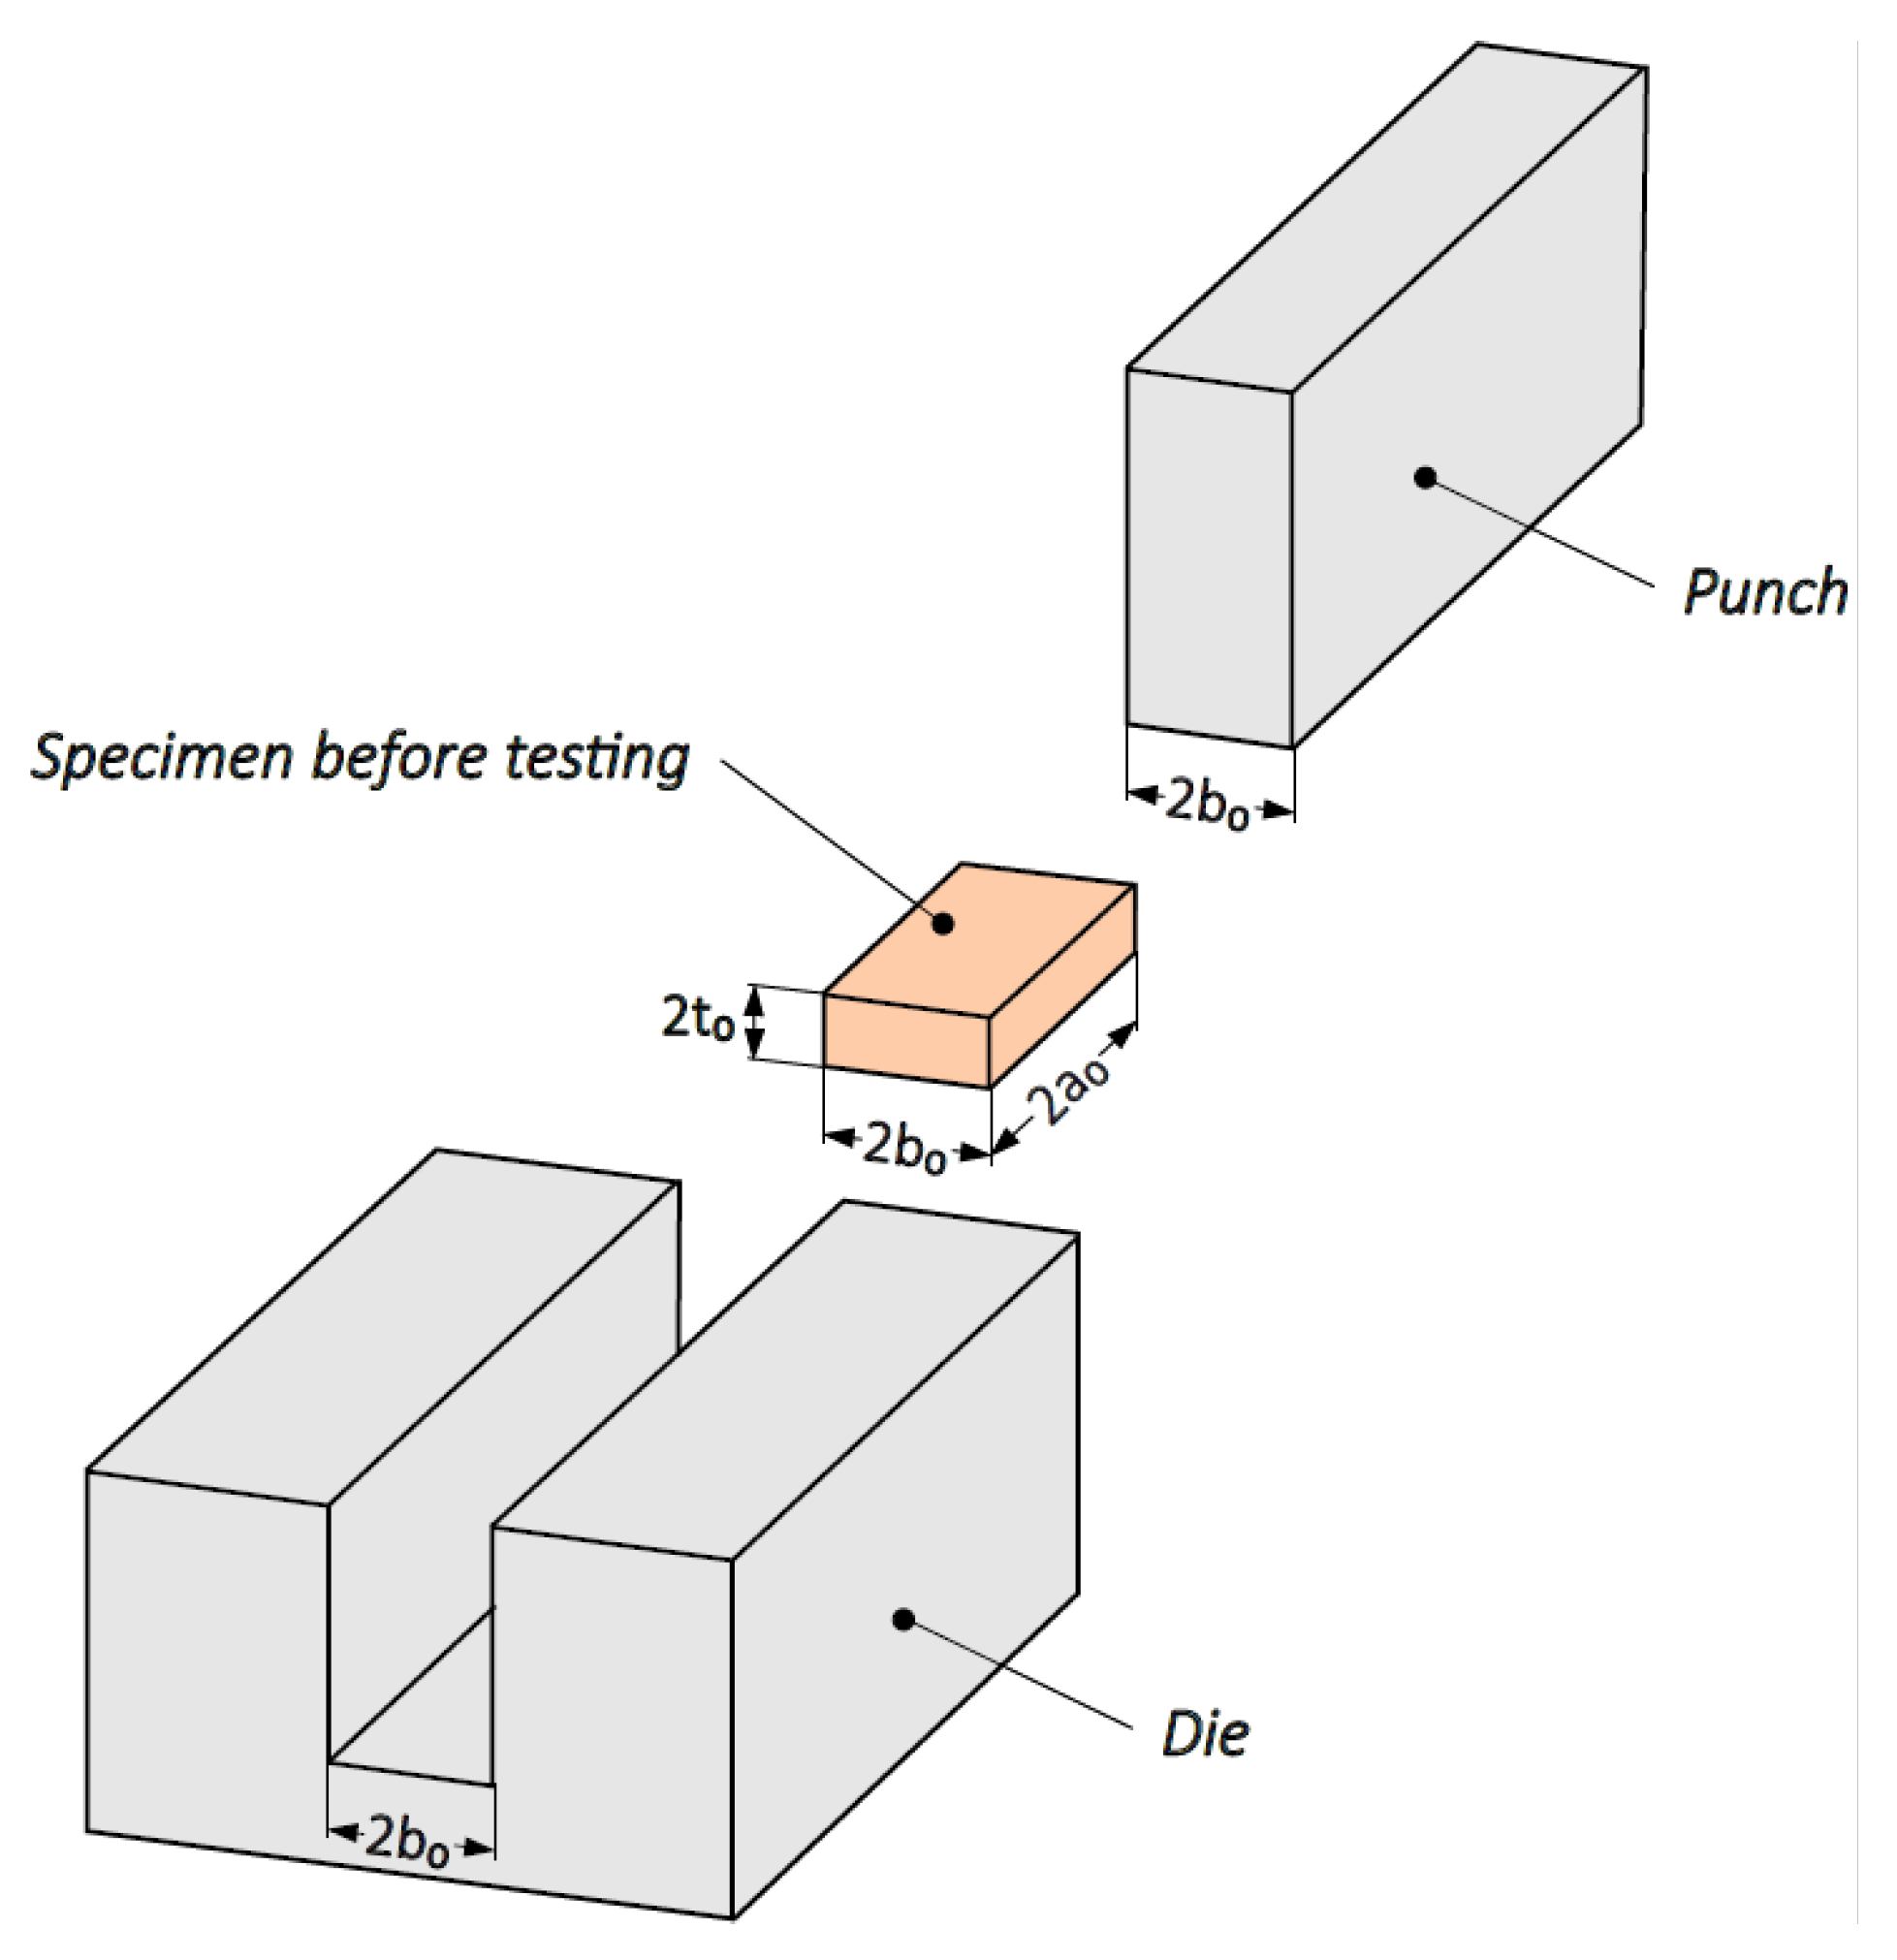
Figure 2.
CAD model of the experimental setup: 1 – upper die (punch), 2 – mold plate, 3 – reinforcing bar, 4 – bottom die.
Figure 2.
CAD model of the experimental setup: 1 – upper die (punch), 2 – mold plate, 3 – reinforcing bar, 4 – bottom die.
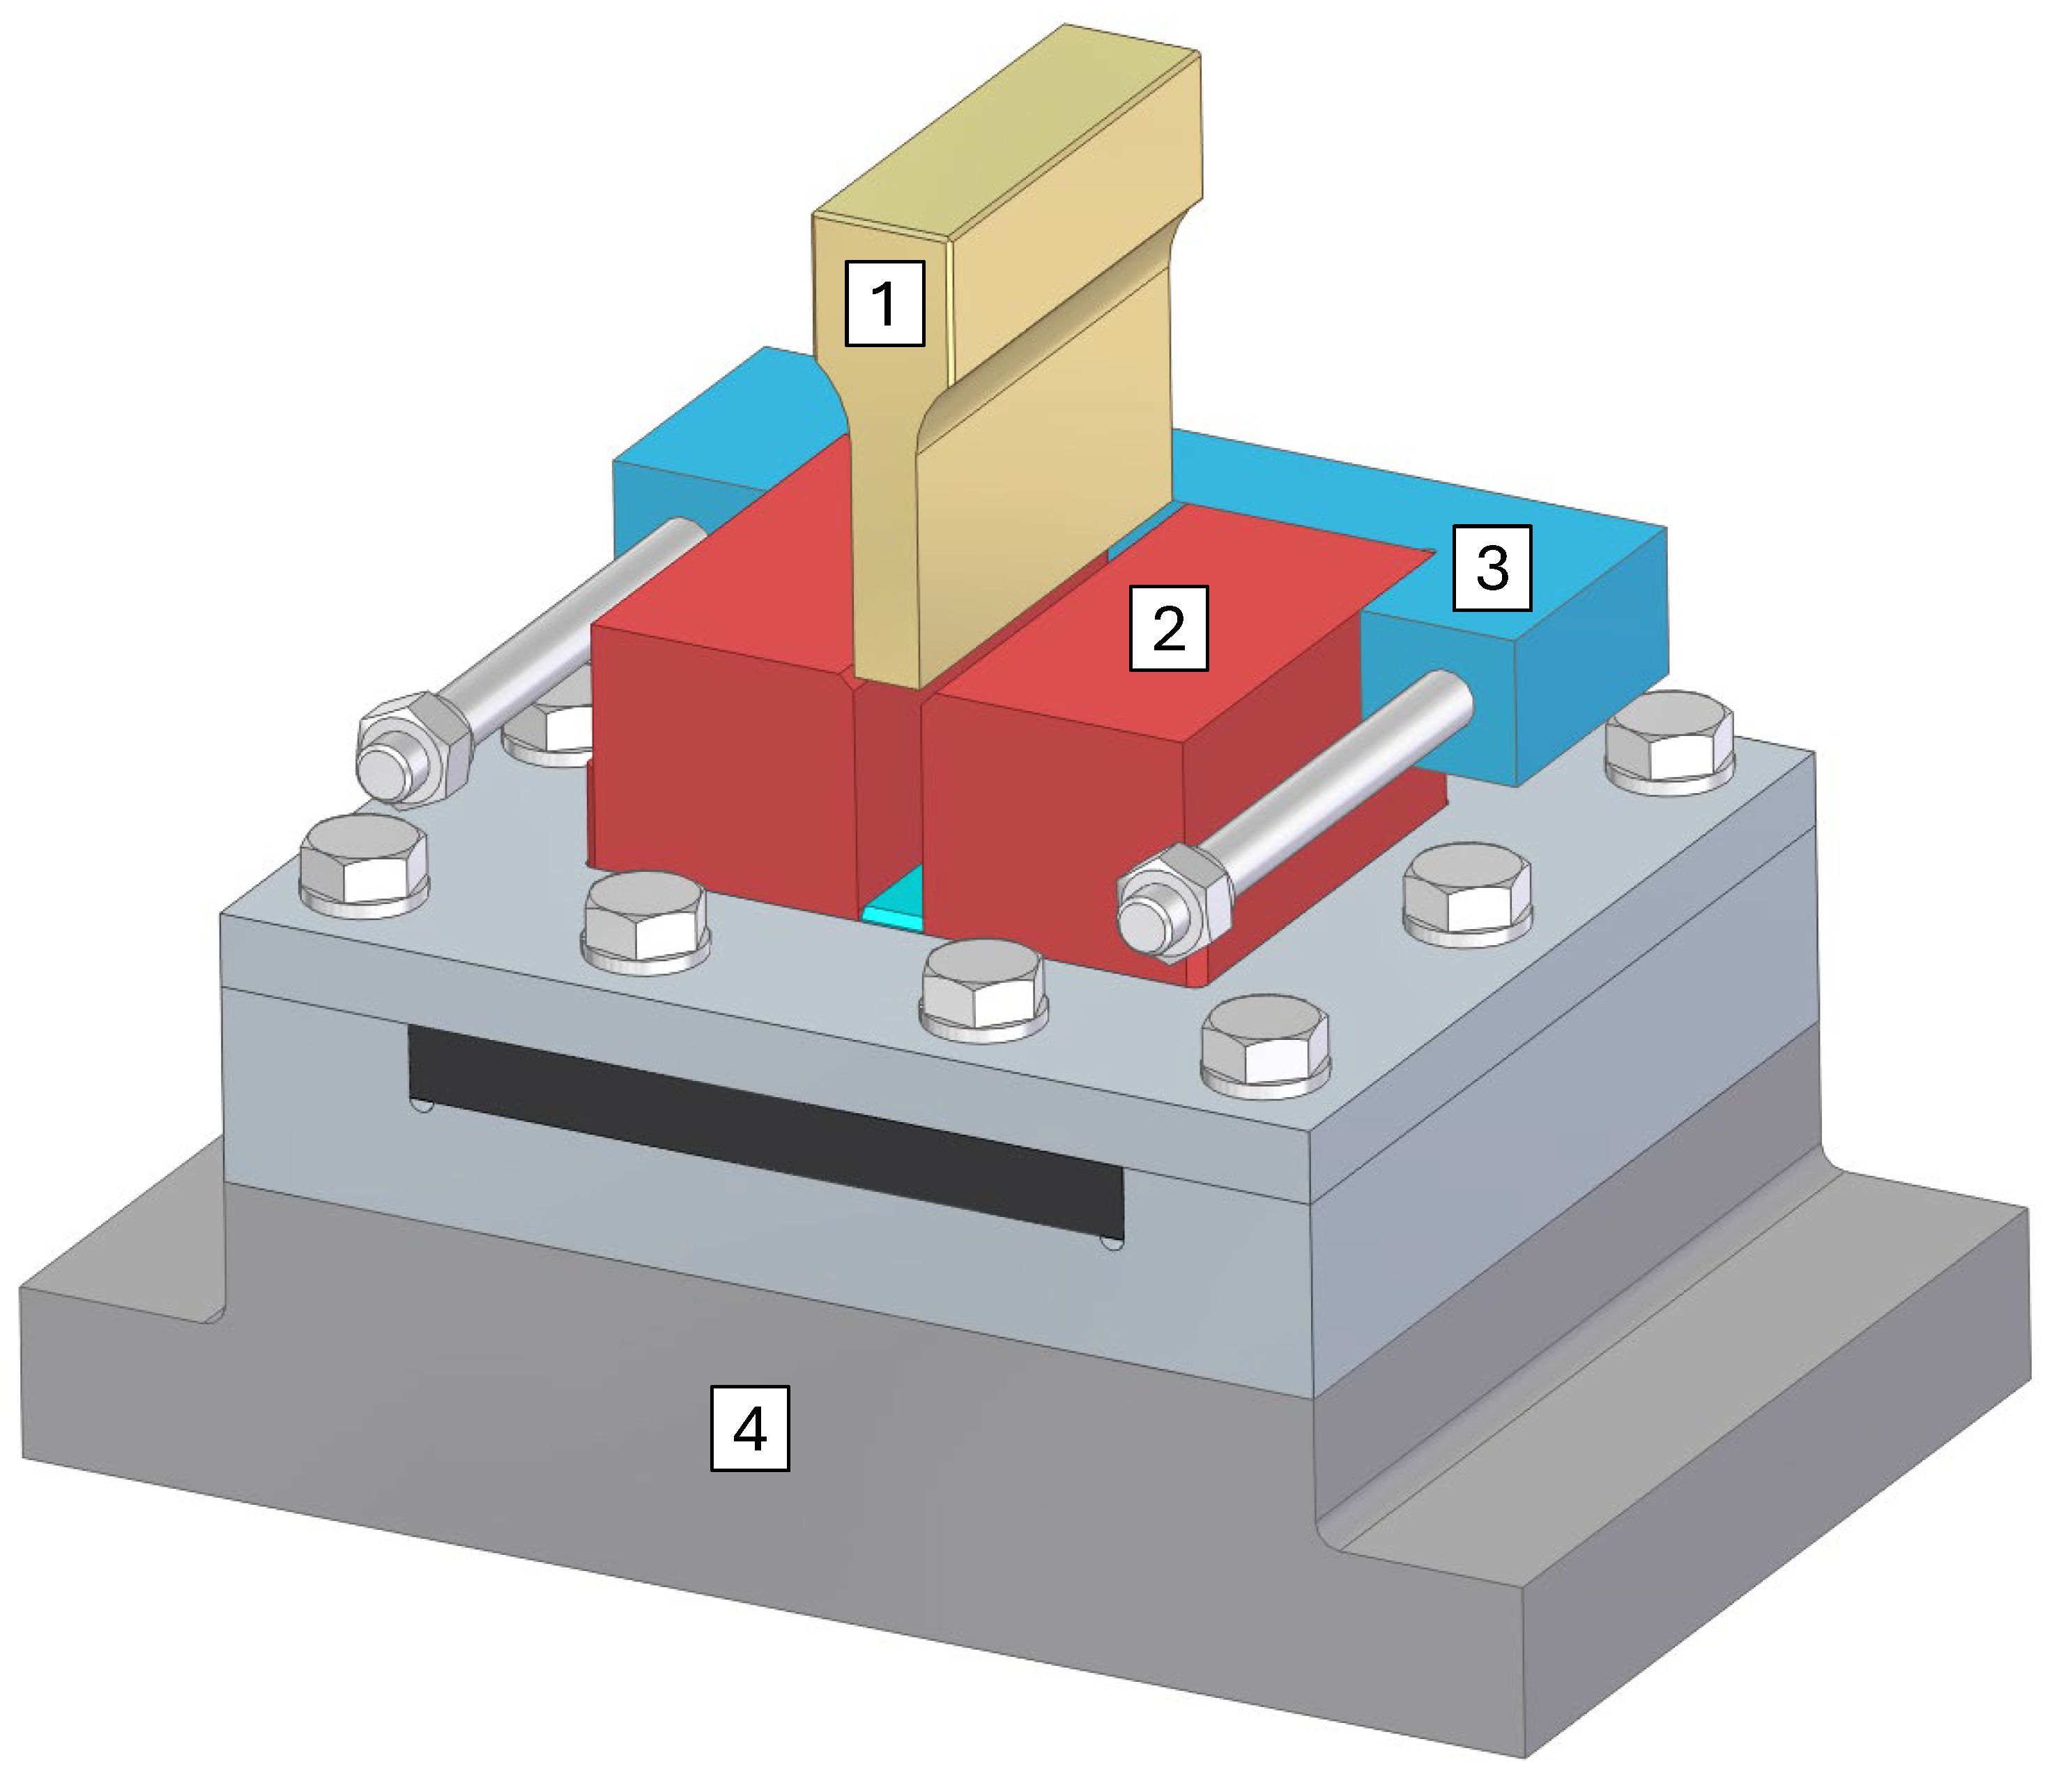
Figure 3.
Specimens of Group O after testing.
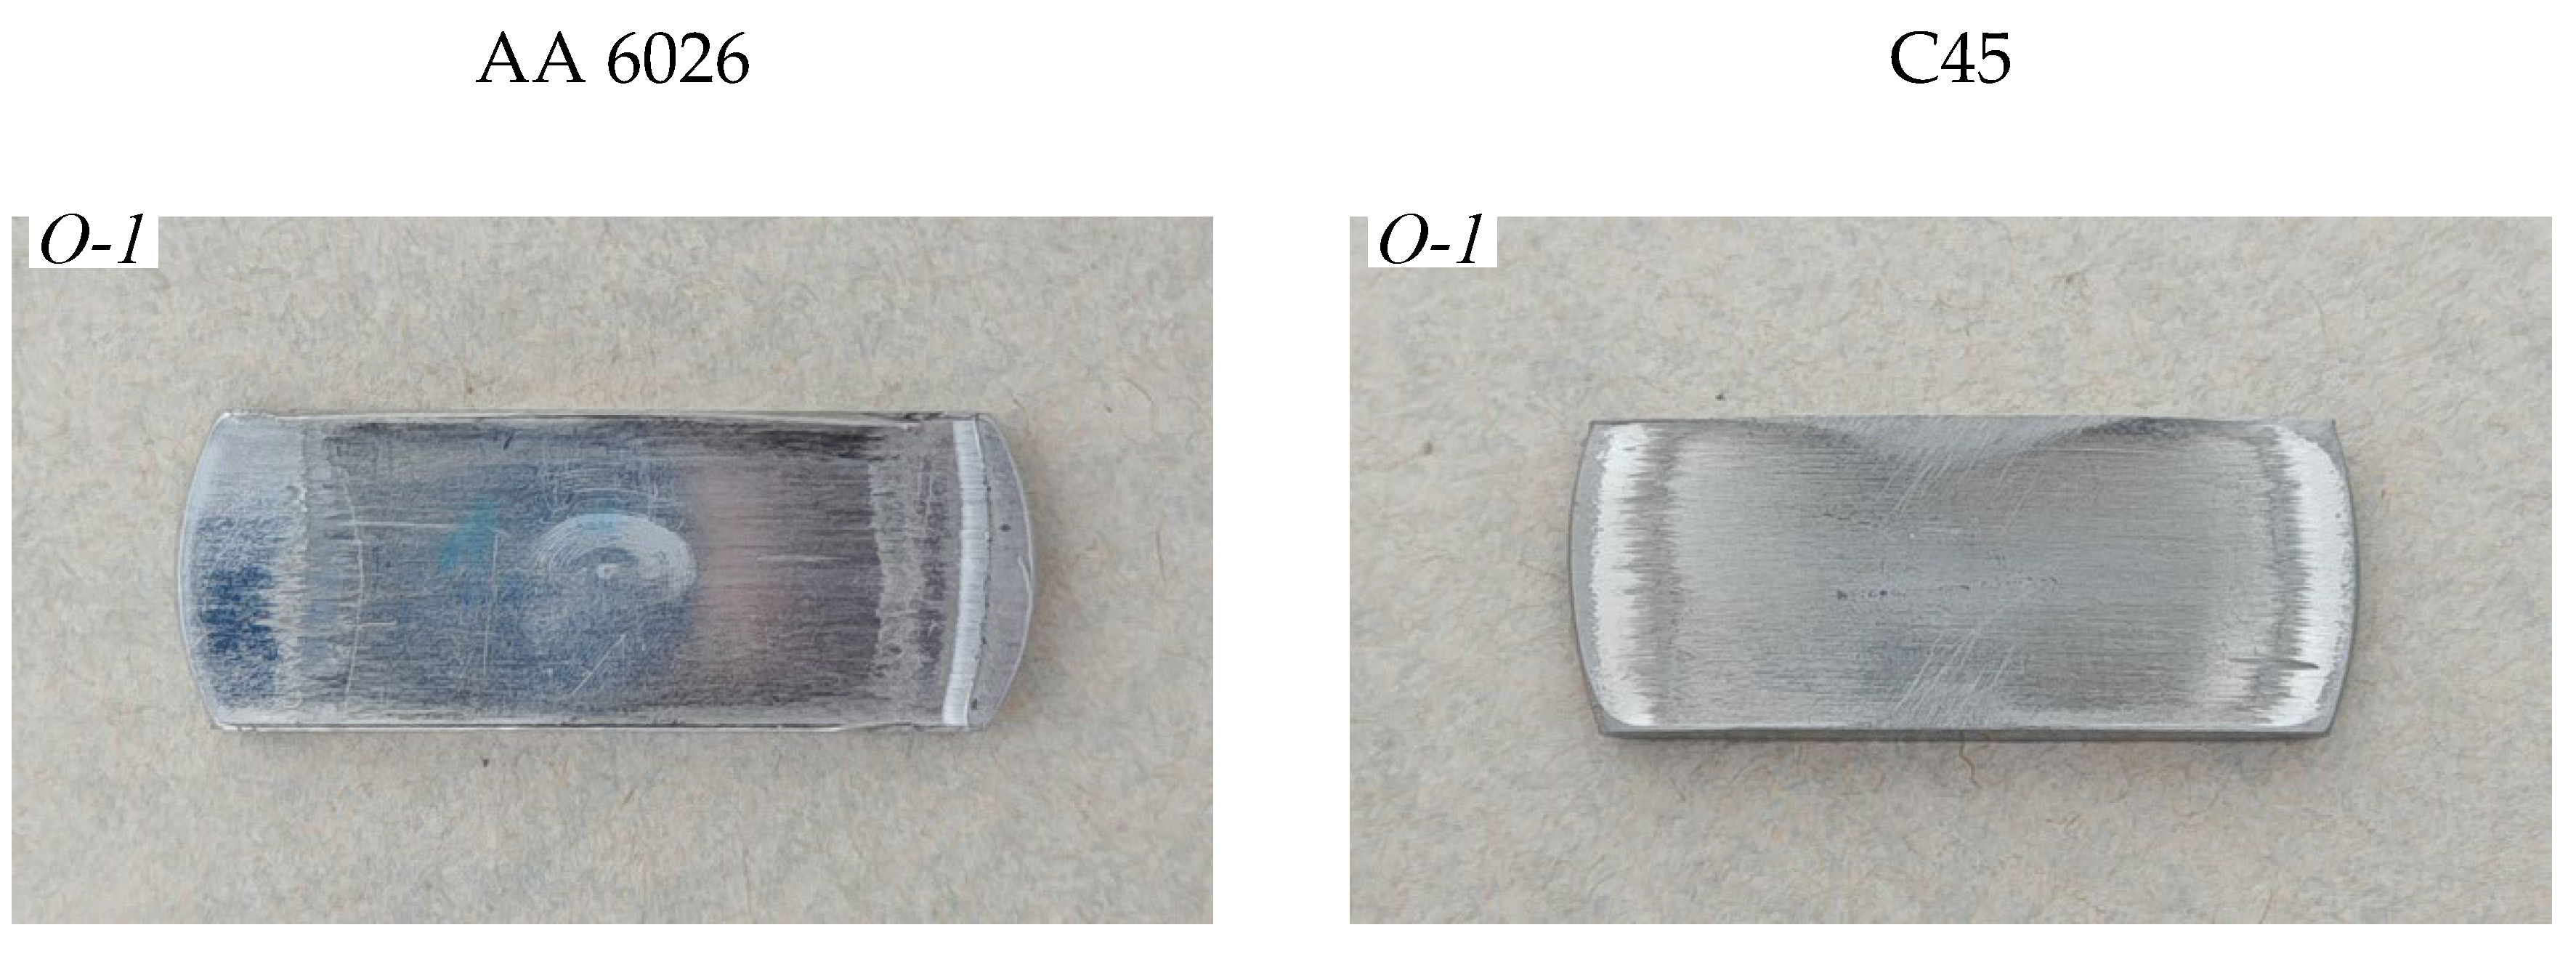
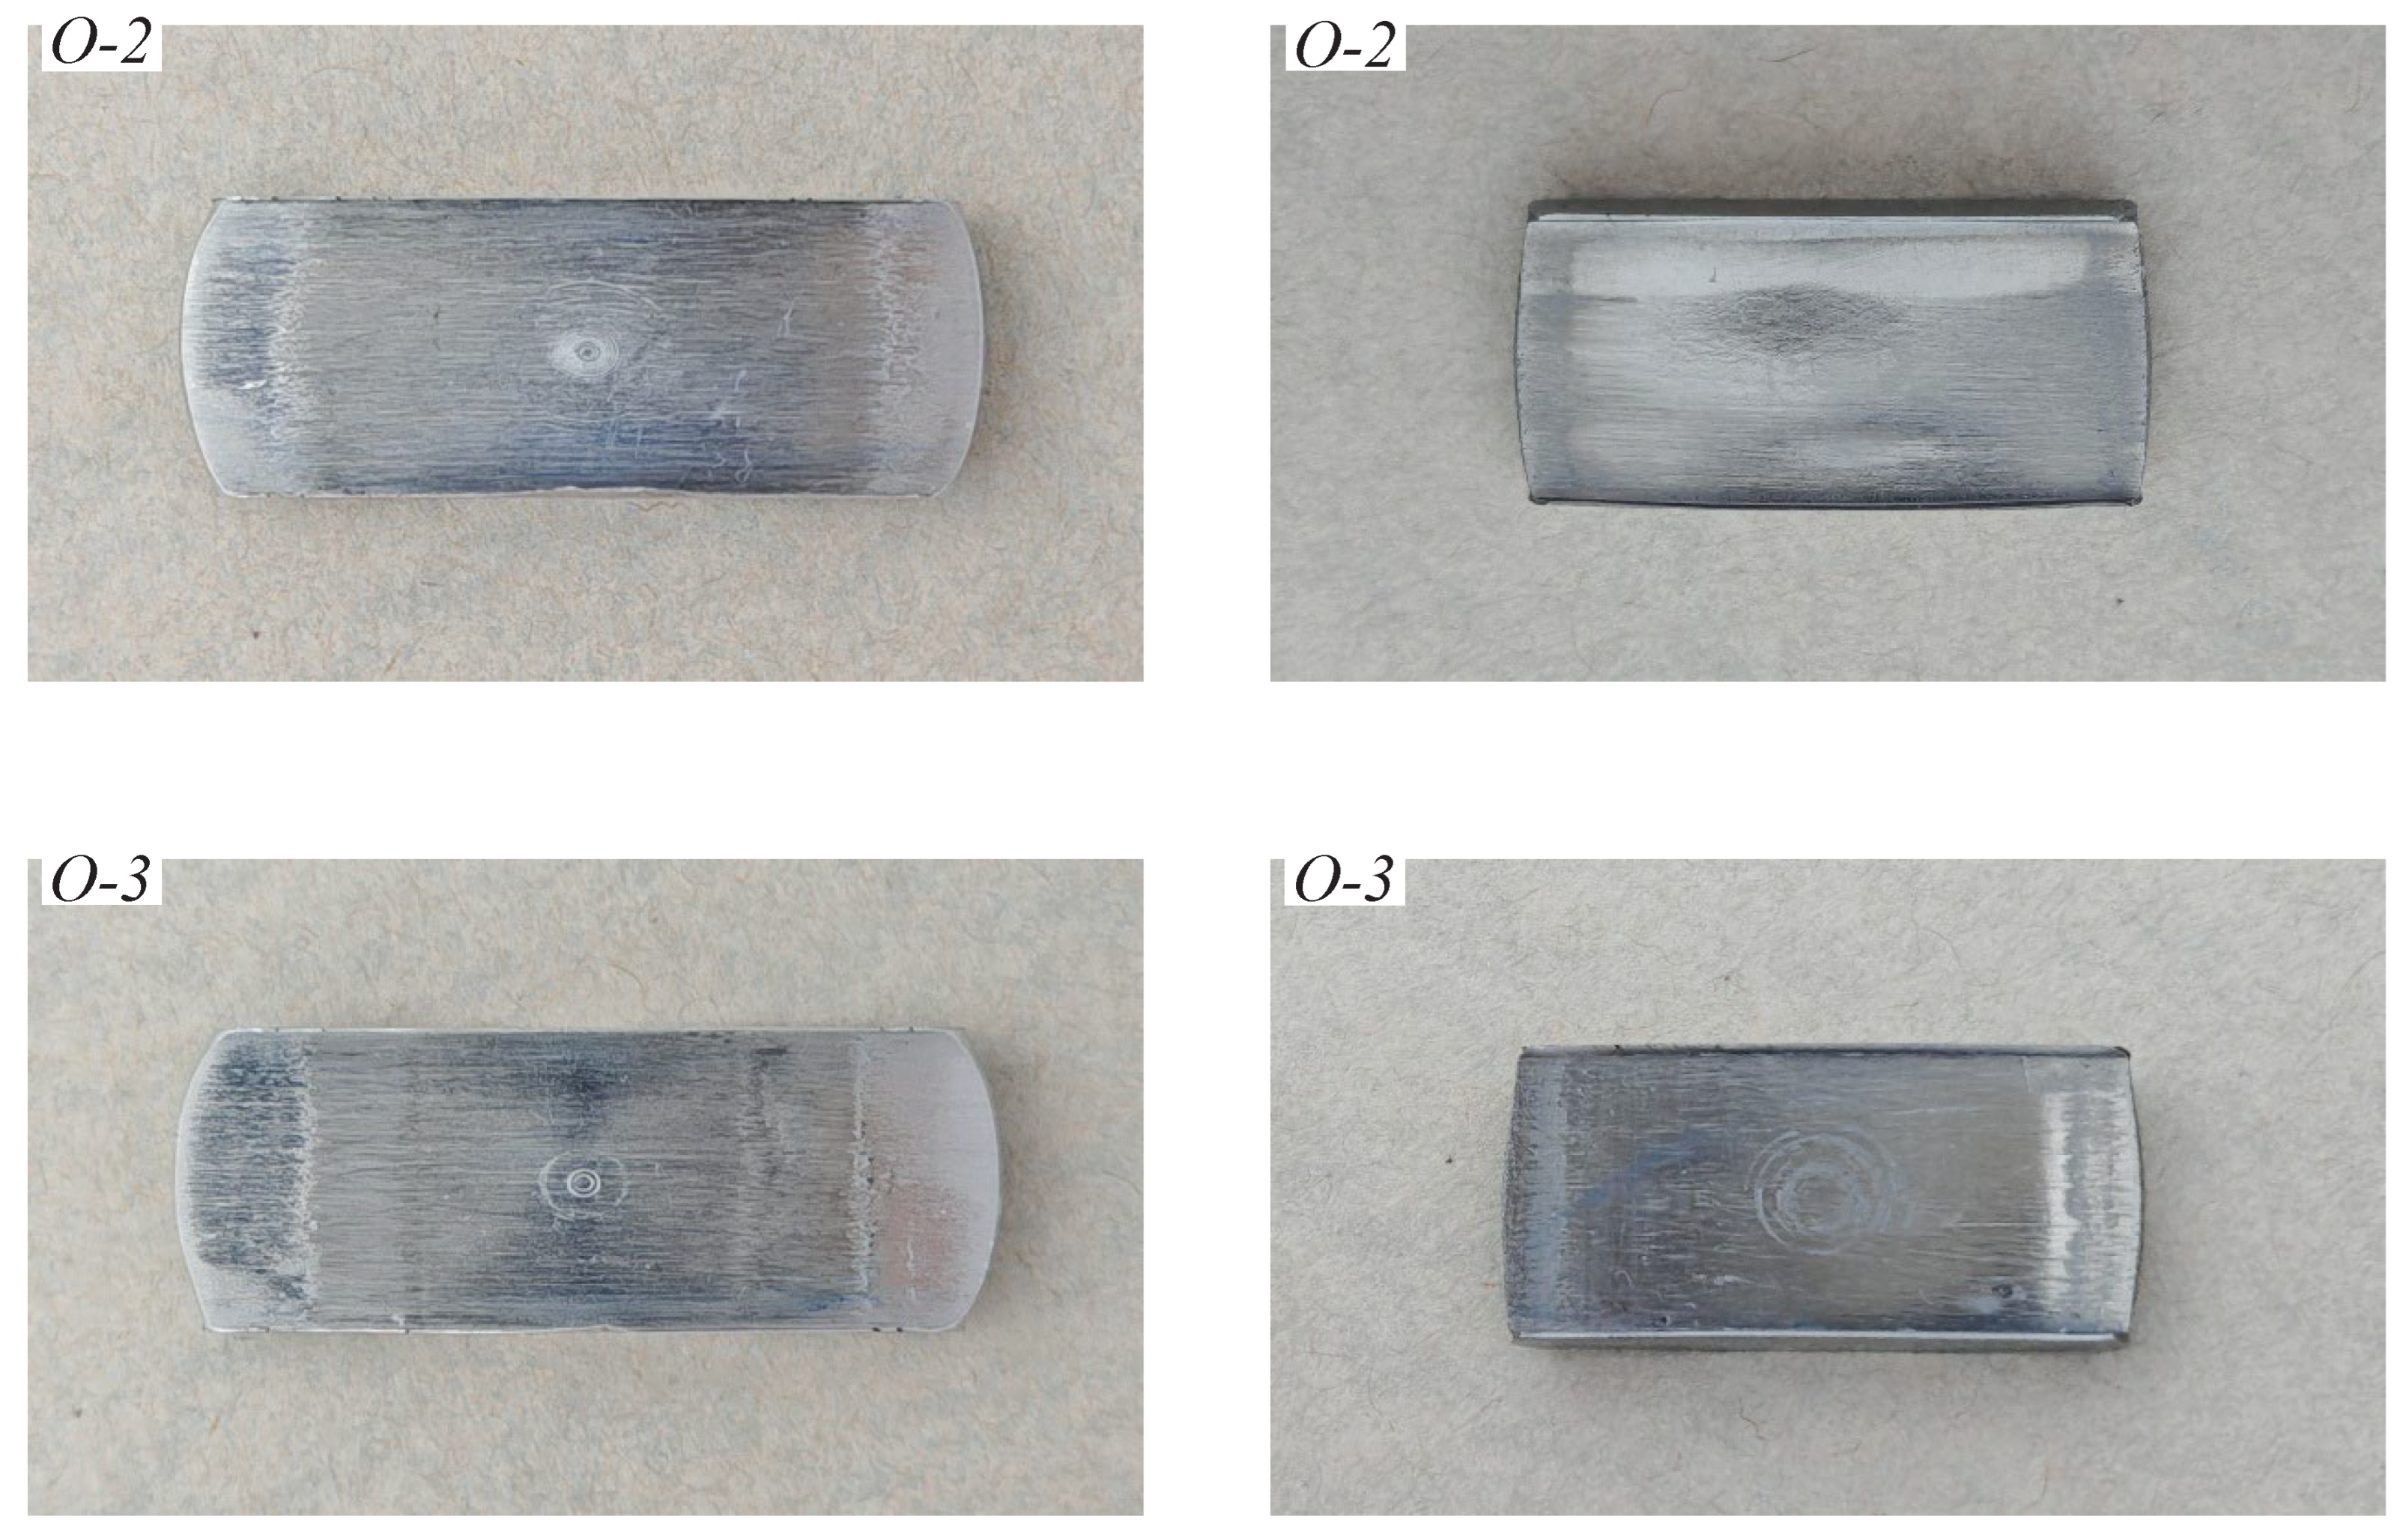
Figure 4.
Specimens of Group GS after testing.
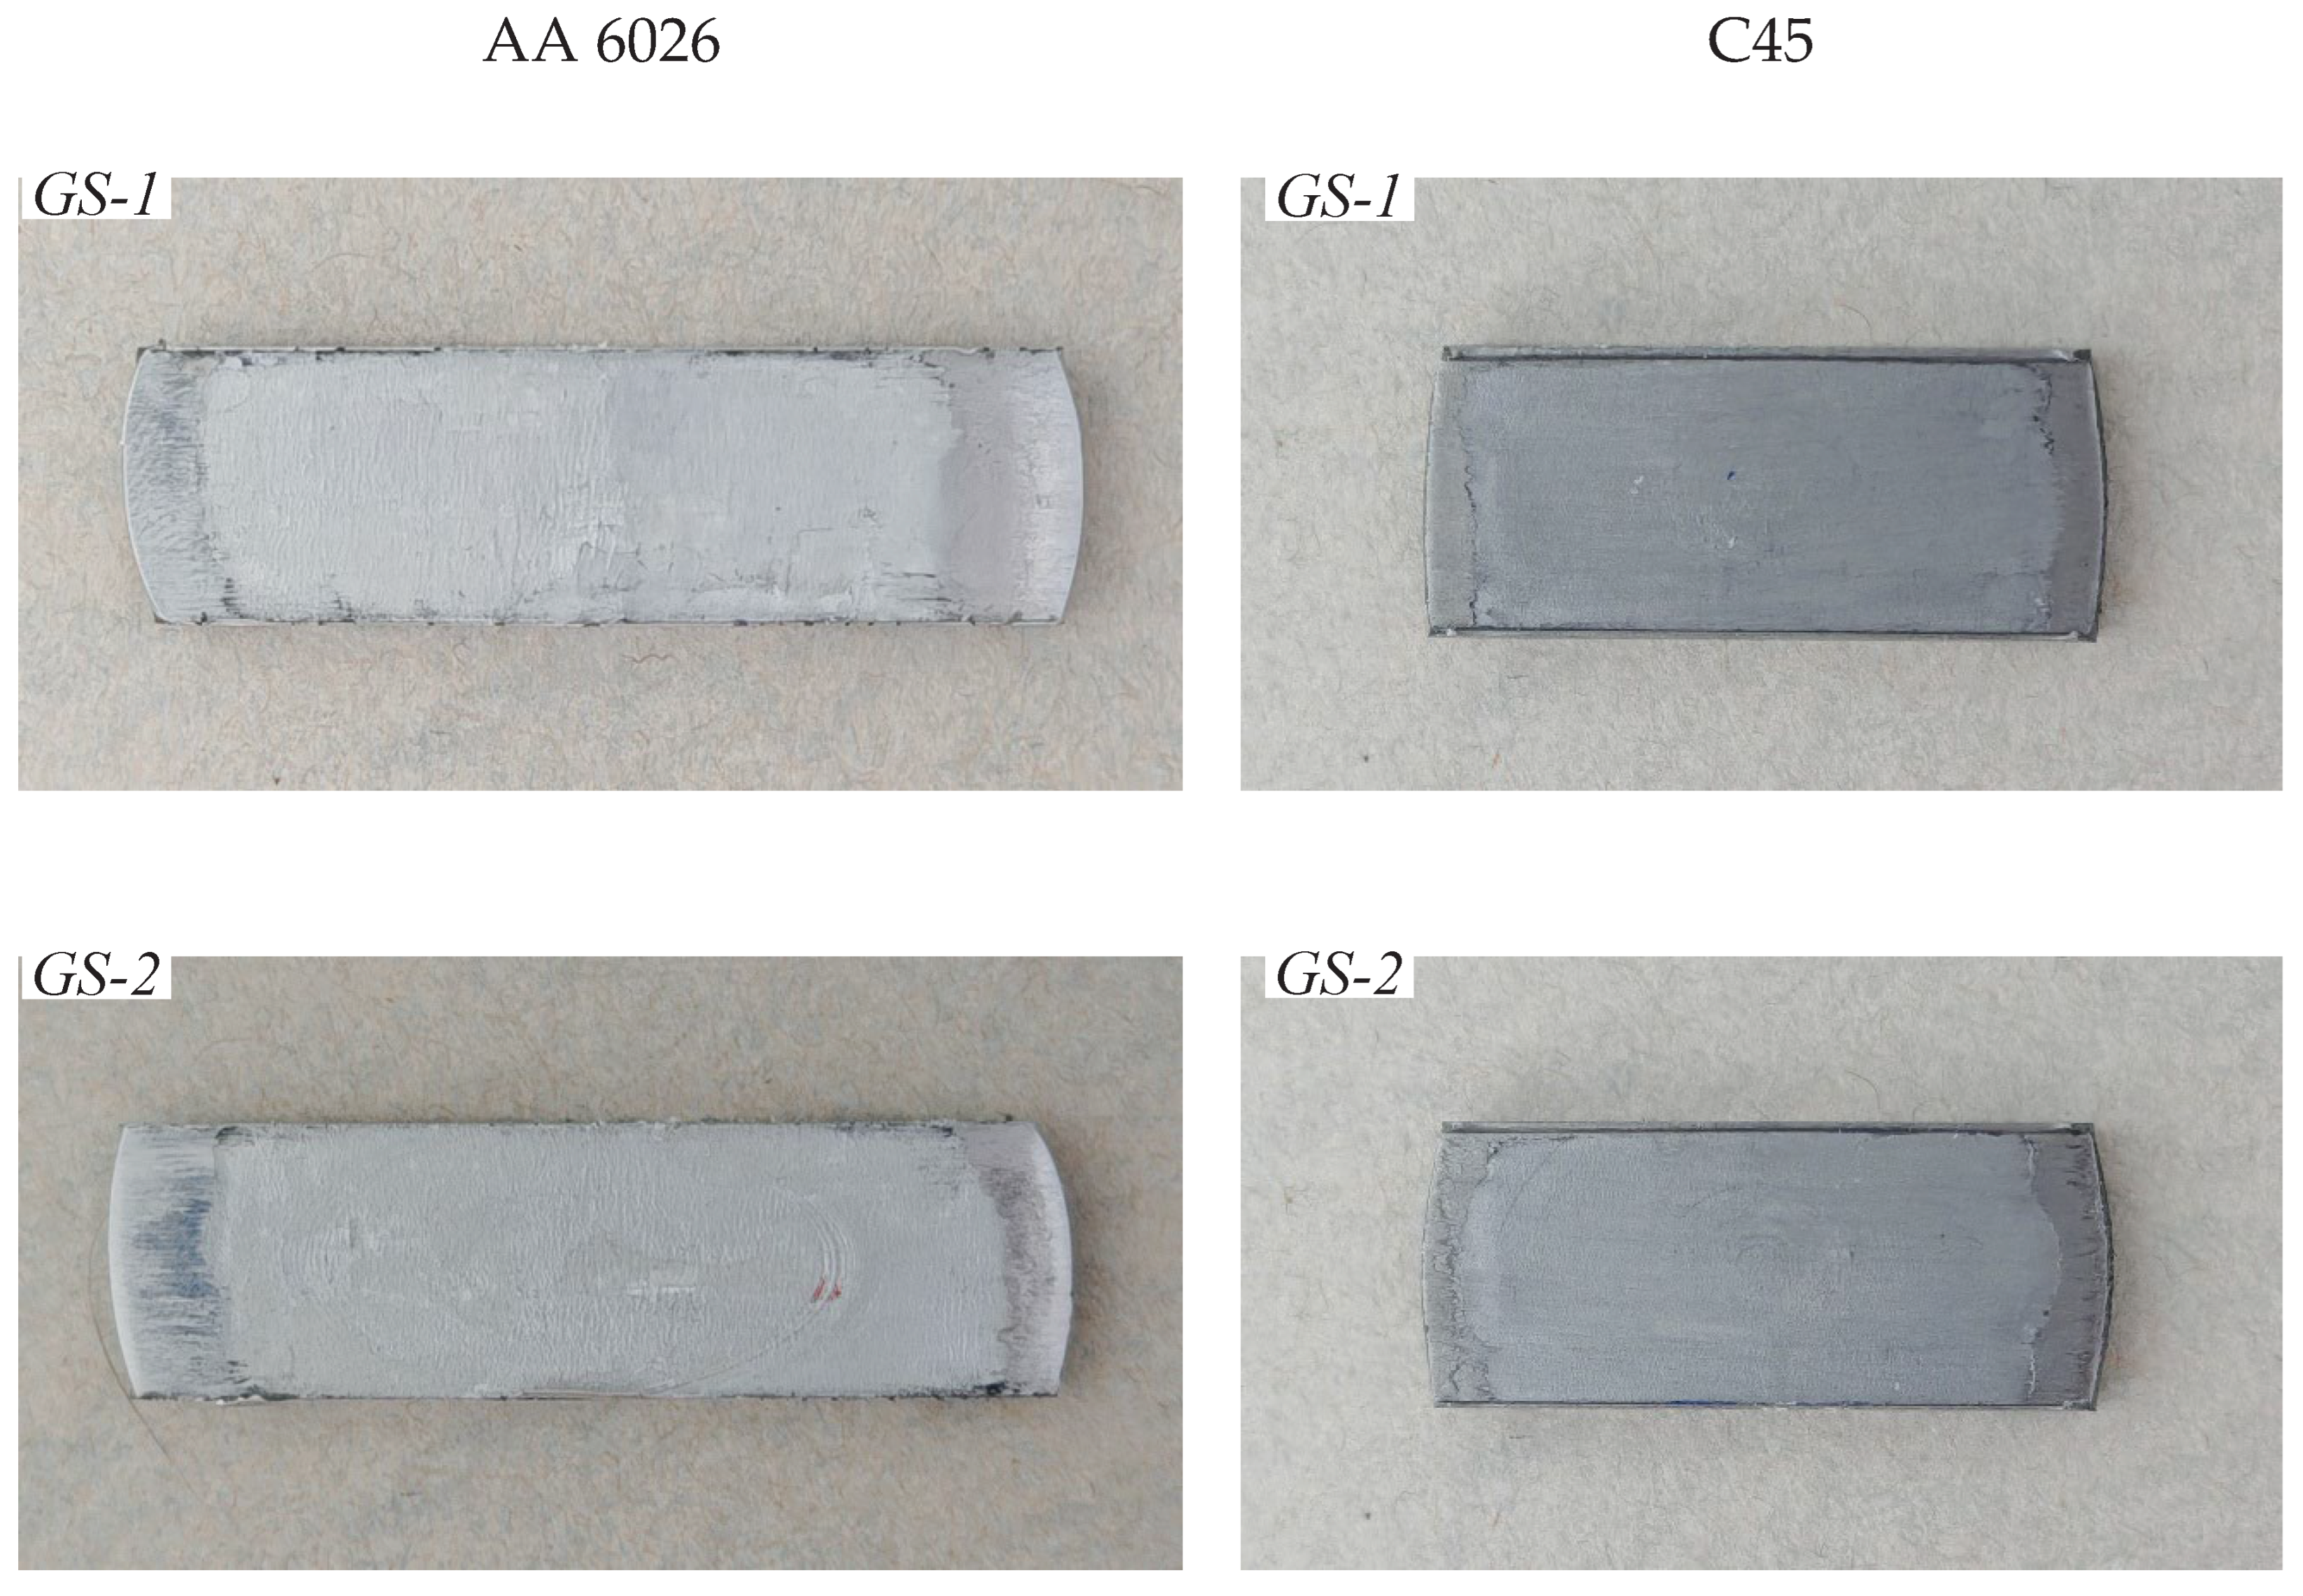
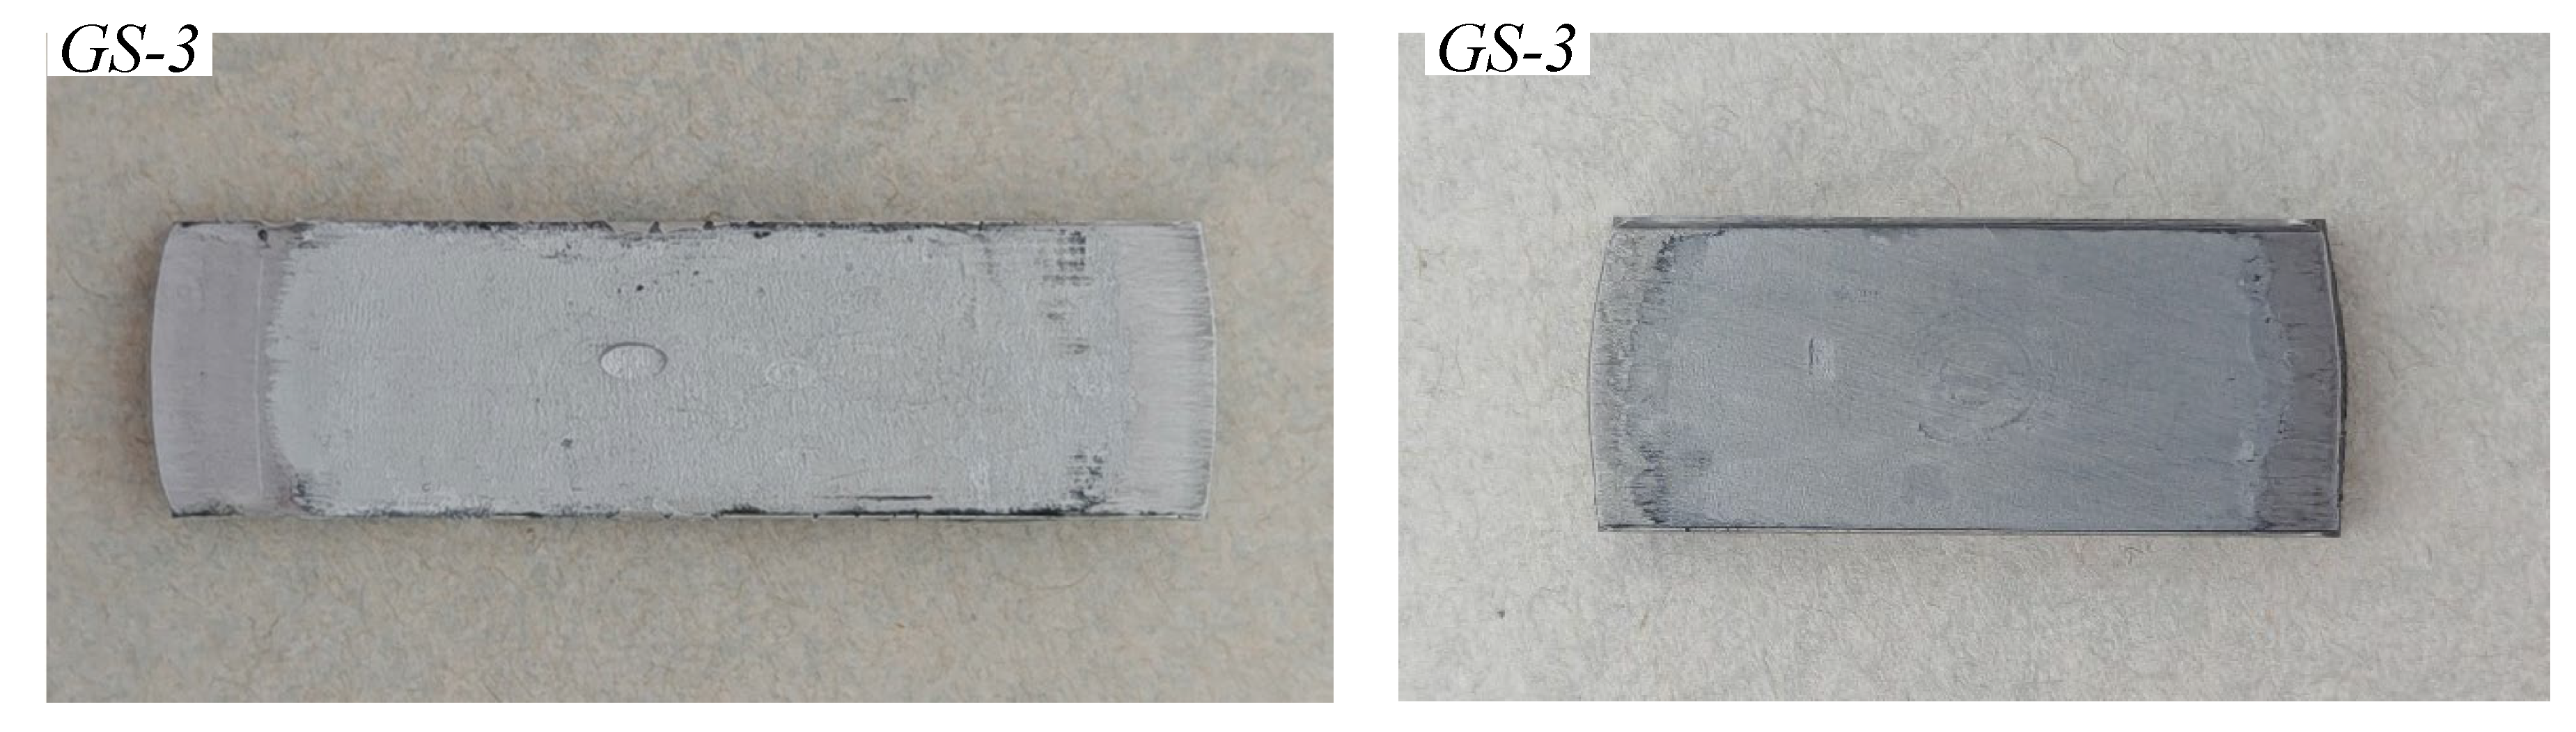
Figure 5.
Specimens of Group D after testing.
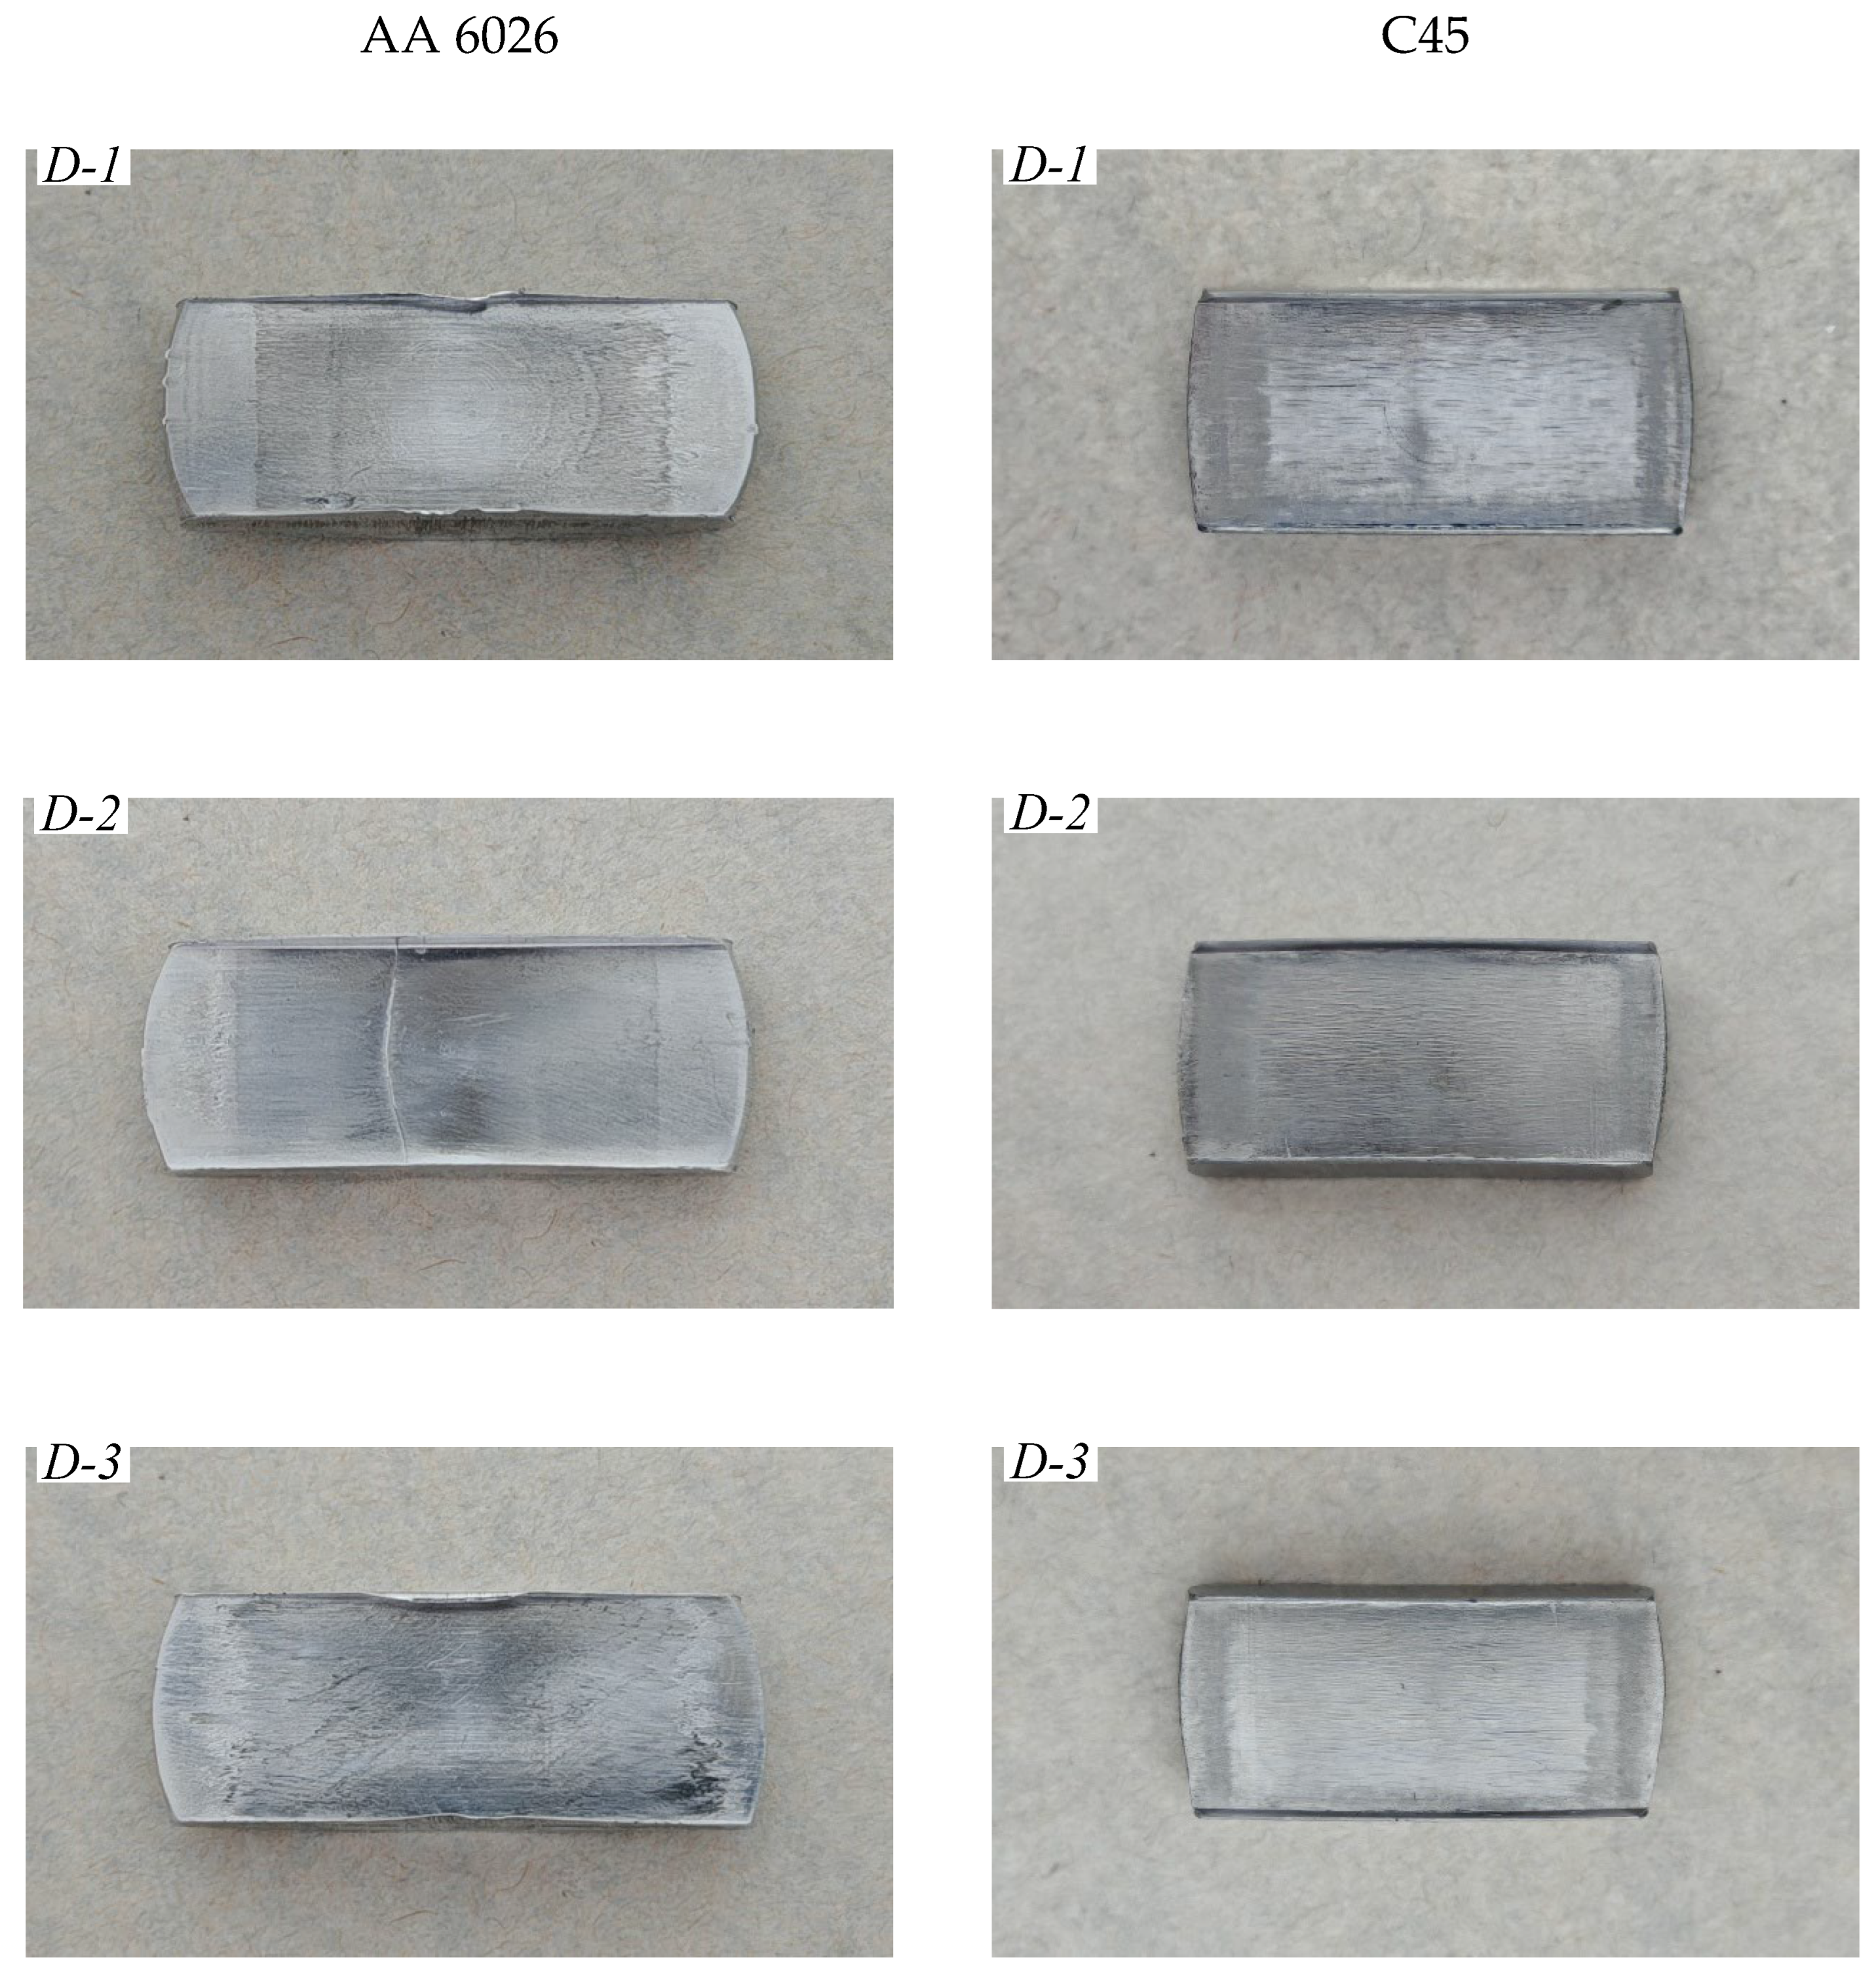
Figure 6.
Variation of the compression force with the punch’s stroke for AA6026.
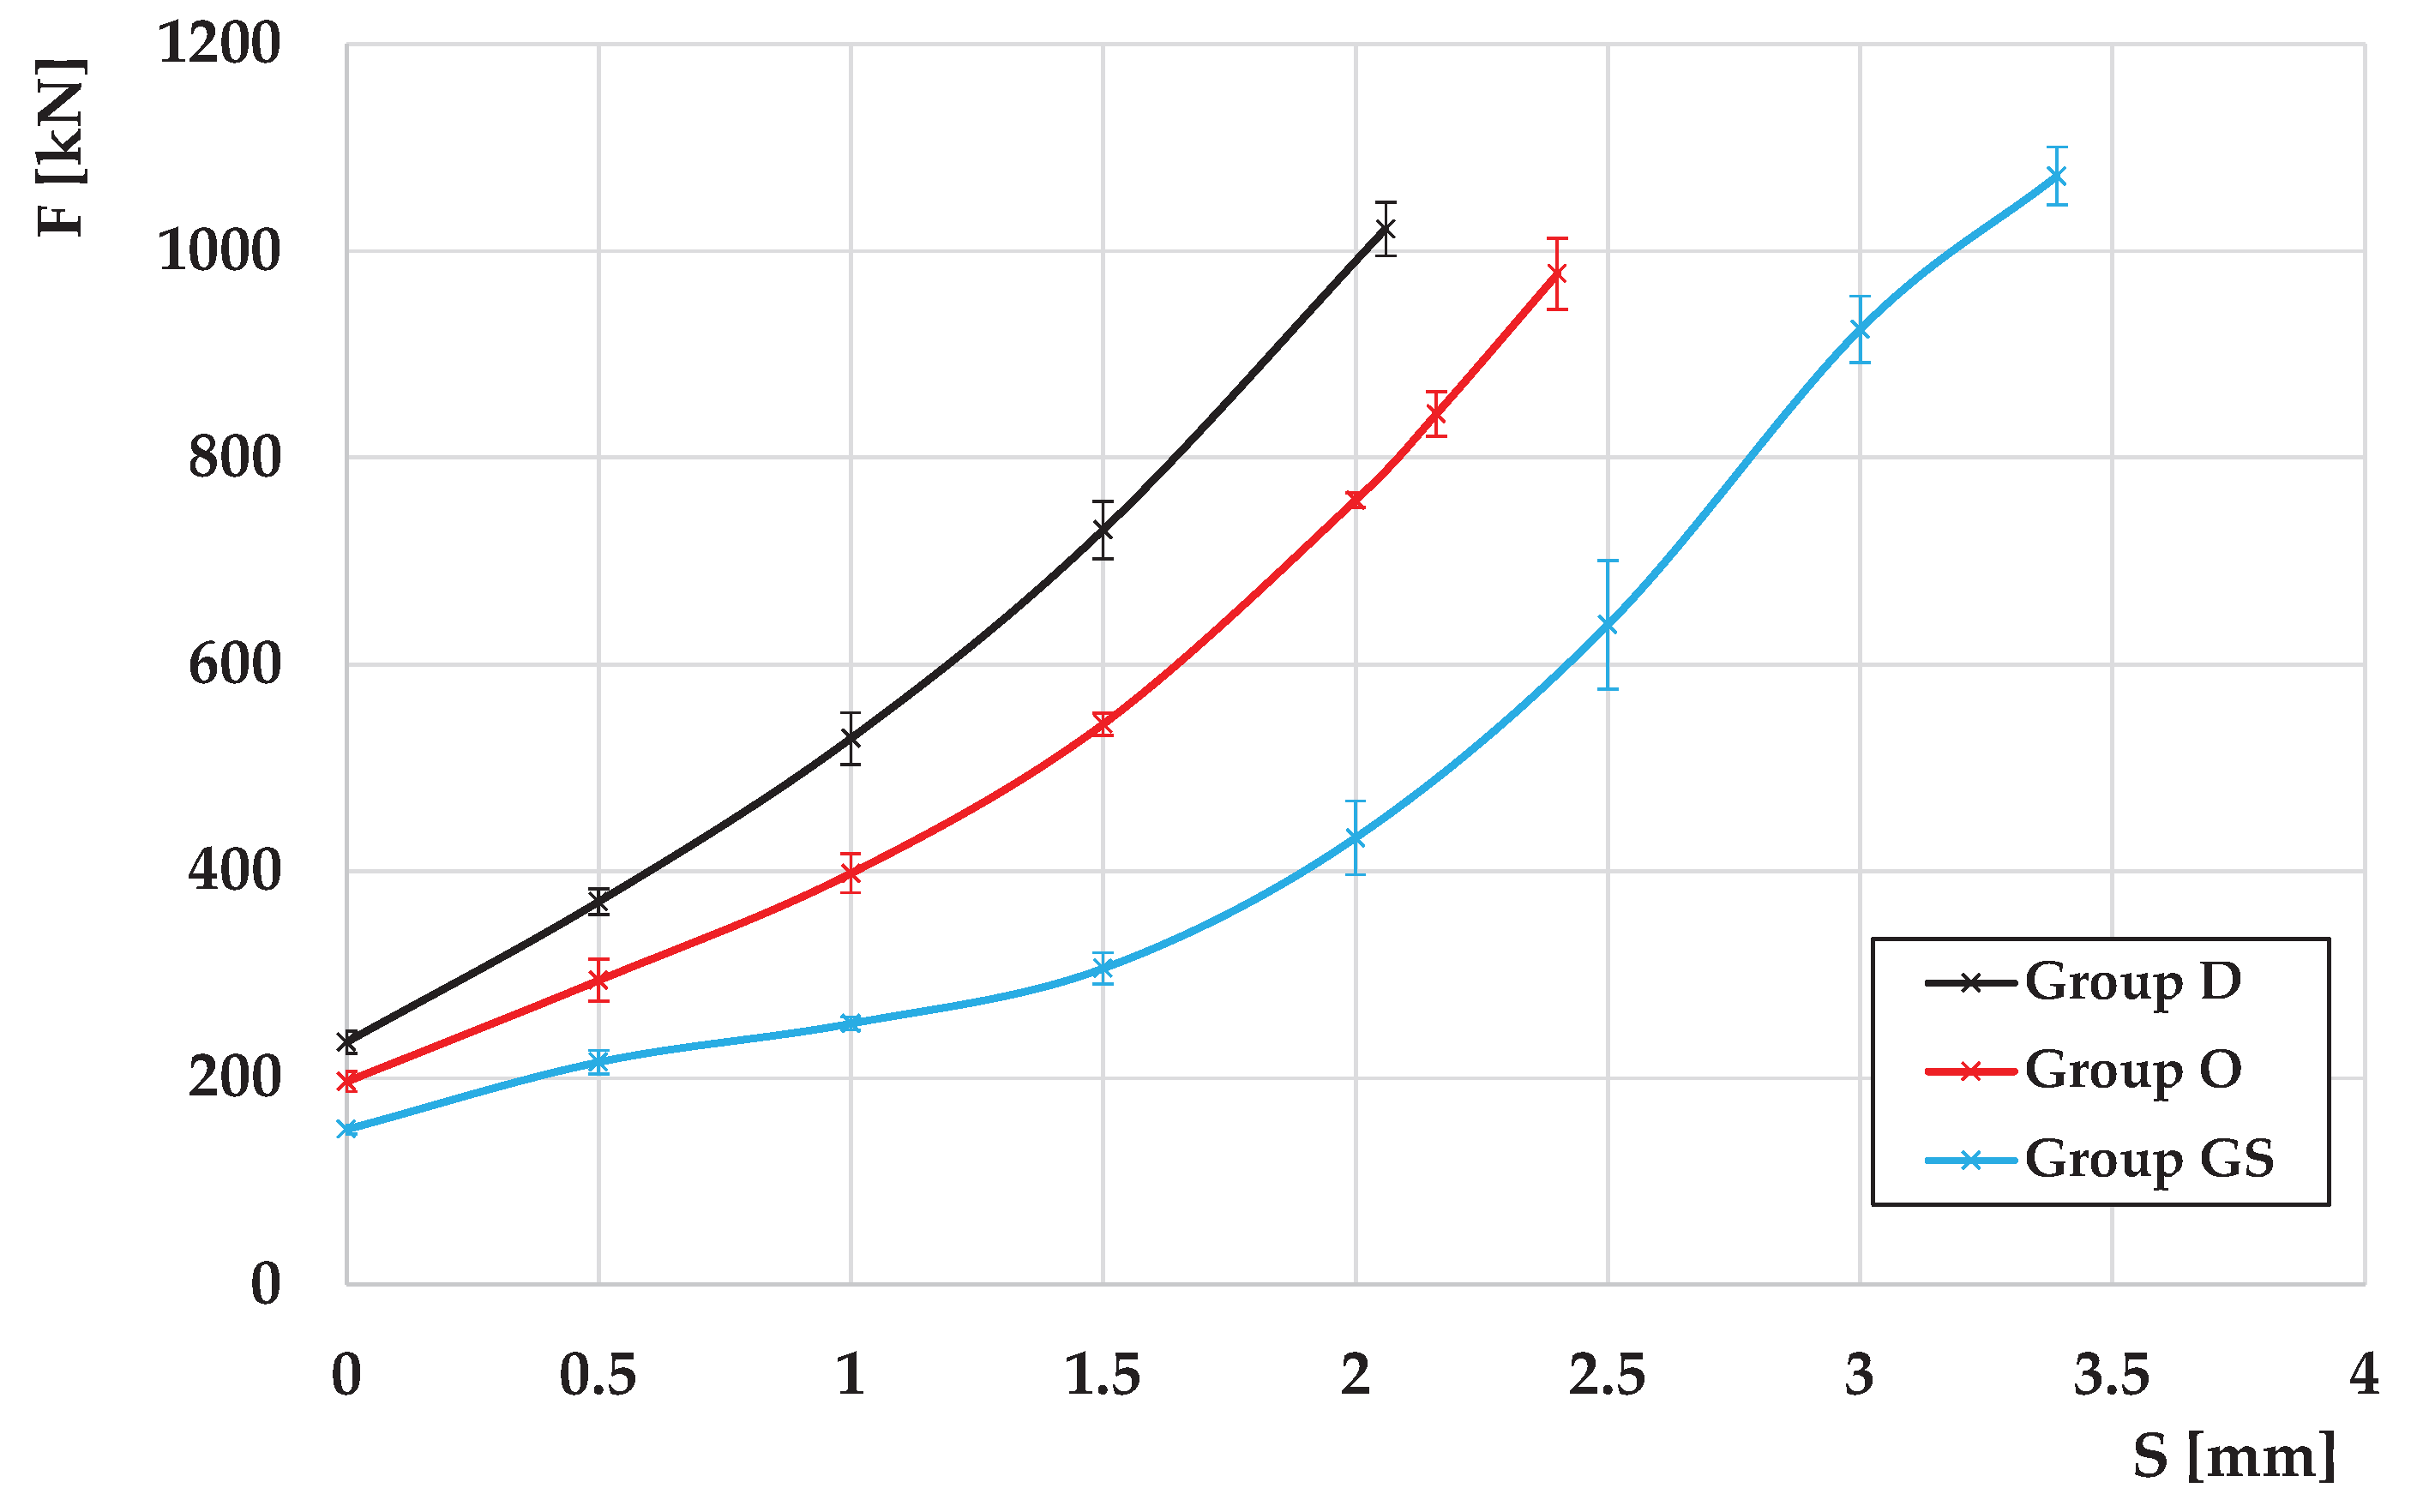
Figure 7.
Variation of the compression force with the punch’s stroke for C45.
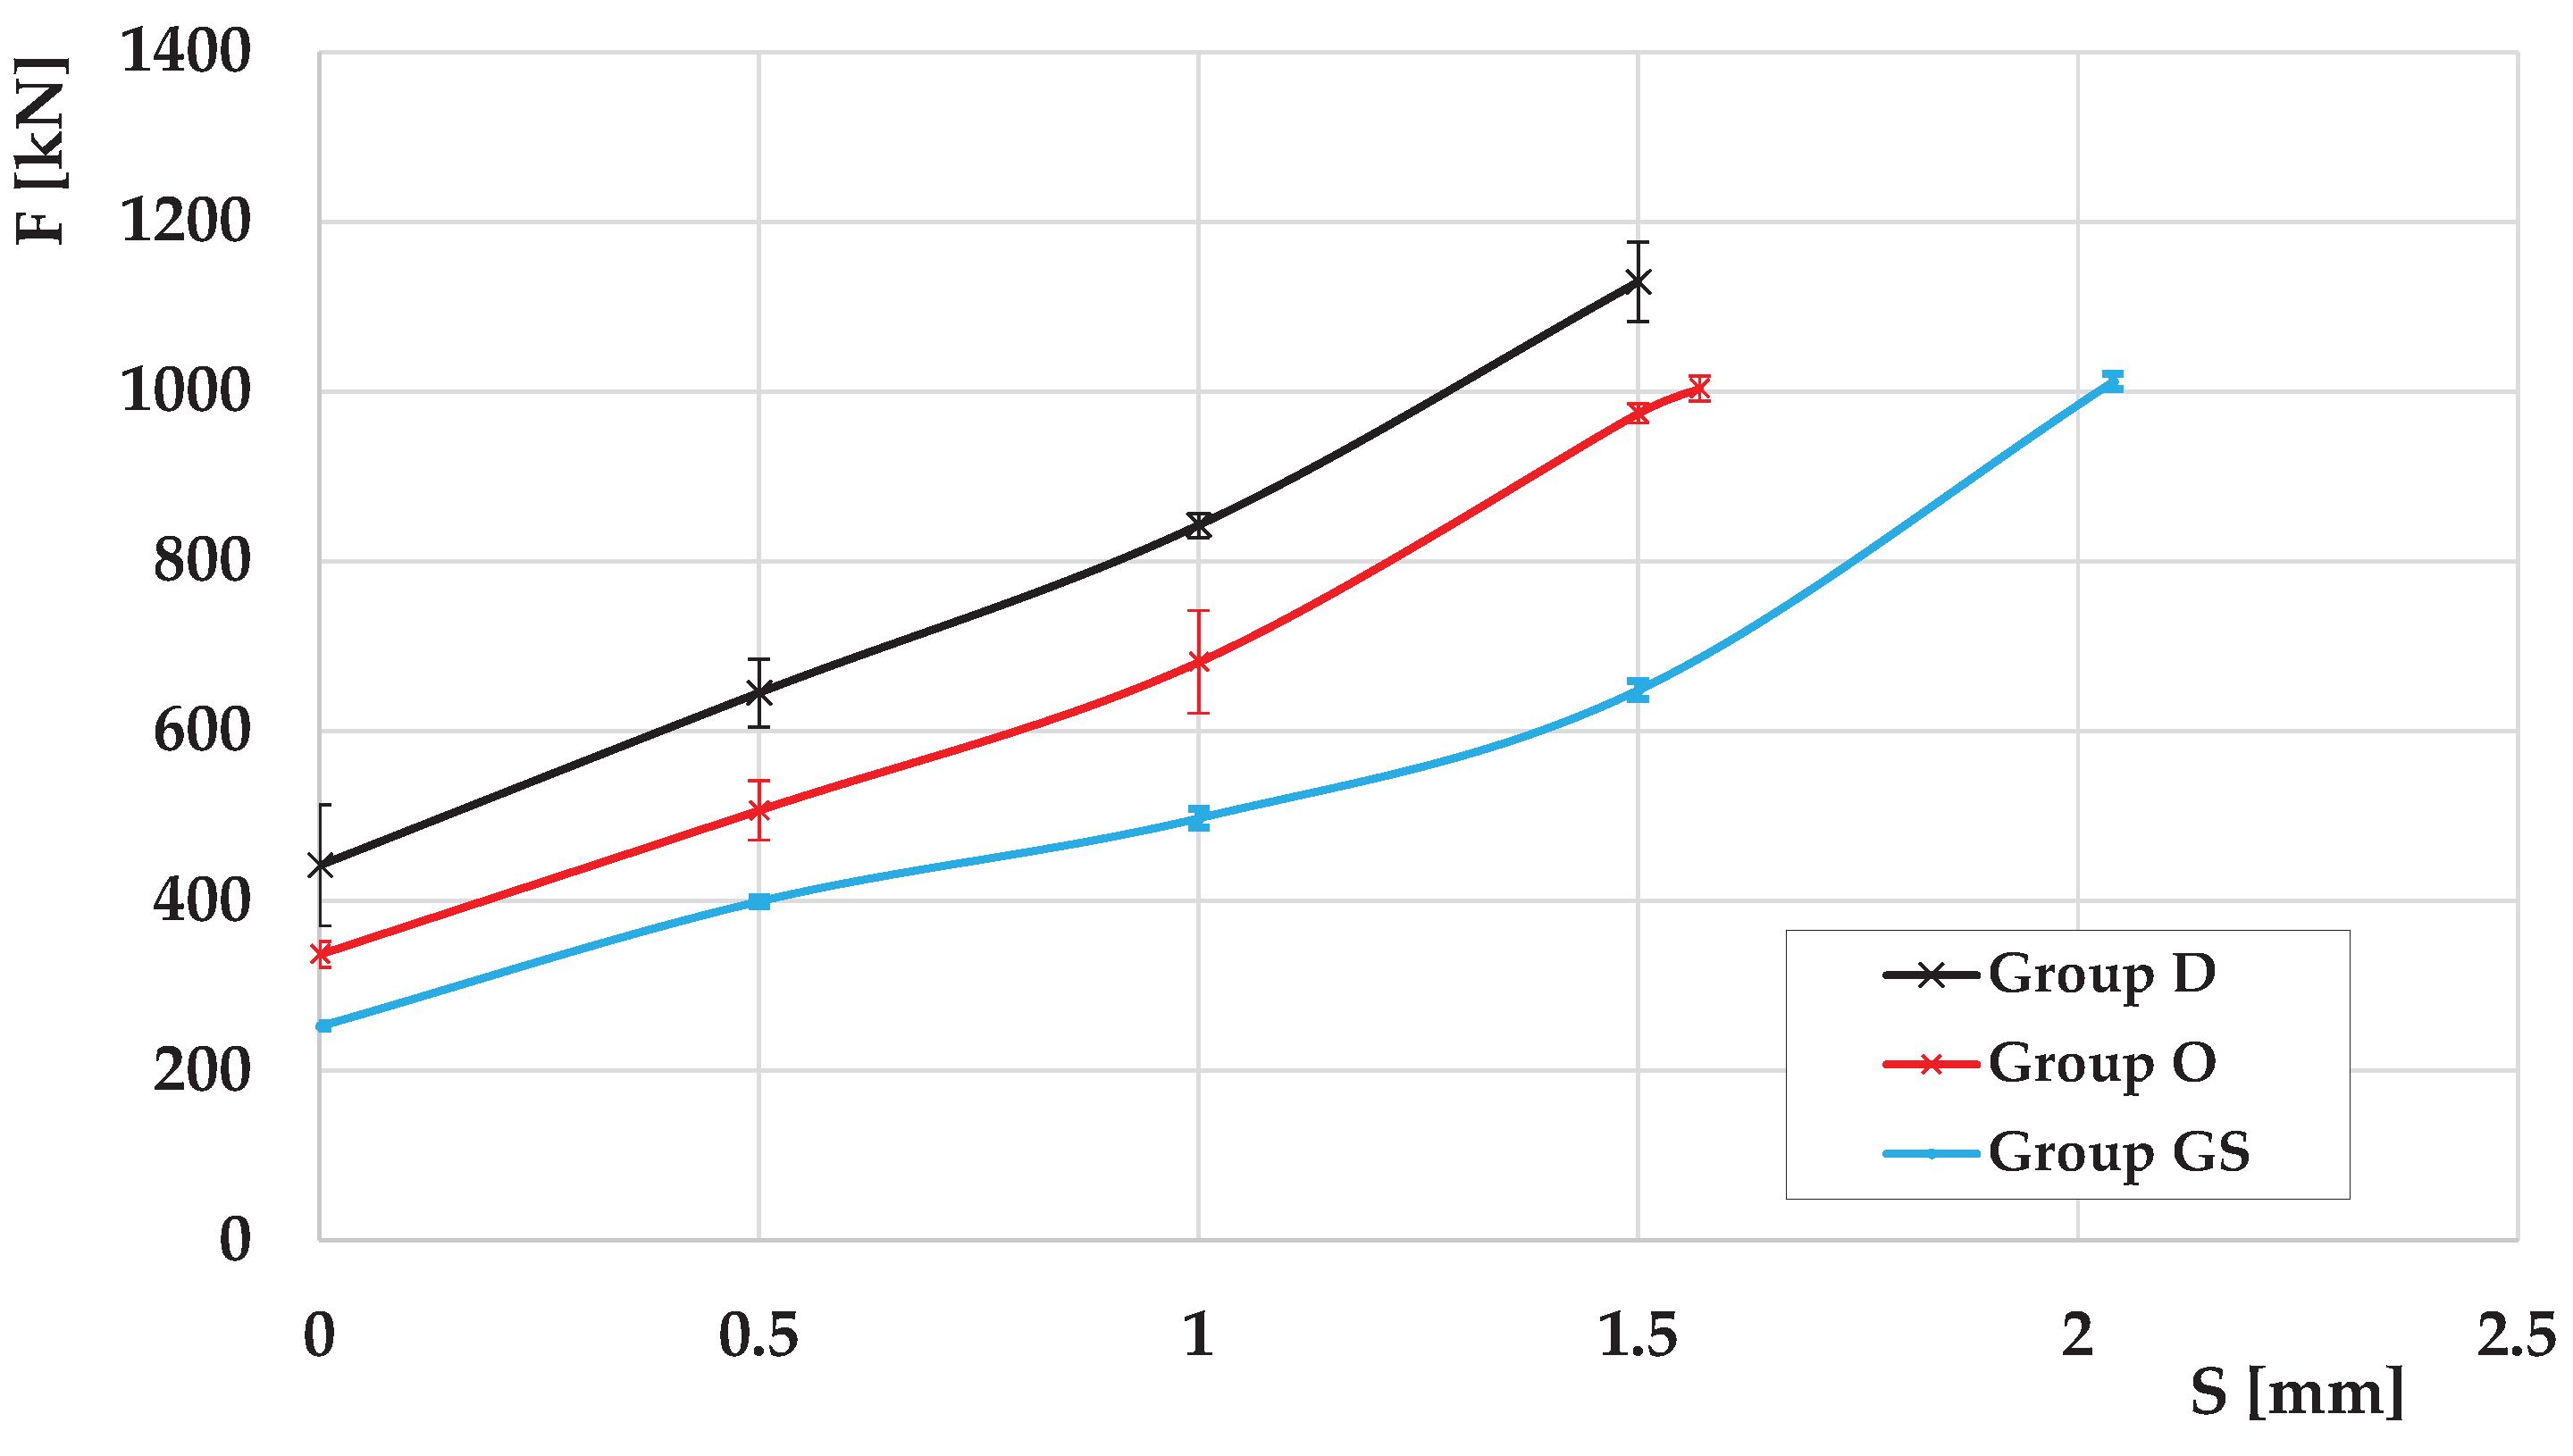
Figure 8.
Compression of strip between parallel rough dies.
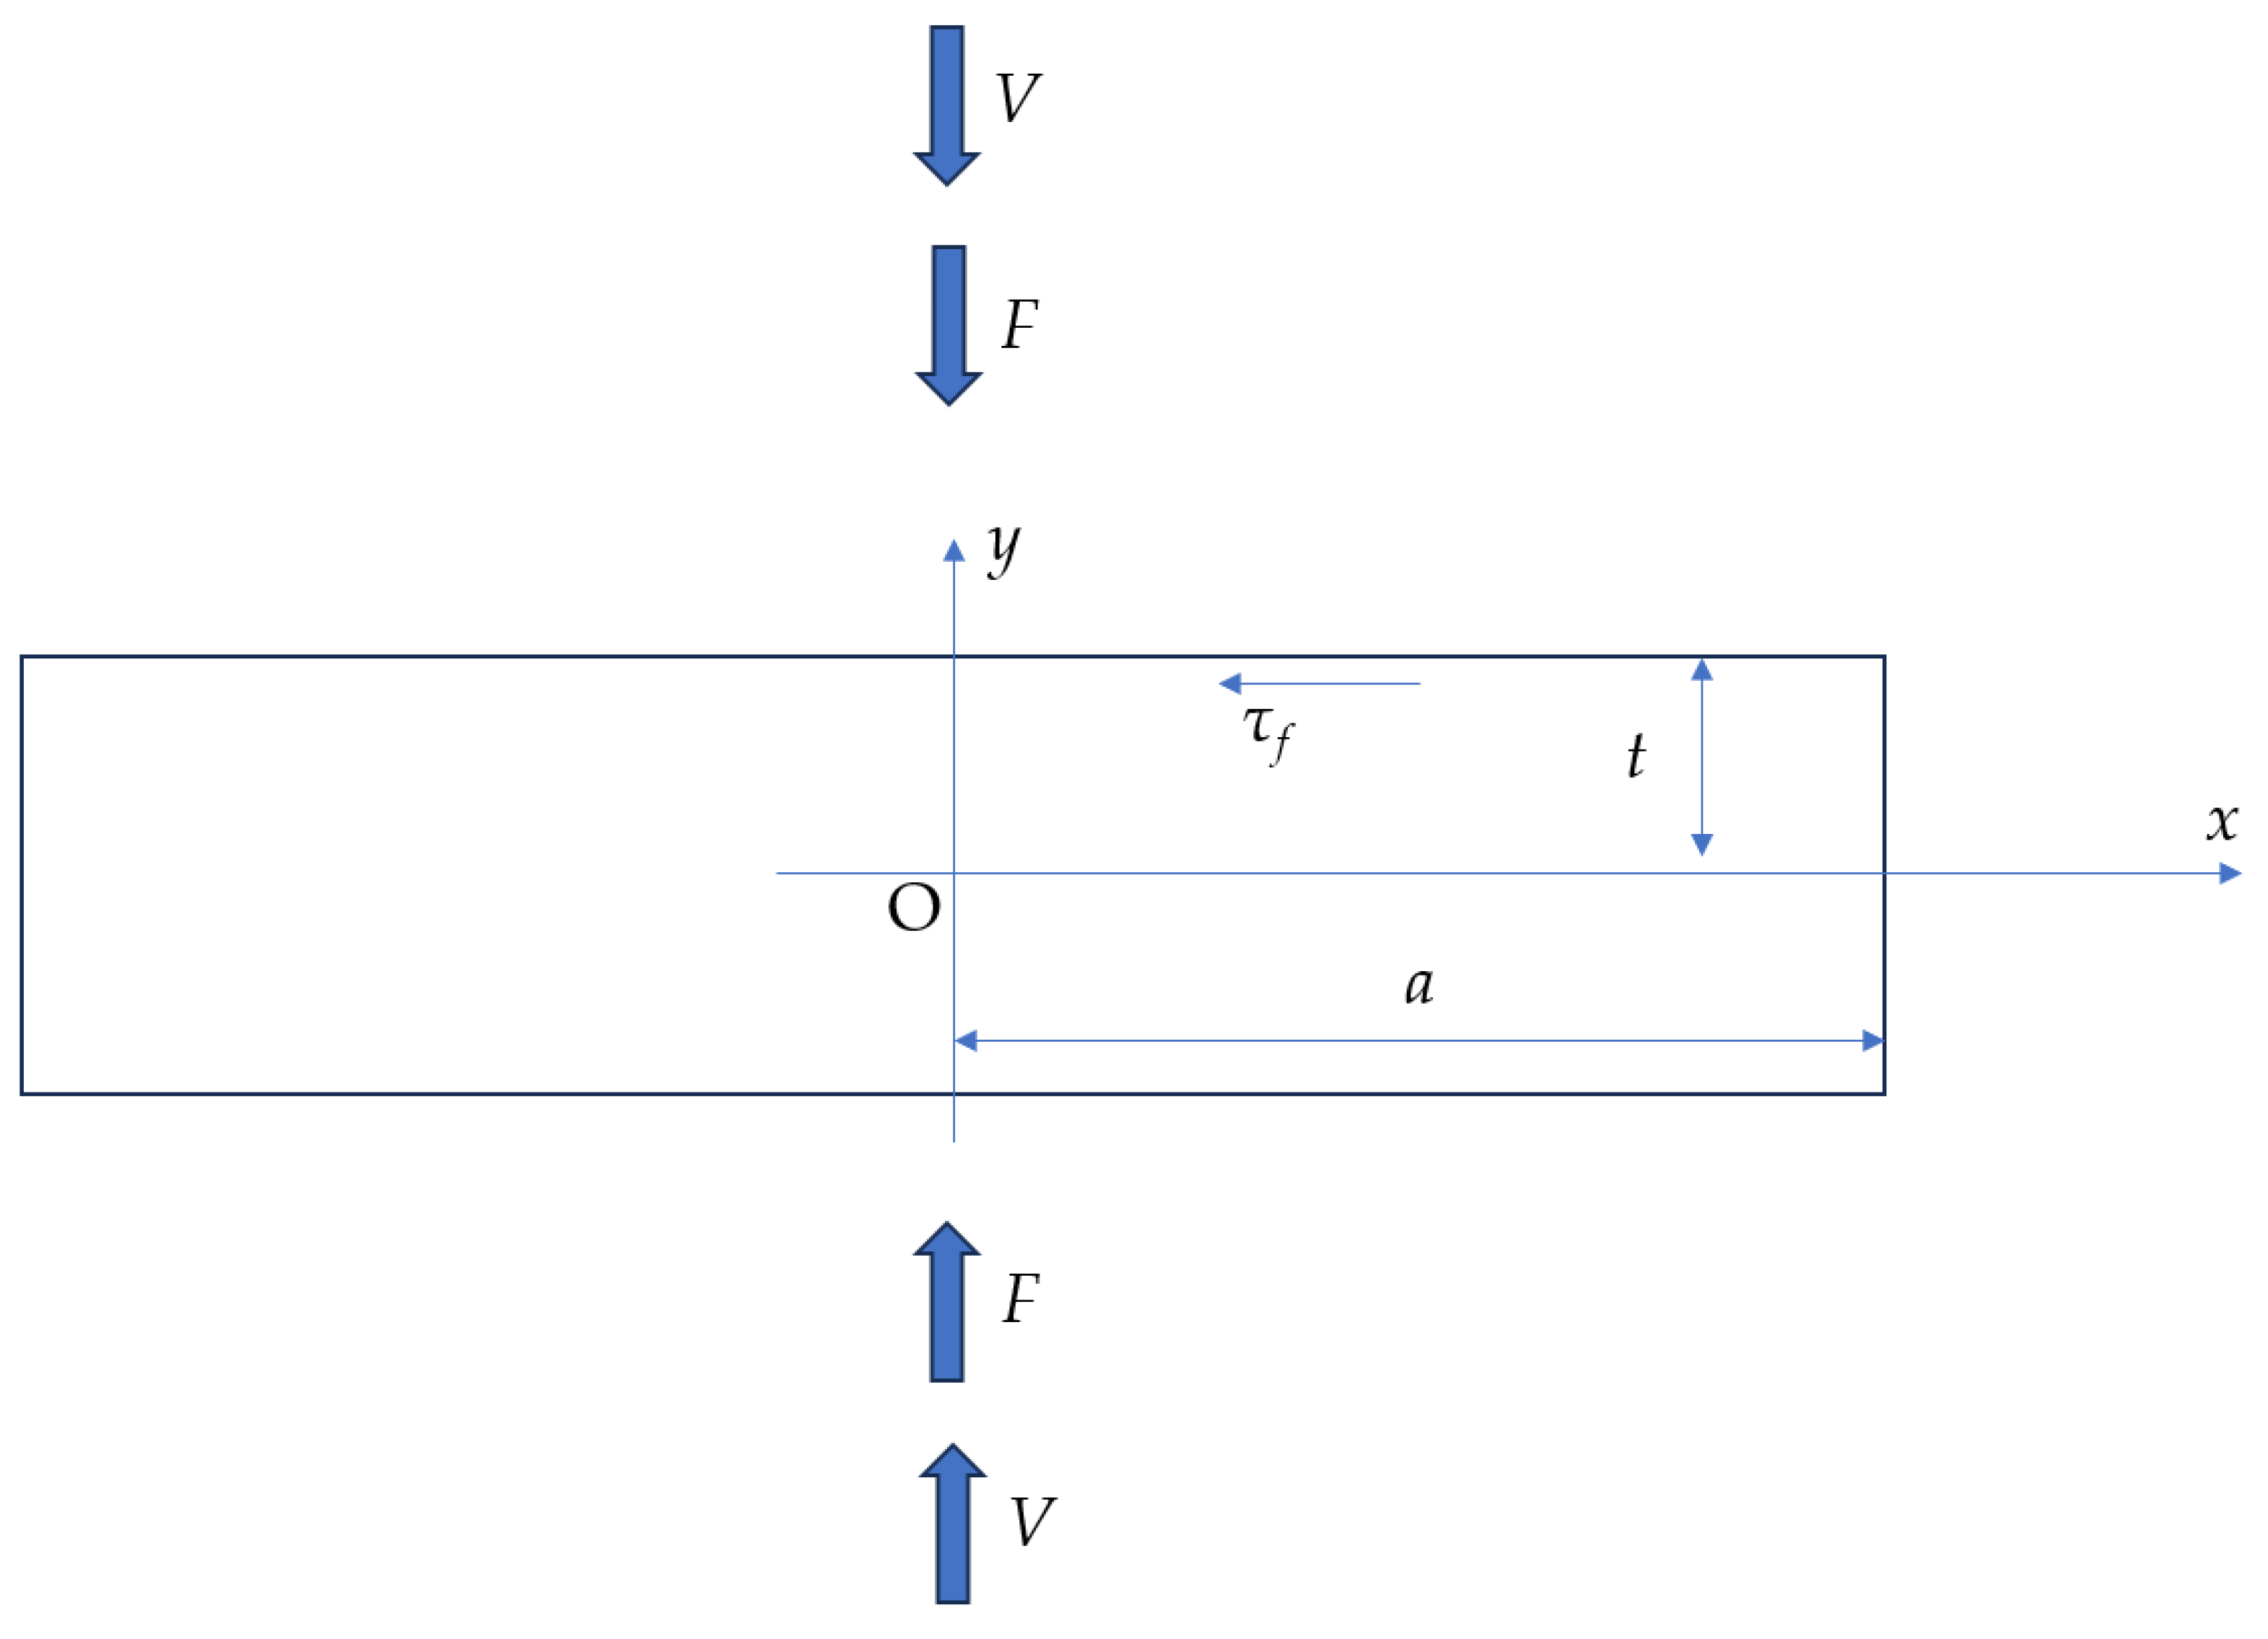
Figure 9.
Specimen for the compression test by Rastegaev’s method.
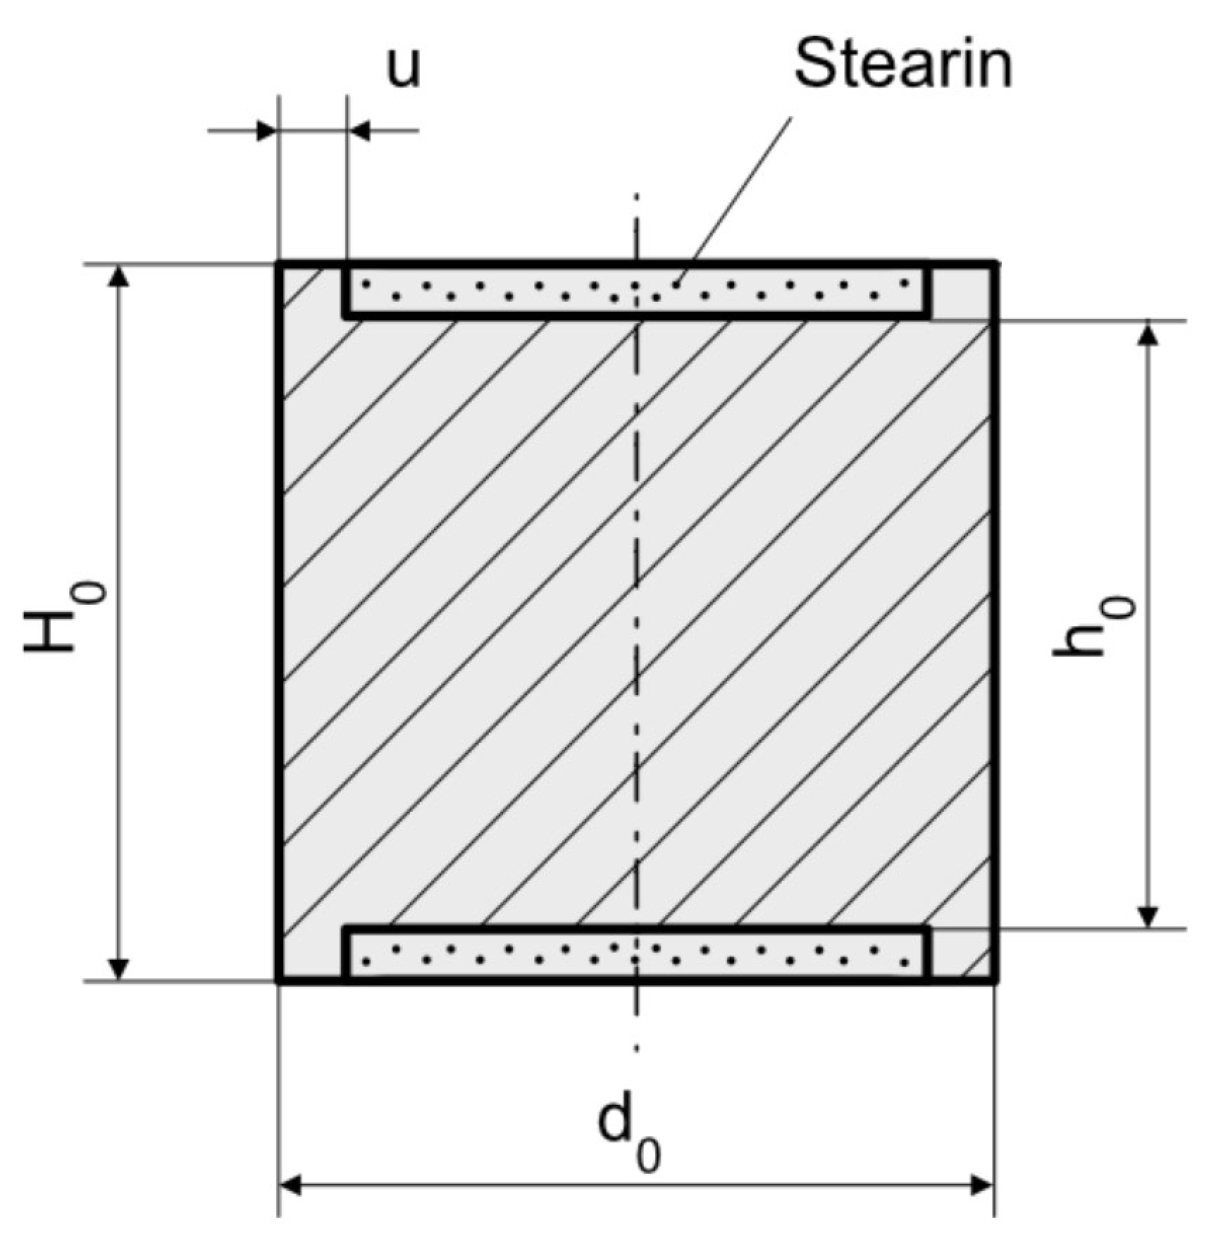
Figure 10.
Variation of the compression force with the punch’s stroke in tests by Rastegaev’s method: (a) AA6026 and (b) C45.
Figure 10.
Variation of the compression force with the punch’s stroke in tests by Rastegaev’s method: (a) AA6026 and (b) C45.
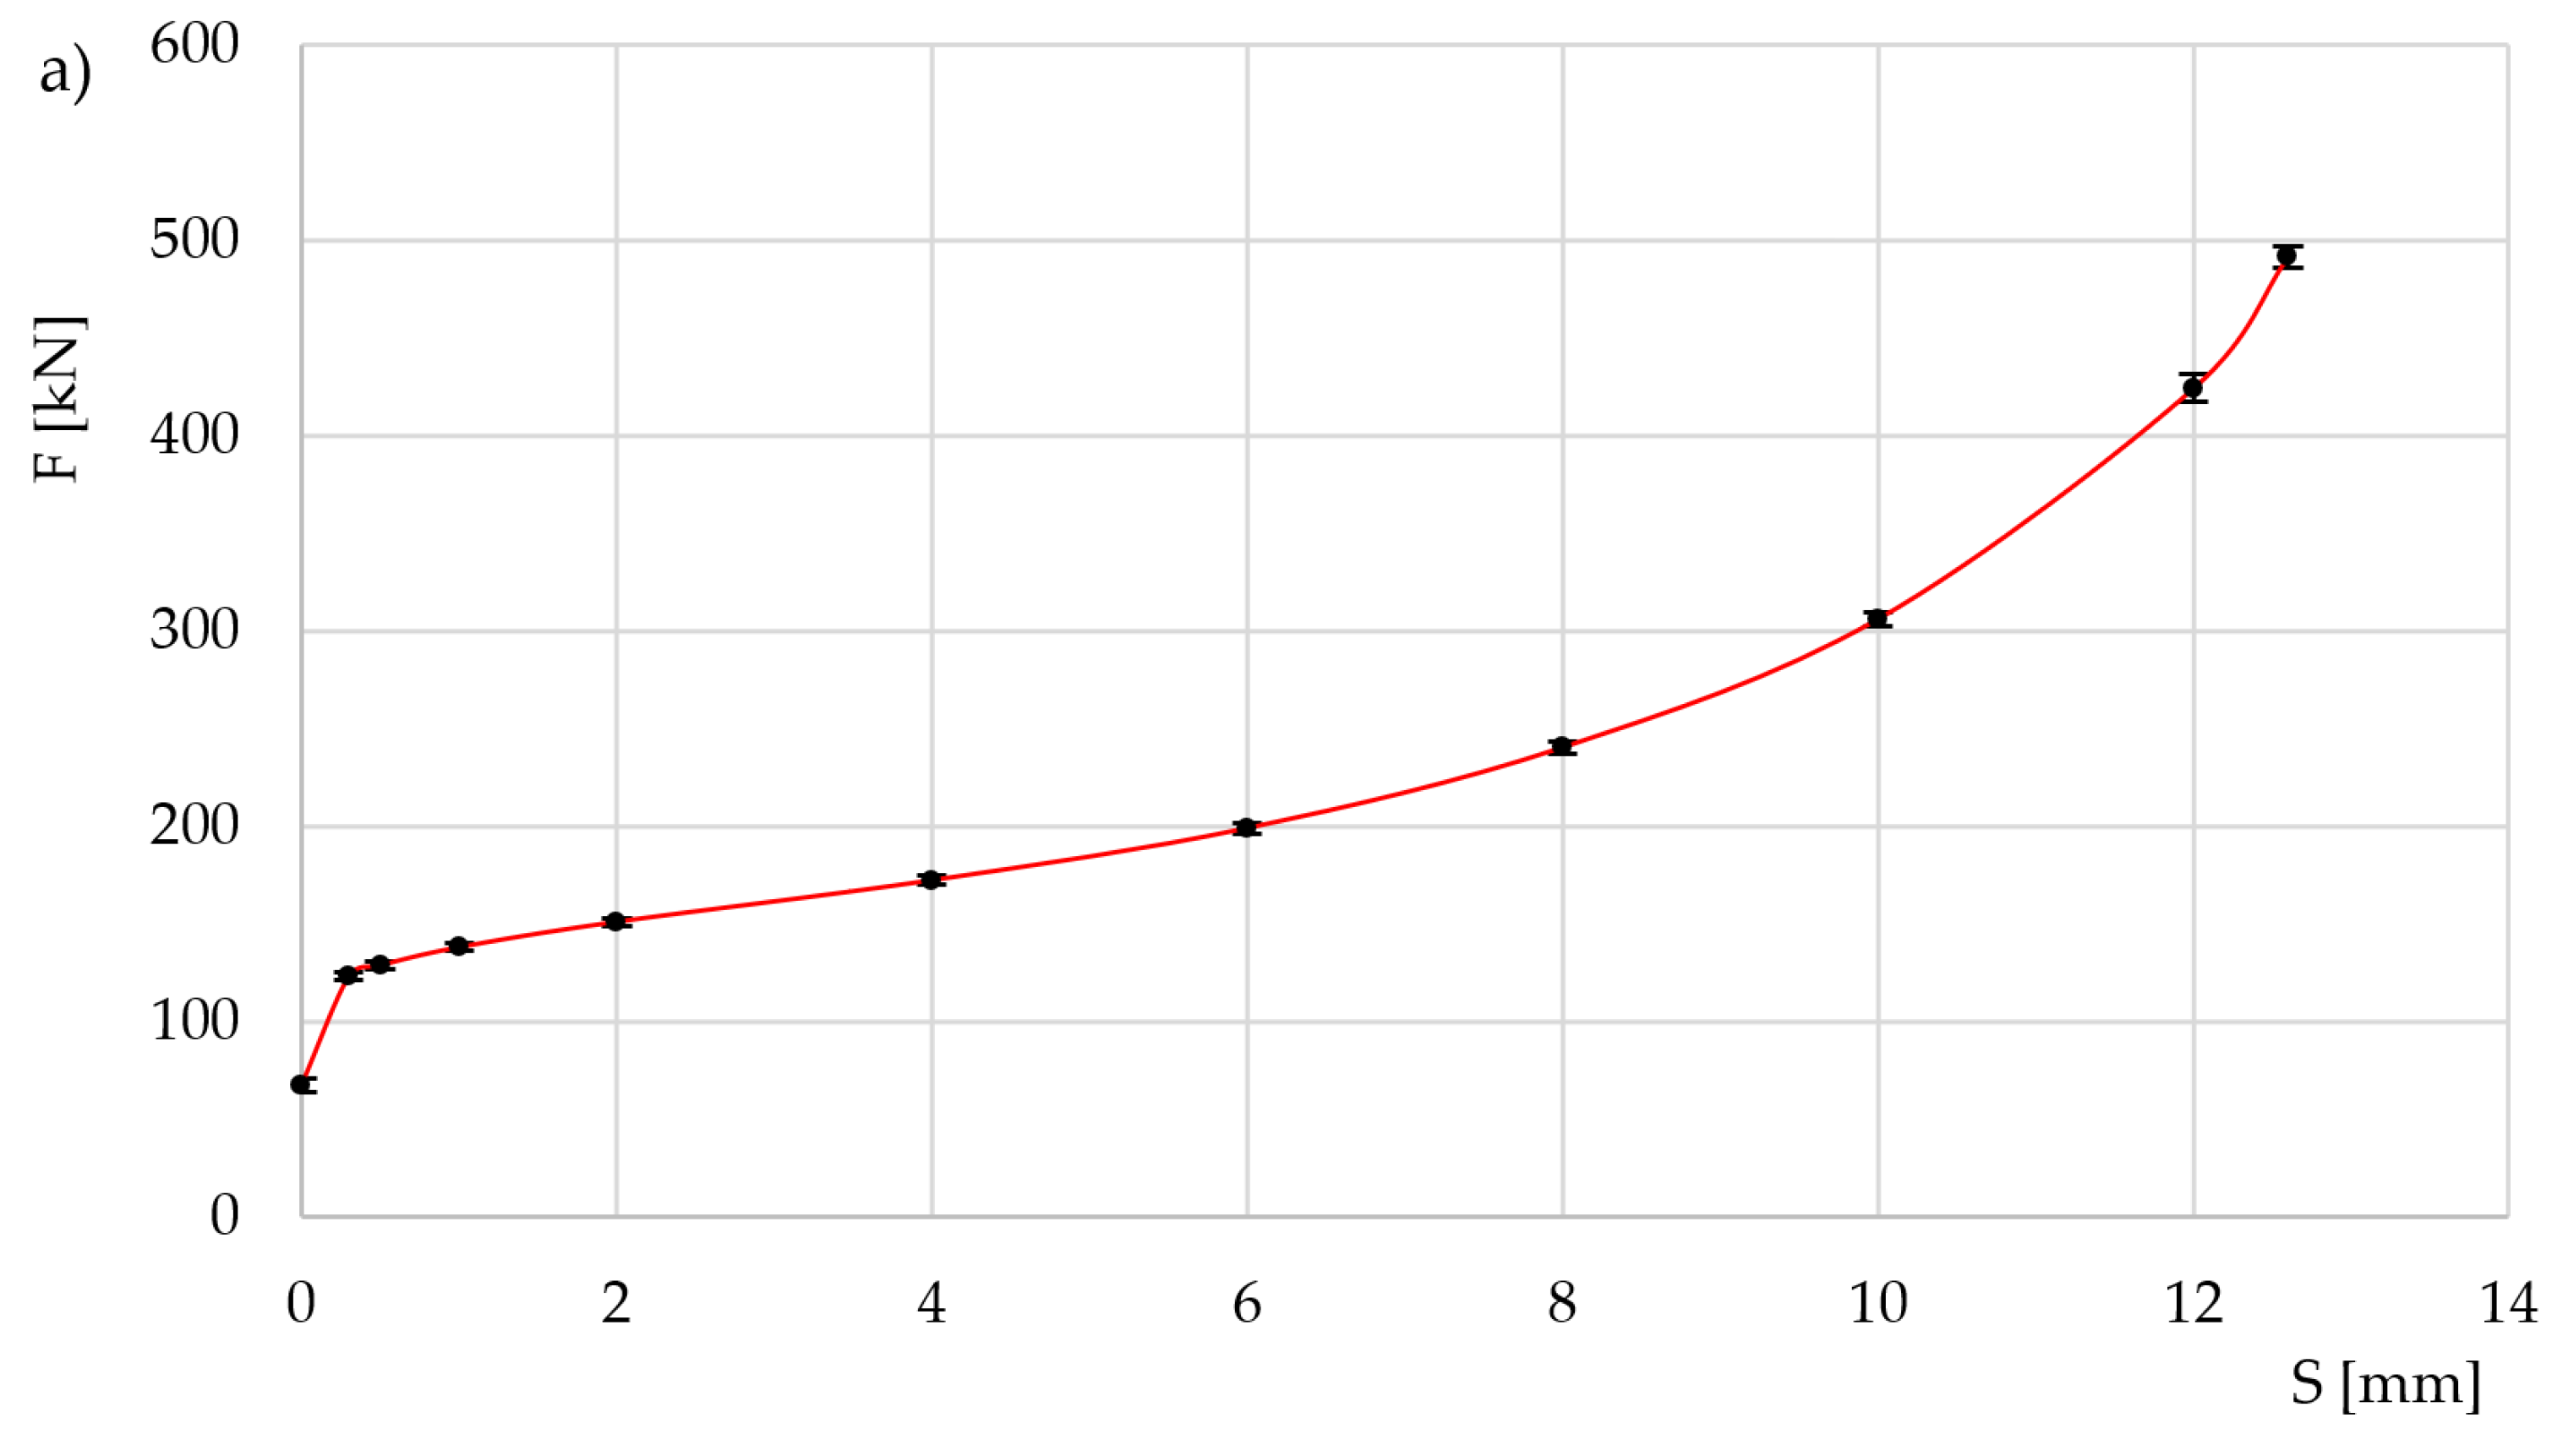
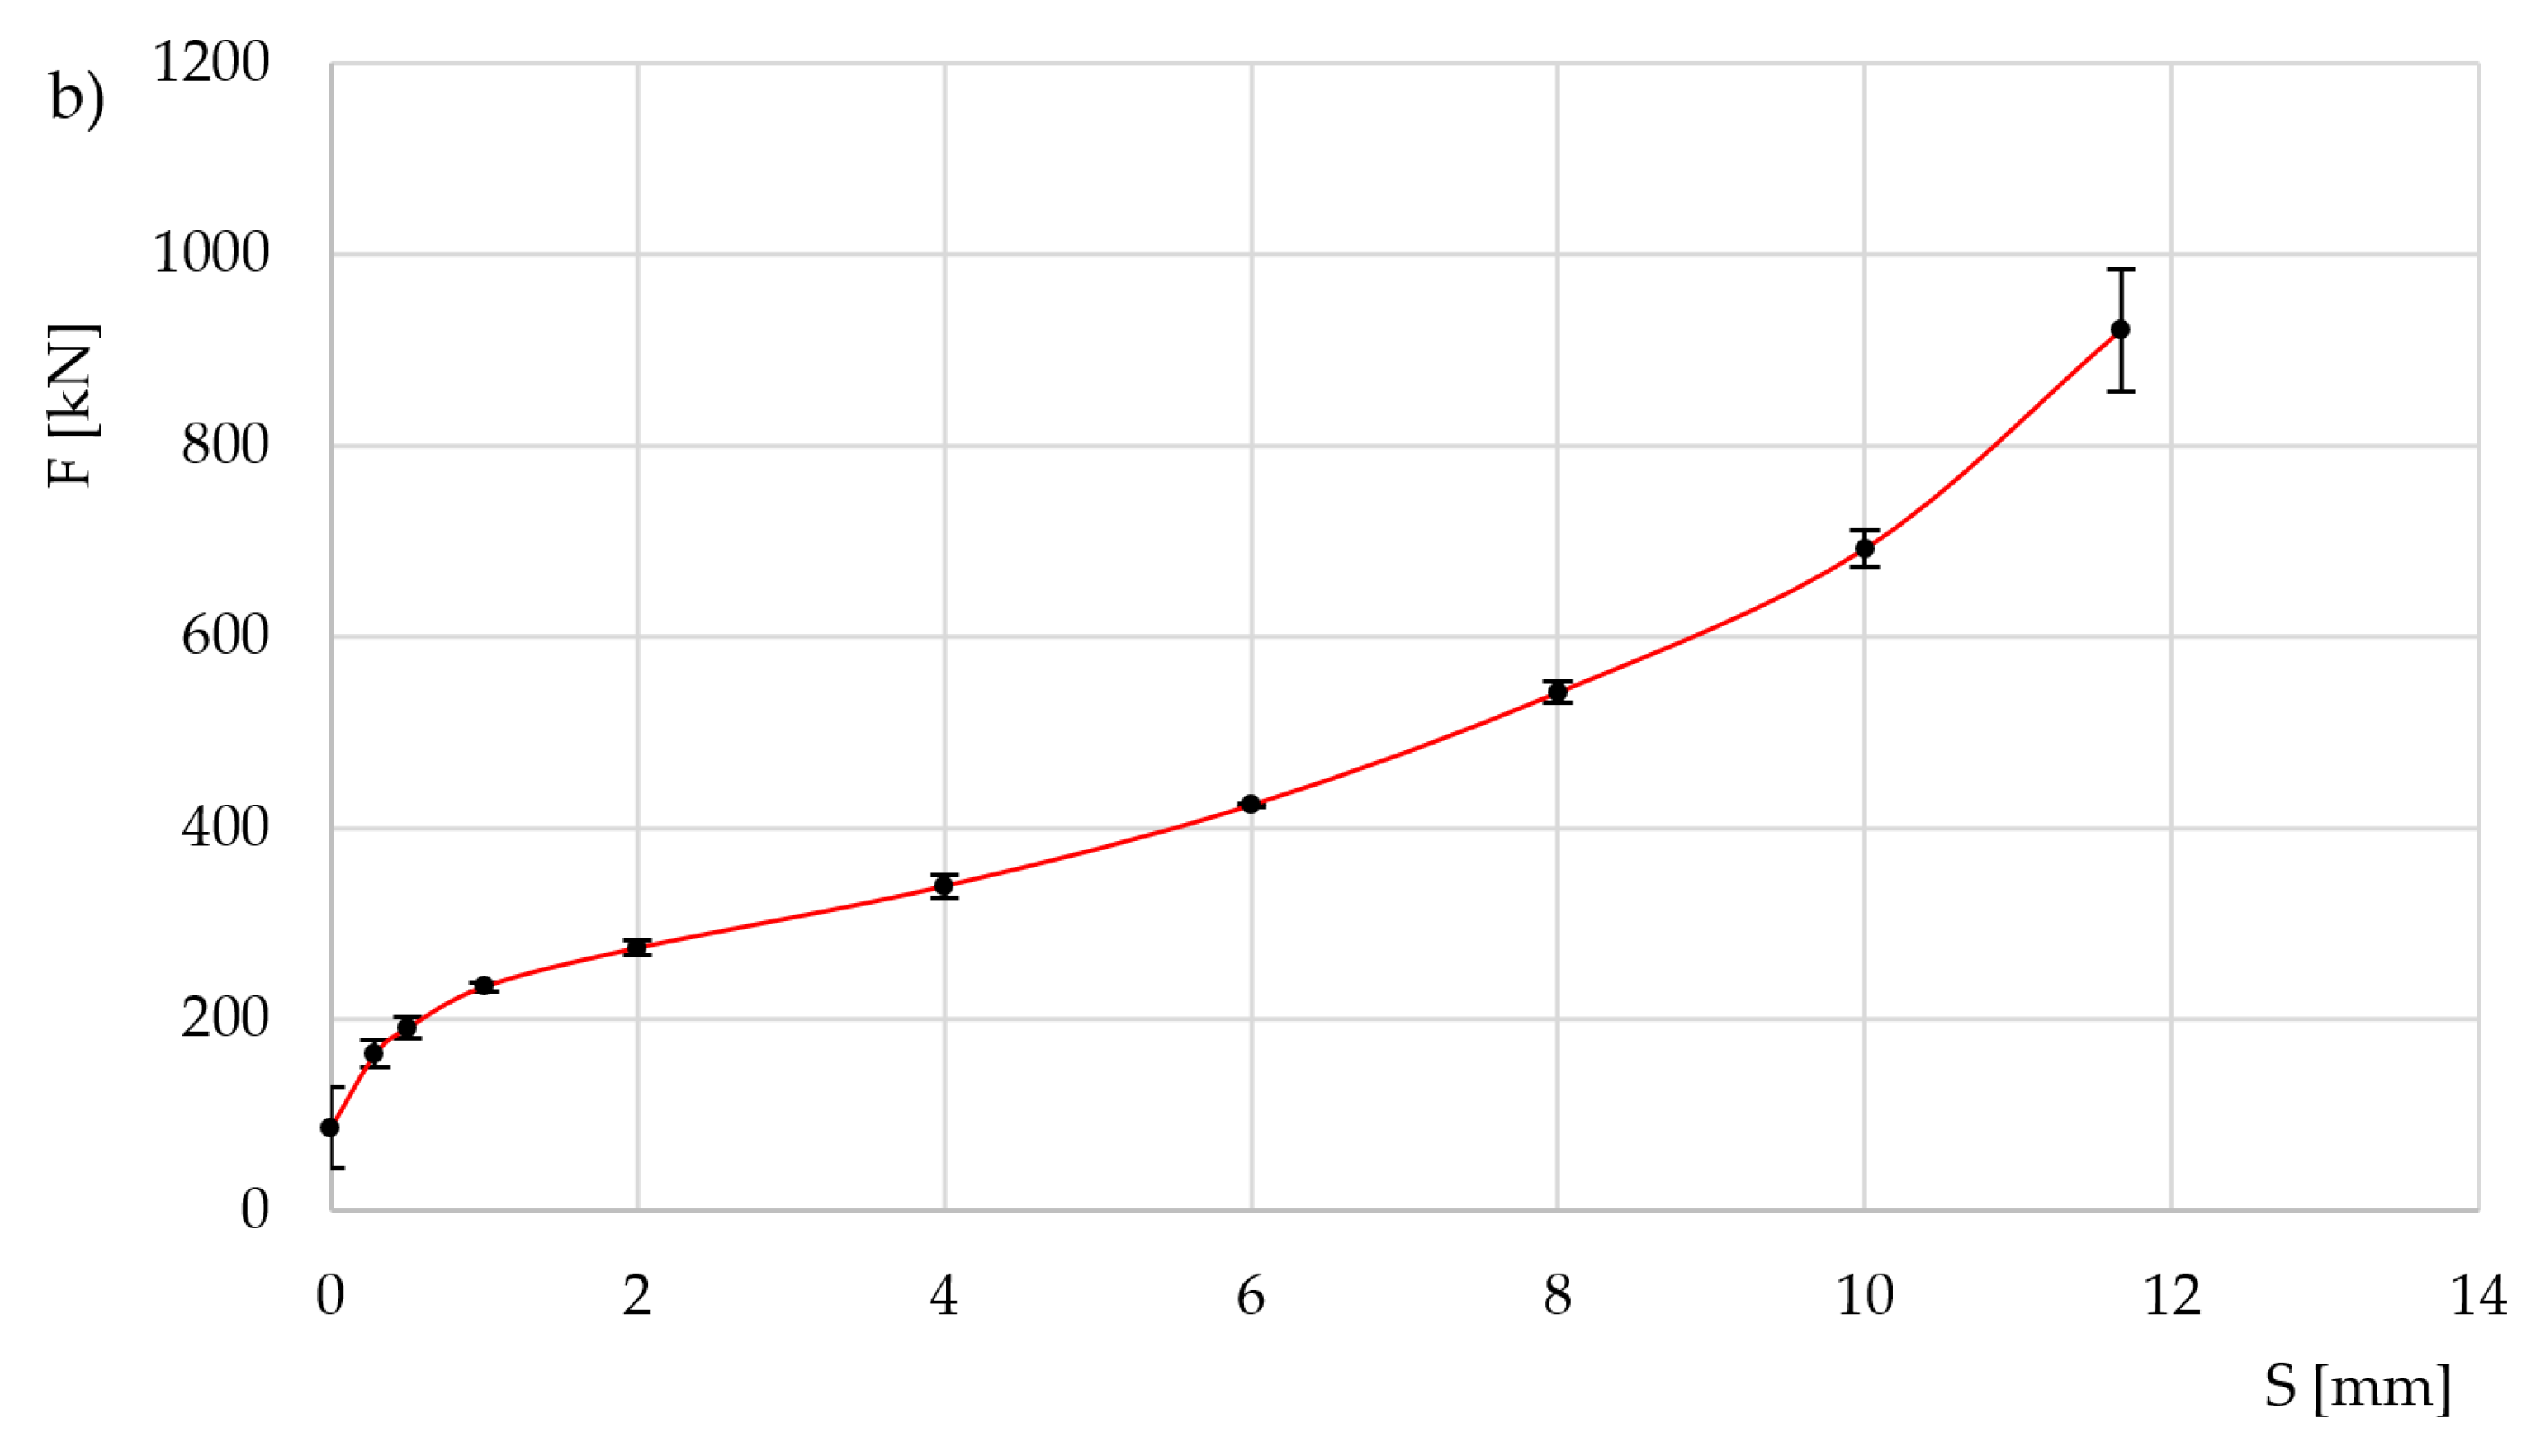
Figure 11.
Flow curves for a) AA 6026, and b) C45.
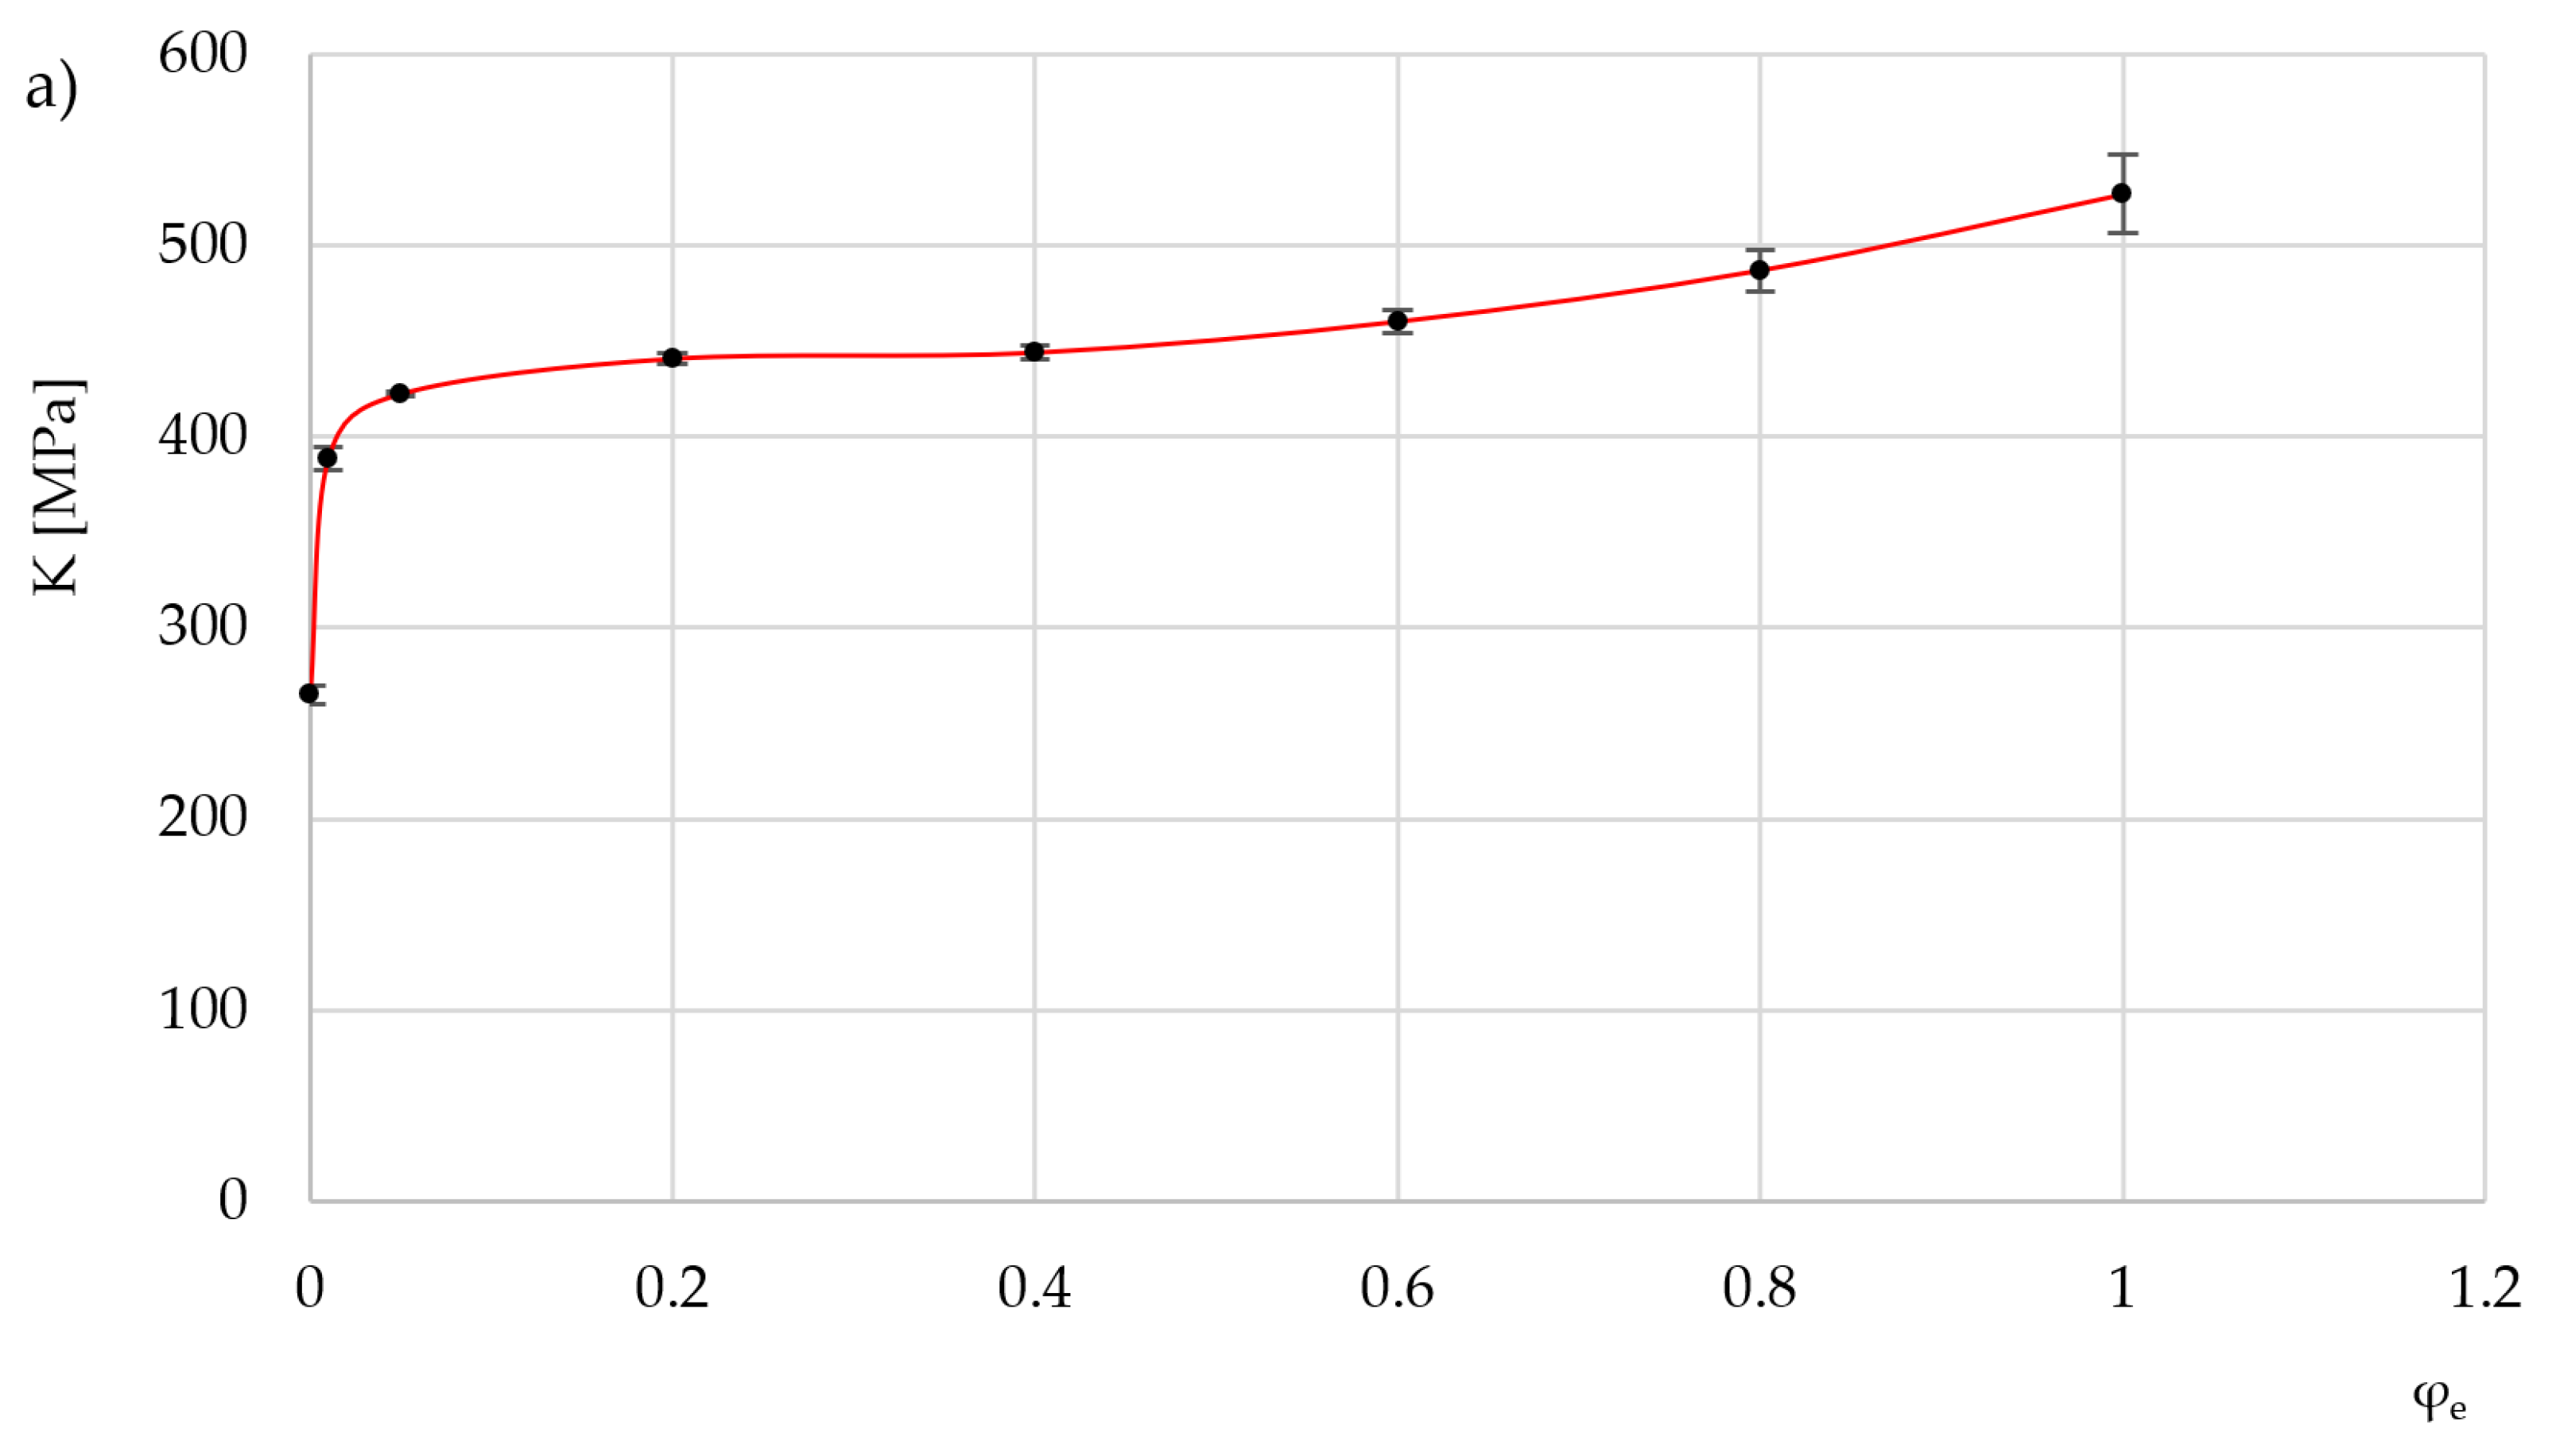
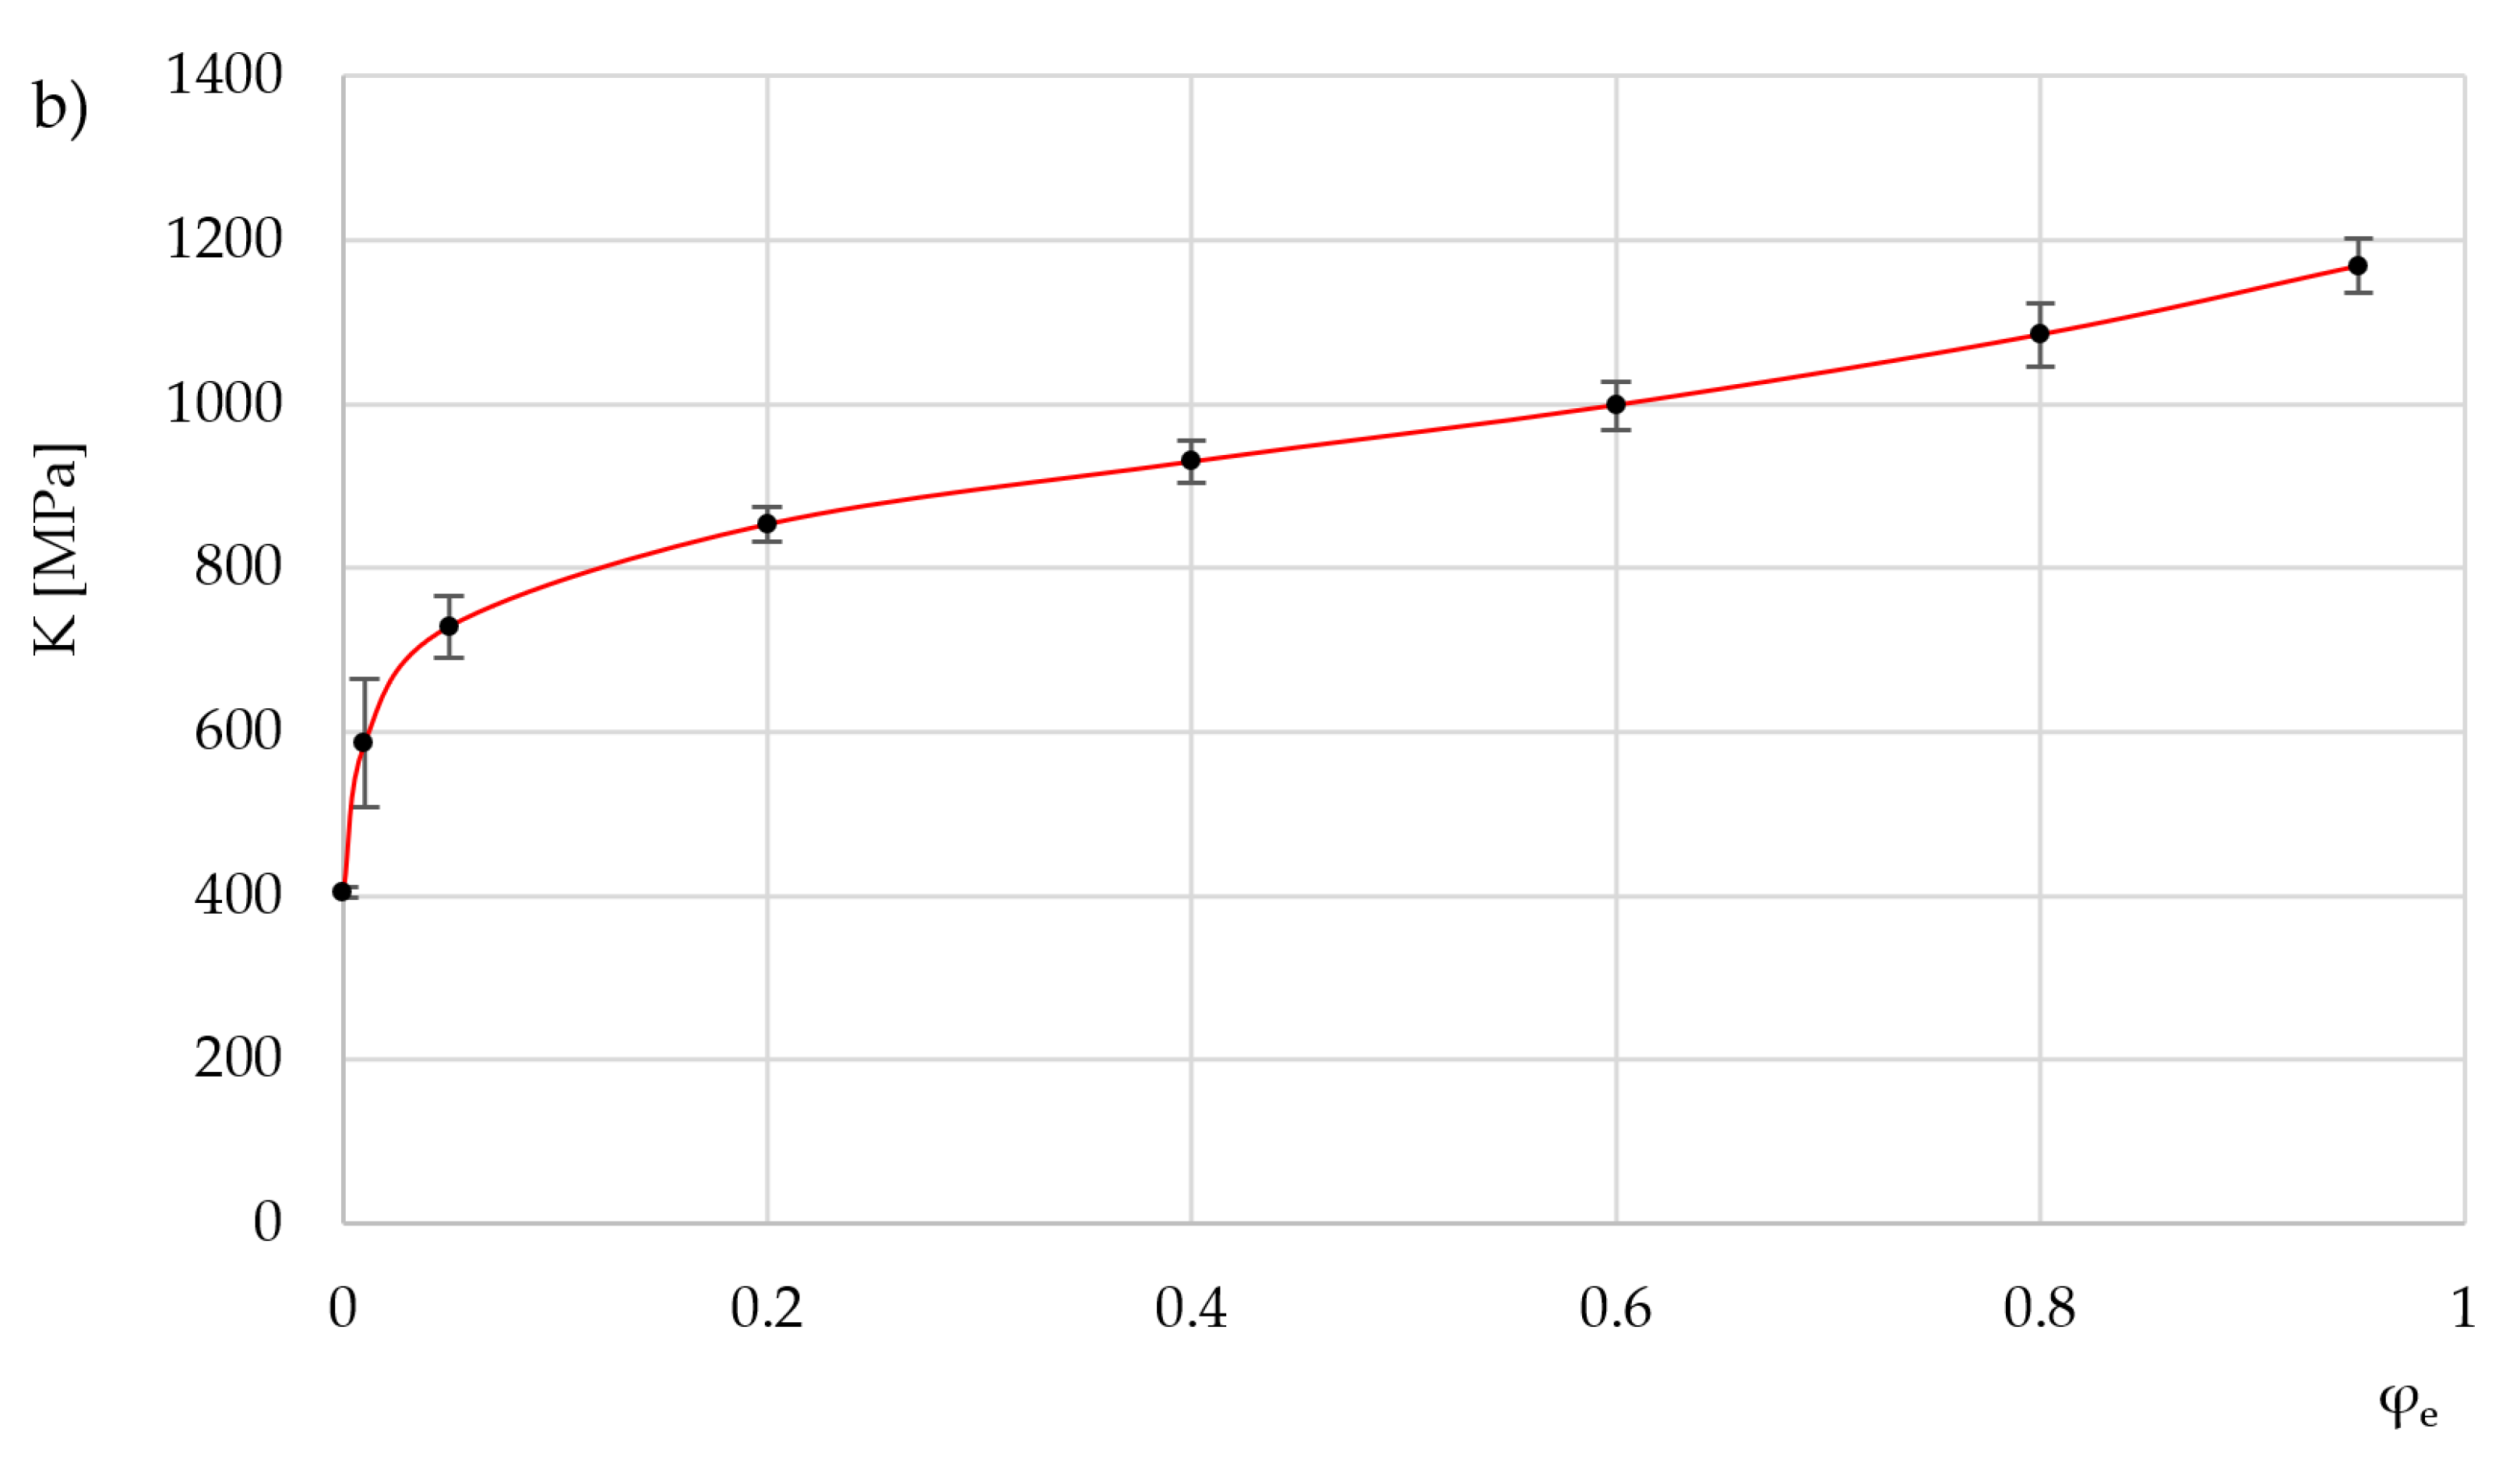
Figure 12.
Variation of the theoretical dimensionless compression force with η for several m-factors for AA6026 (solid lines) and the experimental curves (broken lines).
Figure 12.
Variation of the theoretical dimensionless compression force with η for several m-factors for AA6026 (solid lines) and the experimental curves (broken lines).
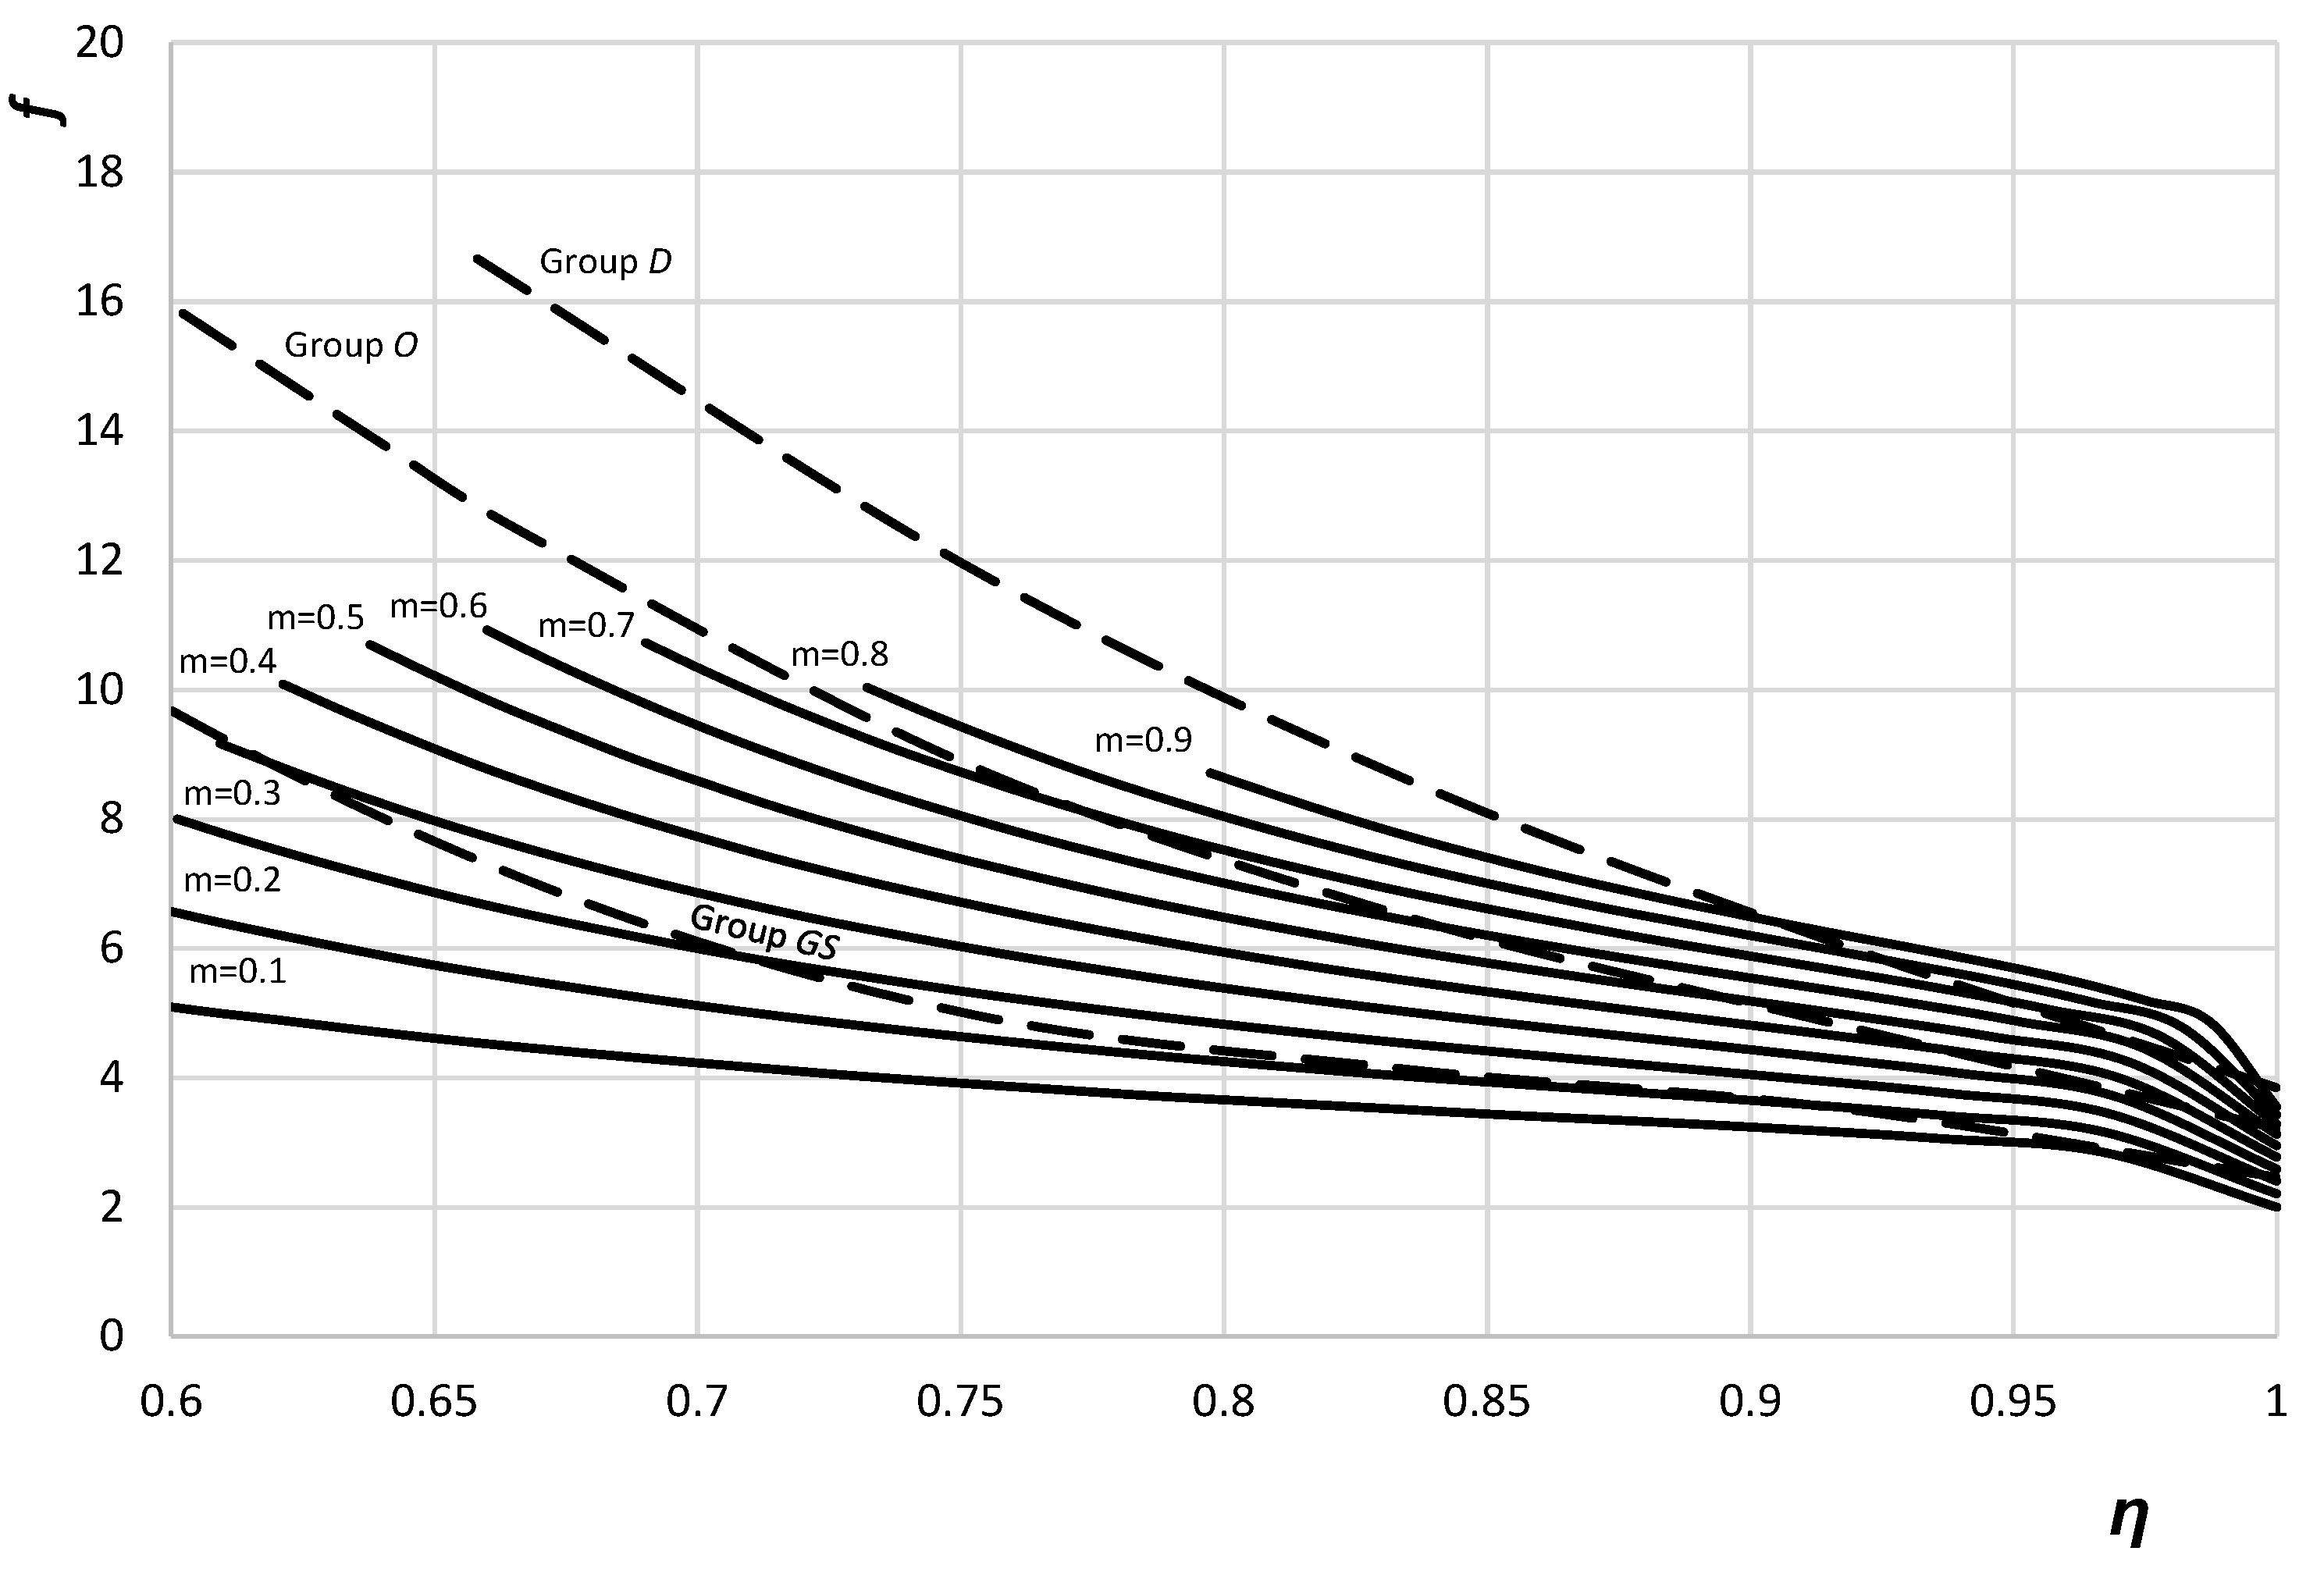
Figure 13.
Variation of the theoretical dimensionless compression force with η for several m-factors for C45 (solid lines) and the experimental curves (broken lines).
Figure 13.
Variation of the theoretical dimensionless compression force with η for several m-factors for C45 (solid lines) and the experimental curves (broken lines).
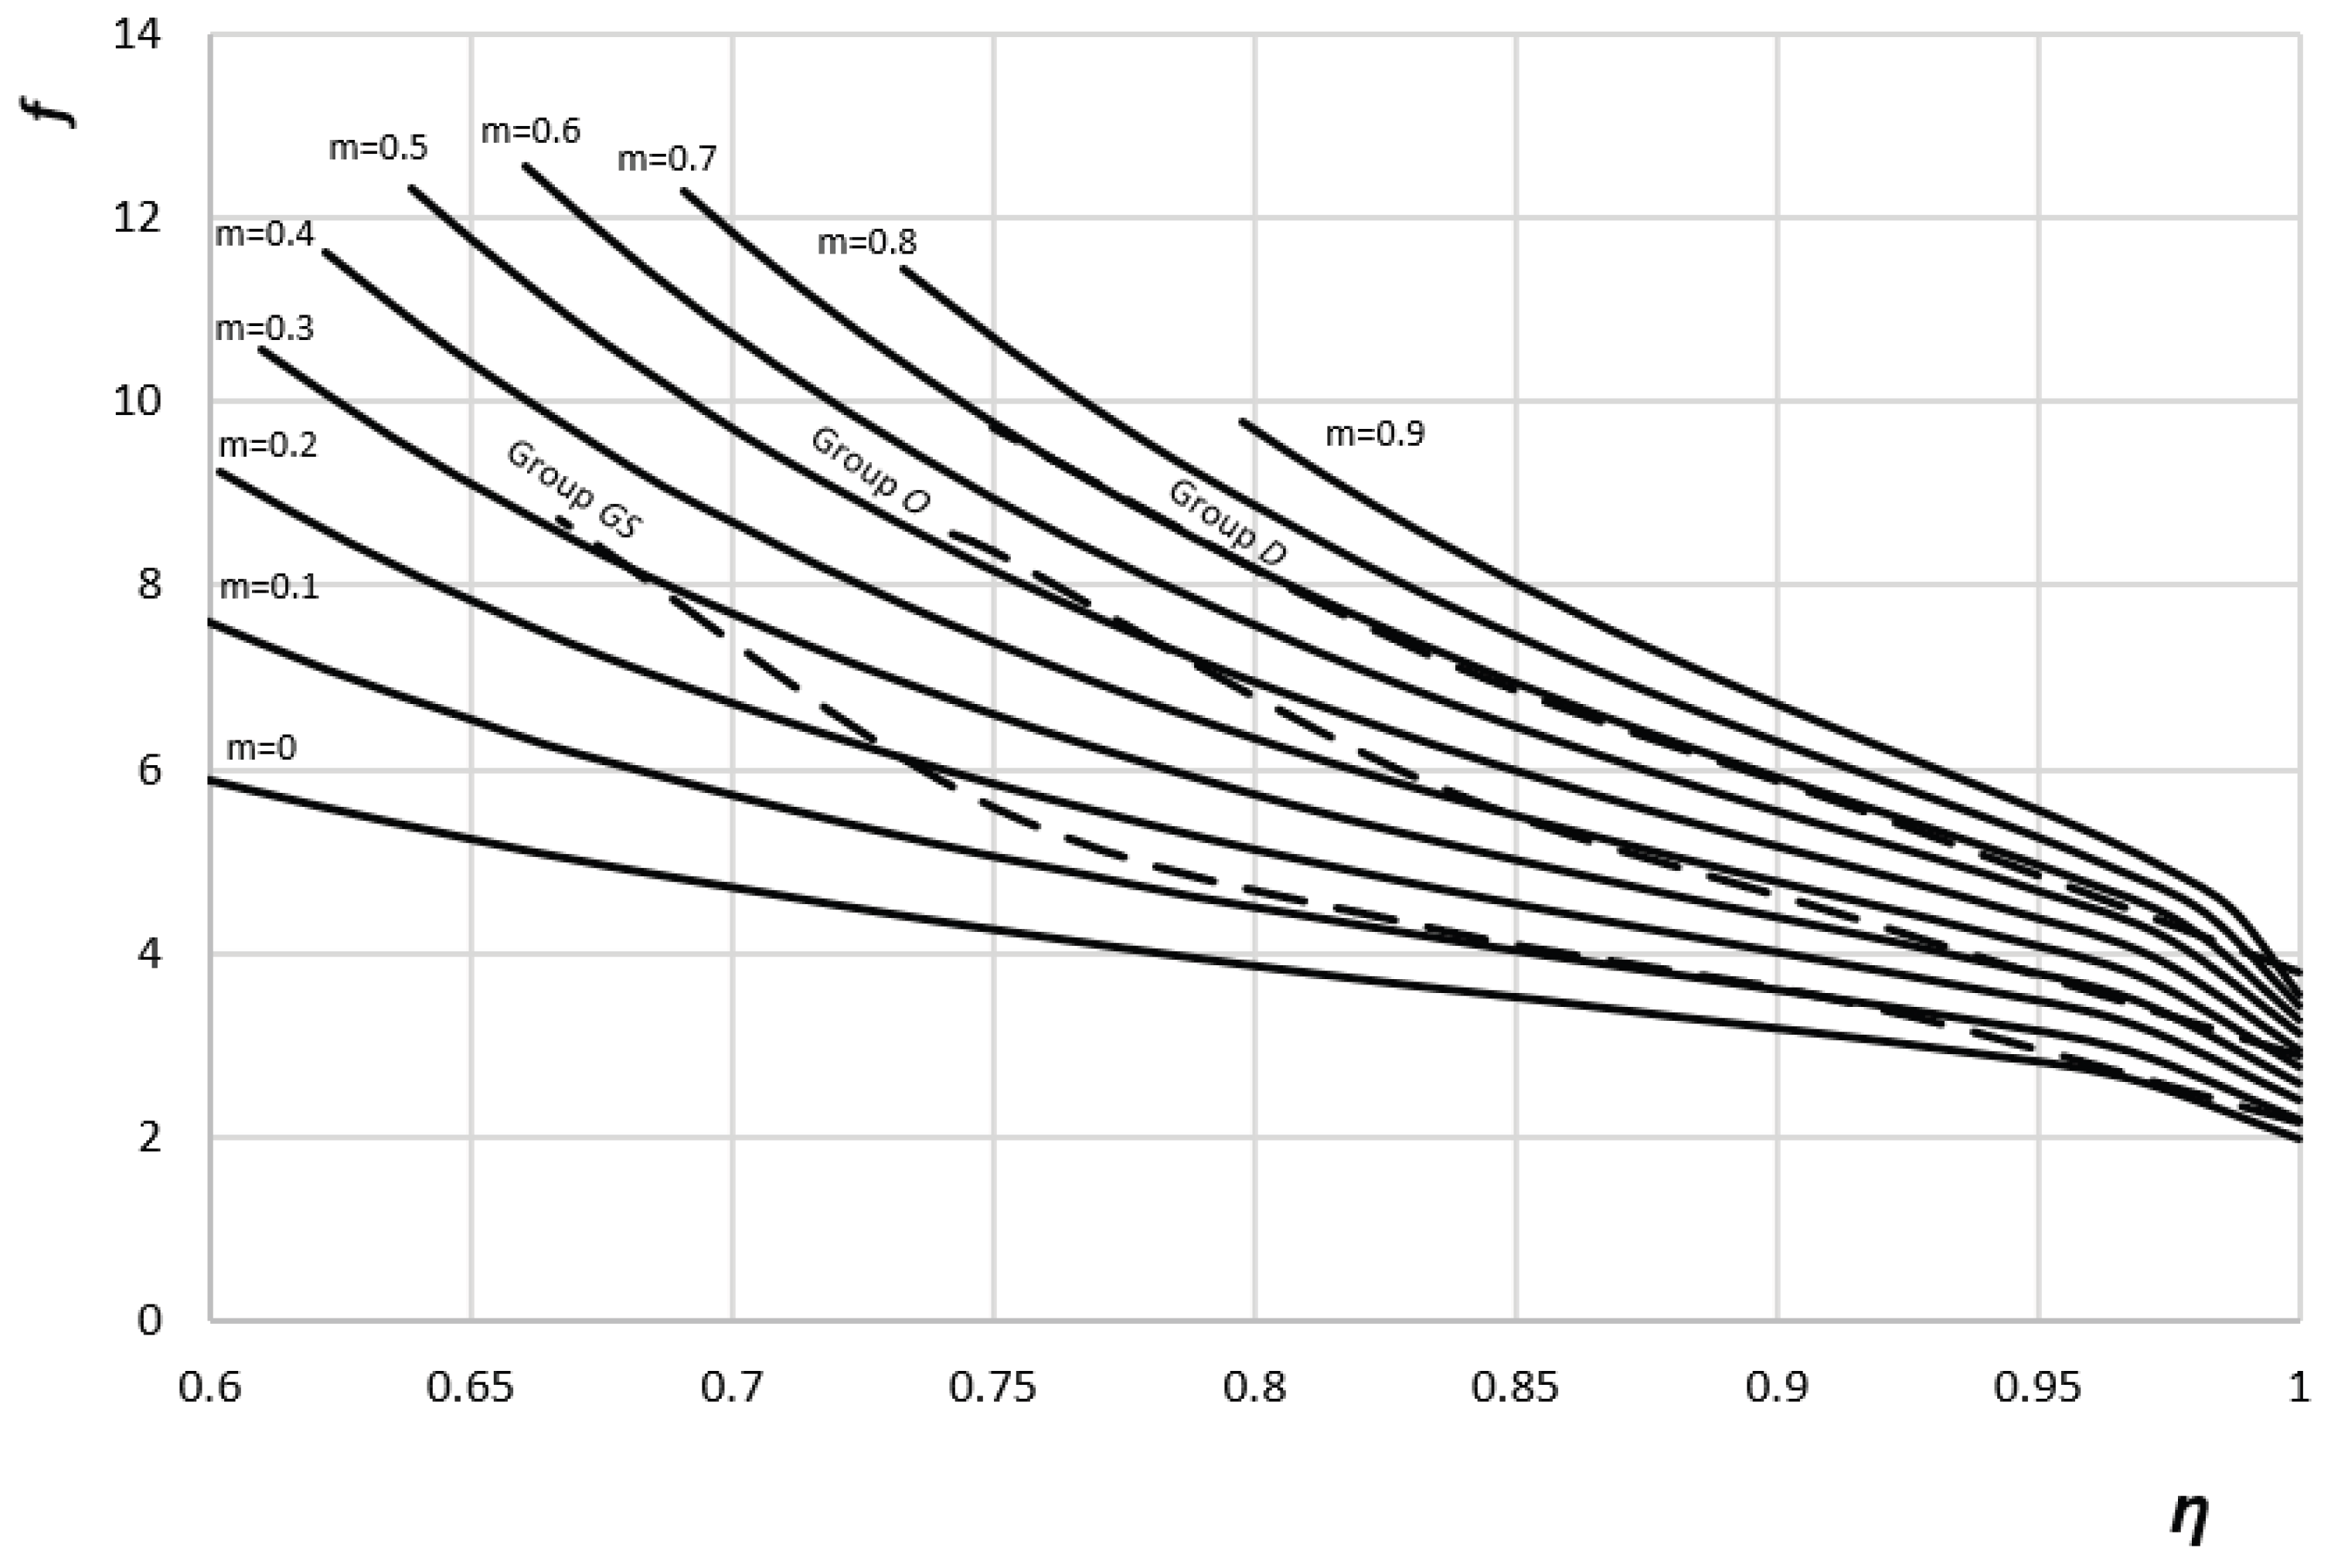

Table 1.
Dependence of the initial value of the friction factor on the frictional conditions for the two materials.
Table 1.
Dependence of the initial value of the friction factor on the frictional conditions for the two materials.
| Group O, Al |
Group GS, Al |
Group D, Al |
Group O, Steel |
Group GS, Steel |
Group D, Steel |
|
|---|---|---|---|---|---|---|
| f at η = 1 | 3.22 | 2.46 | 3.85 | 2.9 | 2.17 | 3.8 |
| Initial value of m | 0.67 | 0.22 | Very close to unity | 0.47 | 0.09 | Very close to unity |
Disclaimer/Publisher’s Note: The statements, opinions and data contained in all publications are solely those of the individual author(s) and contributor(s) and not of MDPI and/or the editor(s). MDPI and/or the editor(s) disclaim responsibility for any injury to people or property resulting from any ideas, methods, instructions or products referred to in the content. |
© 2025 by the authors. Licensee MDPI, Basel, Switzerland. This article is an open access article distributed under the terms and conditions of the Creative Commons Attribution (CC BY) license (http://creativecommons.org/licenses/by/4.0/).
Copyright: This open access article is published under a Creative Commons CC BY 4.0 license, which permit the free download, distribution, and reuse, provided that the author and preprint are cited in any reuse.


