
Submitted:
18 November 2025
Posted:
19 November 2025
You are already at the latest version
Abstract
This paper illustrates an original Data-Driven Analysis on logistics matters, developed within the scope of a research & development project conducted by La Logistica S.r.l. and financed by the Apulia Region. The paper uses real operative data for developing and validating a complete analytical tool to forecast volume saturation on pallets. Compared to other studies on similar matters, which frequently make use of simulated and ideal sets of data, this research provides a unique opportunity to test, on an empirical ground, how very advanced Data Science approaches could be successfully applied on industrial processes.The paper develops a complete analytical investigation combining diagnose analytics, forecasting and model-interpretability to compare the performances of many different Machine Learning algorithms, such us K-Nearest Neighbors, Decision Trees, Random Forest, Boosting, Support Vector Machines, and Linear Models. The results obtained after an overarching comparison show how KNN is significantly more accurate and trustful in relation to any other method, outperforming any other on any key error measure and interpretability factors. The addition of contribution and importance investigation on variables extends to this paper a unique degree of originality, showing which SKUs’ physical variables are most significantly influencing volume saturation on pallets, and offering immediate management implications related to their operative meaning. The complete methodological pipeline is grounded on real operative data regarding La Logistica S.r.l., making this paper capable to show how operative Data-Driven solutions could play an innovative role into improving operative continuity within logistics matters.
Keywords:
logistics optimization
; warehouse management
; data-driven modelling
; machine learning
; operational efficiency
1. Introduction
The increasingly dynamic nature of global supply chains has led to the increased strategic relevance of logistics, moving on from being viewed merely as an operation to being viewed as a strategic competence which is crucial to competitiveness, sustainability, and efficiency (Chen & Liao, 2023; Ojadi et al., 2024). Amidst this background, warehouse management emerges as a crucial segment, which can indeed function as a physical and information interface between incoming product flows and outgoing product distribution processes (Sodiya et al., 2024). The growing variability of product sets, corresponding variability in demands, and simultaneous demands to cut down costs have exposed several weaknesses within present approaches to manage such warehousing units, which continuously depend upon static rules, human expertise, and simple descriptive analytics (Hosseini et al., 2024). These generally lack comprehensiveness within modern logistics settings, due to which complex interactions between product sets, corresponding palletization rules, and handling constraints lead to distinctly nonlinear dynamics within such operation sets (Hosseini et al., 2024). To counter such realities, present demands on third-party logistics units to employ sophisticated data analytics and knowledge-science competencies have become unavoidable (Mulla, 2022; Boonma, 2025). These increasingly empower organizations to derive actionable knowledge sets directly from corresponding warehousing function sets, which helps identify unseen inefficiencies, moving on to evidence-based decision making (Burra, 2025; Chen & Liao, 2023). The paper's originality lies directly within proving that a comprehensive methodology can be devised on diagnostics, predictions, and machine-learning analytics to pragmatically work directly on corresponding operation sets available within an actual third-party logistics company operating within Italy—La Logistica S.r.l. This paper helps fill an existing knowledge gap because empirical studies available within such literature on corresponding industrial operation sets directly remain relatively less within this segment (HAYTA et al., 2023). The paper helps address this knowledge gap because this specific work helps devise a replicable knowledge segment to pragmatically combine corresponding approaches within such literature to pragmatically address third-party logistics management. The warehousing environment is responsible for generating copious information sets directly about product attributes, operation sets, corresponding storage sets, and resulting outcome sets within corresponding pallet configurations (Sodiya et al., 2024). The corresponding information sets generated within such warehousing units remained generally inadequately leveraged or remained generally segregated within corresponding information units to pragmatically synthesize a comprehensive perspective within such warehousing sets (Sodiya et al., 2024). The corresponding strategic role within digitalization pertaining to IoT devices to corresponding sophisticated warehousing management units directly enables organizations to generate distinctly higher granularity sets within such operation sets directly to pragmatically empower such organizations to synthesize sophisticated analytics to pragmatically diagnose such inefficient sets within corresponding warehousing management units on an empirical basis rather than mere human opinions (Mulla, 2022; Daios et al., 2024). Against this background, this research study investigates the following research question: How can data science and machine-learning approaches be employed to explain and predict pallet volume saturation within a practical warehousing environment? How can these results aid more optimal warehousing management? To accomplish this, this analytical research employ two scenario approaches. The initial approach is to make use of diagnostic analytics to discover which product attributes—such as dimensions, weight, and volume—interact to produce what level(s) of volume saturation on a pallet (Aylak et al., 2021). Conventional rules-based approaches disregard these non-linear correlations, causing irregularities in building product pallets, inefficient volume usage, and misdirected product saturation. The analytical work uses machine-learning principles to identify which product attributes impact a pallet’s behavior and to what extent upon operation (Vu et al., 2024 & HAYTA et al., 2023). The second approach is to employ machine-learning algorithms to make predictions on volume saturation on a new product type. Machine-learning algorithms such as K- Nearest Neighbors and Trees can assess complex correlations between variables successfully to generate predictions across product lines (Hosseini et al., 2024). The key strength of this analytical work is to make use of Explainable Machine-Learning to break down each distinct prediction to specific product attributes’ contribution to these predictions (Burra, 2025 & Sodiya et al., 2024). This enables both validation and incorporation into practical business processes by information stakeholders. This is particularly important within a warehousing environment where actionable results can make a concrete difference to information stakeholders’ productivity. The contribution to this specific body of literature is multifaceted. The first is that this analytical work is only one out of very few studies that offer a practical result within a properly operating environment, complementing other studies employing ideal warehousing simulations (Mulla, 2022 & HAYTA et al., 2023). The second is this analytical work is equipped with a practical step-wise methodological approach consisting of multiple aspects—data preprocessing, attribute identification, diagnosis, prediction, and interpretable result generation (Boonma, 2025)—that can easily be repeated and modified according to one’s interest within both academic circles and practical warehousing circles. Third, there is a unique perspective herein on how product features can impact pallet saturation volume, which helps expand the understanding related to item behavior within a warehousing context (Aylak et al., 2021; Vu et al., 2024). The second unique aspect is scalability. The developed formulas could be generally applied across product types, zones, and/or multiple warehousing locations. Then, with access to more information, machine-learning processes can adapt to changes within product offerings, packaging specifications, and warehousing conditions (Daios et al., 2024). This is crucial within rapidly fluctuating warehousing landscapes (Ojadi et al., 2024) (Chen & Liao, 2023). The more widespread usage of analytical technology is also supportive of sustainability initiatives. This is because there is reduced travel volume due to better use of available pallet space, which helps lower fuel emissions and CO₂ (Ojadi et al., 2024). Better management also results in reduced waste within inventory results. Diagnostic information can better isolate returns, repackaging, and matters related to recycling (Daios et al., 2024). Therefore, analytics-driven processes can assimilate into both effectiveness and sustainability goals. Despite such value-adding aspects, there are technological integration pain points to overcome within analytics-driven warehousing management approaches. These include issues such as poor information quality, technological integration, and other aspects concerning model explainability (Sodiya et al., 2024) (Hosseini et al., 2024). Typically, there is a need to clean, standardize, and verify information within warehousing operations to isolate information worthy of analytical review. Another complementing element is making sure information across company technology operates on one converging analytical platform. Additionally, there might still exist value within machine learning to ensure they are more interpretable. All these factors discuss how analytics integration could serve more than warehousing technology up-gradation but more like a paradigm shift change toward more analytical warehousing cultures (Burra, 2025) (Ojadi et al., 2024). This ensures organizations with better integration with available information offer more strength toward being more resilient, efficient, and more competitively aligned to a more complex warehousing environment (Chen & Liao, 2023).
2. Diagnostic Modelling Framework and Comparative Evaluation of Machine Learning Algorithms
In the diagnostic analysis, the data are examined in terms of their relationships. First, it is necessary to specify a research question, that is, to identify a variable to be estimated, represented in the equation as the y on the left-hand side of the model. Then, the variables that will be used to investigate y—the x variables on the right-hand side of the model—are identified. In our case, purely for illustrative purposes, we have chosen to use the following research question:
As a diagnostic tool, we used the machine learning algorithms listed in the following Table 1.
To compare the algorithms, it is necessary to normalize the data, as shown in the following Figure 1.
Among these approaches, K-Nearest Neighbors (KNN) is found to be the most consistent method. This is because KNN achieves the highest value on normalized MSE, RMSE, and MAE, which translates to more accurate numerical predictions on each critical error measure, a result consistent with those obtained by Rimal et al. (2025) in their comparison of KNN with other classifiers such as Random Forest and Support Vector Machine, regarding its predictions being more accurate. The results on KNN also approach optimality on MSE-normalized scores, but its value on the coefficient of determination is already 99.5%, leaving little room for improvement. The best classifier is only outperformed by having a slightly better value on both R² and MSE-normalized scores, but it lags behind on absolute error measures, causing this marginal advantage to be eliminated when the scores are averaged, a scenario also observed by Palaniappan and Karthikeyan (2024) on SVR, KNN, and decision tree-based approaches. Random Forest ranks third with low error values and an R² score very close to 80%, but nowhere near the prediction accuracy of KNN and SVR. The remaining approaches rank lower due to higher error values and low explanatory power values. This observation is consistent with Iparraguirre-Villanueva et al. (2023) on how similar approaches differ on similar tasks with heterogeneous input variables Therefore, applying the algorithm in KNN allows us to identify the following results in terms of Feature Importance Metrics (Figure 2).
The result obtained by running the permutation test on the K-Nearest Neighbors algorithm points to which variables actually play a deciding role within the regression to determine pallet saturation regarding volume. Taking into account the depth of the sales unit (VPA_PROF) actually sees a rise in error margin by approximately 388 RMSE points, which is the worst result on this list, asserting that a matters of a few centimeters on this side immediately assist in determining free space. The geometric volume (VOU) reaches an almost similar level on this list, proving that volume rather than height is what determines saturation, which is similar to what Volfatelli et al. (2024) indicated upon employing permutation entropy to identify unstructured information. PSU (Weight per piece) is actually next on this list, with some dense but bulky items, like ceramics, making weight and volume factors that hang closely together. Width and Height only impact slightly because most units actually remain short enough to stay within the 120-centimeters margin, meaning that after this point, there is not much difference. Second-order variables such as pallet weight, weight saturation, and pieces per pallet actually impact but slightly because there is already enough relevant information extracted about these variables via physical measurement. This actually asserts a confirmation upon what Wibowo et., 2025) indicated upon showing that being picky about which information is selected upon employing decision-making skills within ML actually helps within improving regression results. The takeaway message upon this is actually quite simple within this respect: to minimize those lurking void spaces on your shipping pallet, what is actually required is improving on packaging design on depth—preferably on making it more modifiable to depth according to product demands—precise measurement on these two aspects actually improves projected results significantly without having to actually exert extra effort within studying Weight and Quantity information—an affirmation to what actually justified employing ML on more hectic factors such, like what actually comprised within studying medical event prediction Roljbar et., 2023) machine-learning algos.
3. Interpretable Predictive Modeling Through KNN: From Baseline Estimates to Item-Level Insights
Predictive analysis follows diagnostic analysis. Once the variables and the models of interest have been identified, it becomes possible to generate predictions. In our simple illustrative case, the most effective model is KNN. Using this model, it is possible to produce a prediction as shown in Figure 3 below.
The KNN algorithm begins with an initial guess of 256.8% volume saturation on the pallet, which is what we would get by default if there were no information about the item and/or the pallet. This value is incremented and/or decremented by each variable according to its numerical value, thereby obtaining an explanation for the final result. An equivalent method, in which each variable deterministically affects each result, is to be found both in Qiu et al. (2022)’s KNN Classifier using attribute contribution and Banerjee et al. (2023)’s KNN nonparametric classifier and methodological structure to make it more interpretable and robust. The first scenario sees a decrease to 107%. This is due to having many units on the pallet, which weighs very little per item, both subtracting more than 270 points to base value, meaning that this item is compact and small, making up no space on height and/or surface area no matter how much is loaded on the pallet. The second scenario sees an increase to 300%. Both depth and item weight contribute more than 110 points to base value, meaning that this item takes up a wide surface area and presumably exceeds standard height, causing the whole pallet to greatly surpass volume capacity. This kind of behavior is typical when KNN is implemented on more complex environments, such is seen on natural gas transmission processes by Gunawan and Ihsan (2024) on which KNN presented acceptable results on predicting operating conditions on varied input sets. The fourth scenario sees a sharp decrease to 22%. The tiny depth and low item volume subtract more than 230 points to base value, meaning that this item is very shallow and presumably on being stacked on other items, empties completely, making up no volume on the whole pallet. The fifth scenario pegs to 198%. Here, while the weight of the pallet is a contributing factor to increasing estimates, other factors such as width, depth, and volume counterbalance this impact because the item is sufficient enough to occupy almost half a pallet's theoretical volume but not to such extreme points as within the second case. To summarize, decomposition facilitates understanding how each attribute, physical or load-related, forces estimates toward any particular item that can produce sub-filled pallets and vice versa. This interpretable nature of KNN is reflective of how Qiu et al. (2022) Banerjee et al. (2023) and Gunawan & Ihsan (2024) have each exemplified KNN's utility within optimized, interpretable applications across domains.
4. Managerial Implications of Data-Driven Warehouse Optimization
This interpretability is paramount within a practical logistics setting because logistics managers need to trust the underlying arguments upon which analytical recommendations are made (Ahmadi, 2023). The capability to relate SKU attributes to predicted pallet saturation helps to detect instances such as inefficient utilization of pallet space due to under-saturated units, resulting in unnecessary shipment costs, while on the other hand, these units could be overwhelmed, posing stacking hazards within warehousing infrastructure (Ramingwong et al., 2024; Raychowdhuri, 2025). One of the main implications that managers can derive is being capable of finding root causes within systematic predispositions to inefficient utilization during palletization and space allocation. Identifying SKU groups predisposed to low saturation, extreme protrusion, and unsafe configurations can enable logistics managers to optimize rules governing palletization, enhance slot allocation algorithms, and plan warehousing layout modifications accordingly (Tufano et al., 2022). The above is particularly crucial because operating variability is invariably identified within warehousing operations as being responsible for delays, problematic handling, and reduced productivity (Boonma, 2025). The method is also capable of facilitating capacity planning by predicting storage demands according to projected saturation values to identify periods during which there is heightened handling complexity (Samineni et al., 2025). This is particularly important because it can lead to strategic workers allocation, designing timely work shifts, and making informed decisions about supplemental warehousing capacity allocation, including short-term warehousing investments (Muehlbauer et al., 2024). The methodological implications can also be linked to optimized transport services because understanding SKU behavior to volume saturation can lead to more informed transport allocation, reduced logistics costs (Shawon et al., 2025; Shamsuddoha et al., 2025). Apart from methodological implications, there are other aspects about this methodological work that this paper accepts. These aspects involve recognizing that these methodological approaches can depend on quality input within available warehousing repository information. As within most warehousing applications, this information demands considerable preprocessing and standardization (Ahmadi, 2023). The second aspect involves acknowledging that machine-learning methodological approach functionality could tend to fluctuate according to periodically introduced product mixes within varying warehousing dynamics (Tufano et al., 2022). The third issue is validating these methodological approaches within multiple warehousing settings to assess overall generic applications (Ramingwong et al., 2024). However, this project is a great example of how machine learning can successfully operate within an industrial setting to identify hidden relationships that other rule-based solutions fail to detect (Raychowdhuri, 2025; Samineni et al., 2025). The fact that this project comes out of a actual R&D project, which is supported by regional funding, is what gives it such strong practicality and can actually be a role-model project for future innovations within logistics (Shawon et al., 2025). Finally, this project illustrates how a data-driven ethos is a crucial aspect to build within an organization (Chen & Liao, 2023). Highly complex algorithms and technology only work if they can actually incorporate know-how knowledge about warehousing and are accepted on a technological level by management themselves (Shamsuddoha et al., 2025). This project is capable of uncovering actionable results to aid other organizations within knowledge-sharing realms and perpetually work within a mindset to evolve on a continuous basis (Muehlbauer et al., 2024). This project, therefore, is both a technological prowess but also an evolutionary shift on an organizational level. Finally, this actual research project exemplifies how data science can actually make a difference on a technical level within warehousing realms to increase clarity and optimize on correct assumptions on an organizational level to enhance warehousing proficiency on an industrial level (Tufano et al., 2022; Samineni et al., 2025). This project is setting up future success on many technology fronts concerning actual, live decisioning systems, digital twins, and other more sophisticated algorithms to actually optimize logistics on a much more precise level (Raychowdhuri, 2025). See Figure 4.
5. Conclusions
This project shows how analytics-driven approaches can greatly improve operating efficiency and decision-making processes with respect to warehousing and logistics management. The conjunction of analytical diagnoses, patterns obtained by prediction, and machine learning methods into a processing and analysis of actual operating information concerning La Logistica S.r.l. shows how modern data science can provide notable operative benefits within domains know to display strong variability, coupling between physical variables, and strong demands on efficiency. Firstly, much insight is derived by diagnosing K-Nearest Neighbors approaches to item saturation estimation with respect to HGL’s dataset on SKU attributes, volume saturation maps, investor type, item-specific physical variables, to show how considerable item variability is included within theoretically simple logistics processes—variances which, if left to themselves, easily lead to operating inefficiencies about unsaturated units, overloaded units that actually surpass theoretical capacity, systematic misallocations about warehousing space utilization. The systematic investigation about these attributes, complemented by machine learning algorithms, uncovers trends which could not otherwise surface employing mere human expertise. From this perspective, data science doesn’t cover human knowledge but rather complements it on grounds that pertain to quantitative validation about more precise operative decisions. On other respects, particularly about saturation estimation calculated by K-Nearest Neighbors approaches to item saturation estimation, there is a strong indication on how very simple algorithms can lead to extremely interpretable estimation maps. The capability on K-Nearest Neighbors to break down saturation into contributions about each item attribute provides warehousing managers with immediate information about which items to refactor concerning worse-than-expected resistance to item saturation estimation. Incrementally, there is evident capability on these approaches to successfully track operative dynamics on warehousing processes with considerable more celerity than human estimation could take into account, predicting counterintuitive troubles on item warehousing processes. Finally, on operative respects concerning warehousing processes, the above-mentioned machine-learning method illustrates how specific approaches to warehousing forecasting on item variables can better operative experiences on warehousing processes on grounds concerning item variables—weight, volume, geometric, item-specific degree on item warehousing processes. This method has shown to offer a great addition to human decision-making, having introduced both objectivity and repeatability into such a notoriously human-centric domain. As regards managerial implications, this work argues that there is a need to shift the whole logistics culture toward more data-driven decision-making. Finally, this work shows how analytics and other similar technologies can achieve tremendous value within smaller, more resource-constrained organizations such as those classified within this study’s scope, having helped decrease waste, increase pallet usage, increase flows, and last but not least, having assisted these organizations to make informed rather than intuitive decisions during planning processes. Finally, in such domain applications, having very limited profit margins and extremely stiff competition, such optimizations can directly result into significantly better services and immediate profitability gains. Finally, this work asserts how a continued emphasis on collecting such valuable information and integrating this information into digital streams is crucial to being on the forefront of such analytics technology, which relies on such information to evolve into more advanced technologies such as Deep-Learning and other similar notions. As such storage domains continue to grow progressively more automated and constituted by increased numbers of sensors, such an information sensitivity will continue to represent what provides each such business with a competitive advantage. To summarize, this work argues how analytics technology provides tremendous opportunities to optimize such warehousing domains. Finally, this work asserts how attempts to optimize such warehousing domains nowadays represent more than mere technology but rather an information paradigm shift into how such organizations constructively perceive such warehousing domains themselves.
Acknowledgments
The proposed work has been developed within the framework of the project “Logistics 4.0” (Regional call of Apulia for aid under exemption No. 17 of 30/09/2014 – BURP No. 139 supplement of 06/10/2014 and subsequent amendments – TITLE II, CHAPTER 2 OF THE GENERAL REGULATION, “Notice for the submission of projects promoted by Large Enterprises pursuant to Article 17 of the Regulation”).
Declarations
The authors declare no competing interests.
References
- Ahmadi, S. Optimizing data warehousing performance through machine learning algorithms in the cloud. International Journal of Science and Research 2023, 12, 1859–1867. [Google Scholar] [CrossRef]
- Aylak, B.L. , İnce, M., Oral, O., Süer, G., Almasarwah, N., Singh, M., & Salah, B. Application of machine learning methods for pallet loading problem. Applied Sciences 2021, 11, 8304. [Google Scholar]
- Banerjee, A. , Hazard, C.J., Beel, J., Mack, C., Xia, J., Resnick, M., & Goddin, W. Surprisal Driven $ k $-NN for Robust and Interpretable Nonparametric Learning. arXiv 2023, arXiv:2311.10246. [Google Scholar]
- Boonma, C. (2025, May). Logistics Data Analytics and Delay Prediction. In The 15th Benjamit National and International Conference (pp. 72–78).
- Chen, Z. , & Liao, Z. Impact of data technology on logistics industry business performance. Highlights in Business, Economics and Management 2023, 16, 16–282. [Google Scholar]
- Daios, A. , Kladovasilakis, N., & Kostavelis, I. Mixed palletizing for smart warehouse environments: sustainability review of existing methods. Sustainability 2024, 16, 1278. [Google Scholar]
- Gunawan, A.B.M. , & Ihsan, A.F. (2024, July). Implementation of the K-Nearest Neighbor Algorithm for Forecasting the Operational Conditions of Natural Gas Pipeline Transmission Networks. In 2024 International Conference on Data Science and Its Applications (ICoDSA) (pp. 439–444). IEEE.
- HAYTA, E. , GENCTURK, B., ERGEN, C., & KÖKLÜ, M. Predicting future demand analysis in the logistics sector using machine learning methods. Intelligent Methods In Engineering Sciences 2023, 2, 102–114. [Google Scholar]
- Hosseini, M. , Madathil, S.C., & Khasawneh, M.T. Deep Learning Techniques for Manufacturing-Warehouse Optimization: A Critical Literature Review. Available at SSRN 4960940.
- Iparraguirre-Villanueva, O. , Torres-Ceclén, C., Epifanía-Huerta, A., Castro-Leon, G., Melgarejo-Graciano, M., Zapata-Paulini, J., & Cabanillas-Carbonell, M. Comparison of predictive machine learning models to predict the level of adaptability of students in online education. International Journal of Advanced Computer Science and Applications 2023, 14. [Google Scholar]
- Muehlbauer, K. , Schnabel, S., & Meissner, S. Data-Driven Process Analysis of Logistics Systems: Implementation Process of a Knowledge-Based Approach.
- Mulla, F.M. (2022). Leveraging Data Analytics for Advanced Optimization in Warehouse Management Systems.
- Ojadi, J.O. , Odionu, C., Onukwulu, E., & Owulade, O. Big data analytics and AI for optimizing supply chain sustainability and reducing greenhouse gas emissions in logistics and transportation. International Journal of Multidisciplinary Research and Growth Evaluation 2024, 5, 1536–1548. [Google Scholar]
- Palaniappan, R. Comparative analysis of support vector machine, random forest and k-nearest neighbor classifiers for predicting remaining usage life of roller bearings. Informatica 2024, 48. [Google Scholar] [CrossRef]
- Qiu, Q. , Shen, S., Guan, S., Li, M., & Deng, S. (2022, December). An Attribute Contribution-Based K-Nearest Neighbor Classifier. In 2022 6th Asian Conference on Artificial Intelligence Technology (ACAIT) (pp. 1–6). IEEE.
- Ramingwong, S. , Sopadang, A., Tippayawong, K.Y., & Jintana, J. Factory Logistics Improvement: A Case Study Analysis of Companies in Northern Thailand, 2022–2024. Logistics 2024, 8, 88. [Google Scholar]
- Raychowdhuri, D. The Transformative Impact of AI on Supply Chain, Operations Planning, Logistics, and Retail: Technical Implementations and Outcomes. IJSAT-International Journal on Science and Technology 2025, 16. [Google Scholar]
- Rimal, Y. , Sharma, N., Paudel, S., Alsadoon, A., Koirala, M.P., & Gill, S. Comparative analysis of heart disease prediction using logistic regression, SVM, KNN, and random forest with cross-validation for improved accuracy. Scientific Reports 2025, 15, 13444. [Google Scholar]
- Samineni, L. , Ogoti, S.S., Zahraee, A., & Mapa, L. Leveraging Predictive Analytics and AI Techniques to Enhance the Efficiency in Supply Chain Management: A Case Study to Optimize Supply Chain Characteristics. Journal of Decision Science and Optimization 2025, 1, 55–66. [Google Scholar]
- Shamsuddoha, M. , Khan, E.A., Chowdhury, M.M.H., & Nasir, T. Revolutionizing supply chains: unleashing the power of AI-driven intelligent automation and real-time information flow. Information 2025, 16, 26. [Google Scholar]
- Shawon, R.E.R. , Hasan, M.D., Rahman, M.A., Ghandri, M., Lamari, I.A., Kawsar, M., & Akter, R. Designing and Deploying AI Models for Sustainable Logistics Optimization: A Case Study on Eco-Efficient Supply Chains in the USA. arXiv 2025, arXiv:2503.14556. [Google Scholar]
- Sodiya, E.O. , Umoga, U.J., Amoo, O.O., & Atadoga, A. AI-driven warehouse automation: A comprehensive review of systems. GSC Advanced Research and Reviews 2024, 18, 272–282. [Google Scholar]
- Tufano, A. , Accorsi, R., & Manzini, R. A machine learning approach for predictive warehouse design. The International Journal of Advanced Manufacturing Technology 2022, 119, 2369–2392. [Google Scholar]
- Vu, V.D. , Hoang, D.D., Tan, P.X., Nguyen, V.T., Nguyen, T.U., Hoang, N.A.,... & Hoang, D.C. Occlusion-robust pallet pose estimation for warehouse automation. IEEE Access 2024, 12, 1927–1942. [Google Scholar]
Figure 1.
Comparison of normalized machine learning algorithms.
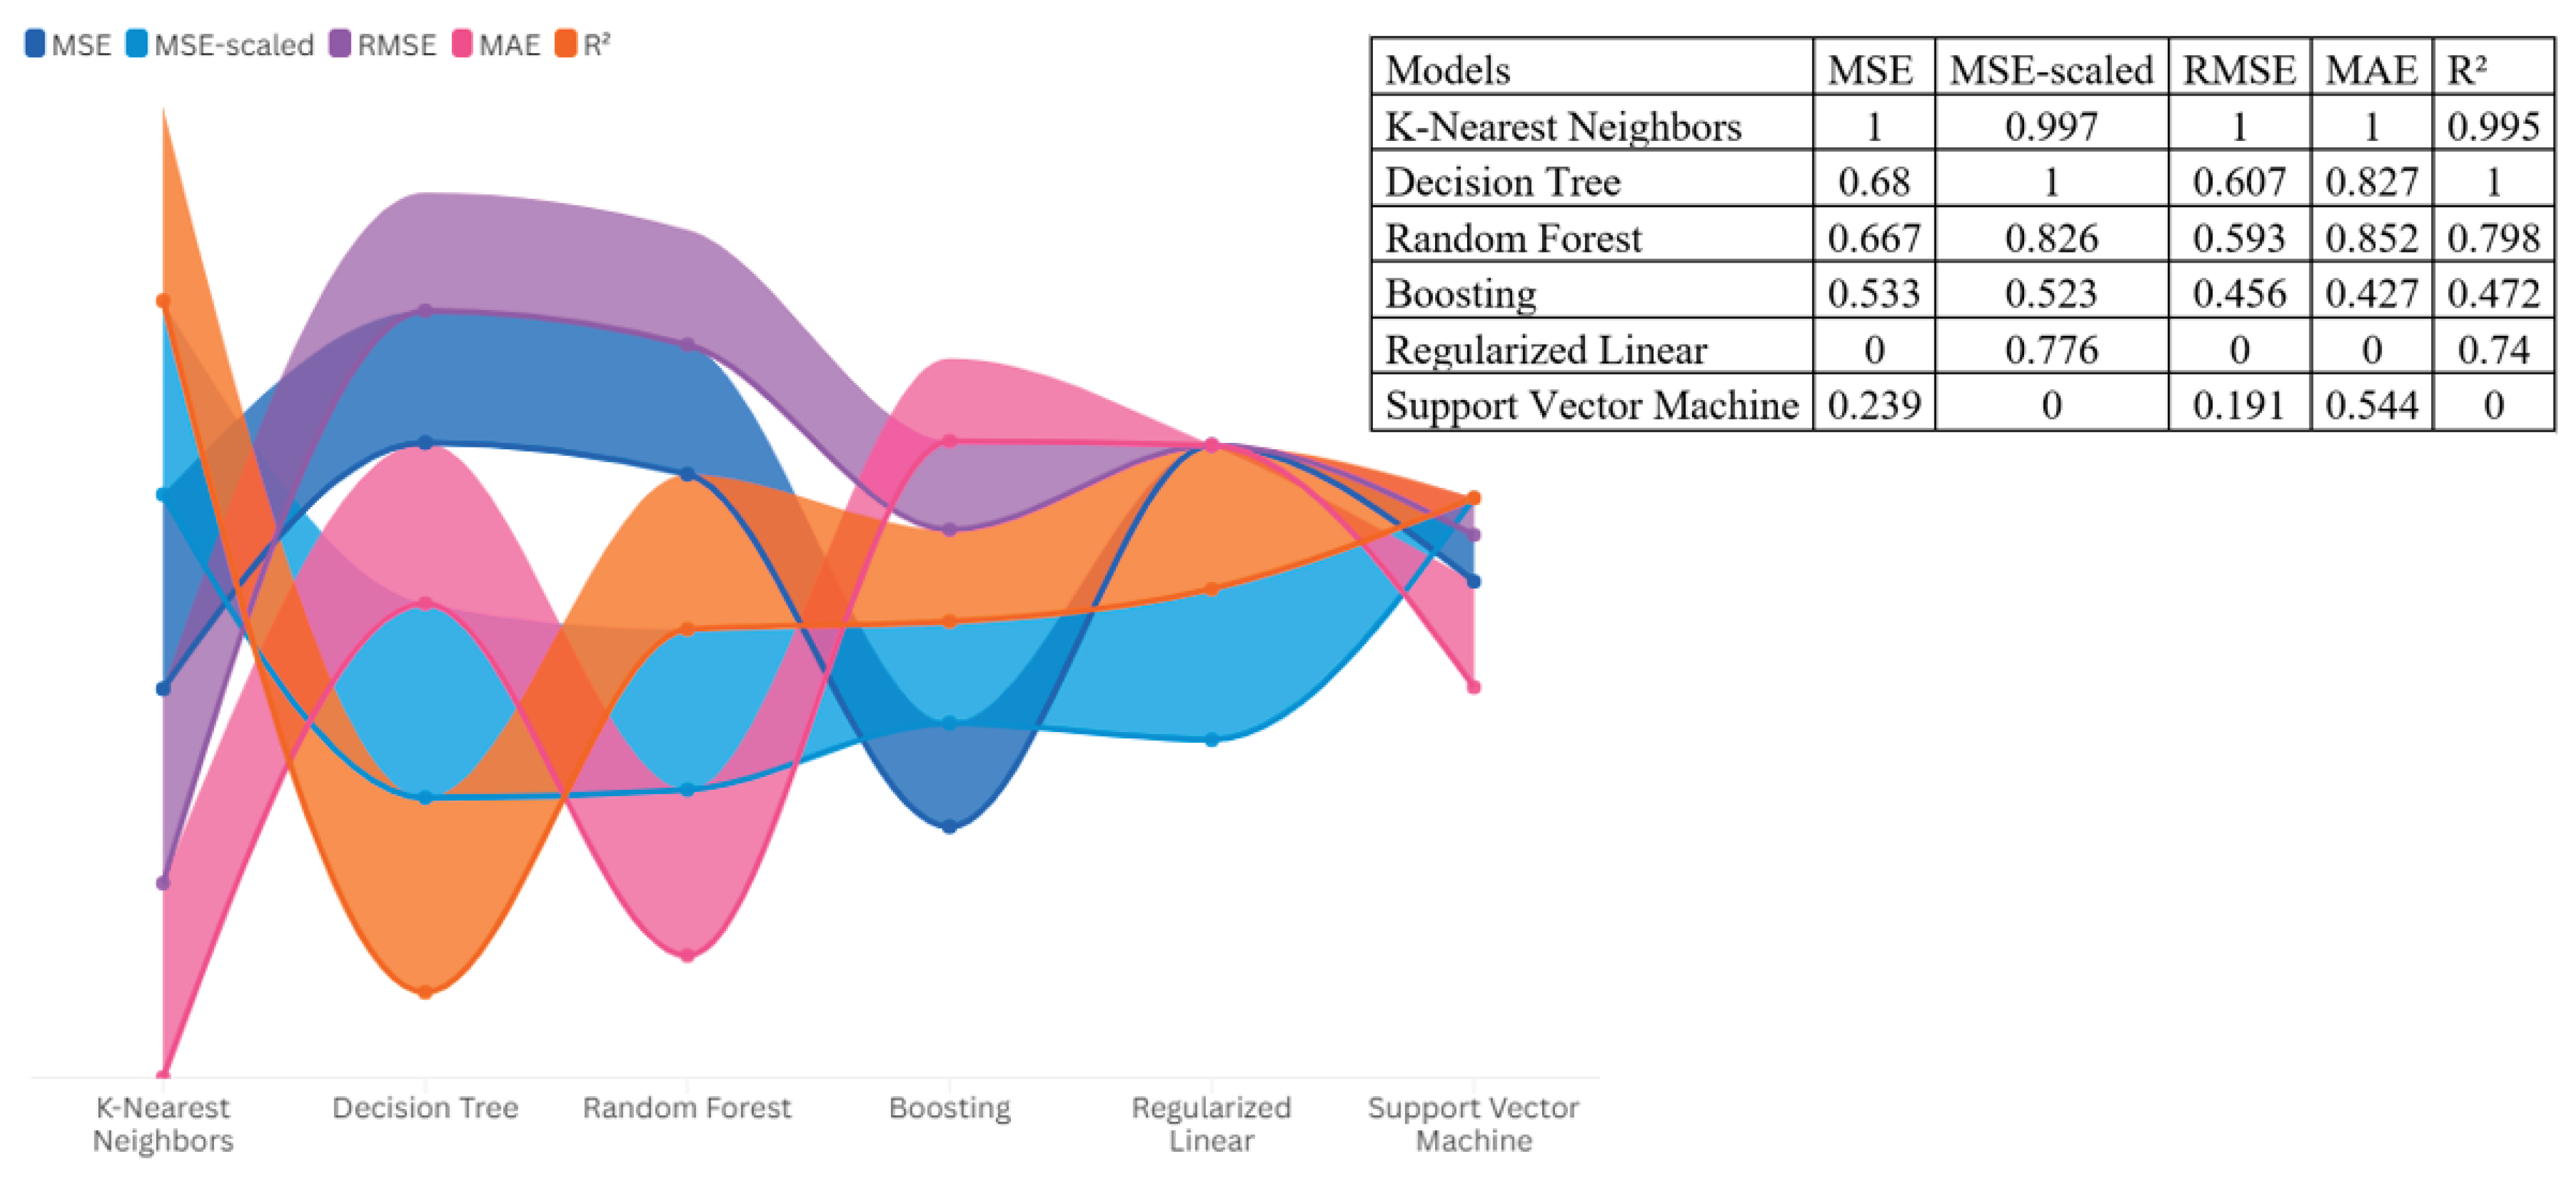
Figure 2.
Feature Importance Metrics.
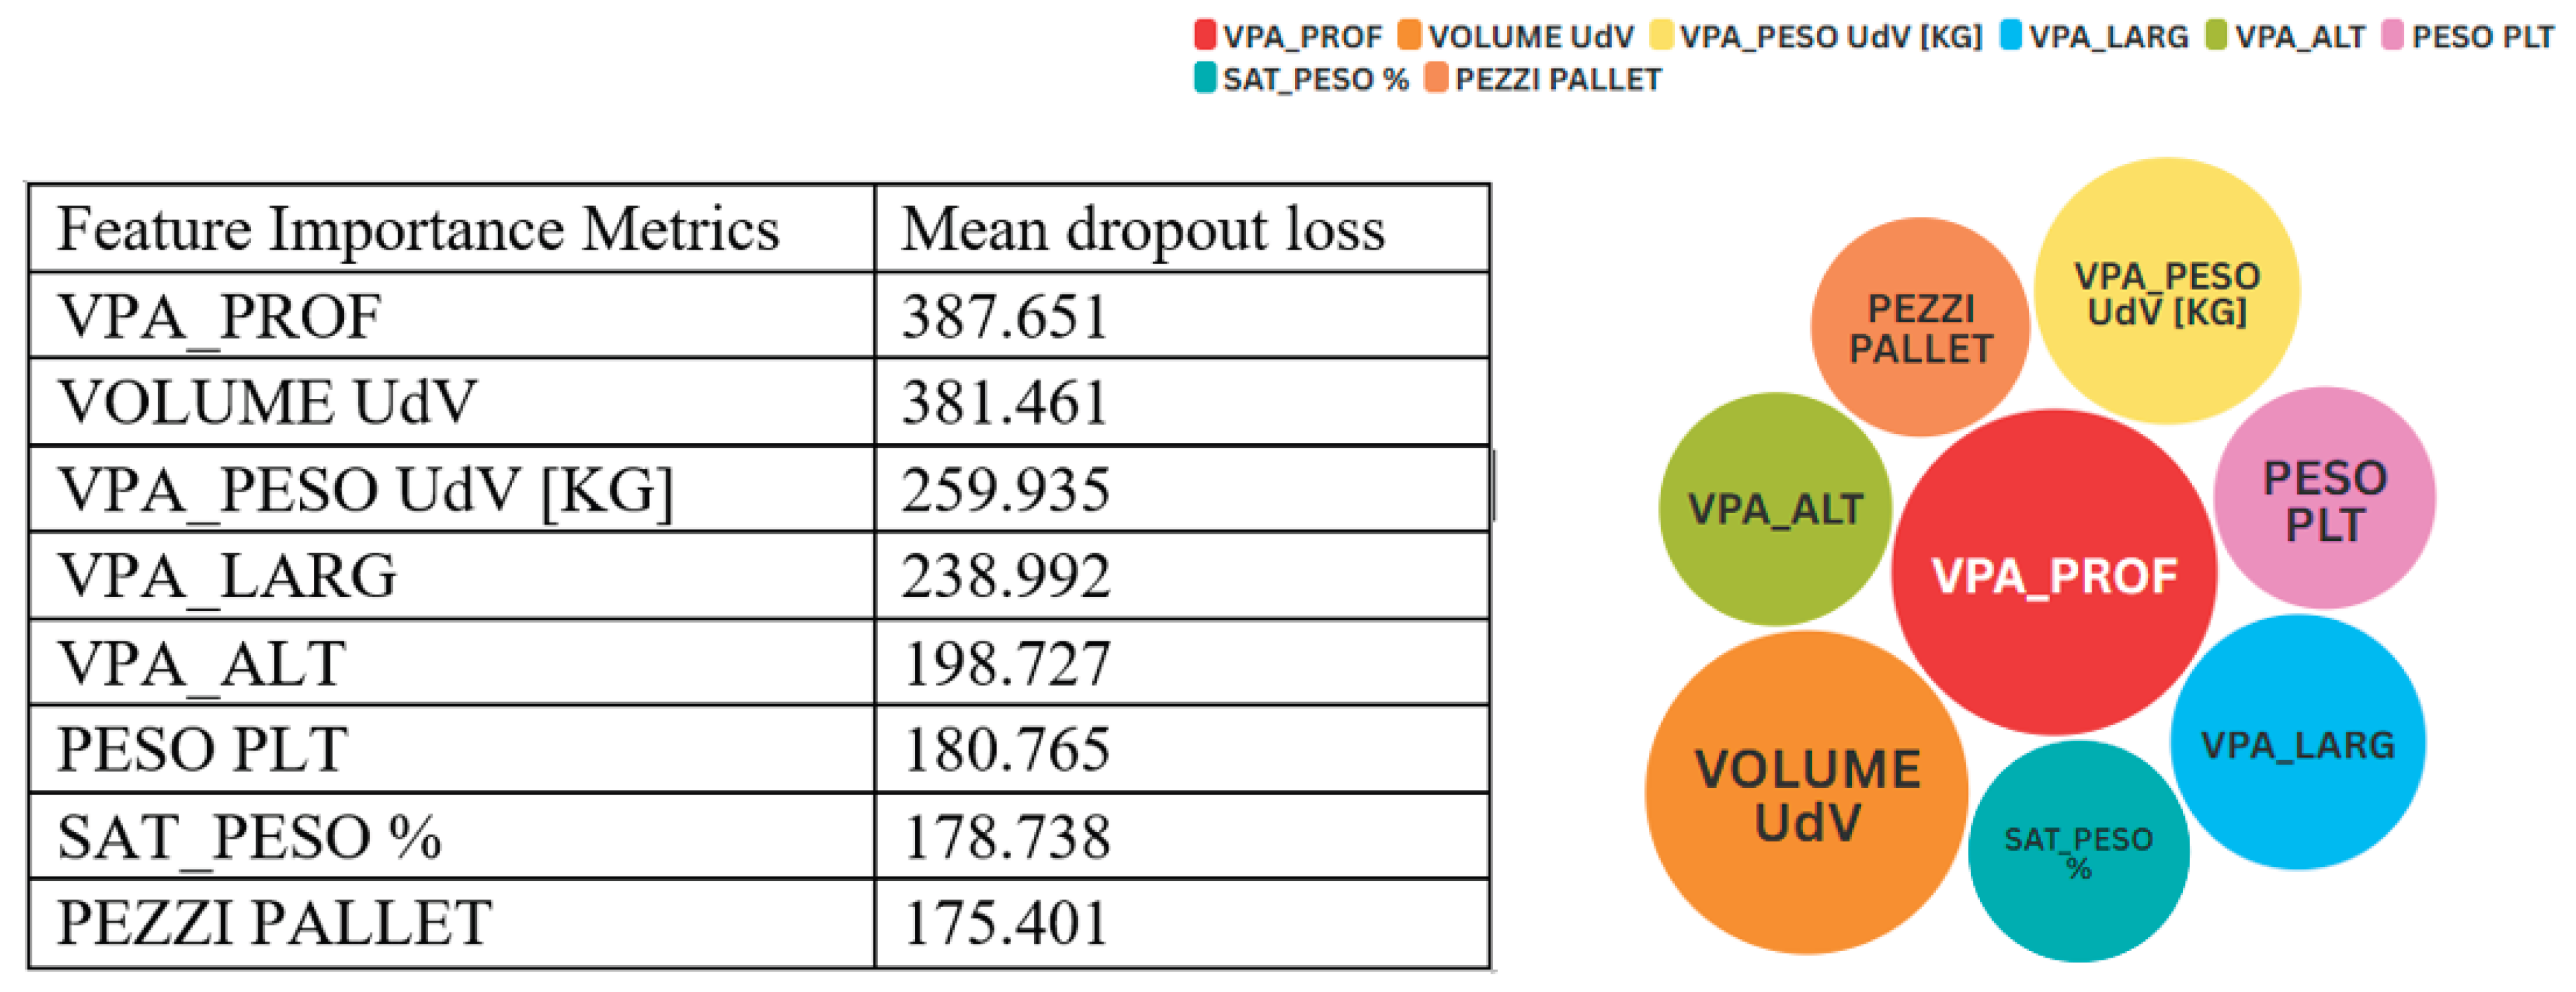
Figure 3.
KNN prediction results.
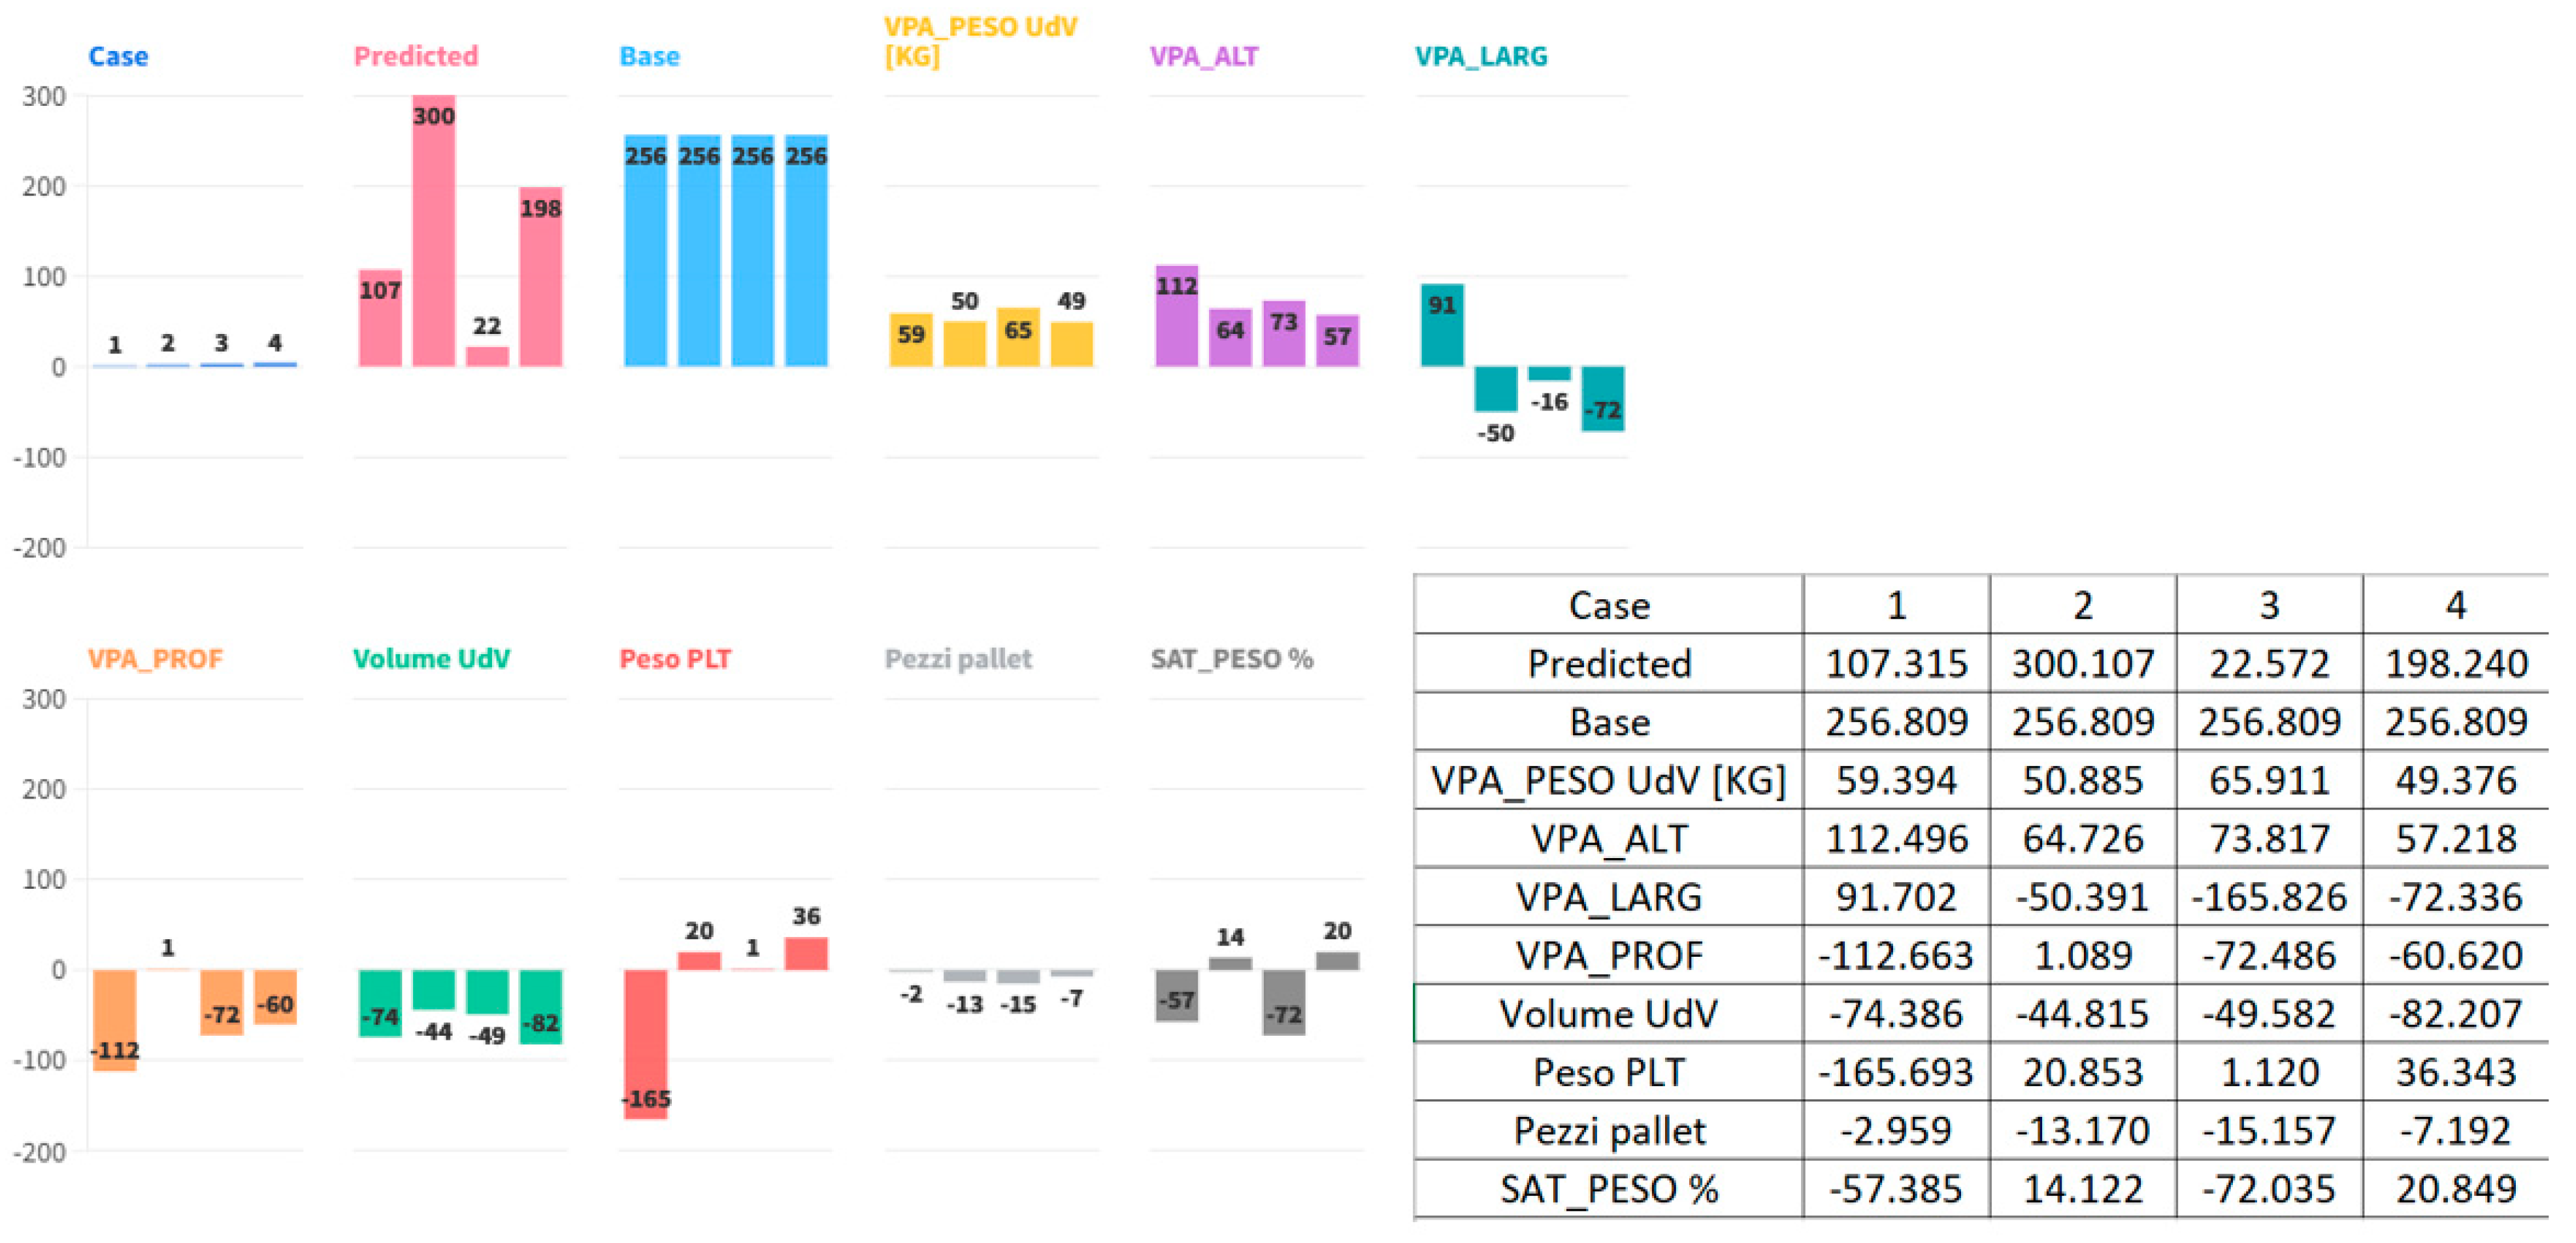
Figure 4.
Integrated Data-Driven Framework for Warehouse Optimization.
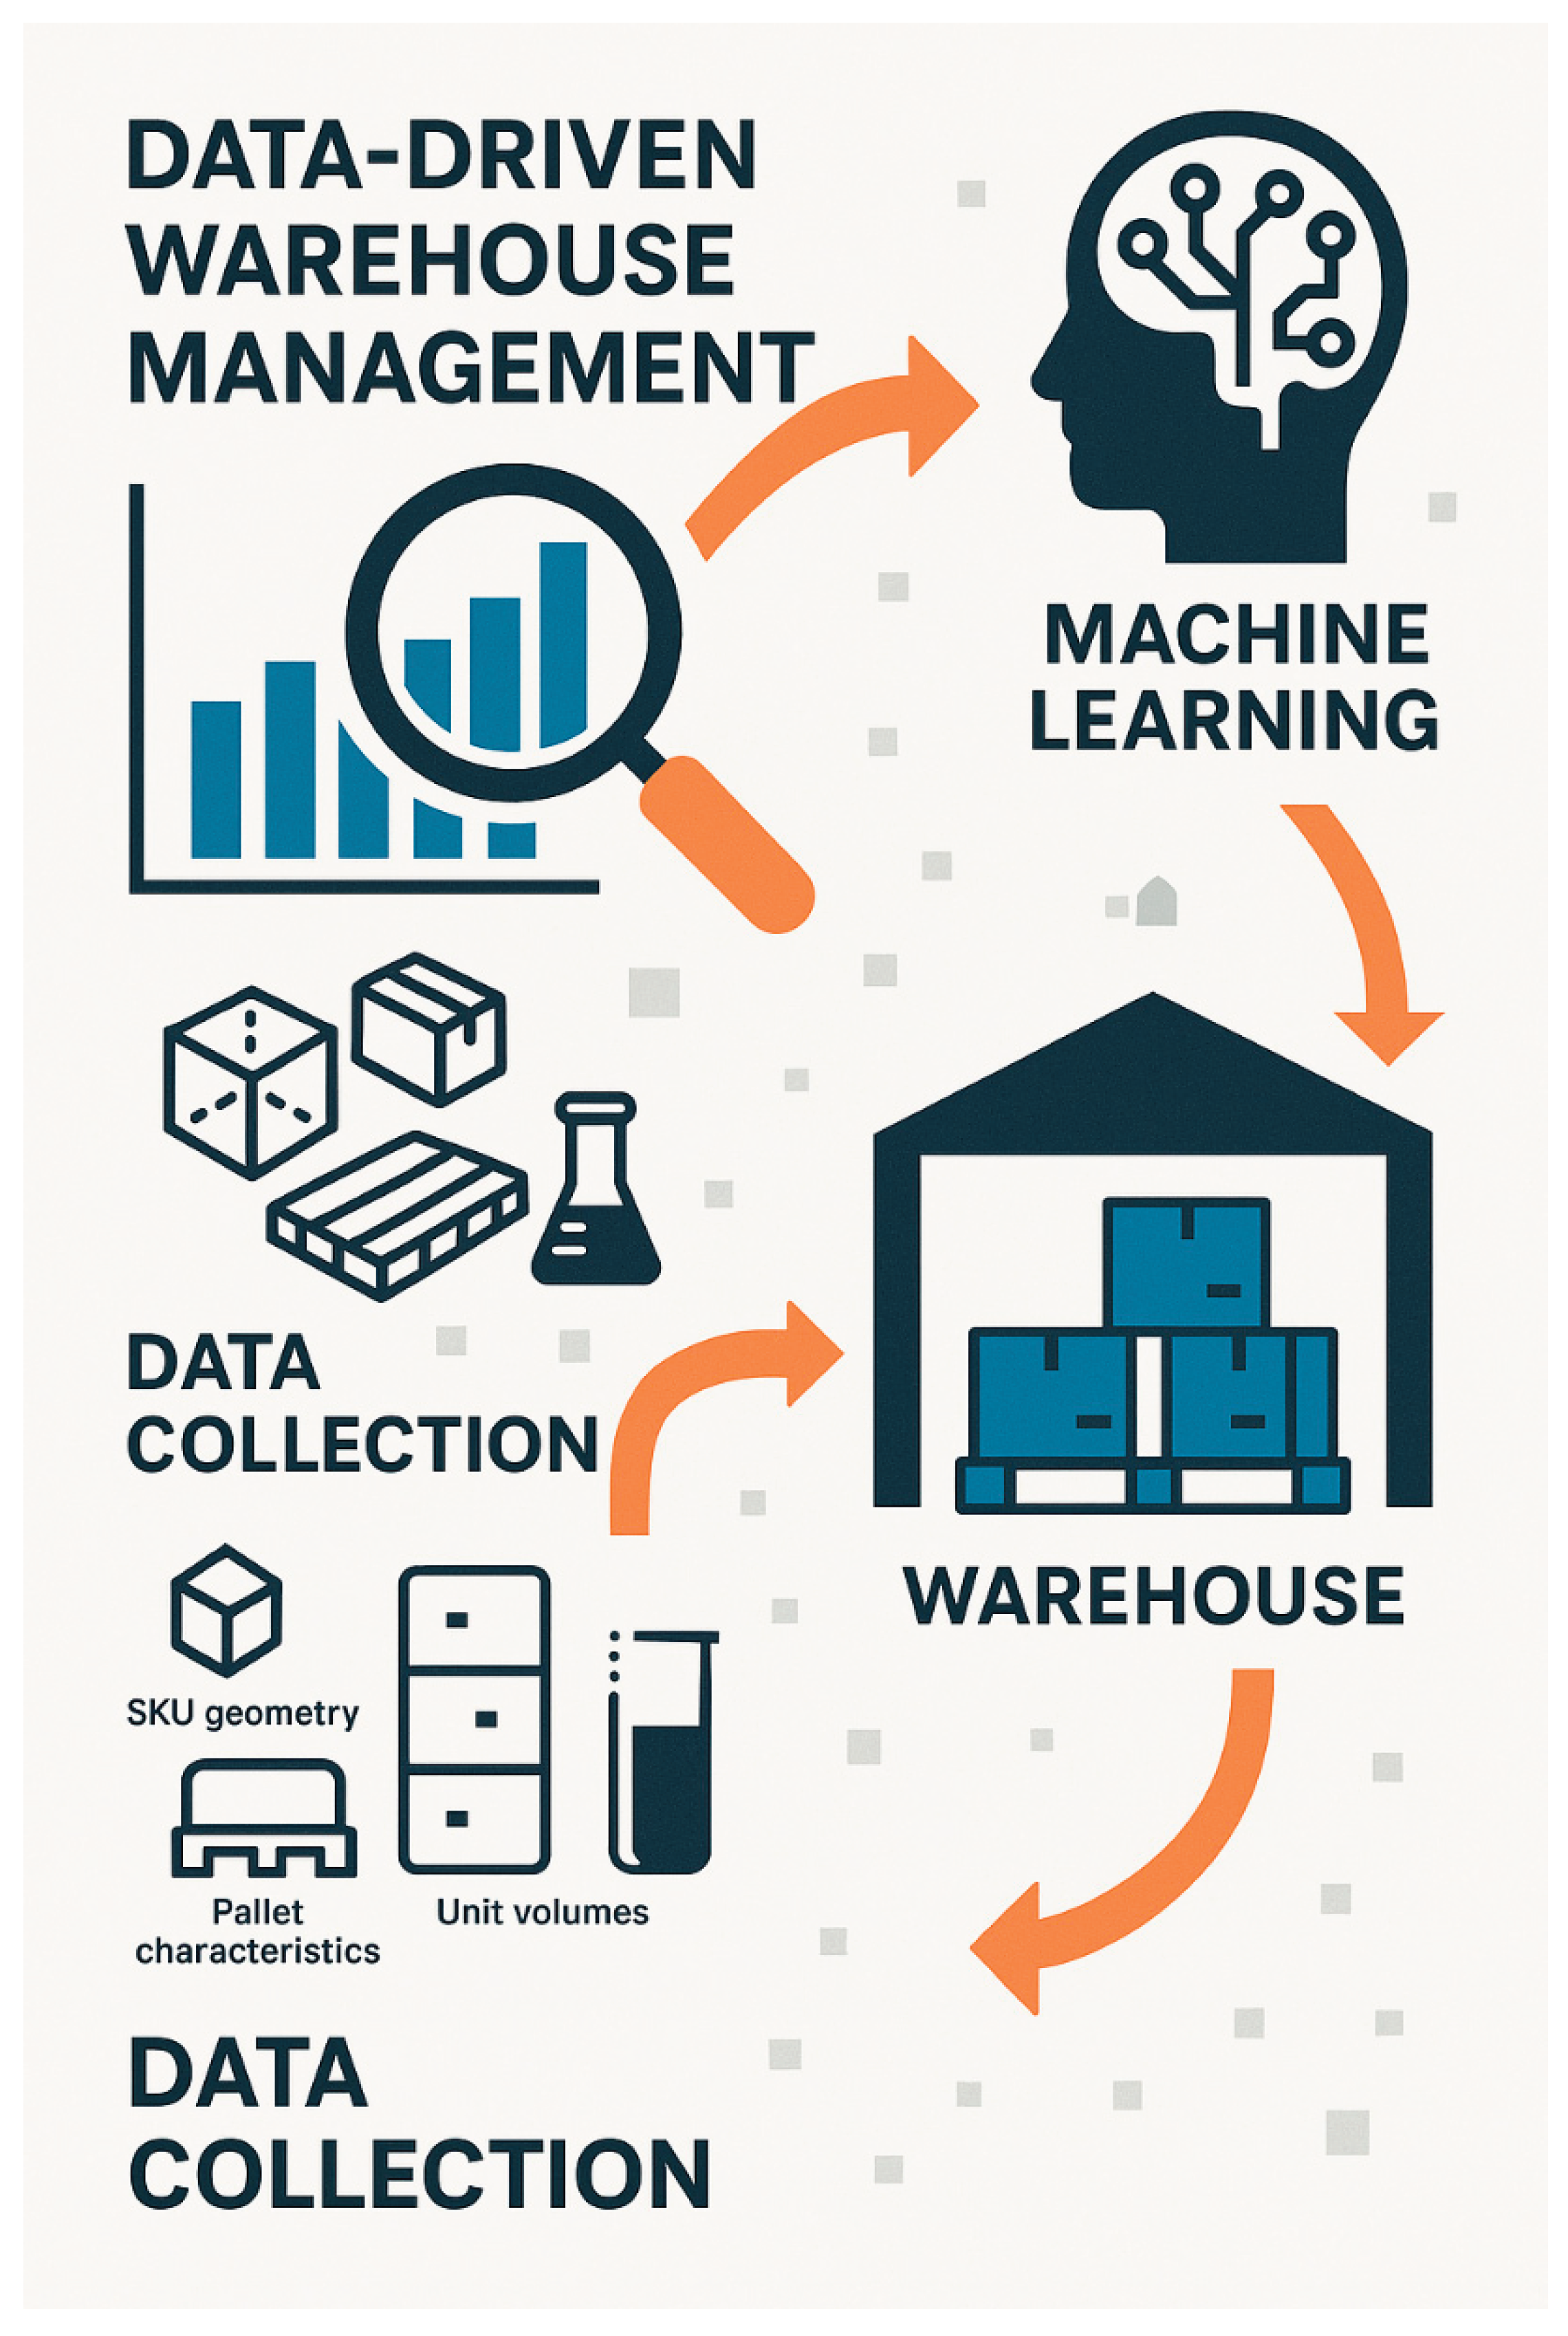

Table 1.
Machine Learning Results.
| Boosting | Decision Tree | K-Nearest Neighbors | Random Forest | Regularized Linear | Support Vector Machine | |
| MSE | 89.847 | 74.308 | 40.682 | 75.698 | 145.868 | 120.780 |
| MSE(scaled) | 0.522 | 0.243 | 0.245 | 0.345 | 0.374 | 0.828 |
| RMSE | 299.746 | 272.596 | 201.698 | 275.135 | 381.927 | 347.534 |
| MAE / MAD | 133.206 | 94.821 | 78.194 | 92.44 | 174.13 | 121.913 |
| R² | 0.544 | 0.771 | 0.769 | 0.684 | 0.659 | 0.341 |
Disclaimer/Publisher’s Note: The statements, opinions and data contained in all publications are solely those of the individual author(s) and contributor(s) and not of MDPI and/or the editor(s). MDPI and/or the editor(s) disclaim responsibility for any injury to people or property resulting from any ideas, methods, instructions or products referred to in the content. |
© 2025 by the authors. Licensee MDPI, Basel, Switzerland. This article is an open access article distributed under the terms and conditions of the Creative Commons Attribution (CC BY) license (http://creativecommons.org/licenses/by/4.0/).
Copyright: This open access article is published under a Creative Commons CC BY 4.0 license, which permit the free download, distribution, and reuse, provided that the author and preprint are cited in any reuse.


