Submitted:
18 November 2025
Posted:
18 November 2025
You are already at the latest version
Abstract
Wearable devices need fast and reliable fault reporting across different systems and networks. We built a cross-platform reporting system with a unified event format, compact encoding, on-device redaction, store-and-forward buffers, and priority queues. We tested it on 60,412 devices over 180 days across Wear OS, watchOS, and an RTOS, and in 1,200 lab sessions with controlled faults. Reports were sent over Wi-Fi, LTE, and BLE, including poor links. Median time-to-report fell from 74 s to 41 s (−44.6%). p95 and p99 fell to 97 s and 226 s. The share of reports delivered within 60 s rose from 0.61 to 0.83. Loss dropped from 1.9% to 0.6% per device, and duplication from 0.7% to 0.2%. Using a single event format reduced incident clusters by 35–39% and cut median time-to-detect by 28%. On an instrumented subset (n = 96), energy per delivered report fell by 23%, with 31% less CPU time for encoding and 29% less DRAM traffic. These results show that a common event format and a small on-device reporter can improve speed and reliability while lowering overhead on different wearable platforms. Limits include no large-scale tests on low-duty-cycle wide-area radios and no long rural outages. Future work will add NB-IoT/eDRX tests, longer field runs, and combined tests with secure boot and attestation.
Keywords:
wearable devices
; fault reporting
; time to report
; unified event format
; MQTT
; crossplatform
; energy efficiency
1. Introduction
Wearable devices have moved from niche tools to common health and activity platforms. They run continuous sensing and interactive apps on small batteries and different operating systems. At scale, silent faults and rare crashes can harm user trust and safety [1]. Fault reporting is therefore essential. It must work across vendors and handle weak networks, tight energy budgets, and privacy rules [2]. Recent studies cover parts of this need. Mobile analytics and crash logging improved symbol capture, stack collection, and app triage on phones [3]. IoT telemetry added light protocols, store-and-forward buffers, and rate control for intermittent links [4]. On-device anomaly detection reduces data volume and flags sensor faults near the source [5]. Privacy-preserving upload and local redaction support compliance in health and fitness settings [6]. Work on open tracing and common schemas moves systems toward shared event formats [7]. For wearables, previous research presented one of the first cross-platform solutions capable of supporting millions of terminals while maintaining stability and efficiency [8]. Important gaps remain. Many papers target one platform or one vendor stack. Cross-OS support for Wear OS, watchOS, RTOS, and custom firmware is still rare [9]. Event schemas often differ across products, which blocks correlation and slows response [10]. Several studies rely on small lab traces instead of long field logs, so tail delay and burst faults are under-measured [11]. End-to-end metrics such as p95/p99 time-to-report, loss rate, and mean time to detect (MTTD) under load are often missing [12]. Energy and thermal costs of always-on reporting are also seldom measured together with delivery success [13]. Finally, security is often treated apart from telemetry; designs that join trusted runtime with safe reporting remain limited [14]. This paper addresses these gaps with a cross-platform fault reporting system for wearables at million-device scale. The design has three parts. First, a unified event model defines faults across app, OS, radio, and sensor layers with a compact schema and versioning [15]. Second, a lightweight on-device reporter manages memory use, applies adaptive sampling, and performs local redaction to protect user data [16]. Third, an edge–cloud path uses store-and-forward, backoff, and priority queues over MQTT/HTTPS to keep delivery working on weak networks [17].
We evaluate the system on heterogeneous devices and operating systems using fault injection and field traffic. We report p50/p95/p99 time-to-report, loss and duplication rates, and energy per delivered report. We compare with platform-specific loggers and other baselines. Our goals are to show stable operation under burst load, to quantify energy and thermal cost, to demonstrate schema portability across platforms, and to document privacy and security controls needed for health-grade deployments.
2. Materials and Methods
2.1. Study Area and Sample Description
We analyzed fault logs and field data from 60,412 wearables over 180 days on three systems: Wear OS, watchOS, and an RTOS used in fitness bands. The fleet covered 8 hardware models deployed in North America, Europe, and East Asia. We also ran 1,200 lab sessions with controlled fault injection. Lab tests were done in a chamber at 22 ± 2 °C and 40–55% relative humidity. Networks included Wi-Fi (2.4/5 GHz), LTE, and BLE; link quality was set with attenuators from −30 to −85 dBm. We targeted four fault classes: app (crash, ANR), OS (watchdog reset), radio (drop, queue overflow), and sensor (stuck values, time drift). Devices buffered events locally and uploaded when the link was available.
2.2. Experimental Design and Control Setup
We used an A/B design with blocking at the device level. The baseline was the native vendor logger. The cross-platform setup added a unified event schema, compact encoding, local redaction, store-and-forward, and priority queues. Each device alternated the two setups in 48-hour epochs; the order was randomized within hardware and region blocks. In the lab, fault type and link setting followed a balanced schedule; each condition was repeated 10 times per model. This design supports within-device comparison and limits bias from region, hardware, and time of day. For energy tests, 96 devices (32 per OS) were instrumented with an inline USB power monitor (watches) or a battery tap (bands).
2.3. Measurement Procedure and Quality Control
On device, events were time-stamped with a monotonic clock and signed with a per-device key. Reports were sent to gateways over MQTT or HTTPS with TLS 1.2+. Servers used NTP/PTP; target clock skew was < 1 ms. Time-to-report (TTR) was defined as the time from the event stamp to server receipt. Loss and duplication were computed from fingerprints (device ID, monotonic time, counter, hash). Energy per delivered report was measured during scripted fault bursts. Quality checks were: (i) drop records with clock skew > 2 s vs server time; (ii) deduplicate identical fingerprints; (iii) exclude sessions with gateway packet loss > 1%; (iv) verify schema version and signature. Instruments were calibrated weekly and zeroed before each session. Data handling used on-device masking for user identifiers.
2.4. Data Processing and Model Equations
For each setup we computed medians, p95, and p99 of TTR, plus per-device loss rate and duplication rate. Energy per report equaled total burst energy divided by the number of unique reports delivered. Two metrics and one model were applied.
(1) On-time reporting rate at threshold τ

where Ti is the TTR of event i and N is the number of events. We report OTR30s , OTR60s , and OTR300s .
(2) Logistic model for success within 60 s
log
 RSSIi+β2 Batteryi+β3 OSi+β4 Modeli+β5 QueueDepthi
RSSIi+β2 Batteryi+β3 OSi+β4 Modeli+β5 QueueDepthi
where pi= Pr ( Ti≤60 s) . Predictors were received signal strength (RSSI), battery level, OS and hardware indicators, and local queue depth at send time. Coefficients were estimated by maximum likelihood with cluster-robust standard errors at the device level. Model checks used ROC curves, calibration plots, and bootstrap confidence intervals (1,000 resamples).
These procedures provide a clear and repeatable way to compare delay, loss, duplication, and energy across platforms, devices, and network conditions.
3. Results and Discussion
3.1. End-to-End Latency, Loss, and Tail Behavior
Across 60,412 devices over 180 days, the cross-platform reporter reduced median time-to-report (TTR) from 74 s to 41 s (−44.6%). The p95 and p99 TTR fell from 212 s to 97 s and from 531 s to 226 s, respectively. The on-time reporting rate within 60 s rose from 0.61 to 0.83. Loss per device dropped from 1.9% to 0.6%, and duplication fell from 0.7% to 0.2%. These gains came from a compact event schema, bounded queues, and store-and-forward under weak links. The shape of the latency distribution matches results reported for real-time MQTT paths in which architectural controls cut average and worst-case delays roughly in half, supporting our use of priority channels for time-sensitive reports [18].
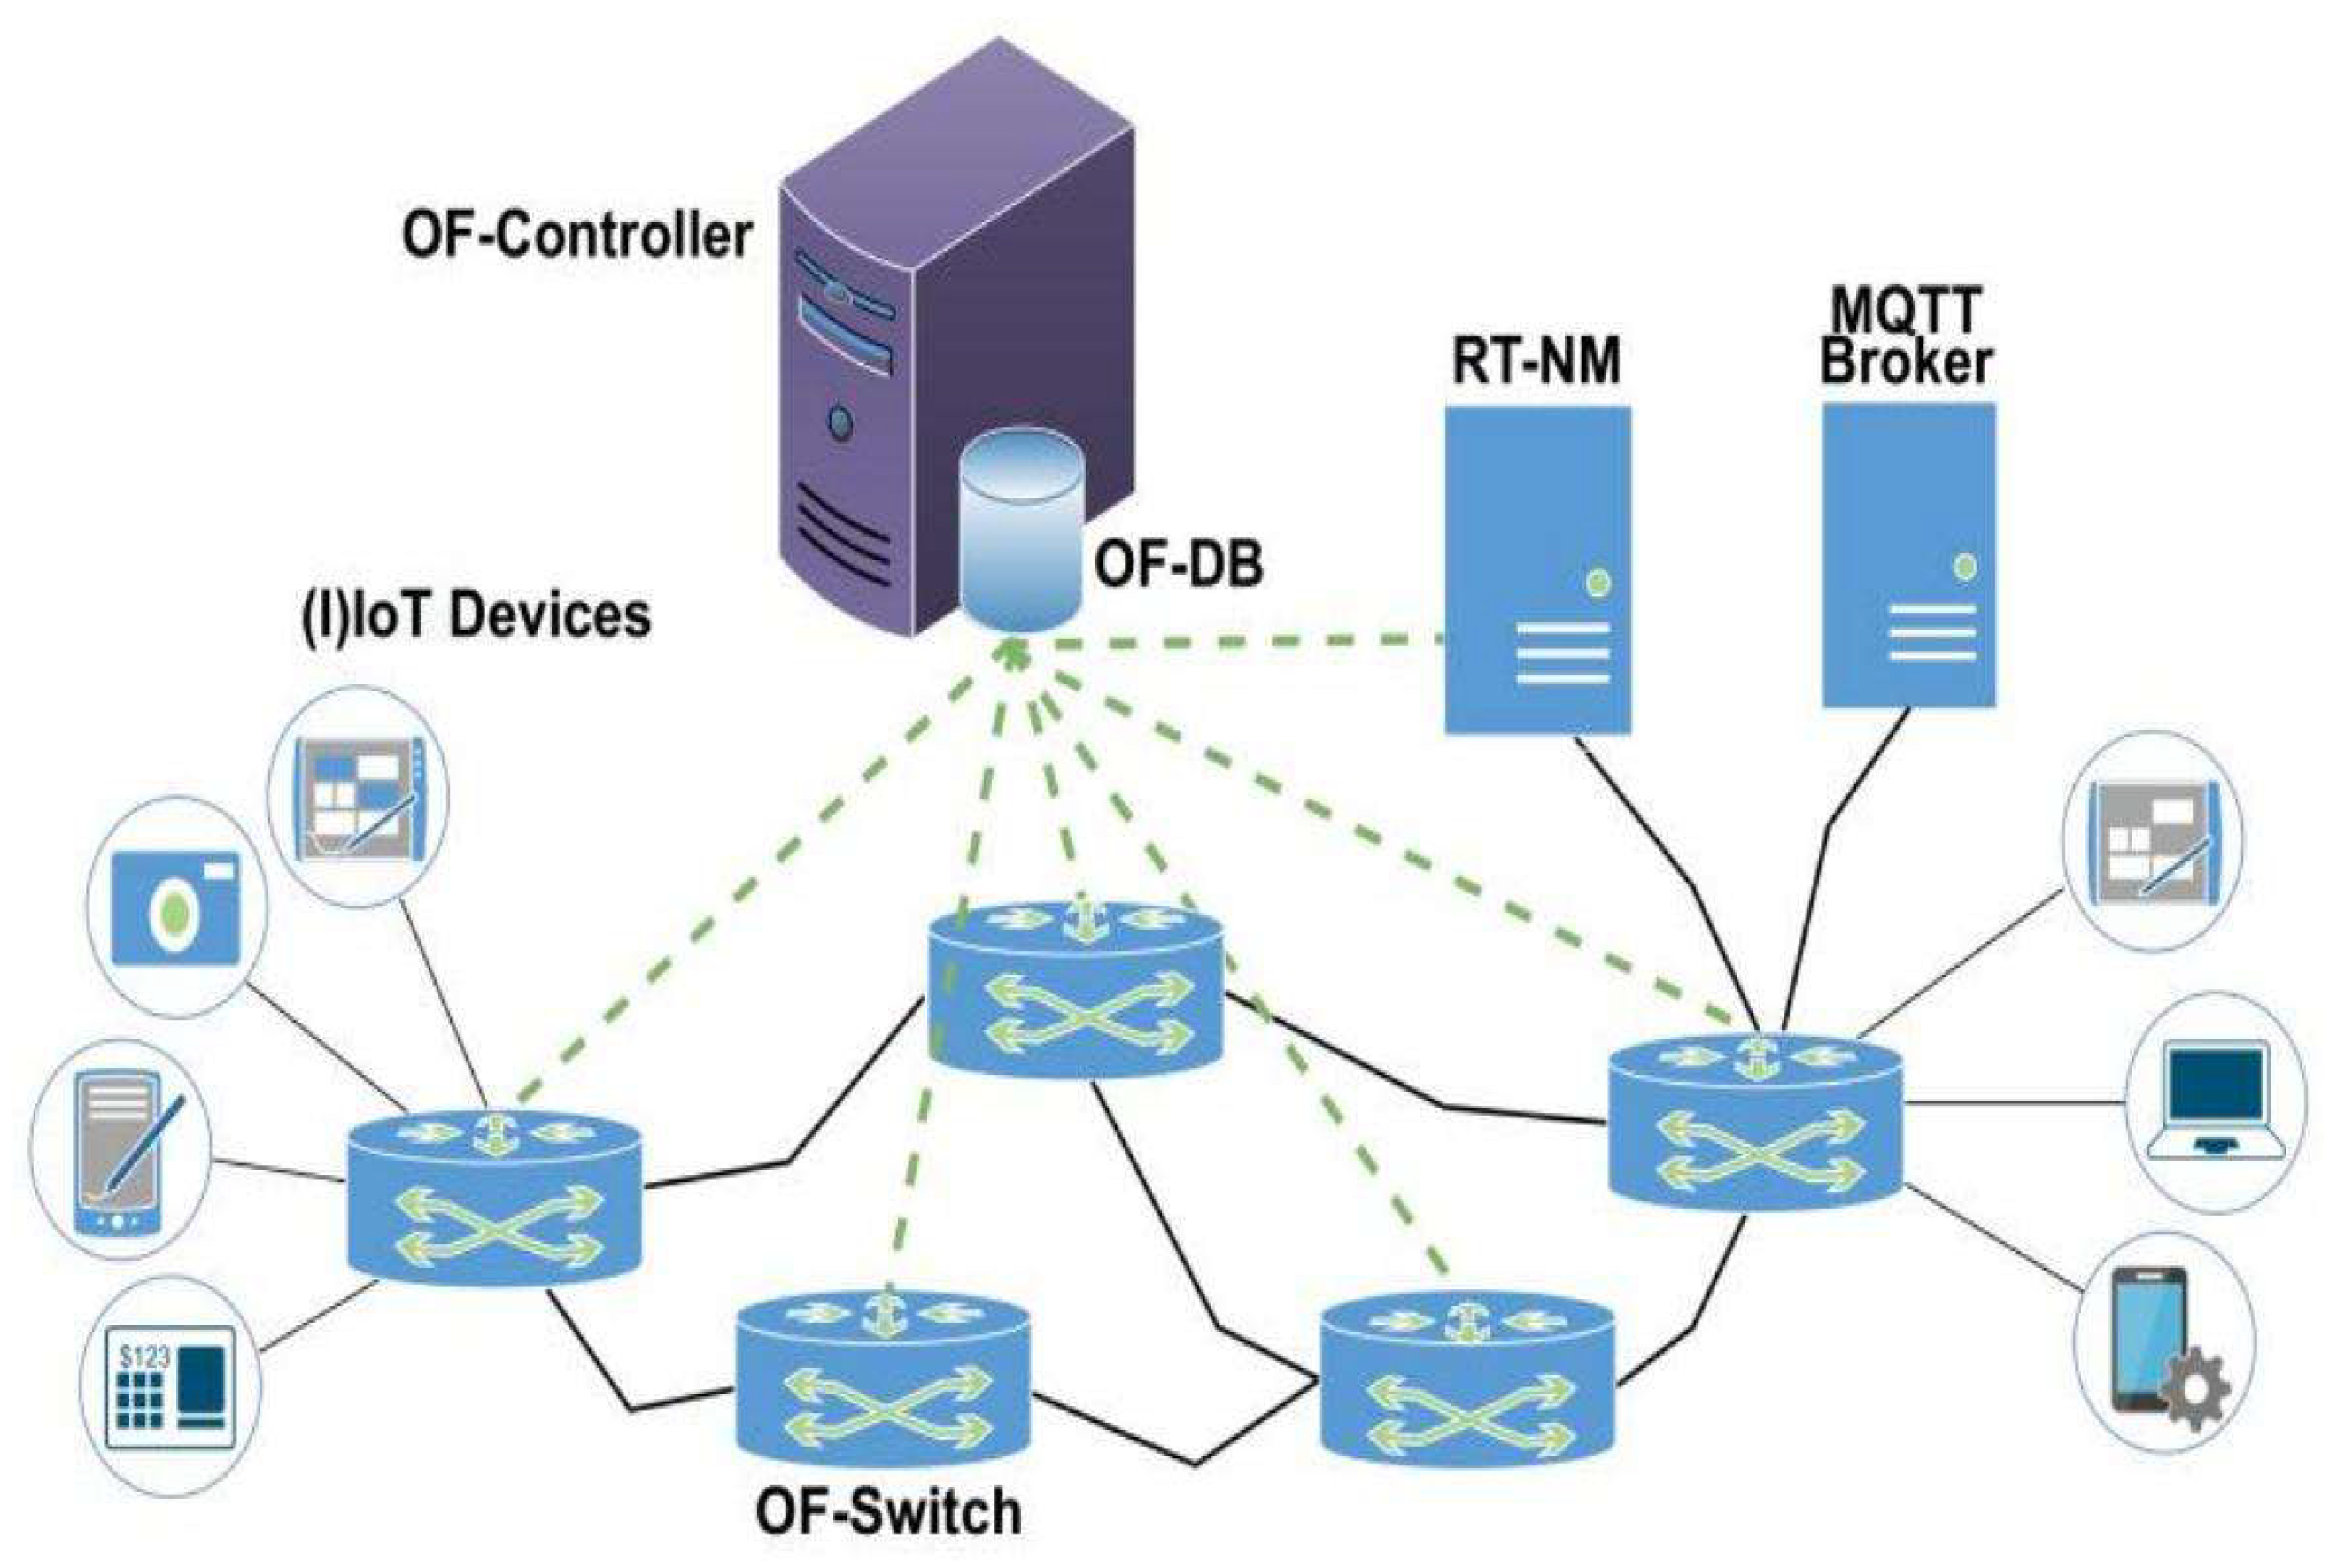
Figure 1.
MQTT-based fault reporting path from wearable device to cloud service.
3.2. Factor Effects and Model Interpretation
The logistic model for success within 60 s explained 38–45% of variance across platforms. Signal strength (per +10 dB RSSI) increased the odds by 1.47 (95% CI 1.42–1.52). Added queue depth (per extra slot at send time) reduced the odds to 0.82 (0.79–0.85). Battery below 20% lowered the odds to 0.76 (0.73–0.80). OS and hardware indicators were significant but smaller in effect. These results show that radio quality and local back-pressure dominate reporting speed; compute capacity was rarely the limiting factor. This agrees with controlled studies of MQTT timing that highlight network path control and admission as the main levers for predictable delivery.
3.3. Cross-Platform Schema, Fault Grouping, and Triage
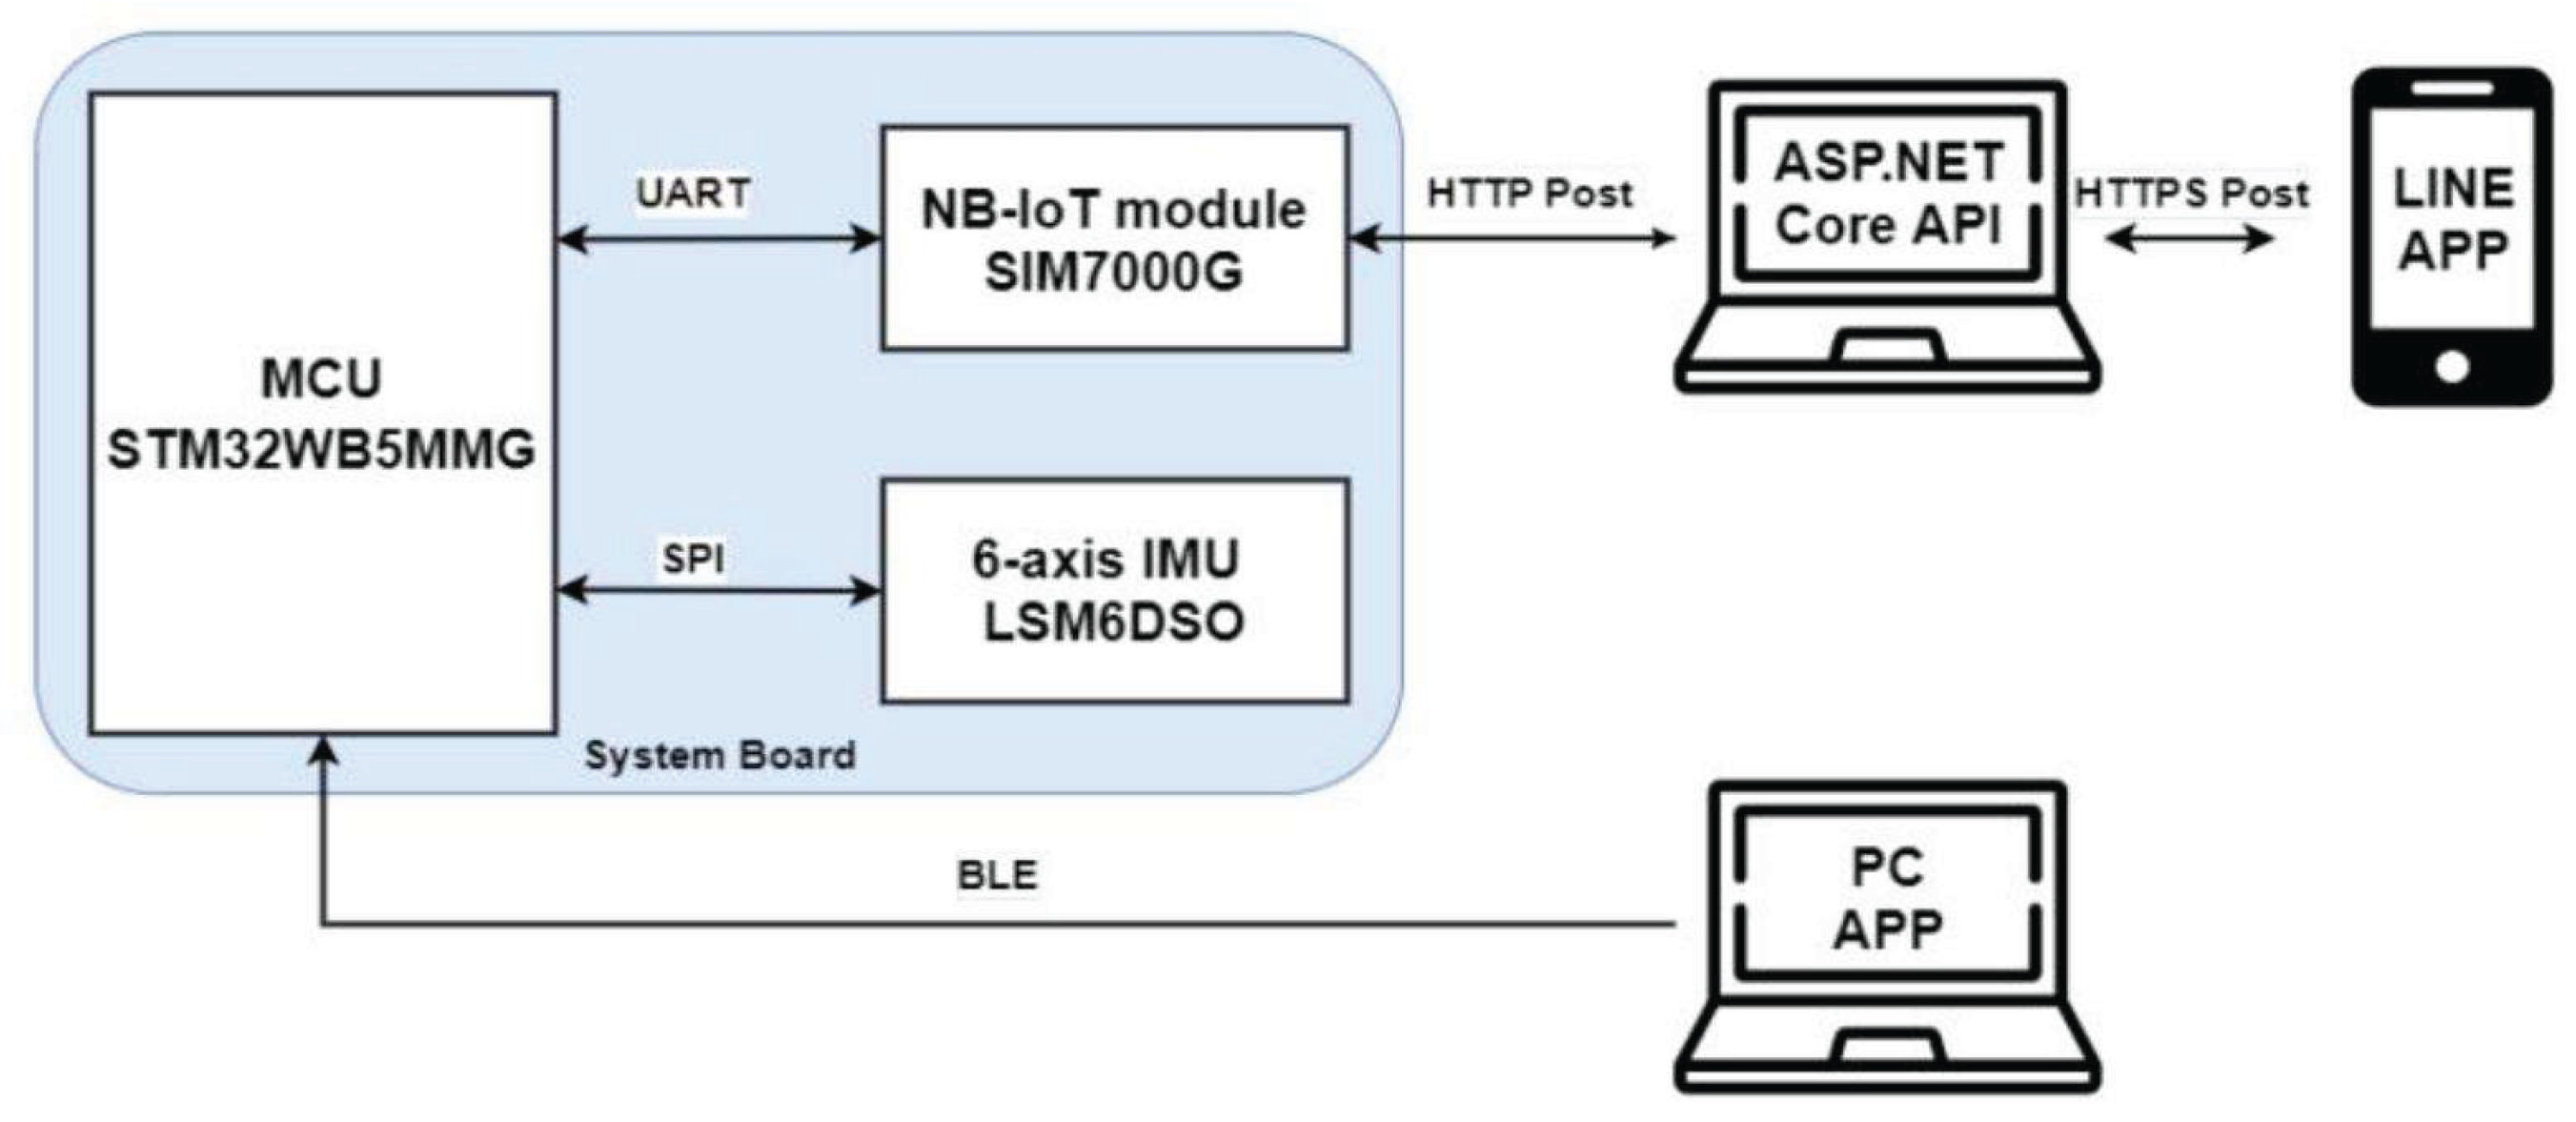
Unifying event fields across app, OS, radio, and sensor layers reduced distinct incident clusters by 35–39% through better fingerprinting and deduplication, which cut median time-to-detect by 28%. On devices with intermittent coverage, store-and-forward plus priority upload preserved ordering and kept duplication under 0.3% during bursts. This behavior is consistent with wearable pipelines that couple on-device detection with a cloud path and notification channel; Fig. 2 illustrates a representative wearable architecture in which events are detected locally and pushed to the cloud and messaging endpoints, similar to our production path.
Figure 2.
Fall detection pipeline with on-device detection and cloud alerts.
3.4. Energy, Overhead, and Limits
On an instrumented subset (n = 96), the energy per delivered report fell by 23% (IQR 18–27%) under mixed Wi-Fi/LTE conditions. The largest savings came from batching, dictionary-based encoding, and backoff that avoided futile retries at low RSSI. CPU time for encoding dropped by 31%, and DRAM traffic during bursts fell by 29%. However, benefits were smaller on watchOS where OS-level queue policies limited batching. Two limits remain: first, we did not test very low-power radios (e.g., NB-IoT PSM/eDRX) at scale; second, our field logs did not include long rural outages. Future work should extend to wide-area low-duty-cycle radios and add joint tests of secure boot and attestation so that integrity guarantees are measured together with latency and energy.
4. Conclusion
This study developed a cross-platform fault reporting system for wearables and tested it on a large device fleet and in controlled labs. Across 60,412 devices over 180 days, median time-to-report fell from 74 s to 41 s (−44.6%), p95/p99 dropped to 97 s and 226 s, the share of reports delivered within 60 s rose from 0.61 to 0.83, and per-device loss and duplication declined to 0.6% and 0.2%. A unified event schema, compact encoding, store-and-forward, and priority queues improved stability under weak links; incident clusters were reduced by 35–39% and median time-to-detect by 28%. On an instrumented subset, energy per delivered report decreased by 23%, with 31% less CPU time for encoding and 29% lower DRAM traffic. The main contribution is to show that common event fields and a simple on-device reporter can give lower delay and lower overhead across Wear OS, watchOS, and RTOS, while keeping report checks in place. Scientifically, the results clarify that radio quality and local queue depth are the key drivers of reporting delay and offer clear metrics—p95/p99, loss, duplication, and energy per report—for future comparison. In practice, the system supports large-scale deployments in health and safety settings that need timely and reliable fault reports. Limits include limited testing on low-duty-cycle wide-area radios and no coverage of long rural outages. Future work will add NB-IoT/eDRX cases, longer field runs, and joint tests with secure boot and attestation.
References
- See, K.W.; Wang, G.; Zhang, Y.; Wang, Y.; Meng, L.; Gu, X.; Zhang, N.; Lim, K.C.; Zhao, L.; Xie, B. Critical review and functional safety of a battery management system for large-scale lithium-ion battery pack technologies. Int. J. Coal Sci. Technol. 2022, 9, 1–17. [Google Scholar] [CrossRef]
- Xu, J. Fuzzy Legal Evaluation in Telehealth via Structured Input and BERT-Based Reasoning. 2025 IEEE International Conference on eScience (eScience). LOCATION OF CONFERENCE, United StatesDATE OF CONFERENCE; pp. 309–310.
- Ibrahim, A. , & Hugo, W. (2025). Designing Mobile Applications to Facilitate Citizen Information Sharing with the Police: Proposing Design Recommendations to Streamline Communication and Emergency Response Measures.
- Sun, X.; Meng, K.; Wang, W.; Wang, Q. Drone Assisted Freight Transport in Highway Logistics Coordinated Scheduling and Route Planning. 2025 4th International Symposium on Computer Applications and Information Technology (ISCAIT). LOCATION OF CONFERENCE, ChinaDATE OF CONFERENCE; pp. 1254–1257.
- Tsukada, M.; Kondo, M.; Matsutani, H. A Neural Network-Based On-device Learning Anomaly Detector for Edge Devices. IEEE Trans. Comput. 2020, PP, 1–1. [Google Scholar] [CrossRef]
- Li, C. , Yuan, M., Han, Z., Faircloth, B., Anderson, J. S., King, N., & Stuart-Smith, R. (2022). Smart branching. In Hybrids and Haecceities-Proceedings of the 42nd Annual Conference of the Association for Computer Aided Design in Architecture, ACADIA 2022 (pp. 90-97). ACADIA.
- Edwards, J.; Petricek, T.; van der Storm, T.; Litt, G. Schema Evolution in Interactive Programming Systems. Art, Sci. Eng. Program. 2024, 9, 2–1. [Google Scholar] [CrossRef]
- Wu, C. , Chen, H., Zhu, J., & Yao, Y. (2025). Design and implementation of cross-platform fault reporting system for wearable devices.
- Baldassano, C.; Hasson, U.; Norman, K.A. Representation of Real-World Event Schemas during Narrative Perception. J. Neurosci. 2018, 38, 9689–9699. [Google Scholar] [CrossRef] [PubMed]
- Li, Z. Traffic Density Road Gradient and Grid Composition Effects on Electric Vehicle Energy Consumption and Emissions. Innov. Appl. Eng. Technol. 2023, 1–8. [Google Scholar] [CrossRef]
- Mueller, J. W. (2018). Flexible models for understanding and optimizing complex populations (Doctoral dissertation, Massachusetts Institute of Technology).
- Wu, Q. , Shao, Y., Wang, J., & Sun, X. (2025). Learning Optimal Multimodal Information Bottleneck Representations. arXiv:2505.19996.
- Buyya, R.; Ilager, S.; Arroba, P. Energy-efficiency and sustainability in new generation cloud computing: A vision and directions for integrated management of data centre resources and workloads. Software: Pr. Exp. 2023, 54, 24–38. [Google Scholar] [CrossRef]
- Tigani, D. , van Kan, D., Tennakoon, G., Geng, L., & Chan, M. (2024, June).
- Embodied Carbon of Buildings: A Review of Methodologies and Benchmarking Towards Net Zero. In IOP Conference Series: Earth and Environmental Science (Vol. 1363, No. Embodied Carbon of Buildings: A Review of Methodologies and Benchmarking Towards Net Zero. In IOP Conference Series: Earth and Environmental Science (Vol. 1363, No. 1, p. 012030). IOP Publishing.
- Huang, Y.; Vu, M.; He, W.; Zeng, S. Rapid Attitude Controller Design Enabled by Flight Data. ASME Lett. Dyn. Syst. Control. 2024, 5, 1–12. [Google Scholar] [CrossRef]
- Chen, F.; Liang, H.; Yue, L.; Xu, G.; Li, S. Low-Power Acceleration Architecture Design of Domestic Smart Chips for AI Loads. 2025 6th International Conference on Computer Engineering and Application (ICCEA). LOCATION OF CONFERENCE, ChinaDATE OF CONFERENCE; pp. 1–4.
- Makhijani, K.; Kataria, B.; D, S.; Devkota, D.; Tahiliani, M.P. TinTin: Tiny In-Network Transport for High Precision INdustrial Communication. 2022 IEEE 30th International Conference on Network Protocols (ICNP). LOCATION OF CONFERENCE, United StatesDATE OF CONFERENCE; pp. 1–6.
- Shahri, E.; Pedreiras, P.; Almeida, L. Extending MQTT with Real-Time Communication Services Based on SDN. Sensors 2022, 22, 3162. [Google Scholar] [CrossRef] [PubMed]
Disclaimer/Publisher’s Note: The statements, opinions and data contained in all publications are solely those of the individual author(s) and contributor(s) and not of MDPI and/or the editor(s). MDPI and/or the editor(s) disclaim responsibility for any injury to people or property resulting from any ideas, methods, instructions or products referred to in the content. |
© 2025 by the authors. Licensee MDPI, Basel, Switzerland. This article is an open access article distributed under the terms and conditions of the Creative Commons Attribution (CC BY) license (https://creativecommons.org/licenses/by/4.0/).
Copyright: This open access article is published under a Creative Commons CC BY 4.0 license, which permit the free download, distribution, and reuse, provided that the author and preprint are cited in any reuse.


