
Submitted:
14 November 2025
Posted:
18 November 2025
You are already at the latest version
Abstract
The Mercosur countries (also known as the Southern Common Market countries) and the European Union (EU) Member States are among the most important players in global agri-food trade. Both blocs are significant net exporters of agri-food products, but their production structure and patterns of specialisation differ significantly. The agri-food sector is an important part of the economies of both country blocs, but the Mercosur countries have advantages in the production of agricultural raw materials, while the EU has comparative advantages in highly processed products. The two groupings also differ in their approach to the sustainability of agricultural production, including international trade. The negotiated EU–Mercosur Partnership Agreement (EMPA) has the potential to alter the conditions of competition in the EU agri-food market. The most important element of this agreement — the EU–Mercosur Interim Trade Agreement — provides for extensive measures facilitating access to the markets of both sides, including the liberalisation of tariffs on imports of most agri-food products from Mercosur countries into the EU. Hence, the aim of this article is to compare the agricultural production potential of Mercosur and the EU countries at the threshold of the entry into force of the EMPA. In particular, the authors seek to answer questions such as whether the EU should fear competition from Mercosur countries in the agri-food sector and whether differences in production potential could pose a threat to EU agriculture. An assessment of the agricultural production potential of Mercosur and the EU countries was made using comparative statistical methods, analysis of structural change and dynamics based on selected indicators commonly used in the literature. The analysis carried out showed that the production potential of Mercosur agriculture – due to large land resources, low labour costs, export specialisation and less restrictive regulation – poses a risk of increased competition and price pressure on the EU agri-food market after the entry into force of the EMPA. This is particularly true for certain sensitive products such as beef, poultry, ethanol and sugar. As a result, this could lead to a widening of the structural disparities between European and South American agriculture.
Keywords:
agricultural production potential
; European Union
; Mercosur
; sustainable production
; EU-Mercosur partnership agreement
1. Introduction
The Mercosur countries (also known as the Southern Common Market) and the European Union (EU) Member States are among the most important players in global agri-food trade [1]. In 2024, they accounted for 9.6% and 12.8% of global agri-food exports and 1.2% and 11.6% of global agri-food imports, respectively [2]. The significant share of these regions in global trade is a consequence of the role that the agri-food sector plays in the economies of both blocs, including the productive capacity of their agriculture [3,4]. Particularly noteworthy is the rise of Brazil and Argentina as exporters of agri-food products, a trend observed during the first decade of the 21st century [5]. Both blocs are significant net exporters of agri-food products, but their production structure and patterns of specialisation differ significantly. Mercosur countries have advantages in the production of agricultural raw materials such as beef [6,7], poultry, soybeans and sugar, while the EU has comparative advantages in highly processed goods, dairy products and high-quality, value-added foods [8]. This distribution of advantages is related to the different approaches of the two groupings to sustainable production practices and, consequently, to international trade [9].
The differences in the patterns of trade specialisation of the two blocs are reflected in their mutual EU–Mercosur agri-food trade. This trade is characterised by a clear asymmetry in turnover, with EU imports from Mercosur countries far exceeding EU exports to the region. The commodity composition of mutual trade is also different [10]. The EU mainly imports raw materials and intermediate products for processing from Mercosur countries (e.g. high-protein soybean meal, coffee, soybeans, orange juice and unprocessed tobacco) as well as products typical of other climate zones (e.g. peanuts, citrus fruits) [11,12]. Around a dozen percent of EU agri-food imports from Mercosur consist of sensitive products for the EU agri-food sector, including beef, sugar, poultry, meat products, and ethyl alcohol. Conversely, the EU countries export mainly processed products to Mercosur, such as edible oils, wine, protein concentrates, confectionery and bakery products, chocolate products, frozen chips, pasta, beer, vodka and whisky [8].
In December 2024, after nearly 25 years of negotiations, representatives of the Mercosur countries and the EU reached an agreement to conclude the EU–Mercosur Partnership Agreement (EMPA) between the two parties [13]. A preliminary agreement had already been reached earlier, in 2019. However, due to a number of concerns about the adequate inclusion of environmental and sustainability issues in the agreement, the talks were temporarily suspended, and negotiations did not resume until 2023 [14,15]. They renewed talks addressed both the aforementioned issues and the changed international environment, including growing competition from China and the resurgence of U.S. protectionism [16,17,18]. On 3 September 2025, the European Commission recognised the EMPA as a mixed agreement and presented the modalities for its adoption. Pending ratification by national parliaments, an interim trade agreement is expected to enter into force. The European Commission has submitted this agreement to the Council (qualified majority required) and to the European Parliament (simple majority required) for approval [19].
The negotiated EU–Mercosur Partnership Agreement has the potential to significantly alter the conditions of competition in the EU agri-food market [20]. The most important element of this agreement, embodied in the EU–Mercosur Interim Trade Agreement (ITA), provides for extensive measures to facilitate access to the markets of both parties, including liberalisation of tariffs on the import of most agri-food products from Mercosur countries into the EU [21,22]. This is particularly important, as the previous experience of the Mercosur countries with tariff liberalisation within the bloc has shown a positive impact of integration on agri-food trade within this grouping [1,5]. Indeed, agri-food products are among the most sensitive categories from the perspective of both partners, as their significance often extends beyond the economic dimension to include social, environmental, and political issues [3]. From the perspective of EU farmers, the EU–Mercosur agreement raises concerns about the influx of commodities produced at lower costs and under different regulatory frameworks, potentially unsustainable, and consequently posing a risk of reduced competitiveness [23,15].
To-date research has focused primarily on assessing selected components of the agricultural production potential of individual Mercosur countries [24] and the EU Member States (e.g. Poland [20]), as well as the production potential of selected sectors [6,7], particularly analysed through the prism of environmental conditions [25,26]. The research has also examined the trade potential of these countries in the context of agri-food trade [5,27]. What is lacking in the literature, however, are in-depth comparative analyses of the agricultural production potential of the Mercosur countries and the EU as an integrated bloc, in particular analyses that present the current state of this potential, i.e. taking into account the new geopolitical conditions after the COVID-19 pandemic and the ongoing war in Ukraine. This gap is particularly relevant in the context of the current discussions on the imminent entry into force of the EU–Mercosur Partnership Agreement.
The purpose of this article is to compare the agricultural production potential of Mercosur and EU countries on the eve of the entry into force of the EU–Mercosur Partnership Agreement. In particular, the authors aim to answer the questions of whether EU countries, in view of the agricultural production potential of Mercosur countries, should be concerned about increased competition from these countries in the agri-food sector and whether differences in production potential could pose a threat to EU agriculture after the agreement enters into force. Answering these questions is expected to provide an innovative contribution to the research problem.
The article consists of an introduction, four substantive chapters, and a conclusion. The first chapter, theoretical in nature, presents the main provisions of the EU–Mercosur Partnership Agreement, discusses the concept of production potential in the light of the literature, and reviews selected research studies. The second chapter contains a description of the research method used, i.e. the formulations and interpretations of the indicators and the data sources. The third chapter provides an in-depth comparative analysis of the agricultural production potential of Mercosur and the EU countries, while the fourth chapter presents a discussion of the results. The article concludes with a final summary and conclusions.
2. Literature Review
2.1. The Main Provisions of the Agreement on Imports of Agri-Food Products from Mercosur Countries to the EU
The Interim Trade Agreement Trade between the European Union and the Common Market of the South (EU–Mercosur ITA) is the most important element of the Partnership Agreement between the parties (EMPA) [19]. It contains provisions aimed at facilitating mutual trade, including trade in agri-food products. This agreement provides primarily for the liberalisation of tariffs, granting EU producers greater access the Southern Common Market, as well as Mercosur producers greater access to the EU market. An important element of the agreement is also the regulation of other areas falling under the EU’s exclusive competence, such as non-tariff barriers — including sanitary and phytosanitary measures — as well as trade defence instruments, products with geographical indications, and trade in the context of sustainable development.
2.1.1. Customs
The provisions adopted in the EMPA for the liberalisation of customs duties on imports from Mercosur countries to the EU are similar to those applied in other agreements. The complete elimination of tariffs upon the entry into force of the agreement will occur only for the least sensitive products in EU imports from Mercosur. Together with products already imported from Mercosur into the EU at zero MFN (Most Favoured Nation) tariffs, from the date of entry into force of the agreement, duty-free access to the EU market will be granted to products representing nearly 38% of the tariff lines relating to agri-food products (Chapters 01–24 of the Combined Nomenclature, plus a dozen selected lines outside these chapters) [28]. For imports into the EU of more sensitive products (around 43% of tariff lines), tariffs will be eliminated gradually over a period of four, seven or ten years. For imports of fresh or chilled fruit and vegetables, the EU will remove tariffs but retain the entry price system. After the expiry of the transitional periods, duty-free access to the EU market will apply to products imported from Mercosur covering nearly 81% of the tariff lines relating to agri-food products.
For sensitive products (more than 300 tariff lines), the EMPA provides for the establishment of 22 tariff-rate quotas (TRQs) on imports from Mercosur to the EU. Within the quotas, it will be possible to import a certain quantity of products at a zero rate, a fixed preferential rate, or a gradually reduced preferential rate [19]. Only four quotas provide for a fixed amount of preferential imports each year. For the remaining quotas, it was agreed that the volume of products would increase annually until the target level was reached, usually in the sixth year of the contractual term. For EU imports, quotas have been established for beef (fresh or chilled and frozen), cheese, eggs, egg albumin, pork, poultry (bone-in and boneless), milk powder, honey, garlic, ethanol, infant formulae, maize and sorghum, sweet maize, cane sugar for refining, other sugar, rice, rum, and maize and cassava starch. The most sensitive products (more than 100 tariff lines), from the point of view of the EU agri-food sector, were excluded from liberalisation. The exclusions include, inter alia, sheep, lamb and goat meat (except salted and dried meat covered by the tariff quota), certain milk and cream powder, buttermilk, whey, certain spreads containing butter, mozzarella, durum wheat, wheat (except seed wheat) and sugar, except cane sugar for refining.
2.1.2. Other Provisions
The EMPA reaffirms the rights and obligations of the parties under the WTO Agreement on the Application of Sanitary and Phytosanitary Measures (SPS Agreement), as well as their commitments to ensure the transparency of SPS measures. Reference was also made to the principles of regionalisation, equivalence, and precaution. The principle of regionalisation facilitates the recognition of animal diseases and pest-free areas, allowing exports of plants, animals, and their products from such unaffected areas [23]. The principle of equivalence allows different regulations and standards to be considered equivalent if they provide the same level of consumer, animal and plant health protection. The precautionary principle, in turn, permits the adoption of provisional SPS measures, including in cases where scientific information is insufficient. The EU–Mercosur ITA also includes a chapter on dialogues on issues related to the agri-food chain. Its purpose is to create a platform for the exchange of information between parties on production, processing, distribution and food safety standards. The EMPA, therefore, does not remove specific non-tariff barriers to agri-food trade between the parties but rather establishes mechanisms for cooperation and dialogue aimed at gradually reducing these barriers. The EMPA contains mechanisms based on dialogue and cooperation rather than sanctions [19].
In addition to global safeguards, the agreement also establishes bilateral safeguard measures that apply to all products, not only agri-food ones. In response to numerous protests by EU farmers highlighting the inadequacy of the proposed provisions to the specificities of the agricultural sector, the European Commission proposed, in early September 2025, to attach a sector-specific bilateral safeguard clause for the agri-food sector to the agreement [19]. This clause is intended to allow the temporary restriction of preferential imports from Mercosur to the EU if such imports were to cause serious damage to the EU agri-food sector. The mechanism of this clause is based on continuous market monitoring and the possibility of a rapid investigation in the event of a surge in imports or a decline in prices. In practice, the safeguard measures may involve the temporary suspension of the tariff-reduction schedule for the product concerned, or a reversion of the tariff preference to the MFN or base rate (whichever is lower) [23].
An important part of the agreement is the chapter on Trade and Sustainable Development (Chapter 18). This chapter is intended to ensure that the liberalisation of tariffs in trade between the EU and Mercosur does not encourage deforestation or lead to a lowering of environmental protection and labour standards in Mercosur countries [19]. The parties reaffirm their commitments to implementing the Paris Agreement on climate change and to taking action to reduce deforestation and promote sustainable development, including through measures related to animal welfare. The agreement also provides for a mechanism for dialogue and cooperation to monitor the implementation of the commitments [22]. However, the Trade and Sustainable Development chapter largely consists of declaratory provisions and lacks effective enforcement mechanisms.
2.2. The Concept of Production Potential
The literature sources on the subject approaches the production potential of a country's or region's agriculture in various ways. The prevailing general approach views it as a combination of resources, production capacity, and external conditions. However, different researchers define the individual components of potential in more detail, giving them different meanings. The production potential of agriculture can, for example, be determined by natural resources (such as land and water), their utilisation methods, natural conditions (climate, biodiversity), labour resources, technical infrastructure and technologies, and economic conditions [29]. It can also be further classified according to: climatic conditions — including the distribution of temperatures and the amount and distribution of precipitation, which determine the length of the growing season and hydrological conditions; the area, structure, and qualitative characteristics of agricultural land; livestock populations; the demographic situation in rural areas, which determines labour resources; and the ownership and size structure of farms [30,31]. Potential can also be understood in a dynamic sense, meaning that it is not merely a finite sum of resources, but is characterised by the ability to combine them productively through investment, innovation, and integration into value chains [32,33]. The FAO adopts an agro-ecological approach, which takes into account components of potential such as climate, soil, and crop technologies [34]. International institutions such as the OECD and the World Bank adopt an economic approach, emphasising the role of market conditions, infrastructure, institutional frameworks, and the regulatory environment in enhancing the capacity of the agricultural sector [35,36].
According to the approach adopted in the literature, research uses different methods to measure the production potential of the agricultural sector, both biophysical and economic. Biophysical measures include, in particular, indicators describing soil quality and fertility, water conditions, rainfall totals, and temperatures [37,38]. Among economic measures, total factor productivity (TFP) — calculated using Törnqvist or Malmquist indices — predominates, often employing Data Envelopment Analysis (DEA) or Stochastic Frontier Analysis (SFA) models to isolate technical efficiency and changes in the technological frontier [39,40]. Taxonomic methods (e.g. Hellwig’s method, TOPSIS) are used to construct synthetic indicators of potential at the district or municipal level [41]. These are complemented by measures such as investment activity, innovation activity, R&D spending, and export competitiveness [42]. Cross-country comparisons are based on the analysis of available data series from FAO, OECD, the World Bank, and FADN/IFCN farm-level databases [43]. Agricultural economists seek to combine both approaches — that is, to analyse the productive potential of agriculture from an economic perspective, in a dynamic and spatial context — by assessing the structure of this potential and the relationships between its individual components, including the productivity of production factors, technical efficiency, profitability, and the financial sustainability of farms, complemented by qualitative indicators [44,45,46]. For EU countries, the impact of the Common Agricultural Policy (CAP) — through subsidies and investment programmes — on capacity development is also sometimes taken into account [47]. In addition, the literature points to limitations in the harmonisation and comparability of data, both administrative data for individual countries and micro-level data, which result in significant underestimation of agricultural potential. Remote sensing-based monitoring [48] could provide a partial solution to this problem.
2.3. Review of Selected Research Results
Although the EU and Mercosur countries are important players in global agri-food trade, the literature sources lack in-depth comparative analyses of the agricultural production potential of the two blocs as a whole. In particular, there are no studies presenting the current state of this potential, i.e. taking into account the new geopolitical conditions following the COVID-19 pandemic and in the context of the ongoing war in Ukraine. The only study known to the authors that compares the agricultural production potential of the EU and Mercosur ends in 2019 [49]. Existing research has focused primarily on assessing selected components of the agricultural production potential of individual EU and Mercosur countries. Differences in production potential and farm efficiency within the EU have been examined, among others, by Pawlak, Smutka and Kotyza [30]; Tłuczak [50]; Smędzik-Ambroży and Sapa [51]; as well as Guth and Smędzik-Ambroży [52]. These studies show that there is regional variation in the availability of production factors in EU agriculture, which implies differences in the technical efficiency of farms [50]. It has been found that the level of technical efficiency in the agriculture of the new EU Member States is higher than in the EU-15 as a whole [52]. At the same time, it has been indicated that higher productivity in agriculture characterises the EU-15 countries rather than the new Member States [51,53]. Some studies have addressed the production potential of selected EU countries [54], the Visegrad Countries [55], or even individual EU countries, such as Poland [20] or Romania [56]. Changes in the production potential of Mercosur countries have been analysed, among others, by Grytz and Guero (for Brazil’s agri-food sector) [57]. In some cases, analyses have been limited to the production potential of selected sectors, such as beef in Brazil [6,7] or soybeans in Brazil [24]. Many authors have referred to the production potential of Mercosur agriculture through the prism of environmental factors [25,58,59], including those related to deforestation [60]. Baležentis et al. have, in turn, addressed environmental issues related to EU agriculture [61].
A separate group of studies consisted of analyses taking into account the impact of the EU–Mercosur agreement on the EU agri-food sector. Research conducted to date suggests that trade liberalisation under the agreement will have a negative impact on the agri-food sector of EU countries, which is considered particularly sensitive [62]. However, as Gohin and Matthews point out [63], these studies have several limitations. Firs, studies using quantitative methods, including computable general equilibrium models, considered multiple scenarios rather than the final provisions of the agreement, not made public until December 2024 [64,65]. Second, the model-based estimates were mostly produced for individual countries – Spain [66], Ireland [67], Austria [68], the Netherlands [69], France [70] and Sweden [71]. Third, some research analysed in detail the impact of the EMPA on the EU agri-food sector but did not employ advanced quantitative methods [8]. Fourth, other studies focused on the cumulative impact of EU free trade agreements with third countries on the EU agri-food sector [27]. The most comprehensive study estimating the impact of the EMPA on the EU agri-food sector, particularly on beef, is that conducted by Gohin and Matthews [63]. This is because they used the most up to date 2017 GTAP database and incorporated the final provisions of the agreement, made public in December 2024, into their model. Their estimates show that, as a result of liberalisation, the income of EU beef producers will decrease by only 0.4% and that of all EU agri-food producers by only 0.1%. This reduction is therefore considerably smaller than if tariffs on imports of agri-food products from Mercosur countries to the EU were to be completely abolished. In 2025, Hagemejer et al. updated the 2019 study prepared for the European Parliament [72] analysing the impact of the EMPA on the agri-food sector. They took into account the provisions of the agreement announced in December 2024. The new estimates indicate that tariff liberalisation after the entry into force of the agreement will contribute to a decrease in EU sugar production by 0.7% and in beef production by 0.4% [72].
3. Method and Data Sources
An assessment of the agricultural production potential of Mercosur and EU countries was carried out using comparative statistical methods, analysis of structural change and dynamics [73] based on selected indicators commonly used in the literature sources. These indicators are shown in Table 1. They are grouped into six categories: production resources and factors, relationships between production factors, prices of production factors, gross value added, productivity, and other qualitative factors determining potential.
Production resources and factors refer to the basic resources (land, labour, and capital) that determine the scale of agricultural activity. Relationships between production factors describe the way in which the various factors complement or substitute for one another, thereby affecting economic efficiency. The prices of production factors represent the cost of using these inputs, which influences the profitability of agricultural production. Gross value added denotes the newly created value in agriculture, determining its contribution to GDP. Productivity reflects the efficiency of factor use, i.e. the output obtained per unit of input.
To ensure the comparability of the statistics, the data were obtained from the FAOStat database. Due to the lack of relevant data disaggregated for the Agriculture section, data covering the Agriculture, Hunting, Forestry, and Fishing sectors combined were sometimes used. The European Union (EU) is understood to be the 27 EU Member States, excluding the UK. Mercosur is understood to include the following countries: Brazil, Argentina, Paraguay and Uruguay.
The time frame of the research covers the years 2018–2023. The year 2018 was chosen as the starting point of the analysis because it was the last year before major negative externalities in the global economy became apparent — notably, the rise of U.S. protectionism during Donald Trump’s first presidency, the COVID-19 pandemic, and the war in Ukraine.
4. Research Results
4.1. Factor Resources and Inputs
The agricultural land area of the Mercosur countries is almost 2.4 times larger than that of the EU, with an upward trend throughout the analysed time frame, except in 2023, while in the EU, the mentioned area shows a downward trend, except in 2019 (Table 2). The same situation can be observed for the arable land area, with Mercosur exceeding the EU by approximately 3.4 million hectares (mln ha) [74]. On the contrary, the area of permanent crops is around 3 million hectares smaller in Mercosur than in the EU, while the area of permanent meadows is approximately five times larger in Mercosur than in the EU. Everything stated above points to the great production potential of the Mercosur countries, though in a different direction, as the larger area of permanent meadows indicates the livestock specialisation of Mercosur agriculture.
When comparing the number of people employed in agriculture across the analysed country blocs, it should be noted that approximately 2.2 million fewer employees work in the agricultural sector of the EU than in Mercosur (Table 3). The tendency toward a decrease in agricultural employment is common to both regions, with a single exception in 2021, when an increase in agricultural employment was observed in Mercosur [75,76]. This trend may indicate an increase in mechanisation processes in the agricultural sectors of both blocs, a decline in the attractiveness of agricultural employment, natural migration processes, and other related factors. The net capital stock in agriculture, forestry, and fishing is approximately 912 billion USD higher in the EU than in Mercosur, indicating a greater capacity in the EU economies to produce goods and services. This, in turn, leads to higher potential output and economic growth, as more capital can be used to enhance productivity in the analysed sector. Mercosur tended to reduce its net capital stock in agriculture, forestry, and fishing in 2019 and 2020, with an increase observed toward the end of the analysed period. In contrast, this indicator decreased in 2019 and 2022 in the EU, while increasing in the remaining years.
4.2. Relationships Between Production Factors
During the analysed period, the Mercosur countries had approximately twice as much agricultural land per employee as the EU countries (Table 4). This indicates that agriculture in Mercosur is more extensive and land intensive. Conversely, the number of people employed per 100 hectares of agricultural land was almost twice as high in the EU as in Mercosur, suggesting that EU agriculture is more labour-intensive [43]. The net capital value per employee was several times higher in the EU than in Mercosur, meaning that EU agriculture is more capital-intensive and mechanised. This is also confirmed by the data on the net capital value per hectare of agricultural land.
Between 2018 and 2023, both country blocs experienced an increase in their net capital per employee and per hectare of agricultural land. During the analysed period, the value of net capital per employee in the Mercosur countries increased by nearly 28.9%, while in the EU it grew by 21.8% [43]. At the same time, the net capital value per hectare of agricultural land in the Mercosur countries rose by 26.3%, compared with only 10.2% in the EU. Despite the higher growth dynamics observed in the Mercosur countries, the differences in the capital intensity of agriculture between Mercosur and the EU have further deepened. The EU continues to steadily increase its capital expenditure, while Mercosur maintains a more extensive agricultural system. At the same time, the number of workers per 100 hectares of agricultural land in the EU has significantly decreased, which may indicate rising labour productivity.
4.3. Prices of Production Factors
Available statistics for selected Mercosur and EU countries showed that labour costs (expressed as average monthly agricultural wages) and energy costs (expressed as diesel price) in the Mercosur countries were lower than in the EU (Figure 1). For example, the average monthly earnings in agriculture, forestry, and fishing in Brazil in 2023 amounted to only 25% of the average monthly wage in Poland, 15% of that in Italy, and less than 10% of that in the other selected countries — Belgium, Denmark, France, Germany, and the Netherlands [77]. The differences in diesel prices between Mercosur and EU countries were smaller than those for average monthly wages in agriculture, forestry, and fishing. For instance, in October 2025, the price of one litre of diesel in Brazil was about one-third lower than in Poland and about half the level recorded in the other EU countries mentioned [78]. Lower labour and fuel costs therefore translate into lower production costs in Mercosur agriculture, making its products more price-competitive in foreign markets, including in the EU market.
4.4. Efficiency of Production Factor Use
The value added in agriculture, forestry, and fishing in the EU was, on average, about 95.5% higher than in the Mercosur countries during the analysed period (Table 5). The largest difference between the two blocs was observed in 2019 (around 125%), while the smallest occurred in 2023 (around 67.5%) [79]. This significant disparity demonstrates that the EU has been more successful than those of Mercosur in increasing the market value of their agricultural products through processing, product and brand development, and the expansion of agro-service offerings, among other factors. The dynamics of value added in agriculture, forestry, and fishing did not vary greatly between Mercosur and the EU. An upward trend was observed in Mercosur between 2020 and 2023, and in the EU from 2021 onwards. This positive tendency suggests that both regions not only acknowledge the importance of transforming their agricultural sectors but are also actively promoting the shift from raw material production to higher value-added processing.
Despite the differences in absolute values described above, the shares of value added in agriculture, forestry, and fishing in the GDPs of the two regions differ in another way. On average, this share amounted to around 1.6% in the EU, compared with approximately 7.3% in Mercosur during the analysed period [79]. Furthermore, a consistent upward trend was observed in the Mercosur countries (except in 2022), whereas in the EU, the share of value added increased only twice — in 2020 and 2022. Consequently, agriculture, forestry, and fishing contribute a significantly larger share to the economic output of Mercosur, making them more important for the economies of its member countries. In contrast, other sectors — such as industry and services — play a more dominant role in generating GDP in the EU.
Land productivity in the EU is, on average, 4.6 times higher than in Mercosur over the analysed period, reflecting greater agricultural efficiency, stronger food security, and more favourable economic development prospects for the EU (Table 6). Labour productivity is also higher in the EU than in Mercosur — by approximately 2.4 times on average during the analysed period — indicating greater efficiency resulting from factors such as advanced technology, higher worker skills, and more effective management practices in EU agriculture compared with that of the Mercosur countries [43]. Despite the differences mentioned above, the trend in labour productivity is similar in both regions, showing a decline in 2019 followed by an increase throughout the remainder of the analysed period.
A completely different situation, however, is observed when assessing the efficiency of capital use in agriculture in the two blocs. This indicator is approximately 3.6 times higher in the Mercosur countries than in the EU during the analysed period (average values: Mercosur – 0.89; EU – 0.25). This, in turn, suggests that Mercosur countries are able to generate higher agricultural output with lower levels of capital investment — such as machinery, technology, and financial resources — leading to greater profitability and productivity by producing more value from the same amount of capital or achieving similar results with less capital input.
4.5. Output of Basic Agricultural Products
When analysing livestock dynamics, the difference in the number of cattle and buffaloes between the two blocs is particularly striking, as it represents the largest disparity among the livestock types examined (Table 7). On average, the Mercosur countries had almost four times more cattle and buffaloes than the EU during the analysed period. Moreover, the trend for this livestock category is upward in Mercosur throughout the entire period under review, whereas it is downward in the EU [80]. Other livestock types in which Mercosur countries surpass the EU are goats and poultry. On average, Mercosur has approximately 1.4 times more goats and 1.1 times more poultry than the EU. The dynamics of these livestock types also differ between the two regions: in Mercosur, the number of goats shows an upward trend (with a single exception in 2021), while in the EU it declines. Similarly, poultry numbers increase steadily in Mercosur but fluctuate in the EU, with growth observed in 2019, 2020, and 2022.
At the same time, the EU surpasses Mercosur in the number of swine and sheep. The EU has almost 2.9 times more pigs and 1.5 times more sheep than the Mercosur countries. However, despite this seemingly favourable situation, the dynamics are far less positive: the number of pigs in the EU shows a downward trend (except in 2020), whereas in Mercosur it tends to increase (except in 2019 and 2023). Similarly, sheep numbers in the EU have been declining, while in Mercosur they show an upward trend, with a temporary decrease observed only in 2021.
When comparing the dynamics of plant product production in the EU and Mercosur, it should be noted that, overall, cereal production was approximately 1.3 times higher in the EU during the analysed period (Table 8). However, two crops in particular — rye and rapeseed — stand out, showing the largest production differences between the two regional blocs: rye production was about 46.8 times higher and rapeseed about 43 times higher in the EU than in the Mercosur countries [80]. Other plant products produced in greater quantities in the EU than in Mercosur include wheat (4.8 times), barley (9.4 times), and sunflower seeds (2.5 times) on average over the analysed period. Therefore, these crops can be seen as major opportunities to increase the EU’s agricultural export volumes to Mercosur. Conversely, Mercosur countries produce almost 66 times more soybeans and 2.5 times more maize than the EU. Given their competitive prices, these two crops represent an important opportunity for import diversification in the EU countries with strong livestock sectors, providing an alternative source of feed imports.
A completely different pattern emerges when comparing meat production between the two regions. Similar to livestock numbers, the Mercosur countries produced more beef and buffalo meat (around 2.1 times) and poultry meat (about 1.3 times), while the EU produced roughly four times more pig meat during the same period. This could represent an opportunity for EU countries to diversify their imports of these types of meat, while at the same time introducing additional competition for those specialising in exports. As for milk production, the EU produced approximately 3.2 times more milk than Mercosur countries during the analysed period. This, in turn, represents a significant opportunity for the EU’s milk production and processing industries to expand their export destinations by introducing their products to the Mercosur market.
4.6. Factors Determining the Quality of Agricultural Production Potential
The analysis of agricultural production potential also requires an assessment based on qualitative indicators. In the context of the Mercosur countries, the scale of pesticide use (measured by the consumption of active substances in plant protection products) is particularly important. Farmers in these countries are not required to comply with many of the production-related standards that apply to EU farmers [81]. Hence, farmers in Mercosur countries are able to produce food more cheaply. In particular, the use of many pesticides banned in the EU — which contribute to higher yields — is still permitted in Mercosur countries. Brazil, for example, uses around 3,670 types of pesticides, about 30% of which have been banned in Europe for nearly two decades [82]. Approximately 60% of all plant protection products used in Brazil are herbicides, while the remaining 40% is split roughly evenly between fungicides and insecticides. The five main crops — soybeans, maize, cotton, sugarcane, and green pastures — account for 87% of Brazil’s total pesticide use, with soybeans alone responsible for 54% of all pesticides applied in the country. This is due not only to the vast area under cultivation of this crop, but also to the widespread use of zero-tillage farming, where site preparation for sowing is limited to chemical weed control, and to the popularity of genetically modified (GMO) varieties resistant to herbicides. It is worth noting that although many GMO varieties are resistant to pests, this resistance does not extend to all pest species, necessitating the continued use of insecticides. Several fungicide treatments are also routinely applied [83]. According to the Brazilian Institute of Environment and Renewable Natural Resources (IBAMA), the most commonly used pesticides in Brazil in 2022 included glyphosate, 2,4-D, atrazine, mancozeb, acephate, chlorothalonil, diquat, glufosinate ammonium, chlorpyrifos, methomyl, and paraquat. Of these products, only the first two are authorised for use in the EU [83].
FAO data [84] show that 800.7 thousand tons of active substances contained in pesticides were used in Brazil alone in 2023, compared with only 292.3 thousand tons in the EU-27. The most commonly sold active substance in Brazil was glyphosate, with 253.3 thousand tons sold [83]. In the EU, glyphosate is permitted but only under specific conditions. More than 40% of the pesticides sold in Brazil were classified as Class II (very hazardous to the environment), and over half as Class III (hazardous). This record level of pesticide use is sometimes referred to as “agrotoxicity” [82]. The sales figures are consistent with statistics on pesticide application per hectare (Figure 2). In 2023, 12.6 kg of active substance per hectare was applied in Brazil and 6.33 kg/ha in Argentina, compared with 1.73 kg/ha in Poland and 2.67 kg/ha in the EU [84].
The differences in production standards between Mercosur countries and the EU are well illustrated by statistics on the amount of authorised active substances and the maximum residue limits (MRLs) for these substances [85]. In addition to the aforementioned 30% of active ingredients used in Brazil that have been banned in the EU, it should be noted that the maximum residue limits (MRLs) allowed in agricultural products are significantly higher in Mercosur countries than in the EU (Table 9) [25]. They range from 10 times higher levels for glyphosate in coffee to 400 times higher thresholds for other pesticides, such as malathion in beans.
EU countries also have a different approach to genetically modified (GM) crops than Mercosur countries. In the EU, it is possible to grow only one GM crop — maize — and only in Spain and Portugal. The Mercosur countries, in turn, are global leaders in terms of GM crop acreage. In 2024, Mercosur countries account for 46.5% of the global GM crop area (97.6 million hectares) [86]. Brazil has the second-largest area under GM crops in the world, after the United States, and Argentina the third largest.
The EU therefore applies double standards in the area of pesticide regulations [81,87]. On the one hand, the use of many active substances is banned in the EU (e.g. atrazine, mancozeb, chlorpyrifos). On the other hand, pesticides containing these active substances continue to be produced and exported within the EU. Mercosur countries are among the main recipients of these products. In other words, EU countries export pesticides to Mercosur while importing agricultural products from Mercosur that were cultivated using pesticides banned in the EU.
5. Discussion
An analysis of the production potential of Mercosur agriculture indicates a significant risk of increased competition on the EU agri-food market following the entry into force of the EU–Mercosur Partnership Agreement. Mercosur countries are less well endowed with fixed assets but make better use of them. The value of net fixed assets (e.g. machinery, equipment) per employee in the EU is more than eight times higher than in Mercosur, and per hectare of agricultural land as much as sixteen times higher. However, capital productivity — i.e. value added per USD of net fixed assets — is around 3.5 times higher in Mercosur than in the EU. Lower capital expenditures translate into lower unit production costs, allowing food to be offered at more competitive prices. In this context, the advantage of the Mercosur countries lies not only in higher production efficiency, but also in lower production costs resulting from less regulatory pressure, cheaper labour, lower fuel prices, and less stringent environmental standards.
Hence, it can be expected that the liberalisation of tariffs under the agreement will contribute to an increase in imports of agri-food products from Mercosur to the EU, as indicated by numerous previous studies [8,22,63,72]. However, there will not be an uncontrolled influx of food, as the regulations adopted in the agreement are designed to prevent this [19]. First, transitional periods of up to several years have been introduced for the import of most products from Mercosur into the EU. Second, the target volumes of preferential quotas for the import of certain sensitive products into the EU are to be reached only after several years of the contractual period. Third, a number of products sensitive to the EU agri-food sector have been excluded from liberalisation. This means that once the agreement enters into force, the conditions for importing these products from Mercosur into the EU will remain unchanged. Finally, the agreement provides for the possibility of activating a bilateral safeguard mechanism [23], and the European Commission also advocates the establishment of a specific bilateral safeguard for agri-food products [19].
Much of the debate in public discussion centres on the duty-free or preferential tariff quotas granted to Mercosur countries for imports into the EU. These mainly concern products that are characterised both by the strong production potential of the Mercosur countries and by their high sensitivity from the point of view of the EU agri-food sector. These include beef, poultry, sugar, and ethanol [23]. Most analyses to date indicate that these tariff quotas will provide sufficient protection for the EU’s sensitive sectors [22,63,88,89]. The European Commission also argues that the target volumes of the preferential or duty-free quotas — which normally apply from the sixth year of the contractual period (and, in the case of dairy products, from the eleventh year) represent a negligible proportion of total EU production of the products concerned. For example, the quota of 99 thousand tons carcass weight equivalent (cwe) of Mercosur beef imports into the EU provided for in the agreement represents only 1.5% of EU beef production and less than half of current EU beef imports from Mercosur countries (206 thousand tons cwe in 2024). However, farmers argue that the most valuable cuts — e.g. sirloin, entrecôte, and beefsteak — will be imported from Mercosur countries, and that the share of preferential imports in this segment will be much higher, potentially reaching several percent.
As much as three-fourths of the agricultural area in Mercosur countries consists of permanent grassland. This farmland structure favours the development of livestock production, in particular beef and dairy production — sectors that are important for international trade and highly sensitive within EU agriculture. Permanent grassland can also be converted into arable land and used to grow crops such as sugarcane and soybeans, for which demand may increase after the agreement enters into force [58]. Nonetheless, some authors argue that the liberalisation of tariffs and the expansion of export-oriented production of certain commodities in Mercosur countries may contribute to increased deforestation [24,90,91] and higher greenhouse gas emissions [26,92]. The EU Deforestation Regulation (EUDR) [93], which will also apply to products imported from Mercosur after the agreement enters into force, is intended to combat deforestation [94]. From the end of 2025, only deforestation-free products will be allowed to enter the EU market, including soybeans, beef, palm oil, timber, cocoa, coffee, and rubber. The EU is the world’s second-largest importer of emissions embedded in tropical land conversion and associated activities, surpassed only by China. Brazil is the largest single exporter of agricultural products to the EU, with imports from Brazil accounting for around 30% of the EU’s total embedded deforestation between 2005 and 2017 [95,96].
The differences in crop and livestock production standards — particularly regarding sustainability — between the two trade blocs are clearly illustrated by the greater use of pesticides in Mercosur countries compared to the EU. Farmers in Mercosur countries are not required to comply with a set of such standards, whereas EU farmers must adhere to them. Hence, farmers in Mercosur countries are able to produce food more cheaply. Although the agreement contains numerous obligations for both parties in terms of environmental protection and labour rights, it does not provide for strict enforcement mechanisms or hard sanctions for non-compliance [21]. In practice, therefore, trade liberalisation may lead to price pressures on the EU food market and to a widening of the structural disparities between European and South American agriculture [20]. In response, some have proposed including mirror clauses in free trade agreements (FTAs) [97,98]. Such a clause would require that products imported into the EU meet the same environmental, sanitary, and production standards as goods produced within the EU. This is intended to ensure fair competition and protect the EU’s high quality and sustainability standards. The lack of effective enforcement mechanisms for sustainable development is sometimes seen as a shortcoming in the EU’s model for negotiating FTAs [95,96].
However, it is important to stress that, regardless of production standards in the Mercosur countries, under general EU trade rules, any product imported into the EU must meet the strict food safety standards that also apply to producers operating within the single European market. The EU–Mercosur Partnership Agreement does not alter this requirement, as food safety and animal and plant health standards are non-negotiable [3,99]. The EU also retains the right to set maximum residue limits for pesticides and to maintain a strict approach to genetically modified organisms (GMOs). The agreement explicitly upholds the precautionary principle, which allows a product to be denied access to the EU market even if scientific evidence regarding its safety remains inconclusive [23].
6. Summary and Conclusions
The analysis leads to several conclusions. First, the Mercosur countries possess nearly 2.5 times more agricultural land than the EU, but a comparable area of arable land. Almost three-fourths of agricultural land in Mercosur consists of permanent grassland (compared to less than one-third in the EU). The high share of pastures may favour the development of livestock production, particularly beef and dairy production — sectors that are important for international trade and highly sensitive from the perspective of EU agriculture. Permanent grassland can also be converted into arable land and used for the cultivation of crops such as sugarcane and soybeans, for which demand in the EU may increase after the agreement enters into force.
Second, agriculture in the Mercosur countries is extensive in nature and highly land intensive. The average agricultural area per person employed in agriculture in Mercosur is almost twice as large as in the EU. At the same time, the value of net capital per hectare of agricultural land in Mercosur amounts to only one-tenth of the level observed in the EU, indicating lower mechanisation and a lower level of technological advancement.
Third, EU agriculture is characterised by high capital intensity and productivity. The value of net fixed assets per person employed in agriculture is several times higher than in Mercosur countries. EU agriculture also exhibits significantly higher land and labour productivity: the value added per hectare of agricultural land is more than four times higher than in Mercosur countries, and the value added per person employed more than twice as high. This results from a high level of mechanisation and the use of modern technologies.
Fourth, the production potential of Mercosur agriculture — stemming from its vast land resources, low labour costs, export-oriented specialisation, and less restrictive regulations on sustainable production and trade — poses a risk of increased competition and price pressure on the EU agri-food market after the EMPA enters into force. This applies in particular to certain sensitive products such as beef, poultry, ethanol, and sugar. However, a flood of cheaper agri-food products from Mercosur countries that do not meet EU food safety standards should not be expected, as the mechanisms included in the agreement are designed to prevent this.
Fifth, considerable controversy arises from the differing crop and livestock production standards, particularly those relating to sustainability. A clear example is the difference in pesticide use between Mercosur and EU countries. Approximately 30% of the pesticides used in Brazil have been banned in Europe for nearly two decades. Moreover, the maximum residue limits (MRLs) allowed in agricultural products are much higher in Mercosur countries than in the EU. The EU thus applies double standards in the area of pesticides: on the one hand, the use of many active substances is banned within the EU, while on the other, pesticides containing these substances continue to be produced and exported.
It is also worth noting that the balance of benefits and costs resulting from the EMPA should be assessed from the perspective of the entire EU economy as well as the individual economies of the Member States. The benefits and costs are unevenly distributed across countries and sectors. It can be expected that for the EU agri-food sector — including Poland — the overall balance will be rather negative, although the scale of this negative impact will likely be relatively small. Moreover, some branches of the agri-food sector, such as dairy producers and producers of products with geographical indications, may actually benefit from the agreement.
The EMPA has significance that goes beyond trade. Equally important are the geopolitical benefits, which cannot be easily quantified. The agreement may become a tool for deepening interregional cooperation and serves the strategic interests of both blocs amid growing pressure from China and Russia and increasing protectionism in the United States. Particularly relevant in the context of the EU’s energy transition is access to South American rare earth metals.
The analysis also highlights the need for continuous monitoring of EU agri-food markets after the agreement enters into force, as liberalisation will contribute to increased imports of certain products from Mercosur to the EU. Early identification of emerging imbalances would make it possible to apply the safeguard mechanisms provided for in the agreement, thereby minimising losses for EU agricultural producers.
The main limitation of this study lies in its focus on comparing the two blocs as whole entities — the 27 EU Member States on the one hand and the four Mercosur countries on the other. In reality, the countries within these groupings differ in terms of their agricultural production potential. It would therefore be valuable to conduct more detailed research that takes into account this intra-regional diversity.
Author Contributions
Conceptualization, I.S. and Ł.A.; methodology, Ł.A., I.S. and O.K.; software, I.S., Ł.A. and O.K.; validation, I.S. and Ł.A.; formal analysis, I.S., Ł.A. and O.K.; investigation, I.S., Ł.A., O.K. and A.Z.; resources, Ł.A., O.K. and A.Z.; data curation, Ł.A., O.K. and A.Z.; writing—original draft preparation, Ł.A., O.K. and A.Z.; writing—review and editing, I.S. and Ł.A.; visualization, Ł.A., O.K. and A.Z.; supervision, I.S. and Ł.A.; project administration, I.S.; funding acquisition, I.S. and Ł.A. All authors have read and agreed to the published version of the manuscript.
Funding
The article processing charge (APC) was funded by the National Support Centre for Agriculture (KOWR) under contract No. CEN.BDG.WP.6515.2.2025.EJ.57.
Institutional Review Board Statement
Not applicable.
Informed Consent Statement
Not applicable.
Data Availability Statement
Data available in a publicly accessible repository that does not issue DOIs Publicly available datasets were analyzed in this study. This data can be found here: https://www.fao.org/faostat/en/#data.
Acknowledgments
The study is the result of cooperation between researchers from the Institute of Agricultural and Food Economics—National Research Institute, Warsaw, Poland.
Conflicts of Interest
The authors declare no conflicts of interest.
References
- Balogh, J.M.; Borges Aguiar, G.M. Determinants of Latin American and the Caribbean Agricultural Trade: A Gravity Model Approach. Agric. Econ.–Czech 2022, 68, 127–136. [Google Scholar] [CrossRef]
- WITS-Comtrade database. Available online: https://wits.worldbank.org/ (accessed on 8 October 2025).
- Krzyzanowski, J.T. The EU–Mercosur Agreement in Agriculture, Opportunities and Threats for European Producers. Eur. Res. Stud. J. 2025, 28, 272–294. [Google Scholar] [CrossRef]
- Zolotnytska, Y.; Krzyżanowski, J.; Wigier, M.; Krupin, V.; Wojciechowska, A. Food Security Strategy for Mercosur Countries in Response to Climate and Socio-Economic Challenges. Sustainability 2025, 17, 7280. [Google Scholar] [CrossRef]
- Ayuda, M.-I.; Belloc, I.; Pinilla, V. Latin American Agri-Food Exports, 1994–2019: A Gravity Model Approach. Mathematics 2022, 10, 333. [Google Scholar] [CrossRef]
- zu Ermgassen, E.K.H.J.; Godar, J.; Lathuillière, M.J.; Löfgren, P.; Gardner, T.; Vasconcelos, A.; Meyfroidt, P. The origin, supply chain, and deforestation risk of Brazil’s beef exports. Proc. Natl. Acad. Sci. U.S.A. 2020, 117, 31770–31779. [Google Scholar] [CrossRef]
- Nunes, C.L. de C.; Pflanzer, S.B.; Rezende-de-Souza, J.H.; Chizzotti, M.L. Beef production and carcass evaluation in Brazil. Anim. Front. 2024, 14, 15–20. [Google Scholar] [CrossRef]
- Buczinski, B.; Chotteau, P.; Duflot, B.; Rosa, A. The EU–Mercosur Free Trade Agreement, Its Impacts on Agriculture; Institut de l’Élevage: May 2023. Available online: https://www.greens-efa.eu/files/assets/docs/mercosur_en_study.pdf (accessed on 2 October 2025).
- Echaide, J. Environmental Impacts of the Agreement Between the European Union and Mercosur. J. Law Stud. 2022, 27, 166–188. [Google Scholar] [CrossRef]
- Zdráhal, I.; Hrabálek, M.; Bečvářová, V. Assessing the Agricultural Trade Complementarity of Mercosur and the European Union. In Agrarian Perspectives XXIX: Trends and Challenges of Agrarian Sector; Tomšík, K., Ed.; Czech University of Life Sciences: Prague, Czech Republic, 2020; pp. 418–425. [Google Scholar]
- Hubbard, C.; Alvim, A.M.; de Mattos, E.J.; Hubbard, L. Agri-food Trade Between Brazil and the EU. EuroChoices 2017, 16, 11–16. [Google Scholar] [CrossRef]
- Baur, A.; Flach, L.; Teti, F. Integration of Mercosur in the Global Economy; EconPol Policy Report, No. 43; CESifo GmbH: Munich, Germany, 2023; Available online: https://www.econstor.eu/handle/10419/279758 (accessed on 2 October 2025).
- European Commission. EU and Mercosur Reach Political Agreement on Groundbreaking Partnership; Press Release, Brussels, Belgium, 6 December 2024. Available online: https://https://ec.europa.eu/commission/presscorner/detail/en/ip_24_6244 (accessed on 3 October 2025).
- de Sadeleer, N. The Draft EU–Mercosur Agreement: Drawing the Dividing Line Between Policy Cooperation and Trade. Eur. J. Risk Regul. 2025, 1–12. [Google Scholar] [CrossRef]
- Del Pupo, E. Politicisation and Agricultural (Post-)Exceptionalism in EU–Mercosur Association Agreement Negotiations. J. Common Mark. Stud. 2025, 1–21. [Google Scholar] [CrossRef]
- Pose-Ferraro, N. Between Geopolitics and Political Economy: The European Union–Mercosur Negotiation to Form a Trade Agreement. J. Common Mark. Stud. 2025, 1–20. [Google Scholar] [CrossRef]
- Lehmen, A.; Vidigal, G. Trade and Environment in EU–Mercosur Relations: Negotiating in the Shadow of Unilateralism. Eur. Foreign Aff. Rev. 2025, 30(SI), 87–114. [Google Scholar] [CrossRef]
- Caetano, G.; Pose, N. European Union and Mercosur: Prospects of an Agreement in the Current Geopolitical Climate. Revista CIDOB d’Afers Internacionals 2023, 135, 221–246. [Google Scholar] [CrossRef]
- European Commission. Proposal for a Council Decision on the Conclusion, on Behalf of the European Union, of the Interim Agreement on Trade between the European Union, of the One Part, and the Common Market of the South, the Argentine Republic, the Federative Republic of Brazil, the Republic of Paraguay and the Oriental Republic of Uruguay, of the Other Part, COM(2025) 339 final; Brussels, Belgium, 3 September 2025. Available online: https://eur-lex.europa.eu/legal-content/EN/TXT/?uri=celex:52025PC0339 (accessed on 4 October 2025).
- Szajner, P.; Pawłowska-Tyszko, J.; Łopaciuk, W.; Kosior, K. Sustainable Concentration in the Polish Food Industry in the Context of the EU-MERCOSUR Trade Agreement. Sustainability 2025, 17, 5640. [Google Scholar] [CrossRef]
- Rudloff, B.; Stoll, P.-T.; Mensah, K.; Ahmad, Z.; Sultan, S. A Comprehensive Analysis of the Updated Trade Part of the EU–Mercosur Partnership Agreement; European Parliament: Brussels, 2025; Available online: https://www.europarl.europa.eu/RegData/etudes/STUD/2025/754477/EXPO_STU(2025)754477_EN.pdf (accessed on 4 October 2025).
- Hagemejer, J.; Stoll, P.-T.; Rudloff, B.; Mensah, K. An Update on the Economic, Sustainability and Regulatory Effects of the Trade Part of the EU–Mercosur Partnership Agreement; European Parliament: Brussels, Belgium, 2025; Available online: https://www.europarl.europa.eu/RegData/etudes/STUD/2025/754476/EXPO_STU%282025%29754476_EN.pdf (accessed on 7 October 2025).
- Dupré, M.; Kpenou, S. Key Insights into the Final EU–Mercosur Agreement; Veblen Institute: Paris, France, 2025; Available online: https://www.veblen-institute.org/Key-Insights-into-the-Final-EU-Mercosur-Agreement.html (accessed on 4 October 2025).
- Rausch, L.L.; Gibbs, H.; Schelly, I.; Brandão Jr., A.; Morton, D.; Carneiro Filho, A.; Strassburg, B.; Walker, N.; Noojipady, P.; Barreto, P.; Meyer, D. Soy Expansion in Brazil’s Cerrado. Conserv. Lett. 2019, 12, e12671. [Google Scholar] [CrossRef]
- Adinolfi, F.; Fargione, R.; Conti, V.; Vivani, D. Mercosur: Environmental, social and health regulations too far apart that recall the principle of ‘reciprocity’, 2024. Available online: https://www.divulgastudi.it/wp-content/uploads/2024/04/Paper-18-Mercosur-ENG.pdf (accessed on 4 October 2025).
- Meyfroidt, P.; Börner, J.; Garrett, R.; Gardner, T.; Godar, J.; Kis-Katos, K.; Soares-Filho, B.S.; Wunder, S. Focus on leakage and spillovers: informing land-use governance in a tele-coupled world. Environ. Res. Lett. 2020, 15, 090202. [Google Scholar] [CrossRef]
- Ferrari, E.; Elleby, C.; De Jong, B.; M’barek, R.; Dominguez, I.P. Cumulative Economic Impact of Upcoming Trade Agreements on EU Agriculture: Update 2024; Publications Office of the European Union: Luxembourg, Belgium, 2024. [Google Scholar] [CrossRef]
- Ambroziak, Ł.; Produkty rolno-spożywcze w umowie UE–Mercosur [Agri-food products in the EU-Mercosur agreement]. Obserwator Finansowy, 21 Nov 2024. Available online: https://www.obserwatorfinansowy.pl/tematyka/makroekonomia/trendy-gospodarcze/produkty-rolno-spozywcze-w-umowie-ue-mercosur/ (accessed on 8 October 2025).
- Poczta, W. , Kołodziejczak, M. Potencjał produkcyjny rolnictwa polskiego i efektywność gospodarowania w aspekcie integracji z Unią Europejską [The production potential of Polish agriculture and management efficiency in the context of integration with the European Union]; Wydawnictwo Akademii Rolniczej im. A. Cieszkowskiego w Poznaniu: Poznań, Poland, 2004. [Google Scholar]
- Pawlak, K.; Smutka, L.; Kotyza, P. Agricultural Potential of the EU Countries: How Far Are They from the USA? Agriculture 2021, 11, 282. [Google Scholar] [CrossRef]
- Szczepaniak, I.; Szajner, P.; Łopaciuk, W. An Assessment of the Production Potential and Food Self-Sufficiency of Ukraine against the Background of the European Union and Poland. Sustainability 2024, 16, 7735. [Google Scholar] [CrossRef]
- Schultz, T.W. Transforming Traditional Agriculture; Yale University Press: New Haven, USA, 1964. [Google Scholar]
- Hayami, Y.; Ruttan, V.W. Agricultural Development: An International Perspective; Johns Hopkins University Press: Baltimore, USA, 1985. [Google Scholar]
- FAO. Agro-Ecological Zones (AEZ) Methodology—Overview; FAO: Rome, Italy, 2020. [Google Scholar]
- OECD. Agricultural Productivity and Innovation: Measuring Potential; OECD Publishing: Paris, France, 2019. [Google Scholar]
- World Bank. Enabling the Business of Agriculture 2021; World Bank: Washington, D.C., USA, 2021. [Google Scholar]
- Fischer, G.; Nachtergaele, F.; Prieler, S.; van Velthuizen, H. Global Agro-Ecological Zones (GAEZ v4); FAO/IIASA: Rome/Laxenburg, 2020. [Google Scholar] [CrossRef]
- IUNG-PIB. Waloryzacja Rolniczej Przestrzeni Produkcyjnej Polski; IUNG-PIB: Puławy, Poland, 2021. [Google Scholar]
- Coelli, T.; Rao, D.S.P.; O’Donnell, C.; Battese, G. An Introduction to Efficiency and Productivity Analysis; Springer: New York, USA, 2005. [Google Scholar]
- Färe, R.; Grosskopf, S.; Norris, M.; Zhang, Z. Productivity Growth, Technical Progress, and Efficiency Change in Industrialized Countries. Am. Econ. Rev. 1994, 84, 66–83. [Google Scholar]
- Nowak, A. , Różańska-Boczula, M. Differentiation in the production potential and efficiency of farms in the member states of the European Union. Agric. Econ. - Czech. 2019, 65, 395–403. [Google Scholar] [CrossRef]
- Fuglie, K.; Rada, N. Resources, Policies, and Agricultural Productivity in Sub-Saharan Africa; USDA ERS Economic Research Report 145, 2013.
- FAOSTAT Data. Available online: https://www.fao.org/faostat (accessed on 25 October 2025).
- Wilkin, J. Ekonomia Polskiego Rolnictwa—Między Efektywnością a Sprawiedliwością Społeczną [The Economics of Polish Agriculture—Between Efficiency and Social Justice]; Scholar: Warszawa, Poland, 2018. [Google Scholar]
- Rembisz, W. Potencjał i Efektywność Rolnictwa w Procesie Rozwoju [Potential and Efficiency of Agriculture in the Development Process]; SGH: Warszawa, Poland, 2020. [Google Scholar]
- Prus, P.; Dziekański, P.; Bogusz, M.; Szczepanek, M. Spatial Differentiation of Agricultural Potential and the Level of Development of Voivodeships in Poland in 2008–2018. Agriculture 2021, 11, 229. [Google Scholar] [CrossRef]
- Kryszak, Ł.; Matuszczak, A. Determinants of Farm Income in the European Union in New and Old Member States: A Regional Study. Ann. PAAAE 2019, No. 3, 200–211. [Google Scholar] [CrossRef]
- Mostafiz, R. B.; Noguchi, R.; Ahamed, T. “Agricultural Land Suitability Assessment Using Satellite Remote Sensing-Derived Soil-Vegetation Indices”. Land 2021, 10, 223. [Google Scholar] [CrossRef]
- Jabkowski, D.A. Conditions for the Competitiveness of the Agricultural Sector in the EU, Japan, Canada, Vietnam, and Mercosur Countries. Zagadnienia Ekonomiki Rolnej/Probl. Agric. Econ. 2023, 374, 42–61. [Google Scholar] [CrossRef]
- Tłuczak, A. Diversity of the selected elements of agricultural potential in the European Union countries. Agric. Econ. Czech. 2020, 66, 260–268. [Google Scholar] [CrossRef]
- Smędzik-Ambroży, K.; Sapa, A. Efficiency and technical progress in agricultural productivity in the European Union. Res. Pap. Wrocław Univ. Econ. 2019, 63, 115–126. [Google Scholar] [CrossRef]
- Guth, M.; Smędzik-Ambroży, K. Economic resources versus the efficiency of different types of agricultural production in regions of the European Union. Econ. Res. Ekon. Istraživanja 2020, 33, 1036–1051. [Google Scholar] [CrossRef]
- Baráth, L.; Fertö, I. Productivity and Convergence in European Agriculture. J. Agric. Econ. 2017, 68, 228–248. [Google Scholar] [CrossRef]
- Floriańczyk, Z.; Rembisz, W. Changes in Production Factor Relations and Their Determinants in Agriculture in Selected European Union Countries. Zagadnienia Ekonomiki Rolnej/Probl. Agric. Econ. 2023, 377, 26–51. [Google Scholar] [CrossRef]
- Suproń, B.; Łącka, I. Impact of the COVID-19 Pandemic on Agriculture in the Visegrad Countries: Results of an Empirical and Econometric Analysis. Zagadnienia Ekonomiki Rolnej/Probl. Agric. Econ. 2024, 381, 96–127. [Google Scholar] [CrossRef]
- Maria, C.; Corina, I. Characterization of the Romanian Agriculture in the Current European Context. In Vision 2020: Sustainable Economic Development, Innovation Management, and Global Growth, Vols I–IX; Soliman, K.S., Ed.; Business Information Management Association: Madrid, Spain, 2017; pp. 5123–5135. [Google Scholar]
- Grytz, V.K.; Guero, I.R. The Use of International Trade Mechanisms by the Brazilian Agribusiness. Glob. Trade Cust. J. 2023, 18, 21–30. [Google Scholar] [CrossRef]
- Mercado Cordova, J.A.; Koo, Y. Trade-Induced Land-Use Transitions and Greenhouse Gas Emissions: The Case of the EU-Mercosur Free-Trade Agreement. J. Clean. Prod. 2023, 429, 139327. [Google Scholar] [CrossRef]
- Li, T.; Ormeño Candelario, V.; Chen, X. Assessing Agricultural Green Total Factor Productivity in Latin America. Agribusiness 2024, 1–14. [Google Scholar] [CrossRef]
- Franco-Solís, A.; Montania, C.V. Dynamics of Deforestation Worldwide: A Structural Decomposition Analysis of Agricultural Land Use in South America. Land Use Policy 2021, 109, 105619. [Google Scholar] [CrossRef]
- Baležentis, T.; Blancard, S.; Shen, Z.; Štreimikienė, D. Analysis of Environmental Total Factor Productivity Evolution in the European Agricultural Sector. Decis. Sci. 2021, 52, 483–511. [Google Scholar] [CrossRef]
- Palmieri, R.; Amice, C.; Amato, M.; Verneau, F. Beyond the Finish Line: Sustainability Hurdles in the EU–Mercosur Free Trade Agreement. Soc. Sci. 2024, 13, 362. [Google Scholar] [CrossRef]
- Gohin, A.; Matthews, A. The European Union–Mercosur Association Agreement: Implications for the EU Livestock Sector. J. Agric. Econ. 2025, 1–11. [Google Scholar] [CrossRef]
- Kirkpatrick, C.; George, C. Trade Sustainability Impact Assessment (SIA) of the Association Agreement under Negotiation between the European Community and Mercosur; Institute for Development Policy and Management, University of Manchester: Manchester, UK, 2009. [Google Scholar]
- LSE Consulting. Sustainability Impact Assessment in Support of the Association Agreement Negotiations between the European Union and Mercosur: Final Report; Publications Office of the European Union: Luxembourg, 2020; Available online: https://www.lse.ac.uk/business/consulting/reports/sia-in-support-of-the-association-agreement-negotiations-between-the-eu-and-mercosur (accessed on 8 October 2025).
- Latorre, M.C.; Yonezawa, H.; Olekseyuk, Z. El Impacto Económico del Acuerdo Unión Europea–Mercosur en España; Facultad de Estudios Estadísticos, Universidad Complutense de Madrid: Madrid, Spain, 2021. [Google Scholar]
- Hovmand, B.E.; Thelle, M.H.; Rytter Sunesen, E. Economic and Sustainability Impact Assessment for Ireland of the EU–Mercosur Trade Agreement; Department of Enterprise, Trade and Employment: Dublin, Ireland, 2021. [Google Scholar]
- Sinabell, F.; Grübler, J.; Reiter, O. Implications of the EU–Mercosur Association Agreement for Austria—A Preliminary Assessment; Austrian Institute of Economic Research (WIFO) and the Vienna Institute for International Economic Studies (wiiw), FIW Research Reports: Vienna, Austria, 2020. [Google Scholar]
- Carrico, C.; van Berkum, S.; Tabeau, A.; Jager, J.; Plaisier, N. Impacts of the EU–Mercosur Trade Agreement on the Dutch Economy; Wageningen Economic Research, Report 2020-65: Wageningen, The Netherlands, 2020. [Google Scholar]
- Ambec Commission. Dispositions et Effets Potentiels de la Partie Commerciale de l’Accord d’Association entre l’Union Européenne et le Mercosur en Matière de Développement Durable; Rapport au Premier Ministre: Paris, France, 2020. [Google Scholar]
- Swedish Board of Trade. Analys av Frihandelsdelen i Associeringsavtalet Mellan EU och Mercosur; Swedish Board of Trade: Stockholm, Sweden, 2020. [Google Scholar]
- Hagemejer, J.; Stoll, T.; Rudloff, B.; Woolcock, S.; Vieira, A.; Mensah, K.; Sidlo, K.; Maurer, A. Trade Aspects of the EU–Mercosur Association Agreement; Publications Office of the European Union: Luxembourg, 2021. [Google Scholar]
- Luderer, B.; Nollau, V.; Vetters, K. Mathematical Formulas for Economists; Springer Science & Business Media: Berlin/Heidelberg, Germany, 2009. [Google Scholar]
- FAOSTAT Data. Land Use. Available online: https://www.fao.org/faostat/en/#data/RL (accessed on 22 September 2025).
- FAOSTAT Data. Employment Indicators: Agriculture and agrifood systems. Available online: https://www.fao.org/faostat/en/#data/OEA (accessed on 22 September 2025).
- FAOSTAT Data. Capital Stock. Available online: https://www.fao.org/faostat/en/#data/CS (accessed on 23 September 2025).
- ILO. Statistics on wages. Available online: https://ilostat.ilo.org/topics/wages/ (accessed on 3 November 2025).
- GlobalPetrolPrices. com. Available online: https://www.globalpetrolprices.com/diesel_prices/ (accessed on 3 November 2025).
- FAOSTAT Data. Macro Indicators. Available online: https://www.fao.org/faostat/en/#data/MK (accessed on 29 September 2025).
- FAOSTAT Data. Crops and livestock products. Available online: https://www.fao.org/faostat/en/#data/QCL (accessed on 25 September 2025).
- Bombardi, L.M. Geography of Asymmetry: The Vicious Cycle of Pesticides and Colonialism in the Commercial Relationship between Mercosur and the European Union; Commissioned by The Left (European Parliament Group); The Left in the European Parliament: Brussels, Belgium, 2021; Available online: https://www.atlasdochao.org/wp-content/uploads/2022/07/mercosur-asymmetry-study-1.pdf (accessed on 29 October 2025).
- Pestycydy – Europejska hipokryzja. Available online: https://www.youtube.com/watch?v=QeCVpSJZoVg (accessed on 20 October 2025).
- IBAMA. Boletins anuais de produção, importação, exportação e vendas de agrotóxicos no Brasil 2023, Ministério do Meio Ambiente e Mudança do Clima, 2025. Availability online: https://www.gov.br/ibama/pt-br/assuntos/quimicos-e-biologicos/agrotoxicos/relatorios-de-comercializacao-de-agrotoxicos/relatorios-de-comercializacao-de-agrotoxicos#boletinsanuais (accessed on 3 November 2025). (accessed on 3 November 2025).
- FAOSTAT Data. Pesticide use. Available online: https://www.fao.org/faostat/en/#data/RP (accessed on 29 September 2025).
- Bombardi, L.M. A Geography of Agrotoxins Use in Brazil and Its Relations to the European Union; Vol. 1, 267 p.; Universidade de São Paulo: São Paulo, Brazil, 2019. [Google Scholar] [CrossRef]
- AgbioInvestor. Global GM Crop Area Review; April 2025. Available online: https://gm.agbioinvestor.com (accessed on 3 November 2025).
- Greenpeace. A Toxic Cocktail: The EU–Mercosur Deal Limes Reveal How European Pesticides Travel Around the World (and Back); 2025. Available online: https://www.greenpeace.de/publikationen/Report.%20A%20Toxic%20Cocktail.%20EU-Mercosur%20Deal.pdf (accessed on 10 October 2025).
- Ferrari, E.; Chatzopoulos, T.; Perez Dominguez, I.; Boulanger, P.; Boysen-Urban, K.; Himics, M.; M’barek, R. Cumulative Economic Impact of Trade Agreements on EU Agriculture. 2021 Update; Publications Office of the European Union: Luxembourg, 2021. [Google Scholar]
- Beckman, J.; Gale, F.; Lee, T. Agricultural Market Access under Tariff-Rate Quotas; Economic Research Report No. 279; U.S. Department of Agriculture, Economic Research Service: Washington, DC, USA, 2021. [Google Scholar]
- Arima, E.; Barreto, P.; Taheripour, F.; Aguiar, A. Dynamic Amazonia: The EU–Mercosur Trade Agreement and Deforestation. Land 2021, 10, 1243. [Google Scholar] [CrossRef]
- Gordeev, S.; Jelliffe, J.; Kim, D.; Steinbach, S. What Matters for Agricultural Trade? Assessing the Role of Trade Deal Provisions Using Machine Learning. Appl. Econ. Perspect. Policy 2025, 47, 1469–1506. [Google Scholar] [CrossRef]
- Campos, R.G.; Suárez-Varela, M.; Timini, J. The EU–Mercosur Trade Agreement and Its Impact on CO2 Emissions; Banco de España, Article 2/22: Madrid, Spain, 2022; Available online: https://ssrn.com/abstract=4021945 (accessed on 3 October 2025).
- European Union. Regulation (EU) 2023/1115 of the European Parliament and of the Council of 31 May 2023 on the Making Available on the Union Market as well as the Export from the Union of Certain Commodities and Products Associated with Deforestation and Forest Degradation (EUDR). Official Journal of the European Union 2023, L 150, 206–247. Available online: https://eur-lex.europa.eu/eli/reg/2023/1115/oj (accessed on 9 October 2025).
- Fuchs, R.; Raymond, J.; Winkler, K.; Rounsevell, M. The EU’s New Anti-Deforestation Law Has Severe Loopholes That Could Be Exploited by the Forthcoming EU–Mercosur Trade Agreement. Environmental Research Letters 2024, 19, 091005. [Google Scholar] [CrossRef]
- Cesar de Oliveira, S.E.M.; Visentin, J.C.; Pavani, B.F.; Branco, P.D.; de Maria, M.; Loyola, R. The European Union–Mercosur Free Trade Agreement as a Tool for Environmentally Sustainable Land Use Governance. Environ. Sci. & Policy 2024, 161, 103875. [Google Scholar] [CrossRef]
- Harrison, J.; Paulini, S. Reinventing Trade, Environment and Development Interlinkages: Lessons from the EU–Mercosur Association Agreement. J. Int. Econ. Law 2024, 27, 723–740. [Google Scholar] [CrossRef]
- Beckman, J.; Ivanic, M.; Jelliffe, J.; Arita, S. Adopt or Not Adopt? Mirror Clauses and the European Green Deal. Appl. Econ. Perspect. Policy 2022, 44, 2014–2033. [Google Scholar] [CrossRef]
- Gohin, A.; Matthews, A. Adding mirror clauses within the European Green Deal: Hype or hope? Appl. Econ. Perspect. Policy 2024, 46, 1103–1126. [Google Scholar] [CrossRef]
- Leśkiewicz, K. Safety of Animal Food Imported into the European Union in Light of the European Union–Mercosur Partnership Agreement. Przegląd Prawa Rolnego 2025, 36, 173–187. [Google Scholar] [CrossRef]
Figure 1.
Labour and energy costs in selected Mercosur and EU countries. Source: own elaborations based on [77,78].
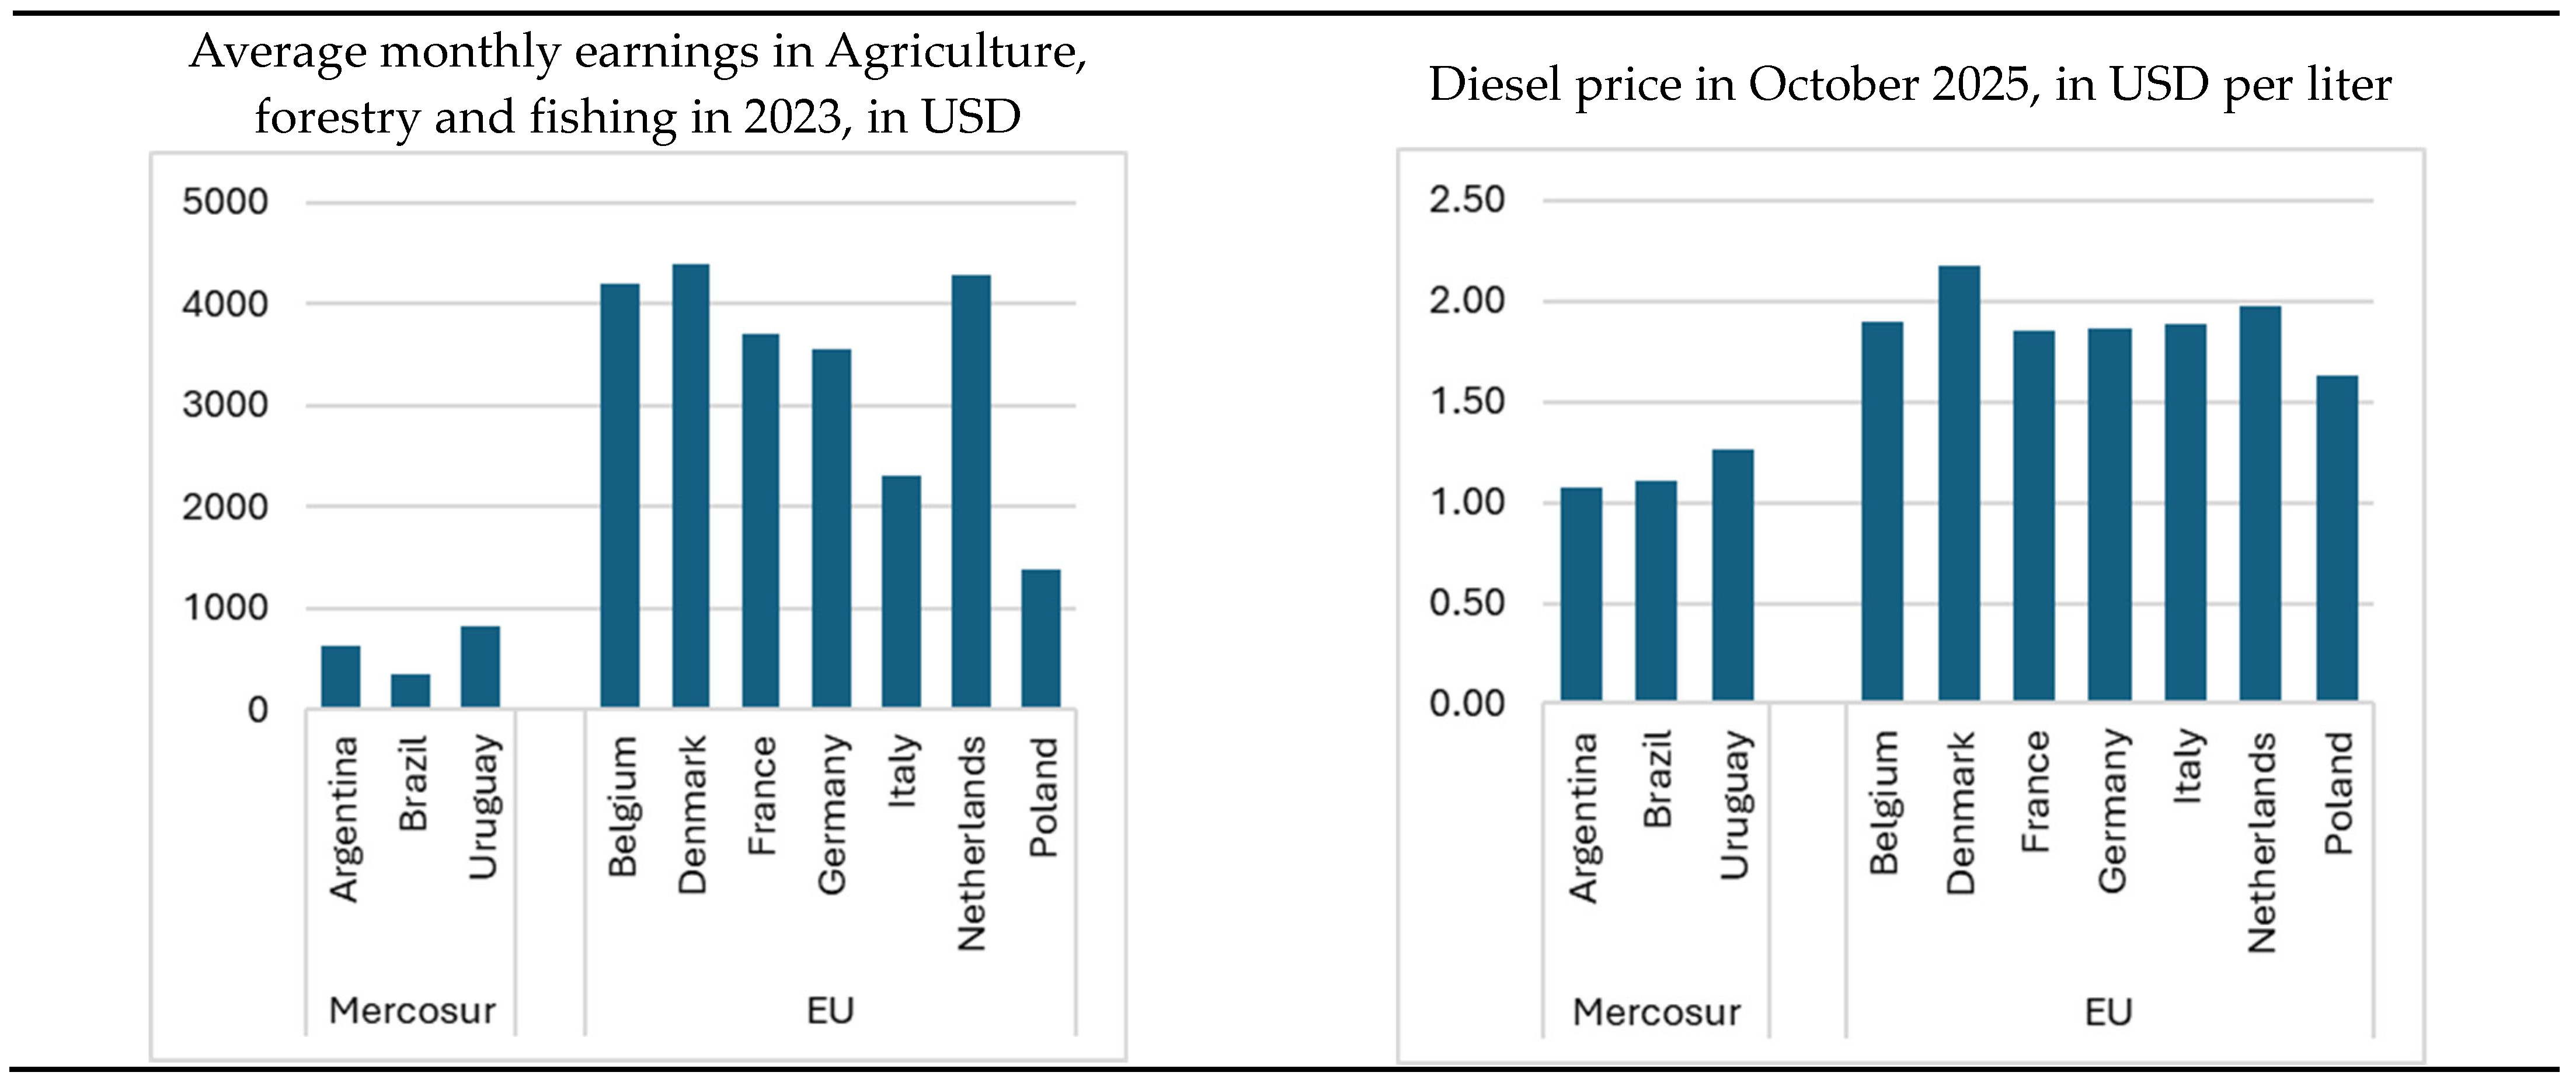
Figure 2.
Pesticide use in 2023, in kg of active substance per ha of agricultural land. Source: own elaborations based on [43].
Figure 2.
Pesticide use in 2023, in kg of active substance per ha of agricultural land. Source: own elaborations based on [43].
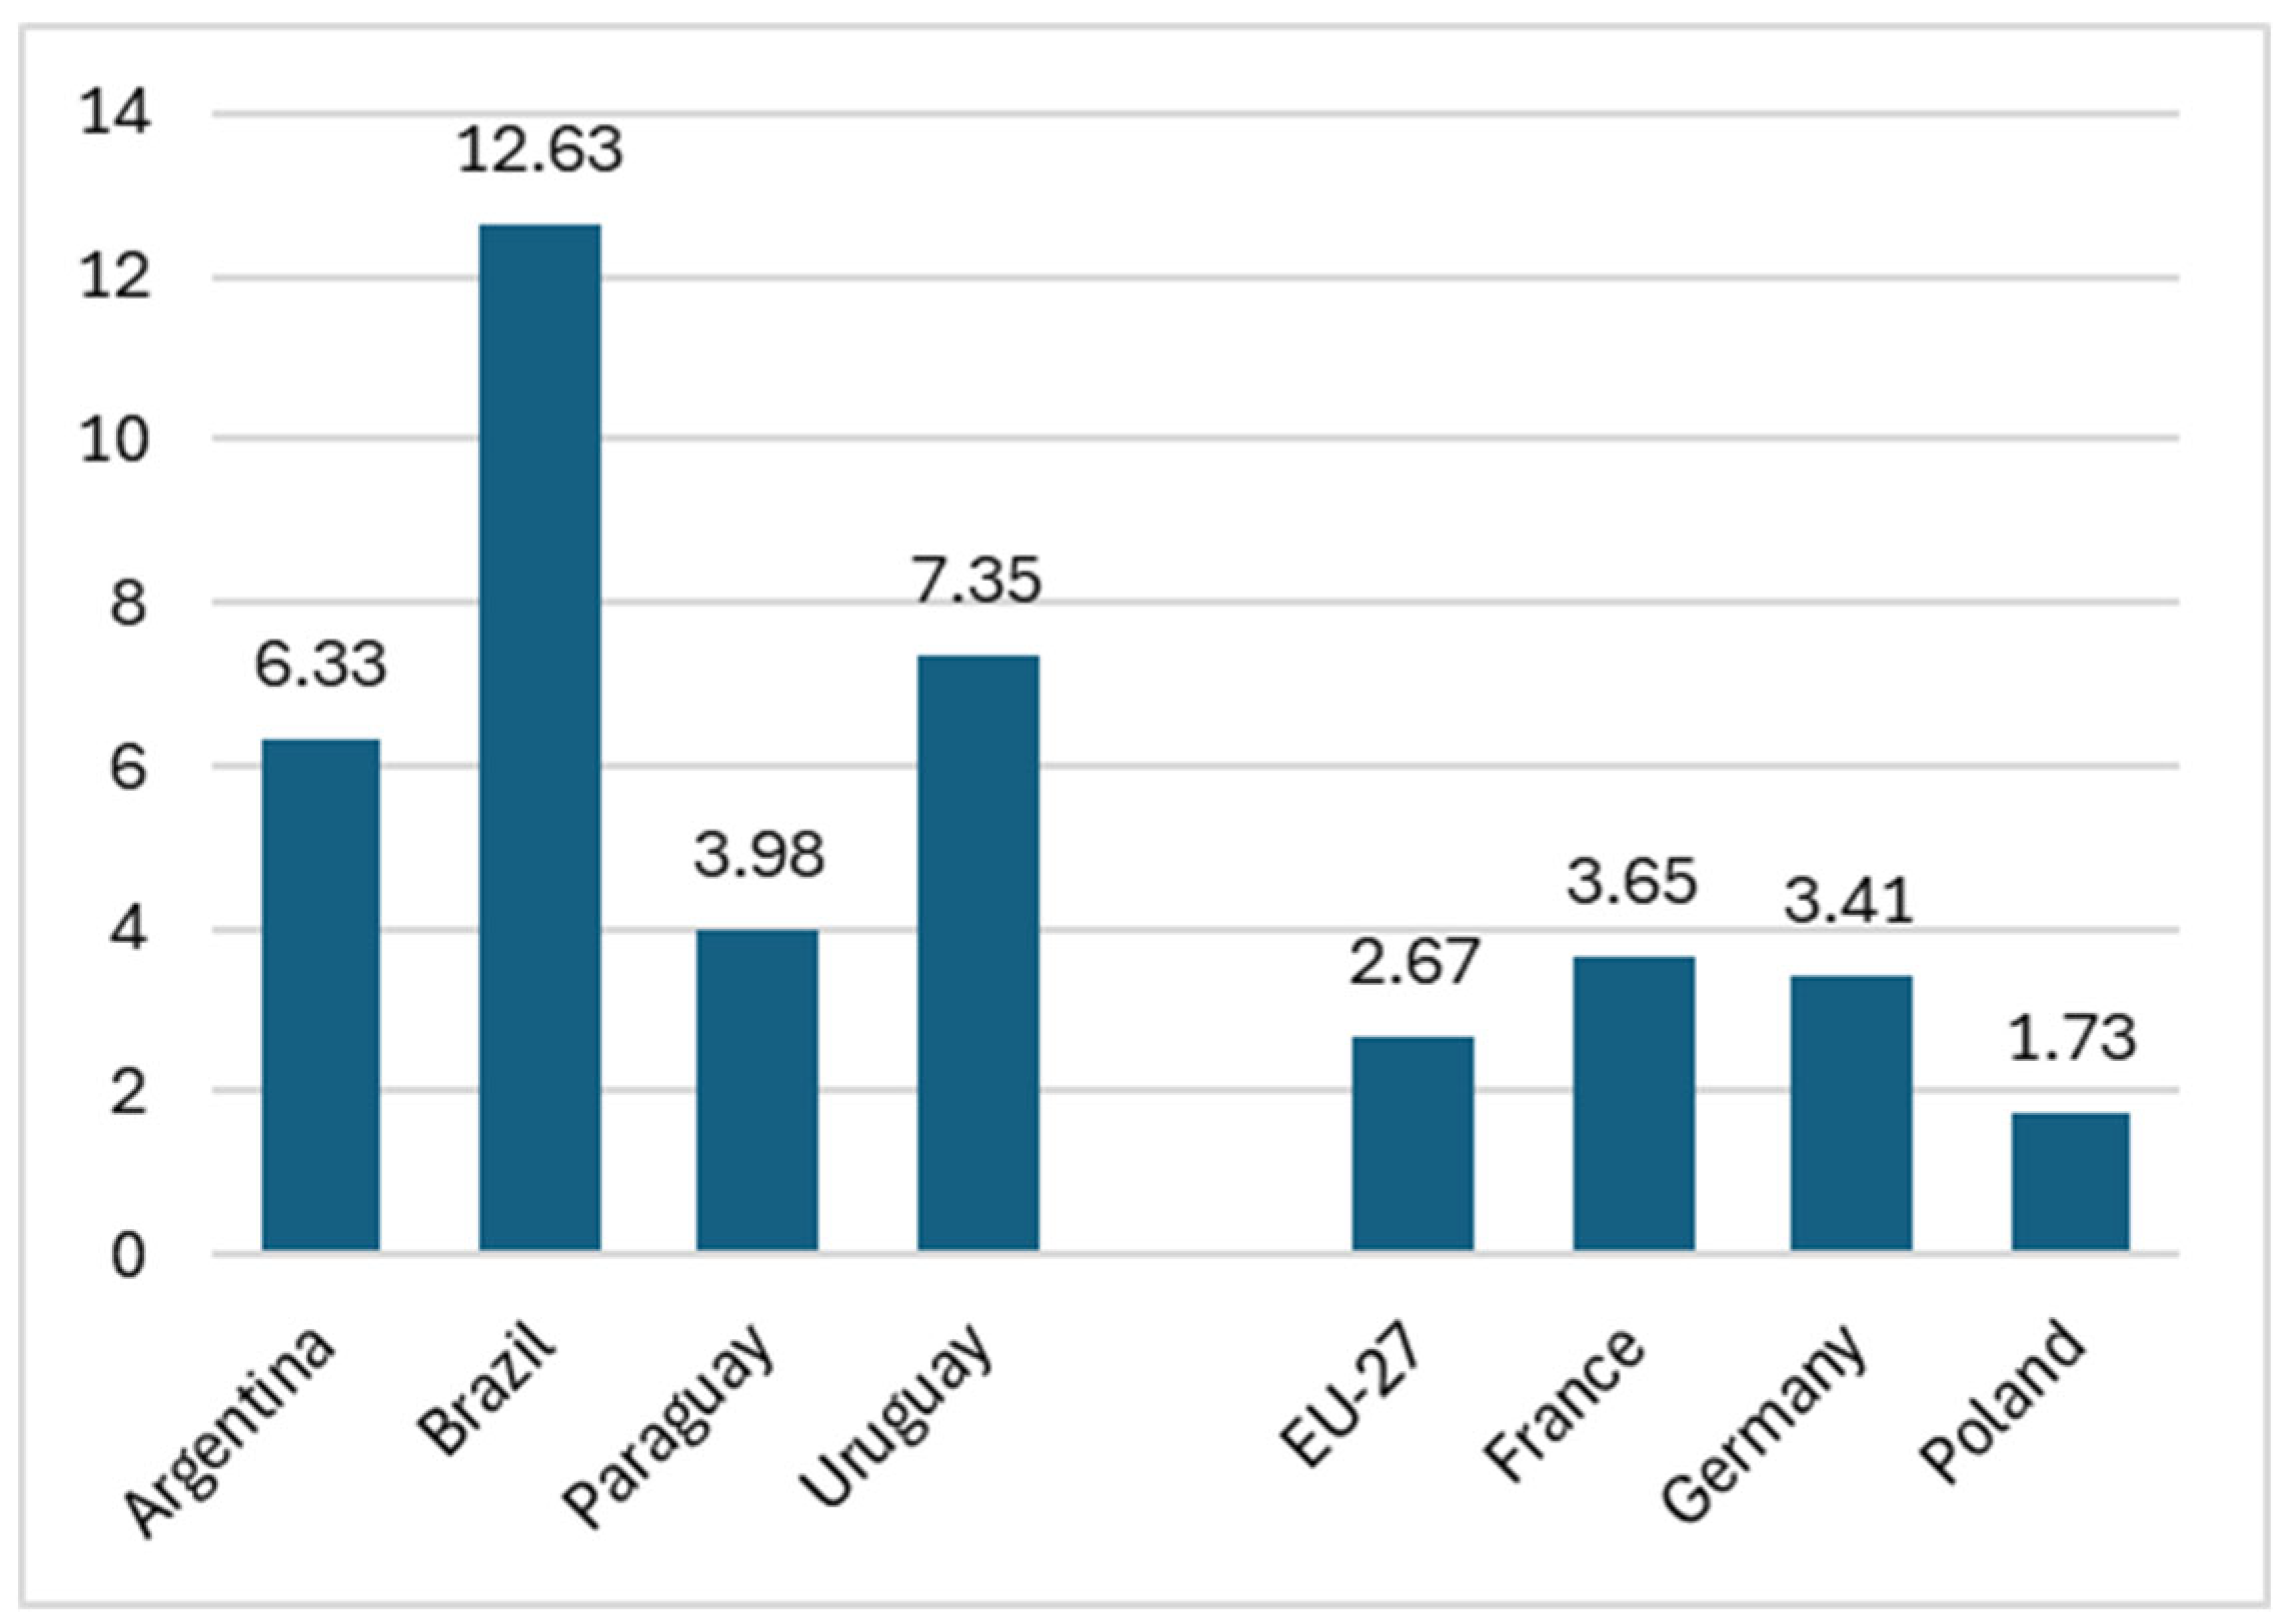

Table 1.
Indicators relating to agricultural production potential.
| Element of production potential | Description | |
|---|---|---|
| Production resources and factors |
Land | Utilised agricultural area (ha) |
| Area of arable land (ha) | ||
| Area of permanent crops (ha) | ||
| Area of permanent grassland (ha) | ||
| Labour | Number of emloyed person (by ILO methodology) (thousand people) |
|
| Capital | Net capital stock (USD million) | |
| Relations between production factors |
Land-Labour | Utilised agricultural area per employed person (ha per person) |
| Land-Labour | Arable land per employed person (ha per person) | |
| Labour-Land | Employed person per 100 ha UAA | |
| Capital-Labour | Net capital stock per employed person (USD thousand per person) |
|
| Capital-Land | Net capital stock per UAA (USD thousand per ha) | |
| Prices of production factors | Labour cost | Average monthly earnings in US dollar |
| Energy cost | Diesel price in USD per liter | |
| Gross value added | Value in USD billion | |
| Share in percent of GDP | ||
| Productivity | Land productivity | Gross value added per UAA (USD thousand per ha) |
| Labour productivity | Gross value added per employed person (USD thousand per person) |
|
| Capital productivity | Gross value added per net capital stock (USD per USD) | |
| Other factors determining quality of the production potential |
Pesticide use | Tons of active ingredients or kilos of active ingredients per ha UAA |
| Maximum residue limits |
mg per kg | |
Source: own elaborations based on literature.
Table 2.
Agricultural Land Area, in ha million.
| Mercosur | European Union | |||||||||||
|---|---|---|---|---|---|---|---|---|---|---|---|---|
| 2018 | 2019 | 2020 | 2021 | 2022 | 2023 | 2018 | 2019 | 2020 | 2021 | 2022 | 2023 | |
| Agricultural Land | 387.52 | 388.31 | 389.51 | 390.00 | 391.19 | 388.56 | 163.73 | 164.96 | 162.88 | 162.63 | 162.45 | 160.83 |
| Arable Land | 102.34 | 102.97 | 104.02 | 104.36 | 105.42 | 102.79 | 98.97 | 99.37 | 97.55 | 97.60 | 97.34 | 97.38 |
| Land under Permanent Crops |
8.95 | 8.95 | 8.96 | 8.96 | 8.95 | 8.95 | 11.96 | 12.05 | 11.84 | 11.88 | 12.12 | 12.12 |
| Permanent Meadows and Pastures |
276.23 | 276.38 | 276.53 | 276.68 | 276.83 | 276.83 | 52.80 | 53.54 | 53.48 | 53.14 | 53.00 | 53.03 |
Source: own calculations based on [74].
Table 3.
Labour and Capital Inputs in Agriculture.
| Mercosur | European Union | |||||||||||
|---|---|---|---|---|---|---|---|---|---|---|---|---|
| 2018 | 2019 | 2020 | 2021 | 2022 | 2023 | 2018 | 2019 | 2020 | 2021 | 2022 | 2023 | |
| Employment in Agriculture, in thousand persons |
10,662.97 | 10,628.69 | 10,276.64 | 10,999.21 | 10,852.71 | 10,441.28 | 8,963.44 | 8,762.89 | 8,582.57 | 8,332.99 | 8,237.46 | 7,966.74 |
| Net Capital Stocks (Agriculture, Forestry and Fishing), in USD billion |
147.06 | 141.70 | 130.86 | 151.50 | 179.76 | 185.53 | 1,031.53 | 1,002.43 | 1,031.07 | 1,125.28 | 1,101.41 | 1,116.62 |
Table 4.
Relations between Factors of Production in Agriculture.
| Mercosur | European Union | |||||||||||
|---|---|---|---|---|---|---|---|---|---|---|---|---|
| 2018 | 2019 | 2020 | 2021 | 2022 | 2023 | 2018 | 2019 | 2020 | 2021 | 2022 | 2023 | |
| Number of Employees per 100 ha of Agricultural Land, persons/100 ha |
2.75 | 2.74 | 2.64 | 2.82 | 2.77 | 2.69 | 5.47 | 5.31 | 5.27 | 5.12 | 5.07 | 4.95 |
| Area of Agricultural Land per 1 Employed in Agriculture, ha/person |
36.34 | 36.53 | 37.90 | 35.46 | 36.05 | 37.21 | 18.27 | 18.82 | 18.98 | 19.52 | 19.72 | 20.19 |
| Net Capital Value per 1 Employed in Agriculture, thousand USD/person |
13.79 | 13.33 | 12.73 | 13.77 | 16.56 | 17.77 | 115.08 | 114.39 | 120.14 | 135.04 | 133.71 | 140.16 |
| Net Capital Value per 1 ha of Agricultural Land, thousand USD/ha |
0.38 | 0.36 | 0.34 | 0.39 | 0.46 | 0.48 | 6.30 | 6.08 | 6.33 | 6.92 | 6.78 | 6.94 |
Source: own calculations based on [43].
Table 5.
Value Added of Agriculture, Forestry and Fishing.
| Mercosur | European Union | |||||||||||
|---|---|---|---|---|---|---|---|---|---|---|---|---|
| 2018 | 2019 | 2020 | 2021 | 2022 | 2023 | 2018 | 2019 | 2020 | 2021 | 2022 | 2023 | |
| Value Added in Agriculture, Forestry and Fishing, in USD billion |
116.36 | 110.30 | 116.59 | 154.39 | 164.04 | 180.88 | 254.50 | 247.74 | 246.45 | 273.79 | 284.76 | 302.93 |
| Share of Value Added (Agriculture, Forestry and Fishing) in GDP, % |
6.18 | 6.42 | 7.54 | 8.27 | 7.57 | 7.67 | 1.58 | 1.57 | 1.59 | 1.56 | 1.68 | 1.63 |
Source: own calculations based on [79].
Table 6.
Efficiency of Production Factors Use.
| Mercosur | European Union | |||||||||||
|---|---|---|---|---|---|---|---|---|---|---|---|---|
| 2018 | 2019 | 2020 | 2021 | 2022 | 2023 | 2018 | 2019 | 2020 | 2021 | 2022 | 2023 | |
| Land Productivity (Value Added per Agricultural Land), USD/ha | 300.27 | 284.05 | 299.32 | 395.87 | 419.33 | 465.51 | 1,554.39 | 1,501.85 | 1,513.09 | 1,683.56 | 1,752.87 | 1,883.48 |
| Labour Productivity (Value Added per 1 Person Employed), USD/person | 10,912.53 | 10,377.45 | 11,344.94 | 14,036.41 | 15,114.93 | 17,323.59 | 28,393.04 | 28,271.92 | 28,714.91 | 32,856.57 | 34,569.11 | 38,023.87 |
| Capital Productivity (Value Added per Net Capital Stock) 1 USD/1 USD |
0.79 | 0.78 | 0.89 | 1.02 | 0.91 | 0.97 | 0.25 | 0.25 | 0.24 | 0.24 | 0.26 | 0.27 |
Source: own calculations based on [43].
Table 7.
Livestock, in million heads.
| Mercosur | European Union | |||||||||||
|---|---|---|---|---|---|---|---|---|---|---|---|---|
| 2018 | 2019 | 2020 | 2021 | 2022 | 2023 | 2018 | 2019 | 2020 | 2021 | 2022 | 2023 | |
| Cattle and Buffaloes | 294.96 | 296.66 | 299.01 | 305.50 | 314.45 | 319.95 | 78.30 | 77.62 | 77.02 | 76.18 | 75.29 | 74.22 |
| Swine/pigs | 47.91 | 47.17 | 48.06 | 49.41 | 51.37 | 50.37 | 143.52 | 143.15 | 145.91 | 141.68 | 134.41 | 132.86 |
| Sheep | 39.98 | 41.60 | 41.84 | 40.44 | 40.46 | 40.66 | 63.24 | 62.47 | 61.46 | 60.51 | 59.01 | 58.16 |
| Goats | 15.66 | 16.41 | 16.92 | 16.30 | 16.47 | 17.15 | 12.19 | 12.13 | 11.98 | 11.75 | 11.26 | 10.71 |
| Poultry Birds | 1,650.46 | 1,662.43 | 1,683.05 | 1,730.38 | 1,774.90 | 1,782.60 | 1,567.23 | 1,580.91 | 1,604.80 | 1,562.75 | 1,563.65 | 1,562.00 |
Source: own calculations based on [80].
Table 8.
Production of Basic Agricultural Products, in million tons.
| Mercosur | European Union | |||||||||||
|---|---|---|---|---|---|---|---|---|---|---|---|---|
| 2018 | 2019 | 2020 | 2021 | 2022 | 2023 | 2018 | 2019 | 2020 | 2021 | 2022 | 2023 | |
| Cereals | 183.45 | 216.51 | 223.24 | 210.05 | 238.63 | 228.81 | 274.54 | 299.87 | 286.29 | 298.19 | 271.42 | 272.17 |
| Wheat | 25.15 | 27.14 | 28.20 | 27.39 | 34.75 | 22.92 | 124.51 | 139.43 | 126.42 | 138.18 | 134.30 | 133.48 |
| Barley | 5.78 | 4.83 | 4.61 | 5.38 | 6.72 | 5.97 | 50.15 | 55.59 | 54.67 | 52.09 | 51.99 | 47.38 |
| Maize (corn) | 131.48 | 164.38 | 168.98 | 153.66 | 174.28 | 178.12 | 69.00 | 70.10 | 67.31 | 73.02 | 52.97 | 61.04 |
| Rye | 0.09 | 0.10 | 0.23 | 0.15 | 0.24 | 0.19 | 6.14 | 8.37 | 8.94 | 7.96 | 7.46 | 7.56 |
| Rape or colza seed | 0.17 | 0.22 | 0.27 | 0.36 | 0.54 | 0.87 | 17.92 | 15.29 | 16.56 | 16.95 | 19.42 | 19.59 |
| Soya Beans | 168.08 | 180.93 | 183.62 | 193.26 | 173.15 | 188.03 | 2.91 | 2.81 | 2.68 | 2.71 | 2.51 | 2.86 |
| Sunflower Seed | 3.72 | 4.00 | 2.97 | 3.36 | 4.13 | 5.15 | 10.00 | 10.28 | 9.03 | 10.39 | 9.33 | 9.83 |
| Raw cane or beet sugar (centrifugal only) | 30.29 | 30.00 | 40.84 | 37.87 | 42.03 | N/A | 18.16 | 17.24 | 16.01 | 17.52 | 16.11 | N/A |
| Beef and Buffalo Meat (primary) | 14.05 | 14.40 | 14.17 | 13.83 | 14.63 | 15.51 | 7.09 | 6.99 | 6.93 | 6.90 | 6.74 | 6.48 |
| Meat of pig with the bone, fresh or chilled | 51.86 | 53.94 | 57.14 | 61.39 | 65.04 | 66.10 | 250.92 | 247.51 | 247.31 | 251.91 | 239.03 | 221.92 |
| Poultry Meat | 15.95 | 16.09 | 16.36 | 16.99 | 17.21 | 17.45 | 13.08 | 13.30 | 13.45 | 13.06 | 12.87 | 13.16 |
| Milk (total) | 48.75 | 49.61 | 50.93 | 51.31 | 50.64 | 51.06 | 156.74 | 158.28 | 160.29 | 159.77 | 160.00 | 160.84 |
Source: own calculations based on [80].
Table 9.
Examples of maximum residue limits in the EU and Mercosur (mg/kg).
| Pesticide | Product | EU | Brazil |
|---|---|---|---|
| Glyphosate | Coffee | 0.1 | 1 (×10) |
| Glyphosate | Sugar cane | 0.1 | 1 (×10) |
| Glyphosate | Drinking water | 0.1 | 500 (×5,000) |
| Chlorothalonil | Soya | 0.01 | 0.5 (×50) |
| Carbaryl | Apples | 0.01 | 2 (×200) |
| Atrazine | Corn | 0.05 | 0.25 (×5) |
| Acephate | Lemon | 0.01 | 0.2 (×20) |
| Malathione | Bean | 0.02 | 8 (×400) |
Source: own elaborations based on [25].
Disclaimer/Publisher’s Note: The statements, opinions and data contained in all publications are solely those of the individual author(s) and contributor(s) and not of MDPI and/or the editor(s). MDPI and/or the editor(s) disclaim responsibility for any injury to people or property resulting from any ideas, methods, instructions or products referred to in the content. |
© 2025 by the authors. Licensee MDPI, Basel, Switzerland. This article is an open access article distributed under the terms and conditions of the Creative Commons Attribution (CC BY) license (http://creativecommons.org/licenses/by/4.0/).
Copyright: This open access article is published under a Creative Commons CC BY 4.0 license, which permit the free download, distribution, and reuse, provided that the author and preprint are cited in any reuse.


