
Submitted:
15 November 2025
Posted:
17 November 2025
You are already at the latest version
Abstract
Air quality has become a critical environmental and public health concern due to rapid urbanization, industrial activities, and increased vehicular emissions. Accurate assessment and prediction of air pollution levels are essential for informed policy-making and early warning systems. This study investigates the application of machine learning techniques for analyzing air quality data and forecasting pollutant concentrations. This dataset contains environmental and air quality data collected to study the factors affecting air pollution levels in different regions. The dataset includes features related to environmental conditions, pollution indices, and contextual environmental factors. It supports air quality analysis and predictive modeling to better understand the impacts of pollution on human health and the environment.
Keywords:
air pollution
; prediction
; machine learning
1. Introduction
This study emphasizes the importance of mitigating the harmful effects of environmental pollution and conducting an in-depth examination of contributing factors. While the complete elimination of pollution is not feasible, understanding its causes and improving monitoring systems remains a key objective [11]. The research applies machine learning techniques to an updated pollution dataset. Among the tested models, Random Forest achieved the highest accuracy (95%), outperforming other classifiers [12,13,14]. The dataset was pre-processed to eliminate missing and irrelevant data. Performance was evaluated using accuracy, precision, recall, and F1-score. Results indicate that industrial proximity and population density significantly impact air quality.
2. Literature Review
To overcome extensive data gaps in satellite aerosol optical depth (AOD) retrievals, Li et al. proposed a multimodal data fusion system combining simulations, satellite, and ground-based measurements using optimal interpolation. Their model produced high-resolution AOD maps with strong correlation (R = 0.83). Bhatti et al. [1] examined PM2.5 and PM10 in Lahore using SARIMA and HYSPLIT to identify pollution sources, noting coal burning and traffic as key contributors.
Nguyen et al. [2] proposed a deep learning air quality forecasting framework integrating Wasp-based interfaces and cross-assorted DL models, achieving high accuracy across Australian regions. Abboud et al. [3] tackled limitations of static air quality monitoring by combining CNN-LSTM with mobile monitoring data, improving spatial coverage (83.3% in Paris).
Rodrigues et al. [4] investigated European cities’ compliance with air quality laws, analyzing 10 years of data and showing policy interventions reduced violations. Ntesat et al. [5] highlighted toxic metal pollution from fireworks in indoor air and used atomic spectroscopy to identify exposure risks to children.
Sannoh et al. [6] emphasized the persistent air pollution in Karachi due to insufficient monitoring and analyzed risk through PM2.5 levels and PMF models. Liu and Cui [9] evaluated control measures in China’s GBA region using WRF-CMAQ and SMAT-CE modeling, noting significant pandemic-related pollution declines. Liu et al. [10] proposed LightGBM and LSTM models to overcome forecasting limitations [8], achieving 97.5% accuracy. Table 1 summarizes key studies from literature [15,16,17,18].
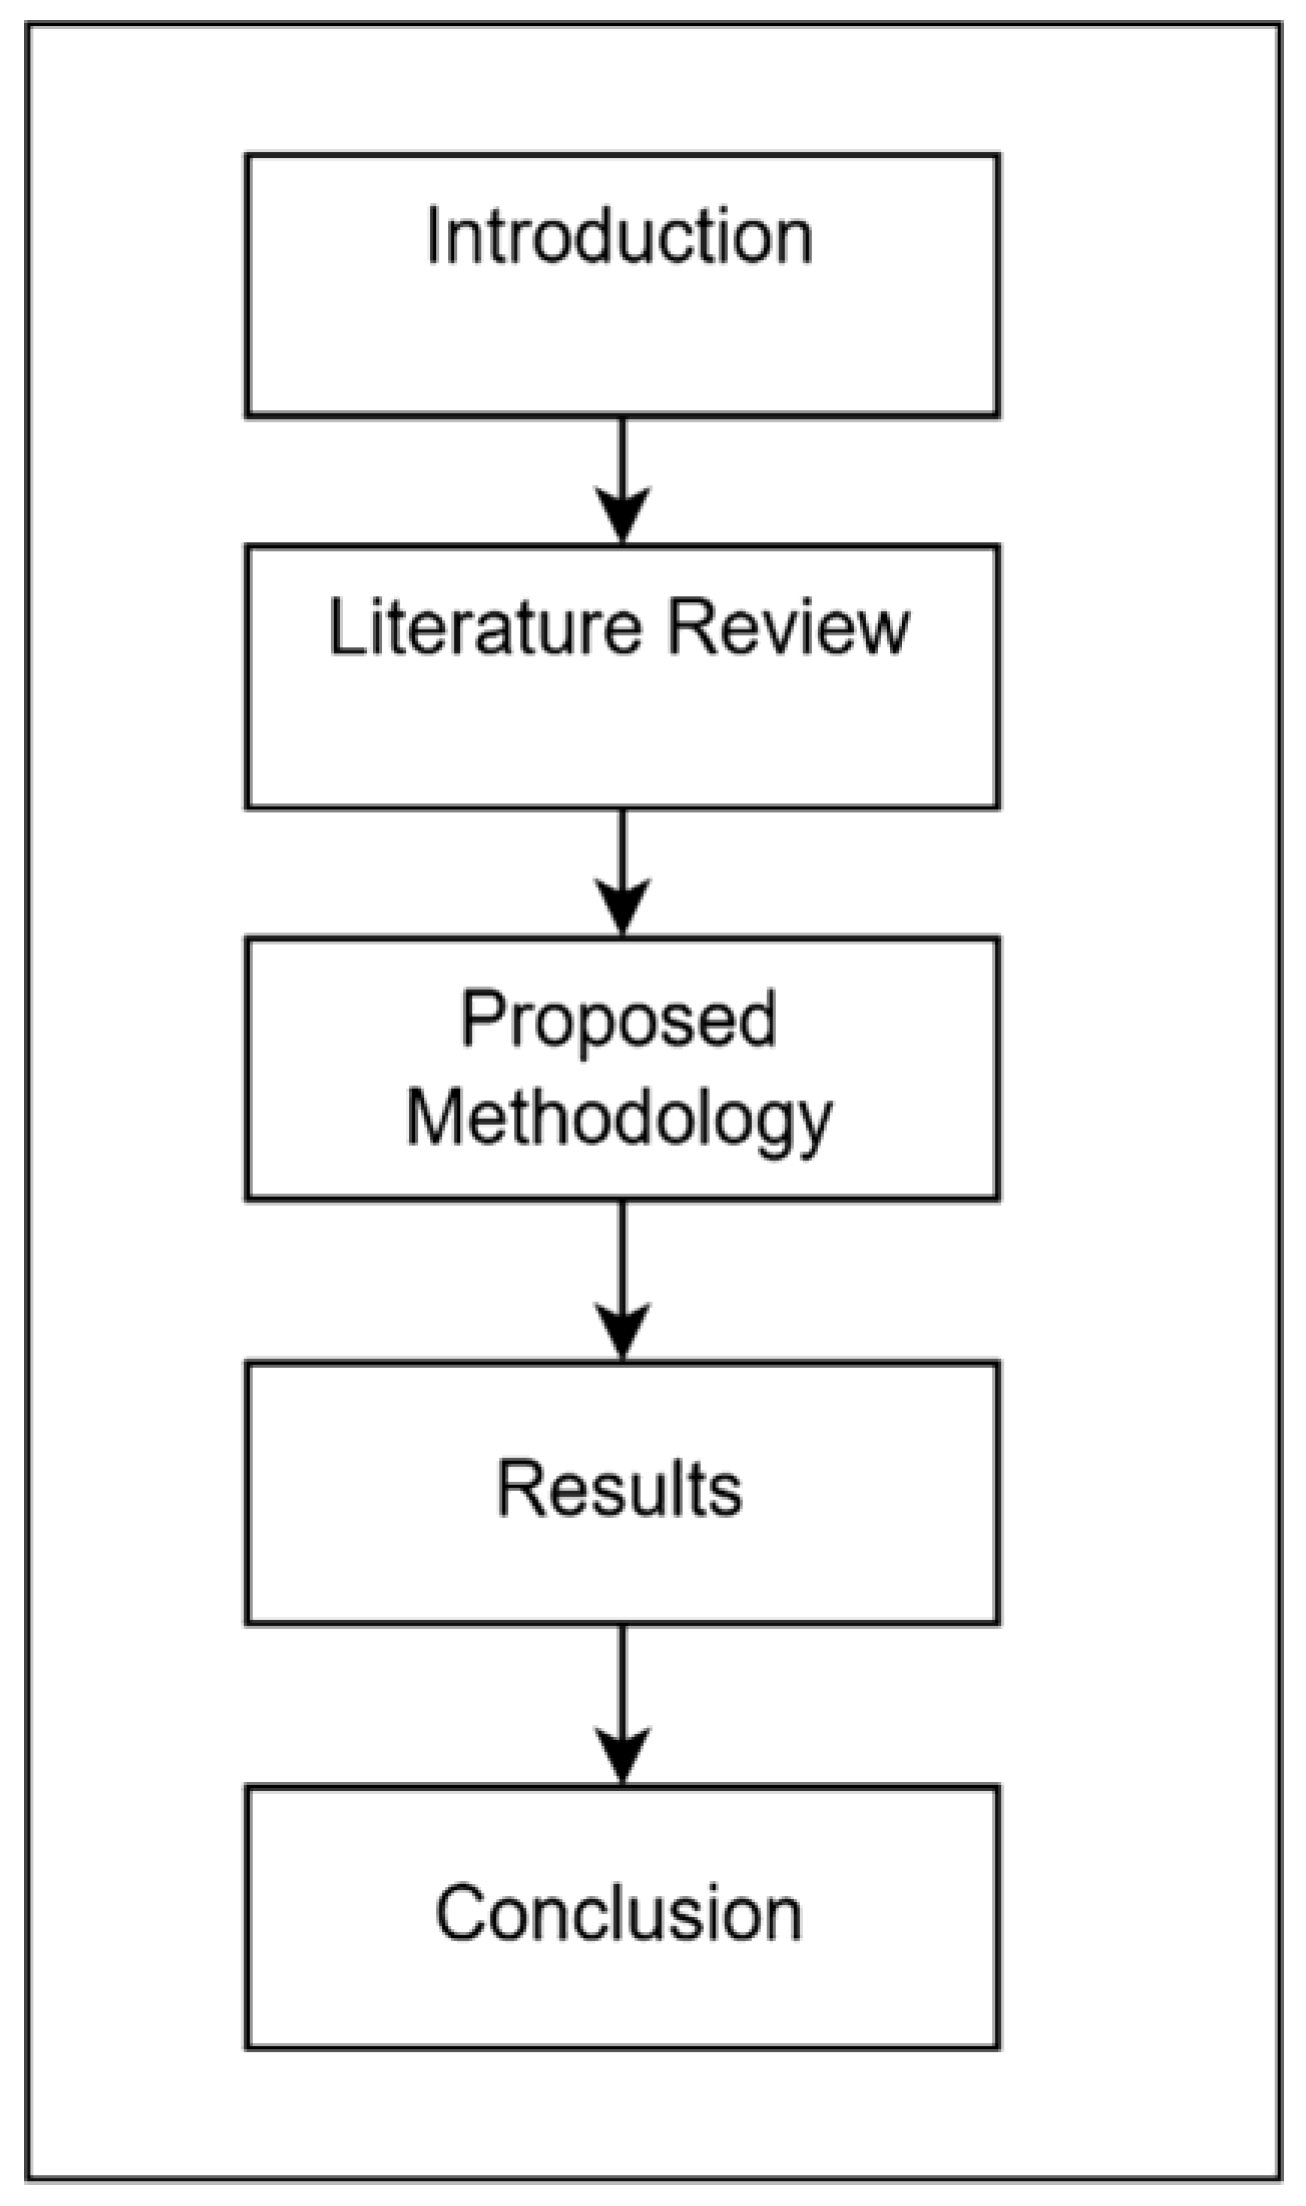
3. Proposed Methodology
Our proposed methodology is shown in Figure 1. We implemented several ML models using RapidMiner:
- (a)
- KNN: Classifies data based on similarity to nearby data points.
- (b)
- Decision Tree: Tree-based model with branching decisions for multi-class classification.
- (c)
- Random Forest: Ensemble method using multiple decision trees.
- (d)
- Naive Bayes: Probabilistic classifier effective for binary and multi-class problems.
Figure 1.
Paper Methodology.
The dataset used in this research work includes 5000 records with 10 attributes. Table 2 shows dataset description.
4. Results
We used 10-fold cross-validation and stacking-based ensemble modeling. Five base models (Naive Bayes, Gradient Boosted Tree, KNN, Decision Tree, Random Forest) were combined. The meta-classifier (Random Forest) achieved the best results. Figure 2 shows machine learning Framework flow diagram.
Figure 3 illustrates a machine learning workflow for a cross-validation process, as displayed in the RapidMiner software. The workflow is split into training and testing phases.
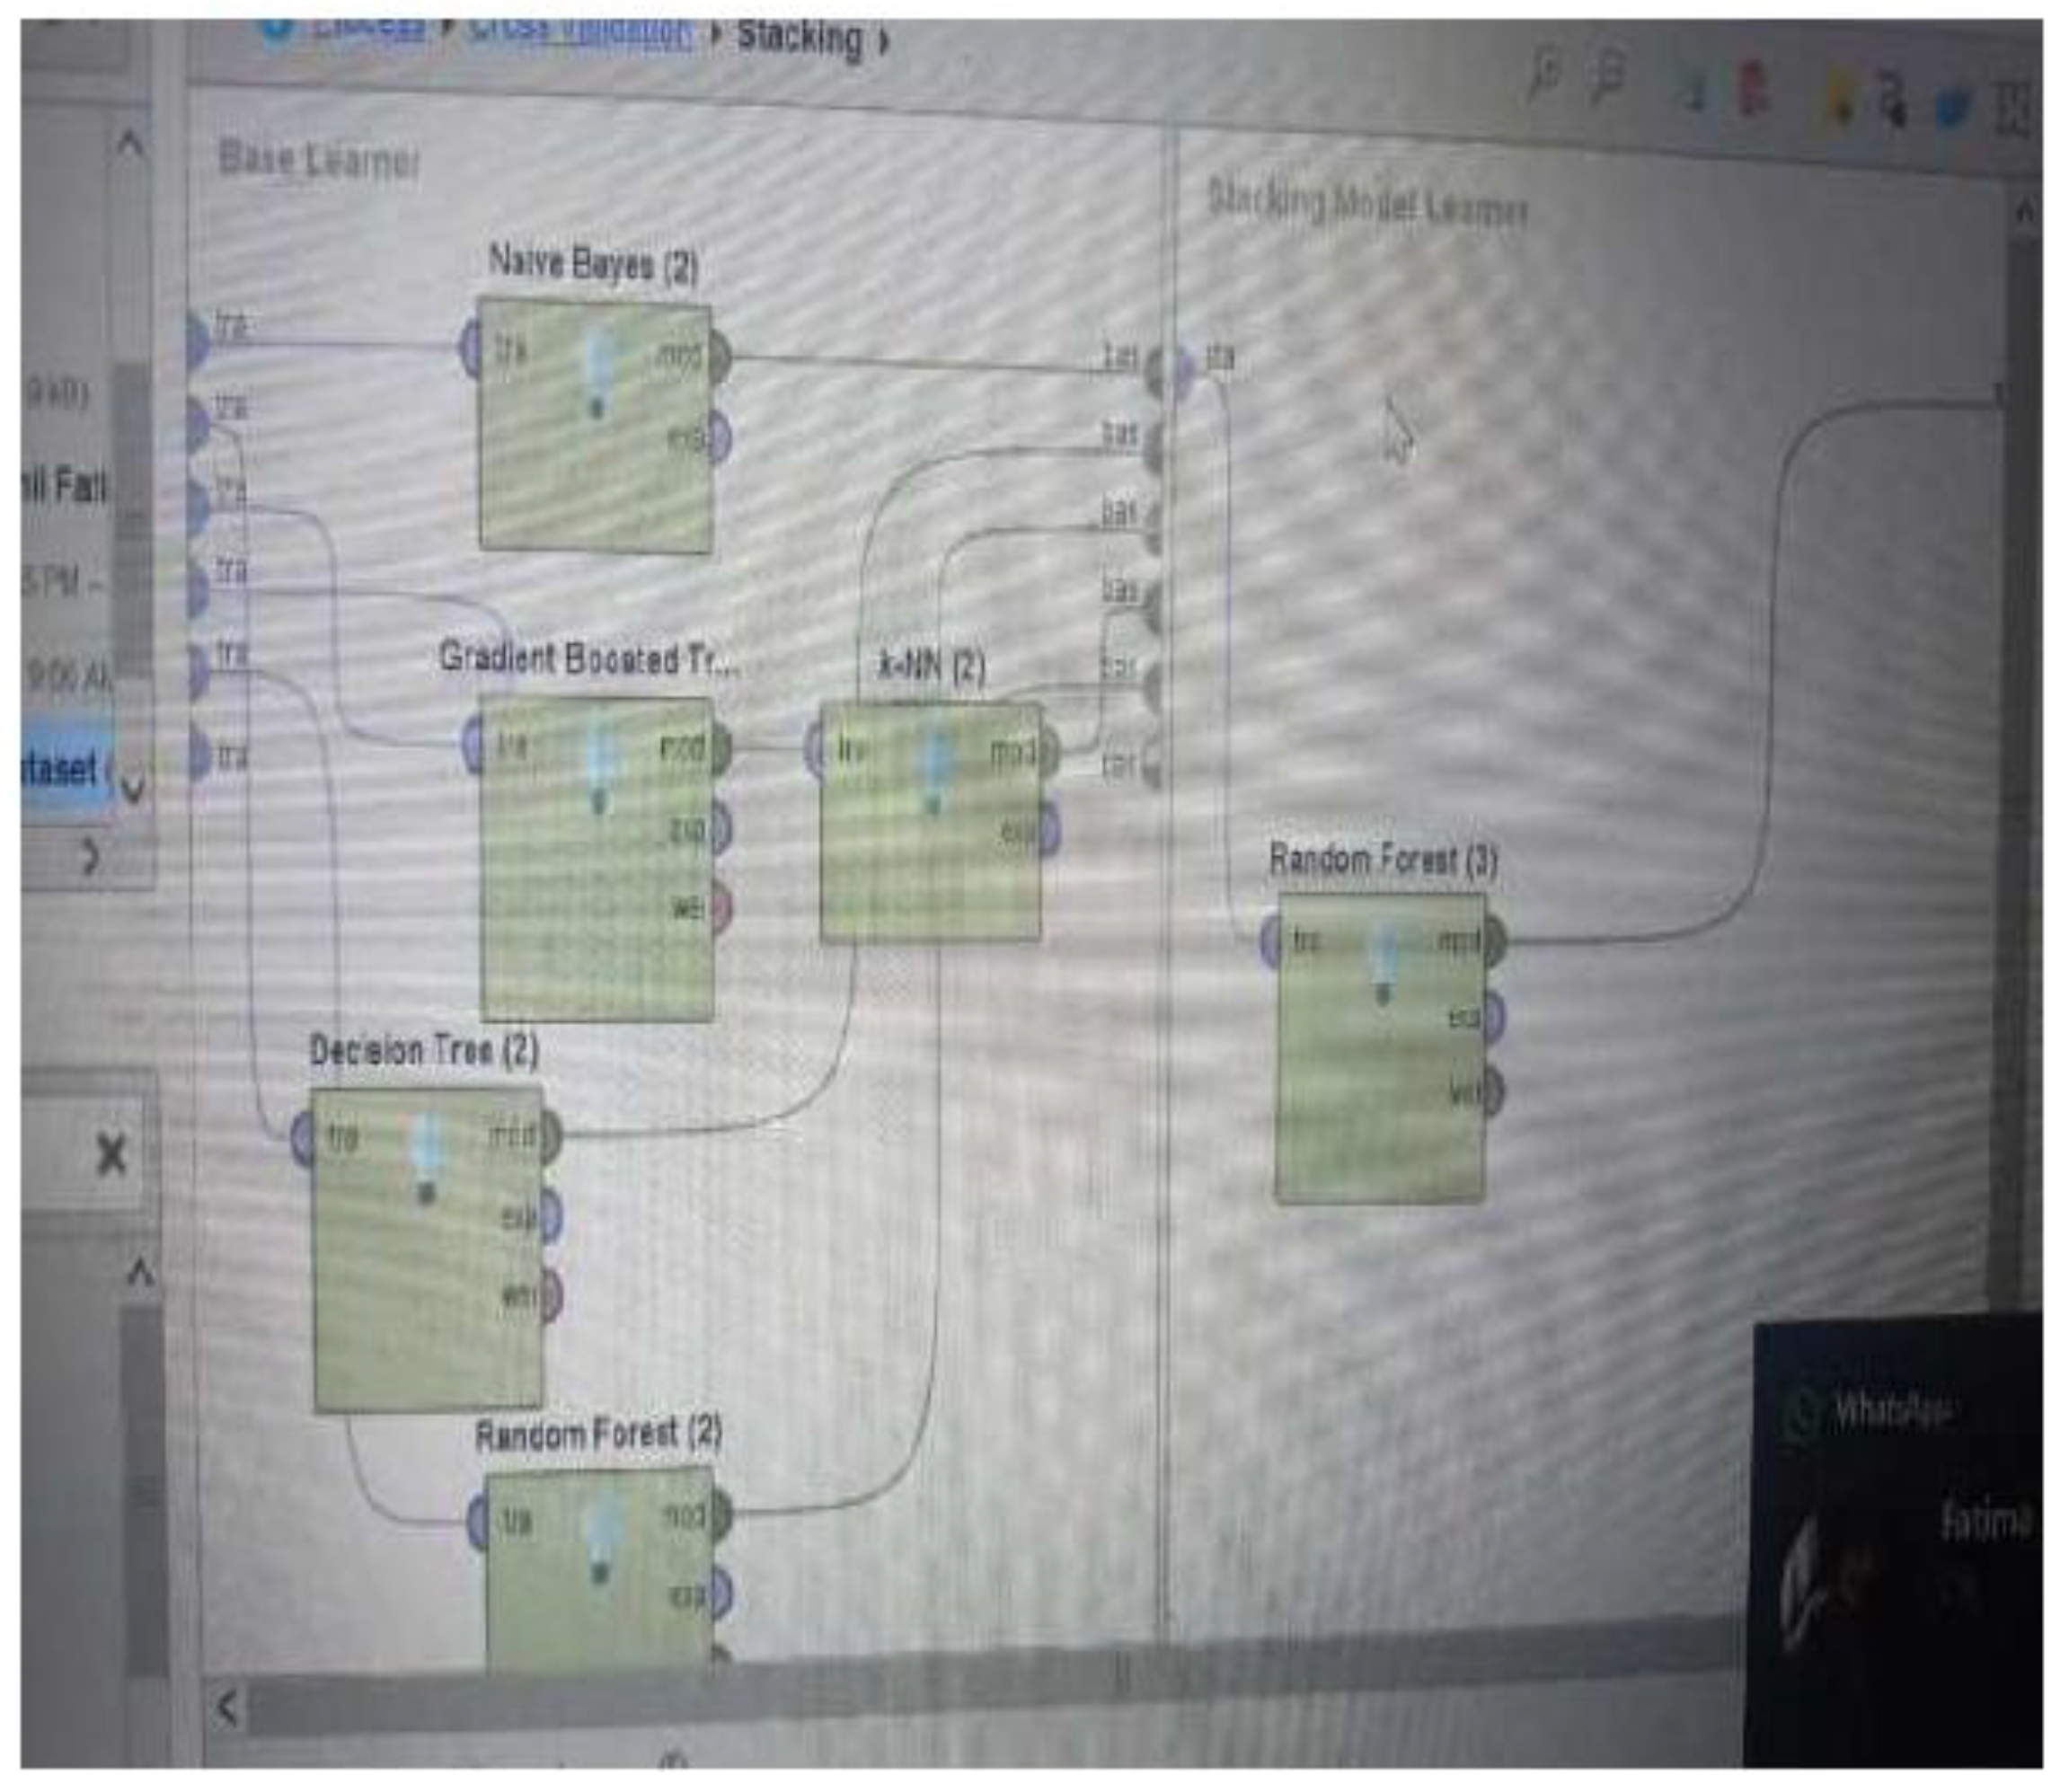
Figure 4 illustrates a stacking ensemble learning process. The workflow begins with a set of “Base Learners” on the left, which are individual machine learning models. In this specific example, the base learners include Naive Bayes, Gradient Boosted Tree, Decision Tree, and Random Forest.
Figure 3.
Cross-Validation Technique Diagram.
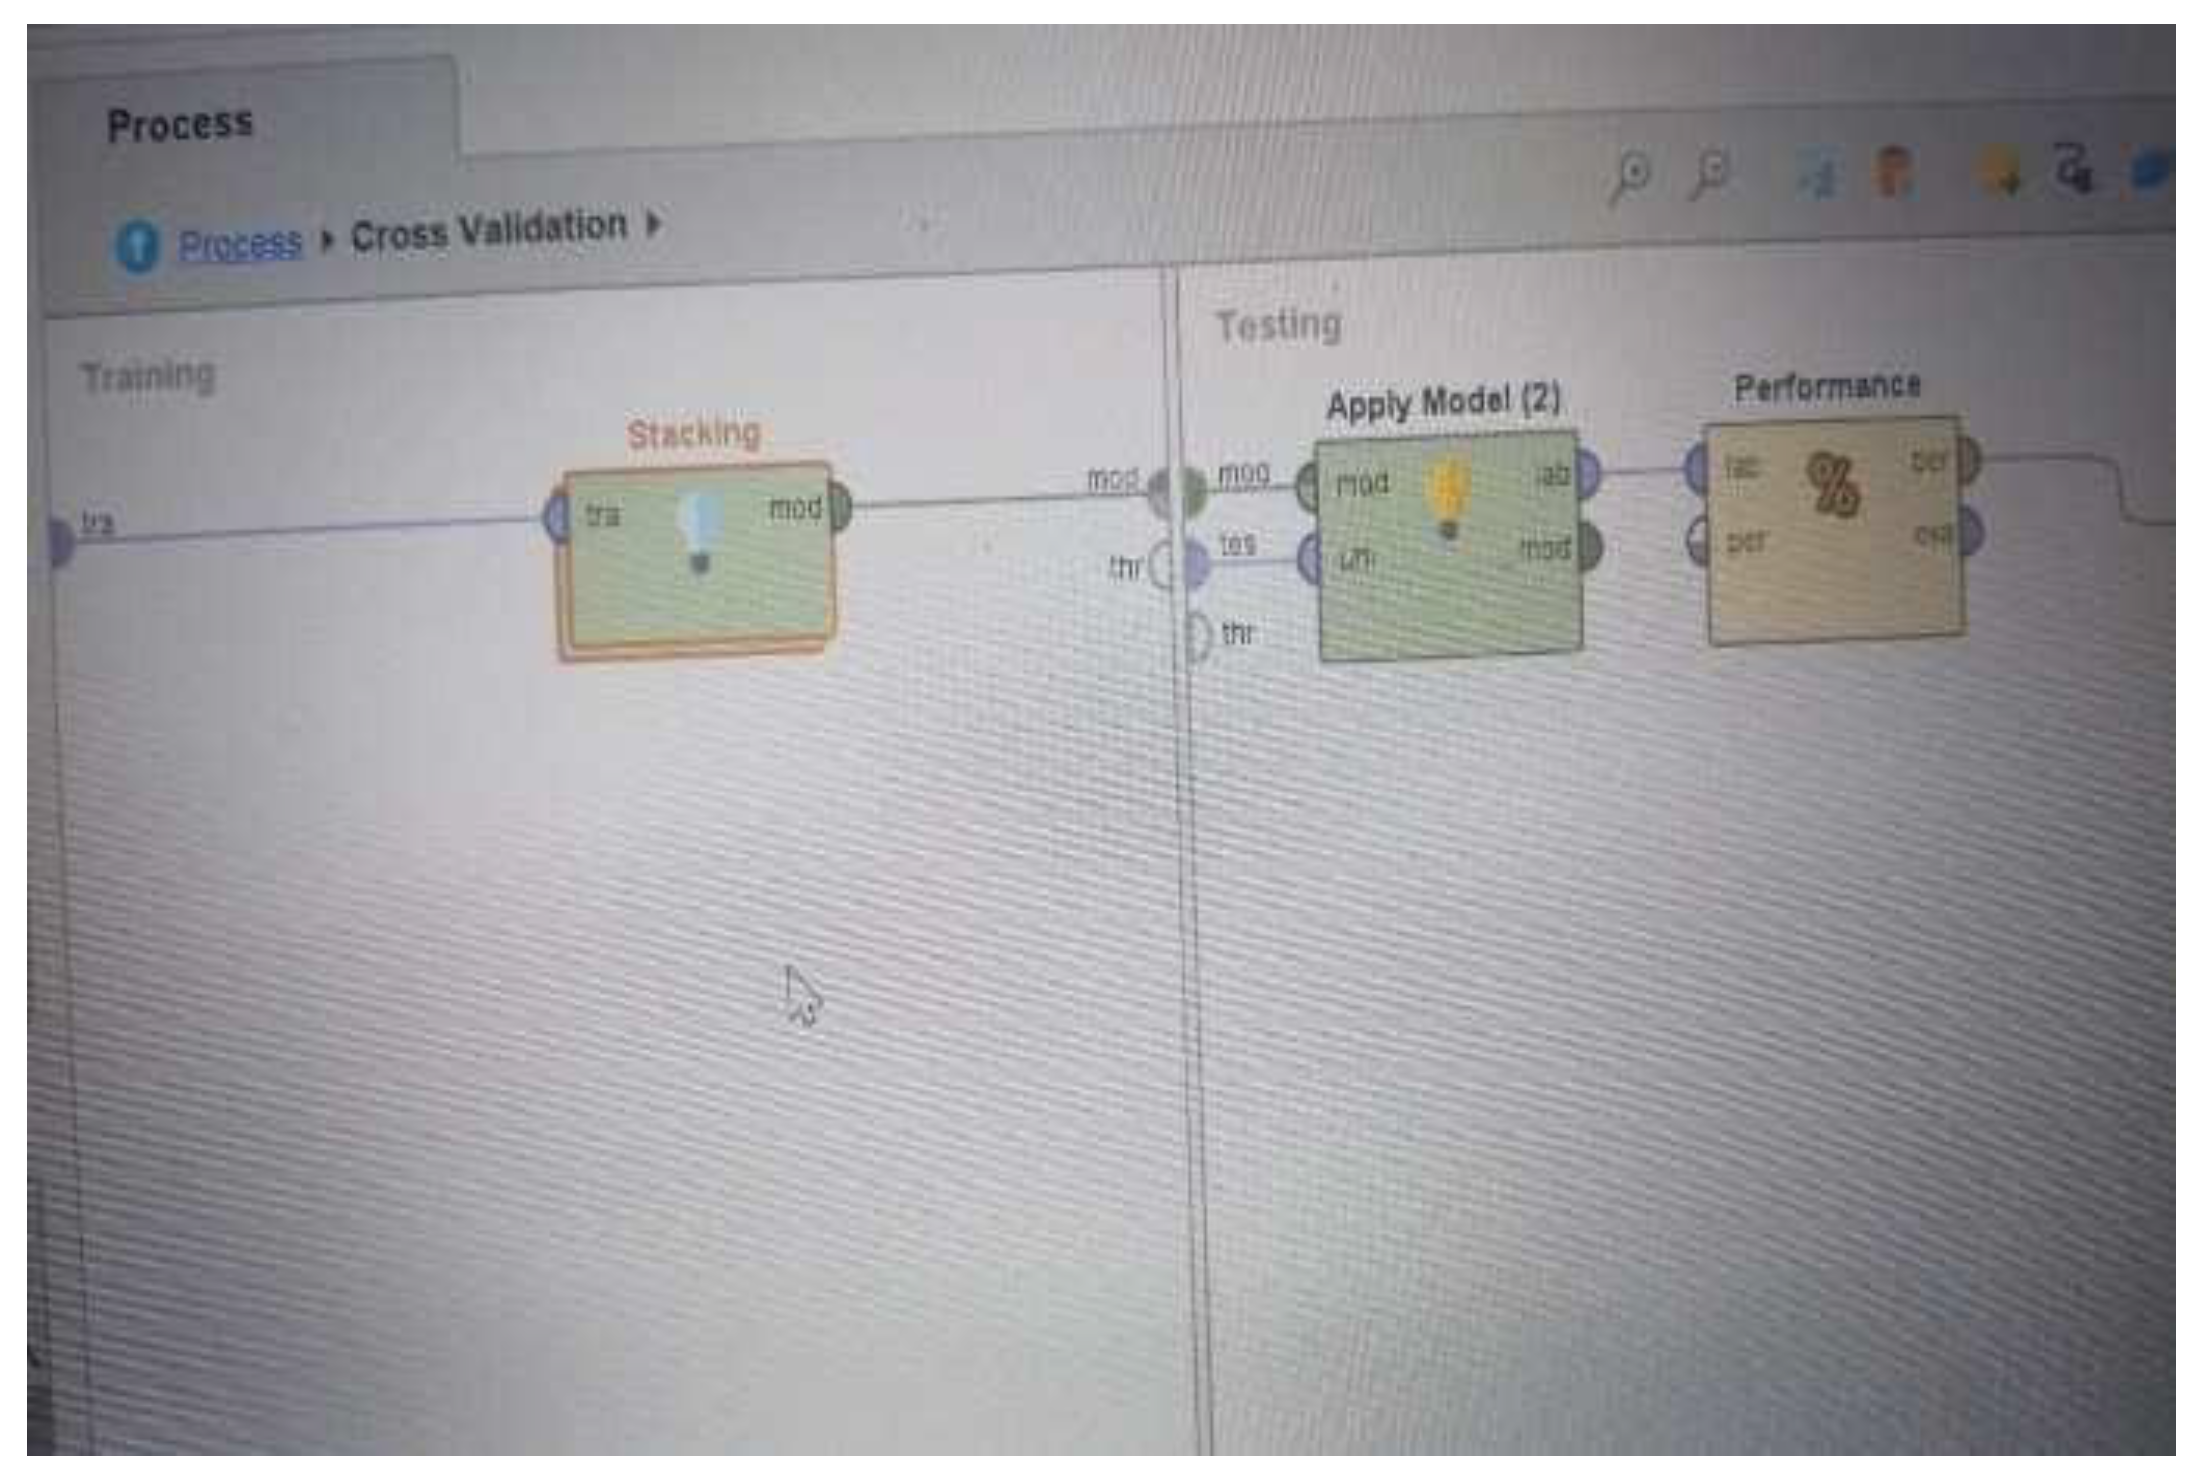
Figure 4.
caption.
4.1. Dataset Description
The original dataset contained various air pollutant measures such as PM2.5, PM10, NO2, CO, SO2, and O3. The dataset also included weather-related parameters such as temperature, humidity, wind speed, and pressure. These attributes served as input features for the classification and regression models [19,20,21].
4.2. Performance Comparison of Algorithms
A comparison was made between several machine learning models including Decision Tree, Random Forest, KNN and SVM. The models were tested on both the original and preprocessed datasets. Preprocessing involved handling missing values, normalization, and feature selection to improve model performance [23,24].
Table 3 presents the classification accuracy [25] of different algorithms on the original and preprocessed datasets.
As shown in Table 3, all models improved after preprocessing. Random Forest consistently achieved the highest accuracy, followed by SVM. Decision Tree and KNN also showed improvement, but their performance lagged.
4.3. Confusion Matrix and Classification Report
Figure 5 illustrates the confusion matrix for the best-performing model, Random Forest, on the preprocessed dataset. The matrix reveals a strong balance between true positives and true negatives, indicating a reliable prediction performance. The classification report in Table 4 provides detailed precision, recall, and F1-score for each class.
5. Discussion
The results clearly show that preprocessing steps significantly improve the performance of all machine learning models. Random Forest emerged as the most effective model for predicting air quality, likely due to its ensemble nature which reduces overfitting and enhances generalization [26,27].
The improvements in accuracy, precision, and recall across models reinforce the importance of data preprocessing in environmental data analytics. These findings can be instrumental in guiding future implementations of predictive systems for air pollution monitoring and management.
6. Conclusions
Air pollution is a serious global problem that affects public health, ecosystems, and overall quality of life. This dataset is designed to analyze air quality by incorporating a wide range of environmental, industrial, and demographic factors. Consisting of 5,000 records and 10 features, the dataset includes key meteorological parameters (such as temperature and humidity) and pollution indicators (such as PM2.5, PM10, NO2, SO2, and CO). Additionally, factors such as proximity to industrial areas and population density help estimate potential pollution sources and levels of human exposure. The target variable, air quality, categorizes pollution levels into classes such as good and moderate, enabling qualitative analysis. This dataset supports descriptive analysis, predictive modeling, and policy development, offering researchers, environmentalists, and policymakers valuable insights to better understand air pollution dynamics and implement effective interventions. Its comprehensiveness makes it a valuable tool for promoting sustainable solutions and improving public health outcomes.
References
- U. A. Bhatti et al., “Time series analysis and forecasting of air pollution particulate matter (PM2.5): An SARIMA and factor analysis approach,” IEEE Access, vol. 9, pp. 41019–41031, 2021. [CrossRef]
- H. A. D. Nguyen et al., “Deep-learning based visualization tool for air pollution forecast,” IEEE Software, vol. PP, no. November, pp. 1–8, 2024. [CrossRef]
- M. Abboud, Y. Taher, K. Zeitouni, and A. M. Olteanu-Raimond, “How opportunistic mobile monitoring can enhance air quality assessment?,” Geoinformatica, vol. 28, no. 4, pp. 679–710, 2024. [CrossRef]
- V. Rodrigues et al., “Assessing air pollution in European cities to support a citizen-centered approach to air quality management,” Science of the Total Environment, vol. 799, 2021. [CrossRef]
- P. T. S. Environment, U. B. Ntesat, D. Ojadi, C. Emeka, and R. N. Okparanma, “Ambient air quality and human health risk assessment of heavy metals in a potentially toxic silver-polluted environment,” Resources and Environmental Economics, no. January, 2025. [CrossRef]
- F. Sannoh et al., “Air pollution we breathe: Assessing the air quality and human health impact in a megacity of Southeast Asia,” Science of the Total Environment, vol. 942, p. 173403, 2024. [CrossRef]
- W. Song, M. P. Kwan, and J. Huang, “Assessment of air pollution and air quality perception mismatch using mobility-based real-time exposure,” PLoS ONE, vol. 19, no. 2, pp. 1–24, Feb. 2024. [CrossRef]
- Dvorak, D., & Kuipers, B. (1991). Process monitoring and diagnosis: a model-based approach. IEEE expert, 6(3), 67-74.
- Liu, Q., Cui, B., & Liu, Z. (2024). Air quality class prediction using machine learning methods based on monitoring data and secondary modeling. Atmosphere, 15(5), 553.
- M. Mannan and S. G. Al-Ghamdi, “Indoor air quality in buildings: A comprehensive review on the factors influencing air pollution in residential and commercial structures,” International Journal of Environmental Research and Public Health, vol. 18, no. 6, pp. 1–24, 2021. [CrossRef]
- U. Rehman et al., “A machine learning--based framework for accurate and early diagnosis of liver diseases: A comprehensive study on feature selection, data imbalance, and algorithmic performance,” International Journal of Intelligent Systems, vol. 2024, no. 1, Jan. 2024. [CrossRef]
- T. M. Ali et al., “A sequential machine learning-cum-attention mechanism for effective segmentation of brain tumor,” Frontiers in Oncology, vol. 12, Jun. 2022. [CrossRef]
- A. Mir et al., “A novel approach for the effective prediction of cardiovascular disease using applied artificial intelligence techniques,” ESC Heart Failure, Jul. 2024. [CrossRef]
- Nawaz et al., “A comprehensive literature review of application of artificial intelligence in functional magnetic resonance imaging for disease diagnosis,” Applied Artificial Intelligence, pp. 1–19, Oct. 2021. [CrossRef]
- Muzafar, S., & Jhanjhi, N. Z. (2020). Success stories of ICT implementation in Saudi Arabia. In Employing Recent Technologies for Improved Digital Governance (pp. 151-163). IGI Global Scientific Publishing.
- Jabeen, T., Jabeen, I., Ashraf, H., Jhanjhi, N. Z., Yassine, A., & Hossain, M. S. (2023). An intelligent healthcare system using IoT in wireless sensor network. Sensors, 23(11), 5055.
- Shah, I. A., Jhanjhi, N. Z., & Laraib, A. (2023). Cybersecurity and blockchain usage in contemporary business. In Handbook of Research on Cybersecurity Issues and Challenges for Business and FinTech Applications (pp. 49-64). IGI Global.
- Hanif, M., Ashraf, H., Jalil, Z., Jhanjhi, N. Z., Humayun, M., Saeed, S., & Almuhaideb, A. M. (2022). AI-based wormhole attack detection techniques in wireless sensor networks. Electronics, 11(15), 2324.
- Shah, I. A., Jhanjhi, N. Z., Amsaad, F., & Razaque, A. (2022). The role of cutting-edge technologies in industry 4.0. In Cyber Security Applications for Industry 4.0 (pp. 97-109). Chapman and Hall/CRC.
- Humayun, M., Almufareh, M. F., & Jhanjhi, N. Z. (2022). Autonomous traffic system for emergency vehicles. Electronics, 11(4), 510.
- Muzammal, S. M., Murugesan, R. K., Jhanjhi, N. Z., & Jung, L. T. (2020, October). SMTrust: Proposing trust-based secure routing protocol for RPL attacks for IoT applications. In 2020 International Conference on Computational Intelligence (ICCI) (pp. 305-310). IEEE.
- Brohi, S. N., Jhanjhi, N. Z., Brohi, N. N., & Brohi, M. N. (2023). Key applications of state-of-the-art technologies to mitigate and eliminate COVID-19. Authorea Preprints.
- Khalil, M. I., Humayun, M., Jhanjhi, N. Z., Talib, M. N., & Tabbakh, T. A. (2021). Multi-class segmentation of organ at risk from abdominal ct images: A deep learning approach. In Intelligent Computing and Innovation on Data Science: Proceedings of ICTIDS 2021 (pp. 425-434). Singapore: Springer Nature Singapore.
- Humayun, M., Jhanjhi, N. Z., Niazi, M., Amsaad, F., & Masood, I. (2022). Securing drug distribution systems from tampering using blockchain. Electronics, 11(8), 1195.
- Muzammal, S. M., Murugesan, R. K., Jhanjhi, N. Z., & Jung, L. T. (2020, October). SMTrust: Proposing trust-based secure routing protocol for RPL attacks for IoT applications. In 2020 International Conference on Computational Intelligence (ICCI) (pp. 305-310). IEEE.
- Ashfaq, F., Jhanjhi, N. Z., Khan, N. A., Javaid, D., Masud, M., & Shorfuzzaman, M. (2025). Enhancing ECG Report Generation With Domain-Specific Tokenization for Improved Medical NLP Accuracy. IEEE Access.
- Alshudukhi, K. S. S., Ashfaq, F., Jhanjhi, N. Z., & Humayun, M. (2024). Blockchain-enabled federated learning for longitudinal emergency care. IEEE Access, 12, 137284-137294.
Figure 2.
Machine learning Framework Flow Diagram.
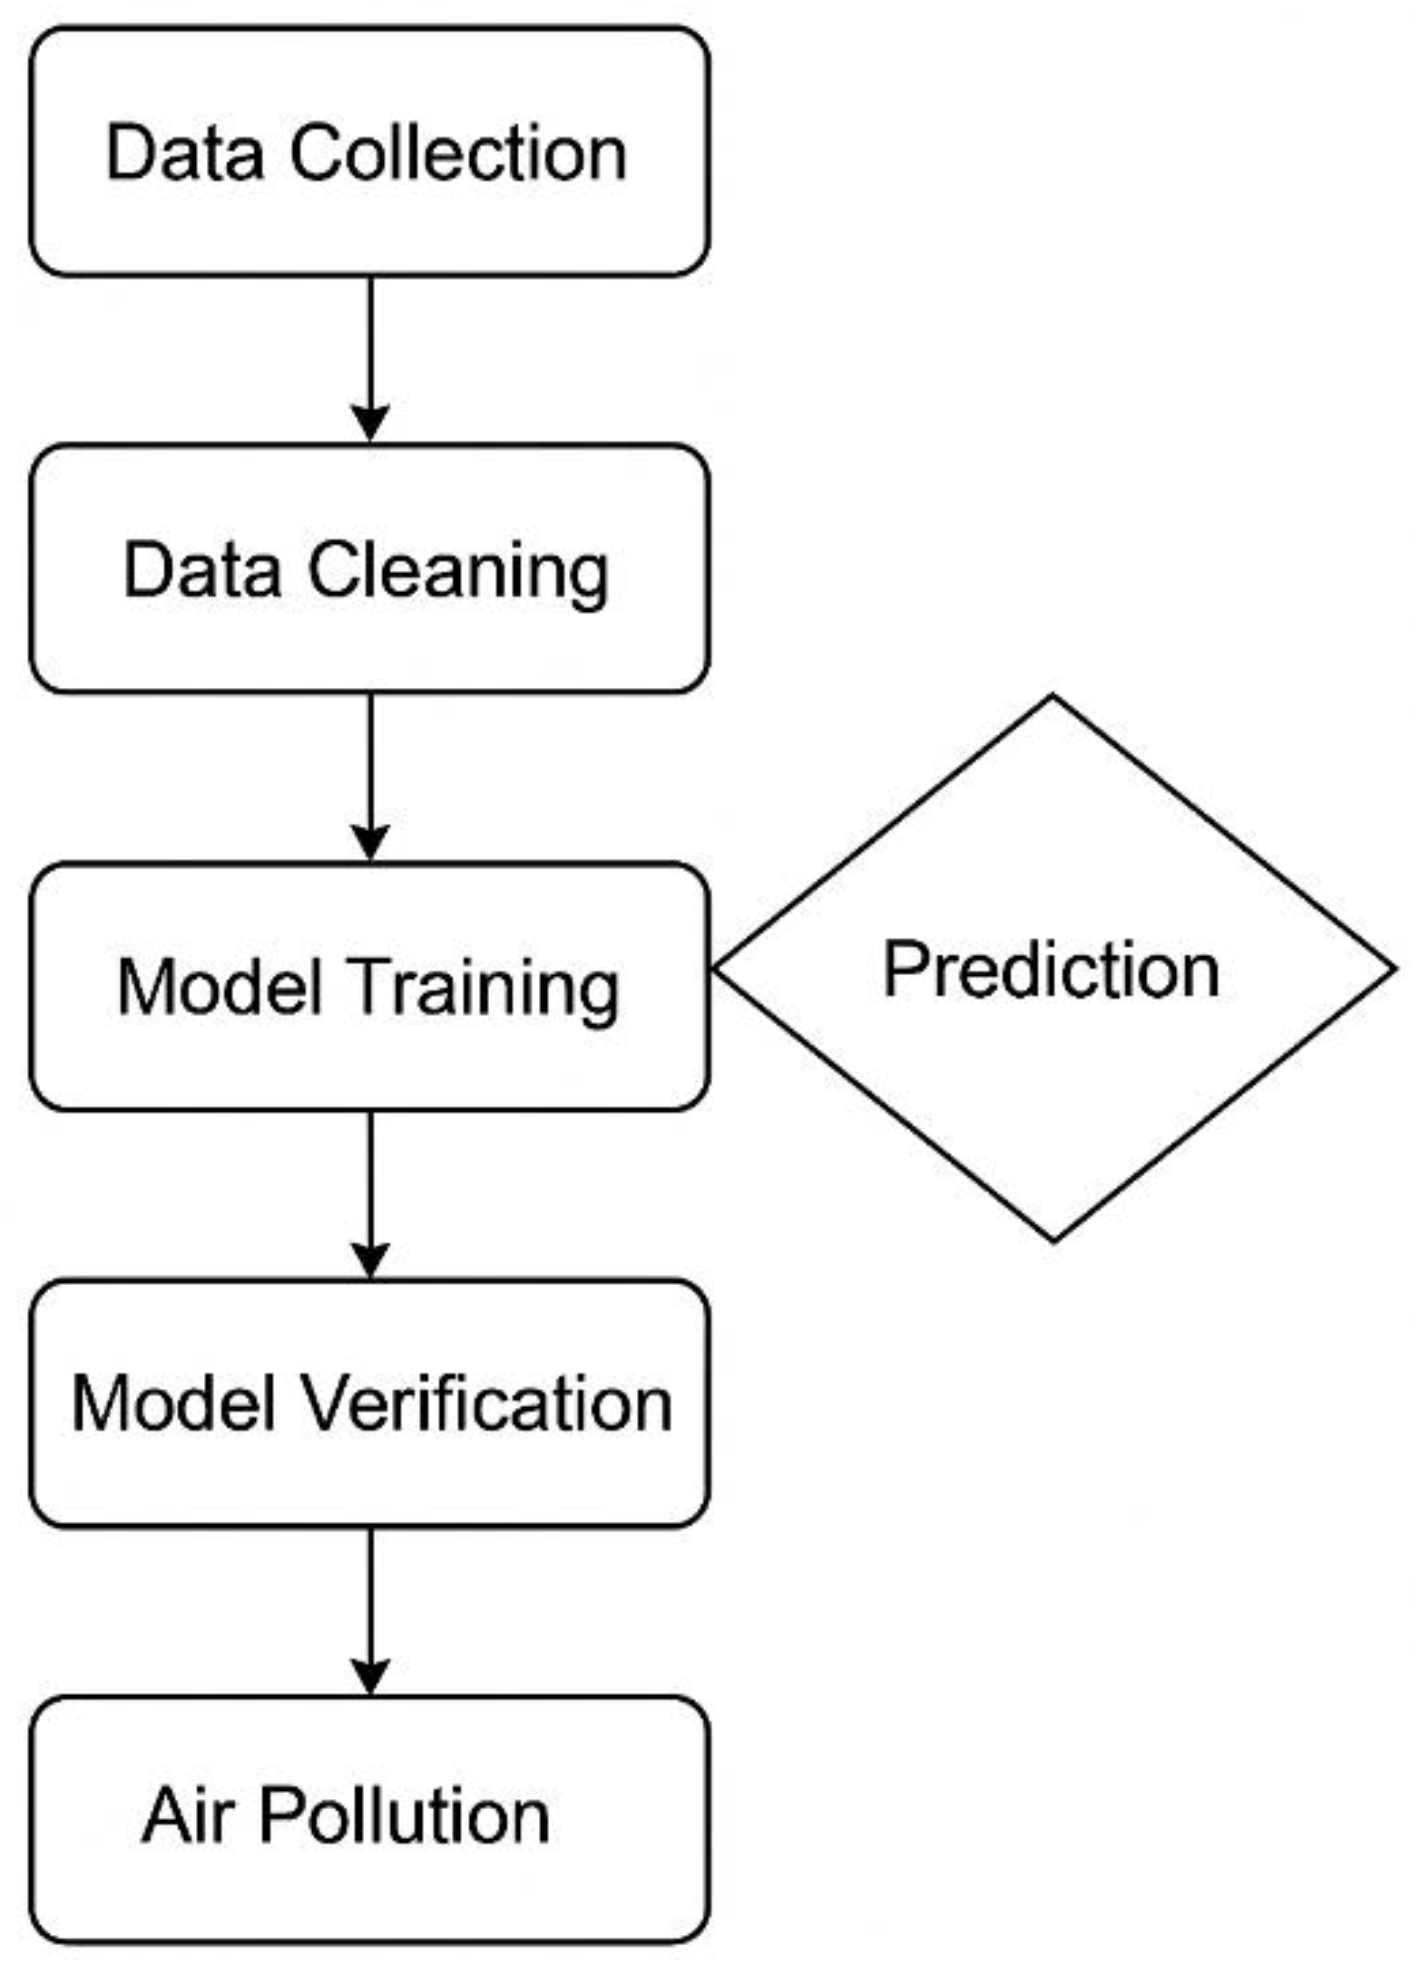

Table 1.
Summary of Most Related Works in Literature.
| Author(s) | Year | Technique Used | Region Studied | Key Finding |
|---|---|---|---|---|
| [9] | 2022 | Multimodal Fusion + AOD | Global | High AOD prediction accuracy (R = 0.83) |
| [1] | 2021 | SARIMA, HYSPLIT | Lahore, Pakistan | Persistent PM2.5 levels > 100 µg/m³ |
| [2] | 2024 | DL + Wasp Interface | Australia | High accuracy in real-time pollution monitoring |
| [3] | 2024 | CNN-LSTM + Mobile Monitoring | Paris, Chicago | Increased spatial resolution (up to 83.3%) |
| [4] | 2021 | Temporal Trend Analysis | Europe | Regulatory interventions reduced violations |
| [5] | 2025 | Spectrophotometry + Statistics | Indoor (Multiple) | High heavy metal exposure risk for children |
| [10] | 2024 | LightGBM + LSTM | China (GBA) | Improved AQI prediction accuracy (97.5%) |
Table 2.
Dataset Features.
| Attribute | Description |
|---|---|
| Temperature | Ambient temperature |
| Humidity | Relative humidity (%) |
| PM2.5 | Particulate matter ≤ 2.5 µm (µg/m³) |
| NO2 | Nitrogen dioxide (µg/m³) |
| SO2 | Sulfur dioxide (µg/m³) |
| CO2 | Carbon monoxide (µg/m³) |
| Proximity to Industry | Distance from industrial areas |
| Population Density | People per km² |
| Air Quality | Categorical target (Good, Moderate, Dangerous) |
Table 3.
Accuracy Comparison on Original vs. Preprocessed Dataset.
| Model | Accuracy (Original) | Accuracy (Preprocessed) |
|---|---|---|
| Decision Tree | 78.3% | 82.1% |
| Random Forest | 85.4% | 89.2% |
| SVM | 81.7% | 86.5% |
| KNN | 74.6% | 79.8% |
Table 4.
Classification Report for Random Forest (Preprocessed Dataset).
| Class | Precision | Recall | F1-Score |
|---|---|---|---|
| Good | 0.89 | 0.91 | 0.90 |
| Moderate | 0.87 | 0.85 | 0.86 |
| Poor | 0.90 | 0.91 | 0.90 |
Disclaimer/Publisher’s Note: The statements, opinions and data contained in all publications are solely those of the individual author(s) and contributor(s) and not of MDPI and/or the editor(s). MDPI and/or the editor(s) disclaim responsibility for any injury to people or property resulting from any ideas, methods, instructions or products referred to in the content. |
© 2025 by the authors. Licensee MDPI, Basel, Switzerland. This article is an open access article distributed under the terms and conditions of the Creative Commons Attribution (CC BY) license (http://creativecommons.org/licenses/by/4.0/).
Copyright: This open access article is published under a Creative Commons CC BY 4.0 license, which permit the free download, distribution, and reuse, provided that the author and preprint are cited in any reuse.


