

Submitted:
13 November 2025
Posted:
14 November 2025
You are already at the latest version
Abstract
The presence of duplicate bugs in defect tracking systems creates an additional burden on software engineering specialists, potentially causing delays in fixing critical bugs. The use of automated methods for detecting duplicates relieves this burden and re-duces the time and cost associated with their processing. Detecting duplicate bug re-ports in large databases is a challenging task that requires a balance between compu-tational efficiency and prediction accuracy. Traditional approaches either rely on re-source-intensive searches or use classification models that, while highly accurate, compromise performance. This paper proposes a new approach to automatic duplicate bug detection based on a two-level analysis of text features in reports. The first stage involves vectorising text data using BERT (Bidirectional Encoder Representations from Transformers), MiniLM (Miniature Language Model) and MPNet (Masked and Per-muted Pre-training for Language Understanding) transformer models, which deter-mine the semantic similarity between defect descriptions. This reduces the number of potential duplicates and the volume of reports that need to be compared. The second stage involves classifying pairs of potential duplicates using machine learning algo-rithms, including XGBoost (eXtreme Gradient Boosting), SVM (Support Vector Ma-chines) and logistic regression. The models are trained on vector representations of text to assess the degree of similarity between errors. The combination of transformer mod-els with classical classification algorithms ensures high accuracy in detecting dupli-cates while significantly reducing query processing time. The results of the experi-ments confirm the effectiveness of the approach, demonstrating its ability to reduce the number of required comparisons, cut the cost of analysing defect reports, and achieve sufficient accuracy in duplicate detection.
Keywords:
duplicate detection
; deep learning
; transfer learning
; natural language processing
; computational efficiency
1. Introduction
Modern software development involves the active use of bug tracking systems that document defects detected during both testing and operational use. These systems enable the storage, analysis and coordination of defect fixes, ensuring continuous improvement in product quality [1,2,3,4]. Each bug report contains both structured metadata (software version, component, author, timestamps) and unstructured text descriptions, which play a key role in the process of diagnosing and troubleshooting problems [5,6].
However, as projects grow in scale and the number of users increases, the proportion of duplicate reports, i.e. cases where the same bug is reported repeatedly under different formulations, increases sharply. According to empirical studies, such duplicates create a significant additional burden on development and testing teams [2]. At the same time, they sometimes contain additional details that help to localise the problem more accurately, so the task is not only to remove them, but also to recognise and combine them in a timely manner [3]. Such repetition of reports complicates the reproducibility of analytics and the comparative nature of methods, which necessitates standardised data sets for the correct evaluation of approaches [7,8].
Duplicate identification has traditionally been performed using information retrieval methods that compare text representations of reports by keywords, TF-IDF vector similarity, or lexical metrics [5,6]. Subsequent work focused on improving the quality of ranking potential duplicates and enriching text features, which increased accuracy without a noticeable increase in computational costs [9,10]. Such methods use various combinations of text features and metadata, as well as result ranking mechanisms, which later became the basis for modern hybrid systems.
With the further development of natural language processing methods, researchers focused on improving the semantic sensitivity of models, reducing dependence on superficial text similarity. During the transition phase, vector representations of words such as Word2Vec were actively used, which made it possible to model latent semantic relationships between terms in reports and thus improve the quality of duplicate search while maintaining acceptable computational costs [11]. Further advances in deep learning ensured the transition to automatic feature extraction: neural networks based on convolutional and Siamese architectures learned to detect similarities even with minimal lexical matches and exceeded the accuracy of classical information retrieval models [12,13]. Concurrently, solutions began to take into account the structural and behavioural characteristics of systems: in particular, the relationships between artefacts and stack traces, which allow for broader modelling of the project context [14,15].
At the same time, significant attention has been paid to improving the quality of the candidate search stage, which largely determines the overall effectiveness of the process. Approaches have been developed for reformulating queries and optimising text descriptions of bug reports, which makes it possible to obtain more relevant results already at the initial stage of processing [16,17,18]. Together, these studies laid the foundation for the emergence of modern semantic search methods capable of combining high accuracy with scalability [19,20,21].
In this context, pre-trained transformer models—BERT [22], Sentence-BERT [23], MiniLM [24], and MPNet [25] — play a special role, providing context-rich vector representations of text. Thanks to such representations, it is possible to quickly find semantically similar reports in a large database using approximate neighbour search methods in multidimensional space, and then refine the result using a classification module.
Thus, this paper proposes a combined approach to duplicate detection in bug tracking systems, which combines the efficiency of vector search with the accuracy of classification models. At the search stage, semantic encoding of reports is used with the MiniLM and MPNet models, which ensures the formation of compact vectors and a quick search for candidates in multidimensional space. The resulting pairs are checked by a classifier, which refines the result and minimises the number of false matches. This approach facilitates a balance between performance and accuracy, increasing the practical applicability of artificial intelligence methods to support defect management in large software projects.
2. Related Works
The detection of duplicate error reports has evolved considerably, progressing from simple heuristic solutions to complex models based on deep learning and modern language technologies. Early approaches combined information retrieval methods, such as BM25 ranking, with vector representations of words to improve the search for similar reports [26]. This helped to overcome simple differences in wording between reports, but proved insufficient for understanding their full meaning or context. With the development of technology, Siamese neural networks began to be used, which automatically learned to extract semantic features from text [27]. Convolutional neural networks were also used toidentify important phrases and forme a holistic understanding of the content of the report [28]. However, such neural approaches required significant computational resources and had limited scalability. In addition, research on evaluation methods [29] showed that the effectiveness of many early approaches was overstated due to the use of limited datasets that did not reflect real-world conditions. This highlights the importance of conducting experiments on large real-world datasets to obtain more reliable and practically relevant results.
Recent studies have also focused on the use of hybrid architectures that combine semantic vector representations of sentences with fast vector similarity search methods, as well as the subsequent application of machine learning classifiers to improve the accuracy of duplicate error report detection. In particular, one study [30] used the BERT model to construct meaningful vector representations of reports, which are then analysed by a multilayer perceptron, allowing for more accurate detection of duplicates, taking into account their key details and subtle semantic differences. Another work [31] combined vector representations of sentences with Faiss, a high-performance library for vector similarity search, significantly improving the scalability of the system. Yet another study [32] implemented a hybrid approach with a two-step process: first, a quick search for candidates is performed using vector similarity, and then the results are refined using a trained classifier to effectively balance detection accuracy and computational efficiency.
Retraining vector representations of sentences on specific error report data [33] showed improvement in the ability to distinguish subtle semantic variations, which contributed to more accurate duplicate identification. Finally, the potential of large language models such as GPT was explored in [34], where ChatGPT was used to extract enriched semantic representations of reports. While this approach improved accuracy, it also increased computational requirements, which may limit its practical application.
Despite these successes, challenges remain in balancing scalability, computational cost, and semantic accuracy. Methods based solely on vector representations sometimes fail to distinguish between lexically similar but semantically different reports, and large transformer models are not always practical for real-time operation. This is what motivates the research of a hybrid method that combines compact transformer models without the need for additional training for fast candidate search and an easy classification stage to improve accuracy, ensuring scalability, easy integration, and suitability for use in real-world conditions.
3. Materials and Methods
The proposed duplicate error detection system uses a structured approach that integrates search and classification models, ensuring efficient and accurate identification of duplicate errors. A visual representation of the algorithm is shown in Figure 1. The system consists of the following key steps:
- Preliminary report processing
Each new error undergoes minimal pre-processing, during which the title and description are extracted and combined into a single text block. In previous works, these fields were used as the main signal sources for text search and similarity [18], as well as in modern two-stage candidate selection systems [32]. Preliminary experiments were conducted to find the optimal way to represent the text. Vectorisation of only the title, only the description, and combined vectorisation of the title and description were evaluated, as well as additional pre-processing steps such as stop word removal, lemmatisation, and stemming. The results showed that combining the title and description provides the most informative representation, as it covers both the general summary of the problem and its detailed description. Further text normalisation had a minimal impact on performance, as the transformer models considered in the next step are capable of handling these aspects on their own.
- 2.
- Generation of vector representations
The processed text blocks of errors are converted into dense vector representations using pre-trained transformer models. For the -th error report with the title and description the vectors are calculated using the formula:
where — is the text vectorisation transformer model, and denotes concatenation.
- 3.
- Indexing and searching in ChromaDB
The generated vector representations are stored in ChromaDB, a vector database that enables efficient search for approximate nearest neighbours for large-scale selection, as demonstrated in [31]. ChromaDB provides fast search for potential duplicates by organising vector representations into a structured index optimised for similarity search. For a new bug report the system retrieves the K most similar reports based on cosine similarity:
where represents the vectors stored in ChromaDB.
- 4.
- Classification and refinement
Selected candidates are further analysed using machine learning classification models to determine whether they are true duplicates. The classifier is trained on unlabelled pairs of bug reports, with vector representations of text blocks concatenated as follows
where — is the classification model.
- 5.
- Final decision
If the system detects a duplicate with high confidence, the error report is linked to an existing issue. If no duplicate is found, the report is not associated with any of the existing errors. The proposed hybrid approach, combining semantic search and classification, ensures scalability and accuracy in duplicate detection, effectively handling the variability of error descriptions.
The dataset used in this study is BugHub, a large-scale collection of bug reports obtained from several open-source projects. It contains structured metadata, including titles, descriptions, timestamps, components, and references to duplicates. BugHub is a well-suited dataset for duplicate detection research because it contains labelled duplicate relationships, allowing for the evaluation of both search and classification models.
Each bug report contains the following fields selected for analysis:
- Bug ID: A unique identifier for each report;
- Title: A short text description of the problem;
- Description: A detailed explanation of the problem, including steps to reproduce, relevant versions, and a comparison of expected and actual behaviour;
- Duplicated Issue: An indication of whether this bug has been marked as a duplicate and the number of the corresponding pair.
This study focuses on five key projects in BugHub: Mozilla Core, Firefox, Thunderbird, Eclipse Platform, and JDT. These projects cover a variety of domains, from web browsers to integrated development environments, ensuring that our findings are generalisable to different types of software. Figure 2 provides an overview of the dataset, including the total number of reported issues and the number of confirmed duplicates for each project.
To prepare the dataset for experiments, we form a diverse and representative set of pairs of bug reports. This combination covers a wide range of similarity levels, from identical duplicates to closely related but distinct reports, as well as completely dissimilar bugs. Accordingly, the following three types of relationships are combined:
- duplicates within a single duplicate group — reports that are explicitly marked as relating to the same issue;
- duplicates from different groups within a single project — pairs originating from separate duplicate groups within a single project. They may be semantically similar but not marked as exact duplicates, which helps the classifier learn to distinguish between similar and unrelated reports;
- non-duplicates — randomly selected reports from the same project that have no duplicate connections.
The dataset is divided into a training set of 10,000 pairs of error reports and a test set of 2,000 pairs, with carefully balanced ratios of duplicates and non-duplicates. In the training set, duplicates and non-duplicates are distributed evenly (50% duplicates, 50% non-duplicates), which ensures uniform training of the classifier. However, the test set reflects the real conditions of error tracking, where duplicates occur much less frequently. As a result, only 20% of test pairs are duplicates, while 80% are not. This deliberate imbalance ensures that the classifier is evaluated under realistic conditions, making it more robust to deployment in situations where unrelated errors significantly outweigh true duplicates.
Since the task of detecting duplicates involves finding reports that are similar in content, special attention was paid to transformer models that allow for the construction of contextually rich vector representations of text. BERT [22], MiniLM [24], and MPNet [25] were selected because they provide a different balance between speed and accuracy. BERT is a powerful base model that forms multi-valued text representations, but it is resource-intensive and not optimised for semantic search. MiniLM, thanks to its compactness, speeds up computations without significant loss of quality. MPNet demonstrates improved ability to model text semantics, which is especially important for recognising rephrased error descriptions.
Several traditional machine learning algorithms were considered for classifying potential duplicates: logistic regression, support vector machines, and XGBoost. Logistic regression allows for effective estimation of the probability that two reports describe the same problem, making it a simple and interpretable baseline model. The support vector machine (SVM) method was tested due to its ability to work with high-dimensional spaces and find nonlinear relationships. To increase speed and adaptability to complex data distributions, XGBoost was used. Leveraging gradient boosting mechanisms, it takes into account previous errors and improves classification results.
The combination of transformer models for obtaining vector representations and classical machine learning algorithms for classification made it possible to develop an effective system for searching for duplicate error reports. This approach takes into account both the accuracy of detecting similar records and the speed of processing, which is critical for integration into real workflows.
Several key metrics are used to evaluate search and classification performance: Recall@k, Accuracy, Precision, Recall, F1-measure and ROC curve (Receiver Operating Characteristic).
Recall@k, or search completeness, determines the proportion of relevant items that appear in the first found k results, which is especially important when only the most relevant results are considered. It is calculated using the formula:
Accuracy reflects the overall correctness of the classification model by measuring the ratio of correctly classified cases (both positive and negative) to the total number of cases. The formula is given below:
where:
- TP true positive predictions (correctly classified positive cases);
- TN true negative predictions (correctly classified negative cases);
- FP false positive predictions (incorrectly classified as positive);
- FN false negative predictions (incorrectly classified as negative).
Precision, or positive predictive value, measures the accuracy of positive predictions by determining the ratio of true positive predictions to the total number of predicted positive cases, calculated as follows
Recall, or the true positive prediction rate, assesses the model's ability to identify all relevant cases:
F1-measure is a harmonic mean of Precision and Recall, providing a single metric that balances accuracy and completeness. It is particularly useful when classes are unevenly distributed in a dataset. The following formula is:
However, to fully evaluate the model's performance, it is important to consider not only the balance between accuracy and completeness, but also the relationship between sensitivity and specificity at different classification thresholds, which is best demonstrated on the ROC curve.
Sensitivity is another name for the Recall metric and is presented in the formula. Specificity measures how well the model recognises unique reports while avoiding false positive predictions. It is calculated using the formula:
4. Experiment and Results
Table 1, Table 2, Table 3, Table 4 and Table 5 show the results of a comparative evaluation of the BERT, MiniLM, and MPNet models using the (4) Recall@K metric (where K = 10, 50, 100) for the task of identifying duplicates within five software projects: Eclipse JDT, Eclipse Platform, Mozilla Core, Mozilla Firefox, and Mozilla Thunderbird.
Table 6, Table 7, Table 8, Table 9 and Table 10 present a comparison of the performance of three classification models — Logistic Regression, SVM, and XGBoost — for five different software projects: Eclipse JDT, Eclipse Platform, Mozilla Core, Mozilla Firefox, and Mozilla Thunderbird. The evaluation is based on four basic metrics: Accuracy (5), Precision (6), Recall (7), and F1-score (8).
Figure 3 presents a comparative analysis of ROC curves for three classification models — Logistic Regression, Support Vector Machine, and XGBoost — using five software projects as examples: Eclipse JDT, Eclipse Platform, Mozilla Core, Mozilla Firefox, and Mozilla Thunderbird. For each model, the classification quality is evaluated based on the area under the ROC curve (AUC), which allows analysing their ability to distinguish between positive and negative classes at different classification thresholds. To construct ROC curves, the values of Sensitivity (7) and Specificity (9) were calculated at different classification thresholds.
Additionally, a system has been developed that provides a convenient graphical interface for users to automatically detect duplicate error reports. To demonstrate how the proposed system works, we use a subset of Mozilla Firefox error reports that contain recurring errors that are difficult to detect manually. Figure 4a shows the system preparation process, including data set loading, model selection, and classifier training. Figure 4b shows the duplicate search stage, where the user enters a new report and the system automatically finds the most similar errors.
The interaction begins with loading a dataset containing previous reports, their descriptions, and information about possible duplicates. After importing the data, the user can view it in a table and choose an approach to duplicates analysis:
- Accurate method (SVM + MPNet) — provides maximum accuracy using powerful deep vector representations of text and non-linear classification methods.
- Fast method (XGBoost + MiniLM) — offers a compromise between speed and accuracy using efficient but less resource-intensive models.
After selecting an approach, the programme prepares a vector database that allows you to quickly search for similar reports and trains a classifier that determines whether two reports are true duplicates. The user can track the progress of the preparation process thanks to a logging system that shows the key stages of configuration in real time.
When the system is ready, the user can add a new report by specifying its title and description. The programme automatically searches the vector database, finds the most similar reports, and then classifies which ones are true duplicates. The results are displayed as a list of the most similar reports, allowing the user to check them manually and confirm the duplicates.
Thus, the system significantly reduces the workload on testing teams, helping them quickly find duplicates without the need for lengthy manual analysis. This speeds up the processing of bug reports, increases the efficiency of development teams, and helps optimise software defect elimination processes.
5. Discussion
The search results demonstrate the significant advantages of using models pre-trained for semantic similarity. MPNet consistently achieves the highest completeness score for all projects, confirming its effectiveness in semantic search tasks. MiniLM shows slightly lower results, but provides comparable performance with reduced computational load, making it a good choice for cases where processing speed is a priority.
In contrast, BERT shows significantly lower results, once again confirming the importance of using models optimised for semantic similarity search. It is also worth noting that the performance of the models depends on the structure and terminology of the error reports. For example, in the Mozilla Core project, the scores are lower, probably due to more diverse and less structured error descriptions.
An analysis of the dependence of accuracy on the K parameter in the Recall@K metric showed that accuracy increases significantly as K increases. The result is consistent with expectations, as a larger candidate set increases the probability of finding a true duplicate. However, the study also found that after a certain K threshold, the efficiency increases less significantly, and an excessively large value can lead to the inclusion of irrelevant reports. The optimal value of K = 100 was determined experimentally as a compromise between achieving high recall and minimising unnecessary computations.
The key conclusion of this stage of the research is that using pre-trained models for semantic search outperforms over training your own models from scratch. MiniLM and MPNet demonstrate that by using pre-trained models specifically optimised for sentence comparison, high search accuracy can be achieved without the need for additional training. Furthermore, our results confirm that general-purpose language models such as BERT are not effective enough for search tasks without additional training, as they cannot effectively rank semantically similar bug reports. The integration of MPNet for high search accuracy and MiniLM as a lightweight alternative, combined with ChromaDB for efficient vector search, forms a robust and scalable mechanism for detecting duplicate errors.
The results demonstrate the superiority of SVM and XGBoost in duplicate detection, with SVM achieving the highest F1 score in most datasets, making it the most accurate model for distinguishing true duplicates from similar ones. In particular, SVM achieves an F1 score >= 0.94 for Mozilla Thunderbird and Mozilla Firefox, making it the best model for these datasets. XGBoost, in turn, shows the highest F1 score on Mozilla Core, demonstrating its effectiveness on structured report sets containing well-defined recurring errors. High precision and recall values for both models indicate that they successfully identify true duplicates while minimising false positives, providing a balance between duplicate detection and classification. However, XGBoost's ability to effectively balance precision and recall suggests that it may be a better choice for large-scale projects, providing faster processing than SVM with similar F1 performance.
Unlike XGBoost and SVM, logistic regression is significantly inferior in terms of performance, as its F1 score does not exceed 0.80 in most cases. This confirms that duplicate detection is a non-linear problem that requires models capable of finding complex decision boundaries. The low accuracy and precision values for logistic regression indicate that it does not distinguish well between duplicates and non-duplicates, leading to both false positives and false negatives. Although including logistic regression in the analysis as a baseline model is useful, its poor performance confirms that simple linear models are not suitable for classifying duplicate errors.
Confirmation of the conclusions can be seen in the ROC curves, which illustrate the effectiveness of the models at different decision threshold values (Figure 4). SVM demonstrates the highest area under the curve (AUC = 0.94–0.98), confirming its superiority in classification accuracy, especially for the Mozilla Thunderbird and Firefox sets. XGBoost (AUC = 0.92–0.96) also shows consistently high results, yielding only slightly to SVM. Logistic regression (AUC = 0.61–0.72) lags significantly behind, confirming its inability to adequately separate duplicates from non-duplicates. The high AUC values for SVM and XGBoost demonstrate their effectiveness in finding the optimal compromise between sensitivity and specificity, which is critical for the task of duplicate detection.
Also, an interesting discrepancy is observed when comparing the effectiveness of retrieval and classification in different projects. Mozilla Core, which had the lowest completeness value at the search stage, achieves the highest F1 value for XGBoost (0.95), indicating that despite the difficulty in obtaining correct duplicate candidates, it is easier to classify them correctly after the search. This probably means that Mozilla Core contains strong duplicates of bug reports, but their wording is inconsistent, which complicates the search stage but simplifies classification. Once the correct candidates are found, the classifier has no difficulty distinguishing true duplicates from non-duplicates, which explains the high classification efficiency for Mozilla Core, despite weaker results at the candidate extraction stage.
A comparison with current research demonstrates the key advantages of our chosen approach. Article [35] uses an analytical hierarchical process (AHP) to optimise the selection of optimal algorithms. However, unlike the specialised MPNet and MiniLM models, AHP does not have the ability to perform semantic embedding.
In [36], Shannon's entropy method is used for pre-processing data. But the complexity of its adaptation and the need for significant modifications to work correctly with high-dimensional vector representations of natural language make it less effective. While the predictive models in [37] focus on predicting changes in numerical indicators over time, our approach has a fundamental advantage for solving the problem of duplicate detection. Another common method is Bayesian analysis [38], but it requires significant resources to ensure the accuracy of the research results. Thus, our two-stage approach is both specialised and technologically superior, as it is specifically designed to solve the complex problem of semantic similarity in error datasets, ensuring high accuracy and scalability.
These results emphasise that the effectiveness of error duplicate detection depends not only on the selected search and classification models, but also on the structure of the dataset itself. Some datasets may contain vaguely formulated duplicates, which complicates search but facilitates classification, while others contain subtle differences between duplicates, which, conversely, complicates classification. Future research may consider hybrid approaches that dynamically adjust search thresholds and classification models depending on the characteristics of the dataset. In addition, domain adaptation techniques can be used to fine-tune models for specific software ecosystems, ensuring reliable performance in different bug tracking environments.
6. Conclusions
The proposed approach combines semantic search based on contextual vector representations with classification refinement, which allows for effective detection of duplicate bug reports. Experiments have shown that MPNet provides the highest completeness in search, while MiniLM offers the optimal balance between speed and quality. For classification tasks, SVM achieves the highest accuracy, especially with MPNet embeddings, while XGBoost provides faster computation without sacrificing result quality. The optimal combination for practical application is MiniLM for search and XGBoost for classification, as it provides fast processing and high accuracy. For critical tasks with a priority on accuracy, the best choice is MPNet in combination with SVM. Thus, the choice of models must take into account the system requirements for speed or accuracy. The proposed solution also combines the use of ready-trained models, enabling high efficiency with minimal configuration and implementation effort.
Author Contributions
Conceptualization, I.P. and A.K.; methodology, V.S., O.B. and L.S.; software, O.B. and A.K.; validation, I.P., N.L. and V.S.; formal analysis, O.B. and L.S.; investigation, I.P., V.S. and L.S.; resources, N.L. and A.K.; data curation, V.S. and L.S.; writing—original draft preparation, I.P. and O.B.; writing—review and editing, V.S. and N.L.; visualization, A.K. and O.B.; supervision, I.P. and N.L.; project administration, A.K.; funding acquisition, I.P., L.S. and N.L. All authors have read and agreed to the published version of the manuscript.
Funding
This research received no external funding.
Data Availability Statement
The raw data supporting the conclusions of this article will be made available by the authors on request.
Conflicts of Interest
The authors declare no conflicts of interest.
References
- Guo, P. J.; Zimmermann, T.; Nagappan, N.; Murphy, B. Characterizing and predicting which bugs get fixed: An empirical study of Microsoft Windows. In Proceedings of the 32nd ACM/IEEE International Conference on Software Engineering (ICSE 2010). Cape Town, South Africa, 2010, 495–504. [CrossRef]
- Rakha, M.; Shang, W.; Hassan, A. E. Studying the needed effort for identifying duplicate issues. Empirical Software Engineering 2016, 21(5), 1960–1989. [CrossRef]
- Bettenburg, N.; Premraj, R.; Zimmermann, T.; Kim, S. Duplicate bug reports considered harmful… really? In Proceedings of the IEEE International Conference on Software Maintenance (ICSM 2008). Beijing, China, 2008, 337–345. [CrossRef]
- Herzig, K.; Just, S.; Zeller, A. It’s not a bug, it’s a feature: How misclassification impacts bug prediction. In Proceedings of the 35th International Conference on Software Engineering (ICSE 2013). San Francisco, CA, USA, 2013, 392–401. [CrossRef]
- Runeson, P.; Alexandersson, M.; Nyholm, O. Detection of duplicate defect reports using natural language processing. In Proceedings of the 29th International Conference on Software Engineering (ICSE 2007). Minneapolis, MN, USA, 2007, 499–510. [CrossRef]
- Wang, X.; Zhang, L.; Xie, T.; Anvik, J.; Sun, J. An approach to detecting duplicate bug reports using natural language and execution information. In Proceedings of the 30th International Conference on Software Engineering (ICSE 2008). Leipzig, Germany, 2008, 461–470. [CrossRef]
- Lazar, A.; Ritchey, S.; Sharif, B. Generating duplicate bug datasets. In Proceedings of the 11th Working Conference on Mining Software Repositories (MSR 2014). Hyderabad, India, 2014, 392–395. [CrossRef]
- Zhang, T.; Han, D.; Vinayakarao, V.; Irsan, I. C.; Xu, B.; Thung, F.; Lo, D.; Jiang, L. Duplicate bug report detection: How far are we? ACM Transactions on Software Engineering and Methodology (TOSEM) 2023, 32(4), Article 97, 1–32. [CrossRef]
- Sun, C.; Lo, D.; Khoo, S.-C.; Jiang, J. Towards more accurate retrieval of duplicate bug reports. In Proceedings of the 26th IEEE/ACM International Conference on Automated Software Engineering (ASE 2011). Lawrence, KS, USA, 2011, 253–262. [CrossRef]
- Nguyen, A. T.; Nguyen, T. T.; Nguyen, T. N.; Lo, D.; Sun, C. Duplicate bug report detection with a combination of information retrieval and topic modeling. In Proceedings of the 27th IEEE/ACM International Conference on Automated Software Engineering (ASE 2012). Essen, Germany, 2012, 70–79. [CrossRef]
- Mahfoodh, H.; Hammad, M. Identifying duplicate bug records using Word2Vec prediction with software risk analysis. International Journal of Computing and Digital Systems 2022, 11, 763–773. [CrossRef]
- He, J.; Xu, L.; Yan, M.; Xia, X.; Lei, Y. Duplicate bug report detection using dual-channel convolutional neural networks. In Proceedings of the 28th International Conference on Program Comprehension (ICPC 2020). Seoul, Republic of Korea, 2020, 117–127. [CrossRef]
- Rocha, T. M.; Carvalho, A. L. D. C. SiameseQAT: A semantic context-based duplicate bug report detection using replicated cluster information. IEEE Access 2021, 9, 44610–44630. [CrossRef]
- Xiao, G.; Du, X.; Sui, Y.; Yue, T. HINDBR: Heterogeneous information network-based duplicate bug report prediction. In Proceedings of the 31st IEEE International Symposium on Software Reliability Engineering (ISSRE 2020). Red Hook, NY, USA, 2020, 195–206. [CrossRef]
- Ebrahimi, N.; Trabelsi, A.; Islam, M. S.; Hamou-Lhadj, A.; Khanmohammadi, K. An HMM-based approach for automatic detection and classification of duplicate bug reports. Information and Software Technology 2019, 113, 98–109. [CrossRef]
- Chaparro, O.; Florez, J. M.; Marcus, A. Using bug descriptions to reformulate queries during text-retrieval-based bug localization. Empirical Software Engineering 2019, 24(5), 2947–3007. [CrossRef]
- Mills, C.; Parra, E.; Pantiuchina, J.; Bavota, G.; Haiduc, S. On the relationship between bug reports and queries for text retrieval-based bug localization. Empirical Software Engineering 2020, 25(5), 3086–3127. [CrossRef]
- Senkivskyy, V.; Pikh,, I.; Senkivska, N.; Hileta, I.; Lytovchenko, O.; Petyak, Yu. Forecasting assessment of printing process quality. Advances in Intelligent Systems and Computing Lecture Notes in Computational Intelligence and Decision Making 2020, 467–479. [CrossRef]
- Senkivskyy, V.; Babichev, S.; Pikh, I.; Kudriashova, A.; Senkivska, N.; Kalynii, I. Forecasting the reader’s demand level based on factors of interest in the book. In Proceedings of the CIT-Risk’2021: 2nd International Workshop on Computational & Information Technologies for Risk-Informed Systems, Kherson, Ukraine, 16–17 September (2021), 2021, 176–191. URL: https://ceur-ws.org/Vol-3101/Paper12.pdf.
- Senkivskyy, V.; Pikh, I.; Kudriashova, A.; Senkivska, N.; Tupychak, L. Models of factors of the design process of reference and encyclopedic book editions. Lecture Notes in Computational Intelligence and Decision Making. ISDMCI 2021. Lecture Notes on Data Engineering and Communications Technologies 2022, 77, 217–229. [CrossRef]
- Senkivskyi, V.; Kudriashova, A.; Pikh, I.; Hileta, I.; Lytovchenko, O. Models of postpress processes designing. In Proceedings of the 1st International Workshop on Digital Content & Smart Multimedia (DCSMart 2019), 2019, 259–270. URL: https://ceur-ws.org/Vol-2533/paper24.pdf.
- Devlin, J.; Chang, M.-W.; Lee, K.; Toutanova, K. BERT: Pre-training of deep bidirectional transformers for language understanding. In Proceedings of the 2019 Conference of the North American Chapter of the Association for Computational Linguistics: Human Language Technologies (NAACL-HLT 2019), Volume 1 (Long and Short Papers). Minneapolis, MN, USA, 2019, 4171–4186. [CrossRef]
- Reimers, N.; Gurevych, I. Sentence-BERT: Sentence embeddings using Siamese BERT-networks. In Proceedings of the 2019 Conference on Empirical Methods in Natural Language Processing and the 9th International Joint Conference on Natural Language Processing (EMNLP-IJCNLP). Hong Kong, China, 2019, 3982–3992. [CrossRef]
- Wang, W.; Wei, F.; Dong, L.; Bao, H.; Yang, N.; Zhou, M. MiniLM: Deep self-attention distillation for task-agnostic compression of pre-trained transformers. Advances in Neural Information Processing Systems (NeurIPS 2020) 2020, 5776–5788. URL: https://proceedings.neurips.cc/paper/2020/file/3f5ee243547dee91fbd053c1c4a845aa-Paper.pdf.
- Song, K.; Tan, X.; Qin, T.; Lu, J.; Liu, T.-Y. MPNet: Masked and permuted pre-training for language understanding. Advances in Neural Information Processing Systems (NeurIPS 2020) 2020, 16857–16867. URL: https://proceedings.neurips.cc/paper/2020/file/c3a690be93aa602ee2dc0ccab5b7b67e-Paper.pdf.
- Yang, X.; Lo, D.; Xia, X.; Bao, L.; Sun, J. Combining word embedding with information retrieval to recommend similar bug reports. In Proceedings of the IEEE 27th International Symposium on Software Reliability Engineering. Ottawa, Canada, 2016, 127–137. [CrossRef]
- Deshmukh, J.; Annervaz, K. M.; Podder, S.; Sengupta, S.; Dubash, N. Towards accurate duplicate bug retrieval using deep learning techniques. In Proceedings of the IEEE International Conference on Software Maintenance and Evolution. Shanghai, China, 2017, 115–124. [CrossRef]
- Xie, Q.; Wen, Z.; Zhu, J.; Gao, C.; Zheng, Z. Detecting duplicate bug reports with convolutional neural networks. In Proceedings of the 25th Asia-Pacific Software Engineering Conference. Nara, Japan, 2018, 416–425. [CrossRef]
- Rakha, M. S.; Bezemer, C.-P.; Hassan, A. E. Revisiting the performance evaluation of automated approaches for the retrieval of duplicate issue reports. IEEE Transactions on Software Engineering 2018, 44(12), 1245–1268. [CrossRef]
- Messaoud, M. B.; Miladi, A.; Jenhani, I.; Mkaouer, M. W.; Ghadhab, L. Duplicate bug report detection using an attention-based neural language model. IEEE Transactions on Reliability 2023, 72(2), 846–858. [CrossRef]
- Lee, S.; Lee, S. Duplicate bug report detection by using sentence embedding and Faiss. CEUR Workshop Proceedings 2023, 3655, 1–6. URL: https://ceur-ws.org/Vol-3655/ISE2023_07_Lee_Duplicate_Bug.pdf.
- Meng, Q.; Zhang, X.; Ramackers, G.; Visser, J. Combining retrieval and classification: Balancing efficiency and accuracy in duplicate bug report detection. In Proceedings of the Eighteenth International Conference on Software Engineering Advances, ICSEA 2023. Valencia, Spain, 2023, 75–84. URL: http://personales.upv.es/thinkmind/dl/conferences/icsea/icsea_2023/icsea_2023_1_120_10057.pdf.
- Isotani, H.; Washizaki, H.; Fukazawa, Y.; Nomoto, T.; Ouji, S.; Saito, S. Sentence embedding and fine-tuning to automatically identify duplicate bugs. Frontiers in Computer Science 2023, 4, Article 1032452. [CrossRef]
- Ammu, S. V. A.; Sehra, S. S.; Sehra, S. K.; Singh, J. Amalgamation of classical and large language models for duplicate bug detection: A comparative study. Computers, Materials & Continua 2025, 83(1), 435–453. [CrossRef]
- Chyrun, L.; Kravets, P.; Garasym, O.; Gozhyj, A.; Kalinina, I. Cryptographic information protection algorithm selection optimization for electronic governance IT project management by the analytic hierarchy process based on nonlinear conclusion criteria. CEUR Workshop Proceedings 2020, 2565, 1–16. URL: https://ceur-ws.org/Vol-2565/paper18.pdf.
- Babichev, S.; Durnyak, B.; Zhydetskyy, V.; Pikh, I.; Senkivskyy, V. Techniques of DNA microarray data pre-processing based on the complex use of bioconductor tools and Shannon entropy. In Proceedings of the Second International Workshop on Computer Modeling and Intelligent Systems (CMIS-2019), 19 April, 2019, 2353, 365–377. URL: https://ceur-ws.org/Vol-2353/paper29.pdf.
- Pikh, I.; Senkivskyy, V.; Kudriashova, A.; Senkivska, N. Prognostic assessment of COVID-19 vaccination levels, Lecture Notes in Data Engineering, Computational Intelligence, and Decision Making 2022, 149, 246–265. [CrossRef]
- Bidyuk, P.; Gozhyj, A.; Szymanski, Z.; Kalinina, I.; Beglytsia, V. The methods bayesian analysis of the threshold stochastic volatility model. In Proceedings of the 2018 IEEE Second International Conference on Data Stream Mining & Processing (DSMP), Lviv, Ukraine, 2018, 70–74. [CrossRef]
Figure 1.
Algorithm for searching for duplicate input errors.
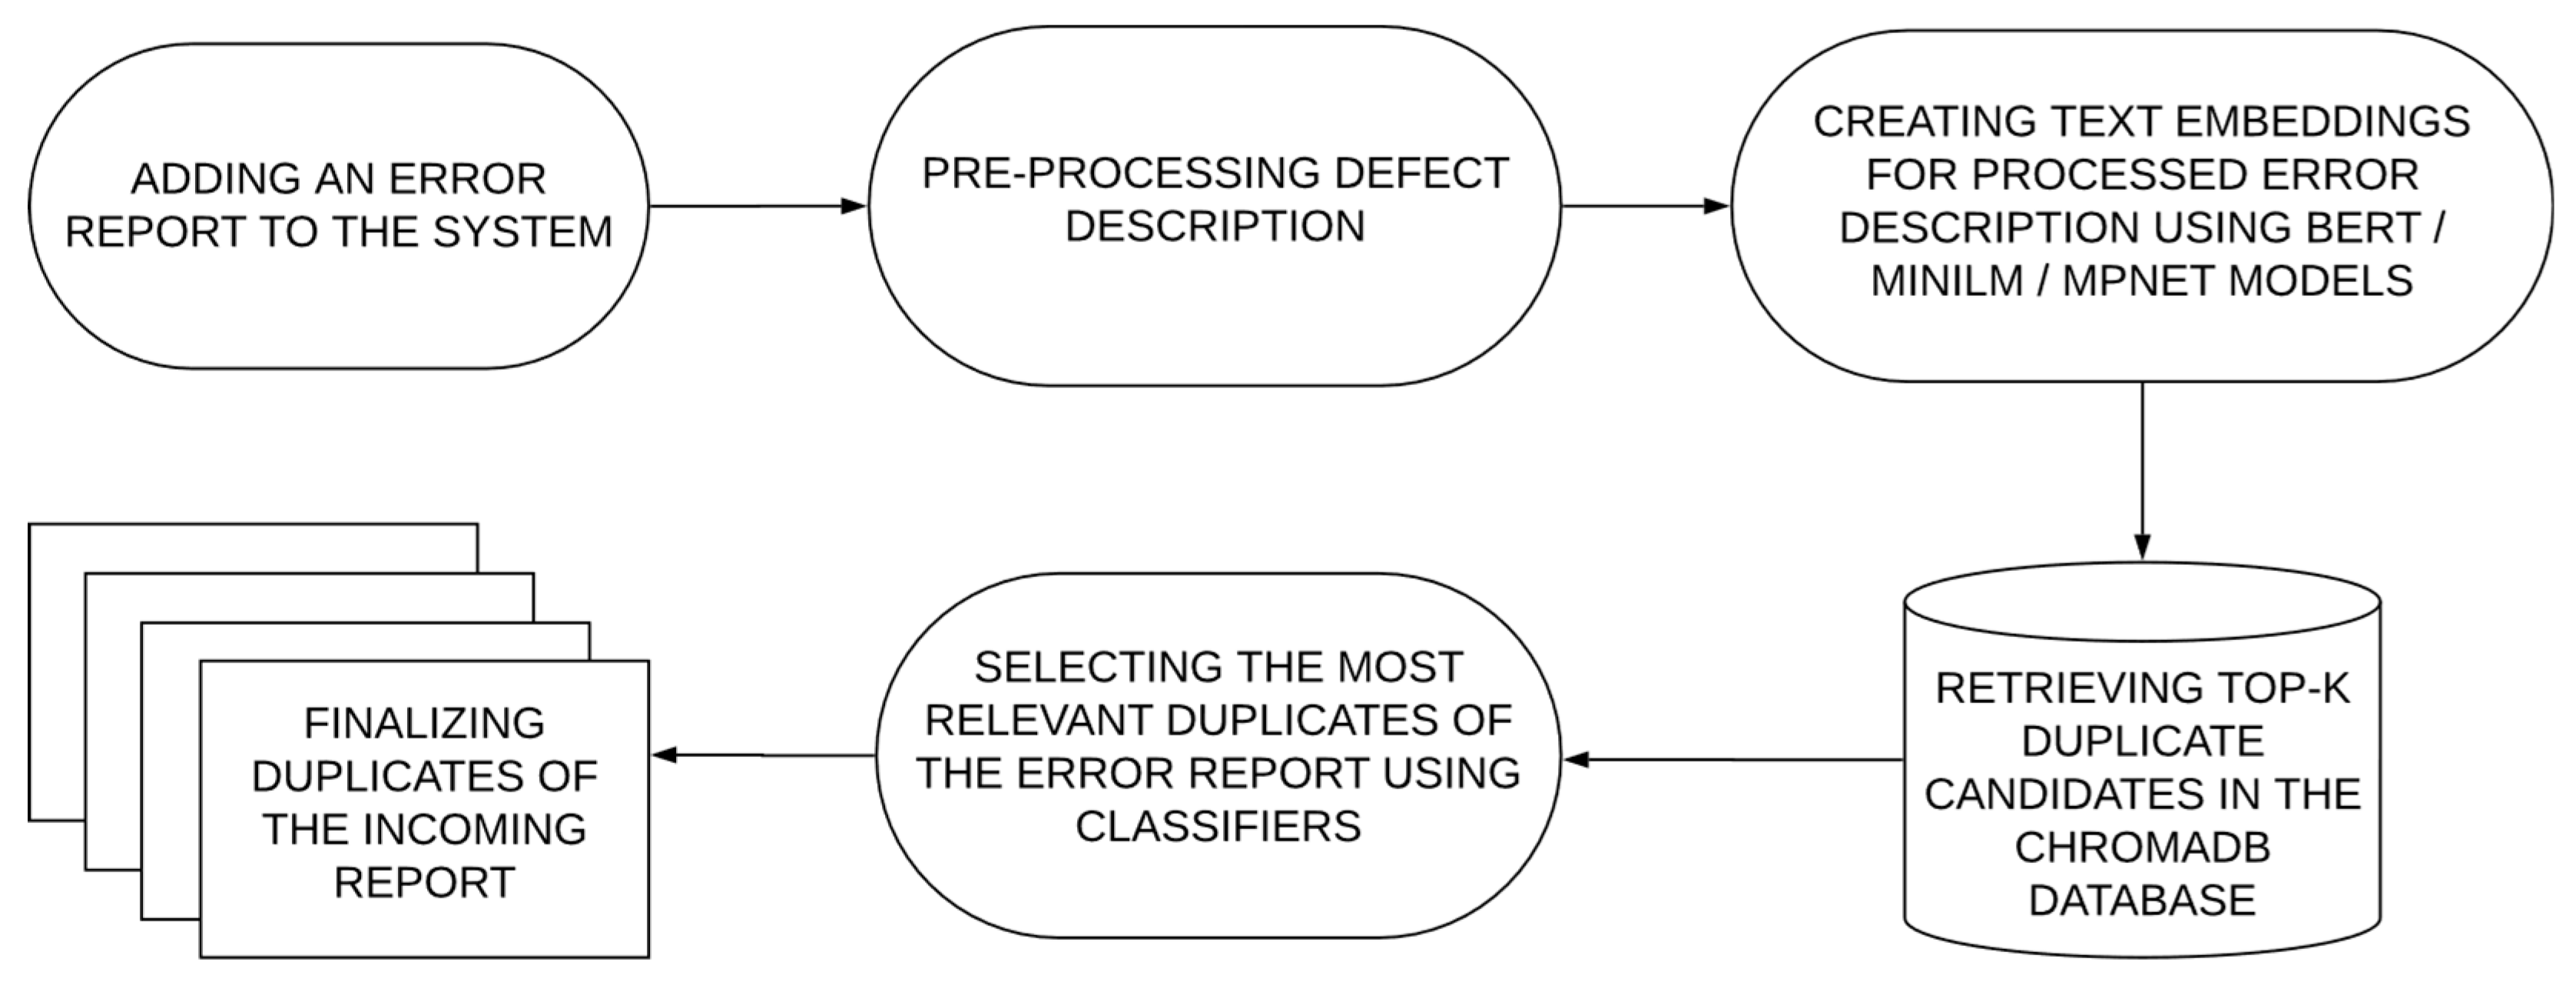
Figure 2.
Data collection statistics for selected projects.
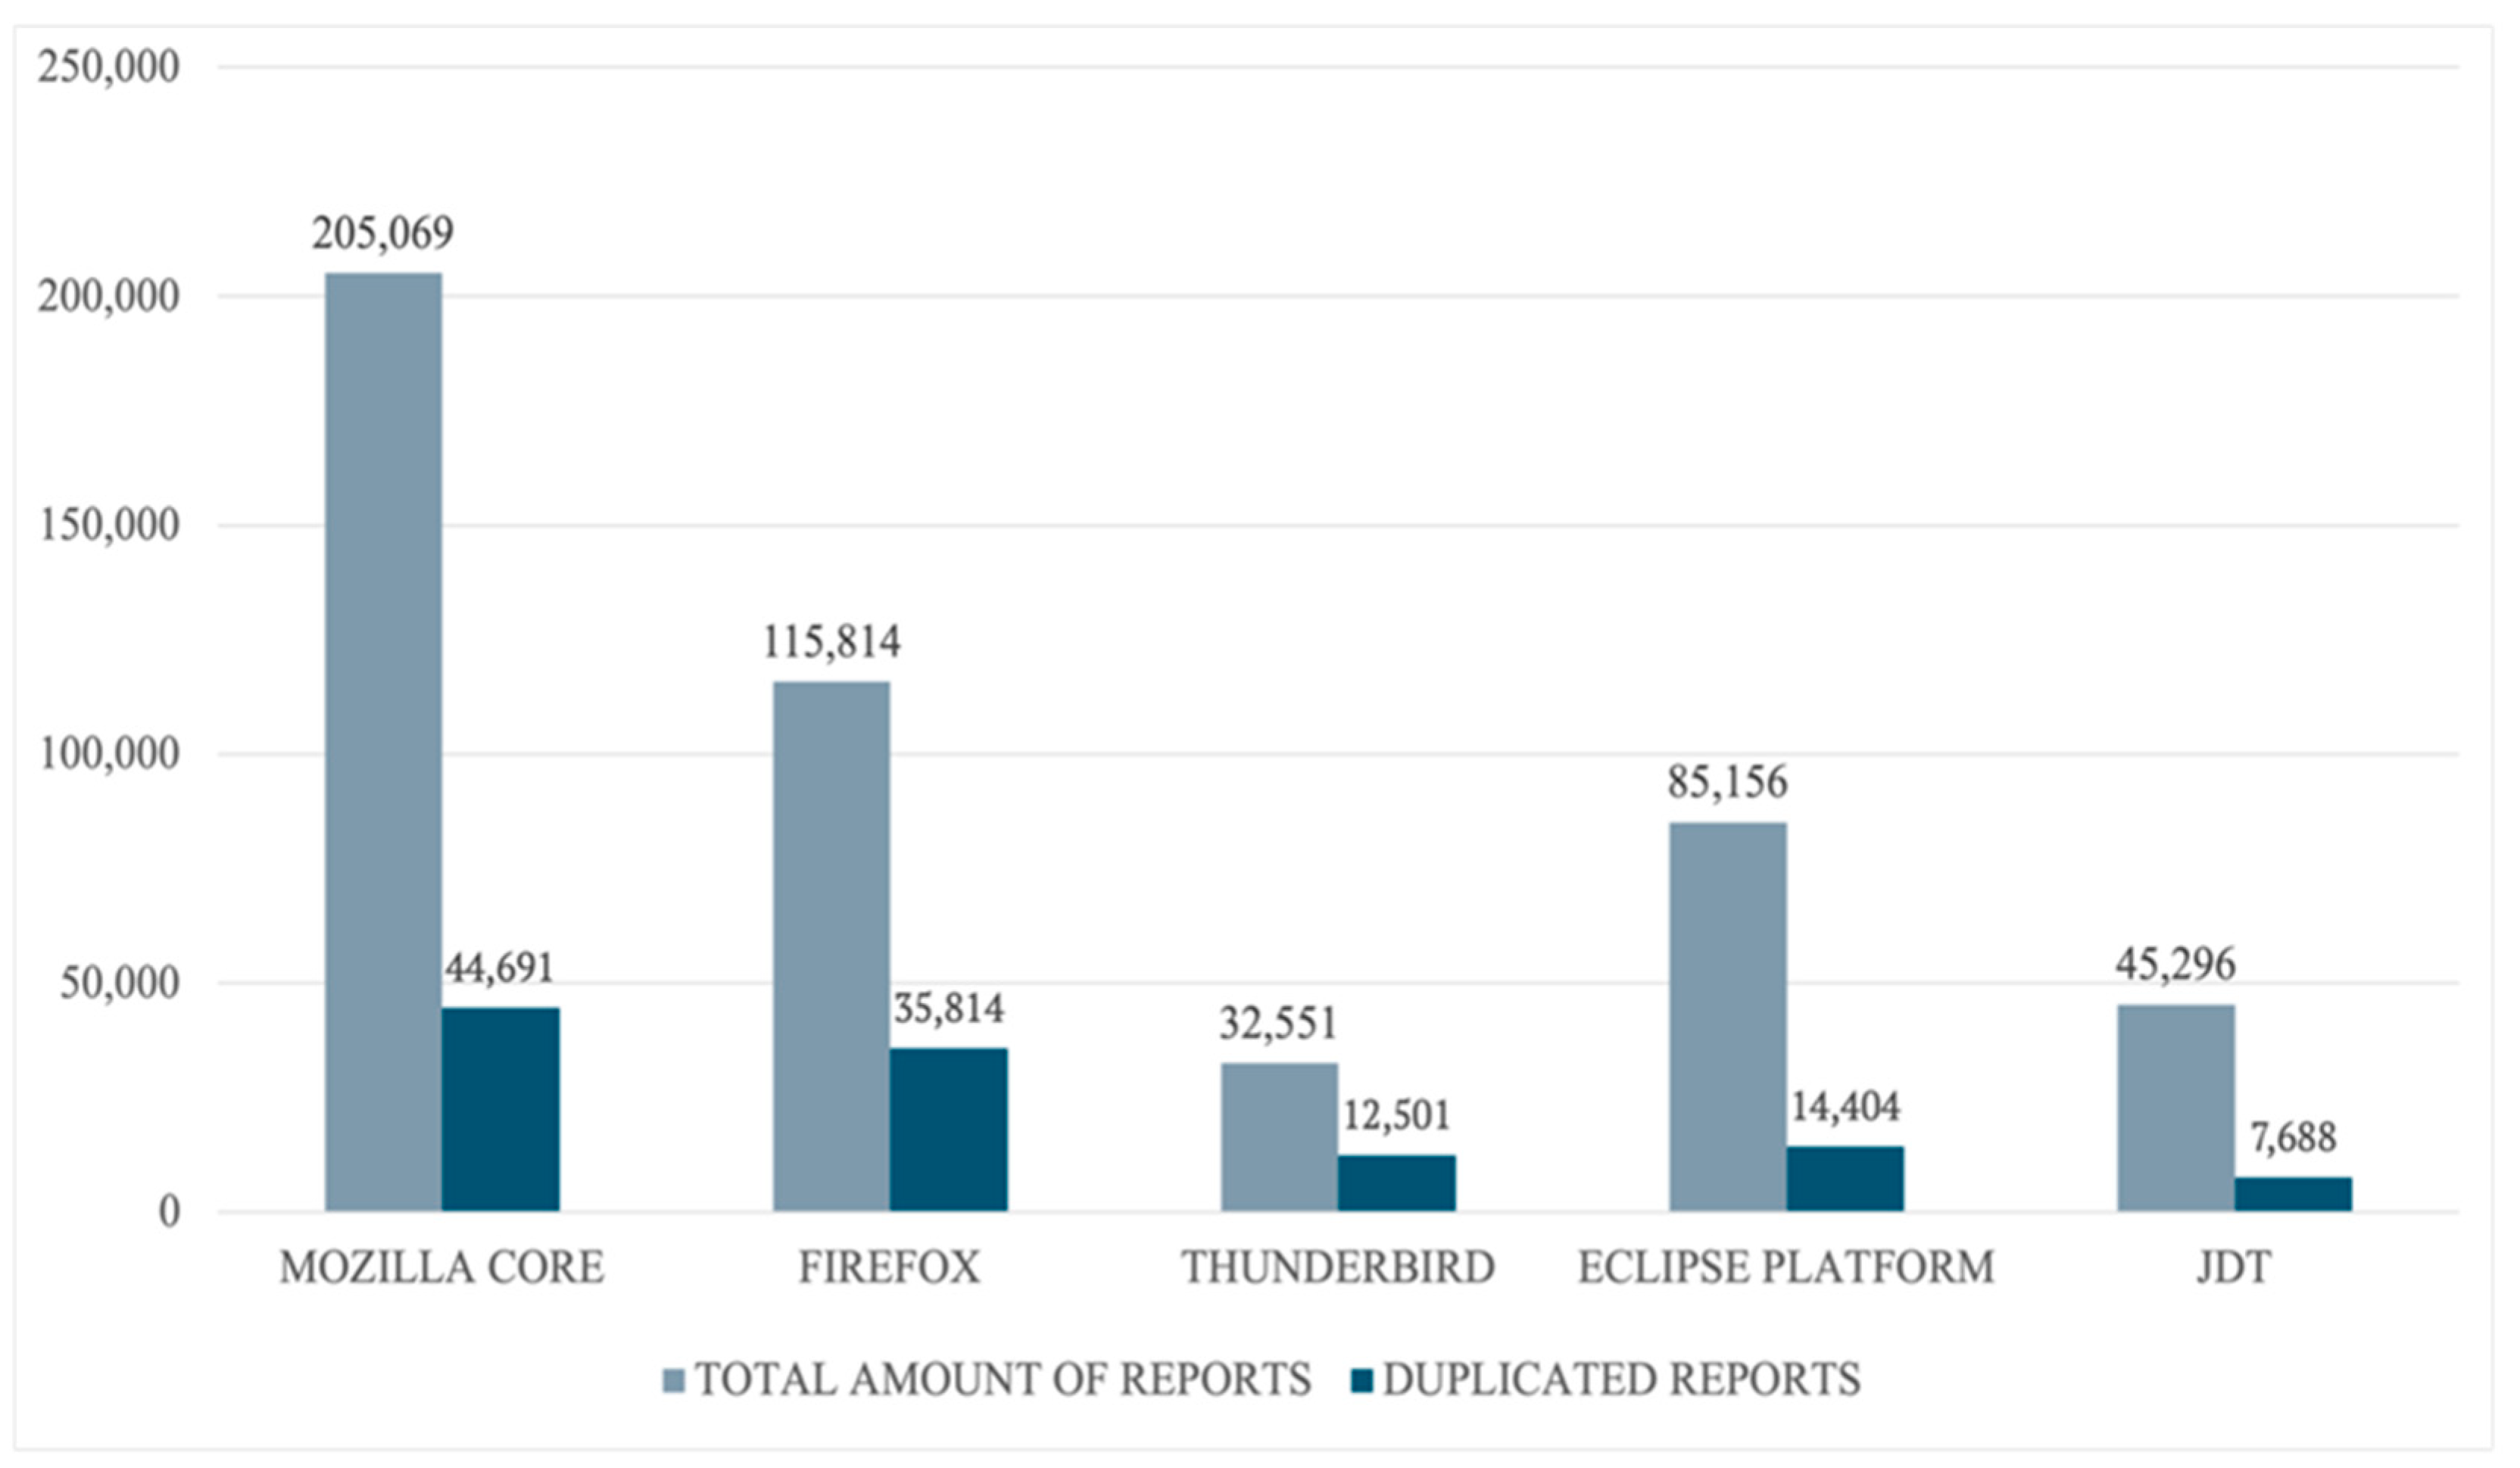
Figure 3.
Comparison of ROC curves and AUC values for different classification models for each project: (a) Eclipse JDT; (b) Eclipse Platform; (c) Mozilla Core; (d) Mozilla Firefox; € Mozilla Thunderbird.
Figure 3.
Comparison of ROC curves and AUC values for different classification models for each project: (a) Eclipse JDT; (b) Eclipse Platform; (c) Mozilla Core; (d) Mozilla Firefox; € Mozilla Thunderbird.
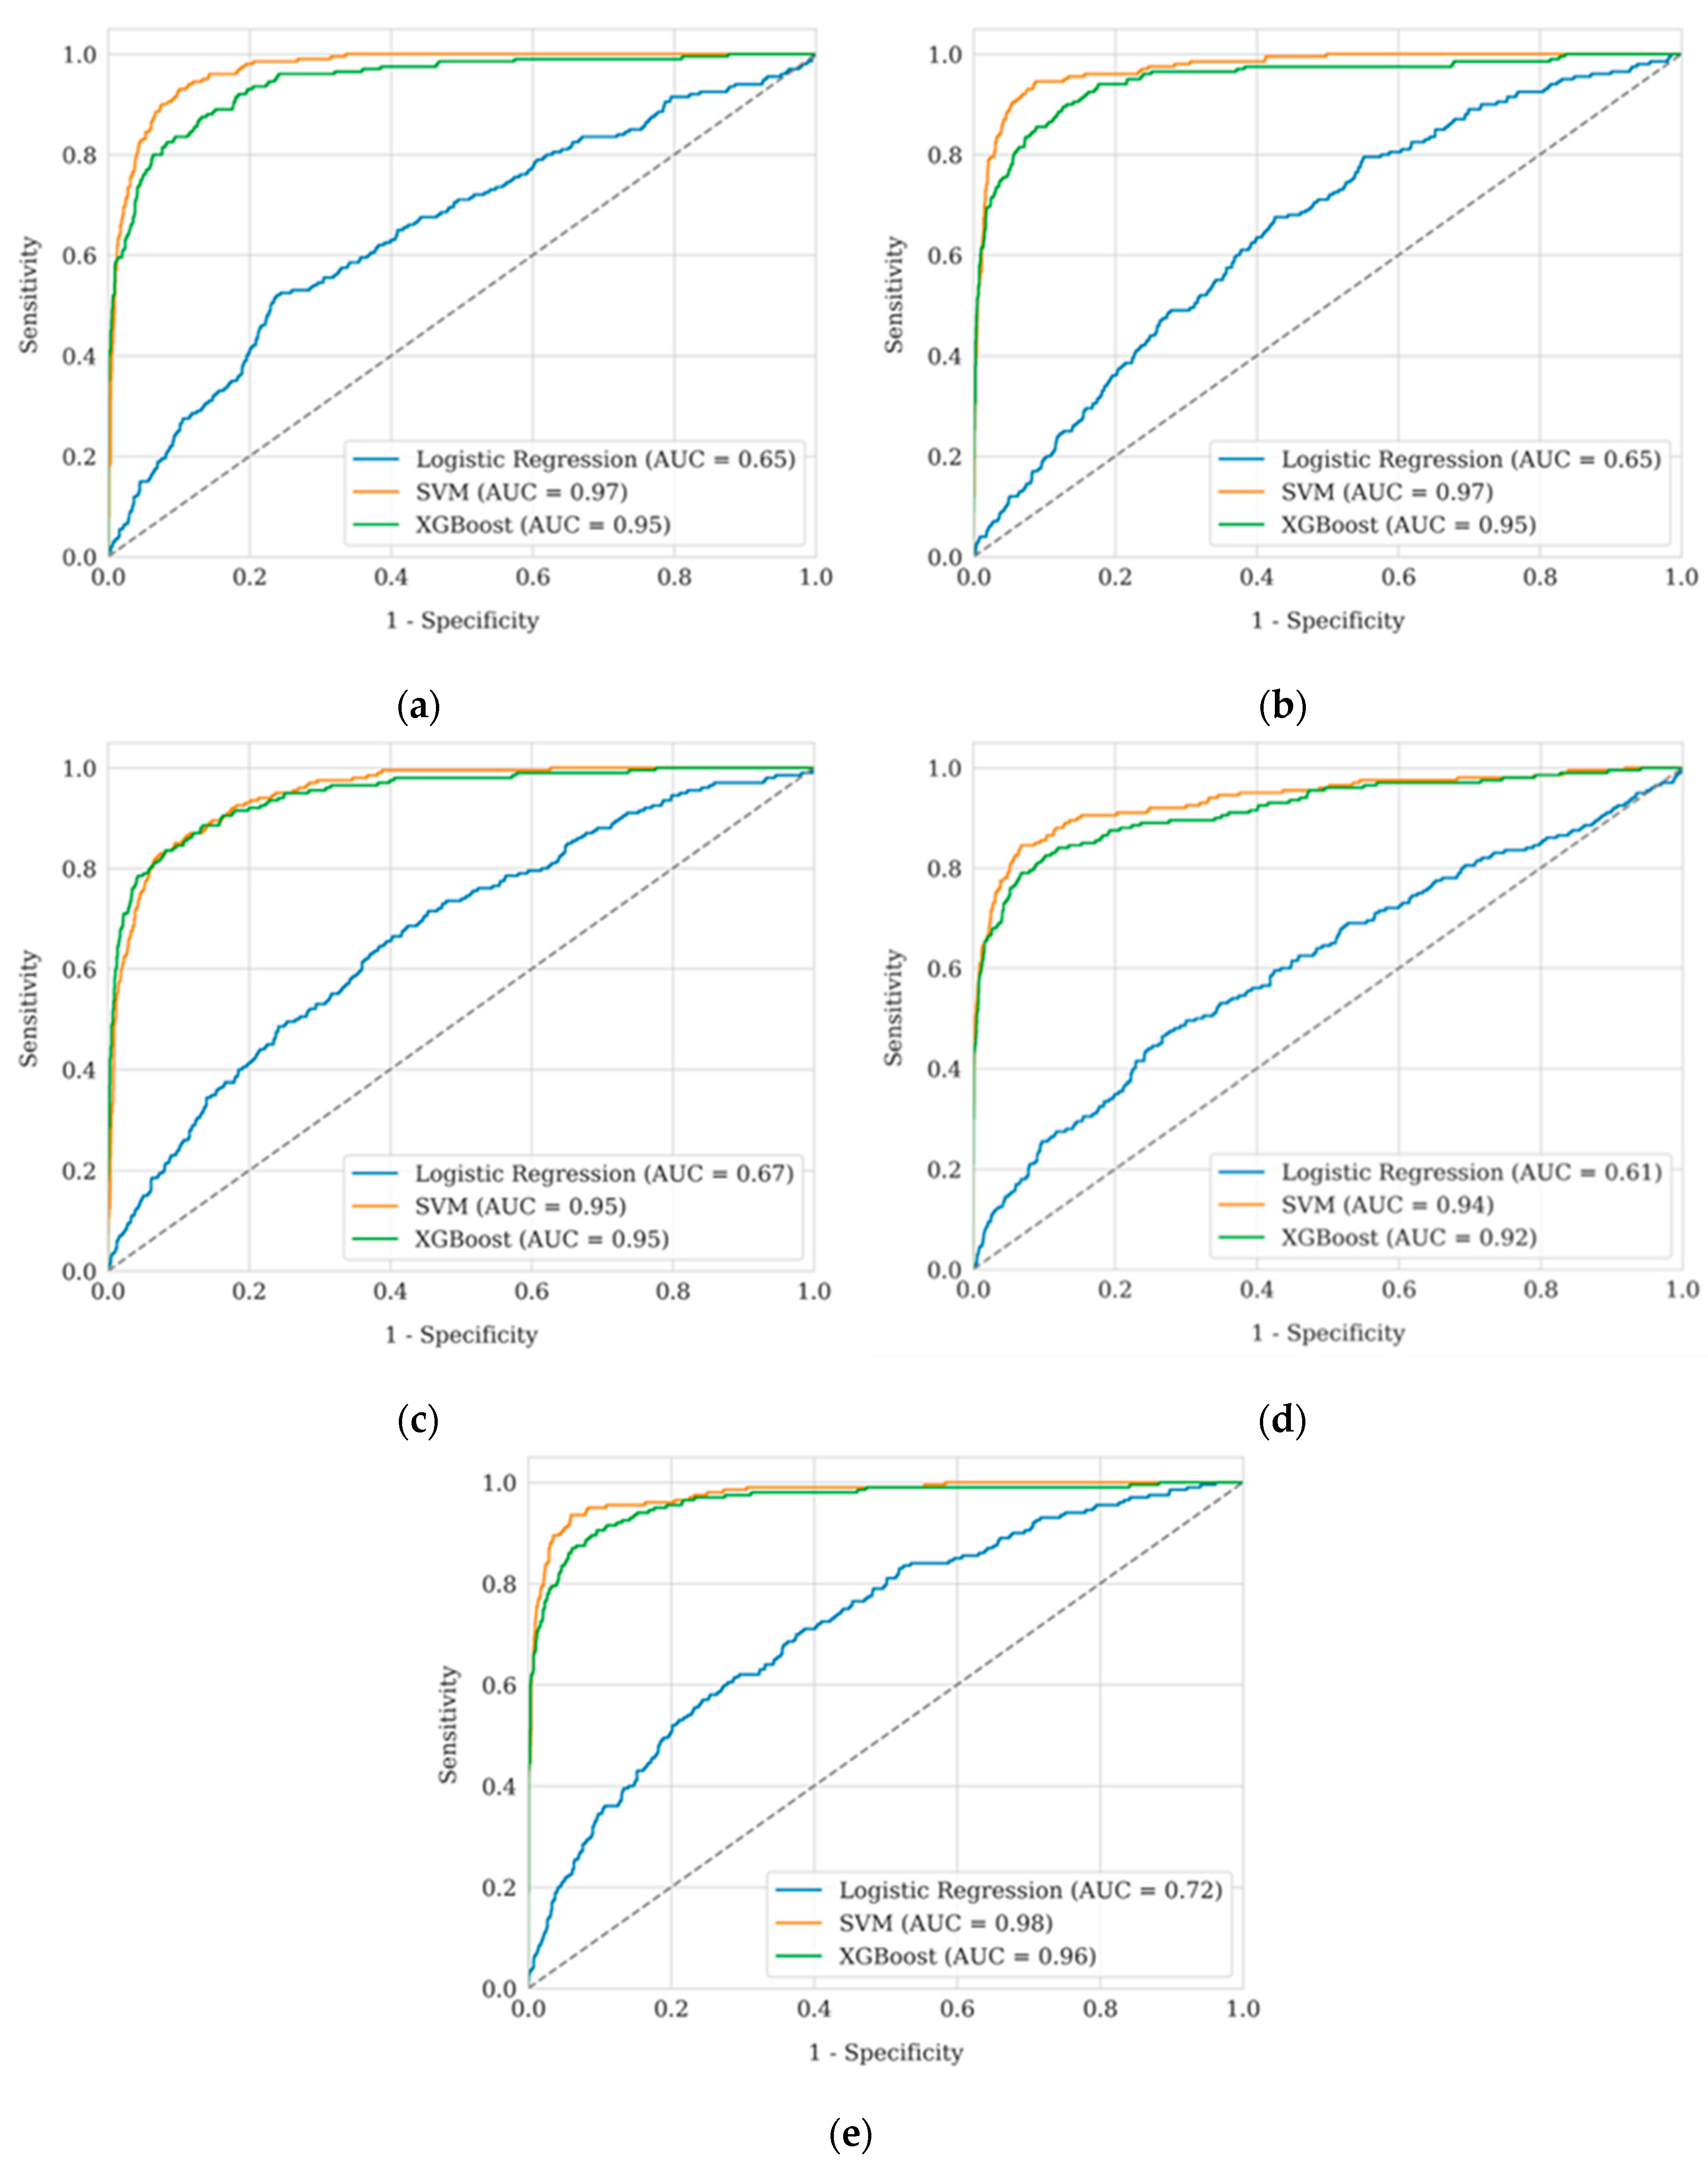
Figure 4.
Description of the programme interface: (a) system interface at the preparation stage; (b) system interface at the duplicate search stage.
Figure 4.
Description of the programme interface: (a) system interface at the preparation stage; (b) system interface at the duplicate search stage.
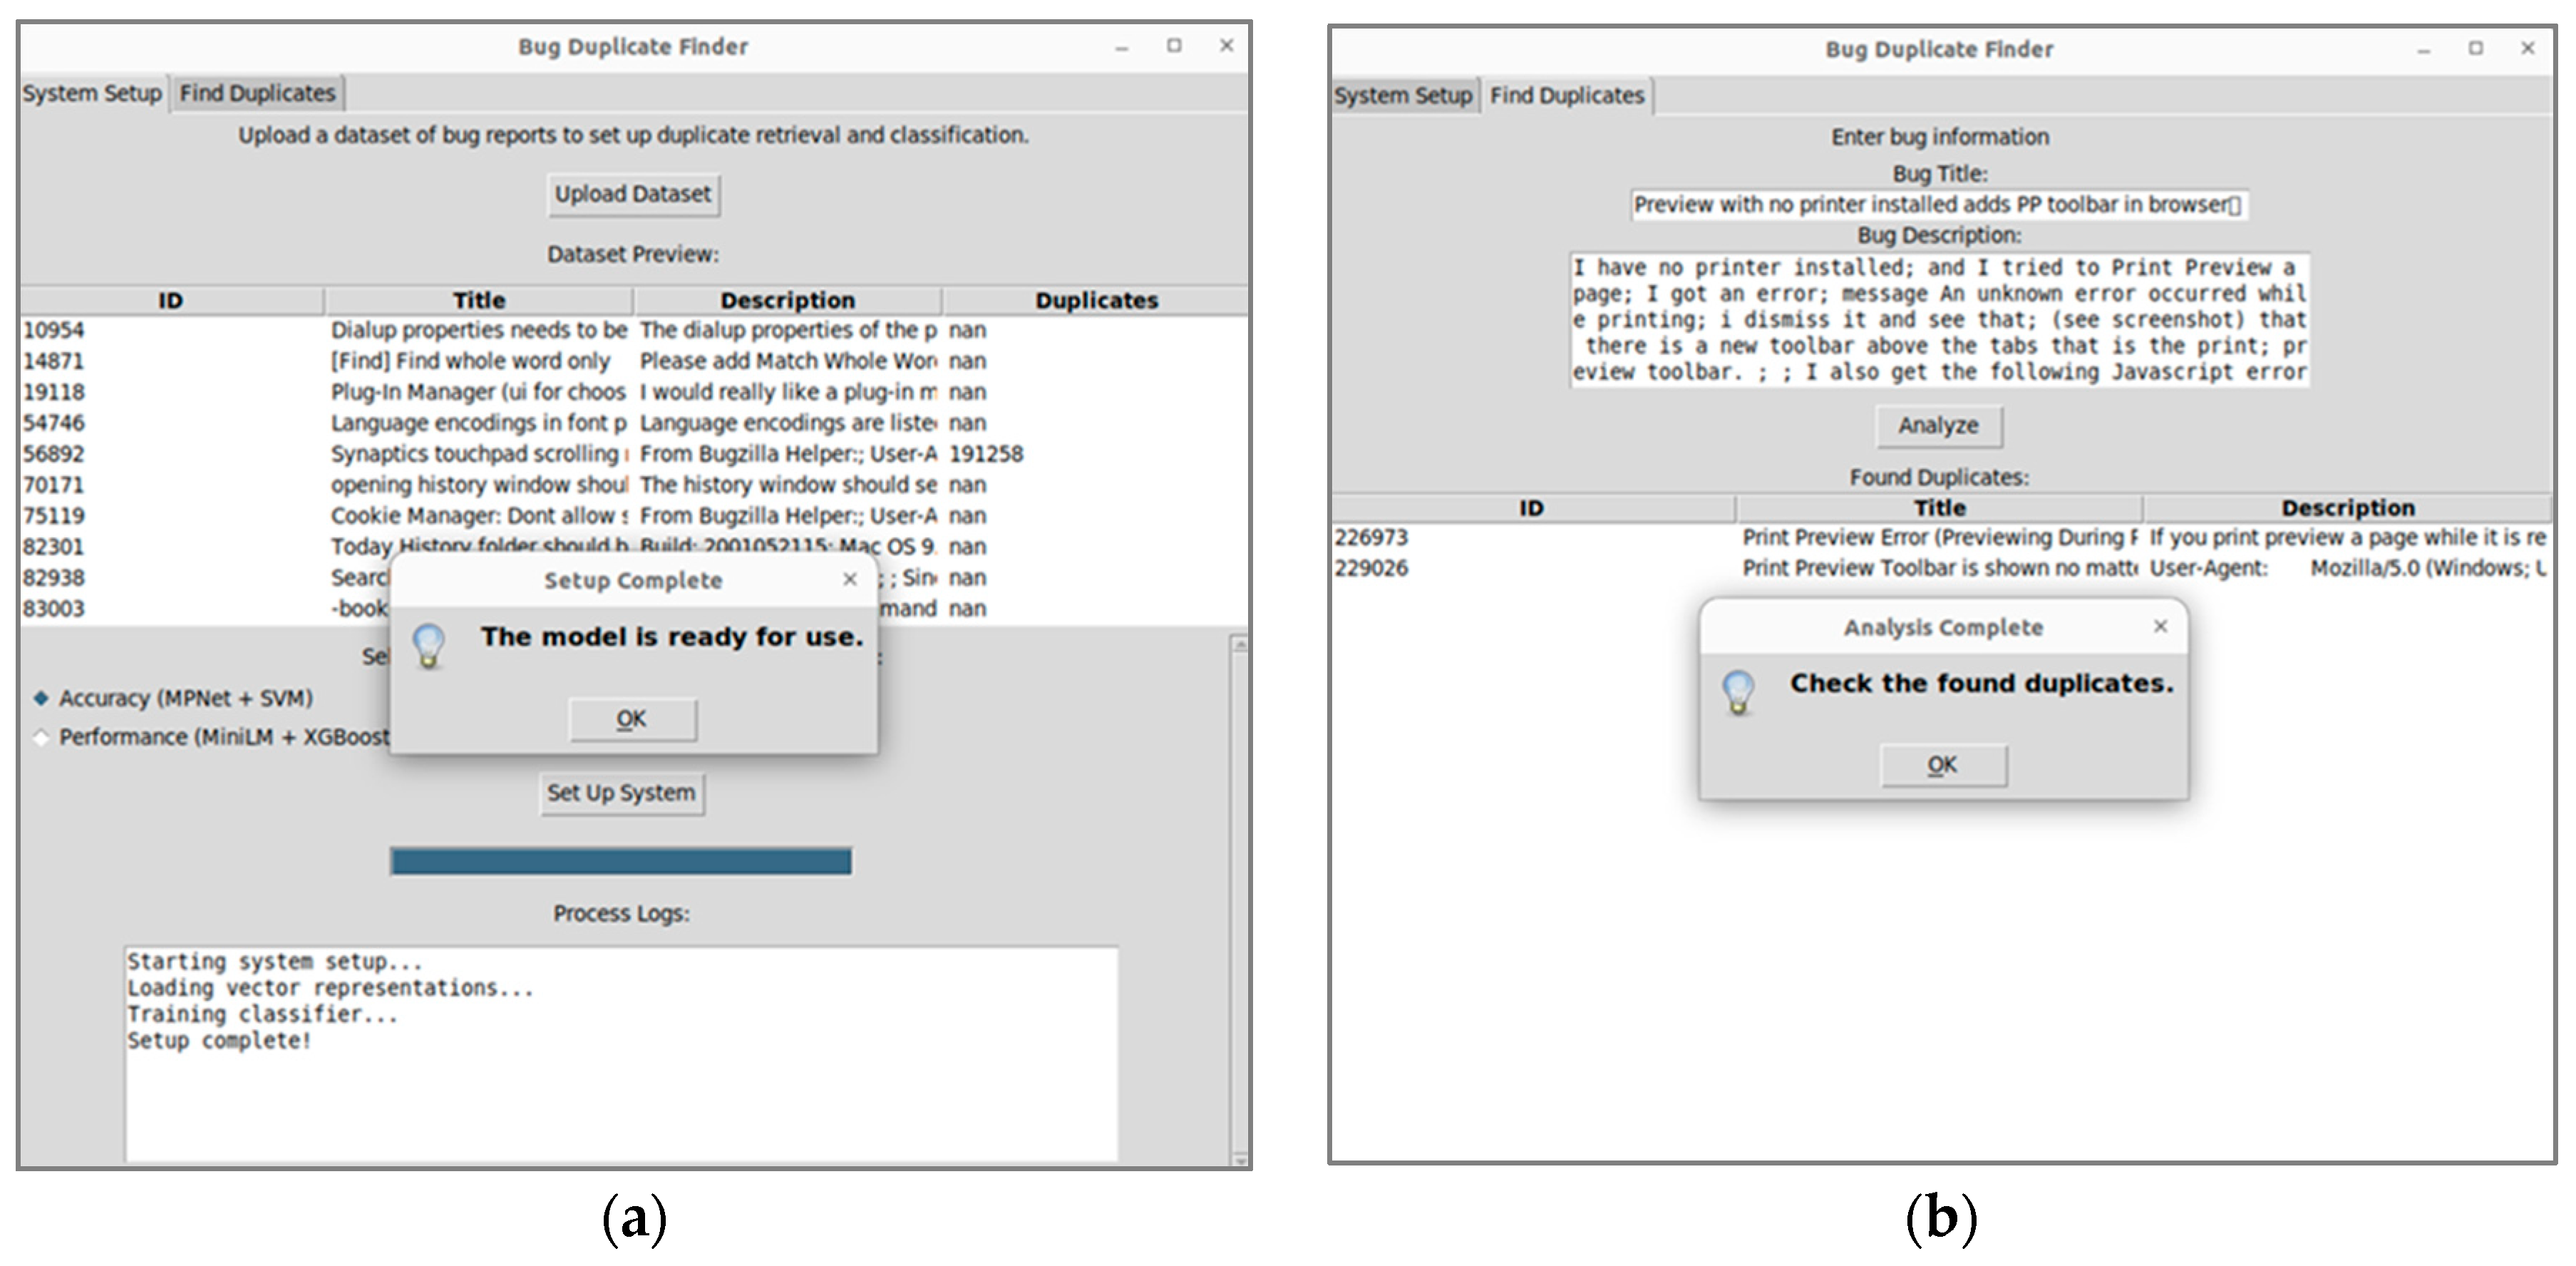

Table 1.
The effectiveness of separation in the Eclipse JDT project.
| Model/Metric | Recall@10 | Recall@50 | Recall@100 |
| BERT | 0.1425 | 0.2412 | 0.3023 |
| MiniLM | 0.4509 | 0.6930 | 0.7543 |
| MPNet | 0.5388 | 0.7343 | 0.7949 |
Table 2.
The effectiveness of separation in the Eclipse Platform project.
| Model/Metric | Recall@10 | Recall@50 | Recall@100 |
| BERT | 0.1725 | 0.2365 | 0.3136 |
| MiniLM | 0.5354 | 0.7232 | 0.7809 |
| MPNet | 0.5827 | 0.7467 | 0.8077 |
Table 3.
The effectiveness of separation in the Mozilla Core project.
| Model/Metric | Recall@10 | Recall@50 | Recall@100 |
| BERT | 0.1113 | 0.1689 | 0.2030 |
| MiniLM | 0.4643 | 0.6318 | 0.6955 |
| MPNet | 0.5583 | 0.7115 | 0.7478 |
Table 4.
The effectiveness of singling out in the Mozilla Firefox project.
| Model/Metric | Recall@10 | Recall@50 | Recall@100 |
| BERT | 0.1441 | 0.2201 | 0.2602 |
| MiniLM | 0.5093 | 0.7046 | 0.7698 |
| MPNet | 0.5929 | 0.7833 | 0.8409 |
Table 5.
The effectiveness of separation in the Mozilla Thunderbird project.
| Model/Metric | Recall@10 | Recall@50 | Recall@100 |
| BERT | 0.0679 | 0.1471 | 0.2218 |
| MiniLM | 0.4504 | 0.6680 | 0.7619 |
| MPNet | 0.5185 | 0.7525 | 0.8337 |
Table 6.
The effectiveness of classification in the Eclipse JDT project.
| Model/Metric | Accuracy | Precision | Recall | F1-score |
| Logistic Regression | 0.74 | 0.86 | 0.74 | 0.79 |
| SVM | 0.91 | 0.94 | 0.92 | 0.92 |
| XGBoost | 0.91 | 0.93 | 0.91 | 0.92 |
Table 7.
The effectiveness of classification in the Eclipse Platform project.
| Model/Metric | Accuracy | Precision | Recall | F1-score |
| Logistic Regression | 0.67 | 0.85 | 0.67 | 0.73 |
| SVM | 0.92 | 0.95 | 0.92 | 0.93 |
| XGBoost | 0.91 | 0.94 | 0.91 | 0.92 |
Table 8.
Classification performance in the Mozilla Core project.
| Model/Metric | Accuracy | Precision | Recall | F1-score |
| Logistic Regression | 0.83 | 0.84 | 0.84 | 0.84 |
| SVM | 0.93 | 0.94 | 0.93 | 0.93 |
| XGBoost | 0.94 | 0.95 | 0.94 | 0.95 |
Table 9.
The effectiveness of classification in the Mozilla Firefox project.
| Model/Metric | Accuracy | Precision | Recall | F1-score |
| Logistic Regression | 0.76 | 0.84 | 0.76 | 0.79 |
| SVM | 0.93 | 0.94 | 0.94 | 0.94 |
| XGBoost | 0.92 | 0.93 | 0.92 | 0.93 |
Table 10.
Classification performance in the Mozilla Thunderbird project.
| Model/Metric | Accuracy | Precision | Recall | F1-score |
| Logistic Regression | 0.74 | 0.87 | 0.74 | 0.78 |
| SVM | 0.94 | 0.96 | 0.94 | 0.95 |
| XGBoost | 0.93 | 0.95 | 0.93 | 0.94 |
Disclaimer/Publisher’s Note: The statements, opinions and data contained in all publications are solely those of the individual author(s) and contributor(s) and not of MDPI and/or the editor(s). MDPI and/or the editor(s) disclaim responsibility for any injury to people or property resulting from any ideas, methods, instructions or products referred to in the content. |
© 2025 by the authors. Licensee MDPI, Basel, Switzerland. This article is an open access article distributed under the terms and conditions of the Creative Commons Attribution (CC BY) license (http://creativecommons.org/licenses/by/4.0/).
Copyright: This open access article is published under a Creative Commons CC BY 4.0 license, which permit the free download, distribution, and reuse, provided that the author and preprint are cited in any reuse.


