Submitted:
21 October 2025
Posted:
22 October 2025
You are already at the latest version
Abstract
This paper addresses the important issue of predicting stock market crashes, which can cause major problems due to large drops and long recovery times. We present a new method that uses a mix of machine learning and deep learning to improve prediction accuracy and provide useful insights in financial forecasting. Our approach includes Support Vector Machines (SVMs), Deep Reinforcement Learning (DRL), Long Short-Term Memory (LSTM) networks, Convolutional Neural Networks (CNNs), Generative Adversarial Networks (GANs), and Deep Deterministic Policy Gradient (DDPG) models. An important part of our work is the development of a DRL model specifically designed to be more resilient during market downturns. This model can help reduce financial losses during crises and also provide significant returns for investors. The experimental results strongly support the robustness of our DRL model in unpredictable market conditions. Performance checks, which use R2-Score, Mean Squared Error (MSE), Mean Absolute Error (MAE), and Receiver Operating Characteristic (ROC) curves, confirm that our methods outperform models like Graph Neural Networks (GNNs) and Transformers. This DRL model achieves a high true positive rate for detecting crash signals while keeping the false-alarm rate low. Its strength comes from the reinforcement learning agent’s ability to learn decision-making strategies that take misclassification costs into account within a simulated trading environment.
Keywords:
stock market crash prediction
; machine learning
; deep learning
; reinforcement learning
; financial forecasting
; risk management
; anomaly detection
; sequential modeling
; LSTM
1. Introduction
Stock market crashes, such as the 1929 Great Depression, 1987 Black Monday, 2008 Financial Crisis, and the 2020 COVID-19 crash, have serious economic impacts. Predicting these events is vital for investors, policymakers, and researchers, even though financial markets are complex.
Machine learning and artificial intelligence, particularly deep learning and reinforcement learning, provide promising options for better stock market forecasting. These technologies can identify complex patterns, offering a stronger method for analyzing financial time series and assessing risk.
This research designs, implements, and evaluates deep learning and reinforcement learning models for predicting stock market crashes. It uses models like SVMs for classification, LSTM networks and CNNs for feature extraction, GANs for data augmentation, and DRL with DDPG for making decisions in dynamic markets. The study involves data collection, exploratory data analysis, model construction, performance evaluation, and comparisons with traditional models.
A key innovation is the creation of a hybrid predictive framework that combines DRL with supervised learning for crash detection. Unlike traditional static analyses, our model learns decision-making policies that adapt to changing market conditions. By treating crash prediction as a classification problem with specific crash definitions, this work connects anomaly detection with real-time financial forecasting. Extensive testing across different window sizes, crash thresholds, and various model architectures, including CNNs, GANs, Autoencoders, and LSTMs, provides an in-depth exploration. Model evaluation looks beyond statistical metrics to include real-world portfolio performance measures like drawdown, Sharpe Ratio, and volatility reduction, improving practical use.
The paper is organized as follows: The first section explains the problem and the uniqueness of the proposed approach. The second section reviews related literature. The next section covers the dataset, preprocessing, crash definition, feature engineering, and methodology. The fourth section shows experimental results, including comparative evaluations and portfolio simulations. The final section wraps up with key findings and future research directions.
2. Literature Review
The prediction of stock market crashes is a major challenge in financial forecasting. These crashes are rare but have serious economic effects. Traditional statistical and econometric models provide some insights but often fail to capture the complexity and dynamic nature of financial markets, especially before major downturns (Atsalakis et al., 2013[1]; Kim, 2003 [2]). These older methods usually rely on static analyses of market data, which limits their ability to adapt to quickly changing market conditions and to identify sudden, high-impact events.
In recent decades, financial time series analysis has changed with the rise of machine learning (ML) and deep learning (DL) techniques (Sezer et al. 2020[3]). Deep learning models, like Long Short-Term Memory (LSTM) networks, are better at understanding long-term dependencies in sequential data, making them useful for financial time series forecasting (Selvin et al., 2017[4]; Fischer et al., 2018[5], Kara et al.,[6]). Convolutional Neural Networks (CNNs) have also been used to identify local and hierarchical patterns from market data, treating price series like images (Chong et al., 2017[7]). Additionally, Autoencoders help reduce dimensions and learn strong, compressed representations from complex financial data (Bao et al., 2017[8]). Generative Adversarial Networks (GANs) also show promise for data augmentation and learning complicated data distributions, which can help when crash event data is limited (Brown et al., 2025[9]).
Complementing supervised and unsupervised deep learning, reinforcement learning (RL) has emerged as a powerful framework for addressing sequential decision-making problems in dynamic environments, finding increasing application in quantitative finance (Zhang et al., 2020[10]; Deng et al., 2016[11]; Jiang et al, 2017[12]). RL agents, through iterative interaction with market simulations, can learn optimal policies that explicitly account for long-term rewards and penalties, making them highly suitable for tasks like portfolio management and risk mitigation (Jiang et al., 2017[12]). Specific DRL algorithms such as Deep Deterministic Policy Gradient (DDPG), Proximal Policy Optimization (PPO), and advancements incorporating Transformer architectures have shown potential in adapting to changing market behaviors and making dynamic predictions (Chong et al., 2017[7]; Zhang et al., 2020[10]; Moody et al., 2001[13]).
Alongside supervised and unsupervised deep learning, reinforcement learning (RL) offers a strong method for solving decision-making problems in dynamic environments. It is gaining traction in quantitative finance Zhang et al., 2020[10]; Deng et al., 2016[11]; Jiang et al, 2017[12]). RL agents can learn optimal strategies through repeated interactions with market simulations. This makes them suitable for tasks like managing portfolios and reducing risk (Jiang et al., 2017[12]). Certain RL algorithms like Deep Deterministic Policy Gradient (DDPG), Proximal Policy Optimization (PPO), and those using Transformer architectures have shown promise in adapting to shifting market behaviors and making real-time predictions (Chong et al., 2017[7]; Zhang et al., 2020[10]; Moody et al., 2001[13]).
Despite these advancements, a notable gap persists in the systematic integration of diverse deep learning paradigms, particularly DRL, within a comprehensive hybrid framework specifically designed for proactive stock market crash detection that extends beyond purely statistical metrics. While individual ML/DL models have been applied to various aspects of financial prediction, fewer studies have focused on a unified framework that combines the strengths of supervised learning for classification with the dynamic, adaptive policy-learning capabilities of DRL, critically evaluated not only on predictive accuracy but also on real-world portfolio performance and risk-adjusted returns (Chen et al., 2025[14]). This research aims to bridge this gap by proposing such a novel, integrated methodological fra mework.
Despite these advances, a significant gap remains in combining different deep learning methods, especially DRL, into a strong framework for proactively detecting stock market crashes that moves beyond just statistical measures. While some studies have looked at various ML/DL models for financial predictions, fewer have proposed a comprehensive framework that harnesses the strengths of supervised learning for classification alongside the adaptive learning capabilities of DRL. This framework must be assessed not only on prediction accuracy but also on actual portfolio performance and risk-adjusted returns (Chen et al., 2025(Chen et al., 2025[14]). This research intends to fill that gap by suggesting an integrated methodological approach.
Table 1 lists some influential works and compares them with this paper, pointing out how our framework uniquely defines crash events, combines deep learning with reinforcement learning, and measures both prediction accuracy and portfolio resilience.
3. Methodology
This section outlines the complete method used to predict stock market crashes. It includes data collection, preprocessing, defining crash events, creating features, designing the model structure, training, and evaluation. The workflow of this method is shown in Figure 1.
Data Collection.
The primary dataset includes daily stock price data (open, high, low, close prices, and trading volume) for major stock market indices from 2012 to 2022. This dataset, with over 3000 daily records, came from a well-known financial data provider, NASDAQ.
Data Acquisition and Preprocessing.
Initial data preparation focused on finding and addressing any missing values using mean imputation. This approach was chosen because it is simple and effective. It preserves the overall statistical distribution of features and maintains the time order and quality of the data, which is essential for time-series analysis. The dataset was also normalized to reduce scale differences among features, preventing larger ranges from overly affecting model training and improving machine learning performance. A detailed Exploratory Data Analysis (EDA) was performed to gain insights into the dataset’s temporal and statistical features. This analysis involved creating time series plots for both the entire dataset and on an annual basis to identify seasonal trends and patterns. The EDA helped in understanding data distributions, spotting outliers, and pinpointing potential quality issues before model development. This understanding guided the subsequent feature engineering and model selection. Additional EDA methods, such as distribution plots, moving averages, box plots, correlation heatmaps, and scatter plots, were used to look at relationships among features, distributions, volatility, and outlier behaviors.
Crash Event Definition.
A key part of this research was clearly defining what a "crash-like" event means. These events were recognized as significant drops in the close price that exceeded a set threshold value, K. Specifically, a date was marked as a "crash-like date" if its close price was at least K points lower than the close price of the previous business day. For instance, if K=100 and the close price fell from 500.2 to 398.7, that date was labeled a "crash-like date," and 398.7 became the "crash-like close price." This threshold-based method gave a clear definition for rare, significant events and allowed the problem to be framed as a supervised learning task. Only downward movements of size K or more were considered, leaving out upward movements, to specifically target negative market events.
Feature Engineering and Target Label Creation.
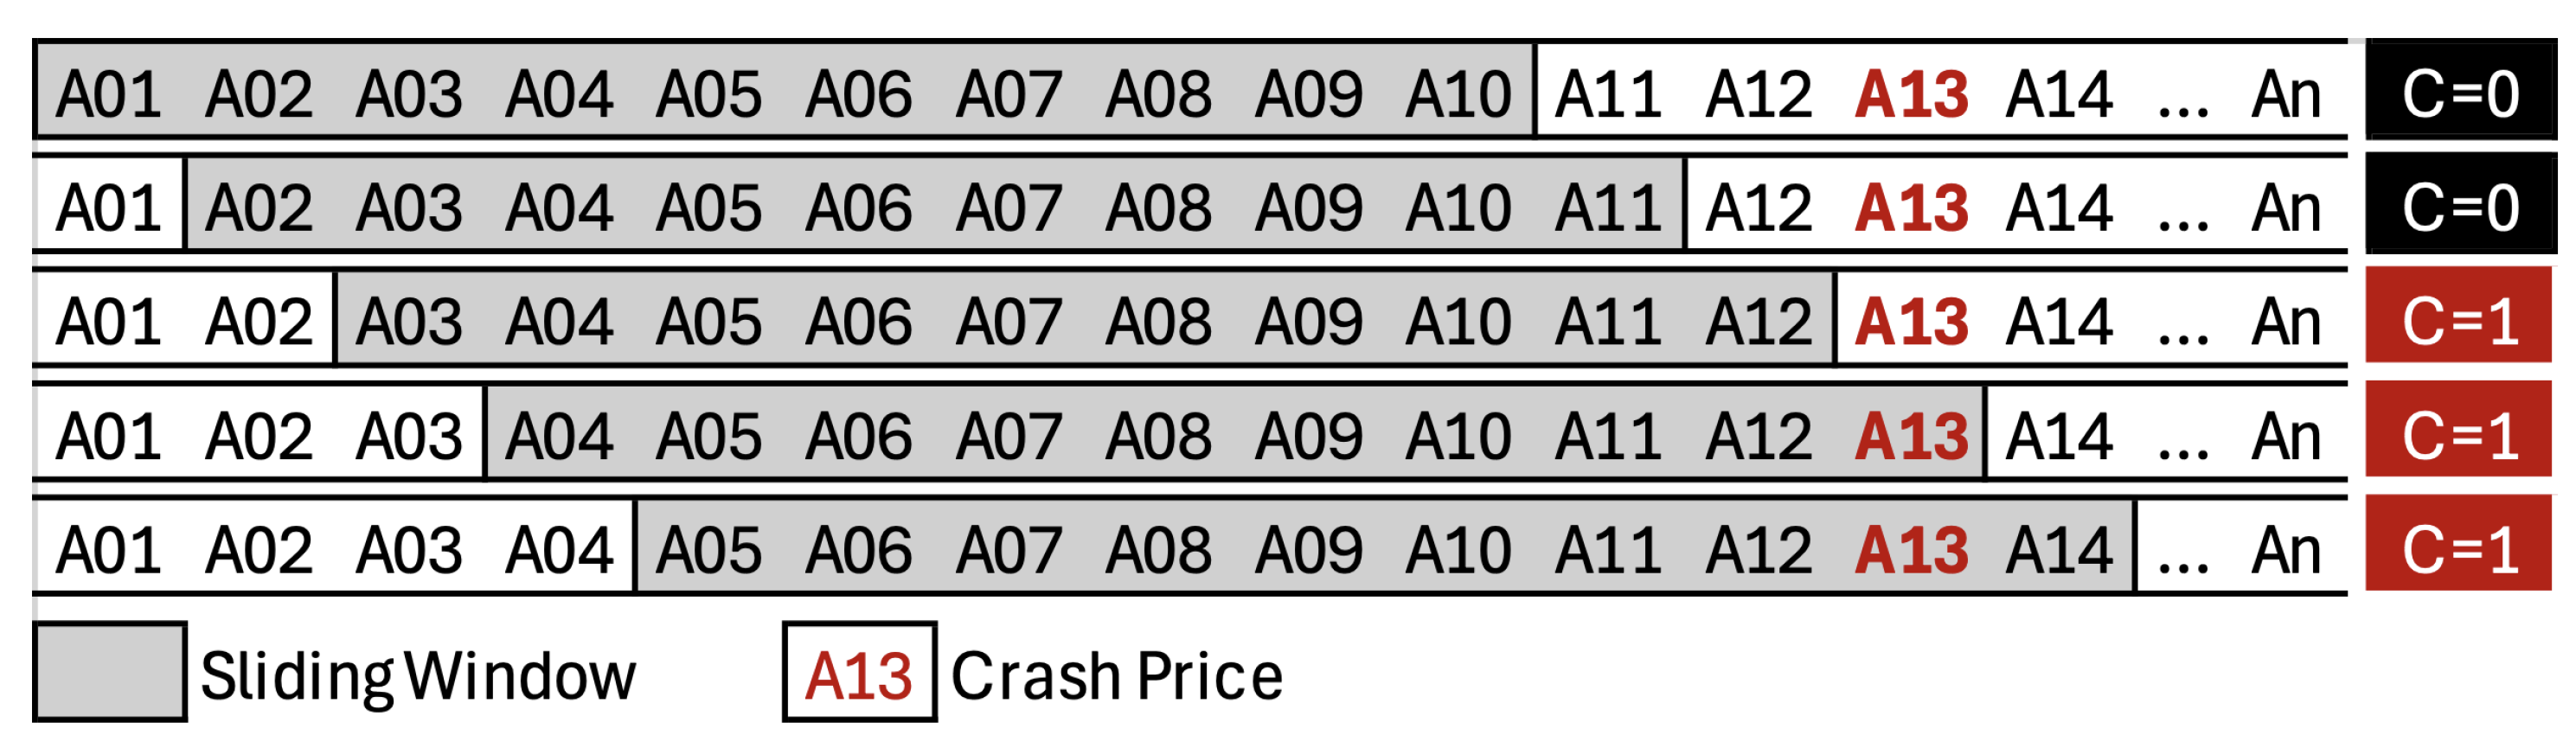
To prepare the time series data for supervised learning, a sliding window method was used (Figure 2). Each input sample (feature vector) consisted of 10 consecutive daily close prices. For example, with a sequence of close prices a01, a02, ..., aN, the first feature vector would be (a01, ..., a10), the second (a02, ..., a11), and so on. This approach was chosen to capture the time dependencies and patterns in financial time series data, which are key indicators of potential market changes.
A binary target column, C, was created for each feature vector. A row was labeled C=1 if the 10-day window immediately before or included a "crash-like close price"; otherwise, it was labeled C=0. This method effectively framed the crash prediction problem as a classification task based on sequences, offering a clear signal for training supervised models. Experiments were carried out by changing the threshold value K and the window length to see how they affected model performance and reliability, allowing for a sensitivity analysis of these important parameters.
Figure 2.
Sliding-window for crash-like close price.
Following feature engineering, feature extraction techniques were applied to reduce dimensionality and highlight informative variables. Methods included correlation analysis and variance thresholding to remove redundant and low-variance features. This streamlined the input for models. Principal Component Analysis (PCA) projected high-dimensional features into lower dimensions while preserving data variance. This helps in managing the trouble of dimensionality. Additionally, Autoencoders learned compressed representations for non-linear feature extraction. The goal was to capture more abstract and strong patterns. These optimized features aimed to simplify model complexity, reduce overfitting, and improve predictive performance, especially for deep learning and reinforcement learning setups. This enabled robust crash prediction under varying market conditions.
Model Architectures.
A range of machine learning and deep learning models was designed, implemented, and assessed for their effectiveness in predicting crashes. Traditional machine learning algorithms, including Logistic Regression, Support Vector Machines (SVMs), Decision Trees (J48), and K-Nearest Neighbors (KNN), acted as baseline classifiers for binary crash detection using the 10-day close price sequences. These models provided a basic understanding of classification performance that more complex deep learning methods could be compared to.
For regression-based forecasting, Long Short-Term Memory (LSTM) networks showed the lowest Mean Squared Error (MSE) and R2-Score among the tested models. This highlighted their capability to capture sequential dependencies and long-range patterns in financial time series. This made LSTMs particularly effective in modeling non-linear dynamics and predicting future crash prices with high accuracy. On the classification side, K-Nearest Neighbors (KNN) achieved the highest accuracy compared to other methods. Its ability to classify rare crash events by relying on local similarities in the feature space gave it an edge. KNN’s strength in handling non-parametric decision boundaries made it particularly fit for distinguishing between crash and non-crash situations in noisy financial datasets.
To go beyond static prediction and support dynamic decision-making in quickly changing market conditions, advanced deep reinforcement learning (DRL) models were used. This DRL framework aimed to develop an agent that can adjust its strategy based on market behavior. It explicitly considered the costs of misclassification and sought optimal actions over time. The DRL approach was selected for its ability to learn complex policies from interactions with a simulated environment, closely resembling real-world trading. Specific DRL algorithms explored included Deep Deterministic Policy Gradient (DDPG), Proximal Policy Optimization (PPO), with and without Neural Attention Mechanism, Graph Neural Networks (GNN), Transformer architectures, Twin Delayed DDPG (TD3), Soft Actor-Critic (SAC), Meta-Learning via Model-Agnostic Meta-Learning (MAML), and Evolution Strategies (ES) combined with PPO. These various DRL methods allowed for an in-depth exploration of policy learning in volatile financial environments.
Among all the models mentioned, DRL performed the best, yielding the highest R2-score and lower MSE and MAE compared to the other models.
Training and Hyperparameter Tuning.
All model development and evaluations were conducted using Python, with popular machine learning and deep learning libraries like TensorFlow, Keras, PyTorch, Scikit-Learn, Matplotlib, and Pandas. Hyperparameters for the machine learning models, including learning rates, batch sizes, dropout rates, and network depths, were carefully tuned using grid search and random search methods whenever computationally possible. This detailed tuning process was necessary to improve model performance, avoid overfitting or underfitting, and ensure the models could generalize to new data.
Evaluation Metrics.
Model performance was evaluated with a set of metrics designed for both classification and regression tasks, as well as real-world financial applications.
- 1.
- Classification Metrics: For binary crash prediction (C=1 vs. C=0), the following metrics were used: Precision, Recall, F1-Score, Accuracy, and Area Under the Receiver Operating Characteristic Curve (AUC-ROC). These metrics offered insights into the models’ ability to identify crash events while managing false positives (incorrectly predicting a crash) and false negatives (failing to predict an actual crash), which is crucial in financial risk management.
- 2.
- Regression Metrics: For models that predict future crash prices, the evaluation included Mean Squared Error (MSE), Mean Absolute Error (MAE), Root Mean Squared Error (RMSE), Mean Squared Log Error (MSLE), and R² Score. These metrics were selected to measure the accuracy of price predictions and evaluate the models’ capability to reflect the scale of market movements.
- 3.
-
Portfolio Performance Metrics: To evaluate the real-world usefulness and impact of the crash prediction signals, a simulated tactical allocation strategy was used. Performance was measured using financial metrics such as:
- (a)
- Drawdown: Maximum observed loss from a peak to a trough, indicating capital preservation capabilities.
- (b)
- Sharpe Ratio: Risk-adjusted return, measuring return per unit of risk.
- (c)
- Volatility Reduction: A measure of reduced-price fluctuations compared to a baseline, indicating stability.
These metrics together offered a complete picture of the models’ statistical accuracy and their practical value in improving downside protection and increasing risk-adjusted returns in investment strategies, directly illustrating their potential in trading.
Assumptions and Limitations.
Several assumptions and constraints emerged during this research. A key assumption was that patterns in stock prices before crash events can be learned and identified using machine learning methods. Another assumption was that it is possible to effectively represent crash-like movements with a single threshold value K, even though real market crashes are affected by various economic, political, and psychological factors. One significant constraint was the exclusive reliance on historical close prices. This approach did not consider external macroeconomic conditions, news sentiment, or insider trading information, all of which can greatly affect crash events and could improve predictions. Additionally, the inherent class imbalance issue arose from the rarity of extreme crash events compared to normal market behavior. This required careful consideration during model training and evaluation to avoid bias towards the majority class.
4. Results
This section presents an analysis of the experimental results from various machine learning, deep learning, and reinforcement learning models used to predict stock market crashes. The evaluation includes both statistical predictive metrics and simulated real-world portfolio performance.
Overall Model Performance.
Model performance was measured using standard statistical metrics for classification (Precision, Recall, F1-Score, Accuracy, AUC-ROC) and regression (MSE, MAE, RMSE, MSLE, R2-Score). These metrics offered valuable insights into the models’ ability to distinguish crash events and the accuracy of price predictions. The DRL model consistently showed better overall performance. It achieved an R2-Score of 0.999, with an MSE of 6.922 and MAE of 1.971. This strong performance is due to the DRL agent’s ability to learn complex sequential decision policies that optimize for the high costs of misclassification in a simulated trading environment. This resulted in both high true positive rates for crash detection and a low false-alarm rate.
Reinforcement Learning Regression Model Comparisons.
The performance of various reinforcement learning regression models is summarized in Table 2. DRL variants, including DRL (standard and with Moving Averages), Twin Delayed DDPG (TD3), Soft Actor-Critic (SAC), Evolution Strategies (ES) + PPO, and Meta-Learning (MAML), achieved exceptionally high R2-Scores (0.999) and minimal MSE/MAE. This indicates their strong ability to model complex, non-linear financial dynamics and learn optimal sequential behaviors.
Transformer models performed poorly, with a negative R2-Score of -11.47, along with high MSE and MAE. This indicates they struggled to capture underlying trends in financial data, possibly due to issues with their attention mechanisms in noisy, non-stationary time series. DDPG also showed a negative R2-Score, suggesting a poor fit, which may be related to training stability issues or ineffective exploration strategies. Graph Neural Networks (GNN) and the Neural Attention Mechanism in PPO achieved better R2-Scores (0.910) but had higher errors than the top DRL models.
Traditional Classification Model Comparisons.
Traditional classification algorithms set the baseline for crash detection, as shown in Table 3, with ROC curves in Figure 3 and confusion matrices in Figure 4. The K-Nearest Neighbors (KNN) algorithm had the best classification performance, achieving an Accuracy of 0.773 and an F1-Score of 0.758. Its non-parametric nature likely helped it capture local patterns without strict distributional assumptions. Although Logistic Regression had a high AUC (0.993), KNN’s superior Recall (0.787) is especially useful for minimizing missed crash signals in financial risk management.
Deep Learning Regression Model Comparisons.
The performance of deep learning models for classifier-based crash price prediction is listed in Table 4 and shown in Figure 5. Long Short-Term Memory (LSTM) networks had the lowest MSE (0.093), indicating better predictive accuracy for future price movements. Its low R2-Score (0.007) reflects the non-linear nature of financial data rather than a poor fit, showcasing LSTM’s strength in modeling temporal dependencies. Autoencoders also achieved low MSEs. In contrast, CNNs and Generative Adversarial Networks (GANs) showed higher MSEs. Notably, GAN’s very negative R2-Score (-7739.66) highlights its significant challenges in modeling data trends for direct regression. This suggests that its design for data generation or distribution learning may not be suitable for precise time-series forecasting in this context.
Portfolio Simulation Outcomes.
A simulated tactical allocation strategy shifted to cash based on crash probability signals (C=1) to assess the practical utility of the predictions. The Reinforcement Learning (RL) agent significantly outperformed a standard buy-and-hold strategy in preserving capital during the March 2020 crash (8% vs. 34% drawdown). Over five years, the RL strategy produced an annualized return of 12.4% (Sharpe Ratio: 1.15), surpassing buy-and-hold’s 9.1% return (Sharpe Ratio: 0.48). Volatility was also reduced from 18.7% to 12.6%. Proactive exit signals, such those before the June 2022 market low, further limited losses (6% vs. 21%) and halved recovery time from major drawdowns (7 vs. 14 months). These results highlight the practical value of incorporating crash-prediction outputs into tactical portfolio strategies for better downside protection and improved risk-adjusted returns.
Model Complexity and Interpretability.
While classical methods capture broad trends, modern deep learning and reinforcement learning architectures significantly improve early detection and the ability to differentiate rare market events. Model development balanced expressiveness with the risk of overfitting, considering dataset size and crash rarity. The resulting architectures were simple but still able to capture non-linear dynamics. Challenges in model interpretability remain, especially for complex deep learning and reinforcement learning models. Future research into explainable AI (XAI) techniques is essential for enhancing transparency and trustworthiness in high-stakes financial applications.
5. Conclusions
This paper shows how to apply data science techniques to financial time series data for predicting stock market crashes. By merging thorough exploratory data analysis with modern machine learning models, especially a deep reinforcement learning (DRL) predictive model, this research created a strong framework for forecasting market downturns using historical data. The experimental results indicate that the combined deep learning and reinforcement learning approach greatly improves the accuracy and timing of stock market crash predictions.
The main strength of this method is its ability to identify and respond to the subtle, non-linear, and often surprising patterns that occur before rare, high-impact market events. Traditional models often overlook these patterns, which focus on average market behavior. The DRL component is particularly good at learning the best decision-making strategies that consider the high costs tied to misclassification during crucial market periods. This allows the model to focus on reducing losses and taking advantage of recovery opportunities, which can lead to lower financial losses and significant gains.
This method shows promise in areas that need proactive risk management and early warning systems in volatile and complex financial settings. It could perform especially well in situations where quick, data-driven decisions are essential, such as managing large institutional portfolios, designing dynamic hedging strategies, or creating macroeconomic policies to prevent systemic risks. The ability to offer early, actionable insights into upcoming market stress could change how risk assessments are done and protect substantial capital.
While there are challenges like overfitting and understanding the model’s decisions, the findings show that this methodology has great potential for real-world financial use. Future research could look into developing more sophisticated hybrid models that include macroeconomic simulations and agent-based modeling to further improve crash prediction accuracy. Overall, this study emphasizes that combining artificial intelligence with financial risk prediction is a major step towards stronger investment strategies and better economic forecasting.
References
- Atsalakis, G.; Valavanis, K. Surveying stock market forecasting techniques – Part I: Conventional methods. In Computation Optimization in Economics and Finance Research Compendium; Zopounidis, C., Ed.; Nova Science Publishers: New York, 2013; pp. 49–104.
- Kim, K.J. Financial time series forecasting using support vector machines. Neurocomputing 2003, 55, 307–319. [CrossRef]
- Sezer, O.B.; Gudelek, M.U.; Ozbayoglu, A.M. Financial time series forecasting with deep learning: A systematic literature review 2005–2019. Applied Soft Computing 2020, 90, 106181. [CrossRef]
- Selvin, S.; Vinayakumar, R.; Gopalakrishnan, E.A.; Menon, V.K.; Soman, K.P. Stock price prediction using LSTM, RNN and CNN-sliding window model. In Proceedings of the Proceedings of the International Conference on Advances in Computing, Communications and Informatics (ICACCI), 2017, pp. 1643–1647. [CrossRef]
- Fischer, T.; Krauss, C. Deep learning with long short-term memory networks for financial market predictions. European Journal of Operational Research 2018, 270, 654–669. [CrossRef]
- Kara, Y.; Boyacioglu, M.A.; Baykan, Ö. Predicting direction of stock price index movement using artificial neural networks and support vector machines: The sample of the Istanbul Stock Exchange. Expert Systems with Applications 2011, 38, 5311–5319. [CrossRef]
- Chong, E.; Han, C.; Park, F.C. Deep learning networks for stock market analysis and prediction: Methodology, data representations, and case studies. Expert Systems with Applications 2017, 83, 187–205. [CrossRef]
- Bao, W.; Yue, J.; Rao, Y. A deep learning framework for financial time series using stacked autoencoders and long-short term memory. PLoS One 2017, 12, e0180944. [CrossRef]
- Anastasiou, D.; Katsafados, A.; Tzomakas, C. Banks’ stock price crash risk prediction with textual analysis: a machine learning approach. Annals of Operations Research 2025. [CrossRef]
- Zhang, Y.; Zohren, S.; Roberts, S. Deep reinforcement learning for trading. Journal of Finance and Data Science 2020, 2, 25–40. [CrossRef]
- Deng, Y.; Bao, F.; Kong, Y.; Ren, Z.; Dai, Q. Deep direct reinforcement learning for financial signal representation and trading. IEEE Transactions on Neural Networks and Learning Systems 2016, 28, 653–664. [CrossRef]
- Jiang, Z.; Xu, D.; Liang, J. A deep reinforcement learning framework for the financial portfolio management problem. arXiv preprint arXiv:1706.10059, 2017. [CrossRef]
- Moody, J.; Saffell, M. Learning to trade via direct reinforcement. IEEE Transactions on Neural Networks 2001, 12, 875–889. [CrossRef]
- Chen, Y.; Li, X.; Wang, H. Hybrid CNN-BiGRU-AM Model with Anomaly Detection for Stock Price Crash Prediction. Electronics 2025, 14, 1275. [CrossRef]
- Henrique, B.M.; Sobreiro, V.A.; Kimura, H. Stock price prediction using support vector regression on daily and up to the minute prices. Journal of Finance and Data Science 2018, 4, 183–201. [CrossRef]
- Dichtl, H.; Drobetz, W.; Otto, T. Forecasting Stock Market Crashes via Machine Learning. SSRN Electronic Journal, 2021. [CrossRef]
Figure 1.
Workflow of the proposed methodology.
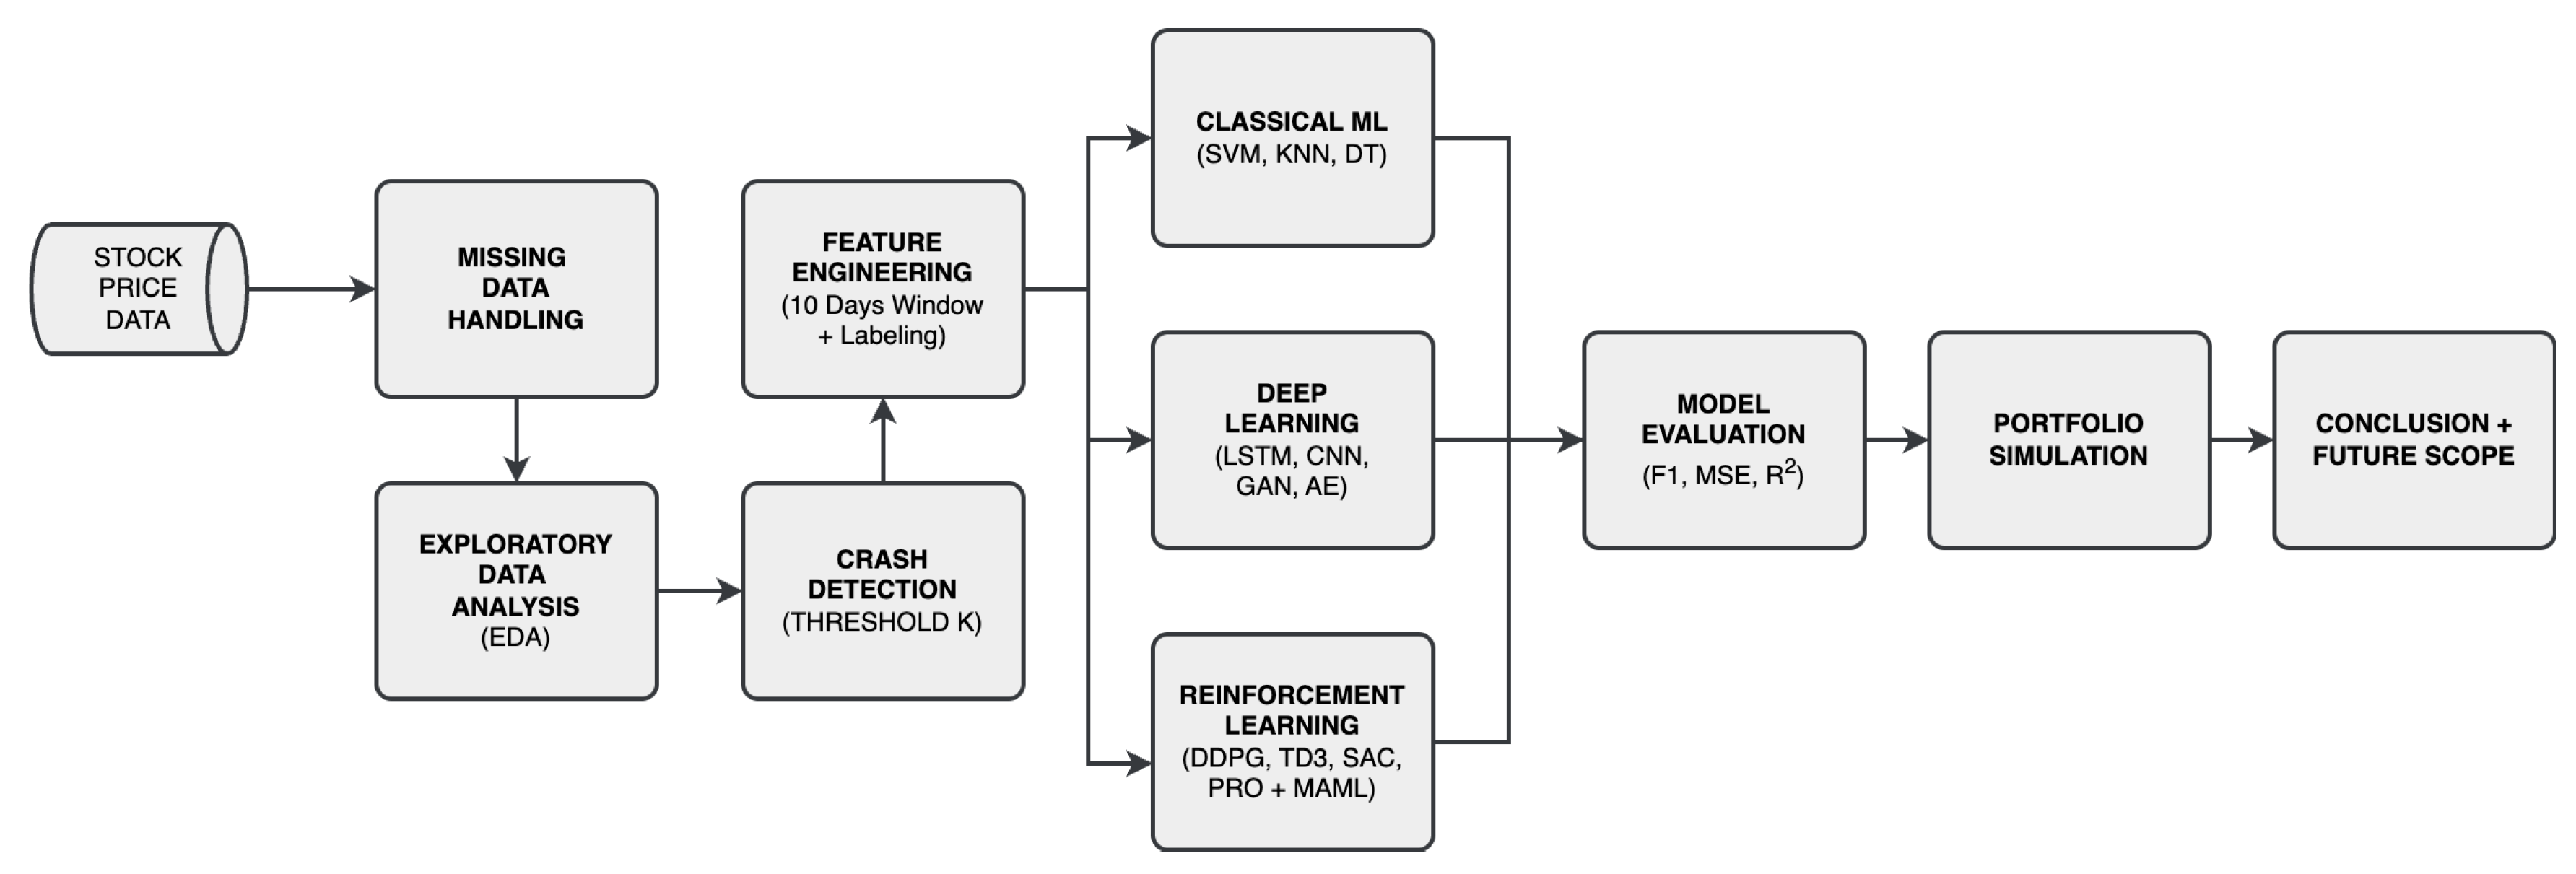
Figure 3.
Comparative ROC Curves for different Classification Algorithms.
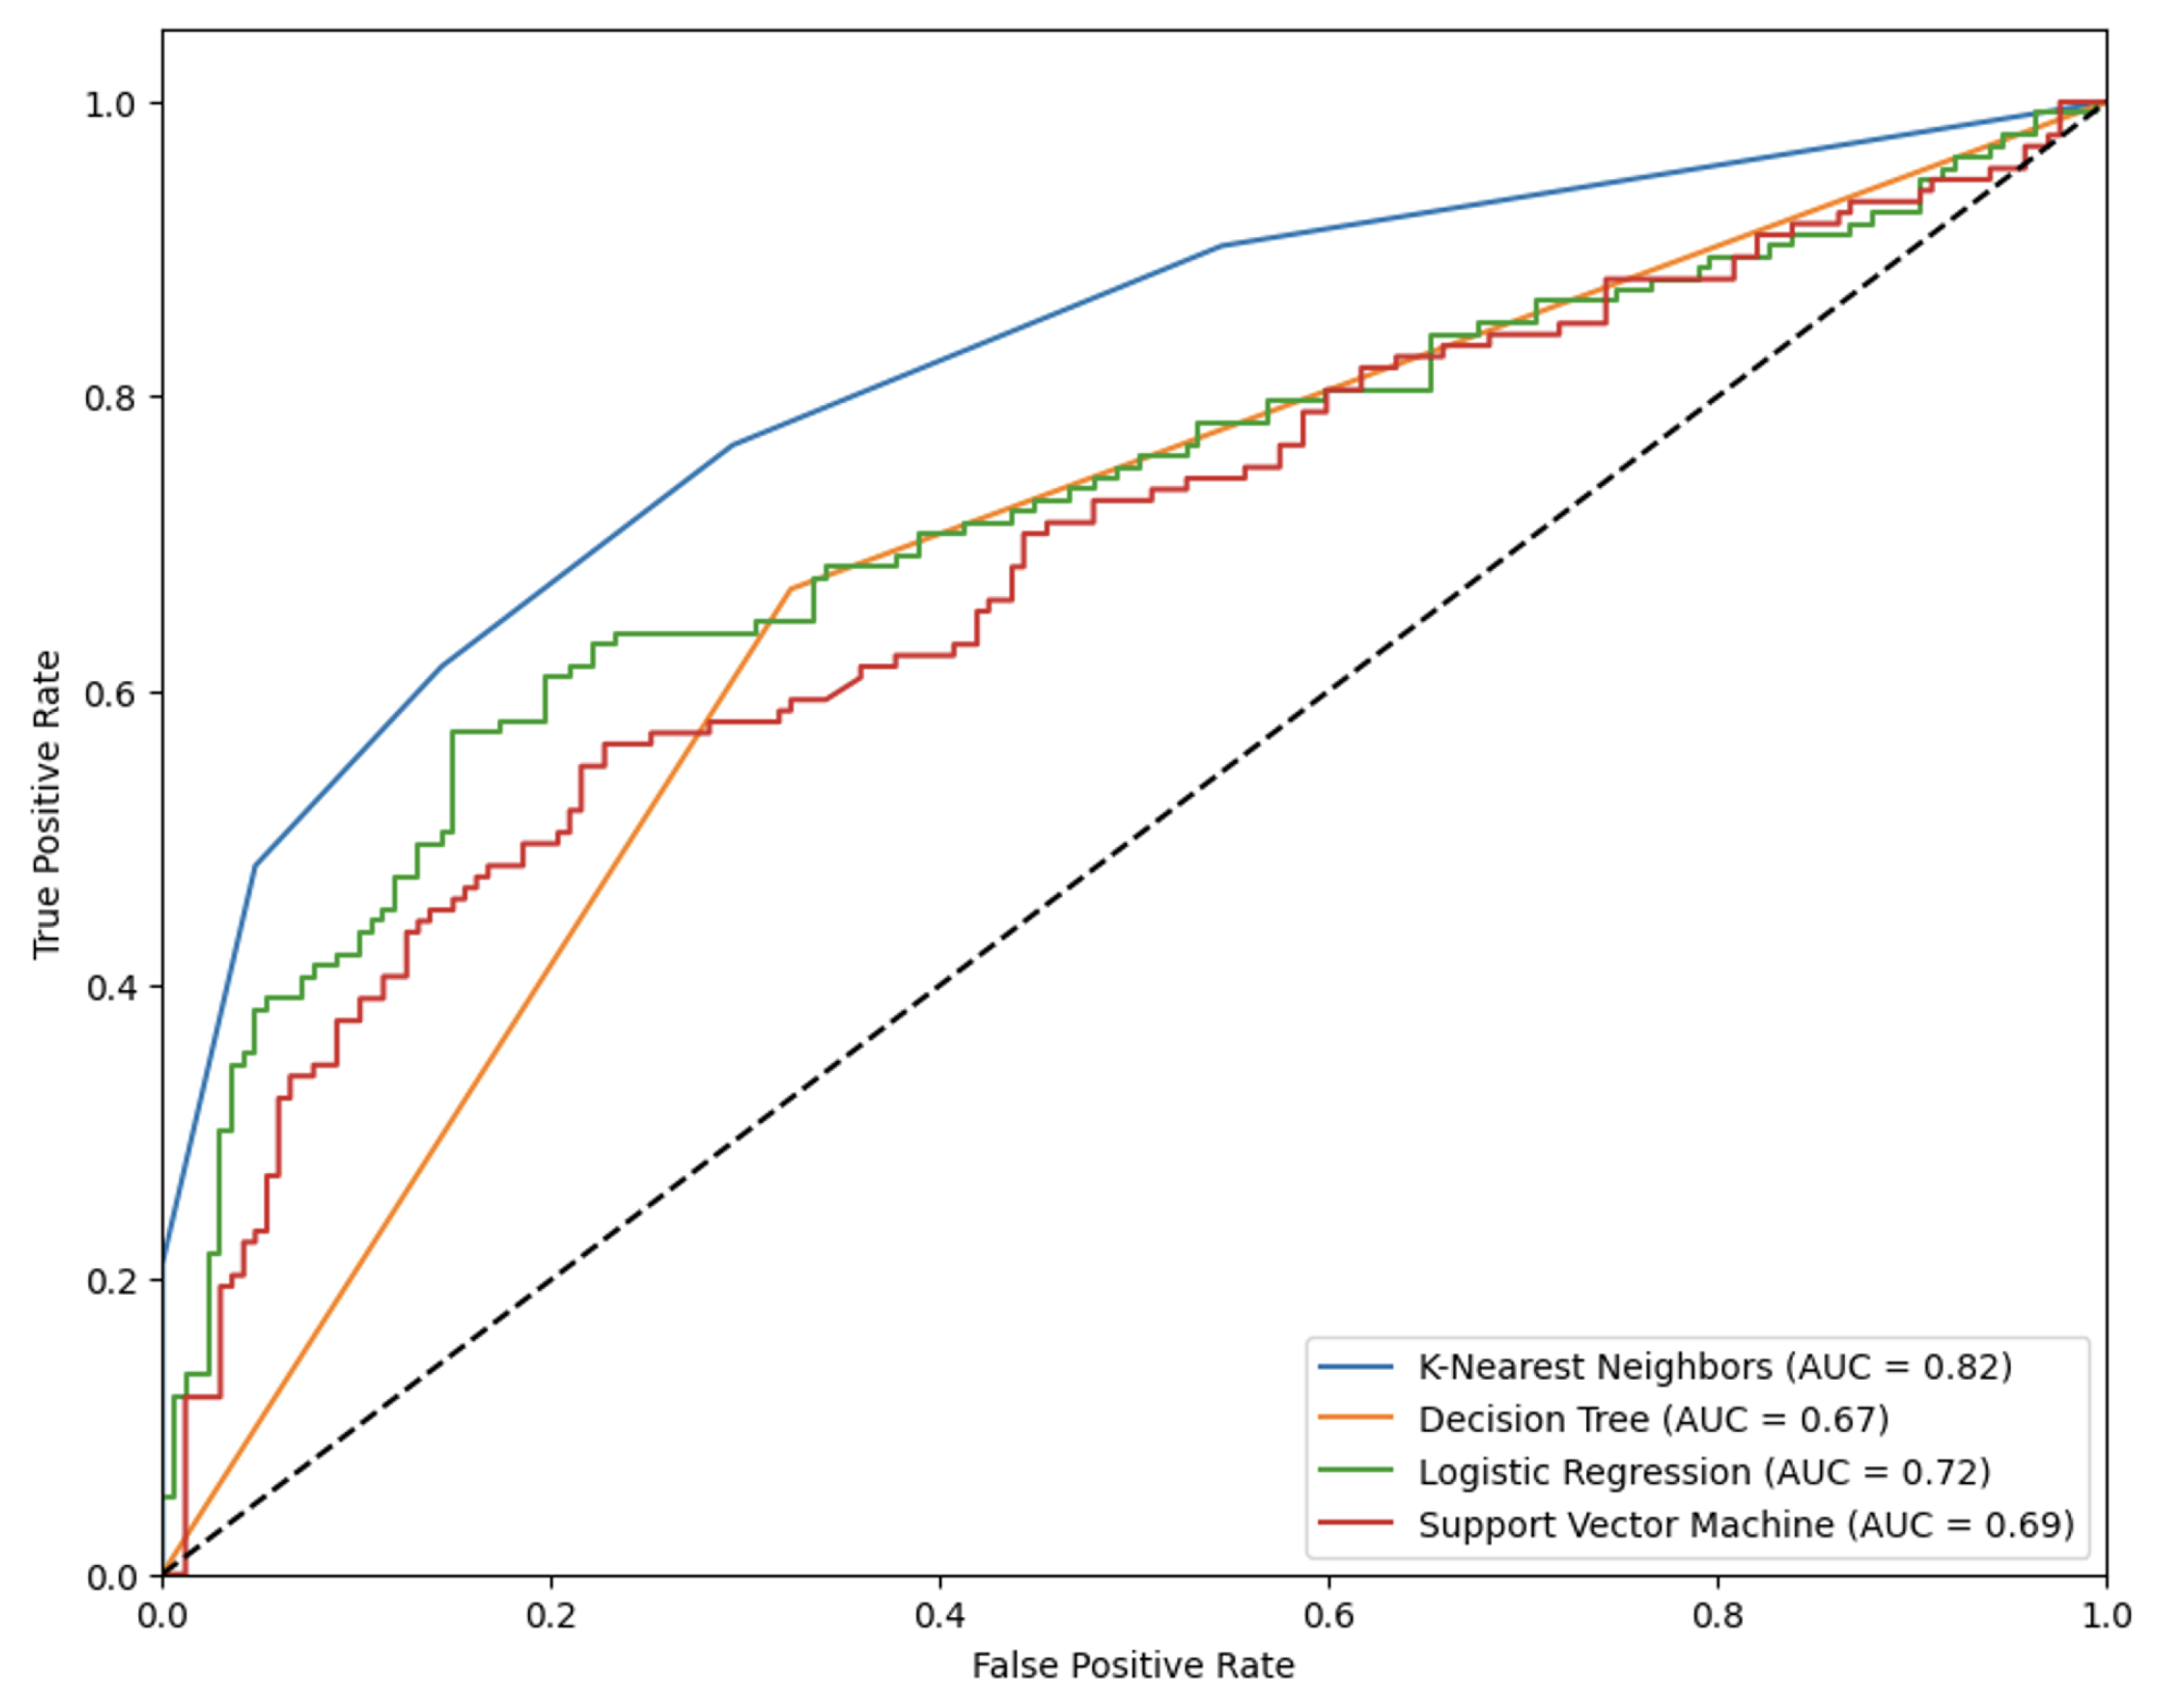
Figure 4.
Confusion Matrices of different Classification Algorithms.
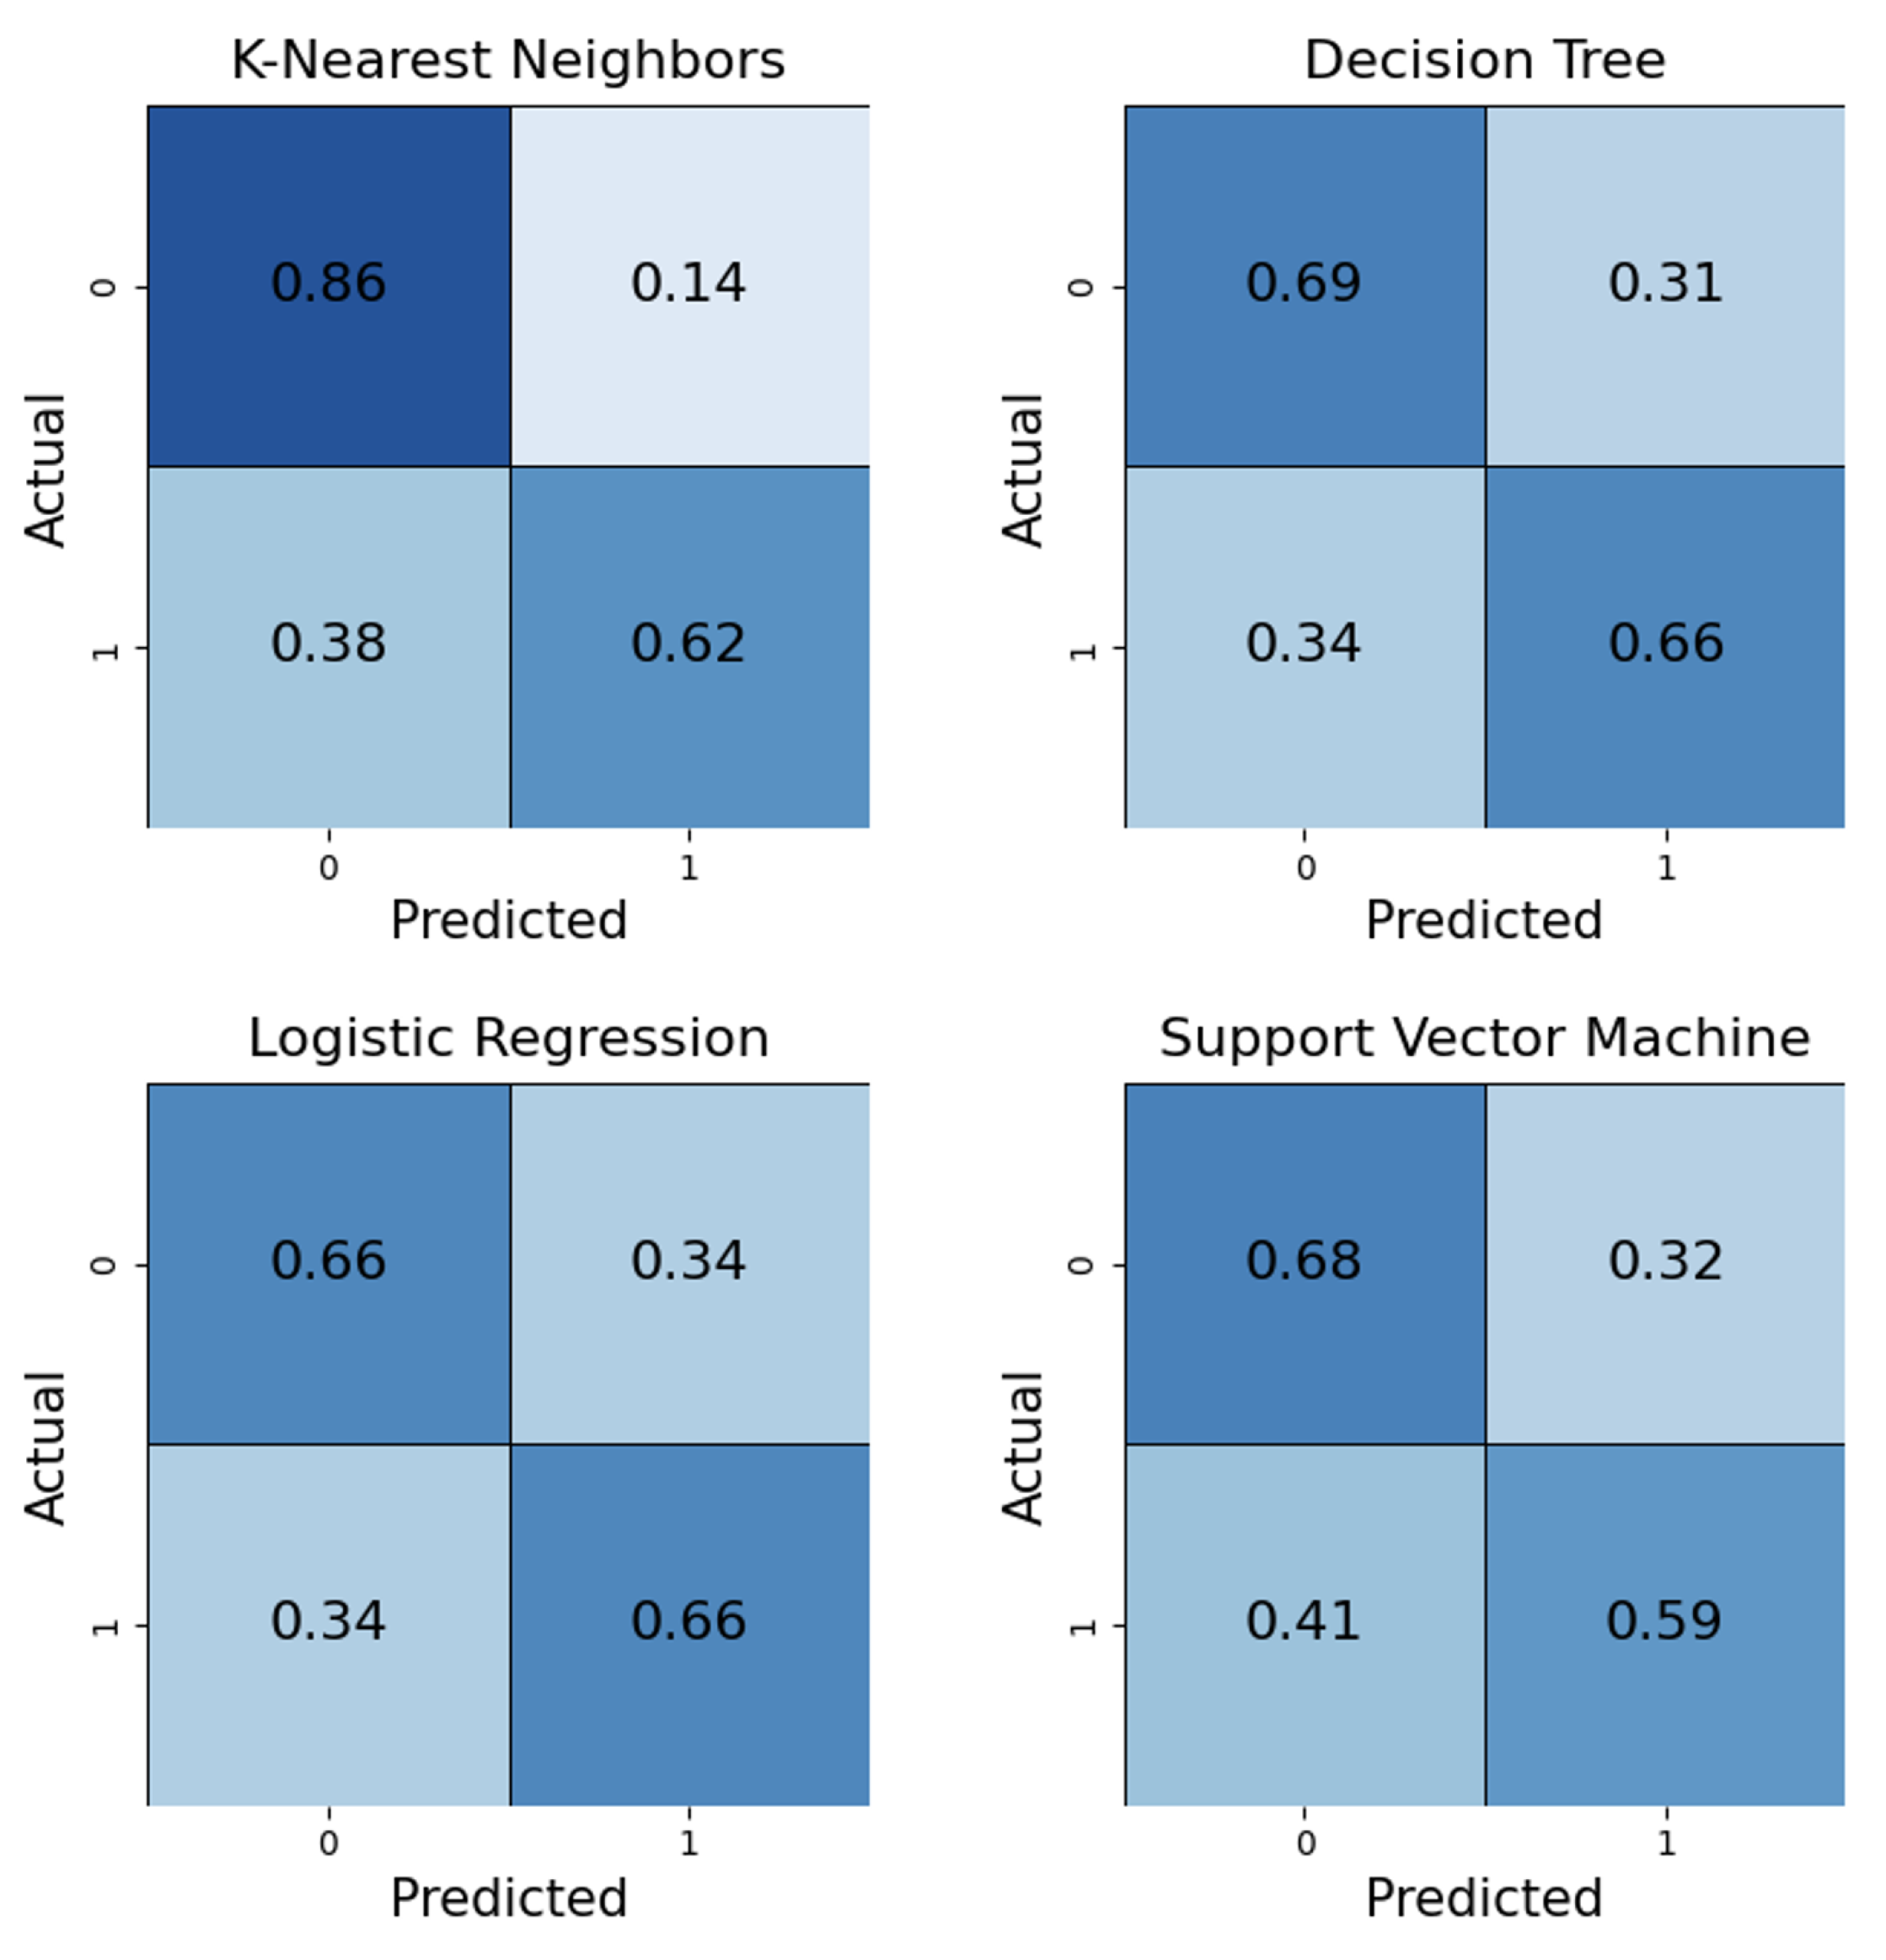
Figure 5.
Comparative Performance Analysis (Actual vs Predicted Curve for each Model).
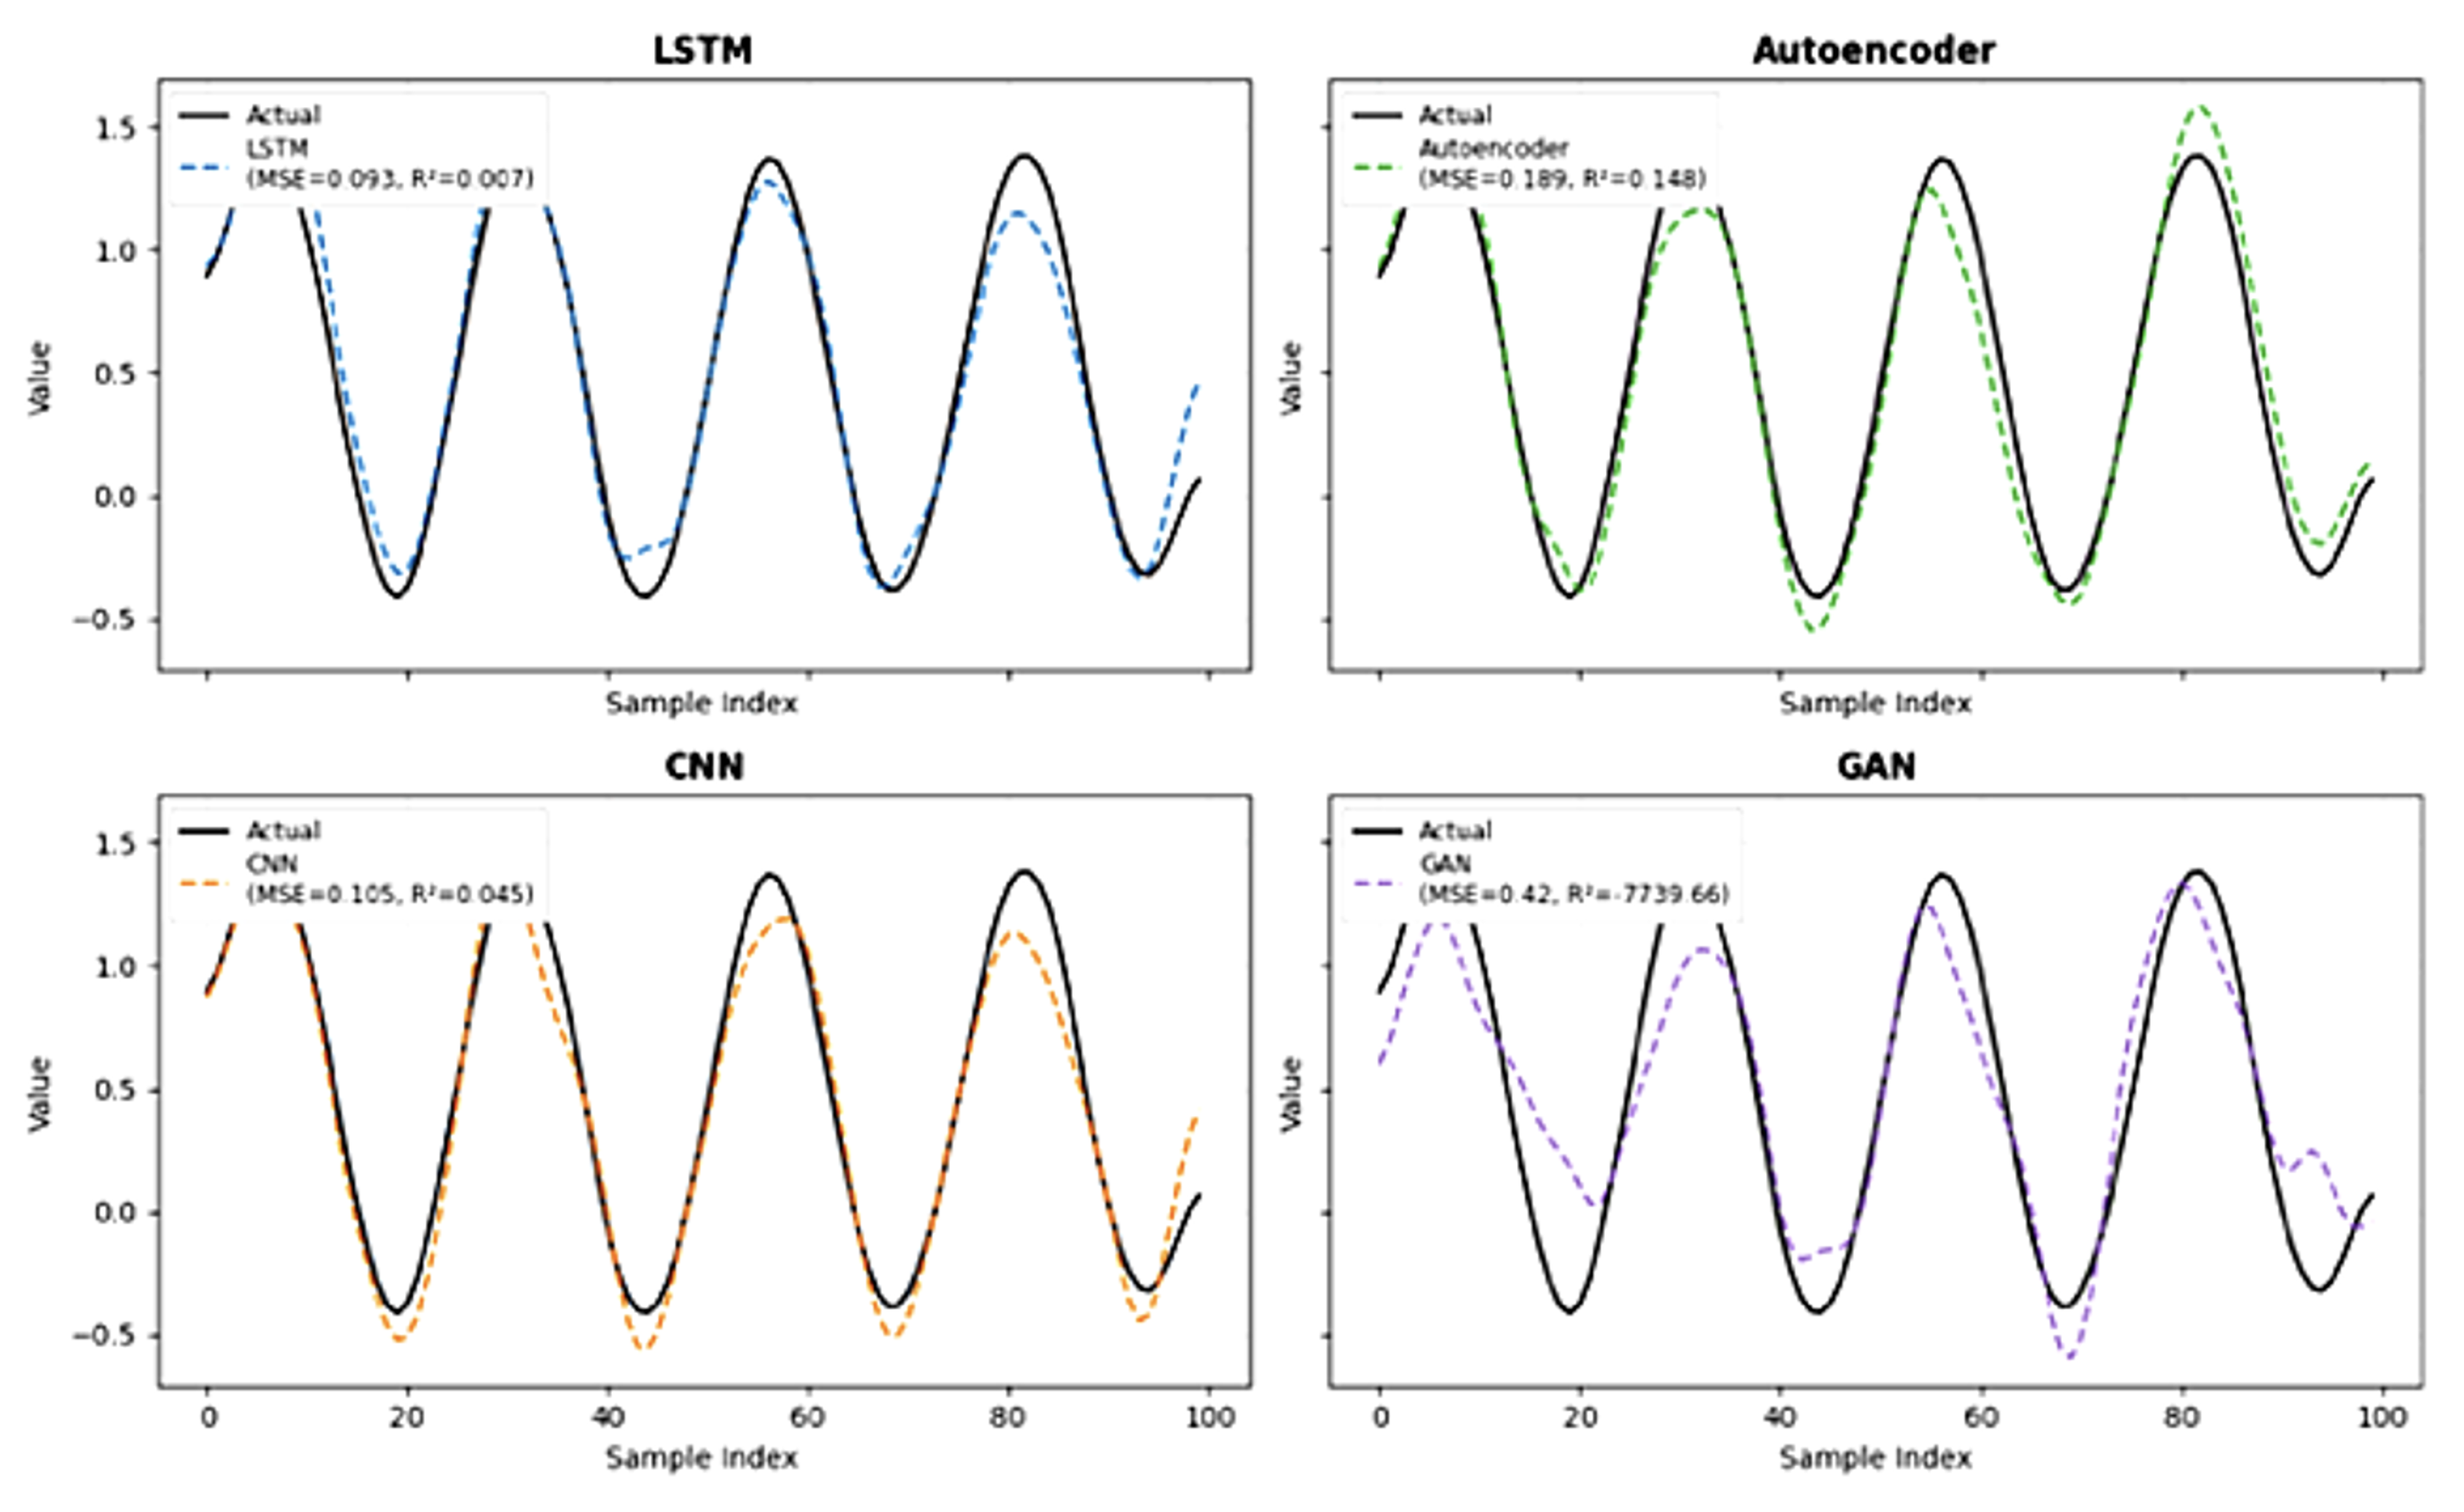

Table 1.
Highlighting novelty in crash definition, DL+RL integration, and portfolio-level evaluation.
Table 1.
Highlighting novelty in crash definition, DL+RL integration, and portfolio-level evaluation.
| References | Key Contribution | How This Paper Approaches |
|---|---|---|
| Conventional & Classical ML (Atsalakis & Valavanis, 2010[1]; Kim, 2003[2]; Henrique et al., 2018[15]) | Surveys and applications of conventional econometric models and ML methods (SVM, SVR) for price/direction forecasting | Moves beyond price or direction prediction to define crash-like events as rare outcomes, framed as temporal sequence classification |
| Deep Supervised Models (Bao et al., 2017[8]; Fischer & Krauss, 2018[5]; Chong et al., 2017[7]) | Use of LSTM, stacked autoencoders, CNNs, and feature learning for financial time series forecasting | Extends from one-step regression/classification to crash detection using sliding windows; integrates DL outputs with RL policies |
| Reinforcement Learning for Trading/Portfolio (Deng et al., 2016[11]; Jiang et al., 2017[12]) | DRL applied to optimize trading strategies, learn signal representations, or manage portfolio weights | Shifts RL focus from profit maximization to crash resilience by introducing misclassification costs and portfolio risk metrics (drawdown, Sharpe) |
| Crash-specific ML Approaches (Dichtl et al., 2021[16]) | Supervised ML applied directly for crash prediction | Advances from pure supervised learning to a hybrid DL + DRL design, explicitly targeting rare crash events |
| Multimodal / Representation Focus(Chong et al., 2017[7]) | Emphasis on feature extraction and representation (e.g., PCA, RBM, autoencoders) for predictive tasks | Uses representations but goes further: aligns them with RL-driven crash-aware decision policies |
Table 2.
Performance Comparison of different Reinforcement Learning Models.
| Model | MSE | MAE | R2-Score |
|---|---|---|---|
| Deep Reinforcement Learning | 6.922 | 1.971 | 0.999 |
| Deep RL (with Moving Averages) | 6.922 | 1.971 | 0.999 |
| Transformer | 982.18 | 130.60 | -11.47 |
| Deep Deterministic Policy Gradiant (DDPG) | 0.367 | 0.486 | -3.39 |
| Graph Neural Network (GNN) | 62.87 | 6.427 | 0.910 |
| Twin Delayed DDPG (TD3) | 6.922 | 1.971 | 0.999 |
| Soft Actor-Critic (SAC) | 6.922 | 1.971 | 0.999 |
| Neural Attention Mechanism in PPO | 62.87 | 6.427 | 0.910 |
| Evolution Strategies (ES) + PPO | 6.922 | 1.971 | 0.999 |
| Meta-Learning (MAML) | 6.922 | 1.971 | 0.999 |
Table 3.
Performance Comparison of different Classification Models.
| Model | Precision | Recall | F1-Score | Accuracy | AUC |
|---|---|---|---|---|---|
| KNN | 0.731 | 0.787 | 0.758 | 0.773 | 0.940 |
| LR | 0.714 | 0.600 | 0.653 | 0.680 | 0.993 |
| DT | 0.711 | 0.640 | 0.673 | 0.707 | 0.843 |
| SVM | 0.613 | 0.640 | 0.626 | 0.667 | 0.828 |
Table 4.
Comparative Performance Analysis of different Regression Algorithms.
| Model | MSE | R2-Score |
|---|---|---|
| LSTM | 0.093 | 0.007 |
| Autoencoder | 0.189 | 0.148 |
| CNN | 0.105 | 0.045 |
| GAN | 0.420 | -7739.66 |
Disclaimer/Publisher’s Note: The statements, opinions and data contained in all publications are solely those of the individual author(s) and contributor(s) and not of MDPI and/or the editor(s). MDPI and/or the editor(s) disclaim responsibility for any injury to people or property resulting from any ideas, methods, instructions or products referred to in the content. |
© 2025 by the authors. Licensee MDPI, Basel, Switzerland. This article is an open access article distributed under the terms and conditions of the Creative Commons Attribution (CC BY) license (http://creativecommons.org/licenses/by/4.0/).
Copyright: This open access article is published under a Creative Commons CC BY 4.0 license, which permit the free download, distribution, and reuse, provided that the author and preprint are cited in any reuse.


