Submitted:
16 October 2025
Posted:
17 October 2025
You are already at the latest version
Abstract
High-risk neuroblastoma (NB) remains a lethal pediatric cancer, and low-toxicity strategies are urgently needed. Using a syngeneic MYCN-driven model, we tested ultra-high dose oral arachidonic acid (ARA, ω6, 4.7 g/d hEq) and docosahexaenoic acid (DHA, ω3, 24 g/d hEq) as modifiers of tumorigenesis. ARA strikingly accelerated tumor growth, producing 100% tumor incidence and solid tumors without necrosis, and fourfold larger than controls. In contrast, DHA profoundly suppressed tumor progression: half of the tumors regressed completely, while the remainder grew slowly, averaging 4.5-fold smaller than controls and 18-fold smaller than ARA tumors. Lipid mediator profiling revealed mechanistic divergence, with ARA increasing angiogenic, proliferative, invasive, pro-inflammatory eicosanoids (PGE2, TXB2, EETs) and DHA enriching anti-inflammatory mediators (17,18-EpETE, 18-HEPE, 14-HDHA). Both treatments were well tolerated. These findings establish tissue lipid composition as a major determinant of neuroblastoma tumorigenesis, alongside genes and proteins, together suggesting DHA as a clinically tractable, safe adjunct to conventional therapies.
Keywords:
Neuroblastoma
; MYCN oncogene
; Arachidonic acid
; Docosahexaenoic acid
; Omega-3 fatty acids
; Eicosanoids and oxylipins
; Cyclooxygenase lipoxygenase cytochrome P450 pathways
; Tumor metabolism
1. Introduction
Neuroblastoma (NB) is the most common extracranial solid tumor of childhood and accounts for ~15% of pediatric cancer deaths (1). High-risk NB, particularly cases with MYCN amplification, remains a major therapeutic challenge: despite intensive multimodal therapy, 5-year survival remains below 50%. A defining feature of NB is its biological heterogeneity, ranging from spontaneous regression in infants to rapidly progressing, treatment-refractory disease. Mounting evidence implicates lipid signaling related to chronic inflammation and as a central regulator of this spectrum (2).
The tumor microenvironment is a hub of cytokines and bioactive lipids that shape tumor behavior. Highly unsaturated fatty acids (HUFAs) occupy a critical role: omega-6 arachidonic acid (ARA) is the dominant precursor of pro-inflammatory eicosanoids that promote angiogenesis, immune suppression, and metastasis, while omega-3 eicosapentaenoic acid (EPA) and docosahexaenoic acid (DHA) generate anti-inflammatory and pro-resolving mediators (3, 4). Elevated ARA metabolism associates with poor outcomes across cancers, including NB, whereas omega-3 HUFAs exert anti-tumor effects. Importantly, ultra-high-dose omega-3 supplementation (up to 20 g/day) is safe and effective in humans for hypertriglyceridemia and traumatic brain injury (5, 6), establishing feasibility for therapeutic dosing (7). Ultrahigh doses have not previously been systematically investigated in neuroblastoma or, to our knowledge, in cancer in general.
Preclinical evidence suggests that omega-3 fatty acids inhibit tumor cell proliferation, induce apoptosis, and modulate immune responses (8-10). Our studies further demonstrate that omega-3 fatty acids suppress tumor proliferation, induce apoptosis, and modulate immunity. Improving on existing medium to low dose studies, recently reported that ultra-high doses of EPA, DHA, or oxidation-resistant deuterated DHA at 12–14 g/day human equivalent completely abrogate tumorigenesis in a MYCN-driven NB model, whereas ARA accelerates tumor formation and reduces latency (11, 12). These findings indicate that dietary HUFA composition is a modifiable determinant of NB biology.
Here, we evaluate the therapeutic potential of ultra-high dosing of DHA in a syngeneic MYCN-driven NB model, focusing on tumor regression and growth suppression. Our primary comparator is ARA, expected from our previous studies to accelerate tumorigenesis. We further characterize the lipid mediator programs associated with ARA and DHA dosing, providing mechanistic insight into how orally consumed HUFA balance can dictate tumor fate.
2. Results
2.1. DHA Suppresses MYCN-Driven Tumor Growth While ARA Accelerates It
To evaluate the therapeutic impact of dietary HUFA composition, we used a syngeneic model of MYCN-driven neuroblastoma. Mice were inoculated subcutaneously with 3 × 10⁶ MYCN-expressing Neuro-2a cells. Tumors became palpable by ~day 6, and animals were randomized to three groups: control, ARA, and DHA. Mice received daily oral gavage at human-equivalent doses: ARA oil (44% ARA; 4.7 g/day hEq), DHA oil (82% DHA; 24 g/day hEq), or no gavage comparator group (Figure 1a).
The outcomes were unequivocal. ARA uniformly accelerated tumor growth, with 12/12 mice (100%) developing tumors that expanded rapidly to endpoint by day 37 (Figure 1b, c). Mean ARA tumor dimensions were 20.0 × 17.8 mm, and tumors were solid without evident necrosis, and were vascularized with irregular borders. By contrast, DHA profoundly suppressed tumor progression: among the 12 mice initially with tumors, 6 tumors completely regressed, in clear distinction to the ARA group. The other DHA 6 mice had small, indolent tumors averaging ~7.0 × 10.0 mm (Figure 1d). These residual tumors were pale and well-circumscribed. Controls (10/10 tumors) showed intermediate, varied growth with mean dimensions of 16.0 × 20.0 mm. Body weight did not differ between groups (Figure 1e). No evidence of clinical toxicity was observed, which is consistent with the well-established tolerability of high-dose HUFA dosing (5, 6). Gross morphology aligned with quantitative measures: ARA tumors were large and red, which suggests a high degree of vascularization. DHA tumors were absent in half the animals and restricted to small, pale nodules in the remainder (Figure 1f).
2.2. Tumor Burden and Regression Outcomes
Quantitative analysis underscored these findings. Tumor mass at termination was highest in ARA, averaging ~3× control and ~6× DHA (Figure 2). By contrast, DHA-treated animals showed an ~80% reduction in tumor burden compared to controls. Differences in tumor mean sizes at study end were significant (p<0.01).
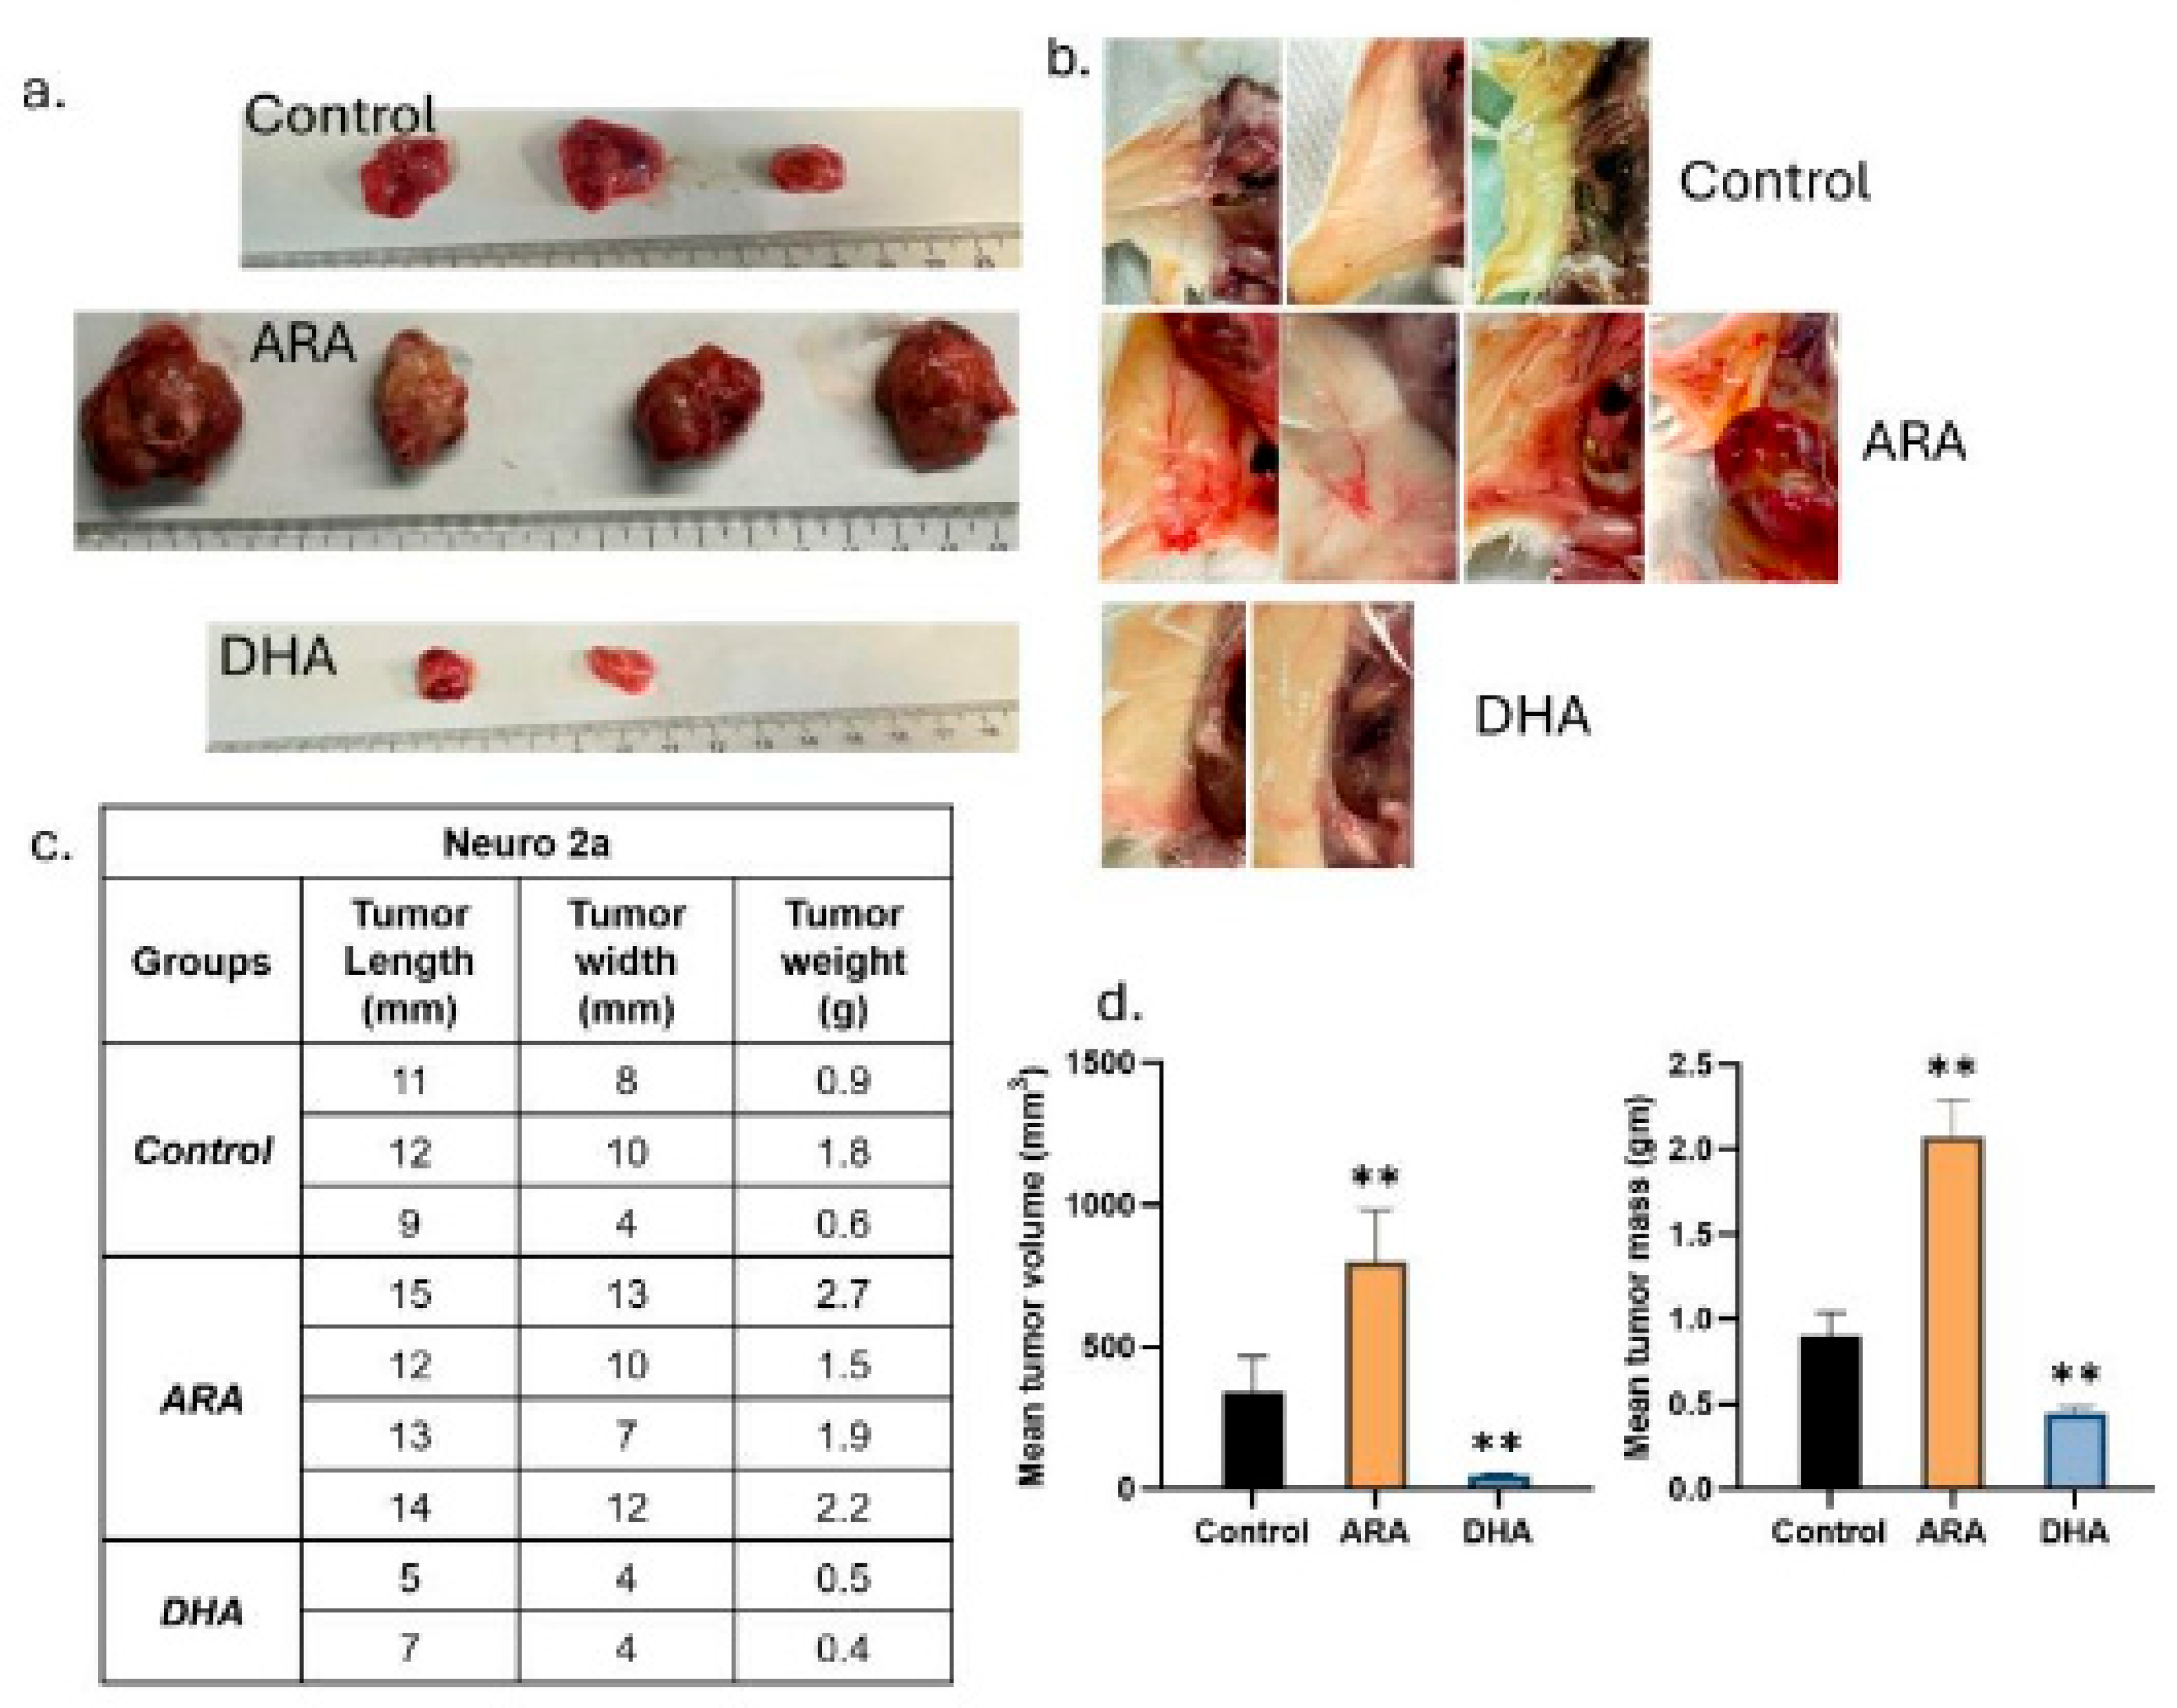
A second experiment intended to replicate the top level tumor findings. Conditions and groups were identical to those of the main study (Figure 3). Results replicated those of the main experiment. We documented the robust vessel formation in the skin flap of the ARA-treated animals compared to the controls and DHA-treated animals (Figure 3b).
2.3. Lipid Mediator Profiles Reveal Opposing Programs
To interrogate lipid signaling mechanisms, we determined quantitative changes in 74 lipid mediators in liver, spleen, brain, and skeletal muscle using LC-MS/MS for the mice in the main study (Figure 1). Values were normalized and expressed as fold-change relative to control (Tables 1–3).

Table 1.
EPA-derived eicosanoids in tissue. Ratio of DHA-dosed to ARA-dosed oxylipins for those that are p<0.05. Comparison of ARA and DHA dosed animal fold-changes compared to controls as described in the Methods. MRM transitions are reported as (precursor/product) masses. “–“, means not significant.
| ARA Derived Eicosanoids | Liver | Spleen | Brain | Skeletal Muscle |
| PGE2 (351/271) | 0.18 | - | - | - |
| PGD2 (351/189) | 0.03 | - | - | - |
| PGF2a (353/193) | 0.06 | - | - | 0.33 |
| 8-iso-PGF2a (353/193) | - | - | - | 0.32 |
| TXB2 (369/169) | 0.04 | - | - | 0.34 |
| 5-HETE (319/115) | 0.09 | 0.32 | - | - |
| 12-HETE (319/179) | 0.12 | - | - | 0.38 |
| 15-HETE (319/219) | 0.14 | 0.32 | - | 0.34 |
| 20-HETE (319/289) | 0.11 | 0.12 | - | 0.16 |
| LTB4 (335/195) | - | - | - | - |
| LXA4/15(R)-LXA4 (351/115) | 0.14 | - | - | - |
| LXB4 (351/221) | - | - | - | - |
| 8,9-EET (319/127) | 0.10 | 0.21 | - | 0.35 |
| 11,12-EET | 0.08 | 0.30 | - | 0.37 |
| 14,15-EET | 0.07 | 0.35 | - | - |
| 5,6 DiHETrE (337/145) | 0.13 | 0.21 | - | 0.38 |
| 8,9 DiHETrE (337/127) | 0.24 | 0.20 | 0.20 | 0.14 |
| 11,12-DiHET | 0.25 | 0.16 | 0.33 | 0.23 |
| 14,15-DiHET | 0.28 | 0.19 | 0.32 | 0.27 |
| PGE1 (353/ 317) | 0.20 | - | - | - |
| EPA Derived Eicosanoids | Liver | Spleen | Brain | Skeletal Muscle |
| 8,9-EpETE (317/127) | 4.69 | 3.21 | 2.19 | - |
| 11,12-EpETE (317/167) | 3.90 | 3.90 | 3.36 | 1.85 |
| 14,15-EpETE (317/207) | 4.60 | 3.54 | - | 1.94 |
| 17,18-EpETE (317/215) | 4.93 | 2.62 | 2.71 | 2.14 |
| 17,18 DiHETE (335/203) | 2.08 | - | - | 1.85 |
| 18-HEPE (317/259) | 4.87 | 3.02 | 2.84 | 1.87 |
| 5-HEPE (317/115) | 4.04 | 2.31 | 2.27 | 2.58 |
| 11-HEPE (317/167) | 3.62 | 2.85 | 2.65 | - |
| 12-HEPE (317/179) | 2.68 | 3.49 | 2.60 | 2.54 |
| 15-HEPE (317/219) | 2.68 | 1.88 | 2.14 | - |
EPA-derived mediators increased robustly with DHA. In liver, DHA elevated 17,18-EpETE, 18-HEPE, 12-HEPE, 15-HEPE, and related isomers, often 2–5-fold relative to ARA. Similar patterns were seen in spleen and brain. These mediators are associated with anti-inflammatory and anti-proliferative signaling.
ARA-derived mediators in ARA-dosed animals. Liver and skeletal muscle showed marked increases in PGE₂, PGD₂, PGF₂α, and TXB₂ (2–6-fold), as well as epoxyeicosatrienoic acids (EETs; 8,9-, 11,12-, 14,15-) and their DiHETE products. These eicosanoids are well established to promote angiogenesis, invasion, and immune evasion, consistent with the aggressive phenotype.
DHA-derived docosanoids were selectively enriched in DHA treatment. Spleen, brain, and muscle displayed higher levels of 14-HDHA, 17-HDHA, EpDPA, and DiHDPA species, potentially consistent with activation of maresin and protectin pathways that favor resolution and apoptosis. However, these latter compounds were not detected in our panel.
Some changes were notable on a tissue-by-tissue basis. In Liver, DHA increased EpETEs (notably 17,18-EpETE), HEPEs, and 18-HEPE; ARA elevated prostaglandins (PGE₂, PGD₂, PGF₂α), TXB₂, and EETs. In Spleen, DHA gavage elevated 14-HDHA, 17-HDHA, 18-HEPE, (maresin precursors), and EpDPAs; ARA increased EETs and prostanoids. In Brain, DHA upregulated 14-HDHA, 17-HDHA, EpETEs, and HDHAs; ARA increased PGE₂ and PGD₂. In skeletal muscle, DHA elevated 14-HDHA, 17-HDHA, HEPEs, and DiHDPA metabolites; ARA enriched TXB₂, PGF₂α, and DiHETEs (Tables 1–3)
Together, these data highlight a consistent biochemical dichotomy: DHA dosing enriched anti-inflammatory, pro-resolving, and anti-tumor mediators, whereas ARA dosing increased pro-tumor eicosanoids across multiple tissues.
3. Results Summary
In a syngeneic MYCN-driven neuroblastoma model, dietary HUFA composition dictated tumor fate. ARA promoted uniform progression with large, aggressive tumors enriched in pro-tumor eicosanoids. DHA induced regression in half of tumors and growth arrest in the remainder, accompanied by increases in anti-inflammatory and pro-resolving mediators. Treatments were safe and well tolerated, underscoring translational potential.
Table 3.
DHA-derived docosanoids in tissue. Ratio of DHA-dosed to ARA-dosed oxylipins for those that are p<0.05. Comparison of ARA and DHA dosed animal fold-changes compared to controls as described in the Methods. MRM transitions are reported as (precursor/product) masses. “–“, means not significantly different.
| DHA Derived Docosanoids | Liver | Spleen | Brain | Skeletal Muscle |
| 7,8-EpDPA (343/113) | - | - | - | - |
| 10,11-EpDPA (343/153) | - | 2.37 | 1.33 | 1.83 |
| 13,14-EpDPA (343/161) | - | 2.77 | 1.53 | 2.61 |
| 16,17-EpDPA (343/273) | - | 1.97 | - | 2.27 |
| 19,20-EpDPA (343/241) | - | - | - | - |
| 7,8-DiHDPA (361/127) | - | - | - | - |
| 10,11-DiHDPA (361/153) | - | - | 1.86 | 2.12 |
| 13,14-DiHDPA (361/193) | - | 2.40 | 1.61 | 2.09 |
| 16,17-DiHDPA (361/233) | - | - | - | - |
| 19,20-DiHDPA (361/229) | - | 4.85 | - | 2.26 |
| 4-HDHA (343/101) | - | - | - | - |
| 7-HDHA (343/141) | - | - | - | - |
| 8-HDHA (343/125) | - | - | - | - |
| 10-HDHA (343/181) | - | 2.34 | 1.35 | 1.81 |
| 11-HDHA (343/165) | - | - | - | 1.69 |
| 13-HDHA (343/193) | - | 2.11 | - | 2.19 |
| 14-HDHA (343/205) | - | 2.85 | 1.64 | 2.61 |
| 16-HDHA (343/233) | - | - | - | - |
| 17-HDHA (343/245) | - | 1.91 | - | 2.31 |
| 20-HDHA (343/241) | - | - | - | - |
4. Discussion
Our findings show that ultra-high dose DHA exerts a profound anti-tumor effect in an established MYCN-driven neuroblastoma model (12), producing complete regression in half of the tumors and indolent growth in the remainder. This effect is directly translatable and immediately applicable. Mechanism and dose-response remain important areas for refinement, but the therapeutic outcome itself is robust, reproducible, and stands independently of full mechanistic elaboration. These results demonstrate that ultra-high dose dietary HUFAs are a determinant of tumor fate, positioning DHA as a safe, low-toxicity adjunct and/or alternative to conventional therapy and supporting the emerging view of lipids as a third pillar of cancer biology alongside oncogenes and immune function.
The tumor-promoting effect of ARA aligns with its role as a precursor to pro-inflammatory eicosanoids that enhance angiogenesis, immune evasion, and metastasis (13). The COX-2 pathway, which metabolizes ARA to prostaglandins, is upregulated in neuroblastoma, with pathway inhibition showing anti-tumor effects (14). These results suggest that even modest increases in endogenous ARA may significantly accelerate disease progression, consistent with our human genetics results in colorectal cancer (15). ARA-treated tumors displayed little to no necrosis, were well vascularized, and showed invasive morphology. Our previous study similarly demonstrated that ARA supplementation (4.6-6.0 g/day, human dose equivalent) enhanced tumor formation, increased vascularization, and reduced tumor latency from 10 to 5.5 days in this model (11).
An alternative anti-angiogenic mechanism, not directly investigated herein, involves the high demand for arachidonic acid (ARA) by the capillary endothelium. Endothelial cells, a major source of oxylipins, are notably rich in ARA, which can comprise up to 20% of total fatty acids (16, 17). These high levels of ARA are not observed for docosahexaenoic acid (DHA) or eicosapentaenoic acid (EPA) in non-neural tissues. Therefore, competitive inhibition of ARA incorporation or metabolism could restrict the formation of nascent capillaries and thereby suppress angiogenesis.
Lipid mediator analyses provide plausible explanations for the divergent outcomes. ARA supplementation elevated pro-tumorigenic eicosanoids, including PGE₂, TXB₂, and multiple EETs, which promote angiogenesis, suppress effector T-cell function, and facilitate metastasis. In contrast, DHA increased EPA- and DHA-derived mediators such as 17,18-EpETE, 18-HEPE, 14-HDHA, and maresin/protectin precursors, all linked to anti-inflammatory and pro-resolving signaling (18, 19). HUFA balance thus reprograms the tumor microenvironment, signaling for progression or regression.
Several mechanisms may contribute to DHA's anti-tumor effects: (1) competitive inhibition of ARA metabolism, reducing pro-inflammatory eicosanoid production; (2) alteration of lipid raft composition; (3) direct modulation of gene expression through nuclear receptors; and (4) production of specialized pro-resolving mediators (4, 9). These opposing effects are particularly relevant in MYCN-driven neuroblastoma, where MYCN amplification drives poor prognosis and reprograms cellular metabolism, including lipid metabolism, to support rapid proliferation (12, 20). Determining which of these are the primary driver(s) of the observed tumor inhibition will be central to fully exploiting ultra-high dose HUFA therapeutically.
4.1. ARA and DHA Divergent Effects in MYCN-Amplified Neuroblastoma
Distinct lipid mediators significantly influence the growth, survival, and progression of high-risk MYCN amplified neuroblastoma (21). Neuroblastoma tumors with 11q deletion have upregulated eicosanoid synthesis (22) and receptors (23). The 11q locus hosts the FADS1/2 gene cluster required for endogenous HUFA synthesis (24) and is deranged in many cancers (25). Its deletion in some neuroblastoma, coupled with upregulated synthesis and receptors, suggests that aggressive tumors rely on the importation of HUFA substrates for lipid mediator synthesis.
DHA strongly suppressed ARA-derived PGE2 in liver (Table 2). PGE2 enhances MYCN-amplified neuroblastoma cell survival through EP4 receptor activation and cAMP/PKA signaling, stabilizing MYCN protein and enhancing its oncogenic functions (26). COX-2 inhibition has shown anti-tumor effects in preclinical models (21). High dose DHA or EPA blocks PGE2 production by outcompeting ARA for COX-1 and COX-2 access while maintaining enzyme function and the ability to synthesize EPA-derived eicosanoids, as our data show. Unlike COX-2 inhibitors such as aspirin that irreversibly silence all COX activity, this mechanism is distinct.
ARA-derived 15-HETE is strongly angiogenic and demonstrates context-dependent effects in MYCN-amplified neuroblastoma. 15-HETE induces growth arrest and apoptosis in MYCN-amplified neuroblastoma cell lines through PPARγ signaling, which antagonizes MYCN-mediated transcriptional programs (27). DHA suppresses 15-HETE in liver, spleen, and skeletal muscle (Table 2).
DHA upregulated the EPA-derived mediator 17,18-EpETE in all four tissues, and its hydrolysis product 17,18-DiHETE in liver and skeletal muscle (Table 1). 17,18-EpETE downregulates MYCN expression and inhibits neuroblastoma cell proliferation through PI3K/Akt signaling pathways critical for MYCN protein stability. Its metabolite, 17,18-DiHETE, retains some anti-tumor activity but with reduced potency, implicating epoxide hydrolase activity in determining mediator efficacy (28).
DHA upregulated 14-HDHA in spleen, brain, and skeletal muscle (Table 3). 14-HDHA inhibits neuroblastoma growth through multiple mechanisms, including reduction of tumor microenvironment inflammation and direct induction of apoptosis in cells expressing high MYCN levels (29). Its potential role as a precursor for maresin biosynthesis may contribute to anti-tumor effects, though this remains to be fully elucidated.
DHA suppressed ARA-derived thromboxane A2 (measured as TXB2) in liver (Table 2). Elevated thromboxane production in MYCN-amplified tumors promotes aggressive behavior, with thromboxane receptor antagonists reducing tumor growth and metastasis in preclinical models (30).
ARA upregulated 8,9-EET, 11,12-EET, and 14,15-EET in liver and spleen, and the former two in skeletal muscle (Table 2). EETs, particularly 11,12-EET and 14,15-EET, promote MYCN-amplified neuroblastoma growth through angiogenesis enhancement and direct effects on tumor cell survival. Inhibition of soluble epoxide hydrolase, which increases EET levels, accelerated neuroblastoma growth, while EET antagonists reduced tumor burden (31).
These findings underscore dietary omega-6 as a potential risk factor and omega-3 as a therapeutic opportunity in pediatric neuroblastoma, with important implications for nutritional recommendations given the high omega-6 content in Western diets.
4.2. MYC-Associated Cancers
c-MYC dysregulation drives ~70% of human cancers, including Burkitt lymphoma, breast cancer, and multiple myeloma. ARA-derived PGE2 promotes MYC-associated cancer growth and progression. In MYC-driven lymphomas and breast cancer, PGE2 enhances tumor cell survival and proliferation through EP4 receptor-mediated cAMP/PKA signaling, which stabilizes MYC protein and enhances its transcriptional activity (32).
In contrast to its effects on MYCN-amplified cancers, ARA-derived 12-HETE demonstrates particularly pronounced pro-tumorigenic effects in MYC-associated malignancies. Elevated 12-HETE production in MYC-driven lymphomas compared to normal lymphoid tissue, with inhibition of 12-lipoxygenase significantly reducing tumor growth in preclinical models (33). Mechanistically, 12-HETE appears to enhance MYC protein stability through modulation of GSK-3β activity, representing a potential therapeutic target specific for MYC-associated cancers.
EPA-derived 5-HEPE has demonstrated anti-tumor effects in MYC-associated breast cancer models. 5-HEPE downregulates MYC expression and inhibits tumor cell proliferation by antagonizing 5-HETE-mediated signaling pathways critical for MYC protein stability (34) suggesting therapeutic potential through dietary EPA supplementation in MYC-driven cancers.
DHA-derived 17-HDHA and 4-HDHA demonstrate anti-tumor properties in MYC-associated cancers. These compounds inhibit tumor growth in MYC-driven lymphoma models by reducing tumor microenvironment inflammation and inducing apoptosis (35). Their potential roles as precursors for D-series resolvins and maresins may contribute to anti-tumor effects.
8-iso-PGF2α, a marker of oxidative stress, is elevated in MYC-driven tumors, reflecting increased oxidative stress from MYC overexpression. While not directly influencing tumor growth, it serves as a biomarker for monitoring oxidative stress-targeted interventions in MYC-associated malignancies (36).
Lipoxins LXA4 and LXB4 demonstrate anti-tumor properties in MYC-associated cancers through inflammatory signaling modulation. LXA4 inhibits tumor growth and enhances conventional therapy efficacy in MYC-driven lymphoma through FPR2/ALX receptor activation and NF-κB signaling inhibition, critical for MYC-mediated transcriptional programs (37), suggesting therapeutic applications for lipoxins or their stable analogs.
4.3. Lipids as Active Orchestrators of Oncogenesis
Across tumor types, ARA-derived metabolites consistently promote angiogenesis, proliferation, immune evasion, and invasion, whereas DHA/EPA-derived metabolites suppress these pathways, favoring apoptosis and immune surveillance. Lipid mediators are thus active orchestrators of oncogenesis, not bystanders. Lipid composition constitutes a third pillar of cancer biology alongside oncogenes and immune function. Dietary HUFA balance serves as a therapeutic lever, with DHA supplementation emerging as an immediately translatable intervention and combination strategies—such as MYC pathway inhibition paired with COX/CYP blockers or pro-resolving lipid analogs—holding particular promise for simultaneously depleting pro-growth eicosanoids and reactivating anti-tumor pathways.
Although CAR-T cells and checkpoint inhibitors are not standard neuroblastoma treatments, early trials demonstrate persistent interest in these approaches. Our results suggest that dietary HUFA balance could critically influence such immunotherapies. ARA elevated mediators that suppress cytotoxic T-cell function, expand regulatory T cells, and blunt checkpoint efficacy, while DHA-enriched anti-inflammatory mediators are associated with restored immune surveillance. We hypothesize that high-dose ARA may abolish, and DHA may enhance, CAR-T and checkpoint therapy efficacy, establishing these as metabolism-dependent interventions with dietary lipid composition as a controlling factor and opening actionable opportunities to overcome immunotherapy resistance.
5. Conclusions
Our preclinical results indicate that modulation of PUFA intake—specifically, reducing ARA and increasing DHA—offers a complementary, low-toxicity approach to conventional neuroblastoma therapies. As normal nutrients conserved among mammals, ARA and DHA serve as both metabolic endpoints and signaling molecule substrates, though translation depends on doses and kinetics. High-dose omega-3 supplementation is well-tolerated in humans for extended periods with only mild side effects (11).
Study limitations include incomplete representation of the human tumor microenvironment, fixed rather than titrated doses, and lack of detailed immune cell and lipid mediator profiling. Future research should investigate dose-response relationships, use EPA and bis-allylic DHA to inform mechanism, perform detailed immunophenotyping, explore synergies with standard therapies, investigate ROS-independent mechanisms, and evaluate patient-derived xenograft models.
Nevertheless, high dose DHA could be implemented immediately. Neuroblastoma patients in remission may be particularly good candidates for DHA maintenance therapy.
STAR * Methods
| REAGENT or RESOURCE | SOURCE | IDENTIFIER |
| Experimental models: Cell lines | ||
| Neuro-2a cells | ATCC | CCL-131 |
| MYCN transgene construct | Custom (human MYCN) | Details in Methods |
| Experimental models: Organisms/strains | ||
| A/J mice | Jackson Laboratory | Stock #000646 |
| Cell Culture Reagents | ||
| Lipofectamine 3000 | Thermo Fisher | Cat# L3000008 |
| RPMI-1640 medium | Gibco (Thermo Fisher) | Cat# 11875-093 |
| Heat-inactivated fetal bovine serum (HI-FBS) | Gibco (Thermo Fisher) | Cat# 16140-071 |
| LC-MS/MS Standards | ||
| Primary Vascular Eicosanoid MaxSpec LC-MS Mixture | Cayman Chemical | Cat# 19667 |
| Arachidonic Acid CYP450 Metabolite MaxSpec LC-MS Mixture | Cayman Chemical | Cat# 20665 |
| Primary COX and LOX MaxSpec LC-MS Mixture | Cayman Chemical | Cat# 19101 |
| Arachidonic Acid Oxylipin MaxSpec LC-MS Mixture | Cayman Chemical | Cat# 20666 |
| SPM E-series MaxSpec LC-MS Mixture | Cayman Chemical | Cat# 19417 |
| Prostaglandin E1 | Cayman Chemical | Cat# 13010 |
| Prostaglandin E3 | Cayman Chemical | Cat# 14990 |
| Leukotriene B4 | Cayman Chemical | Cat# 20110 |
| DHA Oxylipin MaxSpec LC-MS Mixture | Cayman Chemical | Cat# 22280 |
| SPM D-series LC-MS Mixture | Cayman Chemical | Cat# 18702 |
| SPM E-series LC-MS Mixture | Cayman Chemical | Cat# 19417 |
| 8-iso Prostaglandin F2a | Cayman Chemical | Cat# 16350 |
| Lipoxin LC-MS Mixture | Cayman Chemical | Cat# 19412 |
| Docosahexaenoic Acid CYP450 Oxylipins LC-MS Mixture | Cayman Chemical | Cat# 22639 |
| Lipid Reagents | ||
| Arachidonic acid oil (40% ARA) | ARASCO | Cat# 476800 |
| Docosahexaenoic acid oil (82% DHA)x` | OMEGAVIA | N/A |
| HPLC Reagent | ||
| Acetonitrile ≥99.9% (by GC) for HPLC, for spectrophotometry | J.T. Baker | Cat# JT9012-3 |
| Methanol ≥99.8% (by GC, corrected for water content), BAKER ANALYZED™ HPLC for liquid chromatography, for HPLC, UHPLC, for spectrophotometry | J.T. Baker | Cat# JT9093-33 |
| Water, BAKER ANALYZED® HPLC for HPLC, UHPLC, for spectrophotometry | J.T. Baker | Cat# JT4218-88 |
| Acetic acid, glacial, ACS, 99.7+% | Sigma- Aldrich | Cat# A6283-1L |
| 2-Propanol ≥99.5%, BAKER ANALYZED® A.C.S. Reagent ACS | J.T. Baker | Cat# JT9084-33 |
| Hexanes, mixed isomers, HPLC Grade, 99+% | Thermo Fisher Scientific | Cat# 045652.K7 |
| Instruments and Software | ||
| ExionLC AD UHPLC | Sciex | N/A |
| Sciex 7500 QTRAP mass spectrometer | Sciex | N/A |
| Kinetex Polar C18 column (100 mm × 3 mm, 2.6 µm, 100 Å) | Phenomenex | Cat# 00D-4759-Y0 |
| Strata-X 33 µm Polymeric SPE cartridges | Phenomenex | Cat# 8B-S100-TBL |
| Sciex OS Analytics software | Sciex | Sciex OS-FULL v3.3 |
| GraphPad Prism | GraphPad Software | v.3.1 |
| Excel 2024 | Microsoft | v.2507 |
6. Resource Availability
- Lead Contact: Further information and requests should be directed to J. Thomas Brenna [jtbrenna@utexas.edu]
- Materials Availability: This study did not generate new unique reagents.
- Data and Code Availability: All data supporting the findings are available from the Lead Contact upon reasonable request.
7. Method Details
7.1. Cell Culture and Transfection
Murine neuroblastoma Neuro-2a cells transduced with a human MYCN transgene were initially obtained from the American Type Culture Collection (ATCC; CCL-131; details available at ATCC) and cultured in RPMI-1640 medium supplemented with 10% heat-inactivated fetal bovine serum (HI-FBS). Cells were grown at 37 °C in a water-saturated atmosphere of 95% air and 5% CO2. Cells were tested monthly and consistently found to be negative for mycoplasma contamination. Cells were stably transfected with human MYCN using Lipofectamine 3000. Transfected cells were selected from GFP-expressing cells using a fluorescence-activated cell sorter.
7.2. Syngeneic Neuroblastoma Model
All procedures were approved by the University of Texas at Austin IACUC (AUP-2023-00058, approved 17 May 2023). Six-week-old male wild-type strain A/J mice (n = 42) were purchased from The Jackson Laboratory (Jaxmice strain #000646, Sacramento, CA, USA) and allowed to acclimate for one week under standard conditions. Mice were fed customary mouse diets (“chow”) with a composition approximating AIN-93G. A model was established by subcutaneous injection of 3 × 10⁶ MYCN-expressing Neuro-2a cells into the right flank of each mouse. When tumors became palpable (approximately day 6), mice were randomized into three treatment groups: Control group (n=12), ARA group (n=15) receiving daily oral gavage with 75 μL ARA oil (44% ARA, 4.6 g/d human equivalent (hEq) dose), and DHA group (n=15) receiving daily oral gavage with 250 μL DHA oil (82% DHA, 24 g/d hEq). All doses and dietary fatty acids were presented previously (11). Oral gavage was performed daily throughout the study. Tumor dimensions were measured every two days using digital calipers, with volume calculated as: Tumor volume = (length × width²) × 0.5. Body weight and health status were continuously monitored. The study concluded when the control tumors reached approximately 1,000 mm³. Mice were euthanized by CO₂ inhalation followed by cervical dislocation. Tumors were excised, photographed, weighed, and processed for analysis (flash-frozen, fixed in formalin, or processed immediately).
7.3. Lipid Mediator Extraction and LC-MS/MS
Liver, spleen, brain, and skeletal muscle tissues are harvested and immediately immersed in 1 ml of ice-cold methanol containing 10ng/ml of spiked internal standard. Samples are homogenized using a ground glass pestle tissue grinder until fully homogenized or until the solvent appears cloudy. The tube containing the tissue and solvent is vortexed and subsequently incubated on ice for 10 minutes. 9mls of water is added to dilute the methanol concentration to 10%. Strata-X 33 µm Polymeric Reversed Phase cartridges purchased from Phenomenex (California, USA) are used for solid phase extraction (SPE). 1ml of MeOH is used to precondition the SPE cartridge, followed by 1ml of water for equilibration. Pipette sample supernatant into the SPE cartridge, elute to waste in steady drops, refill the cartridge if needed until all sample liquid is eluted. Wash the cartridge with 1ml of 10% MeOH, followed by 1ml of Hexane, elute both to waste. Remove as much water as possible during the wash step by increasing the vacuum pressure on the vacuum manifold and maintaining high vacuum pressure for 5 minutes to completely dry the cartridge after all wash solvent has eluted. 1ml MeOH is used as the final eluting solvent, and sample liquids are collected in 12x75mm disposable culture tubes, which are then transferred to autosampler vials and dried underneath a gentle stream of nitrogen. Dried samples are reconstituted with 60ul of 50/ 50 MeOH/ Water (v/v), before being vortexed and ready for analysis.
Lipid mediator detection was performed using a 20-minute scheduled multiple reaction monitoring (sMRM) method on a Sciex 7500 triple quadrupole QTRAP mass spectrometer operating in negative electrospray ionization mode, integrated with an Exion LC-AD UHPLC system. Chromatographic separation was performed on a Kinetex 2.6 µm Polar C18 100 Å column (100 mm × 3 mm) with column oven temperature at 50°C. Collision energy (CE) and exit potential (CXP) were optimized through direct infusion using available standards. Electrospray ion source gas 1=40psi; Ion source gas 2=70psi; Curtain gas=40psi; CAD gas=12; Source temperature= 350C; Spray voltage=1700V. Electrospray ion source and gas parameters above were optimized through on-column flow injection analysis (FIA). The LC gradient elutes consistently at 0.5ml/min with mobile phase A consisting of 100% Water, and mobile phase B consisting of ACN/ MeOH 60/40 (v/v), each containing 0.5% of HAc as a modifier. The LC gradient is as follows: 0-2mins at 45% B, 2-5mins increase to 48% /B, 5-16.5mins increase to 80%, 16.6min increase to 98%, hold at 98% until 18.6mins then return to 10% B until 20.5min. Fifty-six lipid mediators with quantifying and qualifying ion transitions were included in the final sMRM method, with a target cycle time of 700ms, minimum and maximum dwell times of 3 and 500ms, respectively.
8. Quantification and Statistical Analysis
Tumor mass/ volume data are presented as mean ± SEM. Analyses were performed using GraphPad Prism (version 3.1). Comparisons between groups used one-way ANOVA with Tukey's post hoc test. For tumor growth kinetics, two-way repeated measures ANOVA was used. P-values < 0.05 were considered significant.
For each sample, chromatographic peaks were integrated to obtain the area under the curve (AUC) for each target analyte and for the 5-HETE-d8 internal standard (IS). Peak integration is conducted through the auto-peak algorithm in the Analytics software from Sciex-OS. Each integration is then checked manually. An analyte to IS ratio is calculated by dividing the analyte’s AUC by the IS’s AUC, to compensate for instrument performance differences between injections. The median of the analyte/ IS values within a sample is calculated for all samples. A median normalized ratio is calculated for every analyte by dividing its analyte/IS ratio by the sample’s median value. This normalization sets the median analyte/IS ratio within each sample to be 1, centering the data and allowing comparability across samples. Next, the mean of the median normalized ratios in the control samples is calculated for each analyte to provide a baseline for comparison between treatments. Fold changes relative to the control samples are determined by their median-normalized ratio by the corresponding control-group mean. Thus, a treatment sample with a fold-change of 1.0 indicates an analyte level equivalent to the control average. In contrast, a fold-change of 2.0 or 0.5 would indicate a level double or half that of the control average, respectively. A two-tailed Welch t-test is applied to fold change measurements for each group, comparing each treatment vs. control and the two treatments against each other. P-values < 0.05 were considered significant.
References
- Maris JM. Recent advances in neuroblastoma. N Engl J Med. 2010 Jun 10;362(23):2202-11.
- Crawford JR, MacDonald TJ, Packer RJ. Medulloblastoma in childhood: new biological advances. Lancet Neurol. 2007 Dec;6(12):1073-85.
- Calviello G, Serini S, Piccioni E, Pessina G. Antineoplastic effects of n-3 polyunsaturated fatty acids in combination with drugs and radiotherapy: preventive and therapeutic strategies. Nutr Cancer. 2009;61(3):287-301.
- Dyall SC, Balas L, Bazan NG, Brenna JT, Chiang N, da Costa Souza F et al. Polyunsaturated fatty acids and fatty acid-derived lipid mediators: Recent advances in the understanding of their biosynthesis, structures, and functions. Prog Lipid Res. 2022 Apr;86:101165.
- Bailes JE, Abusuwwa R, Arshad M, Chowdhry SA, Schleicher D, Hempeck N et al. Omega-3 fatty acid supplementation in severe brain trauma: case for a large multicenter trial. J Neurosurg. 2020 Aug 1;133(2):598-602.
- Lewis MD. When Brains Collide: What Every Athlete and Parent Should Know about the Prevention and Treatment of Concussion and Head Injuries: Lioncrest Publishing; 2016.
- Bailes JE, Abusuwwa R, Arshad M, Chowdhry SA, Schleicher D, Hempeck N et al. Omega-3 fatty acid supplementation in severe brain trauma: case for a large multicenter trial. J Neurosurg. 2020 May 15:1-5.
- Cockbain AJ, Toogood GJ, Hull MA. Omega-3 polyunsaturated fatty acids for the treatment and prevention of colorectal cancer. Gut. Jan;61(1):135-49.
- Freitas RDS, Campos MM. Protective Effects of Omega-3 Fatty Acids in Cancer-Related Complications. Nutrients. 2019 Apr 26;11(5).
- D'Eliseo D, Velotti F. Omega-3 Fatty Acids and Cancer Cell Cytotoxicity: Implications for Multi-Targeted Cancer Therapy. J Clin Med. 2016 Jan 26;5(2).
- Patel V, Li YN, Benhamou LRE, Park HG, Raleigh M, Brenna JT et al. High dose ω3 eicosapentaenoic acid and docosahexaenoic acid block, whereas ω6 arachidonic acid accelerates, MYCN-driven tumorigenesis in vivo. Cancers (Basel). 2025;17(3):362.
- Sheeter DA, Garza S, Park HG, Benhamou LE, Badi NR, Espinosa EC et al. Unsaturated Fatty Acid Synthesis Is Associated with Worse Survival and Is Differentially Regulated by MYCN and Tumor Suppressor microRNAs in Neuroblastoma. Cancers (Basel). 2024 Apr 21;16(8).
- Wang D, Dubois RN. Eicosanoids and cancer. Nat Rev Cancer. 2010 Mar;10(3):181-93.
- Larsson SC, Kumlin M, Ingelman-Sundberg M, Wolk A. Dietary long-chain n-3 fatty acids for the prevention of cancer: a review of potential mechanisms. Am J Clin Nutr. 2004 Jun;79(6):935-45.
- Sun G, Li YN, Davies JR, Block RC, Kothapalli KS, Brenna JT et al. Fatty acid desaturase insertion-deletion polymorphism rs66698963 predicts colorectal polyp prevention by the n-3 fatty acid eicosapentaenoic acid: a secondary analysis of the seAFOod polyp prevention trial. Am J Clin Nutr. 2024 Aug;120(2):360-8.
- Spector AA, Hoak JC, Fry GL, Denning GM, Stoll LL, Smith JB. Effect of fatty acid modification on prostacyclin production by cultured human endothelial cells. J Clin Invest. 1980 May;65(5):1003-12.
- Palombo JD, Bistrian BR, Fechner KD, Blackburn GL, Forse RA. Rapid incorporation of fish or olive oil fatty acids into rat hepatic sinusoidal cell phospholipids after continuous enteral feeding during endotoxemia. Am J Clin Nutr. 1993 May;57(5):643-9.
- Chiu CY, Smyl C, Dogan I, Rothe M, Weylandt KH. Quantitative Profiling of Hydroxy Lipid Metabolites in Mouse Organs Reveals Distinct Lipidomic Profiles and Modifications Due to Elevated n-3 Fatty Acid Levels. Biology (Basel). 2017 Feb 4;6(1).
- Morin C, Sirois M, Echave V, Rizcallah E, Rousseau E. Relaxing effects of 17(18)-EpETE on arterial and airway smooth muscles in human lung. Am J Physiol Lung Cell Mol Physiol. 2009 Jan;296(1):L130-9.
- Menendez JA, Lupu R. Fatty acid synthase and the lipogenic phenotype in cancer pathogenesis. Nat Rev Cancer. 2007 Oct;7(10):763-77.
- Johnsen JI, Lindskog M, Ponthan F, Pettersen I, Elfman L, Orrego A et al. Cyclooxygenase-2 is expressed in neuroblastoma, and nonsteroidal anti-inflammatory drugs induce apoptosis and inhibit tumor growth in vivo. Cancer Res. 2004 Oct 15;64(20):7210-5.
- Larsson K, Kock A, Idborg H, Arsenian Henriksson M, Martinsson T, Johnsen JI et al. COX/mPGES-1/PGE2 pathway depicts an inflammatory-dependent high-risk neuroblastoma subset. Proc Natl Acad Sci U S A. 2015 Jun 30;112(26):8070-5.
- Hou R, Yu Y, Jiang J. Prostaglandin E2 in neuroblastoma: Targeting synthesis or signaling? Biomed Pharmacother. 2022 Dec;156:113966.
- Brenna JT, Kothapalli KSD. New understandings of the pathway of long-chain polyunsaturated fatty acid biosynthesis. Current opinion in clinical nutrition and metabolic care. 2022 Mar 1;25(2):60-6.
- Kothapalli KSD, Park HG, Kothapalli NSL, Brenna JT. FADS2 function at the major cancer hotspot 11q13 locus alters fatty acid metabolism in cancer. Prog Lipid Res. 2023 Aug 18;92:101242.
- Rasmuson A, Kock A, Fuskevag OM, Kruspig B, Simon-Santamaria J, Gogvadze V et al. Autocrine prostaglandin E2 signaling promotes tumor cell survival and proliferation in childhood neuroblastoma. PLoS One. 2012;7(1):e29331.
- Rauzi F, Kirkby NS, Edin ML, Whiteford J, Zeldin DC, Mitchell JA et al. Aspirin inhibits the production of proangiogenic 15(S)-HETE by platelet cyclooxygenase-1. FASEB J. 2016 Dec;30(12):4256-66.
- Zhang G, Panigrahy D, Mahakian LM, Yang J, Liu JY, Stephen Lee KS et al. Epoxy metabolites of docosahexaenoic acid (DHA) inhibit angiogenesis, tumor growth, and metastasis. Proc Natl Acad Sci U S A. 2013 Apr 16;110(16):6530-5.
- Gleissman H, Yang R, Martinod K, Lindskog M, Serhan CN, Johnsen JI et al. Docosahexaenoic acid metabolome in neural tumors: identification of cytotoxic intermediates. FASEB J. 2010 Mar;24(3):906-15.
- Carlson LM, Rasmuson A, Idborg H, Segerstrom L, Jakobsson PJ, Sveinbjornsson B et al. Low-dose aspirin delays an inflammatory tumor progression in vivo in a transgenic mouse model of neuroblastoma. Carcinogenesis. 2013 May;34(5):1081-8.
- Panigrahy D, Edin ML, Lee CR, Huang S, Bielenberg DR, Butterfield CE et al. Epoxyeicosanoids stimulate multiorgan metastasis and tumor dormancy escape in mice. J Clin Invest. 2012 Jan;122(1):178-91.
- Wang D, Fu L, Ning W, Guo L, Sun X, Dey SK et al. Peroxisome proliferator-activated receptor delta promotes colonic inflammation and tumor growth. Proc Natl Acad Sci U S A. 2014 May 13;111(19):7084-9.
- Honn KV, Tang DG, Gao X, Butovich IA, Liu B, Timar J et al. 12-lipoxygenases and 12(S)-HETE: role in cancer metastasis. Cancer Metastasis Rev. 1994 Dec;13(3-4):365-96.
- Pogash TJ, El-Bayoumy K, Amin S, Gowda K, de Cicco RL, Barton M et al. Oxidized derivative of docosahexaenoic acid preferentially inhibit cell proliferation in triple negative over luminal breast cancer cells. In Vitro Cell Dev Biol Anim. 2015 Feb;51(2):121-7.
- Serhan CN, Dalli J, Karamnov S, Choi A, Park CK, Xu ZZ et al. Macrophage proresolving mediator maresin 1 stimulates tissue regeneration and controls pain. FASEB J. 2012 Apr;26(4):1755-65.
- Rossner P, Jr., Gammon MD, Terry MB, Agrawal M, Zhang FF, Teitelbaum SL et al. Relationship between urinary 15-F2t-isoprostane and 8-oxodeoxyguanosine levels and breast cancer risk. Cancer Epidemiol Biomarkers Prev. 2006 Apr;15(4):639-44.
- Hao H, Liu M, Wu P, Cai L, Tang K, Yi P et al. Lipoxin A4 and its analog suppress hepatocellular carcinoma via remodeling tumor microenvironment. Cancer Lett. 2011 Oct 1;309(1):85-94.
Figure 1.
Ultra-high-dose DHA inhibits tumor growth in a MYCN-driven neuroblastoma model. a) Table with tumors counts after subcutaneous injection of 3×10⁶ MYCN-transfected Neuro-2a cells followed by treatment administered via oral gavage daily, starting 8 days post-injection. b) Images of all tumors harvested at post-injection day 36. Tumors for no-gavage Controls, ARA and DHA treated animals correspond to counts at sacrifice in (a). c) Tumor growth curves. The DHA curves are means of 6 tumors and 6 zero volumes for the six that regressed away. (mean ± SEM). d) Individual DHA-treated tumor volumes showing appearance and regression of all tumors (green). e) Body weights were not significantly different at any time point. f) Gross morphology of representative subcutaneous tumors at endpoint highlighting differences in vascularization and surrounding tissue architecture.
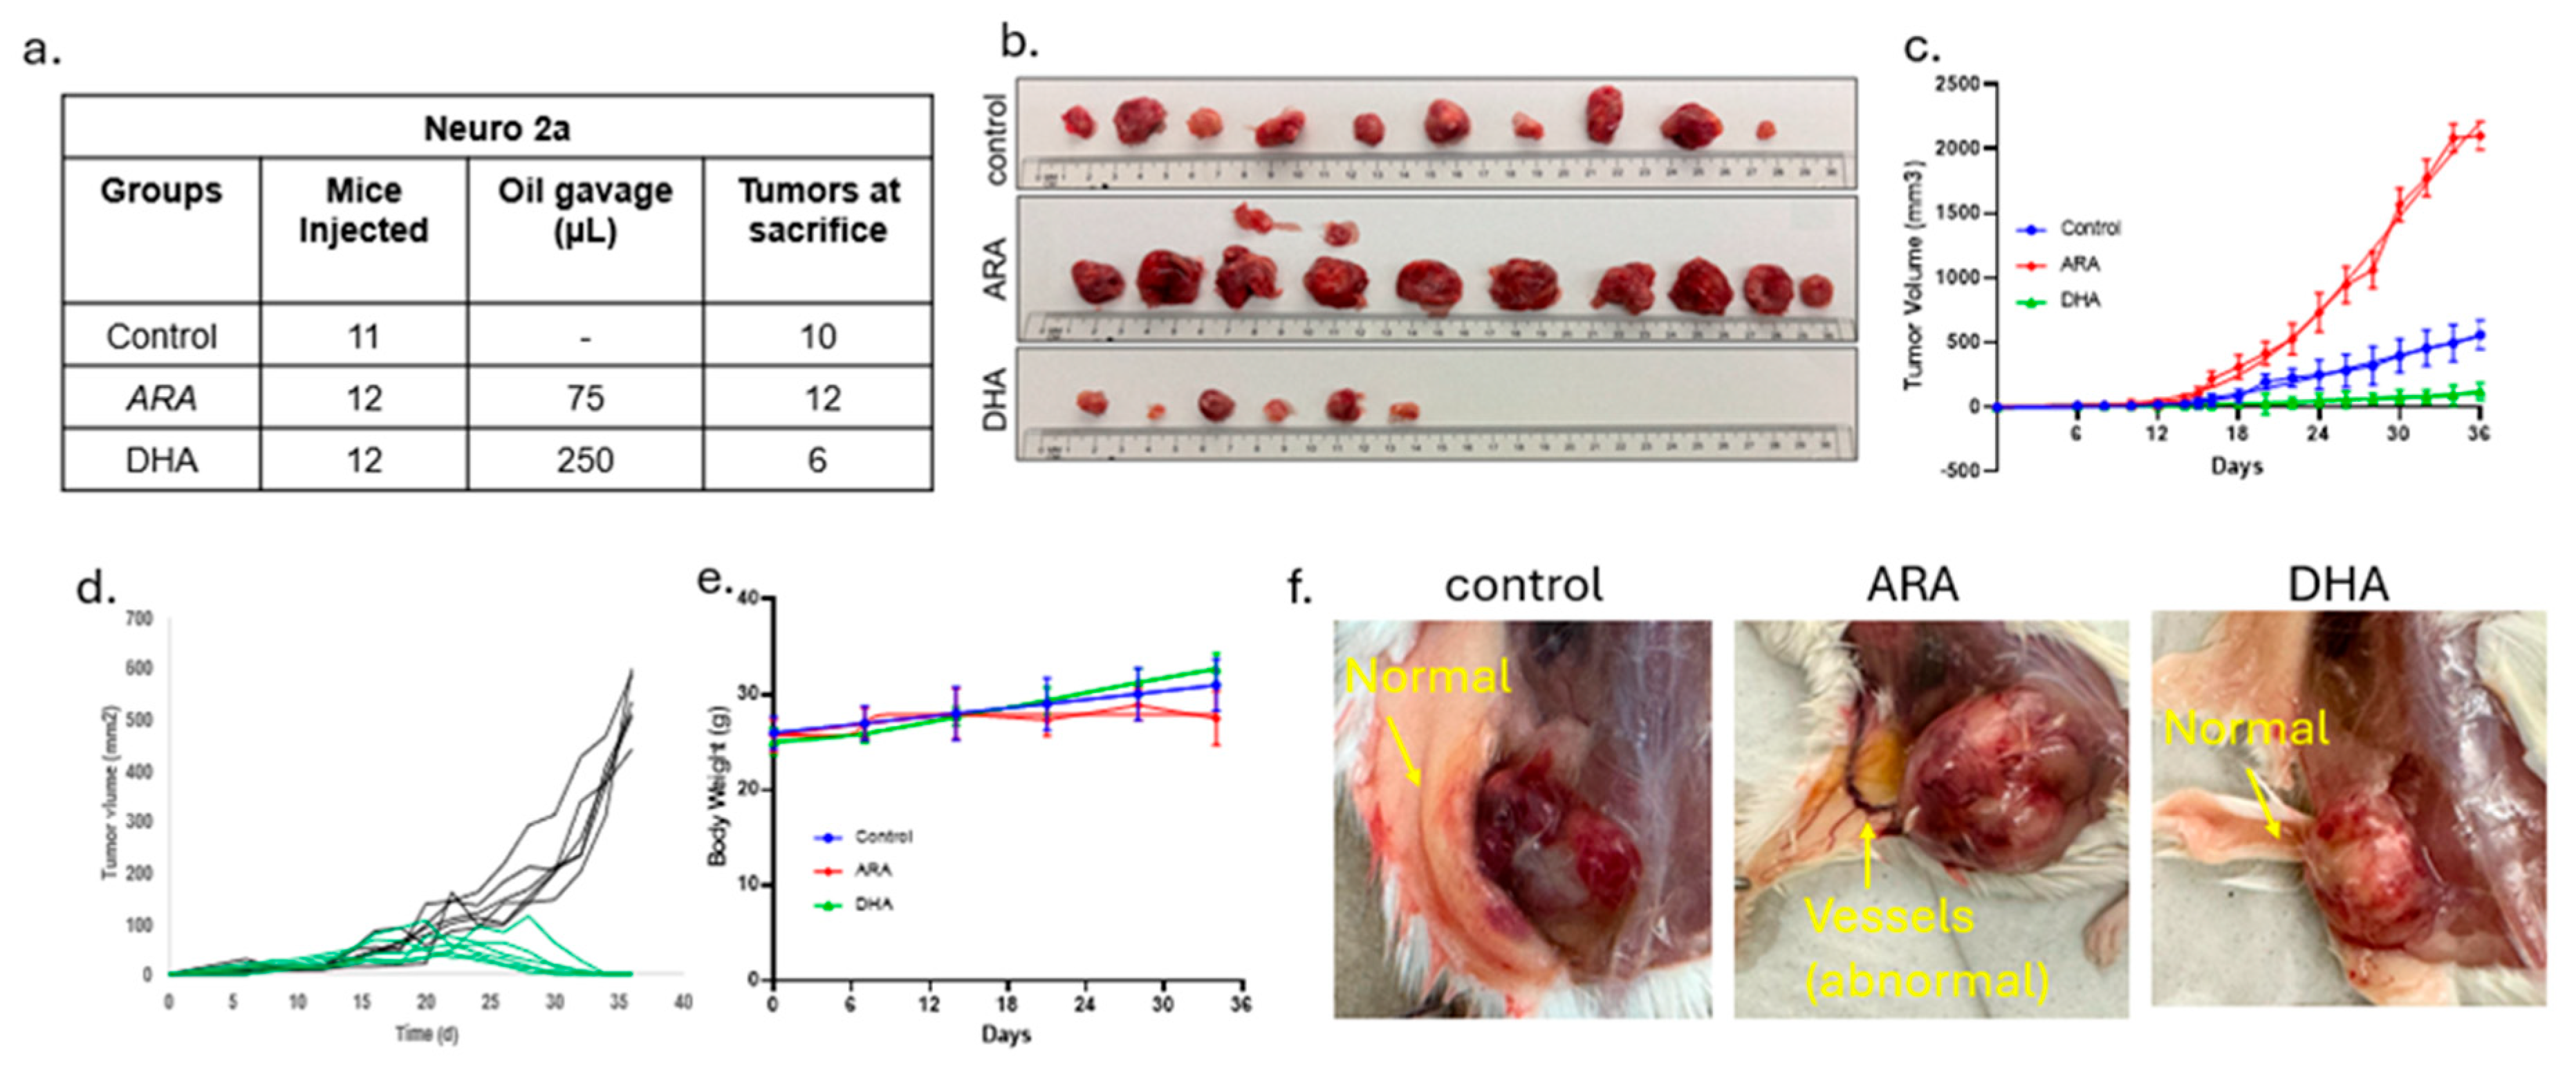
Figure 2.
Tumor sizes and statistics. a) Detailed measurements of size on a tumor by tumor basis. b) Mean and SEM for change in mean tumor mass across the experimental groups, showing the highest tumor volume in the ARA-treated group. The DHA group included only the six tumors present at the end of the experiment. t-test: *p<0.05 and **p<0.01.
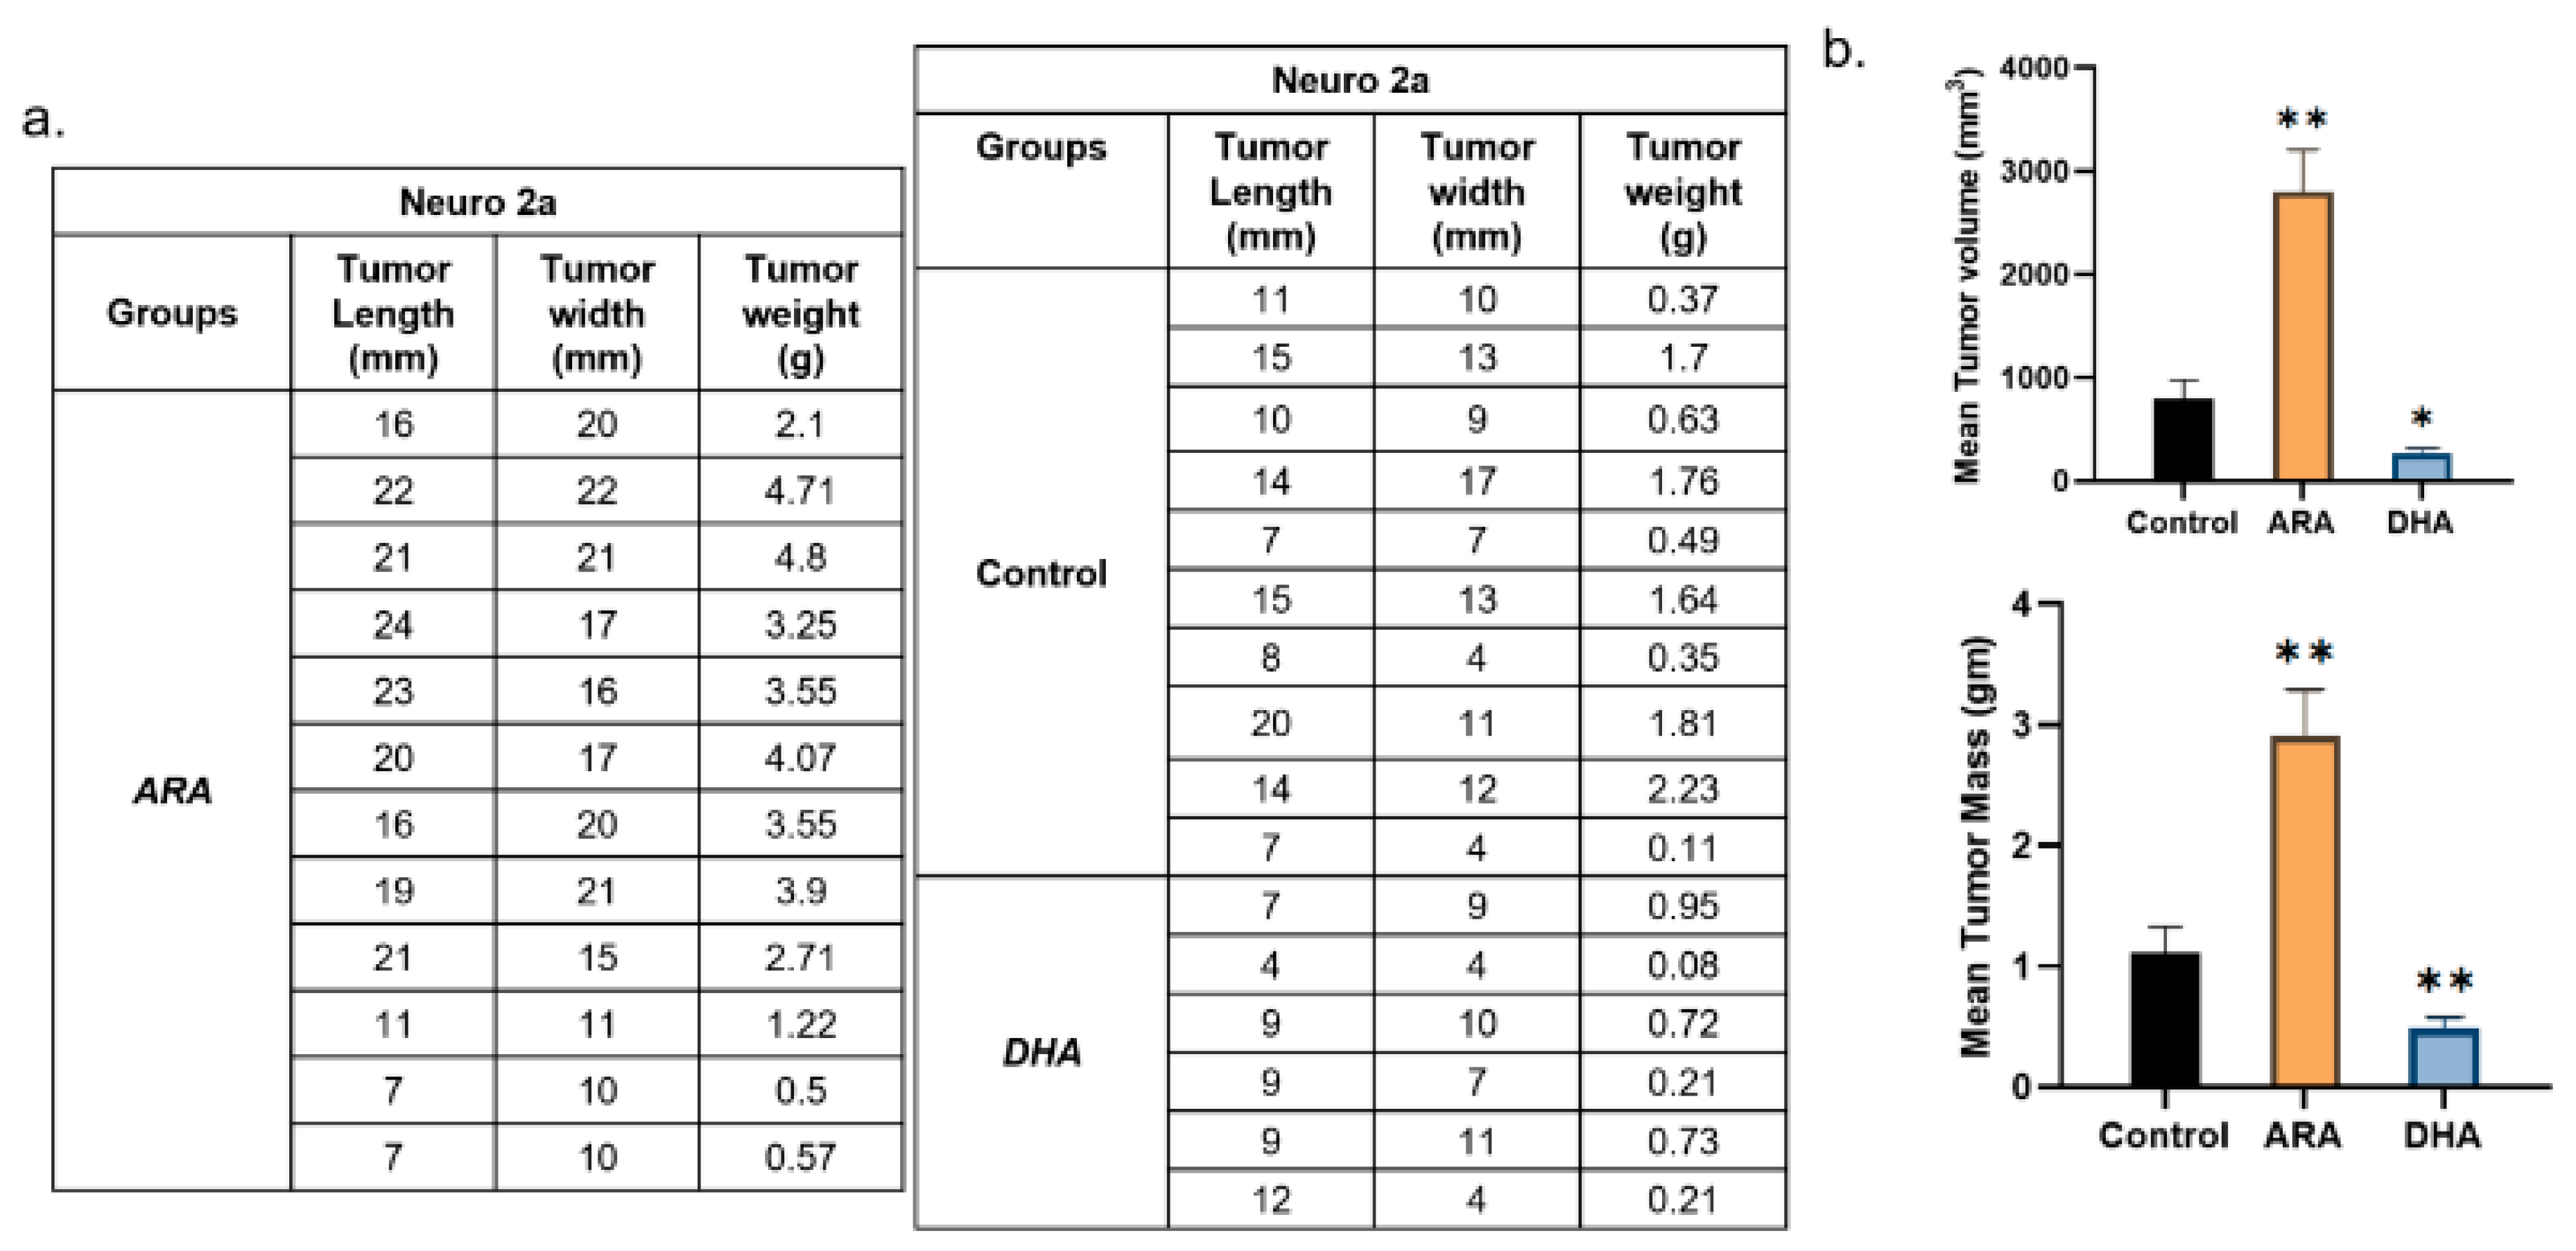
Figure 3.
Experiment 2 results. n=5 mice per group but otherwise identical to experiment 1. a) Control mice, ARA-dosed, and DHA-dosed had 3, 4 and 2 tumors, respectively. b) skin flap above tumors revealing extensive vessel formation in ARA but not in DHA or Control. c) Tabulation of tumor sizes, d) Tumor volume and tumor weights, Mean and SEM, t-test **p<0.01. Results match those of experiment 1.
Disclaimer/Publisher’s Note: The statements, opinions and data contained in all publications are solely those of the individual author(s) and contributor(s) and not of MDPI and/or the editor(s). MDPI and/or the editor(s) disclaim responsibility for any injury to people or property resulting from any ideas, methods, instructions or products referred to in the content. |
© 2025 by the authors. Licensee MDPI, Basel, Switzerland. This article is an open access article distributed under the terms and conditions of the Creative Commons Attribution (CC BY) license (http://creativecommons.org/licenses/by/4.0/).
Copyright: This open access article is published under a Creative Commons CC BY 4.0 license, which permit the free download, distribution, and reuse, provided that the author and preprint are cited in any reuse.


