
Submitted:
08 October 2025
Posted:
09 October 2025
You are already at the latest version
Abstract
Video-centric applications have seen significant growth in recent years with HTTP Adaptive Streaming (HAS) becoming a widely adopted method for video delivery. Recently, low-latency (LL) adaptive bitrate (ABR) algorithms have recently been proposed to reduce the end-to-end delay in HTTP adaptive streaming. This study investigates whether low-latency adaptive bitrate (LL-ABR) algorithms, in their effort to reduce delay, also compromise video quality. To this end, this study presents both objective and subjective evaluation of user experience with traditional DASH and low-latency ABR algorithms. The study employs crowdsourcing to evaluate user-perceived video quality in low-latency MPEG-DASH streaming, with a particular focus on the impact of short segment durations. We also investigate the extent to which quantitative QoE metrics correspond to the subjective evaluation results. Results show that the Dynamic algorithm outperforms the low-latency algorithms, achieving higher stability and perceptual quality. Among low-latency methods, LoL+ demonstrates superior QoE compared to L2A-LL, which tends to sacrifice visual consistency for latency gains. The findings emphasize the importance of integrating subjective evaluation into the design of ABR algorithms and highlight the need for user-centric and perceptually aware optimization strategies in low-latency streaming systems. Our results show that the subjective scores do not always align with objective performance metrics. The viewers are found to be sensitive to complex or high-motion content, where maintaining a consistent user experience becomes challenging despite favorable objective performance metrics.
Keywords:
ABR algorithms
; buffering
; crowd-sourcing
; playback
; QoE
; streaming
; subjective
; quality switching
1. Introduction
Video streaming has grown rapidly in recent years and now makes up more than 80% of global internet traffic. This increasing demand places significant pressure on network resources and energy consumption [1]. The widespread availability of video streaming is largely enabled by the development of the Dynamic Adaptive Streaming over HTTP (DASH) standard [2]. In DASH, the video content is divided into multiple segments. The streaming server generates a manifest file that describes the encoding parameters and URLs of these segments. The client first requests the manifest file, which it then uses to dynamically select and download video segments [3]. ABR algorithms running on the client side determine the quality level of the next segment to be downloaded. The ABR algorithms make these decisions based on playback rate, buffer, and throughput measures [4]. The objective of the ABR algorithms is to optimize the user experience.
In video streaming, quality is often objectively assessed using video quality metrics such as bitrate, start delay, rebuffering frequency, and video resolution. [5]. These technical metrics alone are insufficient to capture the user experience. It is essential to obtain feedback from real users to evaluate overall user satisfaction. As the Human Visual System (HVS) receives and views the streaming videos, subjective opinion and feedback are crucial and a reliable approach to evaluate the QoE of videos in the streaming domain [6]. Multiple approaches have been proposed for the development of models to evaluate QoE in adaptive video streaming systems. These models have limitations such as a limited dataset and network distortion patterns [7,8]. The ABR algorithms should also be evaluated by real subjects. Moreover, these data sets should be made publicly available, in order to support other researchers in this domain to test and build robust models [9,10].
In recent years, the demand for low-latency video streaming has grown significantly due to the high demand of live-streaming, live-gaming, video conferencing, and virtual reality applications. MPEG-DASH (Dynamic Adaptive Streaming over HTTP) is a popular protocol to support adaptive streaming under varying network conditions. The latency in DASH can be reduced by decreasing the duration of the segment. It enables clients to request and decode segments more frequently and, in turn, reduces end-to-end delay. However, this approach presents new challenges, especially in terms of playback stability and bitrate fluctuation, which could lead to degradation of the user experience. While objective metrics provide valuable technical insights into performance, they may fail to capture user perception, particularly in low-latency scenarios where responsiveness is critical. This study focuses on evaluating user-perceived video quality in low-latency MPEG-DASH environments by examining the effects of short segment durations across traditional DASH and LL-ABR algorithms. The results from these experiments are used to create a video content based on source videos encoded under various network conditions. We perform both objective and subjective analyses on the data. For subjective analysis, the data is evaluated using a Prolific crowd-sourced platform. The test participants were asked to provide their opinion based on the video viewing experience. The Mean Opinion Scores (MOS) are collected in order to provide a view of user perception while watching the video sequences. This study presents a comprehensive subjective evaluation of both traditional and low-latency ABR algorithms in MPEG-DASH streaming environments.
The main contributions of this work are as follows:
- We evaluated, compared, and analyzed the performance of low-latency and traditional ABR algorithms to determine whether low-latency algorithms can simultaneously optimize QoE metrics while prioritizing latency reduction.
- A comparative analysis is performed between conventional DASH algorithms (Dynamic, Throughput) and low-latency approaches (L2A-LL, LoL+) to determine their relative strengths in maintaining QoE under fluctuating bandwidth.
- The data for objective and subjective evaluation is prepared by streaming diverse video content encoded under controlled network conditions and varying segment durations, enabling both objective and subjective assessment.
- A crowd-sourced subjective evaluation is conducted to analyze the perceptual impact of ABR algorithms and network dynamics on user QoE.
- The study offers insights into how objective metrics relate to user perception, showing where measured performance differs from what viewers actually experience.
2. Literature Review
Here, we present a detailed background on subjective research in video streaming. We also discuss the existing datasets and methods used to evaluate video quality.
The study in [11] shows that the bit rate of the video and the interruption of playback affect the user experience the most. Also, frequent bitrate fluctuations negatively impact the QoE. However, there is a tradeoff between selecting a high video rate and the risk of playback interruption [12]. Evaluation [13] is performed on the basis of ABR algorithms and user opinion is collected. The results indicate that objective quality metrics alone are insufficient and understanding human perception and behavior is equally important. In research [14], subjective evaluation is carried out. The initial loading delay and its impact on user perception are measured. Based on these findings, a probability model is proposed to evaluate user unacceptability using logistic regression analysis. The authors in [15] conducted a subjective evaluation for live streaming over mobile networks with MPEG-DASH. The Absolute Category Rating (ACR) was used to assess the impact of audio and video quality on the QoE. The findings reveal that providing low audio quality has a minimal impact on the QoE, compared to low video quality. In [16], the authors proposed a model to assess the cumulative quality in HTTP Adaptive Streaming. The model is based on a sliding window of a video segment as the foundation. Through subjective testing and statistical analysis, the model identifies recency, average, minimum, and maximum window qualities as key factors, outperforming existing models while remaining efficient for real-time deployment.
[17] assesses the impact of stall events and quality switching on QoE. The results demonstrate, that shorter duration stalls are not noticeable. The findings also mention that users prefer the quality of the video over the stall event. A study on latency [18] investigates techniques to enhance user experience in adaptive video streaming with a focus on reducing latency. It evaluates the trade-offs between latency, video quality, and stability, proposing methods that achieve lower delays while maintaining smooth playback and consistent quality.
In [19], a model is developed to measure video latency and its impact on QoE. The HAS and low-latency ABR algorithms were evaluated. The results demonstrate that the Dynamic algorithm outperforms low-latency algorithms.
Various data sets have been developed especially to evaluate video quality in the streaming domain. The data set in [20] presents 208 distorted video sequences generated using mobile phones. In this research, subjective evaluation of video sequences is performed and several Video Quality Assessment (VQA) algorithms are evaluated. Another data set presented in [7] includes 20 High Definition (HD) uncompressed source video sequences. The source videos are distorted in a streaming session, and a total of 450 distorted versions are acquired. The streaming sessions were created with various ABR algorithms. This work is evaluated both using objective and subjective assessment methods. The multicodec data set is produced in [21]. The AVC, HEVC, VP9, and AV1 codecs were taken into account. The dataset was evaluated using a range of network profiles. The evaluation is performed to assess the encoding efficiency in the DASH streaming environment. The video dataset [22] was also collected from mobile environments. The 174 video sequences were created in this database. In this dataset, stall events were generated and a subjective evaluation was performed to measure the impact of stalls on video QoE. The results reveal that stalls degrade the video quality and overall user experience.
An Ultra High Definition (UHD) video dataset was created in [23]. The data set contains video encoded using H.264, HEVC, and VP9 codecs. This data set is evaluated using objective and subjective assessment methods. The results show a trade-off between bitrates, resolution, frame rate, and video content. A database [24] presented 4K resolution video content. The content was encoded using the AVC, HEVC, VP9, AVS2, and AV1 codecs. The subjective assessment performed on videos to assess the video quality. The data set is also evaluated using objective models.
The video data set in [25] consists of HD content. This data set was created using 12 source videos and 96 Processed Video Sequences (PVS). This data set is evaluated using subjective evaluation to measure video quality. The 4K resolution database [26] is created by the Open Ultra Video Group. These video sequences are presented in the original RAW format (YUV). Encoding is performed by deploying HEVC and VVC codecs. The video sequences were assessed using objective and subjective evaluation methods. The MPEG-DASH dataset [27] is made up of 8K video contents. The AVC, HEVC, AV1, and VVC codecs are deployed for the encoding process. The sequence is 322 seconds long and the segment is 4 seconds and 8 seconds in duration.
There are several gaps in the current literature concerning subjective evaluation in adaptive streaming. Existing studies have evaluated ABR algorithms; however, they have overlooked a comparative analysis between low-latency and conventional ABR approaches to determine whether low-latency algorithms can simultaneously optimize QoE metrics while minimizing latency. Furthermore, most subjective evaluation studies are not based on the actual outputs of ABR algorithms; instead, they rely on pre-distorted video sources that do not accurately reflect ABR-driven adaptations. This work addresses these limitations through comprehensive objective and subjective evaluations of DASH and low-latency ABR algorithms, employing video data produced by the algorithms themselves instead of using artificially distorted sources.
3. Methodology
This section describes the experimental methodology adopted to evaluate the QoE in segment-based adaptive streaming. This study combines objective metrics of network and video quality with subjective assessments to evaluate user perception across varying conditions. A controlled testbed was implemented using a DASH.js client and Apache HTTP server. The video is fragment in small segments of 2-seconds and multiple ABR algorithms were tested, and both playback logs and user ratings were collected for detailed analysis.
3.1. Test Scenarios
In this experiment, 24 videos were prepared having various quality levels. These videos were created based on the experiments our test-bed shown in Fig. 2. The video is encoded and streamed using both tradiotnal DASH and low-latency ABR algorithms. These algorithms are dynamic, Throughout, L2ALL, and LOL +. The duration of the video sequence was 1 minute (60 seconds).
3.1.1. Evaluation Test Bed
To conduct objective evalaution, a dash.js based test bed is deployed. The test bed architecture is shown in Figure 1. A streaming server is deployed using apache web-server. The DASH client and server were connected through wi-fi network. To simluate diverse network conditions, Linux Traffic Control (tc) utility is deployed. The Linux Traffic Control is a standard tool for shaping, scheduling, and controlling network traffic in experimental environments. The tc framework provides fine-grained control over parameters such as bandwidth, round-trip delay, jitter, and packet loss, which are critical for evaluating Adaptive Bitrate (ABR) algorithms under realistic conditions. The encoded videos are stored on the Apache server. The client streams the video sequences using ABR algorithms, which are deployed on the client side. The detailed architecture is shown in Figure 1.
3.2. Methods
The following sections will describe the experimental pro- cedures, including content selection, encoding proce- dure, viewing conditions and demographics.
3.2.1. Source Content Selection
The source content is selected from [32]. The following video sequences were used in our evaluation: Big Buck Bunny, Elephant, Tears of Steel, and Spark. The content is diverse in nature and consists of content from movies and animation. Each clip was 1 minute long (60 seconds). The sequence frame per rate (FPS) was 24 FPS. To provide a comprehensive assessment of ABR algorithms, four source videos were chosen. These videos were selected to represent a range of spatial and temporal features: An animation segment (with synthetic graphics, sharp edges, and uniform areas), a movie trailer (cinematic content with varied motion). The SI and TI characteristics is shown in Figure 2.This configuration enabled the evaluation of ABR performance under both bandwidth-intensive and bandwidth-constrained conditions. All videos were encoded using a segment-based DASH profile with multiple bitrate options at 1080p resolution to ensure fair comparison across algorithms. This selection aligns with standard practices in adaptive streaming research, where diverse content is crucial to capture different Quality of Experience (QoE) aspects affected by motion complexity and visual traits.
3.2.2. Encoded Content
The test sequences are prepared using FFMPEG [33] and then converted into DASH segments. The quality levels are presented in Table 1. The encoding schemes are based on VBR encoding with minBitrate and maxBitrate and vbvBuffer parameters all set to the relevant bitrates. This ladder covers a range of network conditions while maintaining perceptual quality across resolutions, in line with recommended streaming profiles. The 2-seconds segment is chosen in order to support low-latency playback, with each segment packaged into fragmented MP4 (fMP4) chunks. The GOP size was aligned with the segment length to ensure consistent random access points and minimize decoding overhead. All encoded contents were packaged into MPEG-DASH format using GPAC/MP4Box, with manifest files (MPDs) generated for use in the Dash.js player. These encoding parameters were chosen to balance latency, compression efficiency, and playback stability, thereby providing a fair basis for comparing ABR algorithm performance under controlled conditions.
3.2.3. Bandwidth Profiles for Evaluation
For the evaluation, controlled network profiles with stepwise bandwidth variations are created as shown in Figure 3. This gradual changes in the throughput, allowed us to emulate realistic network dynamics, where capacity improves over time, and to observe how different algorithms adjust their bitrate selection and buffer management in response.

Table 1.
Video sequences encoding and bitrate ladder.
| Index | Animated content | Movie content |
|---|---|---|
| 1 | 50 kbit/s, 320x240 | 50 kbit/s, 320x240 |
| 2 | 200 kbit/s, 480x360 | 200 kbit/s, 480x360 |
| 3 | 600 kbit/s, 854x480 | 600 kbit/s, 854x480 |
| 4 | 1.2 Mbit/s,1280x720 | 1.2 Mbit/s,1280x720 |
| 5 | 2.5 Mbit/s,1920x1080 | 2.0 Mbit/s,1920x1080 |
| 6 | 3.0 Mbit/s,1920x1080 | 2.5 Mbit/s,1920x1080 |
| 7 | 4.0 Mbit/s,1920x1080 | 3.0 Mbit/s,1920x1080 |
| 8 | 8.0 Mbit/s,1920x1080 | 6.0 Mbit/s,1920x1080 |
3.2.4. Experimental Procedure
The subjective evaluation is performed using the Absolute Category Rating (ACR) method [28]. This method is aligned with the recommendations provided by ITU-T release P.910 [29]. The ACR, is a single stimulus method in which the one video sequence is presented to participants. The test participants are asked to watch the video sequence and then rate the overall quality. The Likert scale is provided to test participants as 1-bad, 2-poor, 3-fair, 4-good, and 5-excellent. For each video sequence, an MOS (Mean Opinion Score) is calculated. The MOS is the arithmetic mean of all scores and has a (95%) confidence interval [30,31].
3.2.5. Adaptive Bitrate (ABR) Algorithms
Adaptive Bitrate (ABR) algorithms play a key role in HTTP Adaptive Streaming (HAS) by allowing video players to automatically modify the video quality based on changing network conditions. In this work, the ABR algorithms are considered on the basis of their working principles. These algorithms include both rate-based and low-latency types. The dynamic, BOLA, throughput, L2ALL, and LOL+ algorithms have been implemented within a dynamic adaptive streaming framework known as dash.js. This framework utilizes the open-source implementation of the MPEG-DASH standard.
- Throughput: The throughput-based algorithm selects the video quality level by estimating the available network bandwidth from the download times of recent segments. The player request highre quality level that is expected to be sustainable under the measured throughput. This algorithm calculates the average throughput of the previous video segment that was downloaded [36].
- BOLA (Buffer Occupancy-based Lyapunov Algorithm): The BOLA is buffer based ABR algorithm. This algorithm leverages Lyapunov optimization to balance video quality against the risk of rebuffering. The BOLA makes adaptation decisions based on buffer occupancy, aiming to maximize utility while maintaining playback stability. The BOLA algorithm is well-suited for situations where bandwidth varies. [37].
- Dynamic: A dynamic ABR algorithm working on principle adapting video quality decisions by combining estimated throughput and buffer occupancy. The throughput-based algorithms are based on hybrid strategy. These hybrid or adaptive strategies are more robust than static approaches. These algorithms continuously adjust their decision logic based on the streaming context [38].
- Learn2Adapt Low Latency (L2A-LL): The Learn2Adapt Low Latency (L2A-LL) algorithm is a reinforcement learning–based ABR approach. The L2A-LL is designed for low-latency streaming scenarios. This algorithm uses the online convex optimization principle. The reinforcement learning agent is trained to balance competing objectives, including maintaining low playback latency, reducing rebuffering, and minimizing quality fluctuations. By leveraging data-driven decision-making, L2A-LL adapts more effectively to highly variable network conditions compared to traditional rule-based strategies, making it a strong candidate for next-generation low-latency adaptive streaming systems [18,39].
- Low on Latency (LOL+): The Low on Latency (LOL+) algorithm original LOL extends approach by explicitly incorporating playback latency into the adaptation logic, alongside traditional parameters such as buffer occupancy and throughput. The LOL+ is a heuristic algorithm that uses learning principles to optimize the parameters for the best QoE. This algorithm is implemented on a SOM (self-organizing map) model. The SOM model which accounts for different QoE metrics and changes in the network. There are crucial modules in LOL+. The LOL+ playback speed control module is based on a hybrid algorithm that estimates latency and the buffer level and administers the playback speed. The second module which is LOL+ and the QoE evaluation module and that is accountable for QoE computation based on metrics such as segment bitrate, switching, rebuffer events, latency, and playback speed [39,40].
4. Evaluation Results
In this section, we present both the objective and subjective evaluations of our results. The experiments were conducted according to the methodology described in Section 3. To create the content for subjective evaluation, we will adaptively stream all videos using both traditional DASH and low-latency algorithms.
4.1. Objective Evaluation Outcome
In this section, the objective evaluation is presented. Fig. 3 shows the network profile used for the experiments. The streaming session began at a bandwidth of 1 Mbps, which was subsequently increased to 2 Mbps and then to 4 Mbps. The video sequences consist of 2-second segments. Figure 4 depicts the variations in bitrates for algorithms for the video Big Buck Bunny. Among all algorithms, LoL+ and the dynamic increases the bitrate when the bandwidth increases from 1 Mbps to 4 Mbps. However, the L2A-LL and Throughput algorithms delay increasing the bitrate to minimize the risk of interruption. The Figure 5, Figure 6 and Figure 7, demonstrate that the dynamic algorithm performs consistently across all videos. In Figure 8, among all algorithm. The dynamic algorithm achieves the maximum video rates in all streaming sessions regardless of video sequences. The LOL+ reacts abruptly to the network variations while streaming Big Buck Bunny and Elephant. During the streaming of Tears of Steel and Spark, it increased bitrate initially but quickly reduced to prevent playback interruptions. The Throughput algorithm carefully increases the bitrate for Big Buck Bunny and Elephant but more aggressively improves the video quality when streaming Tears of Steel and Spark. A comparison is shown in Figure 8, that traditional DASH algorithms yields higher bitrates streaming Tears of Steel and Spark compared to BBB and Elephant. However, low-latency algorithms LOL+ and L2A-LL algorithms achieved the similar average bitrates in all streaming sessions. The Figure 9, depict the number of bitrate switches; the LoL+ algorithm experiences the lowest number of video rate switches followed by traditional DASH algorithms. On the other hand L2A-LL algorithm had the highest number of bitrate switches. As illustrated in Figure 4, Figure 5, Figure 6 and Figure 7, most of these changes were minor and probably would not be noticed by the user. The significant bitrate changes occurred when the available bandwidth prompted the algorithms to raise the bitrate. Overall, both Dynamic and LOL+ maintained high video quality across all streaming sessions while ensuring minimal and stable bitrate fluctuations.
4.2. Subjective Evaluation Outcome
This section focuses on the subjective evaluation of the ABR algorithms. The test content was generated based on the quality levels determined by the ABR algorithms discussed in the preceding section.
4.2.1. Video Sequences
In this experiment, 24 video sequences were generated, each reflecting the quality levels selected by the ABR algorithms. The test sequences were presented in six (6) different groups. The reason is to randomize the order of presentation to avoid displaying the same source sequence again. The following table shows the source sequences assigned to each group. In these sequences, 16 sequences are of varying quality. The four (4) sequences have low quality, and four (4) sequences have source quality. In order to minimize the risk of bias, the order of the Processed Video Sequences (PVS) was randomized for each participant. The sequences were ordered such that no two consecutive PVS originated from the same source content. This will minimize the impact of content familiarity on subjective ratings.
Table 2.
Division of Video Files into Groups.
| Group | File 1 | File 2 | File 3 | File 4 |
|---|---|---|---|---|
| 1 | L04-SRC4.mp4 | 0G-SRC1.mp4 | 06-SRC2.mp4 | 0G-SRC3.mp4 |
| 2 | 08-SRC4.mp4 | 13-SRC1.mp4 | L02-SRC2.mp4 | 07-SRC3.mp4 |
| 3 | 0G-SRC4.mp4 | 05-SRC1.mp4 | 0G-SRC2.mp4 | L03-SRC3.mp4 |
| 4 | 04-SRC4.mp4 | 09-SRC1.mp4 | 03-SRC3.mp4 | 16-SRC4.mp4 |
| 5 | L01-SRC1.mp4 | 10-SRC2.mp4 | 15-SRC3.mp4 | 14-SRC4.mp4 |
| 6 | 01-SRC1.mp4 | 02-SRC2.mp4 | 11-SRC3.mp4 | 12-SRC4.mp4 |
4.2.2. Duration of Stimuli
The quantity and variety of test scenes are essential for accurately interpreting the results of subjective evaluations. According to the ITU-T recommendations (ITU-T P.910) four to six scenes are sufficient, provided there is diversity in the content. The audiovisual material should be engaging both in terms of audio and video individually, as well as combined. In this work we prepared 20 test sequences to have better understand of the video quality in streaming domain.
4.2.3. Study Description
Consent was obtained from all test participants. Once participants agreed to the study procedure, they were automatically redirected to the test screen. An automatic check was applied on the bandwidth and screen resolution at the test participant end. Participants were required to have a minimum internet speed of 40 Mbps to take part in the study. The Full HD (1920x1080) resolution was required for the study. The Windows display scale was required to be set at 100%. The test consisted of automatically and sequentially presenting a series of videos (without audio), each lasting up to one minute, with a total viewing duration of approximately 22 to 25 minutes. Participants were instructed to complete the assessment within 30 minutes to avoid the risk of rejection. After viewing each video, participants were asked to evaluate its visual quality by selecting one of five quality levels: Excellent, Good, Fair, Poor, or Bad.
4.2.4. Selection of Test Participants
The prolific crowd-source-based platform was used to recruit test participants [34]. A total of 70 test participants participated in the study. The demographic data is shown below in the Figure 10. Participants were selected to represent typical end-users of adaptive video streaming services. The person correlation is used to include the significant results. The Pearson correlation coefficient is 0.75. The significant test participants selected are 25 in total. We used methods in ITU-R recommendation BT.500-13 [35] to include and exclude test scores. Prior to the experiment, participants were informed of the study procedure and provided written consent in accordance with ethical guidelines. No specialized knowledge of video coding or streaming was required, ensuring that the ratings reflected the perception of general viewers rather than domain experts.
4.2.5. Mean Opinion Score
Figure 11 shows the MOS scores for the algorithms evaluated across four video sequences (Big Buck Bunny (BBB), Elephant, Sparks, and Tears of Steel (TOS). Figure depicts that the Dynamic and Throughput algorithms demonstrate comparable performance, maintaining moderate perceptual quality across all videos, with slightly improved ratings for TOS. L2A-LL exhibits the lowest MOS values, particularly for Sparks, indicating instability in quality adaptation and reduced robustness under fluctuating conditions. In contrast, LOL+ consistently achieves the highest MOS scores, especially for BBB and Elephant, suggesting its effectiveness in sustaining high visual quality while minimizing playback degradation.
The results suggest that algorithms emphasizing latency reduction, such as L2A-LL, may compromise perceptual quality when network variability is high. Conversely, LOL+ demonstrates a favorable balance between responsiveness and visual stability, leading to superior user-perceived quality. These findings underscore the importance of designing adaptive algorithms that optimize both QoE and stability rather than focusing solely on latency minimization.
The results are consistent with the findings from our objective evaluation. As illustrated in Fig. 9, the frequent bitrate switches observed in the L2A-LL algorithm correspond to lower MOS values. This indicates that abrupt quality variations negatively affect user perception. Similarly, the lower average video quality produced by the Throughput algorithm results in reduced MOS scores for the Big Buck Bunny and Elephant sequences. Interestingly, despite exhibiting favorable objective metrics, such as high average quality and minimal switching, the LOL+ algorithm attains a relatively low MOS for Tears of Steel. This suggests that content characteristics or temporal quality perception factors may influence subjective ratings beyond purely objective parameters.
Figure 12, presents the MOS distributions for four ABR algorithms—Dynamic, Throughput, L2A-LL, and LOL+. The box plots provide insights into both the central tendency and the variability of user ratings. The Dynamic and Throughput algorithms exhibit relatively narrow interquartile ranges with consistent median MOS values around 3. This indicates a stable performance and limited perceptual fluctuation across different video contents. In contrast, the L2A-LL algorithm demonstrates a larger spread of scores, particularly for Sparks and TOS. This suggests a higher inconsistency in perceived quality. This variability can be attributed to its latency-oriented adaptation strategy, which may result in more frequent bitrate changes and visual fluctuations.
The LOL+ algorithm achieves higher median MOS scores for BBB and Elephant, indicating strong perceptual quality under favorable conditions. However, its increased score dispersion and presence of outliers for Sparks and TOS suggest sensitivity to complex or high-motion content, where the algorithm may struggle to maintain consistent user experience despite favorable objective metrics. Overall, the results indicate that Dynamic and Throughput provide more stable subjective quality, while L2A-LL and LOL+ exhibit greater variability. It highlights the trade-off between achieving low latency and maintaining consistent perceptual quality across diverse video content.
Figure 12.
Comparison of video score distributions across four ABR algorithms: (a) Dynamic, (b) Throughput, (c) L2A-LL, and (d) LOL+.
Figure 12.
Comparison of video score distributions across four ABR algorithms: (a) Dynamic, (b) Throughput, (c) L2A-LL, and (d) LOL+.
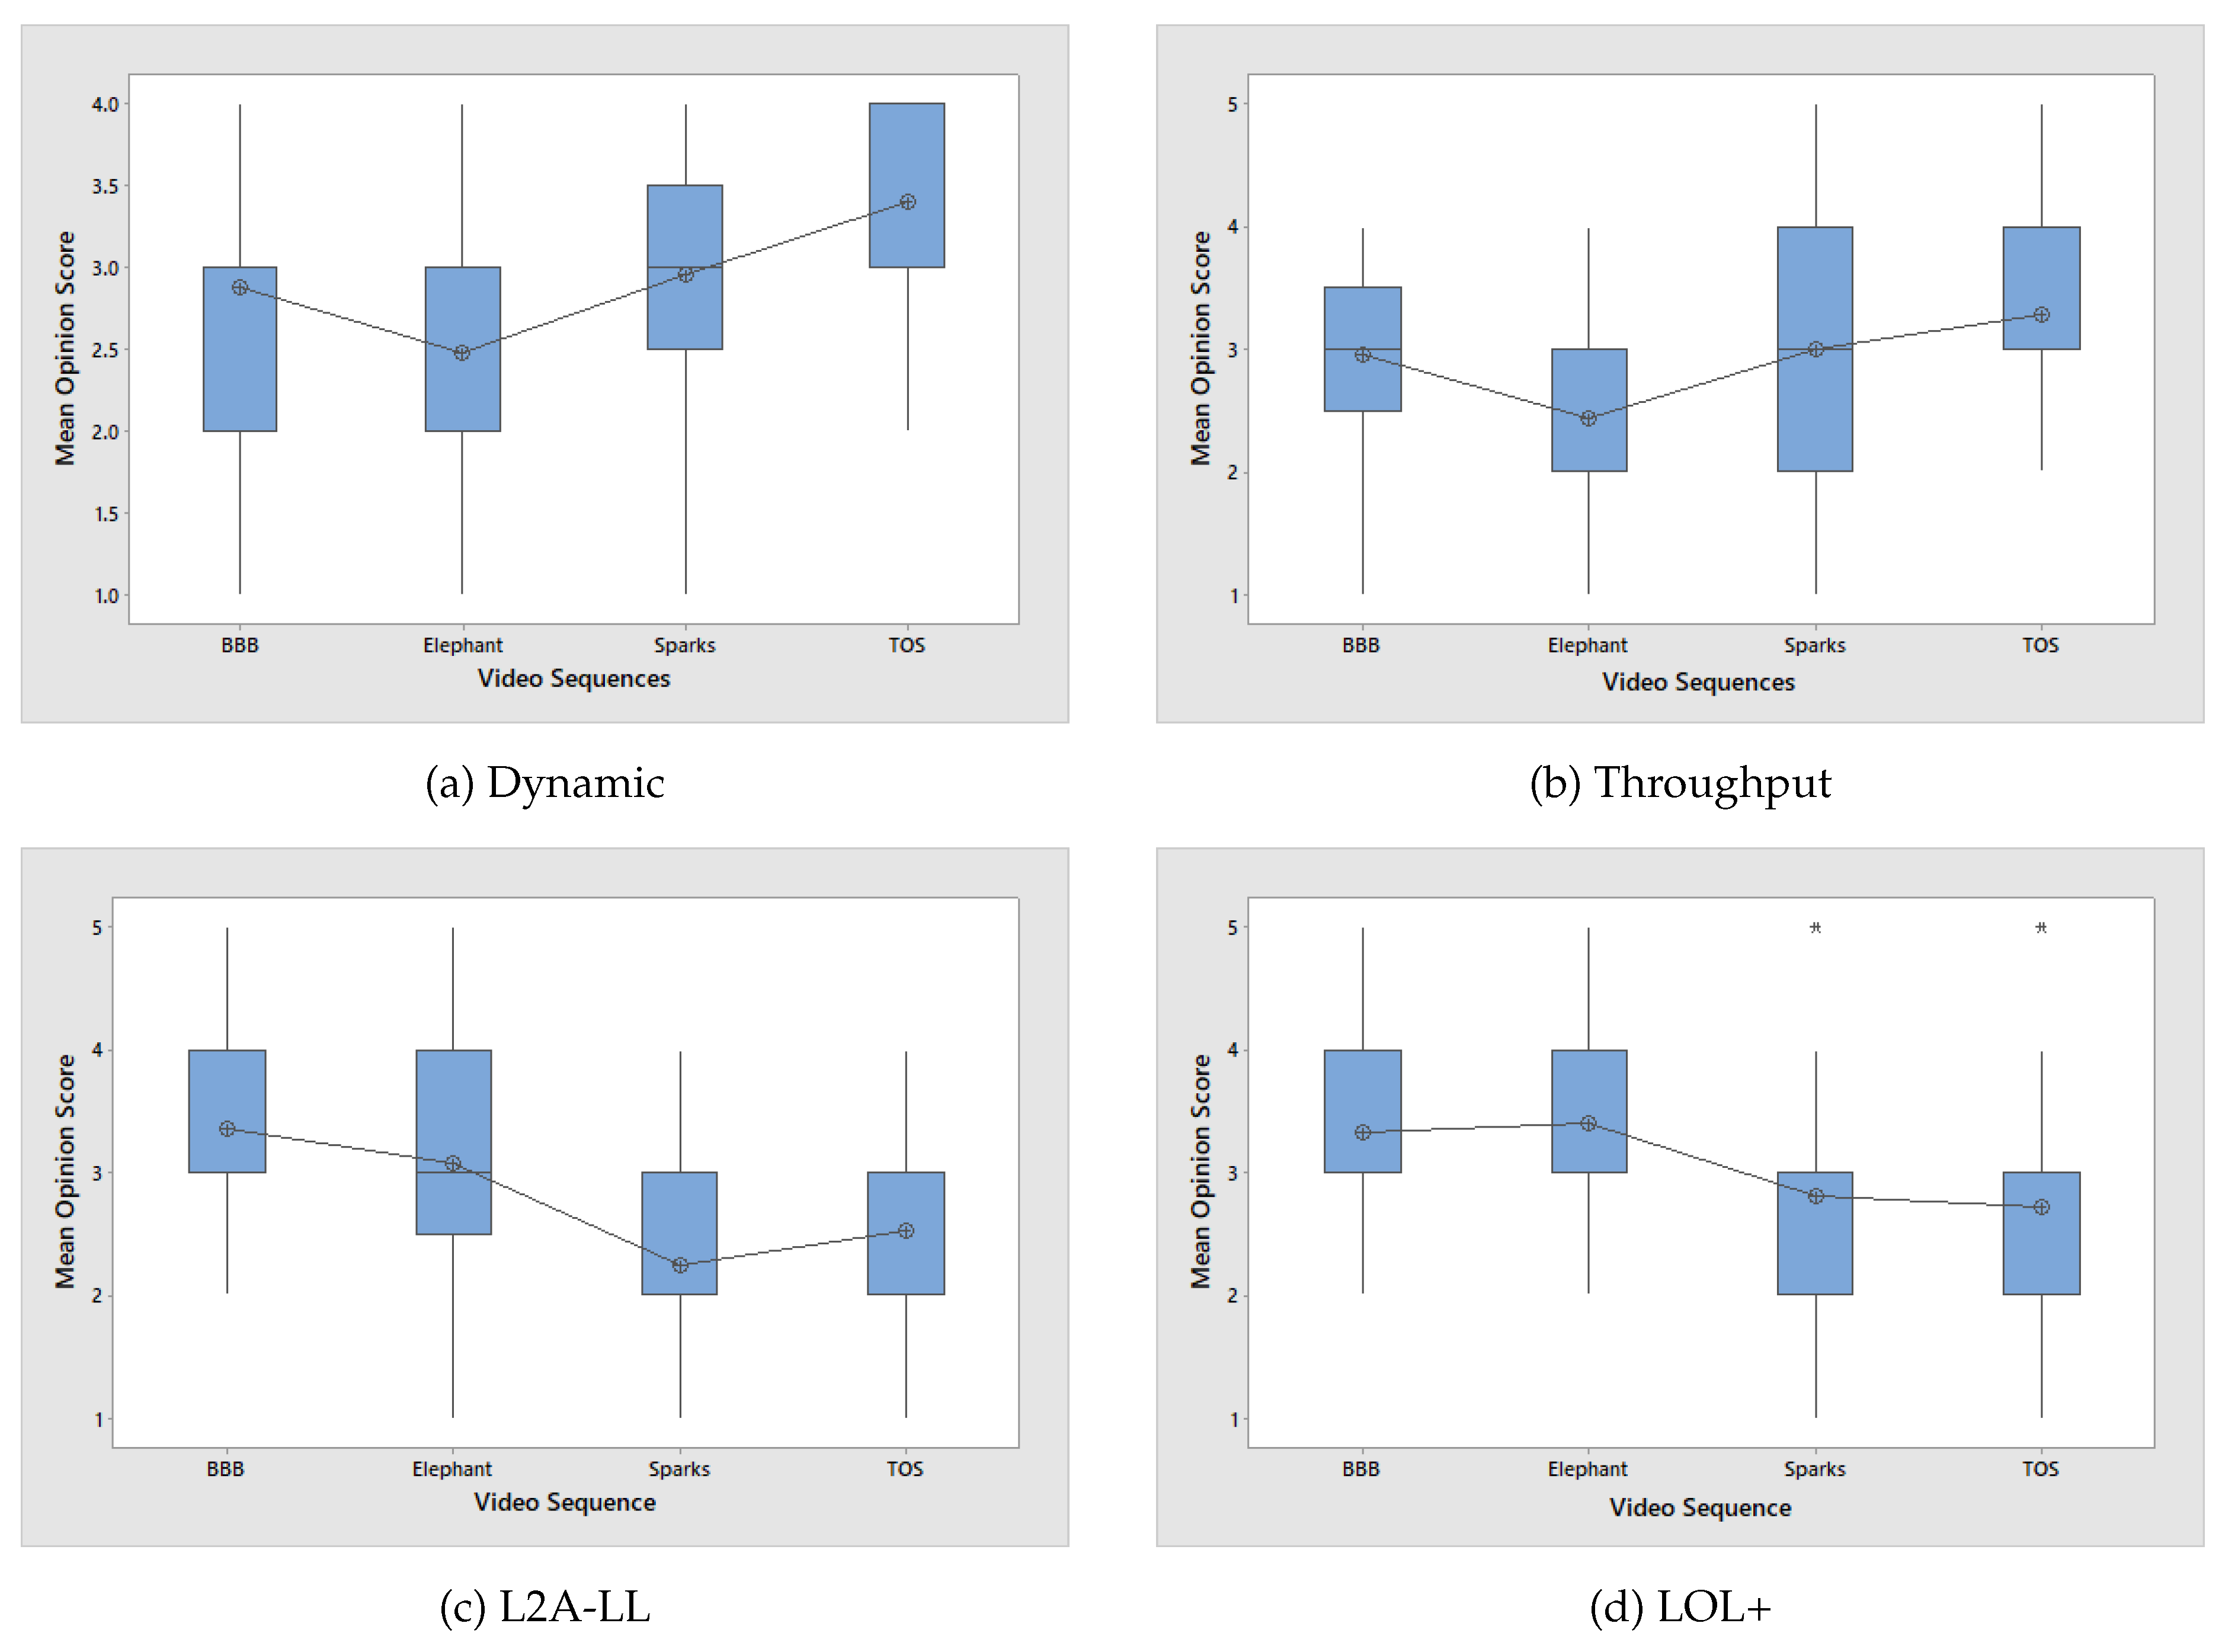
Table 3.
Descriptive Statistics of Mean Opinion Scores- Dynamic.
| Video | N | Mean | StdDev | 95% CI |
|---|---|---|---|---|
| BBB | 25 | 2.880 | 0.781 | (2.594, 3.166) |
| Elephant | 25 | 2.480 | 0.714 | (2.194, 2.766) |
| Sparks | 25 | 2.960 | 0.790 | (2.674, 3.246) |
| TOS | 25 | 3.400 | 0.577 | (3.114, 3.686) |
Table 4.
Descriptive Statistics of Mean Opinion Scores- Throughput.
| Video | N | Mean | StdDev | 95% CI |
|---|---|---|---|---|
| BBB | 25 | 2.96 | 0.790 | (2.641, 3.279) |
| Elephant | 25 | 2.44 | 0.651 | (2.121, 2.759) |
| Sparks | 25 | 3.00 | 0.913 | (2.681, 3.319) |
| TOS | 25 | 3.28 | 0.843 | (2.961, 3.599) |
The descriptive statistics presented in Tables 3–6 reveal that the Dynamic and Throughput algorithms exhibit relatively low standard deviations (0.65–0.79) and narrow confidence intervals. This indicates a stable perceptual quality. The consistency suggests that both algorithms deliver smooth visual experiences with minimal perceptual fluctuations across diverse content types. In contrast, the L2A-LL algorithm demonstrates higher variability, with standard deviations reaching up to 0.997 for the Elephant sequence and wider confidence intervals across all videos. These results imply less stable performance and greater perceptual inconsistency. It is likely due to its aggressive latency-oriented adaptation strategy that leads to frequent bitrate changes and visible quality oscillations. The LOL+ algorithm, on the other hand, shows narrow confidence intervals for low-motion content such as Big Buck Bunny and Elephant, reflecting a high level of user consensus and stable visual quality. However, slightly broader intervals observed for more complex content, such as Tears of Steel. This suggests that scene dynamics and motion intensity may still influence the perceived quality.
Overall, the statistical dispersion and confidence analyses highlight that Dynamic and Throughput achieve steady perceptual outcomes. The L2A-LL introduces instability under fluctuating conditions, and LOL+ sustains high but content-sensitive consistency in subjective quality assessments.
Table 5.
Descriptive Statistics of Mean Opinion Scores- L2A-LL.
| Video | N | Mean | StdDev | 95% CI |
|---|---|---|---|---|
| BBB | 25 | 3.36 | 0.810 | (3.035, 3.685) |
| Elephant | 25 | 3.08 | 0.997 | (2.755, 3.405) |
| Sparks | 25 | 2.24 | 0.723 | (1.915, 2.565) |
| TOS | 25 | 2.52 | 0.714 | (2.195, 2.845) |
Table 6.
Descriptive Statistics of Mean Opinion Scores- LOL+.
| Video | N | Mean | StdDev | 95% CI |
|---|---|---|---|---|
| BBB | 25 | 3.32 | 0.748 | (2.970, 3.670) |
| Elephant | 25 | 3.40 | 0.866 | (3.050, 3.750) |
| Sparks | 25 | 2.80 | 0.913 | (2.450, 3.150) |
| TOS | 25 | 2.72 | 0.980 | (2.370, 3.070) |
4.2.6. Scatter Plot Analysis of Algorithms and MOS Score
To examine the consistency of user perceptions across different adaptive streaming algorithms, we present scatter plots of opinion scores comparing traditional HAS and low-latency algorithms. Figure 13 presents the scatter plot of opinion scores for the Dynamic and Throughput HAS algorithms. The figure illustrates the relationship between their subjective ratings across different video sequences. The subplots include regression lines that represent the trend between the opinion scores of the two algorithms across different video sequences. The correlation between the two algorithms is further examined to assess consistency in user perception. For BBB, the data reveal a weak but positive association, indicating that participants who rated Dynamic higher generally tended to assign slightly higher scores to Throughput as well. The Elephant sequence exhibits a shallow positive trend, where the ratings for both algorithms are correlated but display considerable dispersion. This suggests a modest agreement among participants. In this case, Throughput scores are more tightly clustered around the mid-range values, regardless of variations in Dynamic ratings. In contrast, the Sparks sequence shows a more pronounced upward trend, implying a stronger alignment in subjective evaluations and more consistent high ratings for both algorithms, although some variability remains across individual scores.
Figure 14 illustrates the comparative analysis between the low-latency algorithms, L2A-LL and LOL+ to assess user rating patterns. As evident from the user evaluations, the Elephant sequence exhibits a strong positive correlation, indicating that participants who assigned higher ratings to L2A-LL also tended to rate LOL+ favorably. In contrast, the BBB content shows weaker consistency among user ratings. This suggests a limited correlation and greater perceptual variability. For the Sparks and TOS sequences, a moderate to strong positive relationship is observed which reflects a greater alignment in user perception of quality between the two algorithms. Overall, the correlation analysis demonstrates that while both L2A-LL and LOL+ perform similarly for certain content types, perceptual agreement diminishes for less predictable or visually complex videos such as TOS.
4.2.7. Regression Analysis of Low-Latency Algorithms
To further assess the relationship between two low-latency algorithms, a linear regression analysis was conducted comparing opinion scores from L2A-LL and LOL+ for all videos.
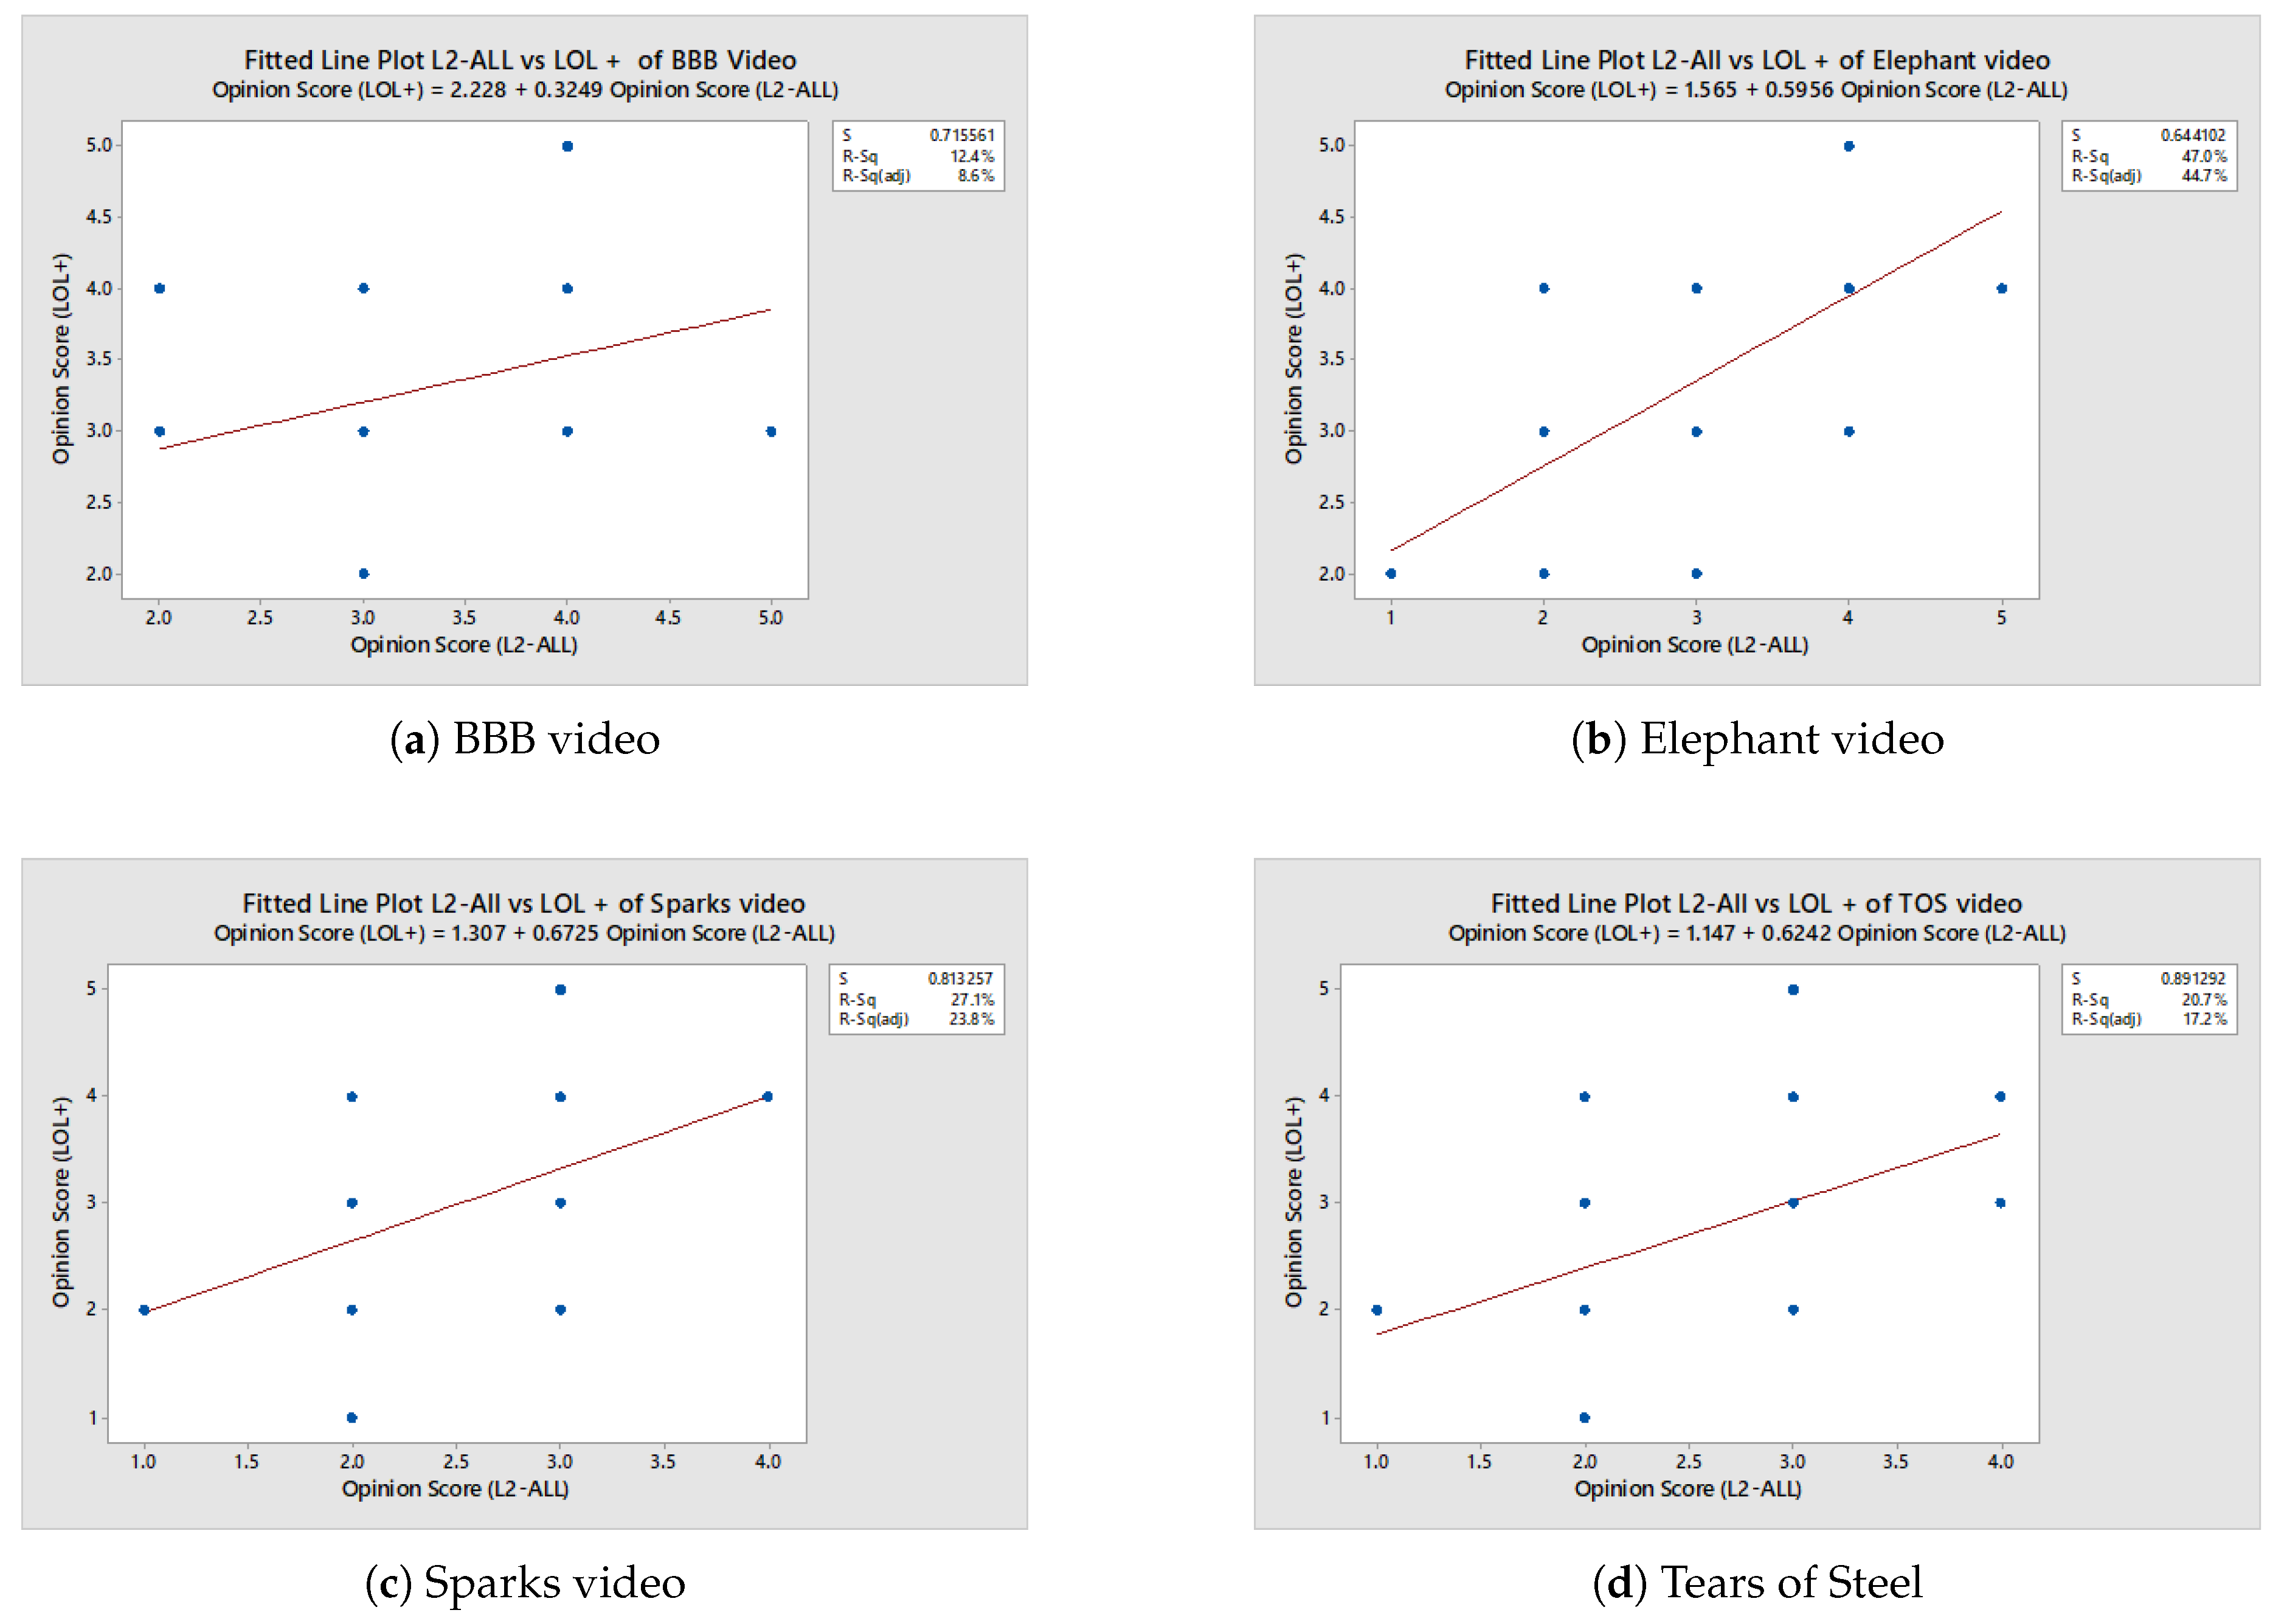
Figure 15a illustrates the regression relationship between the two algorithms, while Table 7 summarizes the corresponding statistical parameters. First, a linear regression relationship is demonstrated between the opinion scores obtained from the L2A-LL and the LOL+ for the Big Buck Bunny (BBB) video. The equation is shown: The regression yielded the following model:
The equation above indicates that increases in L2A-LL scores are accompanied by slight increases in LOL+ scores. This suggests a weak positive association that lacks strong predictive capability. The presence of outliers highlights inconsistencies in participant evaluations, reflecting inherent subjectivity and variability in user perception. These findings suggest the need to consider additional predictors—such as content complexity, motion characteristics, and participant demographics—to more accurately explain differences in perceived QoE.
Table 7.
Statistical Analysis of Variance - BBB.
| Source | DF | SS | MS | F | P |
|---|---|---|---|---|---|
| Regression | 1 | 1.66 | 1.66 | 3.25 | 0.085 |
| Error | 23 | 11.77 | 0.51 | ||
| Total | 24 | 13.44 |
Next, we assess the relationship between two low-latency algorithms for the Elephant video. Figure ?? illustrates a clear upward trend, indicating that users provide consistent ratings when evaluating this video. A detailed analysis is presented in Table 8. The relationship between the two metrics is modeled by the regression equation:
This implies that for every one-point increase in the L2-ALL score, the LOL+ score is expected to increase by approximately 0.60 units.
Table 8.
Statistical Analysis of Variance - Elephant Dream.
| Source | DF | SS | MS | F | P |
|---|---|---|---|---|---|
| Regression | 1 | 8.45 | 8.45 | 20.39 | 0.00 |
| Error | 23 | 9.45 | 0.41 | ||
| Total | 24 | 18.00 |
Next, the Spark video sequence was presented to users for subjective rating. Figure illustrates reveals a clear trend line that indicates a moderate to strong positive correlation. The corresponding analysis of variance is summarized in Table 9. Based on the regression analysis, the following regression equation was derived:
This implies that for every one-unit increase in the L2-ALL score, the LOL+ score is expected to increase by approximately 0.67 units. The positive slope confirms a positive association between the two sets of ratings. However, the noticeable scatter around the regression line indicates variability. This suggests that while the overall trend holds, individual respondents’ ratings often deviate from the predicted values.
Table 9.
Statistical Analysis of Variance - Sparks.
| Source | DF | SS | MS | F | P |
|---|---|---|---|---|---|
| Regression | 1 | 8.45 | 8.45 | 20.39 | 0.00 |
| Error | 23 | 9.45 | 0.41 | ||
| Total | 24 | 18.00 |
Finally, we assess the relationship for the TOS video. As shown in Figure ??, the trend line indicates a moderate to strong positive relationship in users’ opinion scores for this content. The detailed analysis is summarized in Table ??. Based on the regression analysis, the following equation was derived:
The regression equation shows a positive slope of 0.6242. This indicates that for each one-unit increase in the L2-ALL score, the LOL+ score is expected to increase by approximately 0.62 units. This reflects a moderate positive association in respondent opinions across the two algorithms. For the TOS content, the relationship between L2-ALL and LOL+ scores is both moderate and statistically significant. The participants tended to rate the video in a similar manner under both scoring methods. However, the strength of agreement was lower than that observed for the Elephant content, with noticeable individual differences remaining. This variability implies that respondent ratings may have been influenced by contextual factors or subjective interpretation, rather than by the algorithmic method alone.
Table 10.
Statistical Analysis of Variance - Tears of Steel.
| Source | DF | SS | MS | F | P |
|---|---|---|---|---|---|
| Regression | 1 | 4.76 | 4.76 | 6.00 | 0.022 |
| Error | 23 | 18.27 | 0.79 | ||
| Total | 24 | 23.04 |
5. Conclusions and Future Work
This study presents a comprehensive subjective evaluation of ABR algorithms in low-latency MPEG-DASH streaming environments. The work combines objective metrics with large-scale crowd-sourced subjective assessments to analyze user-perceived video quality across both traditional and low-latency ABR strategies. The ABR algorithms were tested using short 2-second segments to simulate real-world low-latency streaming. The evaluation employed the ACR method following ITU-T P.910 standards, with data collected via the Prolific platform. Diverse video content was used, including animation and cinematic clips, to capture variations in spatial and temporal complexity. Results indicate that the Dynamic algorithm consistently achieved higher Mean Opinion Scores and exhibited greater robustness across network fluctuations. For low-latency algorithms, LoL+ outperformed L2A-LL, maintaining superior perceptual quality and playback stability. However, L2A-LL’s aggressive latency optimization resulted in greater bitrate variability and lower user satisfaction. The findings highlight that objective performance metrics alone do not fully capture user perception. Frequent quality switches and visual instability were found to reduce subjective QoE significantly. The study underscores the importance of designing ABR algorithms that balance responsiveness, stability, and perceptual quality rather than focusing solely on latency or bitrate.
Future research can advance in several directions. Additional content types and genres should be incorporated to capture a broader range of visual and motion characteristics. Increasing the number and diversity of participants would enhance the statistical reliability and representativeness of subjective evaluations. The dataset can be expanded by including more resolutions and network profiles to reflect real-world streaming environments more accurately. Furthermore, future subjective studies should focus on assessing video quality in ultra-low-latency scenarios to better understand user perception under extreme delay constraints. These efforts will contribute to the development of next-generation adaptive streaming systems that are both technically optimized and user-centric.
References
- Kumar, T. , et al.: Cloud-based video streaming services: trends, challenges, and opportunities. CAAI Trans. Intell. Technol. 2024, 9, 265–285. [Google Scholar] [CrossRef]
- Abdelhak Bentaleb, Zhengdao Zhan, Farzad Tashtarian, May Lim, Saad Harous, Christian Timmerer, Hermann Hellwagner, and Roger Zimmermann. 2022. Low Latency Live Streaming Implementation in DASH and HLS. In Proceedings of the 30th ACM International Conference on Multimedia (MM ’22). Association for Computing Machinery, New York, NY, USA, 7343–7346. [CrossRef]
- Shih, W.-C.; Wang, Z.-Y.; Kristiani, E.; Hsieh, Y.-J.; Sung, Y.-H.; Li, C.-H.; Yang, C.-T. The Construction of a Stream Service Application with DeepStream and Simple Realtime Server Using Containerization for Edge Computing. Sensors 2025, 25, 259. [Google Scholar] [CrossRef] [PubMed]
- K. Bouraqia, E. Sabir, M. Sadik and L. Ladid, "Quality of Experience for Streaming Services: Measurements, Challenges and Insights,". IEEE Access 2020, 8, 13341–13361. [CrossRef]
- Lyko, T. , Broadbent, M., Race, N. et al. Improving quality of experience in adaptive low latency live streaming. Multimed Tools Appl 2024, 83, 15957–15983. [Google Scholar] [CrossRef]
- Barakovic Husic, Jasmina and Barakovic, Sabina. (). Multidimensional modelling of quality of experience for video streaming. Computers in Human Behavior 2021, 129, 107155. [CrossRef]
- Z. Duanmu, A. Rehman and Z. Wang, "A Quality-of-Experience Database for Adaptive Video Streaming,". IEEE Transactions on Broadcasting 2018, 64, 474–487. [CrossRef]
- Barman, Nabajeet and Martini, Maria. (2019). QoE Modeling for HTTP Adaptive Video Streaming - A Survey and Open Challenges. IEEE Access. 7. 10.1109/ACCESS.2019.2901778.
- Weiling Chen, Fengquan Lan, Hongan Wei, Tiesong Zhao, Wei Liu, and Yiwen Xu. 2024. A comprehensive review of quality of experience for emerging video services. Image Commun. 128, C (Oct 2024). [CrossRef]
- Mariana Arroyo Chavez, Molly Feanny, Matthew Seita, Bernard Thompson, Keith Delk, Skyler Officer, Abraham Glasser, Raja Kushalnagar, and Christian Vogler. 2024. How Users Experience Closed Captions on Live Television: Quality Metrics Remain a Challenge. In Proceedings of the 2024 CHI Conference on Human Factors in Computing Systems (CHI ’24). Association for Computing Machinery, New York, NY, USA, Article 54, 1–16. [CrossRef]
- WU Rahman, M Bilal Amin, Md Delowar Hossain, CS Hong,& Eui-Nam Huh, "QoE optimization for HTTP adaptive streaming: Performance evaluation of MEC-assisted and client-based methods,". Journal of Visual Communication and Image Representation 2022, 2022, 82. [CrossRef]
- WU Rahman, and Kwangsue Chung. "A multi-path-based adaptive scheme for multi-view streaming over HTTP.". IEEE Access 2018, 6, 77869–77879. [CrossRef]
- Duanmu, Z. , Liu, W., Li, Z., Chen, D., Wang, Z., Wang, Y., & Gao, W. (2020). Assessing the Quality-of-Experience of Adaptive Bitrate Video Streaming. ArXiv, abs/2008.08804.
- W. Liu, Y. W. Liu, Y. Xu, S. Yi, T. Zhao and Y. Fang, "The Impact of Multimedia Synchronization and Buffering on Quality of Experience (QoE) in Audiovisual Transmission," 2019 IEEE International Conference on Real-time Computing and Robotics (RCAR), Irkutsk, Russia, 2019, pp. [CrossRef]
- Rodrigues, Rafael & Počta, Peter & Melvin, Hugh & Bernardo, Marco & Pereira, Manuela & Pinheiro, Antonio. (2020). Audiovisual Quality of Live Music Streaming over Mobile Networks using MPEG-DASH. Multimedia Tools and Applications. 10.1007/s11042-020-09047-6.
- Huyen, Tran & Pham Ngoc, Nam & Hossfeld, Tobias & Seufert, Michael & Cong Thang, Truong. (2019). Cumulative Quality Modeling for HTTP Adaptive Streaming. 10.48550/arXiv.1909.02772.
- Taraghi, Babak & Nguyen, Minh & Amirpour, Hadi & Timmerer, Christian. (2021). Intense: In-Depth Studies on Stall Events and Quality Switches and Their Impact on the Quality of Experience in HTTP Adaptive Streaming. IEEE Access. PP. 1-1. 10.1109/ACCESS.2021.3107619.
- Lyko, T. Lyko, T., Broadbent, M., Race, N.J., Nilsson, M., Farrow, P., & Appleby, S. Improving quality of experience in adaptive low latency live streaming. Multim. Tools Appl. 2023, 83, 15957–15983. [Google Scholar]
- O’Hanlon, Piers & Aslam, Adil. (2023). Latency Target based Analysis of the DASH.js Player. 10.48550/arXiv.2304.13551.
- Deepti Ghadiyaram, Janice Pan, Alan C. Bovik, Anush Moorthy, Prasanjit Panda, and Kai-Chieh Yang. 2017. Subjective and objective quality assessment of Mobile Videos with In-Capture distortions. In 2017 IEEE International Conference on Acoustics, Speech and Signal Processing (ICASSP). IEEE Press, 1393–1397. [CrossRef]
- Zabrovskiy, Anatoliy & Feldmann, Christian & Timmerer, Christian. (2018). Multi-Codec DASH Dataset. 10.48550/arXiv.1803.06874.
- D. Ghadiyaram, J. Pan and A. C. Bovik, "A Subjective and Objective Study of Stalling Events in Mobile Streaming Videos,". IEEE Transactions on Circuits and Systems for Video Technology 2019, 29, 183–197. [CrossRef]
- R. R. Ramachandra Rao, S. Göring, W. Robitza, B. Feiten and A. Raake, "AVT-VQDB-UHD-1: A Large Scale Video Quality Database for UHD-1," 2019 IEEE International Symposium on Multimedia (ISM), San Diego, CA, USA, 2019, pp. 17-177. [CrossRef]
- Zhuoran Li, Zhengfang Duanmu, Wentao Liu, and Zhou Wang. 2019. AVC, HEVC, VP9, AVS2 or AV1? — A Comparative Study of State-of-the-Art Video Encoders on 4K Videos. In Image Analysis and Recognition: 16th International Conference, ICIAR 2019, Waterloo, ON, Canada, August 27–29, 2019, Proceedings, Part I. Springer-Verlag, Berlin, Heidelberg, 162–173. [CrossRef]
- Lin, Joe Yuchieh, Rui Song, Eddy Chi-Hao Wu, Tsung-Jung Liu, Haiqiang Wang and C.-C. Jay Kuo. “MCL-V: A streaming video quality assessment database.” J. Vis. Commun. Image Represent. 30 (2015): 1-9.
- Alexandre Mercat, Marko Viitanen, and Jarno Vanne. 2020. UVG dataset: 50/120fps 4K sequences for video codec analysis and development. In Proceedings of the 11th ACM Multimedia Systems Conference (MMSys ’20). Association for Computing Machinery, New York, NY, USA, 297–302. [CrossRef]
- Babak Taraghi, Hadi Amirpour, and Christian Timmerer. 2022. Multi-codec ultra high definition 8K MPEG-DASH dataset. In Proceedings of the 13th ACM Multimedia Systems Conference (MMSys ’22). Association for Computing Machinery, New York, NY, USA, 216–220. [CrossRef]
- Uhrina M, Holesova A, Bienik J, Sevcik L. Impact of Scene Content on High Resolution Video Quality. Sensors (Basel). 2021 Apr 19;21(8):2872. [CrossRef] [PubMed]
- ITU-T, Subjective video quality assessment methods for multimedia applications, ITU-T Rec. P.910, Oct. 2023.
- Alkharusi, Hussain. (2022). A descriptive analysis and interpretation of data from Likert scales in educational and psychological research. 12. 13-16.
- South, Laura & Saffo, David & Vitek, Olga & Dunne, Cody & Borkin, Michelle. (2022). Effective Use of Likert Scales in Visualization Evaluations: A Systematic Review. 10.31219/osf.io/6f3zs.
- M. Montgomery, "Xiph.org Video Test Media [derf’s collection]", 2010. [Online]. Available: https://media.xiph.
- FFmpeg Developers, FFmpeg – A Complete, Cross-Platform Solution to Record, Convert and Stream Audio and Video, [Online]. Available: https://ffmpeg.
- Peer, E. Prolific: Crowdsourcing Academic Online Research. In: Edlund JE, Nichols AL, eds. The Cambridge Handbook of Research Methods and Statistics for the Social and Behavioral Sciences: Volume 2: Performing Research. Cambridge Handbooks in Psychology. Cambridge University Press; 2024:72-92.
- ITU-T, P.1401: Methods, metrics and procedures for statistical evaluation, qualification and comparison of objective quality prediction models, International Telecommunication Union, Geneva, Switzerland, July 2012.
- Duanmu, Zhengfang, et al. "Assessing the quality-of-experience of adaptive bitrate video streaming. arXiv:2008.08804 (2020).
- Marx, E., Yan, F.Y., & Winstein, K. (2020). Implementing BOLA-BASIC on Puffer: Lessons for the use of SSIM in ABR logic. ArXiv, abs/2011.09611.
- Kevin Spiteri, Ramesh Sitaraman, and Daniel Sparacio. 2019. From Theory to Practice: Improving Bitrate Adaptation in the DASH Reference Player. ACM Trans. Multimedia Comput. Commun. Appl. 15, 2s, Article 67 (April 2019), 29 pages. [CrossRef]
- May Lim, Mehmet N. Akcay, Abdelhak Bentaleb, Ali C. Begen, and Roger Zimmermann. 2020. When they go high, we go low: low-latency live streaming in dash.js with LoL. In Proceedings of the 11th ACM Multimedia Systems Conference (MMSys ’20). Association for Computing Machinery, New York, NY, USA, 321–326. [CrossRef]
- A. Bentaleb, M. N. Akcay, M. Lim, A. C. Begen and R. Zimmermann, "Catching the Moment With LoL + in Twitch-Like Low-Latency Live Streaming Platforms,". IEEE Transactions on Multimedia 2022, 24, 2300–2314. [CrossRef]
- Uddin, S. , Grega, M., Leszczuk, M., & Rahman, W. u. Evaluating HAS and Low-Latency Streaming Algorithms for Enhanced QoE. Electronics 2025, 14, 2587. [Google Scholar] [CrossRef]
Figure 1.
Wireless network test bed.
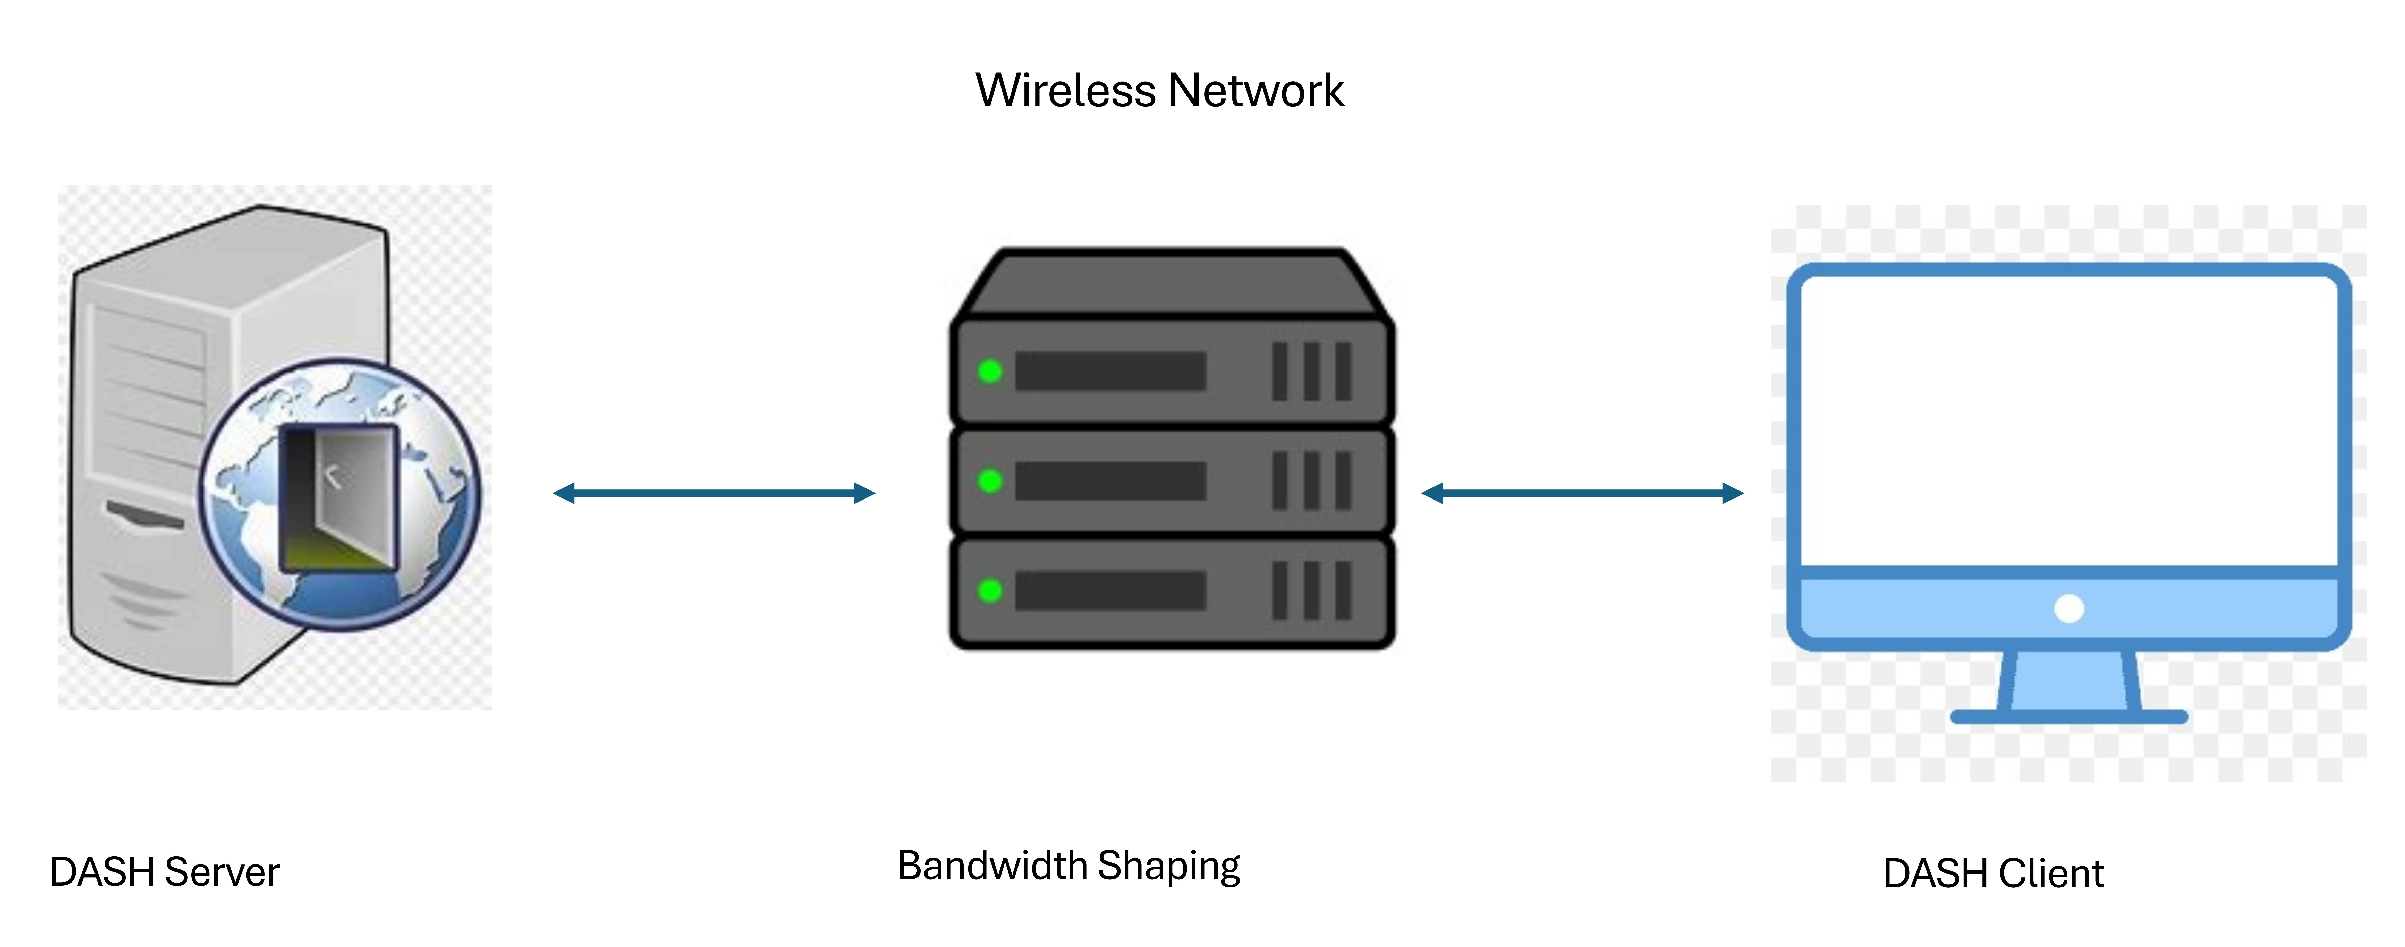
Figure 2.
Spatial Information (SI) vs. Temporal Information (TI) of the source videos
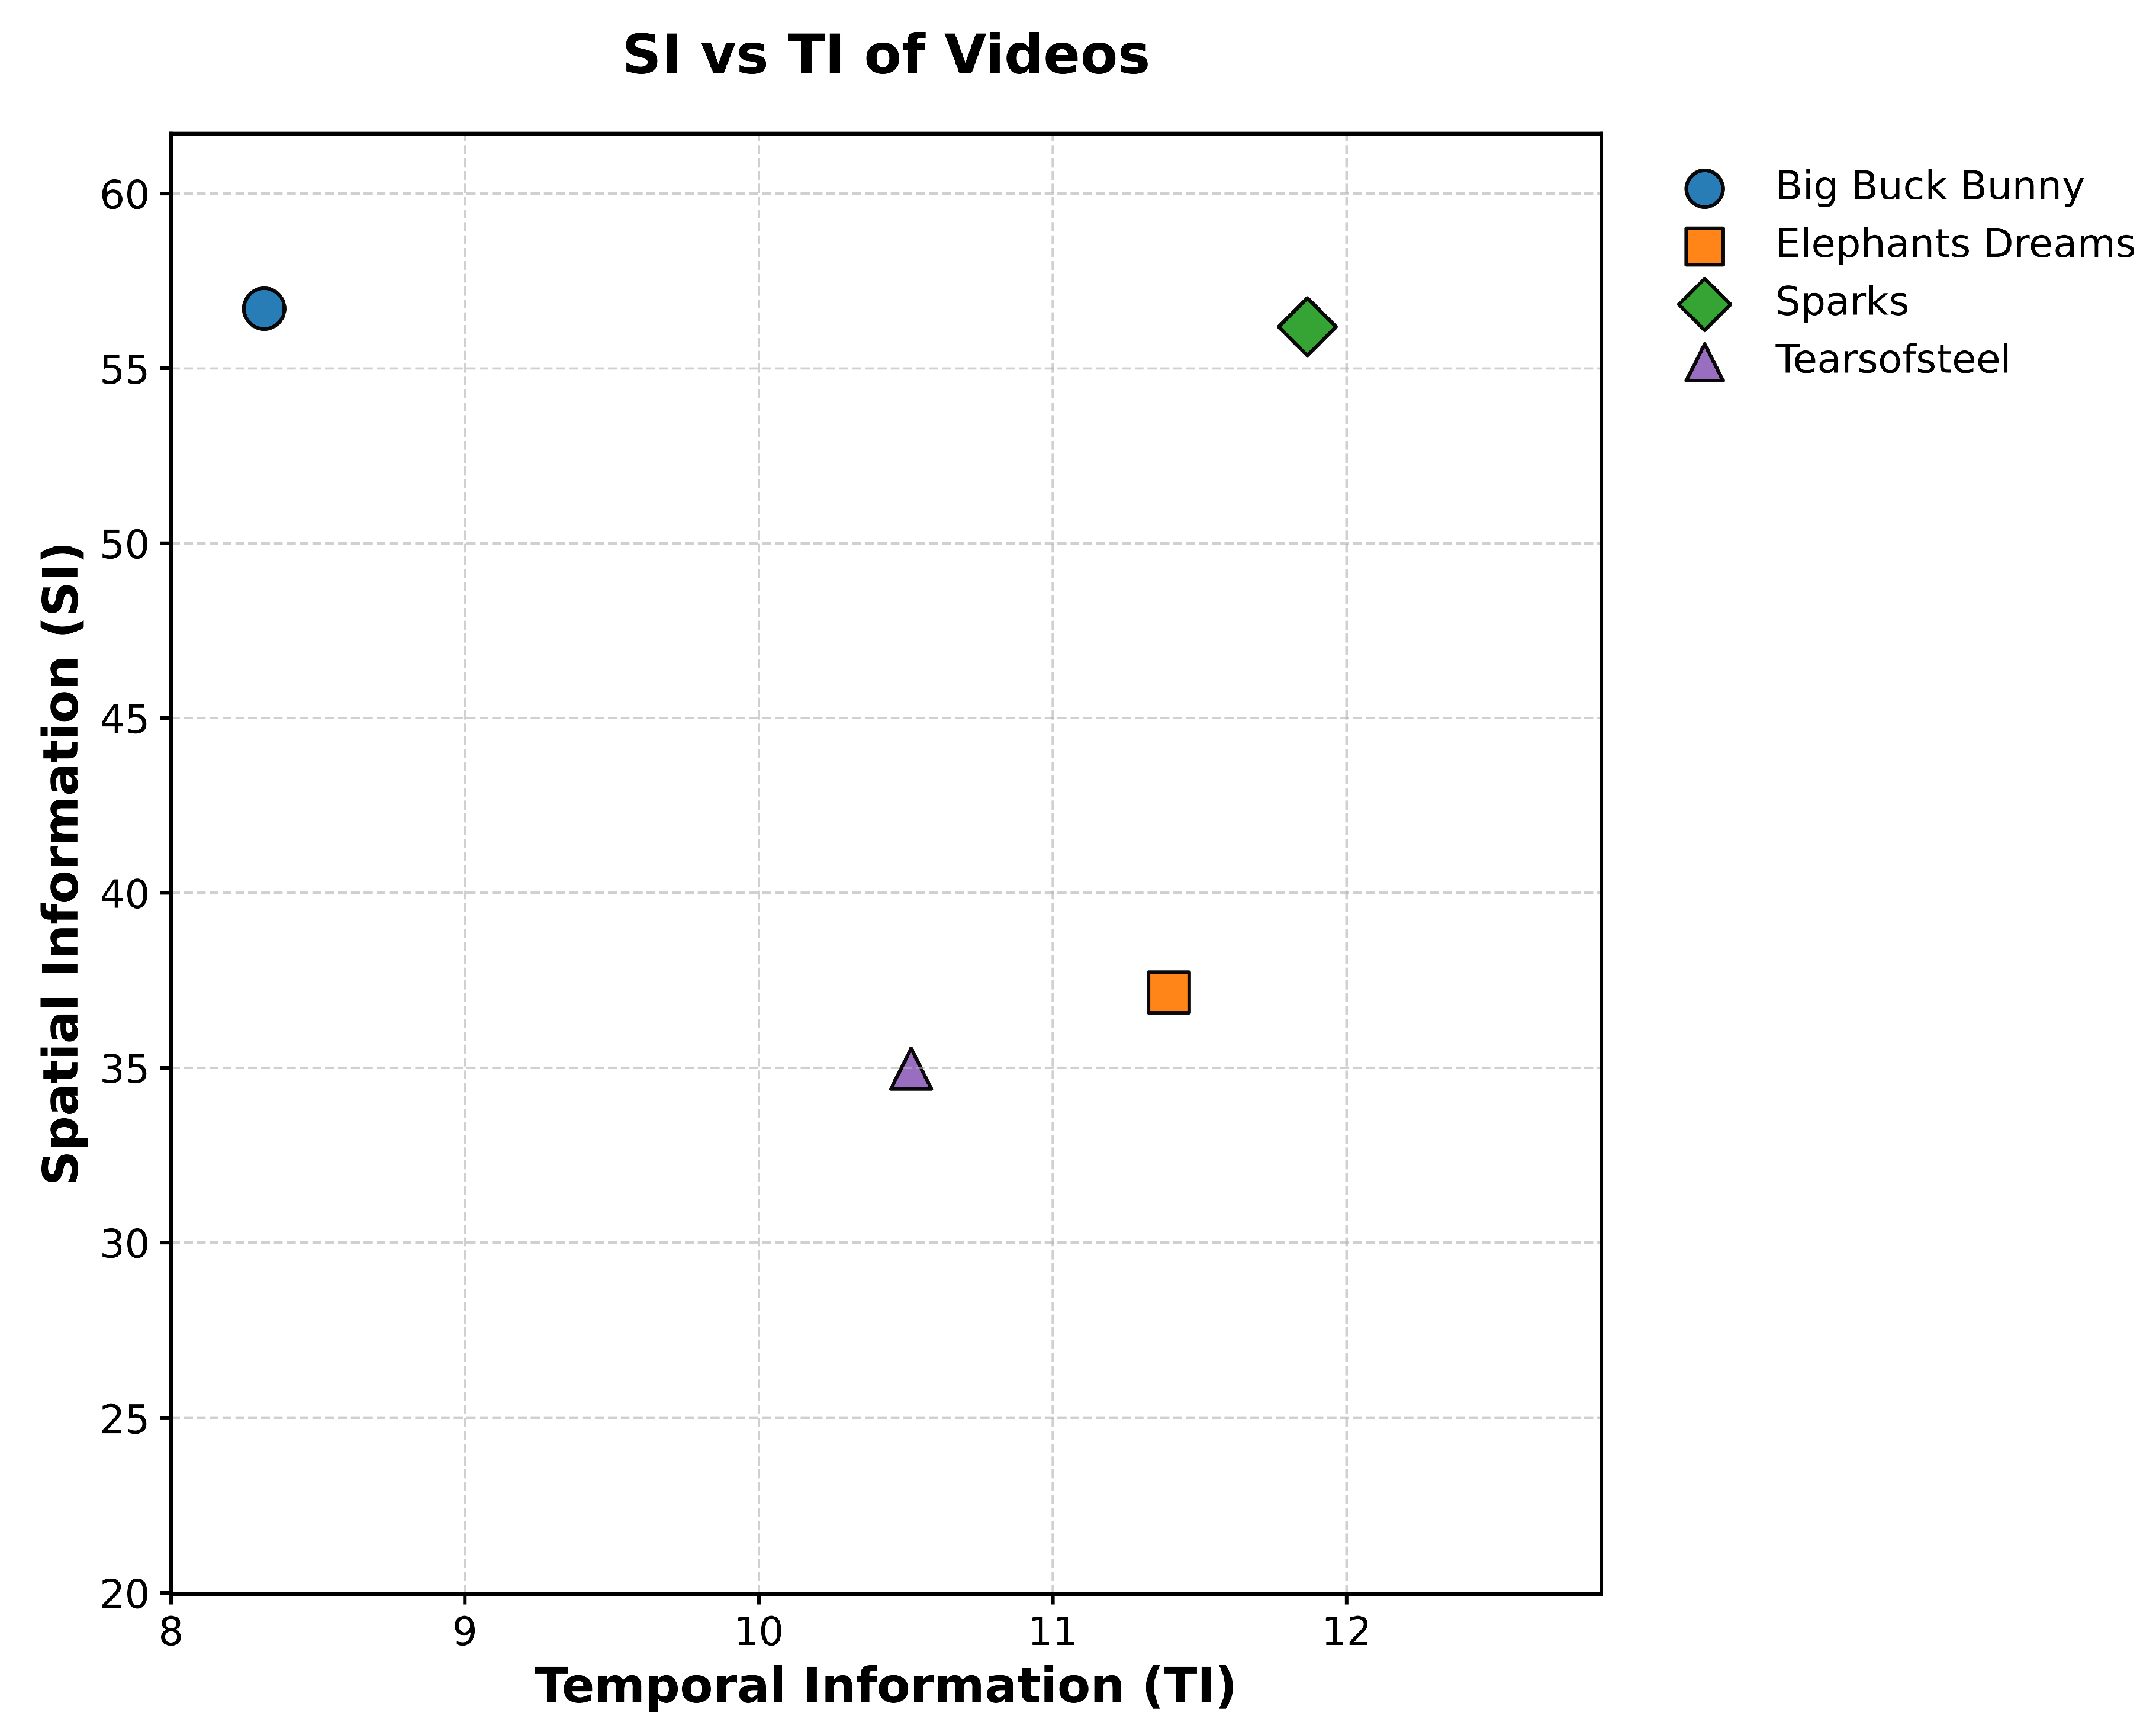
Figure 3.
Network profile used for evaluation.
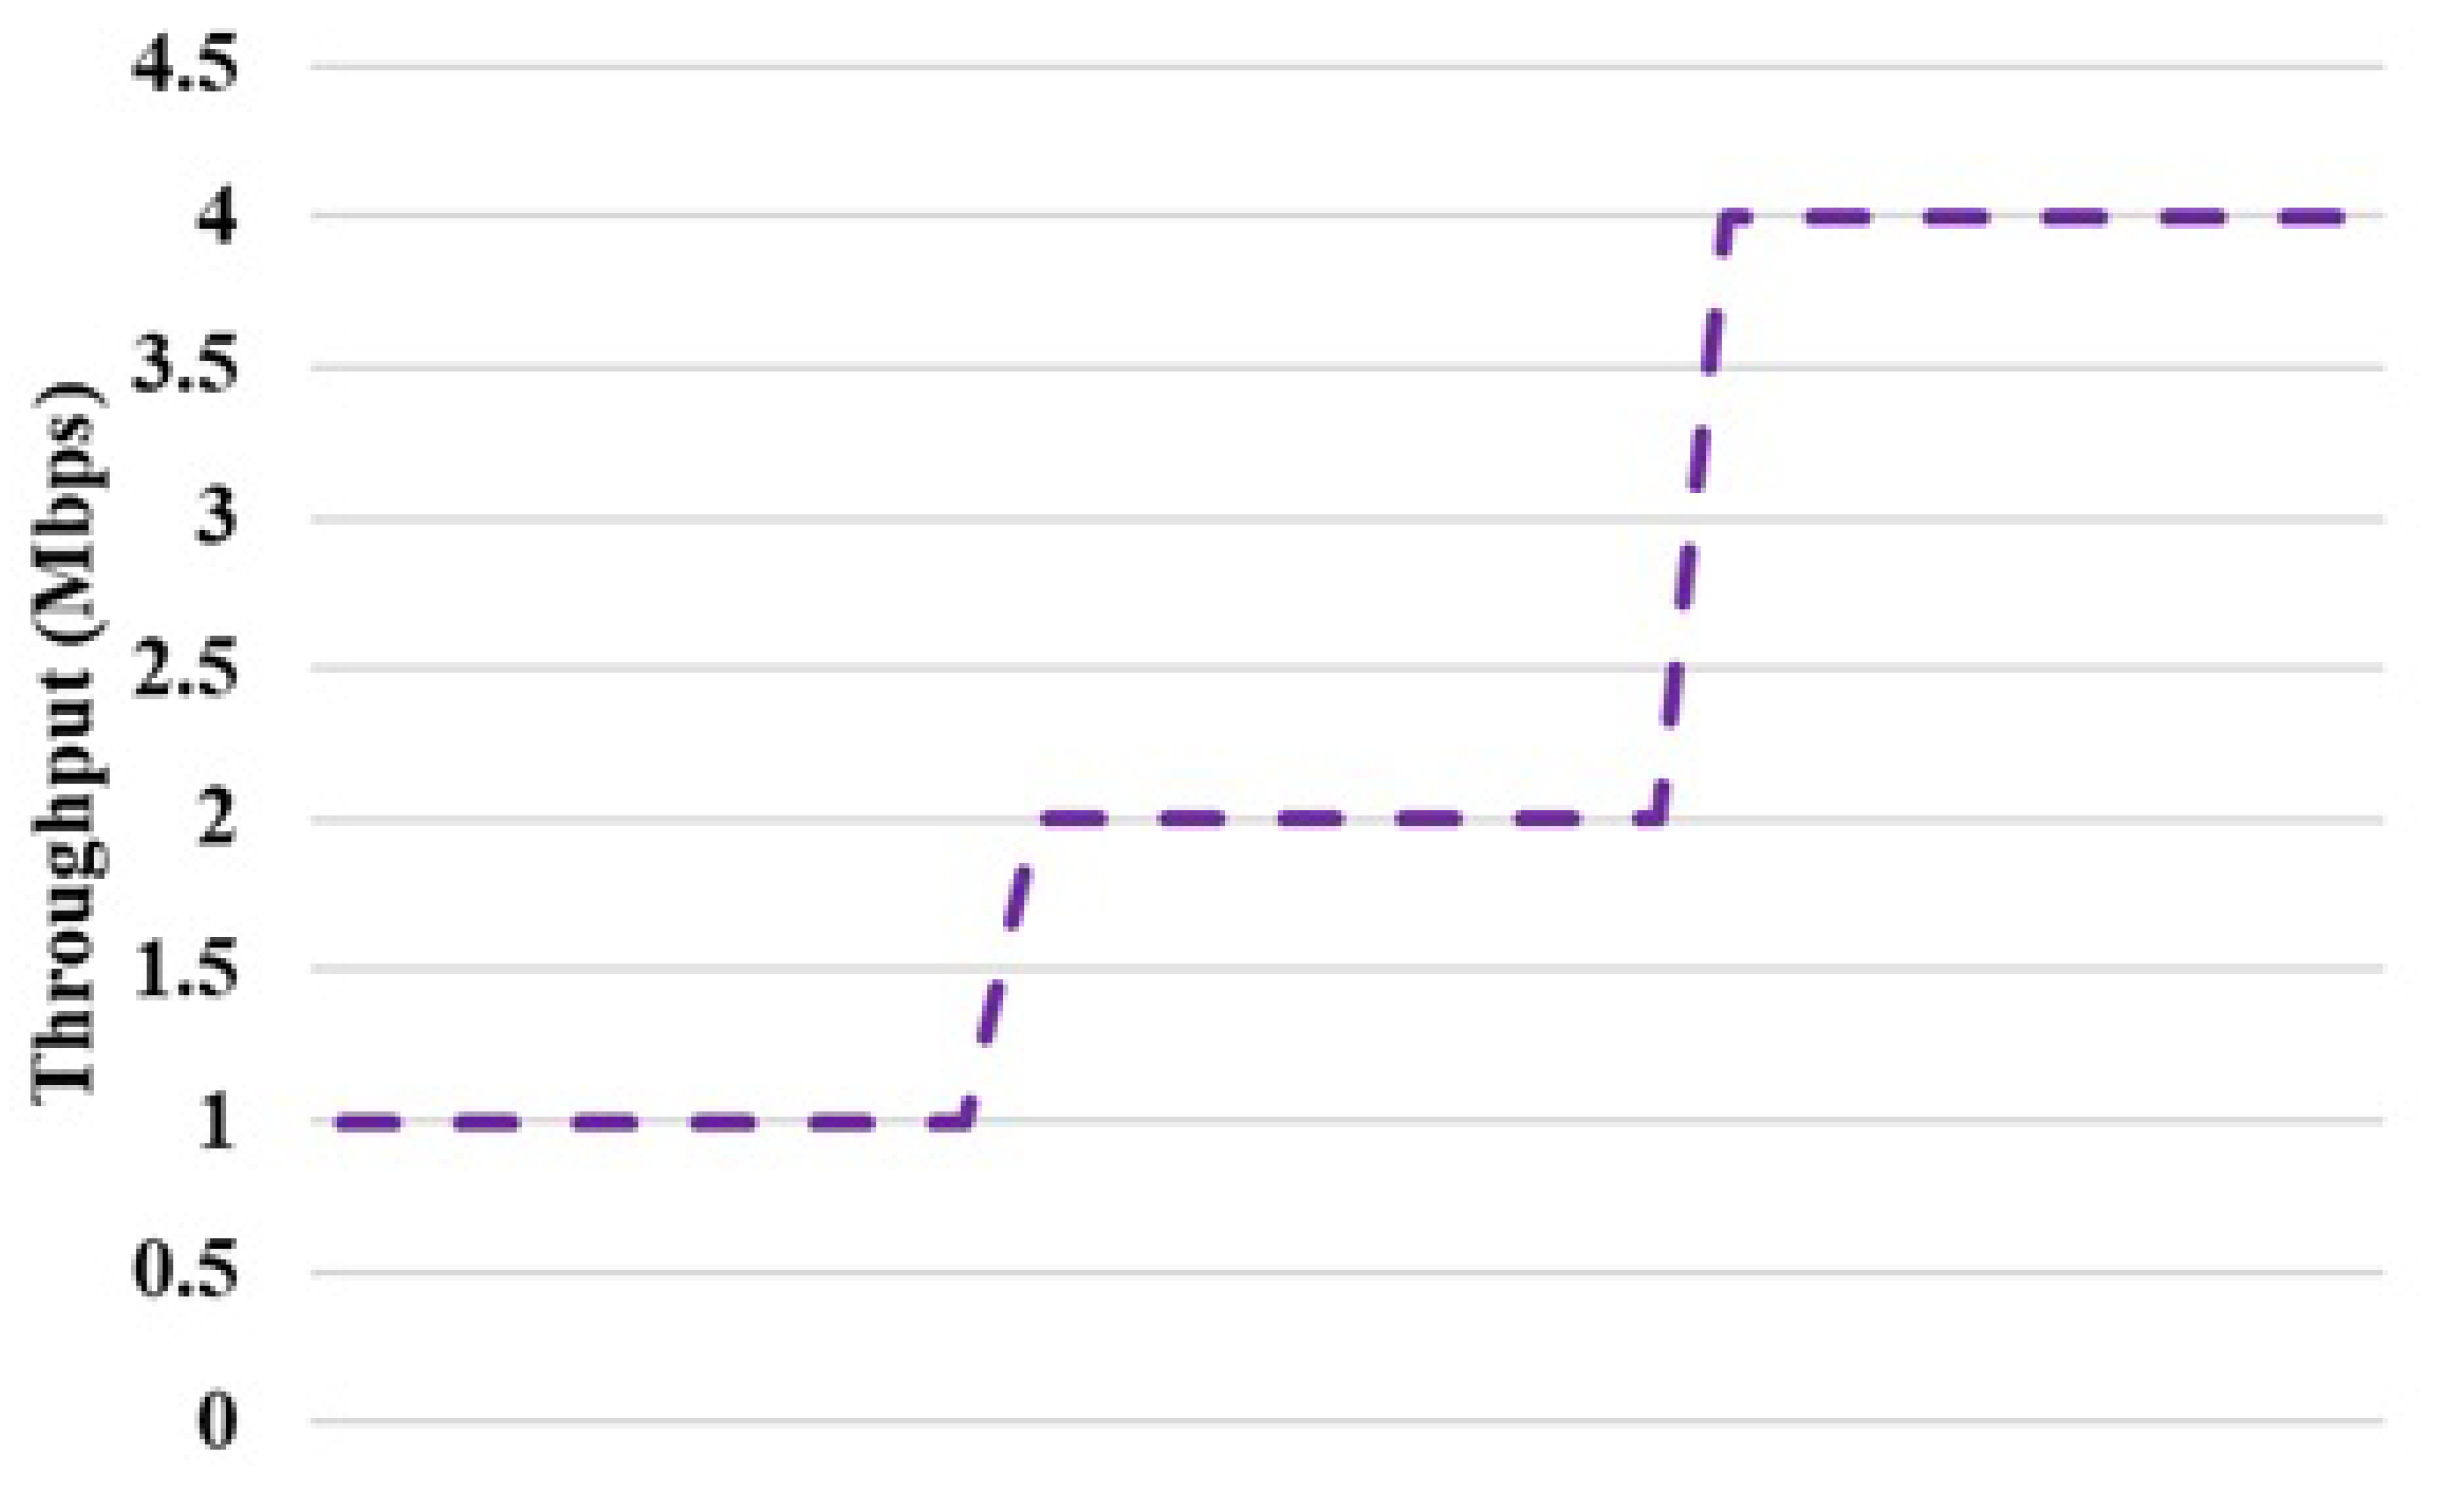
Figure 4.
Bitrate analysis—Big Buck Bunny.
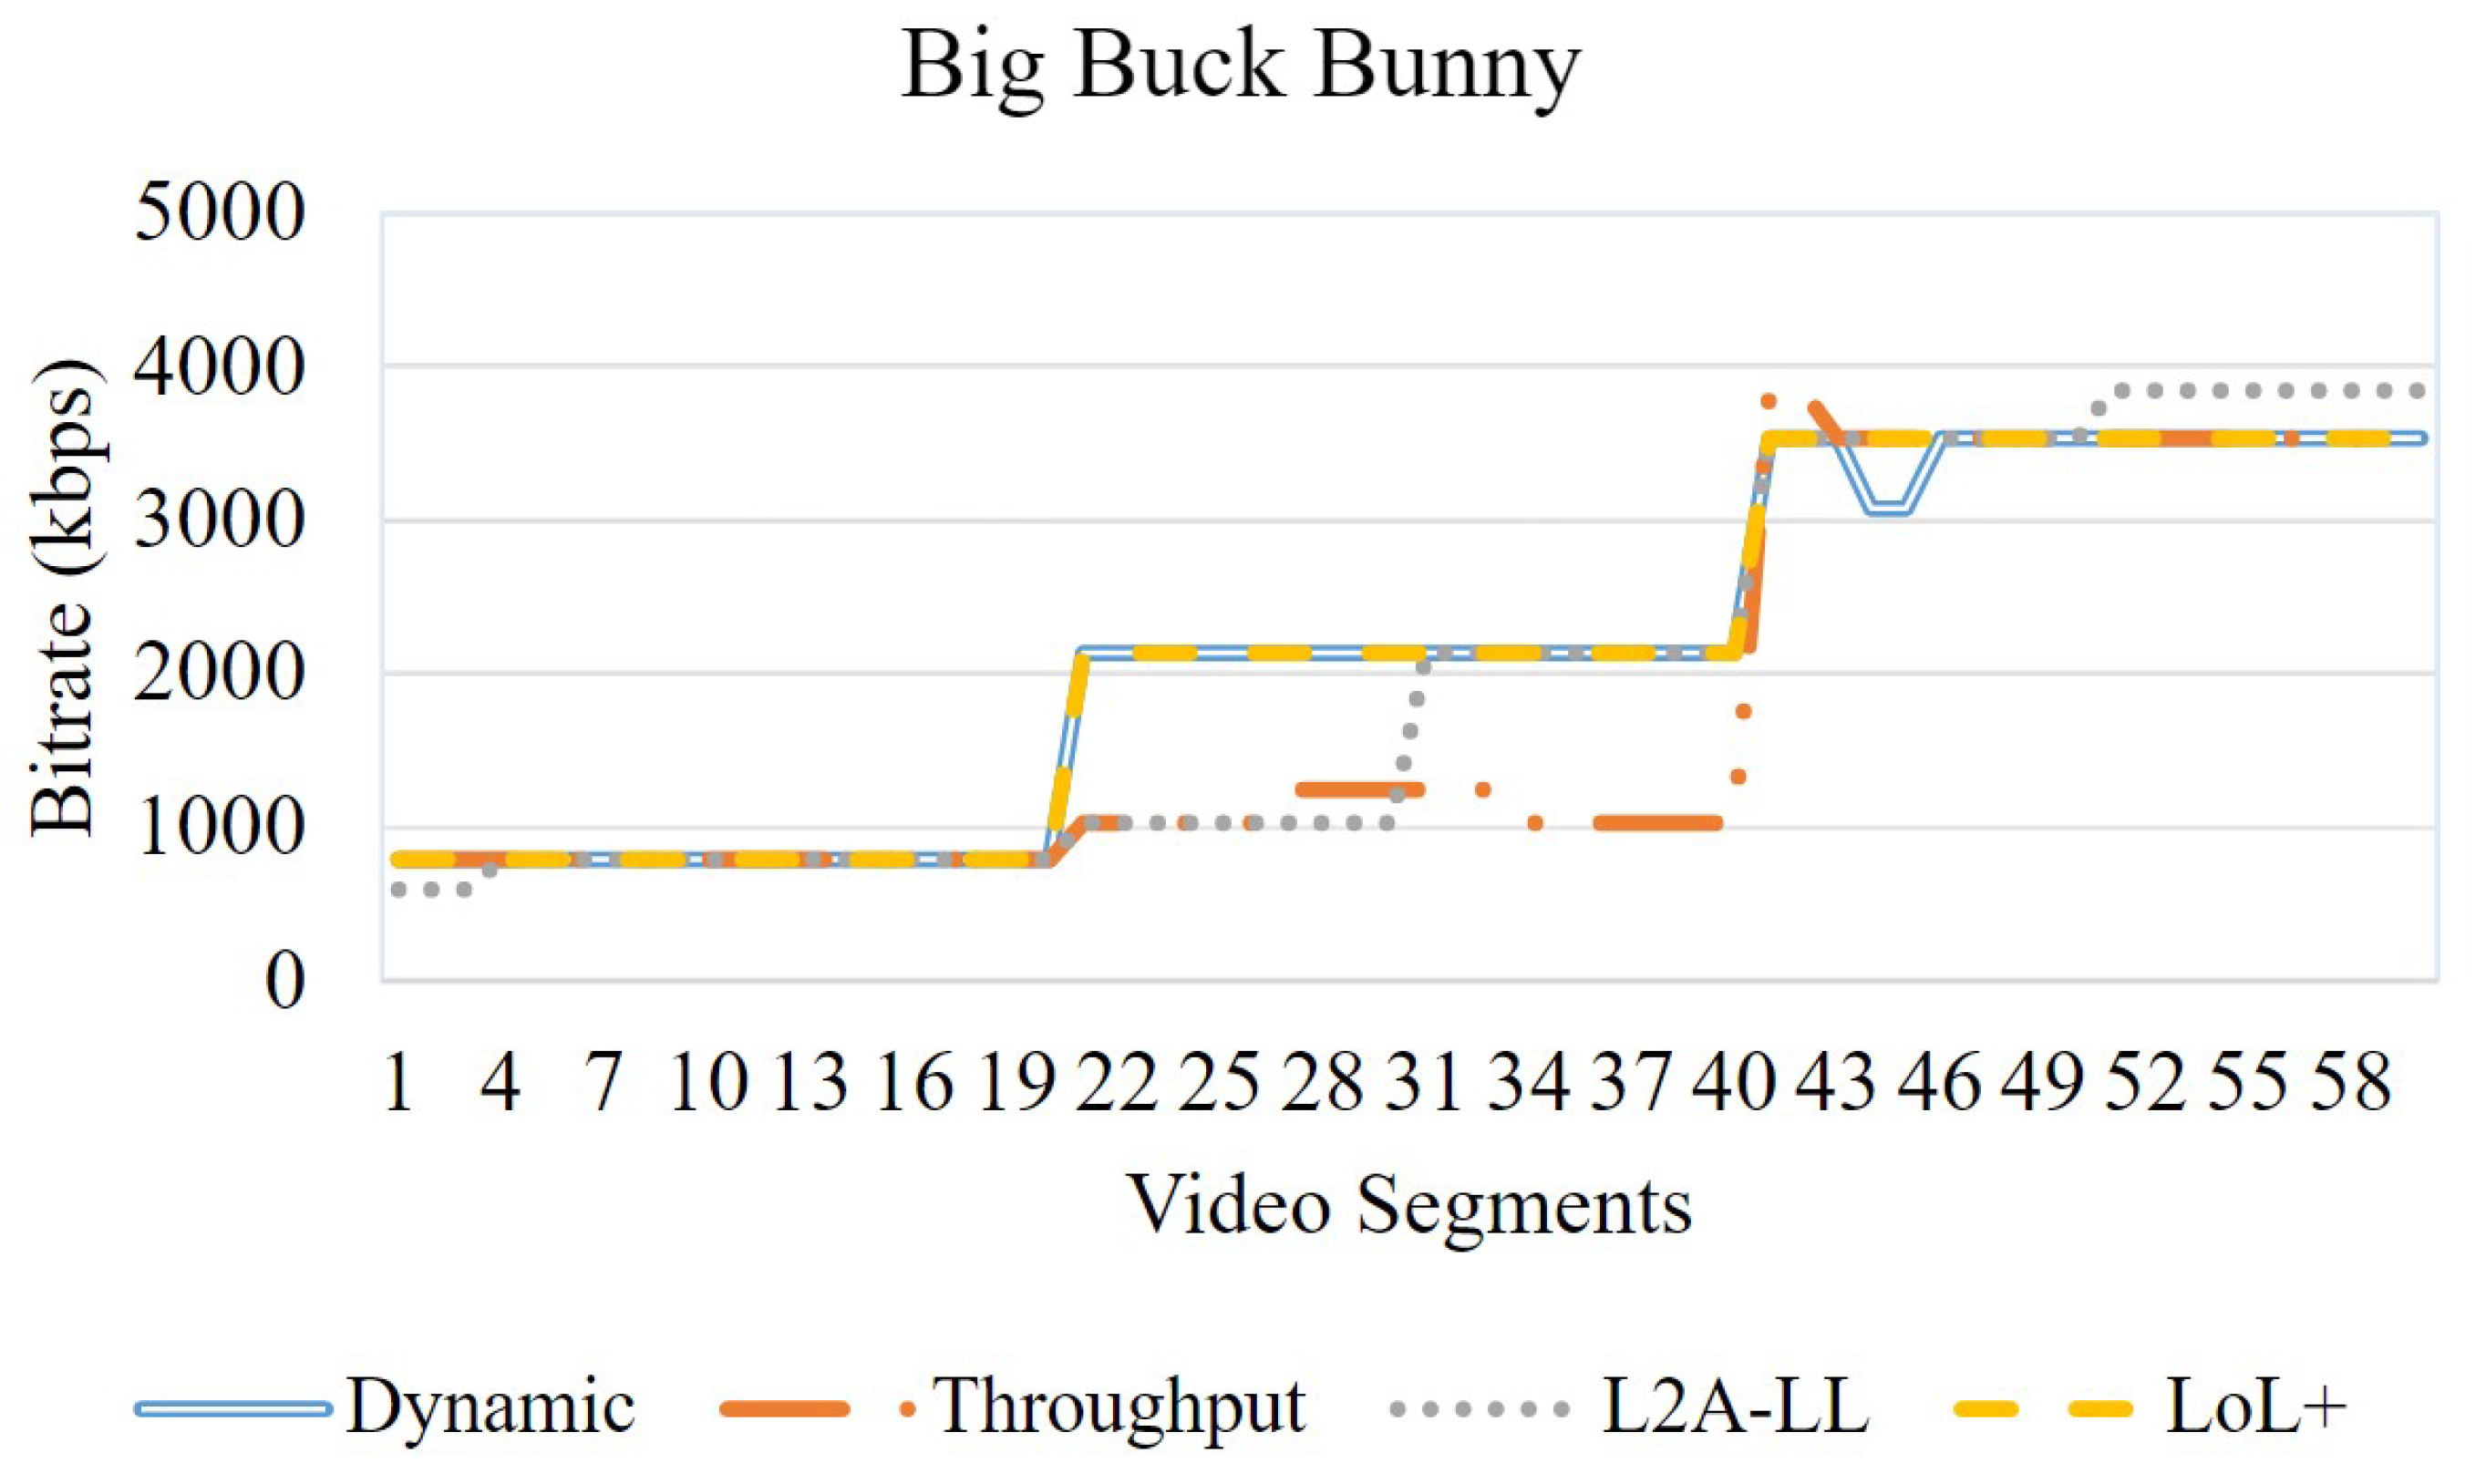
Figure 5.
Bitrate analysis—Elephant Dream.
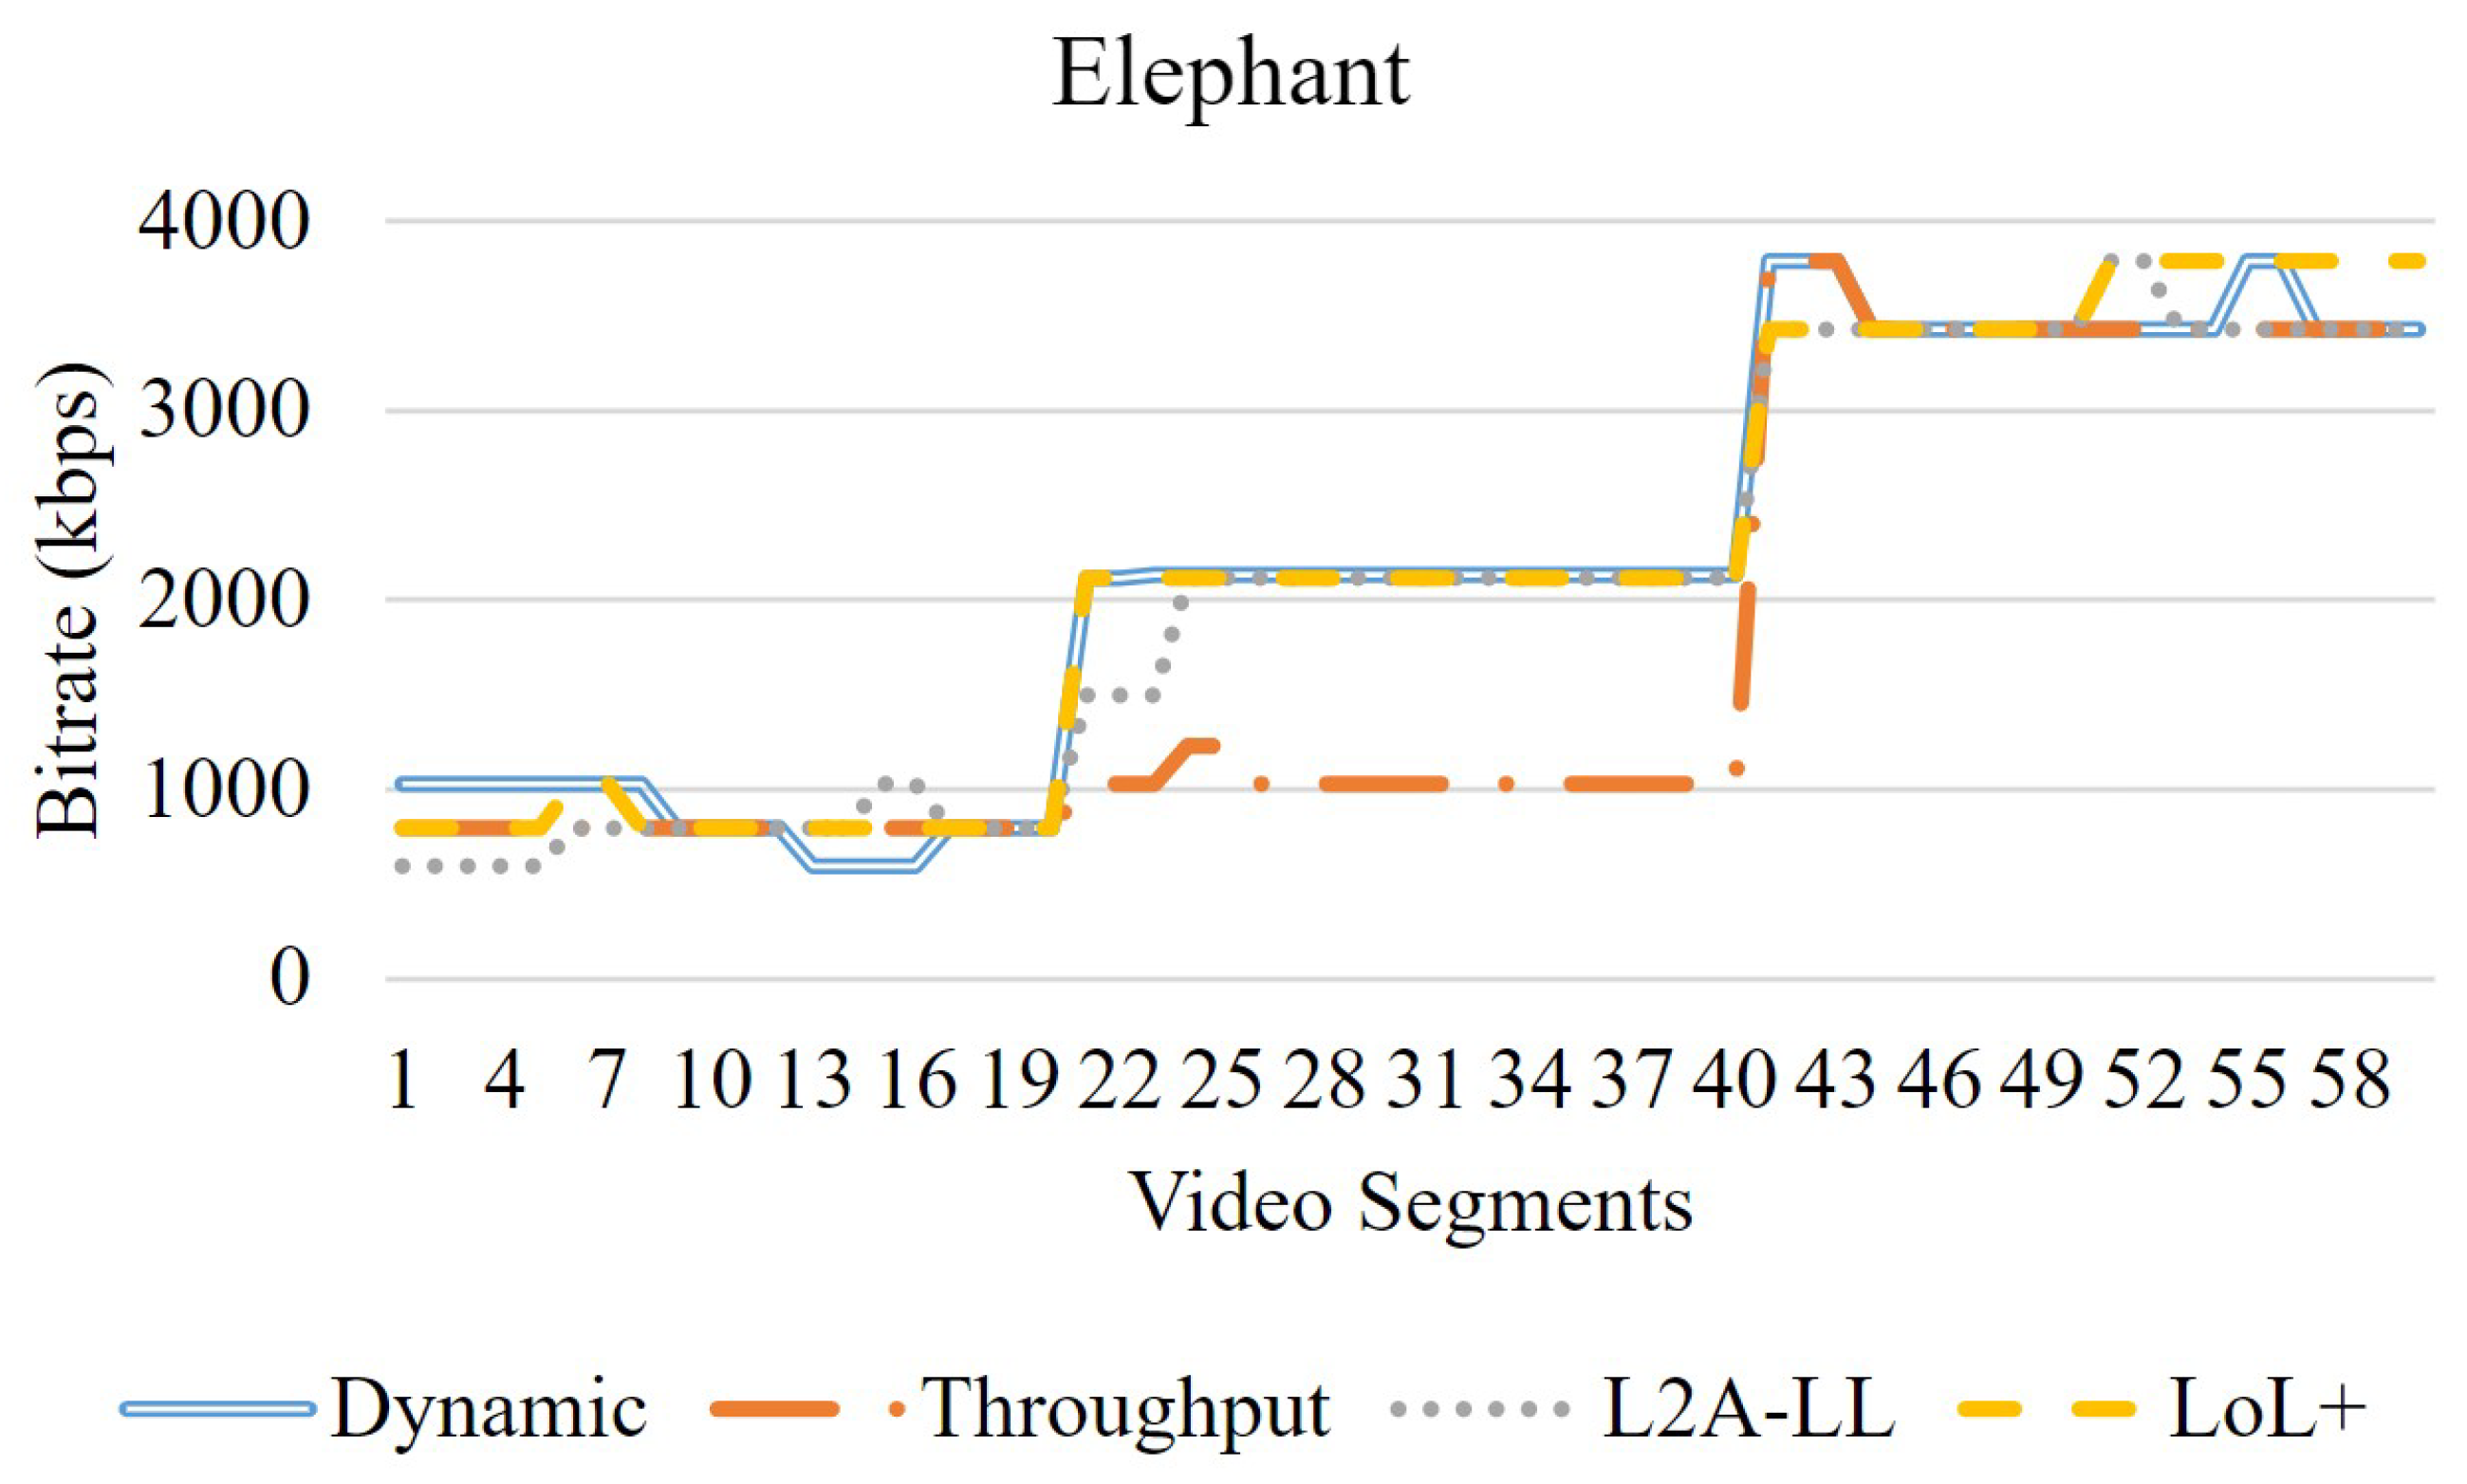
Figure 6.
Bitrate analysis—Tears of Steel.
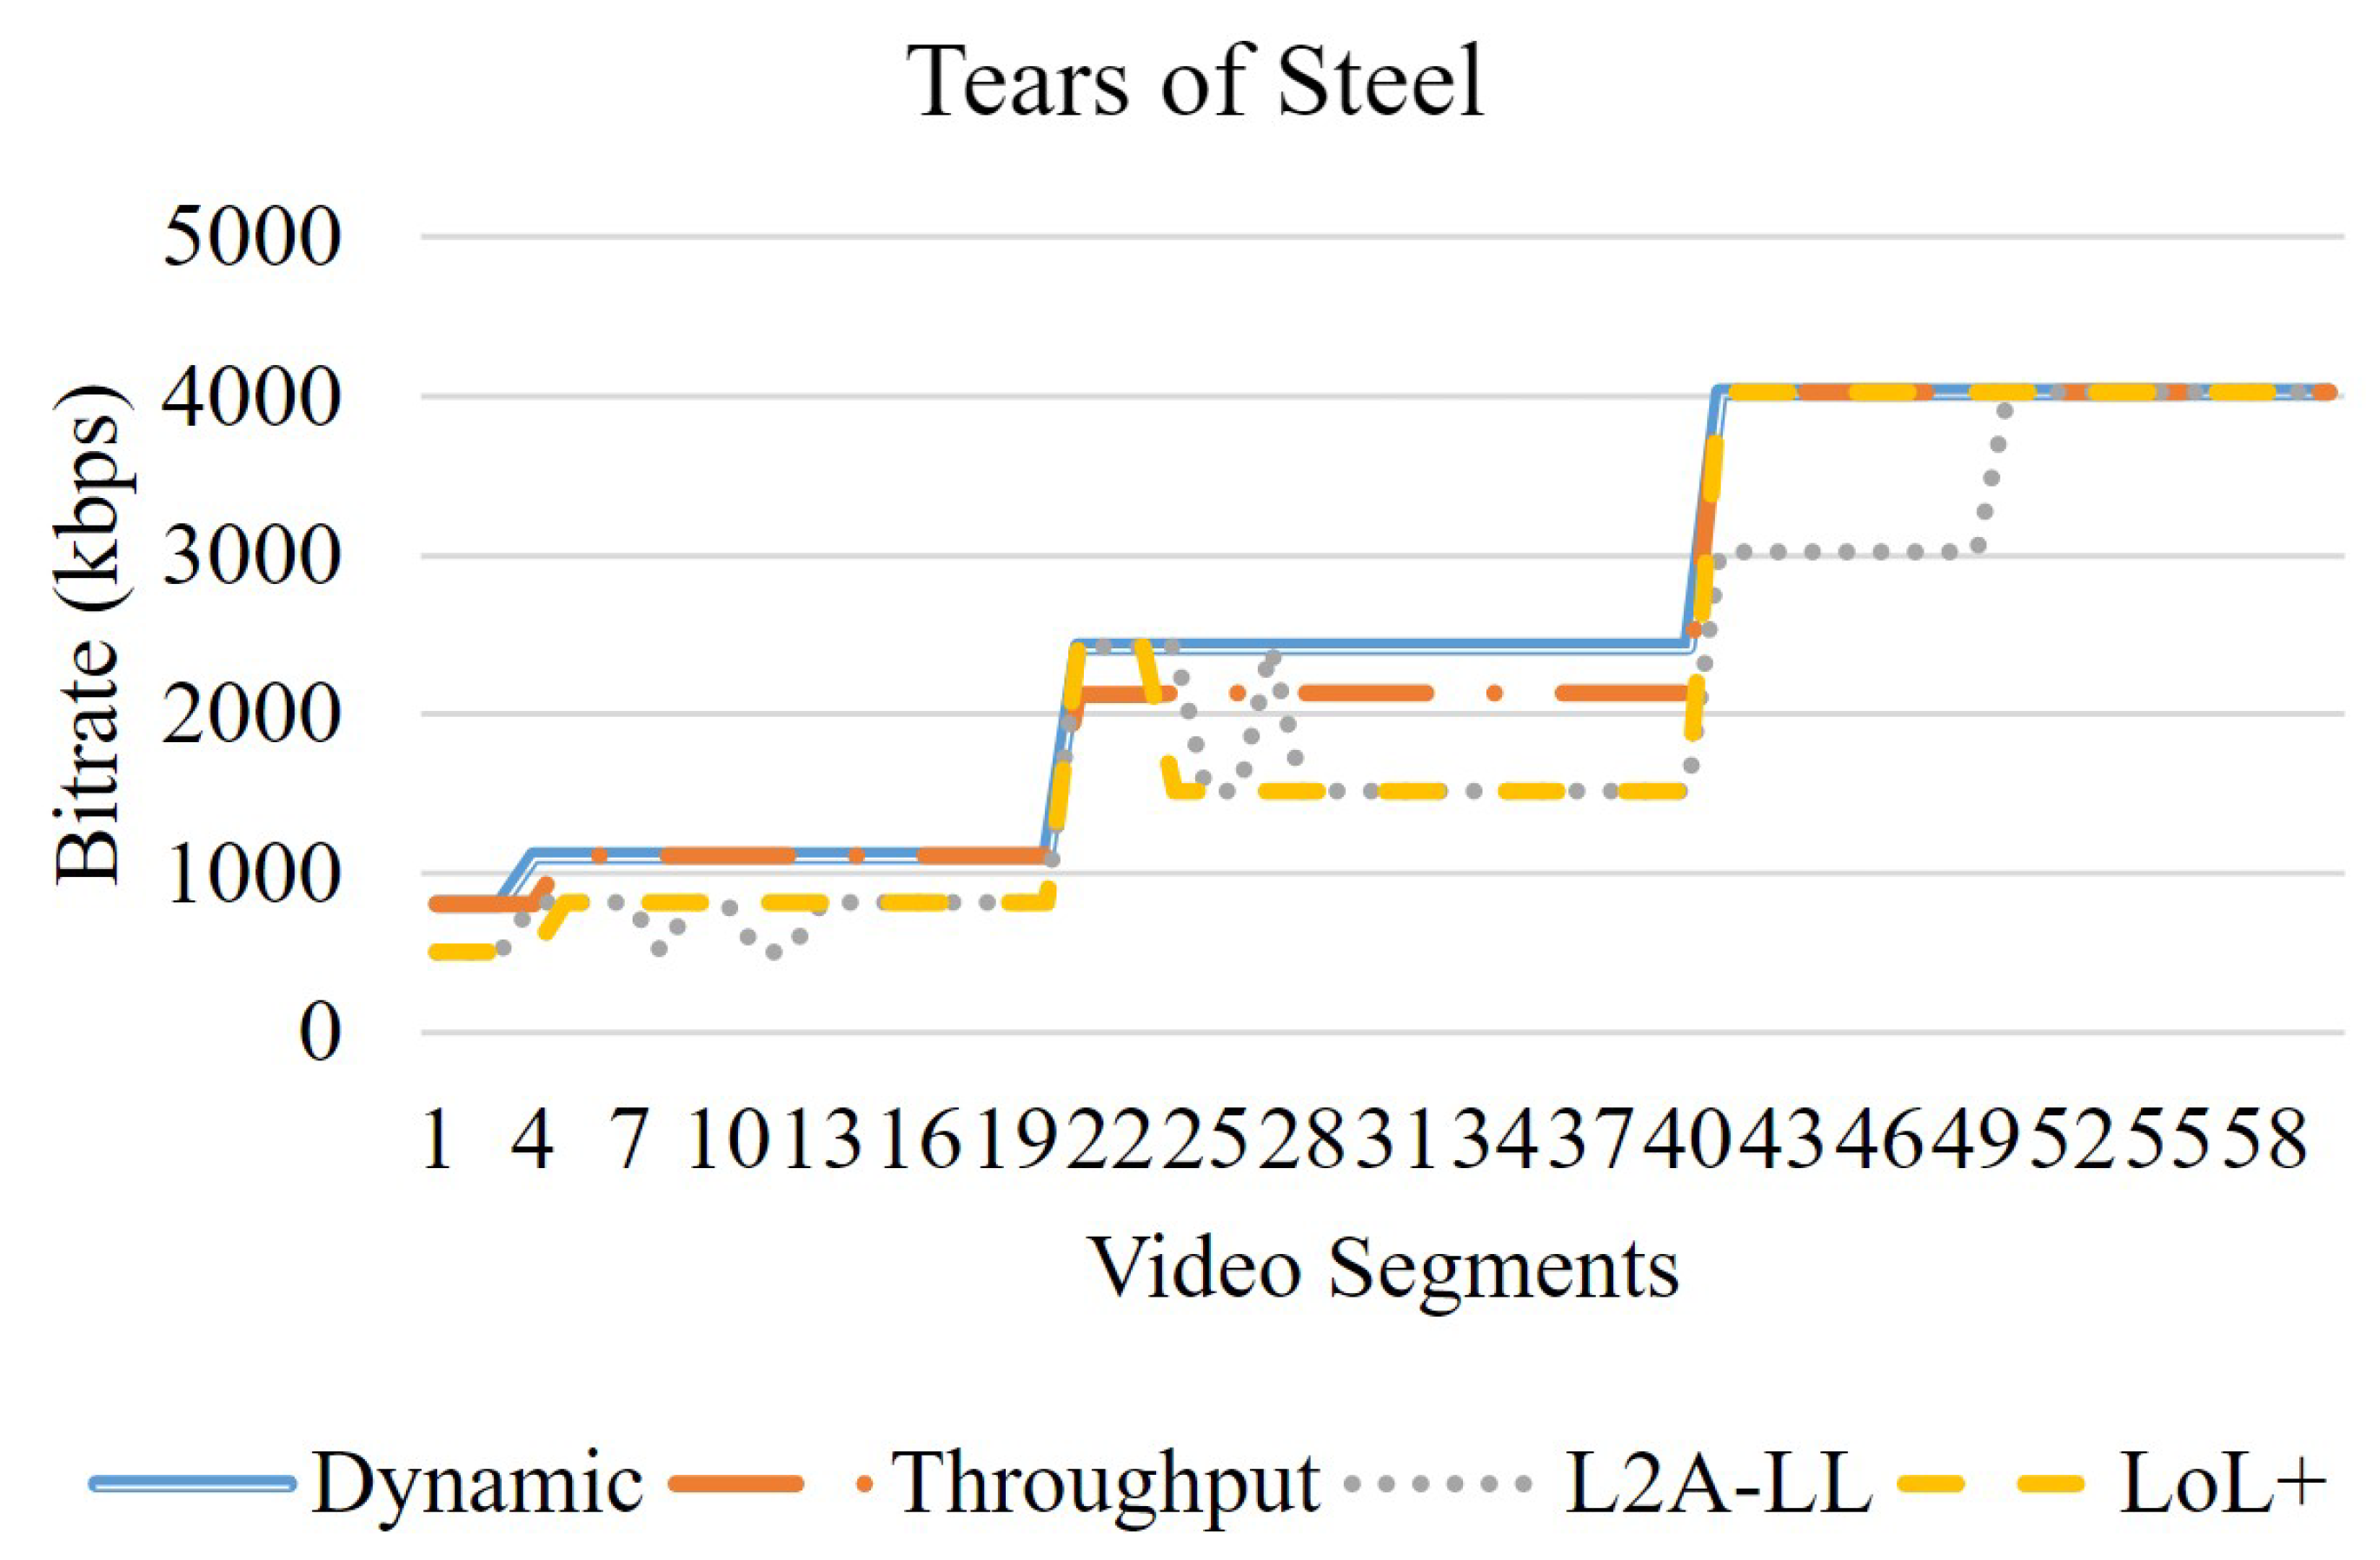
Figure 7.
Bitrate analysis—Sparks.
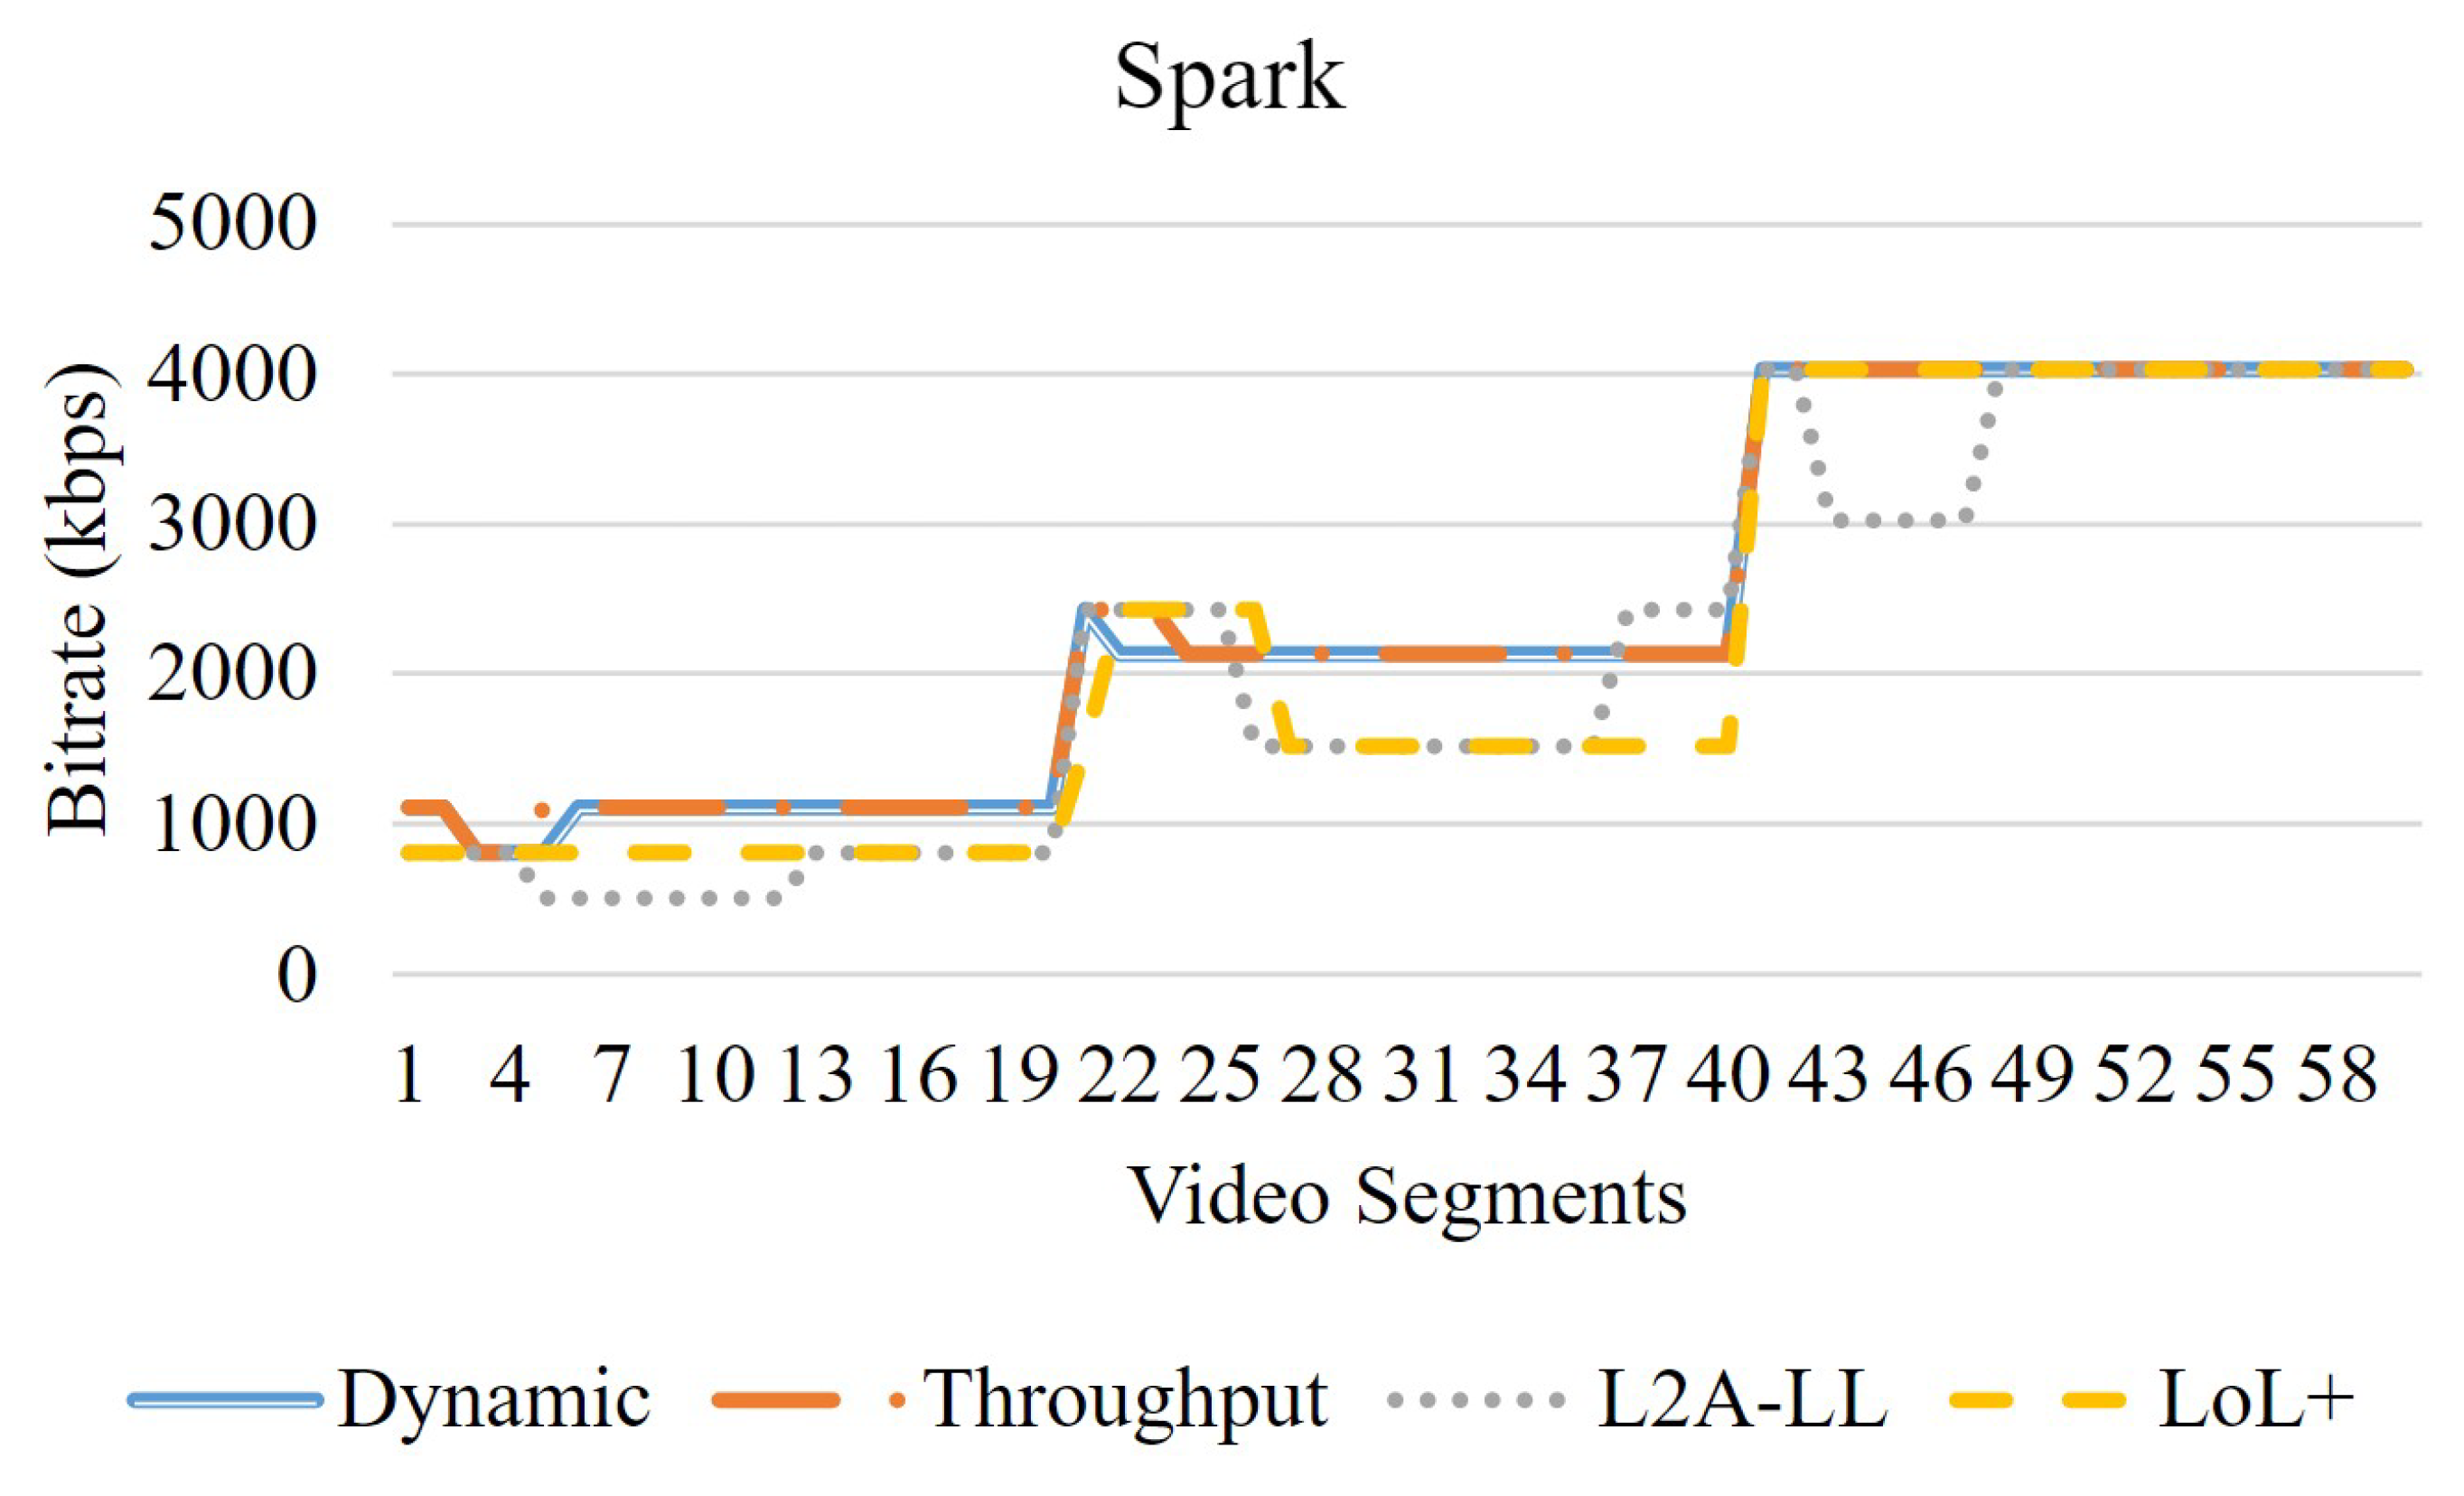
Figure 8.
Average video bitrates achieved by the algorithm under network profile 1.
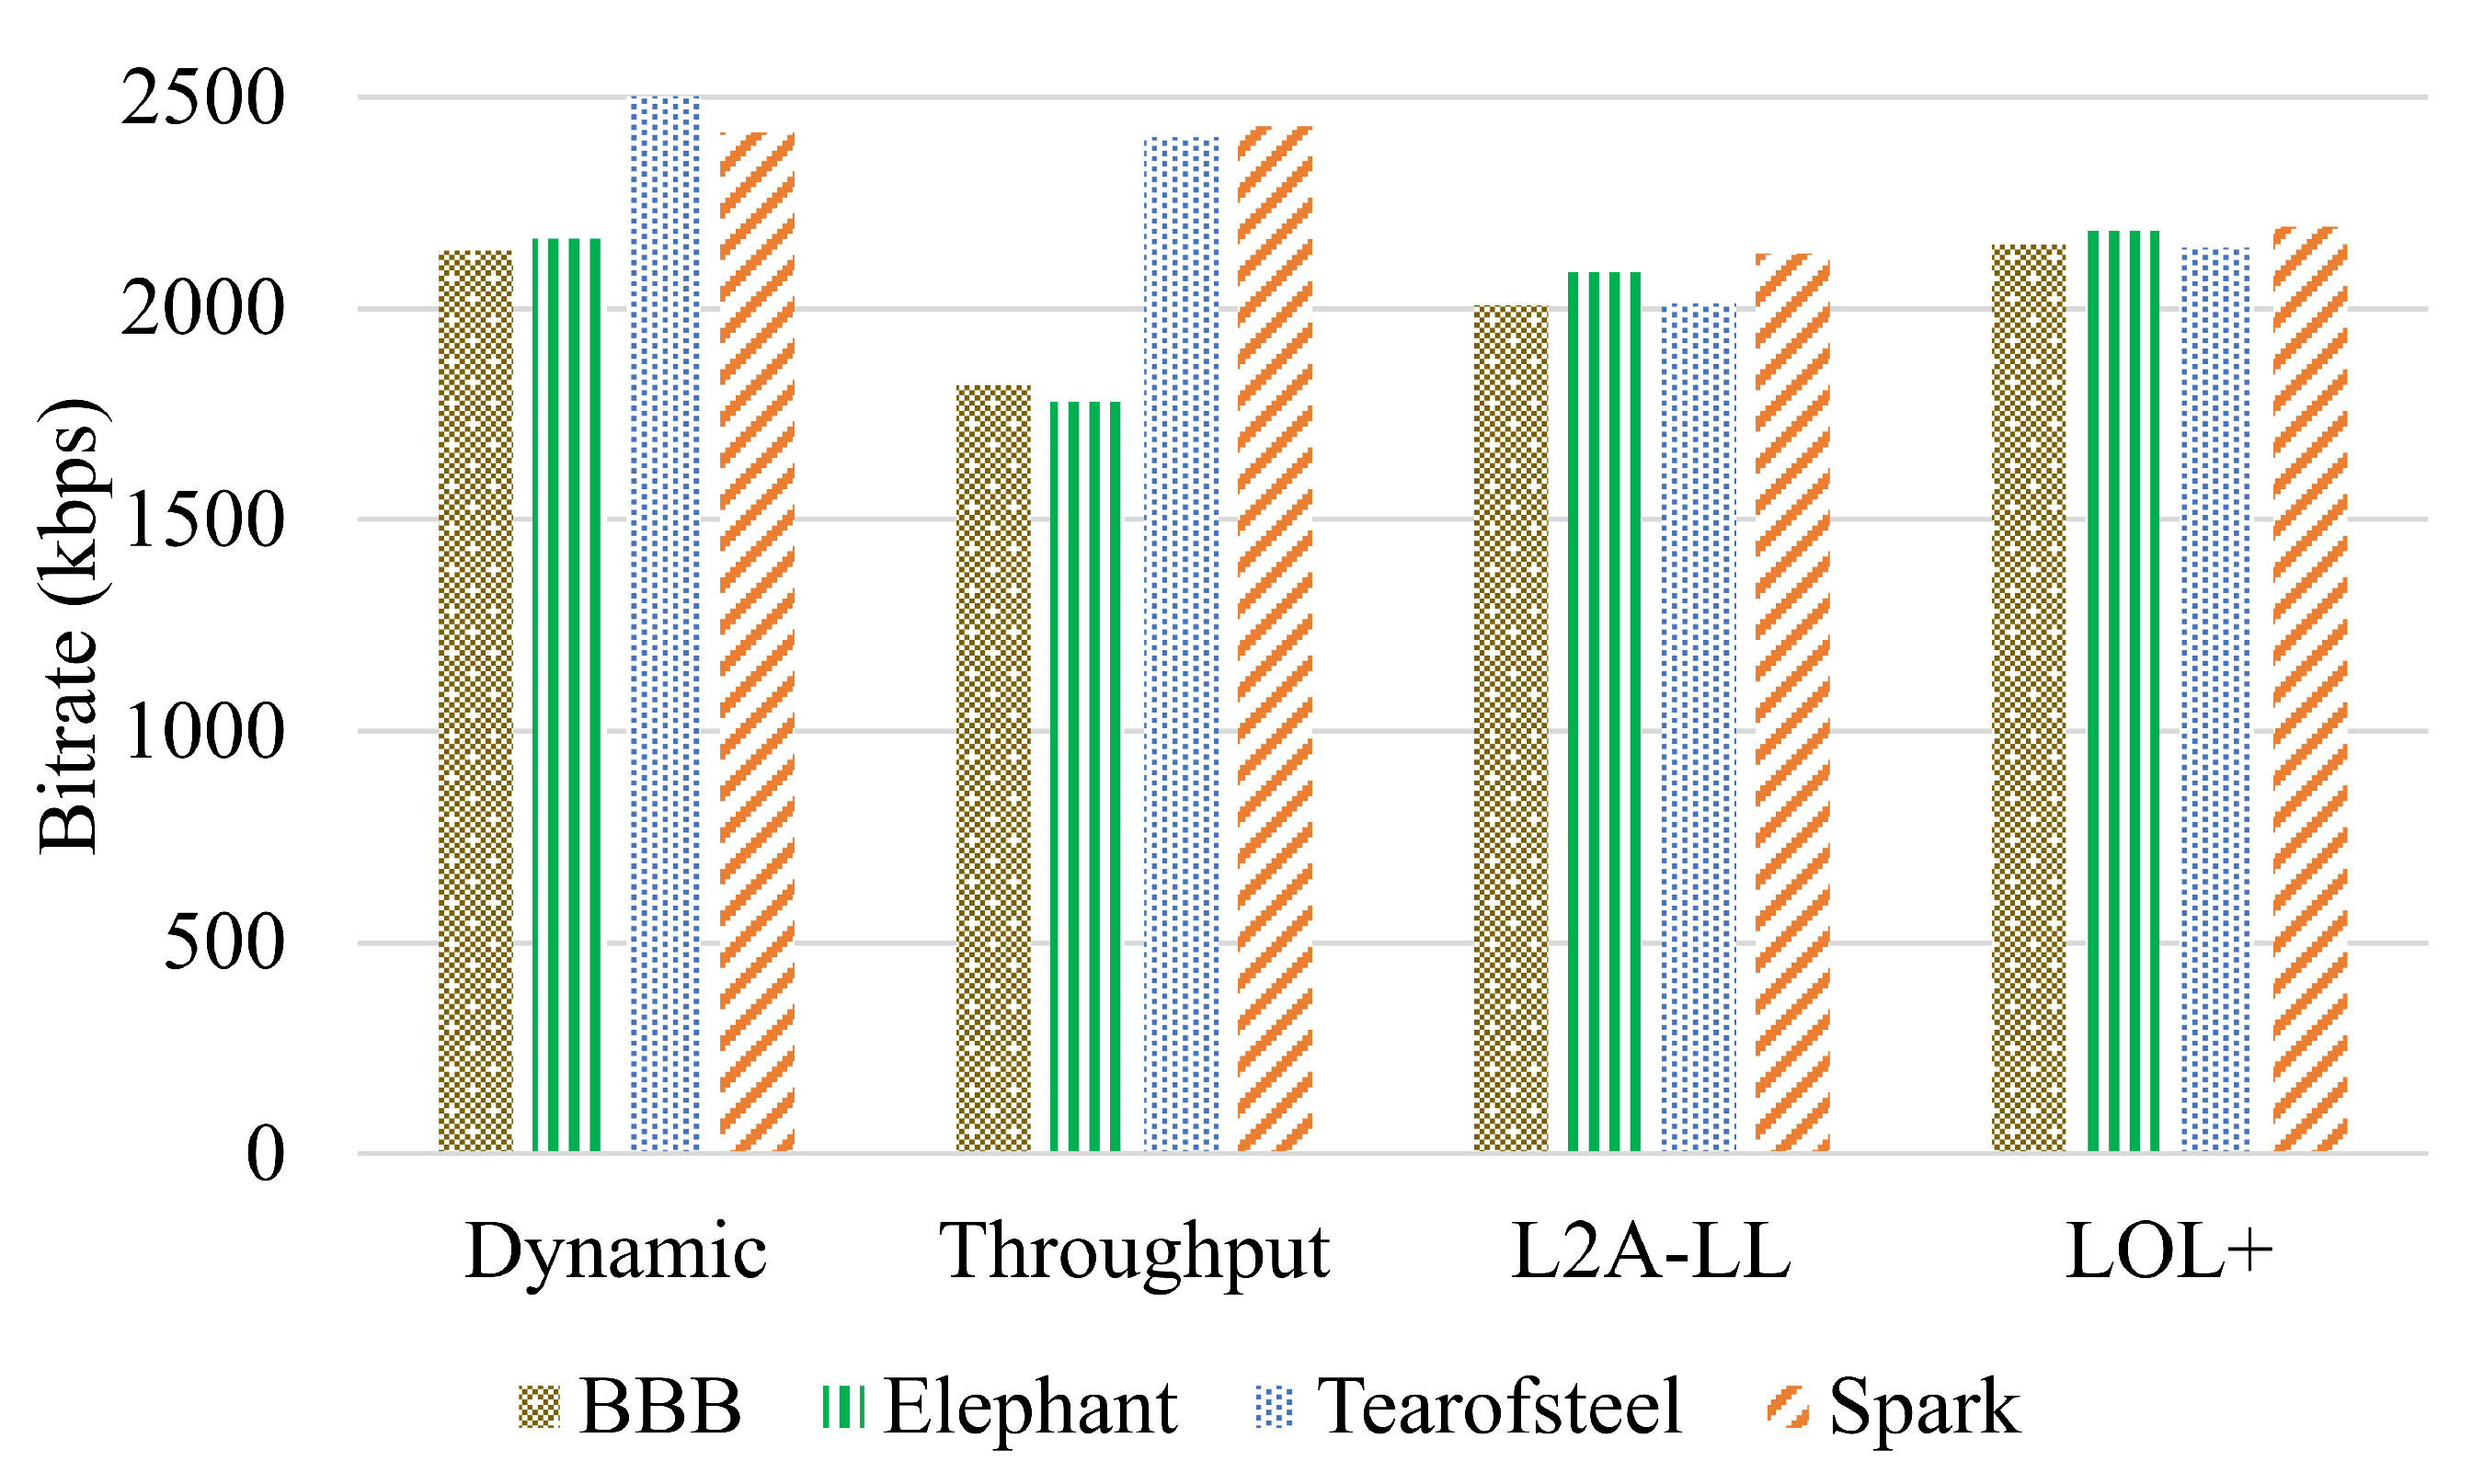
Figure 9.
Number of switches experienced by the algorithms under network profile 1.
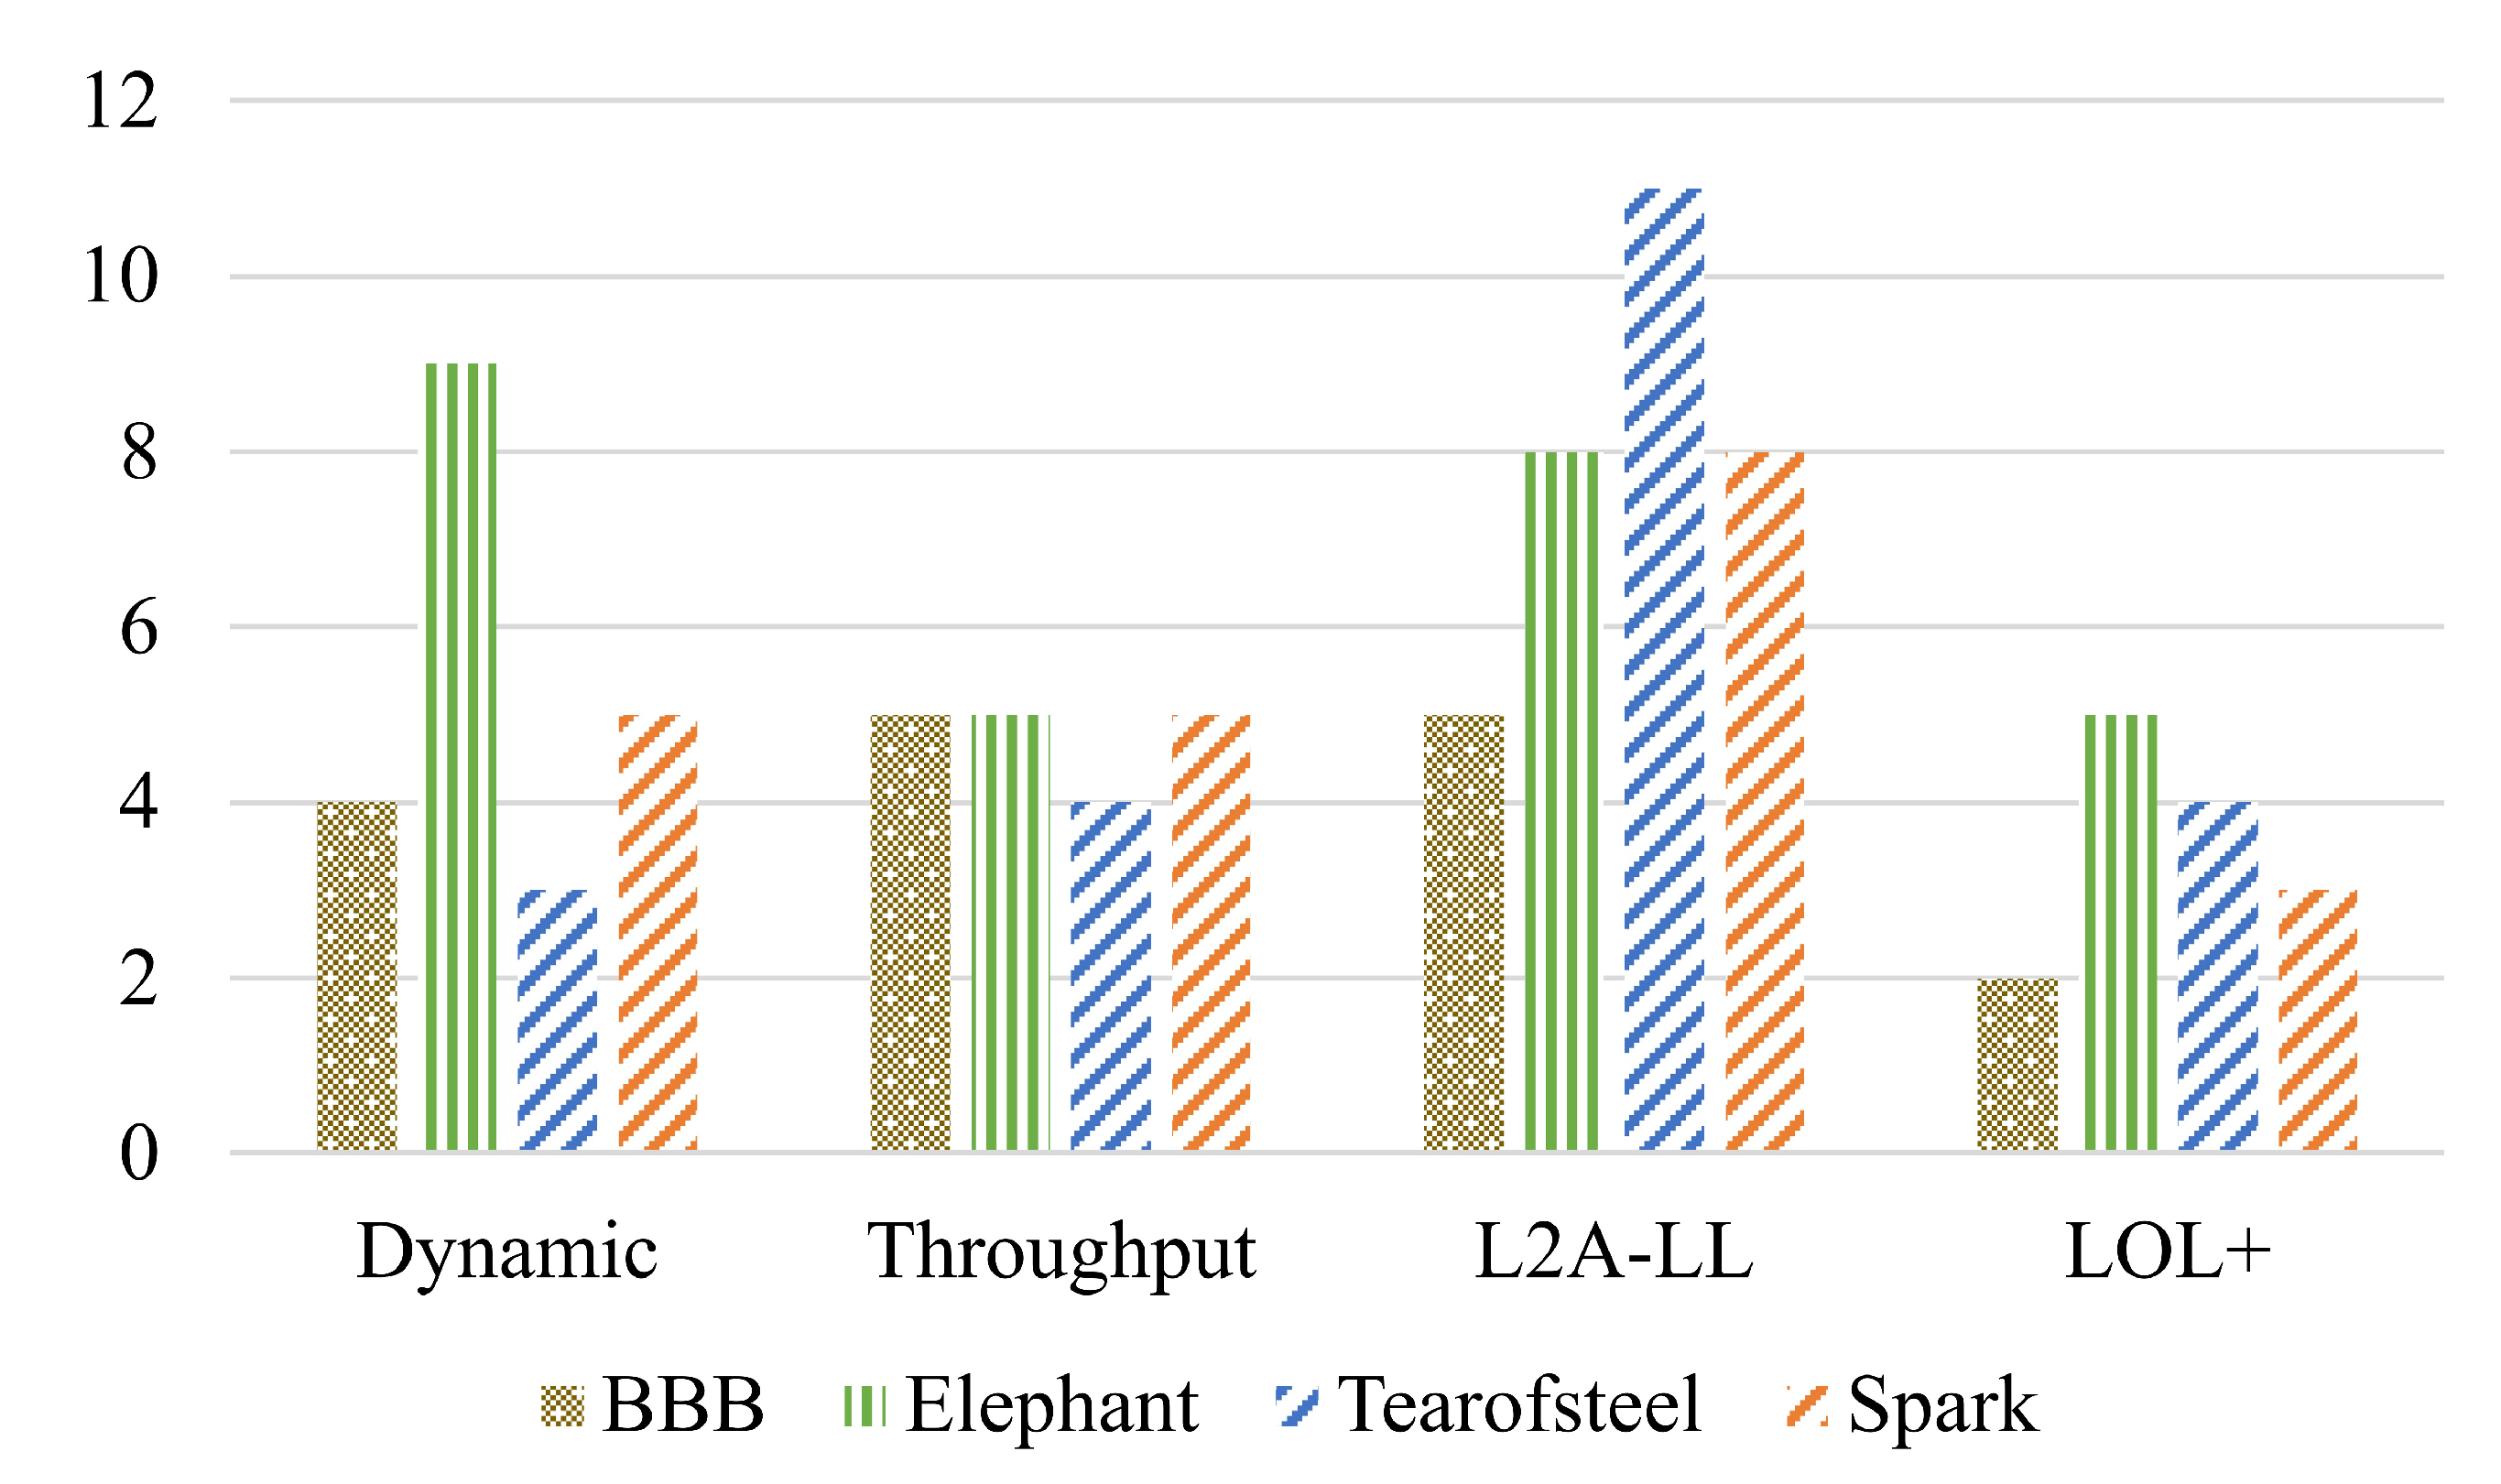
Figure 10.
Participant Demographic Information.
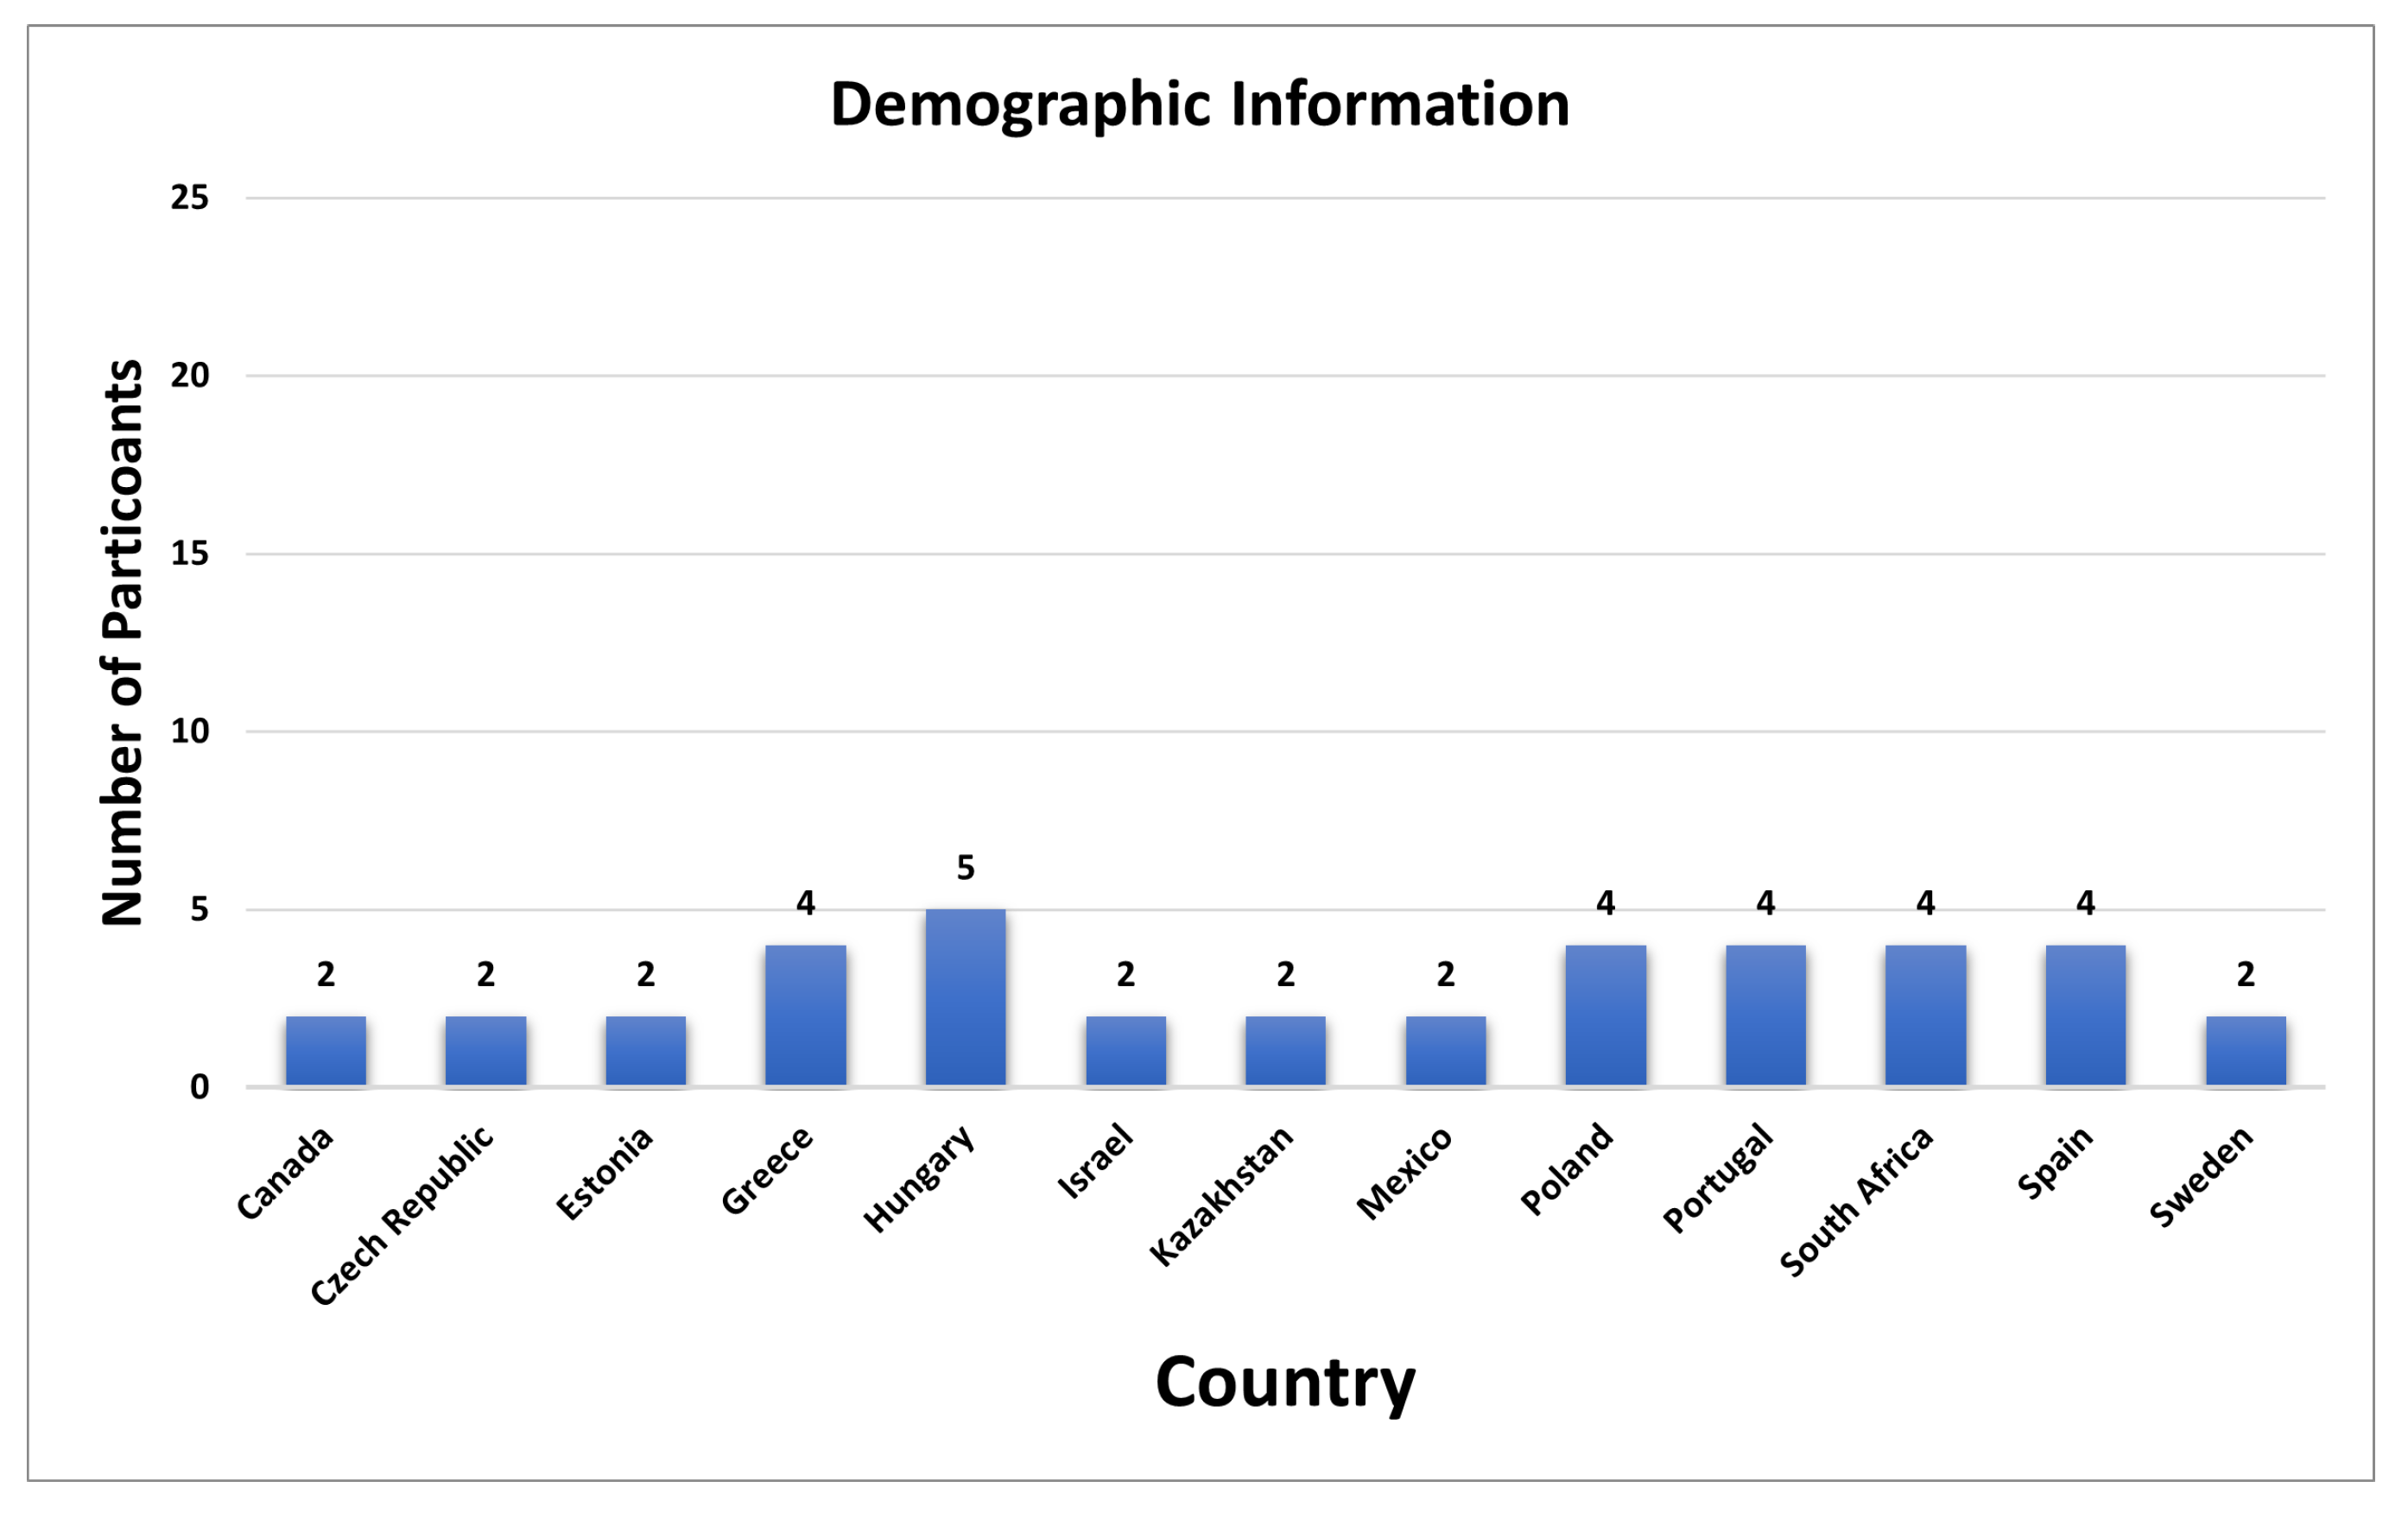
Figure 11.
Mean opion scores of HAS Algorithms.
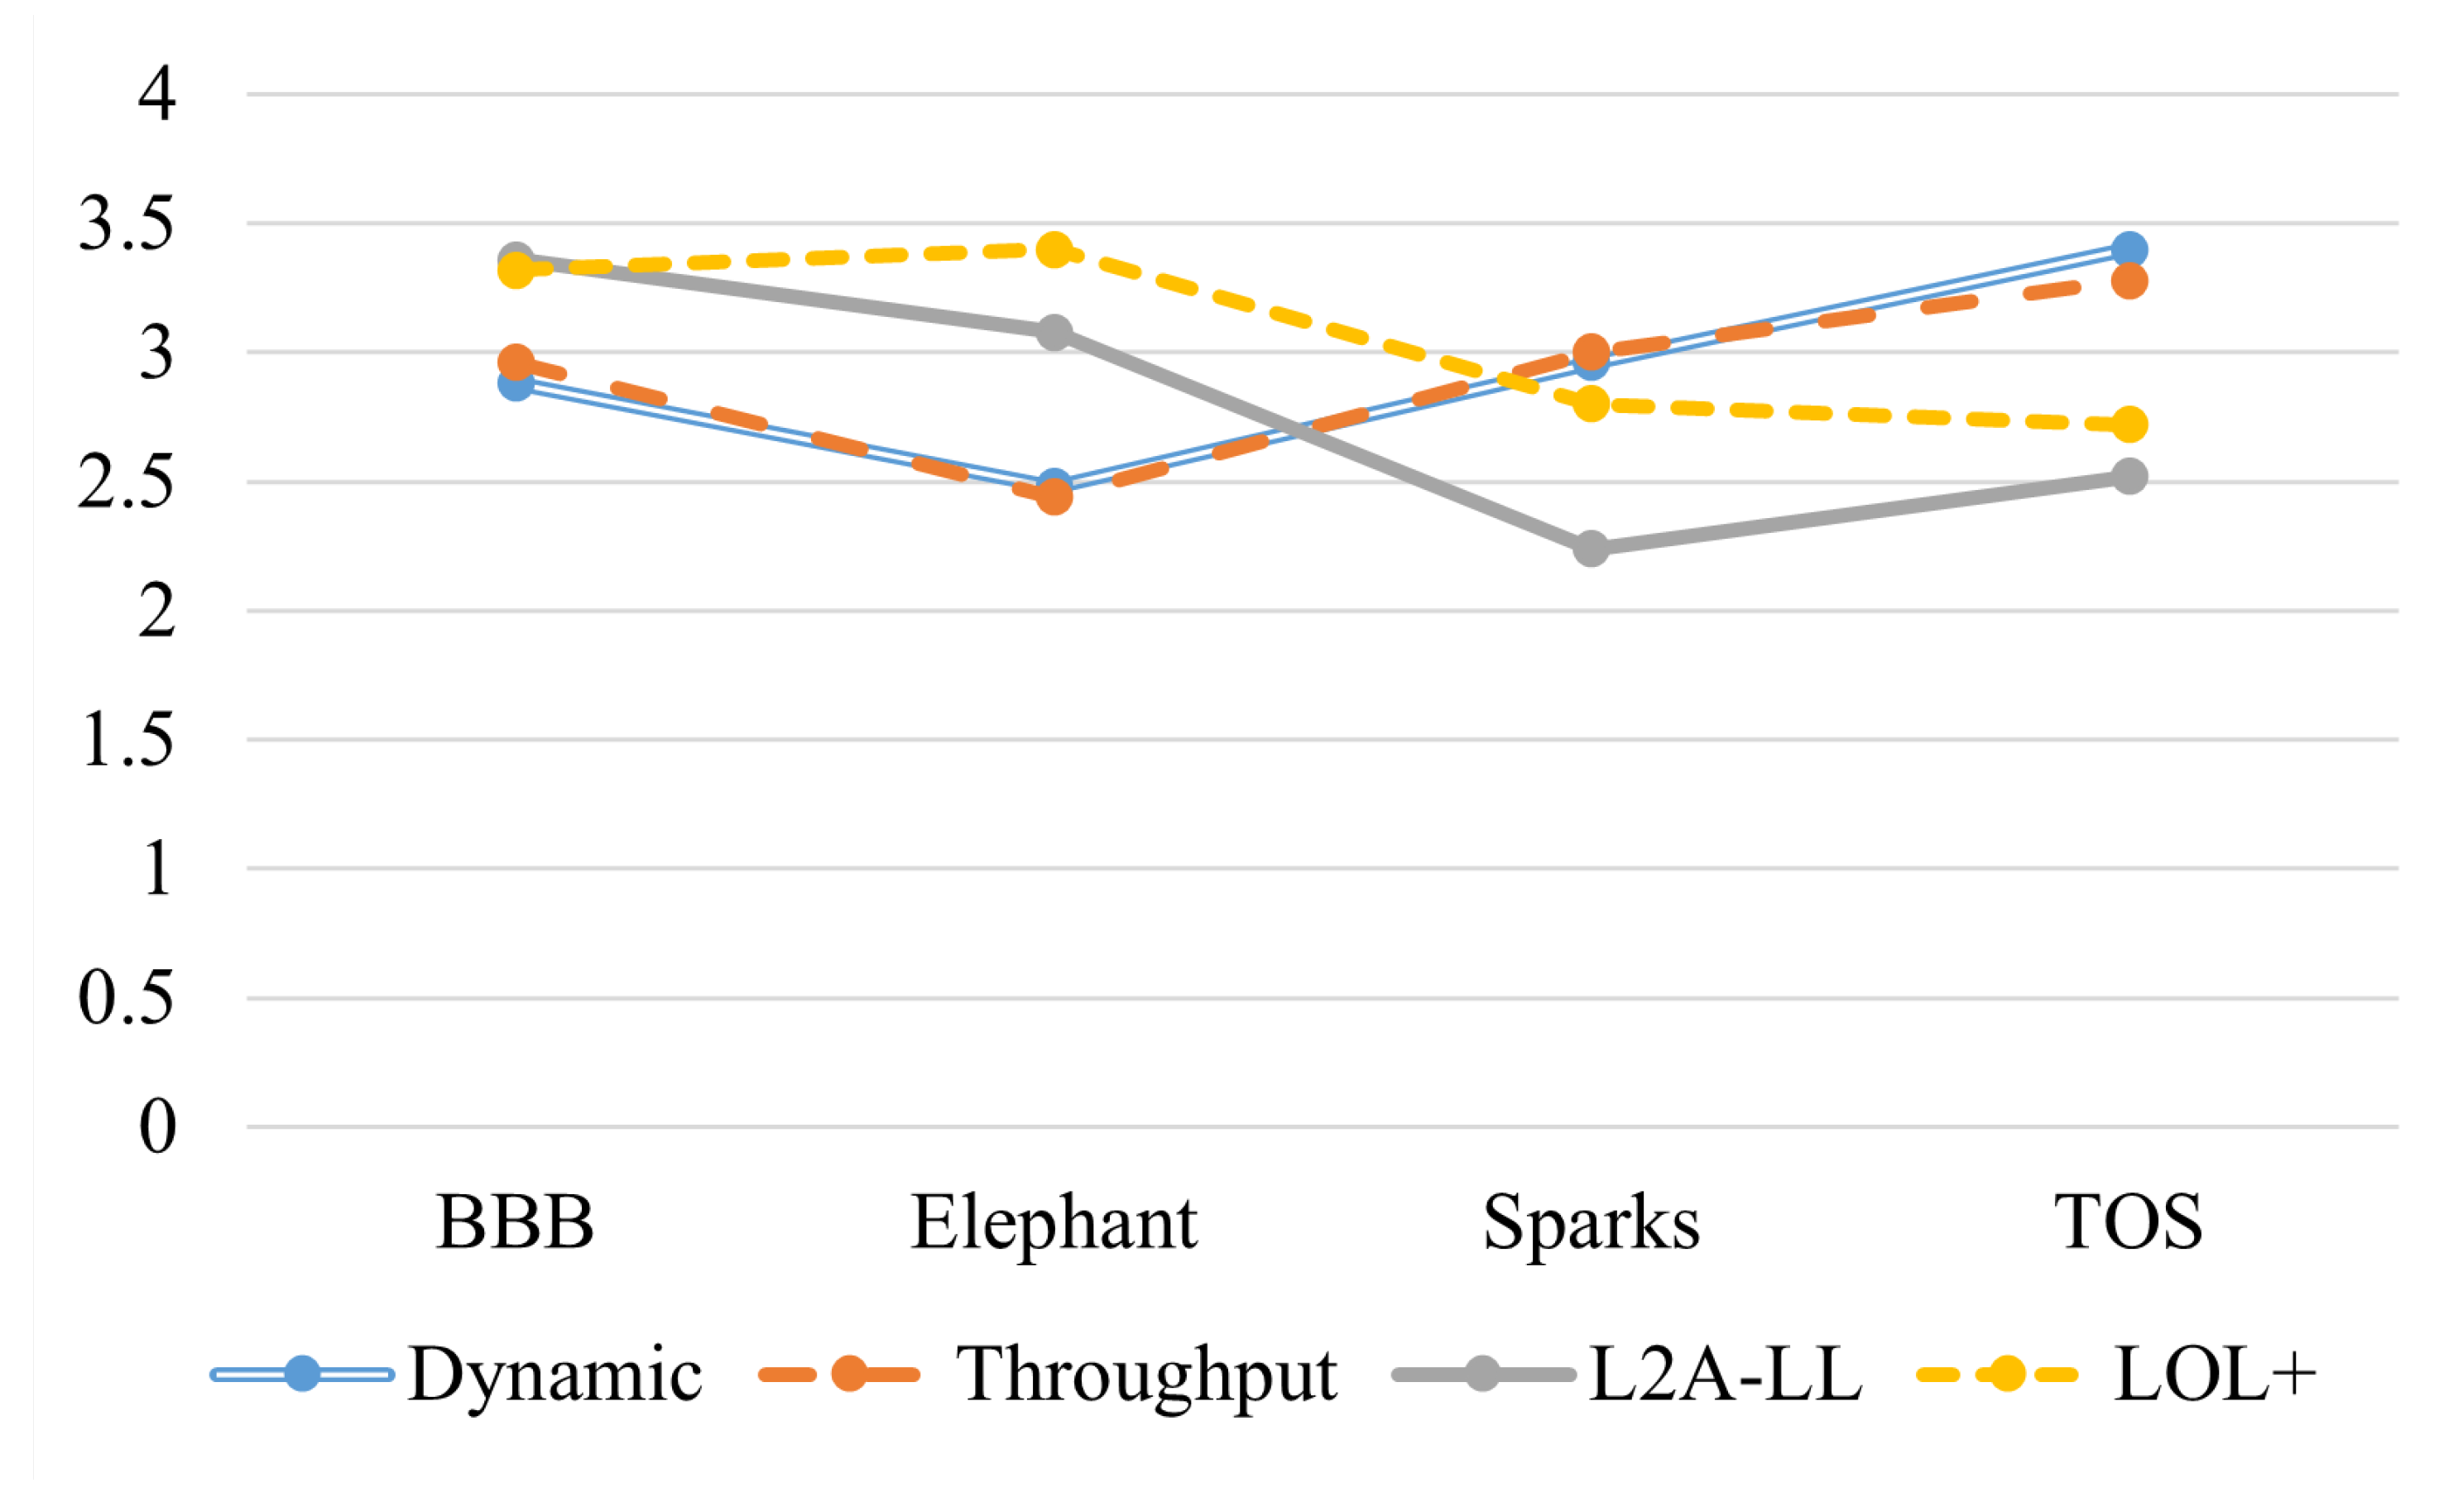
Figure 13.
HAS ABR Algorithms (Dynamic and Throughput) Comparison Scatterplot.
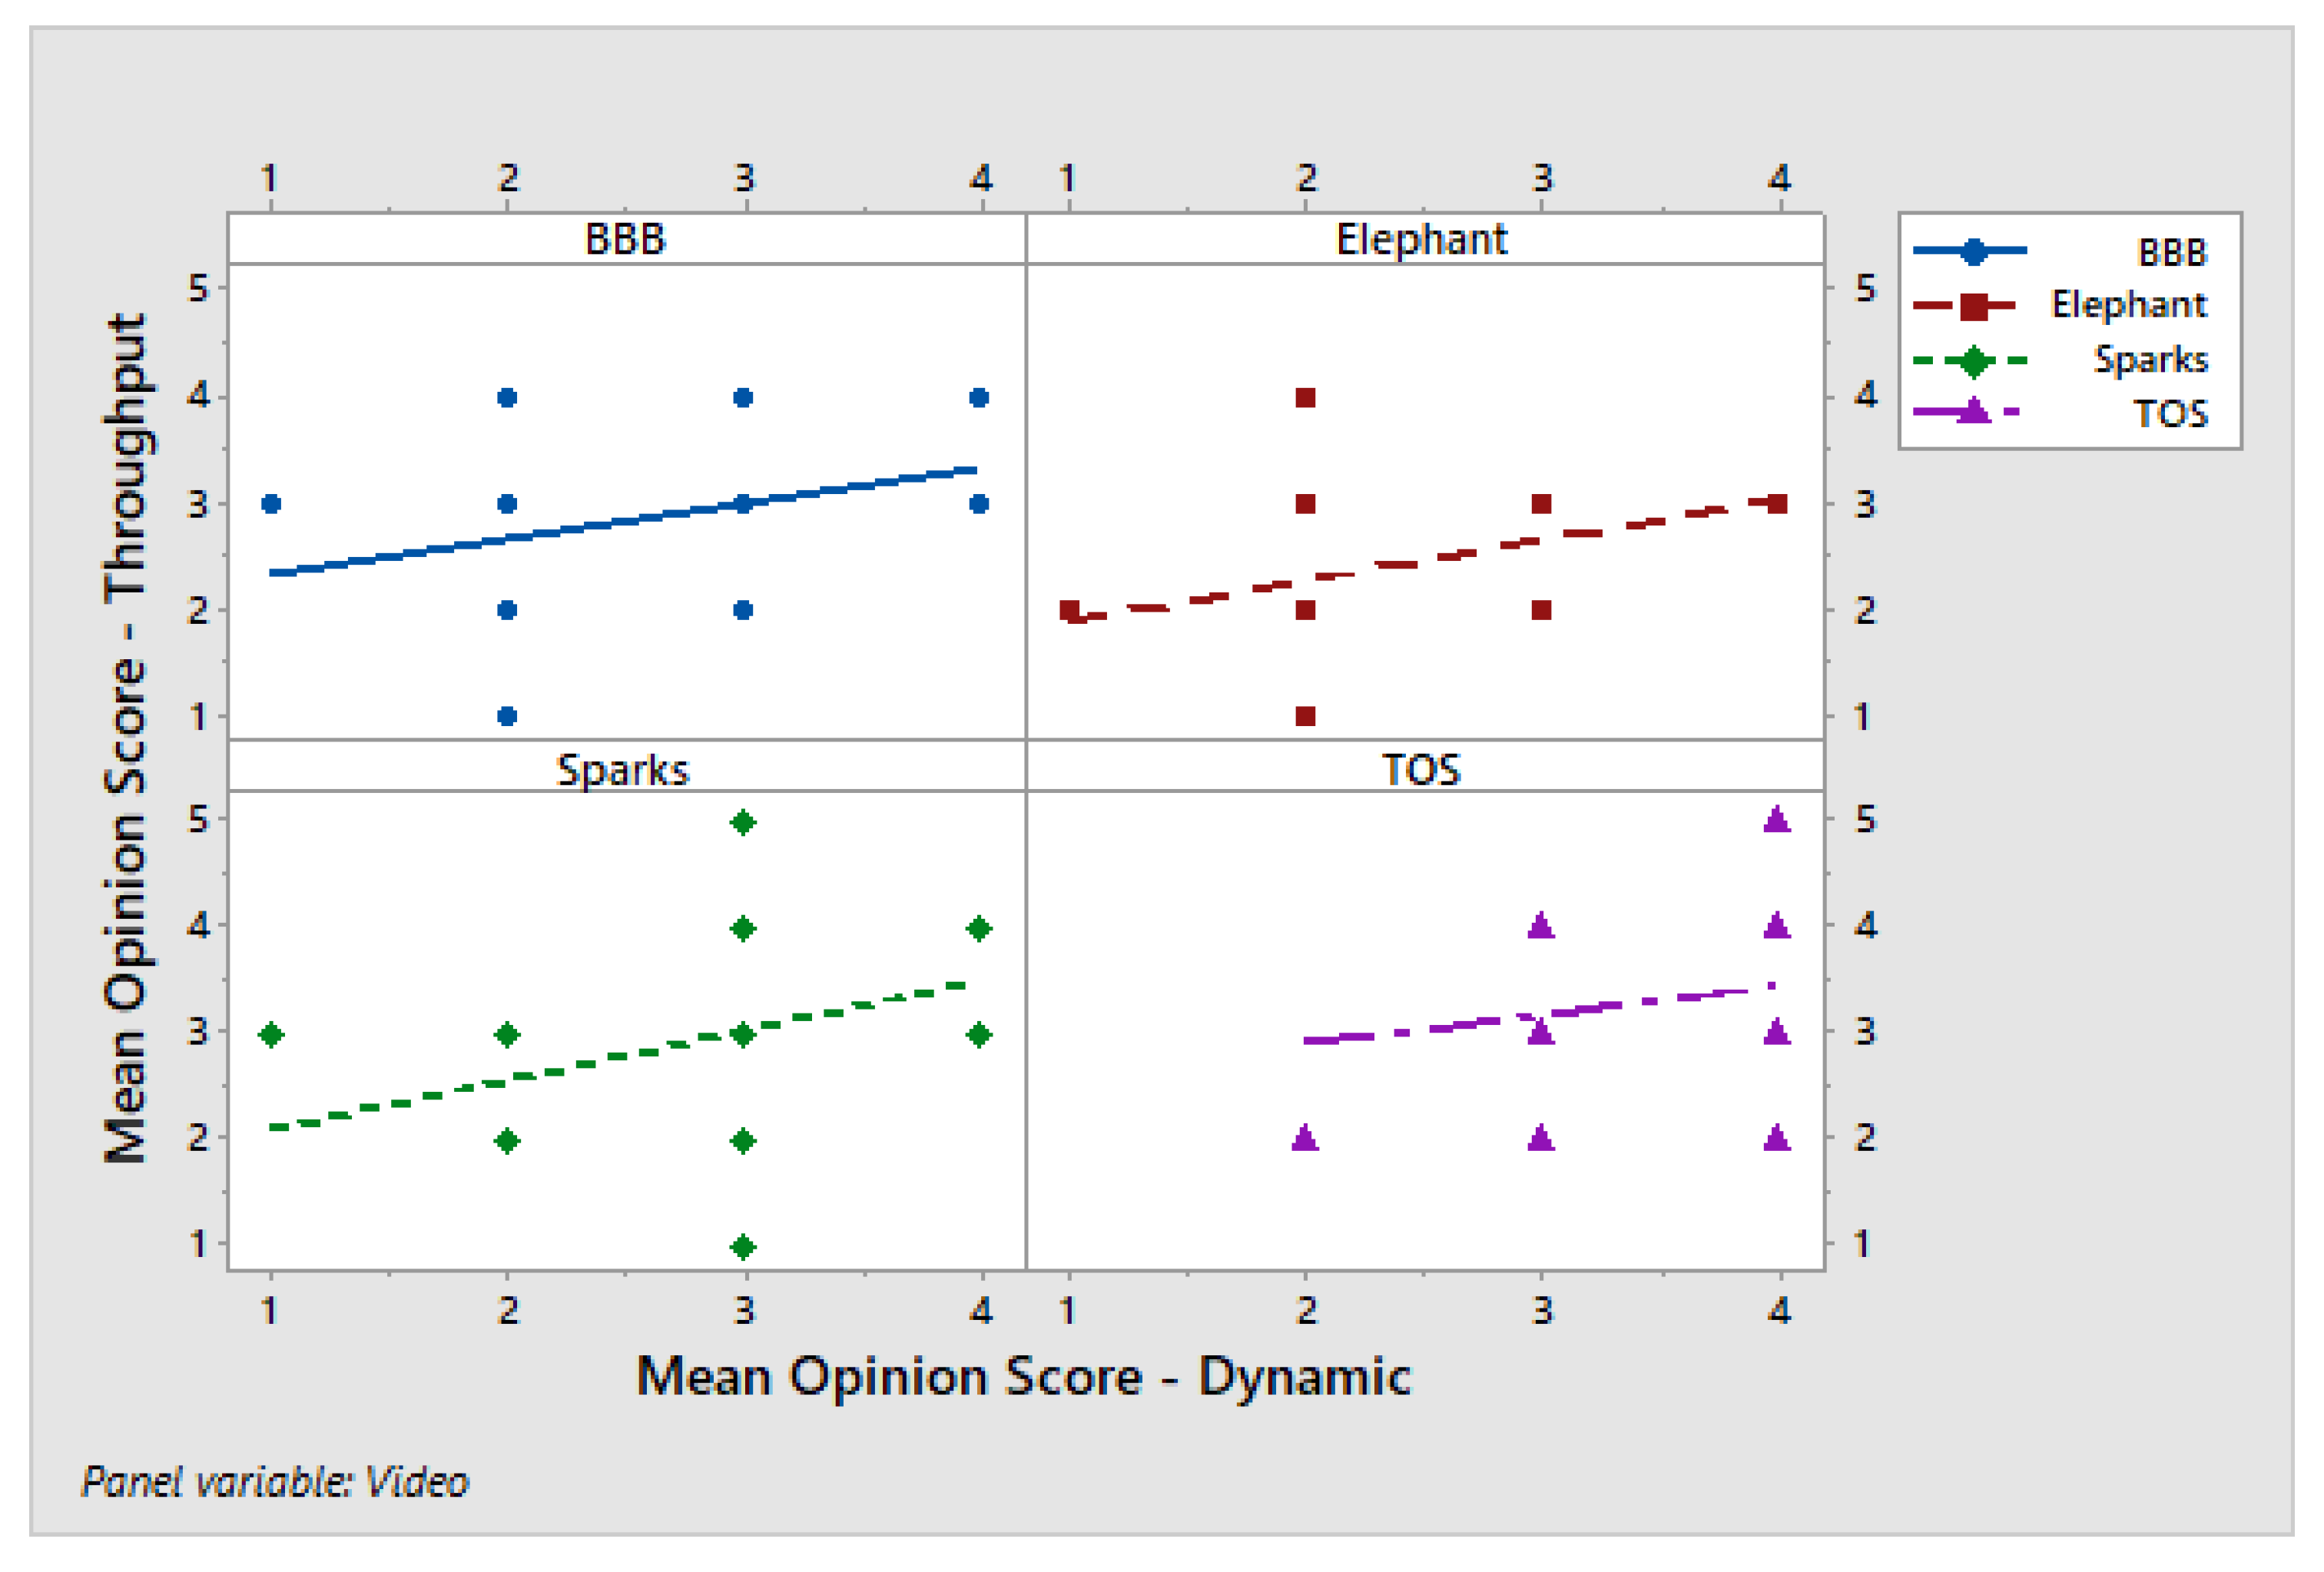
Figure 14.
Low-latency ABR Algorithms (L2A-LL and LOL Comparison Scatterplot.
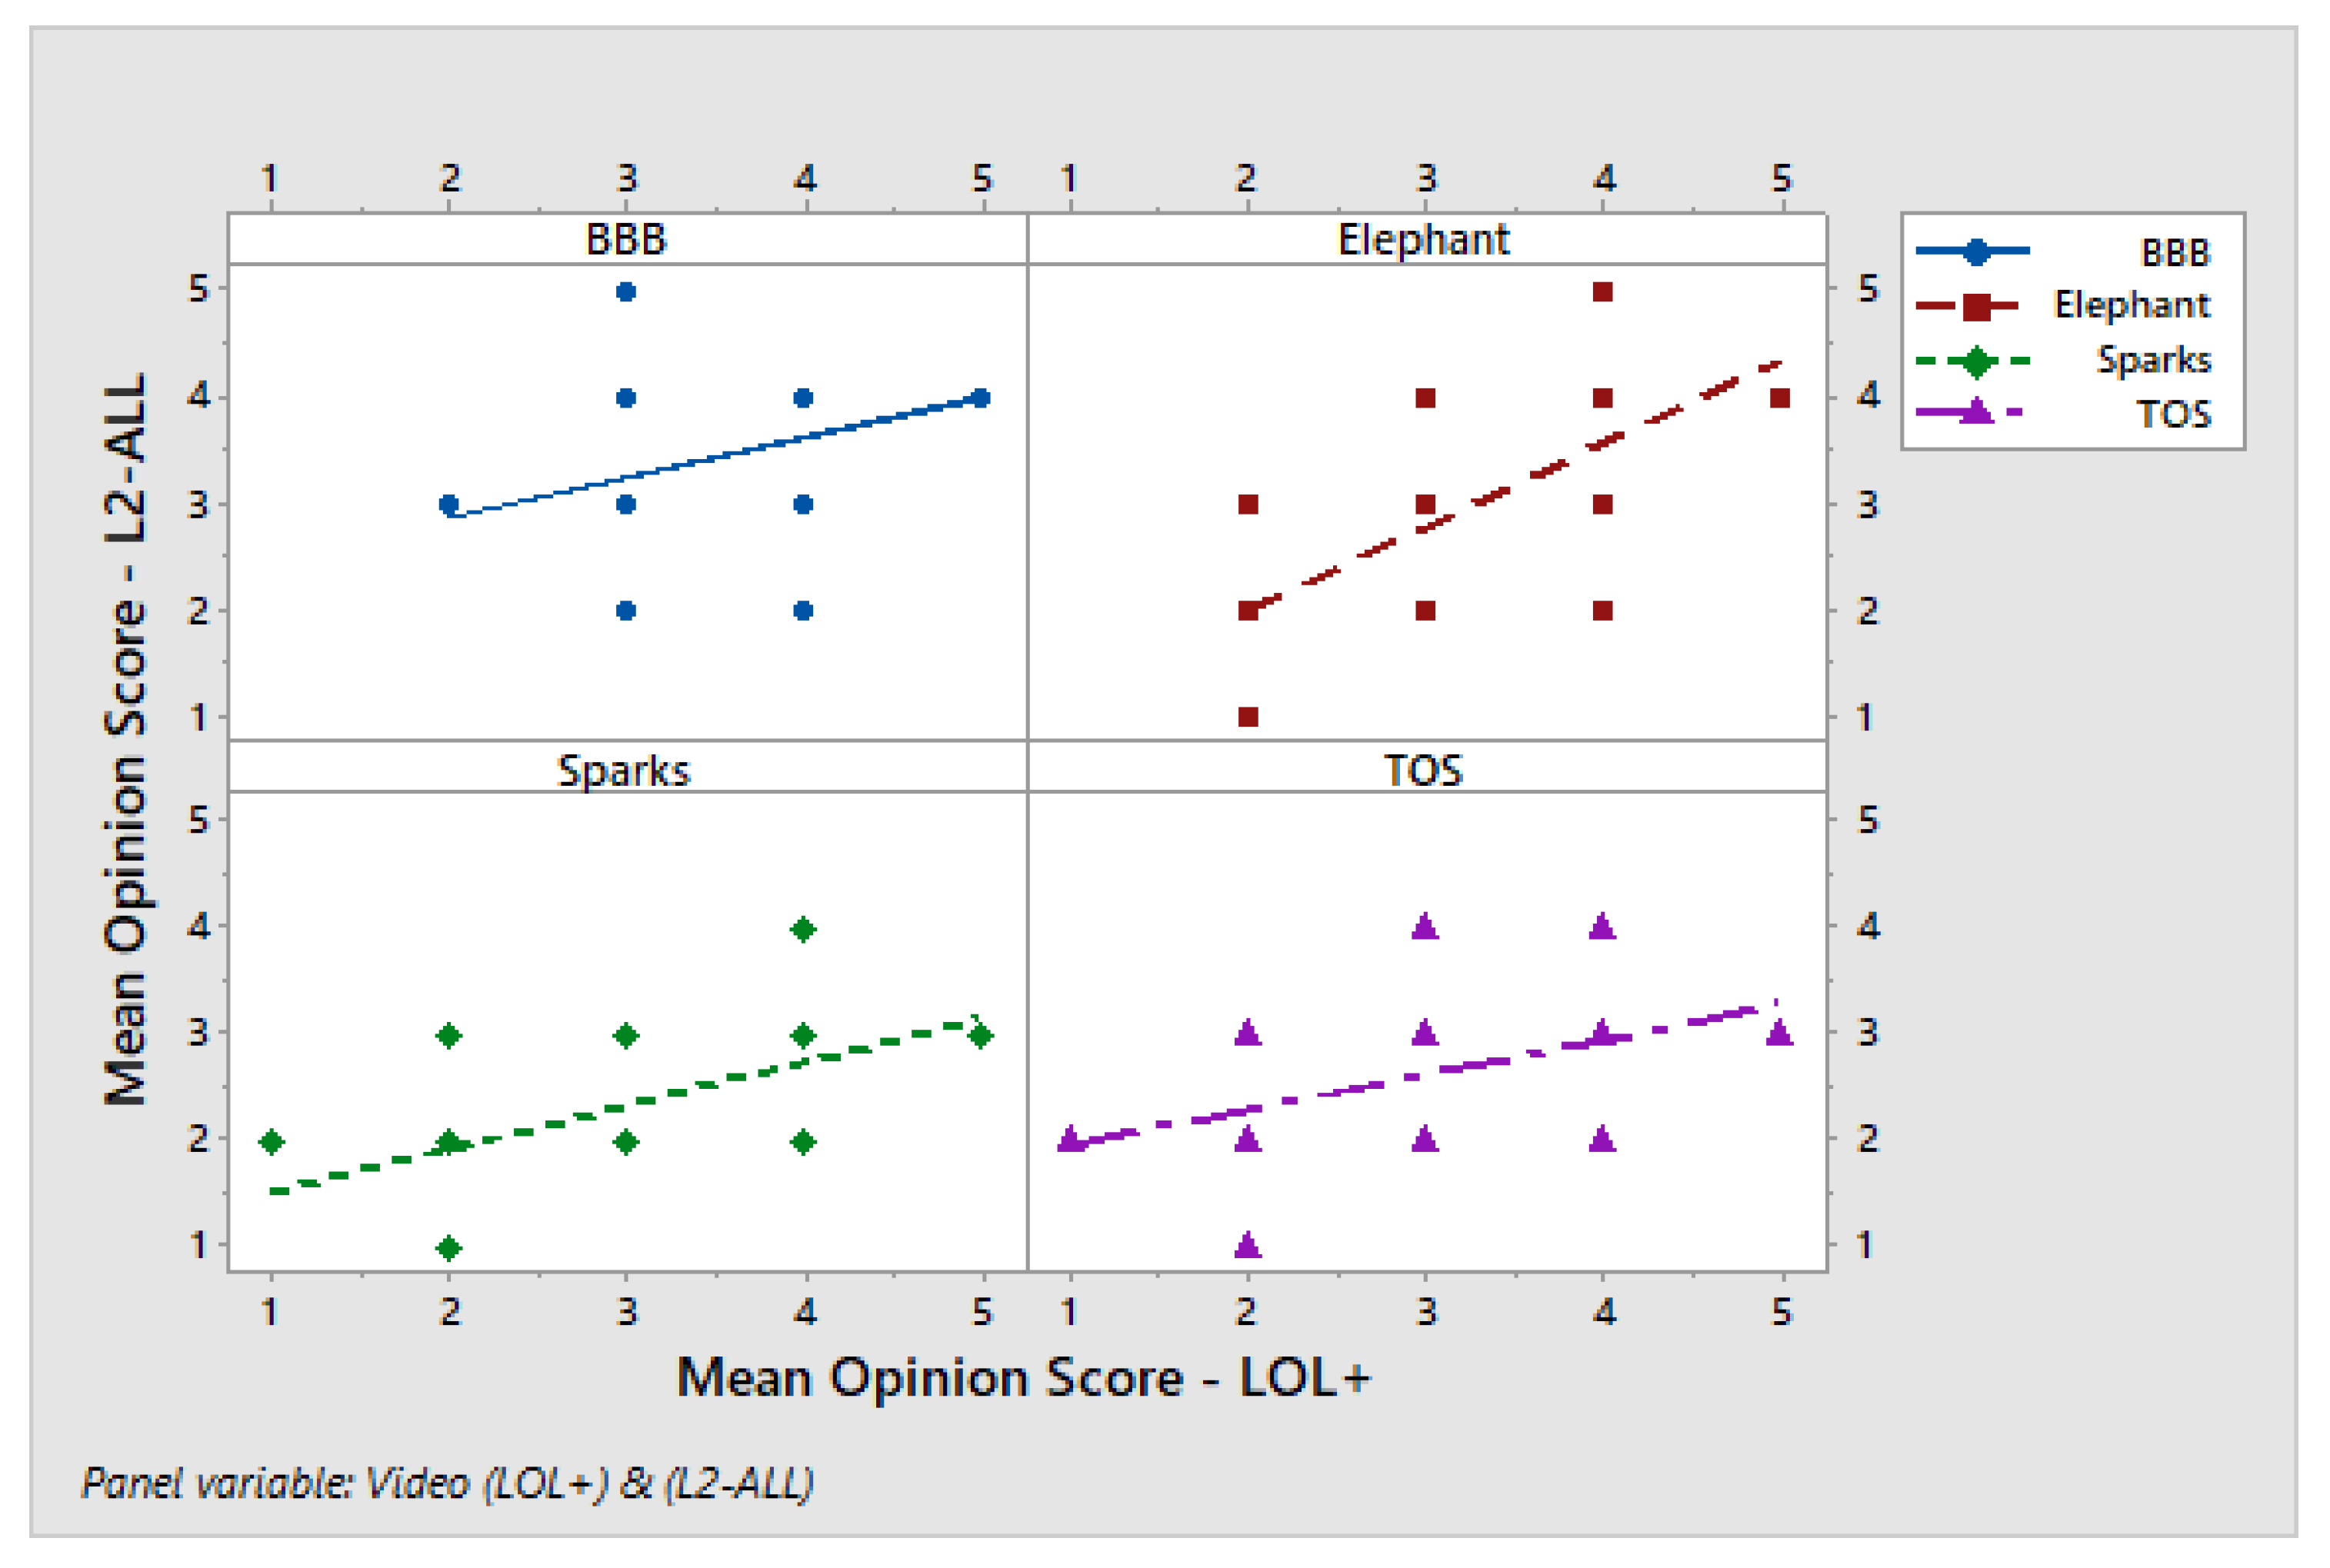
Figure 15.
Fitted Line Plots L2-All vs LOL+ for different videos.
Disclaimer/Publisher’s Note: The statements, opinions and data contained in all publications are solely those of the individual author(s) and contributor(s) and not of MDPI and/or the editor(s). MDPI and/or the editor(s) disclaim responsibility for any injury to people or property resulting from any ideas, methods, instructions or products referred to in the content. |
© 2025 by the authors. Licensee MDPI, Basel, Switzerland. This article is an open access article distributed under the terms and conditions of the Creative Commons Attribution (CC BY) license (http://creativecommons.org/licenses/by/4.0/).
Copyright: This open access article is published under a Creative Commons CC BY 4.0 license, which permit the free download, distribution, and reuse, provided that the author and preprint are cited in any reuse.


