Submitted:
04 October 2025
Posted:
06 October 2025
You are already at the latest version
Abstract
China's petrochemical port cities are confronted with the dual challenges of fostering industrial development and enhancing environmental quality. In this context, this paper establishes a semantic ontology-based data model from a comprehensive environmental factor classification perspective to thoroughly review the environmental quality over the past three years in seven major petrochemical port cities in China. The process consists of three main phases: First, information sources were identified, with the research team conducting extensive statistics and screening of 1,858 relevant papers from Web of Science and the China National Knowledge Infrastructure based on the review’s thematic focus. Next, information preprocessing was carried out, in which the selected literature was categorized and filtered according to different cities and environmental elements. Finally, visual analysis was performed using the preprocessed data to construct semantic ontology-based models for the atmospheric, water, soil, biological, and acoustic environments. These models facilitated the identification of research hotspots regarding pollutants and pollution sources across different cities and environmental domains, as well as the extraction of predominant pollution mitigation measures proposed in existing studies. The outcomes provide theoretical support for achieving coordinated development between industry and the environment in petrochemical port cities in China.
Keywords:
semantic ontology data model
; petrochemical-industrial port city
; environmental quality
1. Introduction
Against the backdrop of advancing global economic integration, the petrochemical industry plays a vital role in both energy supply and the production of basic chemical raw materials, serving as a core driver of sustained development in modern industry. However, as shown in Figure 1, while creating substantial economic value for global development, this industry has also exerted significant impacts on the environmental quality of petrochemical port cities.
In 2024, China’s petrochemical industry generated revenue of 16.28 trillion yuan, accounting for approximately 12% of the total revenue in the country’s scaled industrial sector [1]. Against this backdrop, petrochemical port cities in China are confronted with the dual tasks of urban development and environmental improvement. Therefore, conducting a retrospective analysis of environmental quality studies over the past three years in seven major petrochemical port cities from a comprehensive environmental factor classification perspective, with the aim of exploring pathways for coordinated development between industry and the environment, carries significant practical implications and far-reaching historical value.
1.1. Definition and Classification of Environmental Quality
Environmental quality is a measure of the state of an environment, characterized through both qualitative and quantitative descriptions of the conditions of specific environmental elements [2]. Furthermore, environmental quality represents a comprehensive measure of the state of the environment, encompassing multiple elements such as the atmosphere, water, soil, and biology, and cannot be defined by a single metric. Based on these distinct environmental elements, this paper categorizes the research areas of environmental quality into five primary domains: atmospheric environment, aquatic environment, soil environment, biological environment, and acoustic environment.
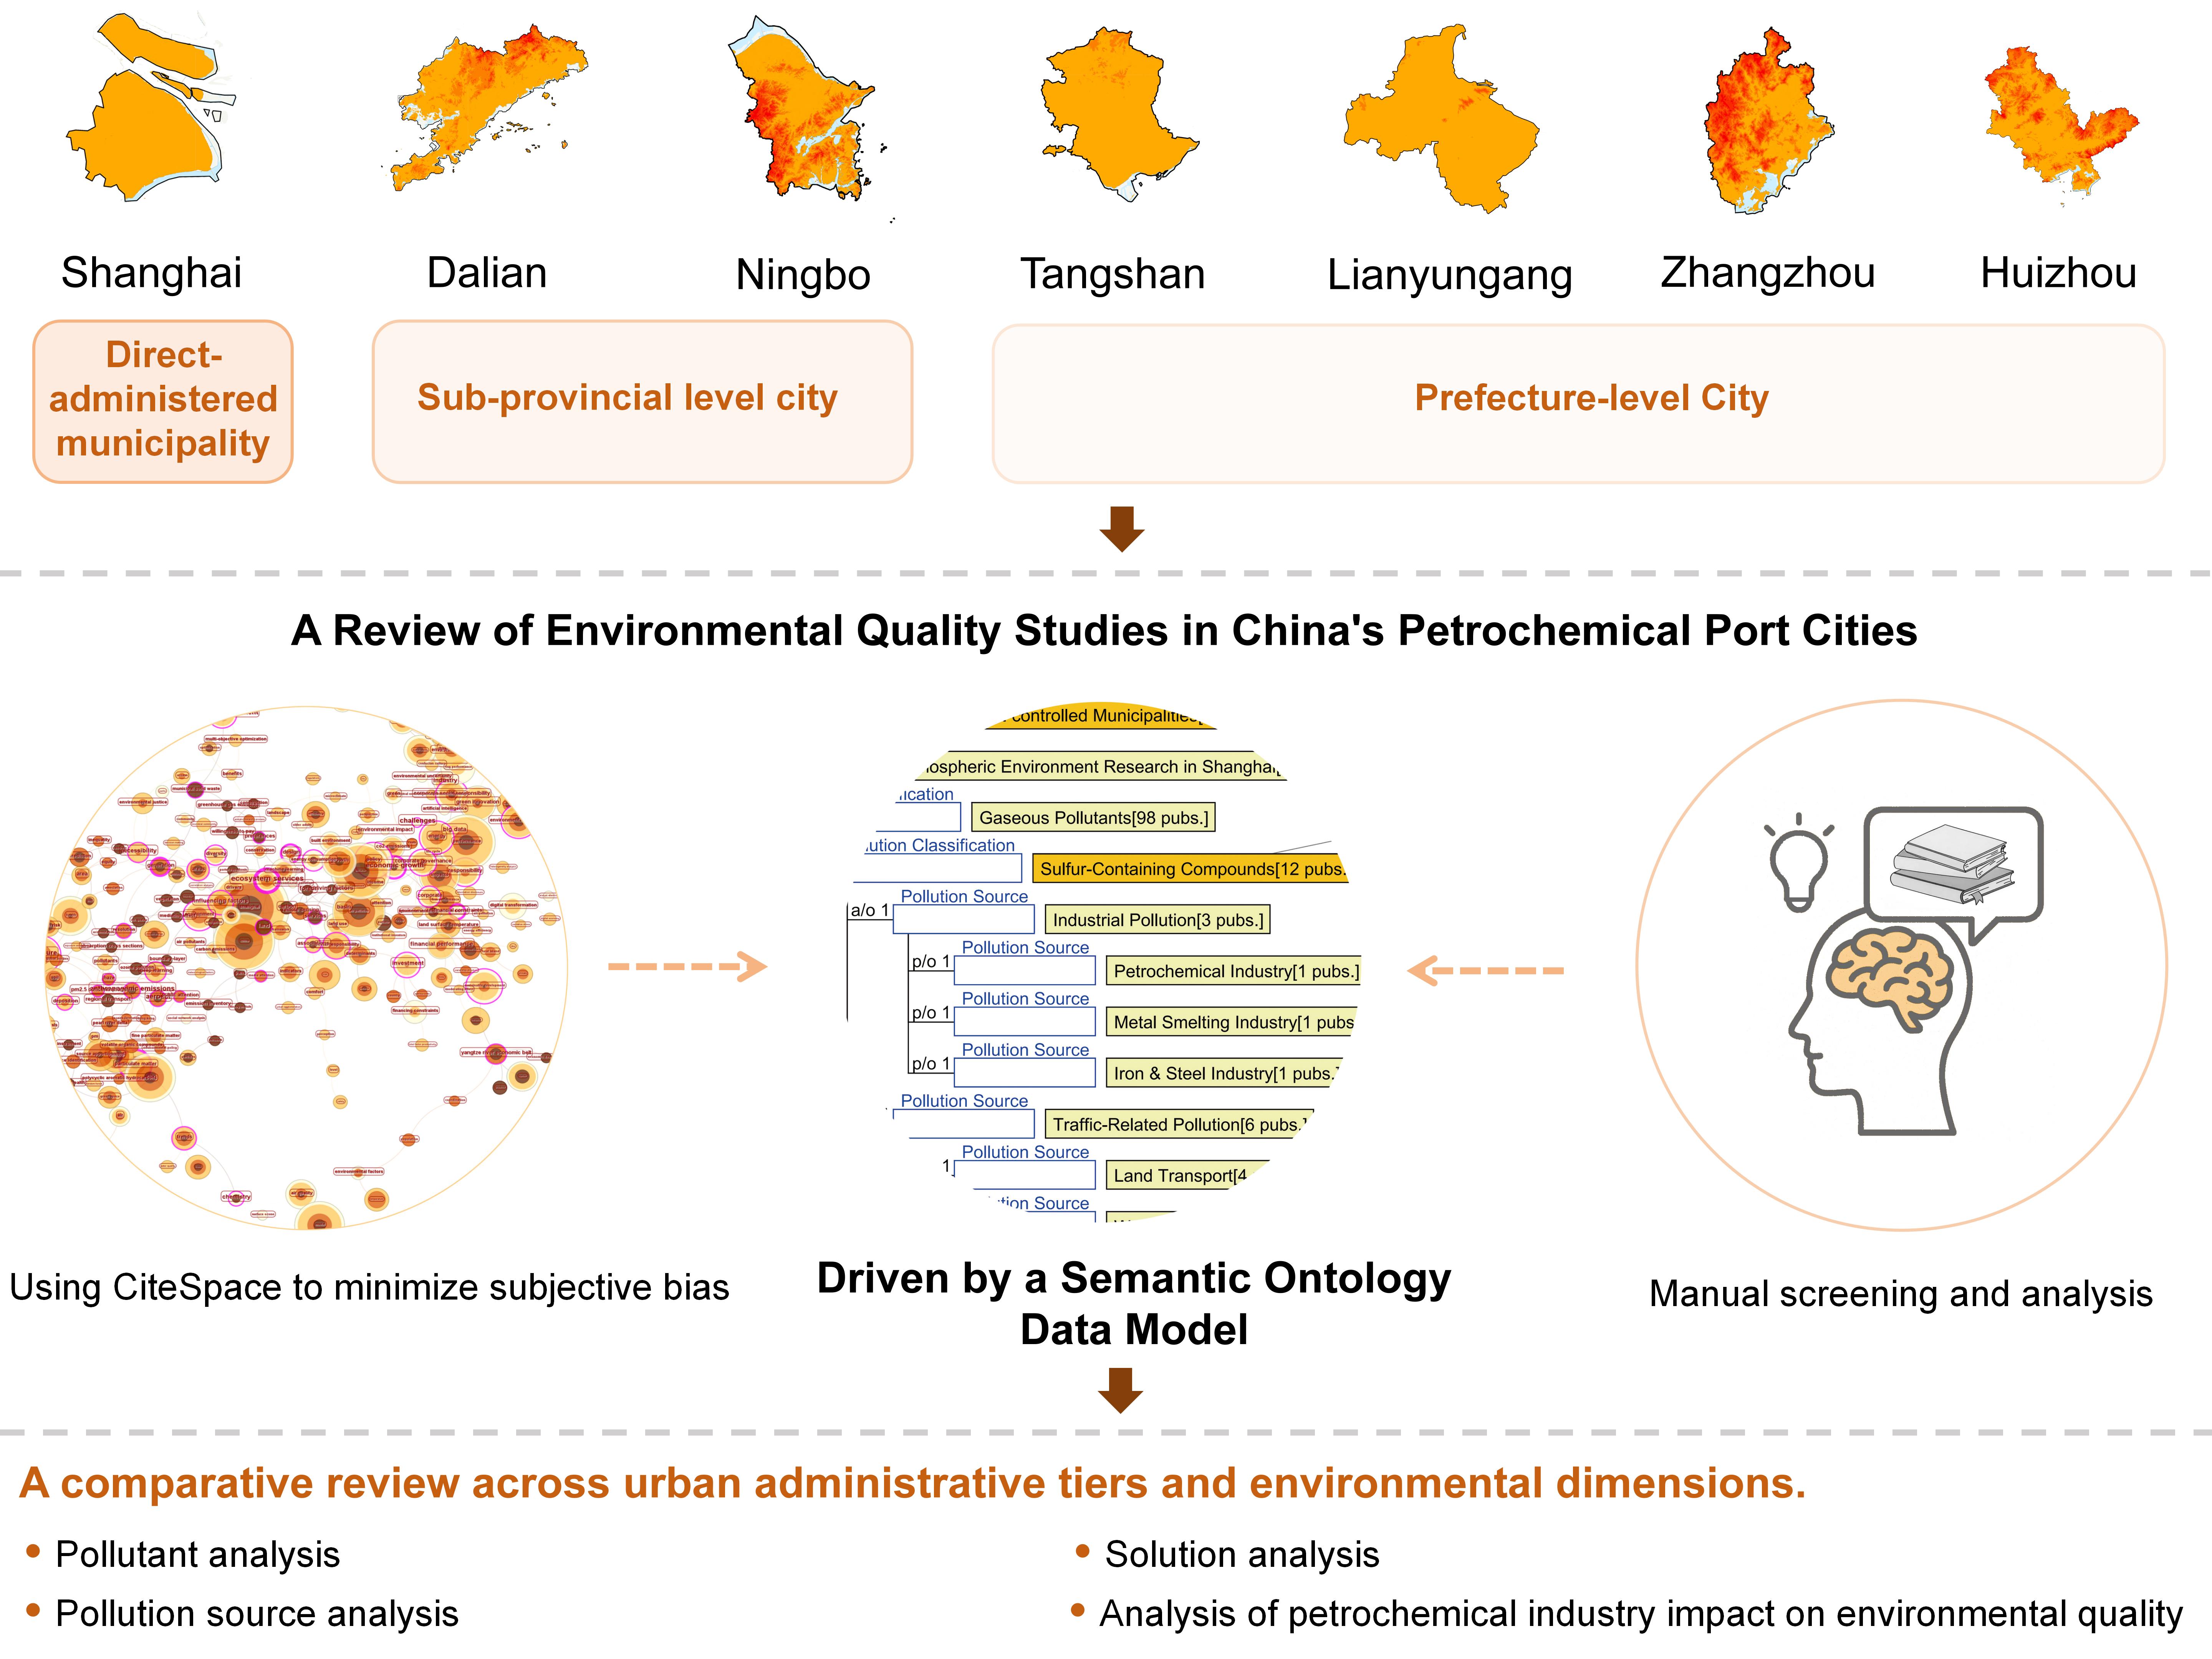
1.2. The Seven Major Petrochemical Port Cities in China
In 2014, to further phase out outdated production capacity, promote clustered development of the petrochemical industry, and optimize its spatial distribution, China’s National Development and Reform Commission and Ministry of Industry and Information Technology formulated the Guidance on the Planning and Layout of the Petrochemical Industry. This document proposed establishing seven major petrochemical industrial bases across the country, including Dalian Changxing Island (Liaoning), Caofeidian (Hebei), Lianyungang (Jiangsu), Caojing (Shanghai), Ningbo (Zhejiang), Huizhou (Guangdong), and Gulei (Fujian). Based on this plan, the present study identifies Dalian, Tangshan, Lianyungang, Shanghai, Ningbo, Huizhou, and Zhangzhou as the seven major petrochemical port cities in China [3]. As illustrated in Figure 2, these cities possess large-scale petrochemical production capacities and are all located along the coast, yet vary in administrative hierarchy: Tangshan, Lianyungang, Zhangzhou, and Huizhou are prefecture-level cities; Dalian and Ningbo hold sub-provincial city status; and Shanghai is a municipality directly under the central government.
1.3. Research on Environmental Quality in Petrochemical Port Cities
Currently, China’s petrochemical industry ranks as the world’s second largest by overall scale, firmly positioned among the global leaders in this sector [4]. However, when compared to internationally advanced standards, China’s petrochemical industry exhibits significantly higher emissions of wastewater, exhaust gases, and solid waste [5]. Under these circumstances, conducting an in-depth exploration of the current state of environmental quality research in China’s petrochemical port cities represents a crucial research objective. This paper employs a semantic ontology-based approach to systematically review studies on environmental quality across five key domains—atmospheric, aquatic, soil, biological, and acoustic environments—in seven major petrochemical port cities in China. The aim is to provide a theoretical foundation for achieving a balance between industrial development and environmental sustainability in these regions.
2. Methods
Semantic ontology-based data modeling integrates principles from semantics and ontology to structure core domain terminology into a logically organized analytical framework, enabling systematic visualization and interpretation of research concepts [6]. This study conducts a systematic review of environmental quality research over the past three years in seven major Chinese petrochemical port cities by constructing a semantic ontology-based data model. As illustrated in Figure 3, the analytical process is divided into three distinct phases: identification of information sources, data preprocessing, and visual analysis based on the semantic ontology model.
2.1. Information Source Identification
This study utilized the China National Knowledge Infrastructure (CNKI) and Web of Science (Core Collection) as primary data sources. For Chinese literature, the search topics included: “环境质量” (environmental quality), “环境污染” (environmental pollution), “环境评估” (environmental assessment), “环境治理” (environmental governance), “环境监测” (environmental monitoring), “大气环境” (atmospheric environment), “土壤环境” (soil environment), “水环境” (water environment), “生物环境” (biological environment), and “声环境” (acoustic environment). The geographic scope was restricted to Shanghai, Dalian, Ningbo, Tangshan, Lianyungang, Zhangzhou, and Huizhou.For English literature, the search query was: TS=(“environmental quality” OR “environmental pollution” OR “environmental assessment” OR “environmental governance” OR “environmental monitoring” OR “atmospheric environment” OR “soil environment” OR “water environment” OR “biological environment” OR “acoustic environment”), with the geographical restriction: (“shanghai” OR “ningbo” OR “dalian” OR “tangshan” OR “lianyungang” OR “zhangzhou” OR “huizhou”).
The literature search in both Chinese and English databases was conducted on April 16, 2025, covering publications from January 1, 2022 to April 15, 2025. Only academic journal articles were included. After excluding retracted publications, a total of 1,858 valid journal articles were identified, comprising 453 from CNKI and 1,405 from Web of Science.
2.2. Data Preprocessing
The overall information undergoes a two-step preprocessing procedure: classification of scholarly articles and subsequent manual curation.
Paper Categorization: Two researchers classified 1,858 publications from existing sources into three distinct datasets based on city administrative level, with some papers covering multiple cities. The resulting corpora include: Municipalities Directly Under the Central Government (1,271 pubs.), Sub-provincial Cities (377 pubs.), and Prefecture-level Cities (210 pubs.).
Manual Screening: The process of manual screening requires predefined criteria in two aspects, namely the scope and objectives of screening. The scope encompasses titles, keywords, and abstracts within the literature dataset. The objective is to identify publications directly related to atmospheric, aquatic, soil, biological, and acoustic environments. Following initial classification, two researchers independently review the three literature collections based on the designated screening criteria to exclude irrelevant studies. In case of discrepancies between the two reviewers, a third researcher intervenes to reach a consensus. Finally, core terminologies are extracted from the shortlisted literature. Keywords serve as the primary reference for core terms, while titles and abstracts provide supplementary references(Figure 4 shows the PRISMA flow diagram for the search and selection process.).
2.3. Visual Analytics
The visualization analysis comprises three components: the application of CiteSpace to mitigate bias from manual screening, the construction of a semantic ontology data model, and graph-based analytical mapping.
To mitigate manual screening bias, the paper datasets were imported into CiteSpace for keyword co-occurrence analysis, from which lists of high-frequency keywords were derived. Based on these lists, current research hotspots on environmental quality in China’s seven major petrochemical port cities were identified and synthesized in advance, thereby reducing subjectivity associated with manual screening.
Semantic ontology data modeling employs specialized software such as HOZO, Protégé, WebProtégé, and OntoStudio. Among these, HOZO—developed by Osaka University—is noted for its usability, interactivity, and cost efficiency, and is adopted as the primary tool for visual ontology analysis in this study. Using HOZO, a three-tier semantic ontology is constructed based on three relational constructs: “is-a”, “part-of”, and “applied-to”. Specifically, “is-a” expresses that the child-concept is a specific instantiation of the parent-concept; “part-of” indicates that the child-concept constitutes a component of the parent-concept; and “applied-to” describes a classification in which the child-concept is derived from the parent-concept [6].
Atlas analysis was conducted using semantic ontology data models developed with HOZO, resulting in the generation of 18 analytical atlas documents for environmental quality research. These included six for atmospheric environment, three for aquatic environment, three for soil environment, three for biological environment, and three for acoustic environment. During the final research phase, the visual atlases enabled the extraction and identification of research hotspots concerning pollutants, pollution sources, and existing mitigation measures across different cities and environmental domains. This approach facilitated a systematic review of environmental quality studies conducted over the past three years in seven major petrochemical port cities in China.
3. Discussion and Analysis
3.1. Research Focus Across Different City Tiers
Prior to developing the HOZO semantic model, the research team utilized objective statistical evidence from CiteSpace to identify and synthesize recent three-year research hotspots in environmental quality across seven major Chinese petrochemical port cities. This approach mitigated subjective bias introduced by manual screening in the HOZO modeling process.
Following classification and screening by the research team, six paper datasets were ultimately obtained. These include: a WOS dataset for municipalities directly under the central government containing 1,064 papers; a CNKI dataset for municipalities containing 207 papers; a WOS dataset for sub-provincial cities containing 243 papers; a CNKI dataset for sub-provincial cities containing 134 papers; a WOS dataset for prefecture-level cities containing 98 papers; and a CNKI dataset for prefecture-level cities containing 112 papers.As shown in Table 1, these six Chinese and English publication sets were separately imported into CiteSpace for keyword co-occurrence analysis, resulting in three English and three Chinese keyword co-occurrence network maps. Concurrently, six lists of high-centrality keywords, ranked by “Centrality,” were exported (details are provided in Table 2, Table 3, Table 4, Table 5, Table 6 and Table 7). It is important to note that these lists only include keywords with an intermediary centrality ≥ 0.01 that ranked within the top 30 of their respective dataset.
In CiteSpace, betweenness centrality is employed to identify pivotal nodes that serve as critical bridges within a network. The centrality value of a keyword directly reflects its research popularity and significance. Based on the six high-centrality keyword lists mentioned above, it can be concluded that research related to the atmospheric environment and aquatic environment constitutes a current hotspot in recent three-year environmental quality studies of the municipality (Shanghai), sub-provincial cities (Dalian, Ningbo), and prefecture-level cities (Tangshan, Lianyungang, Zhangzhou, Huizhou). Therefore, this study will focus on constructing a semantic ontology data model centered on the atmospheric and aquatic environments.
3.2. Analytical Framework for Semantic Ontology Data Modeling
Based on the preprocessed information, the research team constructed a semantic ontology data model. During the modeling process, the researchers extended the framework from the research hotspots (atmospheric and aquatic environments) identified by CiteSpace, adopting a comprehensive classification perspective of environmental elements. This resulted in the development of five principal semantic ontology data models, encompassing the atmospheric, aquatic, soil, biological, and acoustic environments.
The research team generated a total of 18 analytical maps from the five semantic ontology data models, comprising six for the atmospheric environment, three for the aquatic environment, and three each for the soil, biological, and acoustic environments. Using these visual analytical maps, the researchers identified research hotspots related to pollutants and pollution sources, as well as current pollution mitigation measures across different environmental domains and cities. This facilitated a systematic review of recent three-year environmental quality studies in seven major Chinese petrochemical port cities.
3.2.1. Semantic Ontology Model for Atmospheric Environments
The research team examined the atmospheric environment semantic ontology data model through two dimensions: aerosol and gaseous pollutant.
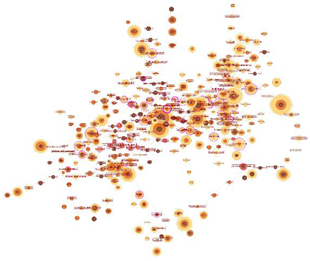
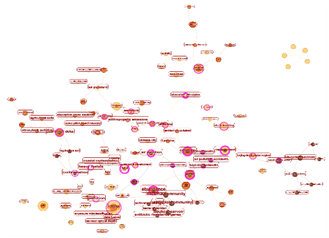
First, the aerosol semantic ontology data model was examined (As illustrated in Figure 5, Figure 6 and Figure 7), covering the following six aspects:
A. As shown in Figure 5, Figure 6 and Figure 7, the number of research papers on aerosol pollutants across the seven cities over the past three years was summarized using the semantic ontology data model: Shanghai (115 pubs.), Dalian (14 pubs.), Tangshan (10 pubs.), Ningbo (9 pubs.), Lianyungang (4 pubs.), Huizhou (4 pubs.), and Zhangzhou (1 pubs.). With its legacy as a traditional heavy industrial city in northern China, Tangshan produced slightly more papers than Ningbo. Overall, however, the distribution of publications reflects that scholarly attention to aerosol research is generally proportional to the administrative tier of each petrochemical port city.
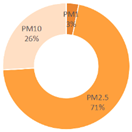
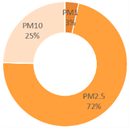
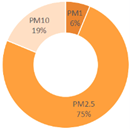
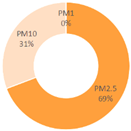
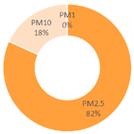
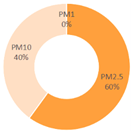
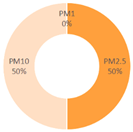
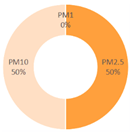
B. As presented in Table 8, the semantic ontology data model was used to analyze the proportional distribution of research papers across different types of aerosol pollutants in the seven cities over the past three years. PM₂.₅-related publications accounted for the largest share across all cities, indicating it is currently the most prominent aerosol pollutant in these research contexts.
C. Statistical analysis based on the semantic ontology data model was conducted on the number of papers addressing pollution sources of various aerosols. Five categories of pollution sources were identified: industrial (29 pubs.), transportation (31 pubs.), construction (1 pubs.), residential (14 pubs.), and natural (3 pubs.). Industrial and transportation sources received the most research attention, underscoring the emphasis placed on the impact of industrial and traffic activities on aerosol pollution in these port cities.
D. As depicted in Figure 8, the semantic ontology data model facilitated a cross-city and cross-source analysis of aerosol-related papers. The results reveal distinct research emphases among pollution sources for specific aerosol types: PM₁ was most frequently linked to transportation sources (2 pubs.), PM₂.₅ to industrial sources (23 pubs.), and PM₁₀ to transportation sources (8 pubs.).
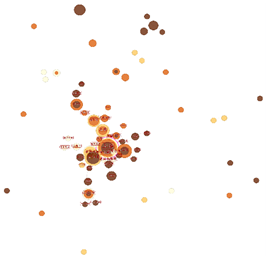
E. Based on semantic ontological modeling, 3 papers were identified within industrial pollution source studies that specifically associate aerosol pollutants with the petrochemical industry, highlighting a direct research focus on its environmental impact.
F. The semantic ontology data model further identified six categories of mitigation measures for aerosol pollutants:
a) Urban ecological optimization: including improving urban ventilation conditions [7] and enhancing urban forest systems [8,9,10].
b) Energy structure improvement: involving the development of clean energy [11,12] and coordinated regional low-carbon development [13].
c) Transportation pollution control: encompassing upgrades in shipping technology [11,12,14], promotion of green transportation [15,16,17], and strict regulation of mobile source emissions [18].
d) Industrial pollution prevention upgrades: consisting of improved industrial waste gas treatment [13,14,18] and phasing out high-energy-consumption industries [19,20].
e) Enhanced smart supervision and technological innovation: including the establishment of intelligent pollution source monitoring platforms [20,21] and strengthening pollution oversight networks [14,19].
f) Policy and governance system refinement: covering the improvement of environmental policies and regulations and providing incentives for corporate green transformation [20,22,23].
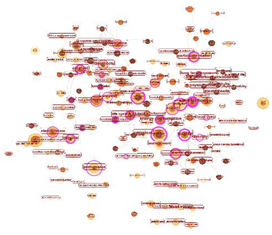
Next, the gaseous pollutant semantic ontology data model was examined (As illustrated in Figure 9, Figure 10 and Figure 11), covering the following six aspects:
A. As shown in Figure 9, Figure 10 and Figure 11, the number of research papers on gaseous pollutants across the seven cities over the past three years was summarized using the semantic ontology data model: Shanghai (98 pubs.), Dalian (15 pubs.), Tangshan (11 pubs.), Ningbo (9 pubs.), Huizhou (8 pubs.), Lianyungang (3 pubs.), and Zhangzhou (2 pubs.). As a traditional heavy industrial city in northern China, Tangshan produced slightly more papers than Ningbo. Overall, the distribution of publications indicates that scholarly attention to gaseous pollutants research is generally proportional to the administrative tier of each petrochemical port city.
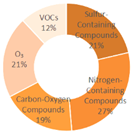
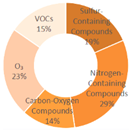
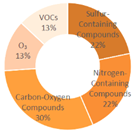
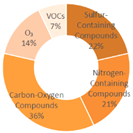
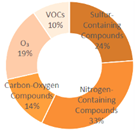
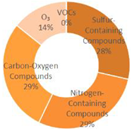
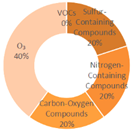
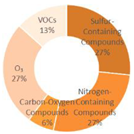
B. As presented in Table 9, the semantic ontology data model was used to analyze the proportional distribution of research papers across different types of gaseous pollutants in the seven cities over the past three years. Nitrogen-containing compounds accounted for the highest proportion of papers, identifying them as the currently most prominent gaseous pollutants across these port cities.
C. Statistical analysis based on the semantic ontology data model was conducted on the number of papers addressing pollution sources of various gaseous pollutants. Six categories of pollution sources were identified: industrial (49 pubs.), transportation (44 pubs.), agricultural (3 pubs.), construction (3 pubs.), residential (17 pubs.), and natural (6 pubs.). Industrial and transportation sources received the most research attention, reflecting scholars’ focus on industrial and traffic-related emissions in these port cities.
D. As depicted in Figure 12, the semantic ontology data model facilitated a cross-city and cross-source analysis of gaseous pollutant-related papers. The results reveal distinct research emphases among pollution sources for each pollutant: sulfur compounds were predominantly linked to transportation sources (11 pubs.), nitrogen compounds to transportation (16 pubs.), carbon oxides to industrial sources (12 pubs.), ozone to industrial sources (8 pubs.), and VOCs to industrial sources (11 pubs.).
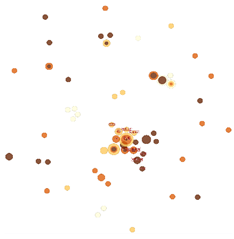
E. Based on semantic ontological modeling, 12 papers were identified within industrial pollution source studies that specifically associate gaseous pollutants with the petrochemical industry, highlighting a direct research focus on its environmental impact.
F. The semantic ontology data model further identified six categories of mitigation measures for gaseous pollutants:
a) Urban ecological optimization: including construction waste recycling [24,25,26], waste source separation [27], promotion of green buildings [28], and improved urban forest systems [8].
b) Energy structure improvement: involving development of clean energy [28,29], optimization of energy mix [11], and promotion of clean cooking [30].
c) Transportation pollution control: encompassing expansion of electric vehicles [28,31,32], instrumental monitoring of vehicle emissions [33], control of tailpipe emissions [34], innovation in shipping emission technologies [11], and upgrades in maritime technologies [12].
d) Industrial pollution prevention upgrades: consisting of environmentally sound medical waste treatment [35], strict enforcement of industrial emission standards [28], improved waste gas treatment measures [36,37], and microalgae-based biotechnology for CO₂/NOx removal [38].
e) Enhanced smart supervision and technological innovation: including advancement of green technology innovation [39], strengthened pollution monitoring [40,41,42,43], and development of shared databases [20].
f) Policy and governance system refinement: covering regional coordinated governance [44,45], public awareness campaigns on pollution reduction [28], formulation and improvement of environmental policies and regulations [12,42,46], incentives for corporate green development [20,47], establishment of joint prevention mechanisms [39], and optimization of industrial structure [20].
3.2.2. Semantic Ontology Model for Aquatic Environments
The research team examined the aquatic environment semantic ontology data model (As illustrated in Figure 13, Figure 14 and Figure 15)through two dimensions: chemical pollution and physical pollution.
First, the chemical pollution semantic ontology data model was examined (As illustrated in Figure 13, Figure 14 and Figure 15), covering the following six aspects:
A. As shown in Figure 13, Figure 14 and Figure 15, the number of research papers on aquatic chemical pollution across the seven cities over the past three years was summarized using the semantic ontology data model: Shanghai (37 pubs.), Dalian (18 pubs.), Lianyungang (9 pubs.), Ningbo (7 pubs.), Tangshan (5 pubs.), Zhangzhou (5 pubs.), and Huizhou (3 pubs.). As a pivotal hub city in China’s “Belt and Road” initiative, Lianyungang produced slightly more papers than Ningbo. Overall, the distribution of publications suggests that scholarly attention remains generally proportional to the administrative tier of each petrochemical port city.
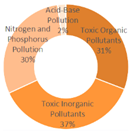
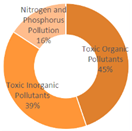
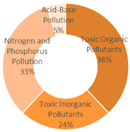
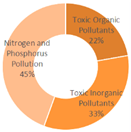
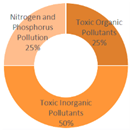
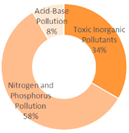
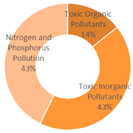
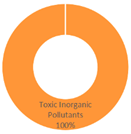
B. As presented in Table 10, the semantic ontology data model was used to analyze the proportional distribution of research papers across different types of chemical pollutants in the seven cities over the past three years. Papers addressing inorganic toxic pollutants accounted for the highest proportion across all seven cities, indicating these are currently the most studied chemical pollutants in the research pertaining to these port cities.
C. Statistical analysis based on the semantic ontology data model was conducted on the number of papers addressing pollution sources of various chemical pollutants. Six categories of pollution sources were identified: industrial (18 pubs.), transportation (1 pubs.), agricultural (23 pubs.), construction (1 pubs.), residential (11 pubs.), and natural (2 pubs.). Agricultural pollution sources were most frequently studied, reflecting significant research focus on the impact of agricultural activities on chemical water pollution.
D. As depicted in Figure 16, the semantic ontology data model facilitated a cross-city and cross-source analysis of chemical pollutant -related papers. The results reveal distinct research emphases among pollution sources for each pollutant: organic toxic pollutants were most frequently linked to agricultural sources (9 pubs.), inorganic toxic pollutants to industrial sources (9 pubs.), and nitrogen/phosphorus pollution to agricultural sources (7 pubs.).
E. Based on semantic ontological modeling, 3 papers were identified within industrial pollution source studies that specifically associate chemical water pollution with the petrochemical industry, highlighting a direct research focus on its environmental impact.
F. The semantic ontology data model further identified five categories of mitigation measures for chemical pollution in water bodies:
a) Enhanced monitoring and early warning systems: including improved water quality monitoring [48,49,50], data sharing [49], and enhanced early warning mechanisms [49].
b) Strengthened pollution source control: encompassing stricter regulation of emission sources [50,51,52] and implementation of coal-to-gas conversion [53].
c) Optimized wastewater treatment measures: including upgrades in treatment technology [54], professionalized rural wastewater management [55], increased dosing of phosphorus-removing agents [56], and science-based effluent standard setting [55].
d) Ecological restoration enhancements: involving improved self-purification capacity of water bodies [52] and phytoremediation of heavy metals [57,58].
e) Integrated planning and comprehensive management: covering improved planning of water source protection zones [51] and promotion of integrated watershed management [52].
Next, the physical pollution semantic ontology data model was examined (As illustrated in Figure 13, Figure 14 and Figure 15), covering the following five aspects:
A. As shown in Figure 13, Figure 14 and Figure 15, the number of research papers on aquatic physical pollution across the seven cities over the past three years was summarized using the semantic ontology data model: Dalian (4 papers), Shanghai (3), Ningbo (2), Zhangzhou (2), Lianyungang (1), Tangshan (0), and Huizhou (0). The data indicate that, compared to chemical pollution, scholarly attention to physical pollution remains limited, with no clear correlation between research output and the administrative tier of each port city.
B. Based on the semantic ontology model, physical pollution research over the past three years primarily addressed microplastics (9 pubs.), suspended solids (2 pubs.), and radioactive materials (1 pubs.). These results identify microplastics as the most studied physical pollutant in these port cities.
C. Statistical analysis based on the semantic ontology data model was conducted on the number of papers addressing pollution sources of various physical pollutants. Three categories of pollution sources were identified: industrial (1 pubs.), transportation (1 pubs.), and residential (1 pubs.). No dominant research focus on any specific pollution source was observed.
D. None of the papers on industrial pollution sources established a link to the petrochemical industry, indicating no direct research emphasis on its role in physical pollutants.
3.2.3. Semantic Ontology Model for Soil Environment
The research team examined the soil environment semantic ontology data model(As illustrated in Figure 17, Figure 18 and Figure 19) through two dimensions: organic pollutant and inorganic pollutant.
First, the organic pollutant semantic ontology data model was examined (As illustrated in Figure 17, Figure 18 and Figure 19), covering the following five aspects:
A. As shown in Figure 17, Figure 18 and Figure 19, the number of research papers on soil organic pollutants across the seven cities over the past three years was summarized using the semantic ontology data model: Shanghai (13 pubs.), Lianyungang (2 pubs.), Huizhou (2 pubs.), Dalian (0 pubs.), Ningbo (0 pubs.), Tangshan (0 pubs.), and Zhangzhou (0 pubs.). The results indicate limited scholarly attention to organic soil pollution in these cities, with no clear correlation between research output and administrative tier.
B. Based on the semantic ontology model, organic pollution research over the past three years primarily addressed microplastics (6 pubs.), petroleum hydrocarbons (6 pubs.), pesticides (3 pubs.), and VOCs (2 pubs.). Microplastics and petroleum hydrocarbons are currently the most studied organic soil pollutants in these port cities.
C. Statistical analysis based on the semantic ontology data model was conducted on the number of papers addressing pollution sources of various soil organic pollutants. Three categories of pollution sources were identified: industrial (3 pubs.), transportation (2 pubs.), and agricultural (5 pubs.). Agricultural sources received the most research attention, reflecting emphasis on the impact of farming practices on organic soil contamination.
D. Based on semantic ontological modeling, 1 papers were identified within industrial pollution source studies that specifically associate soil organic pollutants with the petrochemical industry, highlighting a direct research focus on its environmental impact.
E. Two mitigation measures were derived from the model: development of MPs analysis technology and establishment of a fundamental soil pollution database platform [61,62].
Next, the inorganic pollutant semantic ontology data model was examined (As illustrated in Figure 17, Figure 18 and Figure 19), covering the following five aspects:
A. As shown in Figure 17, Figure 18 and Figure 19, the number of research papers on soil inorganic pollutants across the seven cities over the past three years was summarized using the semantic ontology data model: Shanghai (10 pubs.), Dalian (3 pubs.), Ningbo (3 pubs.), Zhangzhou (2 pubs.), Tangshan (1 pubs.), Lianyungang (0 pubs.), and Huizhou (0 pubs.). Research attention shows a positive correlation with city administrative tier, though overall publication numbers remain low.
B. Heavy metals (18 pubs.) were identified as the most studied inorganic pollutants.
C. Statistical analysis based on the semantic ontology data model was conducted on the number of papers addressing pollution sources of various soil inorganic pollutants. Four categories of pollution sources were identified: industrial (10 pubs.), transportation (2 pubs.), agricultural (2 pubs.), and natural (3 pubs.).Industrial sources dominated research interest, highlighting scholarly concern over industrial impacts on inorganic soil pollution.
D. None of the papers on industrial pollution sources established a link to the petrochemical industry, indicating no direct research emphasis on its role in soil inorganic pollutants.
3.2.4. Semantic Ontology Model for Biological Environments
The research team analyzed the biological environment semantic ontology data model (As illustrated in Figure 20, Figure 21 and Figure 22), with specific findings summarized in five aspects:
A. As shown in Figure 20, Figure 21 and Figure 22, the number of research papers on biological environmental pollution across the seven cities over the past three years was summarized using the semantic ontology data model: Shanghai (13 pubs.), Dalian (8 pubs.), Ningbo (3 pubs.), Lianyungang (3 pubs.), Zhangzhou (1 pubs.), Huizhou (1 pubs.), and Tangshan (0 pubs.). The results indicate limited research attention overall, though a positive correlation is observed between publication output and the administrative tier of each city.
B. Based on the semantic ontology model, biological environmental pollution research over the past three years primarily addressed atmospheric organisms (1 pubs.), aquatic organisms (8 pubs.), and biodiversity issues (12 pubs.). Biodiversity emerged as the most studied biological environmental concern in these port cities.
C. Statistical analysis based on the semantic ontology data model was conducted on the number of papers addressing pollution sources of various biological environmental pollution. Three categories of pollution sources were identified: industrial (1 pubs.), agricultural (1 pubs.), and residential (1 pubs.). No dominant research focus on any specific pollution source was observed.
D. None of the papers on industrial pollution sources established a link to the petrochemical industry, indicating no direct research emphasis on its role in biological environmental pollution.
E. Two categories of mitigation measures were derived from the model:
a) Technological innovation: including purification of air using slightly acidic electrolyzed water and monitoring of aquatic organisms via environmental DNA technology [63,64].
b) Enhanced monitoring: encompassing stricter supervision of external pollutant inputs [65].
3.2.5. Semantic Ontology Model for Acoustic Environment
The research team analyzed the acoustic environment semantic ontology data model(As illustrated in Figure 23, Figure 24 and Figure 25), with specific findings summarized in four aspects:
A. As shown in Figure 23, Figure 24 and Figure 25, the number of research papers on noise pollution across the seven cities over the past three years was summarized using the semantic ontology data model:Shanghai (8 pubs.), Dalian (7 pubs.), Ningbo (1 pubs.), Tangshan (1 pubs.), Lianyungang (0 pubs.), Zhangzhou (0 pubs.), and Huizhou (0 pubs.). The results indicate limited research attention overall, though a positive correlation exists between publication output and the administrative tier of each city.
B. Based on the semantic ontology model, noise pollution research over the past three years primarily addressed transportation noise (6 pubs.), industrial production noise (1 pubs.), and community noise (3 pubs.).Transportation noise emerged as the most studied acoustic environmental issue in these port cities.
C. Statistical analysis based on the semantic ontology data model was conducted on the number of papers addressing pollution sources of various noise pollution. Three categories of pollution sources were identified: industrial (1 pubs.), transportation (6 pubs.), and residential (3 pubs.). Transportation-related sources received the most research attention, reflecting scholarly focus on the impact of traffic development on acoustic environmental quality.
D. None of the papers on industrial noise sources established a connection to the petrochemical industry, indicating no direct research emphasis on its role on noise pollution.
E. Three categories of noise mitigation measures were derived from the model:
a) Transportation noise control: including optimization of road networks and traffic volume [66], expansion of restricted zones for trucks, horns, motorcycles, and hazardous vehicles [66],improved road infrastructure [66],,use of noise-reducing pavement on major routes [66], enhanced building sound insulation [67], implementation of subjective noise intervention technologies [67], increased share of public transportation [67], and improved noise governance policies [67].
b) 67. integration of behavioral guidelines with community self-regulation [67], improved handling of noise complaints [67], and dynamic environmental noise management systems [67].
c) 68.
4. Conclusions
4.1. Summary of Existing Research
4.1.1. Research Summary on Air Quality in Seven Major Chinese Petrochemical Port Cities (Past Three Years)
A. Atmospheric environment research represents a current hotspot. Scholarly attention to aerosol and gaseous pollutants is positively correlated with the administrative level of these cities.
B. PM₂.₅ is the most studied aerosol pollutant, while nitrogen-containing compounds are the most investigated gaseous pollutants.
C. Significant research emphasis is placed on industrial and transportation-related pollution sources.
D. Source-specific research hotspots were identified as follows:
a) Aerosols: PM₁ (transportation), PM₂.₅ (industrial), PM₁₀ (transportation)
b) Gaseous pollutants: sulfur compounds (transportation), nitrogen compounds (transportation), carbon oxides (industrial), ozone (industrial), VOCs (industrial)
E. The semantic ontology data model confirms direct research influence from the petrochemical industry.
F. Six mitigation domains were identified: urban ecological optimization, energy structure improvement, transportation pollution control, industrial pollution prevention upgrades, smart supervision, and policy/regulatory refinement.
4.1.2. Research Summary on Aquatic Environment Quality in Seven Major Chinese Petrochemical Port Cities (Past Three Years)
A. Aquatic environment research represents a current hotspot. Chemical pollution research attention correlates positively with administrative tier; physical pollution studies remain limited without clear tier relationship.
B. Inorganic toxic pollutants and microplastics represent the primary research focuses in chemical and physical pollution, respectively.
C. Agricultural sources dominate chemical pollution research; no predominant pollution source is identified for physical pollution.
D. Petrochemical industry activities directly influence chemical but not physical pollution research.
E. Chemical pollution mitigation emphasizes monitoring enhancement, pollution source control, wastewater treatment optimization, ecological restoration, and comprehensive planning. Physical pollution strategies focus on reducing external inputs and selecting appropriate treatment facilities.
4.1.3. Research Summary on Soil Environment Quality in Seven Major Chinese Petrochemical Port Cities (Past Three Years)
A. Organic pollutant research shows no clear tier correlation; inorganic pollutant attention is tier-proportional.
B. Microplastics and petroleum hydrocarbons are key organic pollutants; heavy metals dominate inorganic pollutant research.
C. Agricultural impacts are emphasized for organic pollutants; industrial influences are prioritized for inorganic contaminants.
D. Petrochemical industry demonstrates direct influence on organic but not inorganic pollution research.
E. Organic pollution mitigation includes MPs analysis technology and soil pollution database development; inorganic strategies involve soil quality monitoring, EDTA-compost remediation, and coal-to-gas conversion.
4.1.4. Research Summary on Biological Environment Quality in Seven Major Chinese Petrochemical Port Cities (Past Three Years)
A. Research attention correlates positively with administrative tier.
B. Biodiversity issues constitute the primary research focus.
C. No predominant pollution source is identified.
D. No direct petrochemical industry research influence is observed.
E. Mitigation strategies emphasize technological innovation and enhanced monitoring.
4.1.5. Research Summary on Acoustic Environment Quality in Seven Major Chinese Petrochemical Port Cities (Past Three Years)
A. Research attention is tier-proportional.
B. Transportation noise represents the most studied acoustic environmental issue.
c) Traffic development receives primary research emphasis regarding pollution sources.
d) No direct petrochemical industry research impact is identified.
e) Noise control strategies encompass transportation, community, and industrial noise mitigation.
4.2. Limitations and Future Research Directions
4.2.1. Limitations of the Study
This review has two limitations due to the large volume of literature screened:
First, to improve screening efficiency, the analysis primarily focused on titles, keywords, and abstracts in the selected corpus, rather than full-text content. This approach may introduce manual screening biases, potentially leading to localized inaccuracies in the semantic ontology data model.
Second, the review only included research articles published in the past three years from Chinese and English databases, which may not fully capture the historical evolution of environmental quality research in China’s seven major petrochemical port cities.
4.2.2. Future Research Directions
Given the limitations of this study, future research will further refine the focus on environmental quality issues in China’s petrochemical port cities based on the semantic ontology data model. The weighting of machine-assisted screening will also be increased to enhance data accuracy, thereby providing stronger theoretical support for environmental quality management in these areas.
Acknowledgments
This work was supported by the university cooperation collaborative education projects of the Ministry of education in 2024: Theories and Methods of Architectural Design Teaching Based on Digitalisation [grant numbers 230907307014246]; and the Project: Analysis of Spatial Genes and Strategies for Preservation and Transmission of Historical Street Districts in Jingzhou Ancient City, Hubei Province [grant number 23Y155].
References
- China Petroleum and Chemical Industry Federation: Petrochemical Industry Revenue Achieves Positive Growth. https://chinanpo.mca.gov.cn/xwxq?id=28032&newsType=1947,1943,1948 (accessed 2025-08-31).
- Introduction to Environmental Science (Fang, S.-R.; Yao, H.) (Z-Library) (1).
- Tian, C.; Liang, Y.; Lin, Q.; You, D.; Liu, Z. Environmental Pressure Exerted by the Petrochemical Industry and Urban Environmental Resilience: Evidence from Chinese Petrochemical Port Cities. J. Cleaner Prod. 2024, 471, 143430. https://doi.org/10.1016/j.jclepro.2024.143430. [CrossRef]
- Dai, H.; Chen, J.; Yuan, Q.; Liu, P. Research on the High-Quality Development Strategy of the Petrochemical Industry. Strategic Study of CAE 2021, *23* (5), 122–129.
- Dai, H.; Chen, J.; Yuan, Q.; Liu, P. Research on the Green and Low-Carbon Transformation Development of China’s Chemical and Petrochemical Industry. Strategic Study of CAE 2024, *26* (6), 223–232.
- Li, Z. A Study on Human Behavior in the Waterscape Space of a Residential Complex in China. Ph.D. Dissertation, Kyoto University, 2009.
- Wang, Y.; Dai, X.; Gong, D.; Zhou, L.; Zhang, H.; Ma, W. Correlations between Urban Morphological Indicators and PM2.5 Pollution at Street-Level: Implications on Urban Spatial Optimization. Atmosphere 2024, 15 (3), 341. https://doi.org/10.3390/atmos15030341. [CrossRef]
- Long, Y.; Zhang, W.; Sun, N.; Zhu, P.; Yan, J.; Yin, S. Sequential Interaction of Biogenic Volatile Organic Compounds and SOAs in Urban Forests Revealed Using Toeplitz Inverse Covariance-Based Clustering and Causal Inference. Forests 2023, 14 (8), 1617. https://doi.org/10.3390/f14081617. [CrossRef]
- Yang, Y.; Xu, Y.; Duan, Y.; Yang, Y.; Zhang, S.; Zhang, Y.; Xie, Y. How Can Trees Protect Us from Air Pollution and Urban Heat? Associations and Pathways at the Neighborhood Scale. Landscape Urban Plann. 2023, 236, 104779. https://doi.org/10.1016/j.landurbplan.2023.104779. [CrossRef]
- Zhang, X.; Lyu, J.; Chen, W. Y.; Chen, D.; Yan, J.; Yin, S. Quantifying the Capacity of Tree Branches for Retaining Airborne Submicron Particles. Environ. Pollut. 2022, 310, 119873. https://doi.org/10.1016/j.envpol.2022.119873. [CrossRef]
- He, S.; Wu, X.; Wang, J. Comprehensive Economic Impact Assessment of Regional Shipping Emissions: A Case Study of Shanghai, China. Mar. Pollut. Bull. 2025, 211, 117368. https://doi.org/10.1016/j.marpolbul.2024.117368. [CrossRef]
- Ye, J.; Chen, J.; Wen, H.; Wan, Z.; Tang, T. Emissions Assessment of Bulk Carriers in China’s East Coast-Yangtze River Maritime Network Based on Different Shipping Modes. Ocean Eng. 2022, 249, 110903. https://doi.org/10.1016/j.oceaneng.2022.110903. [CrossRef]
- Xu, Y.; Xiang, J.; Lv, J. Analysis of Air Quality in a Typical Mountainous County/City in Eastern China—A Case Study of Xinchang County. Energy Conservation and Environmental Protection 2022, No. 3, 44–46.
- Šabanovič, A.; Matijošius, J.; Marinković, D.; Chlebnikovas, A.; Gurauskis, D.; Gutheil, J. H.; Kilikevičius, A. Experimental Setup and Machine Learning-Based Prediction Model for Electro-Cyclone Filter Efficiency: Filtering of Ship Particulate Matter Emission. Atmosphere 2025, 16 (1), 103. https://doi.org/10.3390/atmos16010103. [CrossRef]
- Du, W.; Chen, L.; Wang, H.; Shan, Z.; Zhou, Z.; Li, W.; Wang, Y. Deciphering Urban Traffic Impacts on Air Quality by Deep Learning and Emission Inventory. J. Environ. Sci. 2023, 124, 745–757. https://doi.org/10.1016/j.jes.2021.12.035. [CrossRef]
- Ou, Y.; Bao, Z.; Thomas Ng, S.; Song, W. Estimating the Effect of Air Quality on Bike-Sharing Usage in Shanghai, China: An Instrumental Variable Approach. Travel Behav. Soc. 2023, 33, 100626. https://doi.org/10.1016/j.tbs.2023.100626. [CrossRef]
- Ting, Y.-C.; Ku, C.-H.; Zou, Y.-X.; Chi, K.-H.; Soo, J.-C.; Hsu, C.-Y.; Chen, Y.-C. Characteristics and Source-Specific Health Risks of Ambient PM2.5-Bound PAHs in an Urban City of Northern Taiwan. Aerosol Air Qual. Res. 2023, 23 (11), 230092. https://doi.org/10.4209/aaqr.230092. [CrossRef]
- Ding, C.; Sun, W.; Wang, S.; Zou, S. Analyzing the Sources of PM2.5 at a State-Controlled Atmospheric Monitoring Substation in Dalian City Using Big Data. Science & Technology Information 2023, *21* (6), 87–90. https://doi.org/10.16661/j.cnki.1672-3791.2208-5042-7257. [CrossRef]
- Jiang, W.; Gao, X.; Yan, H.; Guo, L.; Zhang, H.; Ran, Z. Temporal and Spatial Distribution Characteristics of PM2.5 and Their Relationship with Meteorological Conditions in the Coastal Area of Lianyungang. Technology Innovation and Application 2022, *12* (6),73–75. https://doi.org/10.19981/j.CN23-1581/G3.2022.06.020. [CrossRef]
- Wang, Y.; Li, H.; Yang, W. Analysis of Ambient Air Quality Changes and Improvement Measures in Lianyungang City During the “13th Five-Year Plan” Period. Shandong Chemical Industry 2022, *51* (4), 219–220,223. https://doi.org/10.19319/j.cnki.issn.1008-021x.2022.04.038.https://doi.org/10.19319/j.cnki.issn.1008-021x.2022.04.038. [CrossRef]
- Fang, X.; Gao, B.; Cui, S.; Ding, L.; Wang, L.; Shen, Y. Regional Differences in PM2.5 Environmental Efficiency and Its Driving Mechanism in Zhejiang Province, China. Atmosphere 2023, 14 (4), 672. https://doi.org/10.3390/atmos14040672. [CrossRef]
- Kuang, C.; Yu, W.; Yin, Y.; Han, D.; Li, S.; Kuang, J. Heterogeneity Environmental Regulation and Provincial Haze Pollution in China: An Empirical Study Based on Threshold Model. Environ. Dev. Sustainability 2023, 25 (12), 14715–14732. https://doi.org/10.1007/s10668-022-02685-w. [CrossRef]
- Rahaman, S.; Tu, X.; Ahmad, K.; Qadeer, A. A Real-Time Assessment of Hazardous Atmospheric Pollutants across Cities in China and India. Journal of Hazardous Materials 2024, 479, 135711. https://doi.org/10.1016/j.jhazmat.2024.135711. [CrossRef]
- Geng, J.; Wang, J.; Huang, J.; Zhou, D.; Bai, J.; Wang, J.; Zhang, H.; Duan, H.; Zhang, W. Quantification of the Carbon Emission of Urban Residential Buildings: The Case of the Greater Bay Area Cities in China. Environ. Impact Assess. Rev. 2022, 95, 106775. https://doi.org/10.1016/j.eiar.2022.106775. [CrossRef]
- Wang, T.; Li, K.; Liu, D.; Yang, Y.; Wu, D. Estimating the Carbon Emission of Construction Waste Recycling Using Grey Model and Life Cycle Assessment: A Case Study of Shanghai. Int. J. Environ. Res. Public Health 2022, 19 (14), 8507. https://doi.org/10.3390/ijerph19148507. [CrossRef]
- Yang, G.; Zhang, Q.; Zhao, Z.; Zhou, C. How Does the “Zero-Waste City” Strategy Contribute to Carbon Footprint Reduction in China? Waste Management 2023, 156, 227–235. https://doi.org/10.1016/j.wasman.2022.11.032. [CrossRef]
- Liao, N.; Bolyard, S. C.; Lü, F.; Yang, N.; Zhang, H.; Shao, L.; He, P. Can Waste Management System Be a Greenhouse Gas Sink? Perspective from Shanghai, China. Resources, Conservation and Recycling 2022, 180, 106170. https://doi.org/10.1016/j.resconrec.2022.106170. [CrossRef]
- Ali, Md. A.; Assiri, M. E.; Islam, M. N.; Bilal, M.; Ghulam, A.; Huang, Z. Identification of NO2 and SO2 over China: Characterization of Polluted and Hotspots Provinces. Air Qual. Atmos. Health 2024, 17 (10), 2203–2221. https://doi.org/10.1007/s11869-024-01565-8. [CrossRef]
- Hua, E.; Sun, R.; Feng, P.; Song, L.; Han, M. Optimizing Onshore Wind Power Installation within China via Geographical Multi-Objective Decision-Making. Energy 2024, 307, 132431. https://doi.org/10.1016/j.energy.2024.132431. [CrossRef]
- Li, J.; Li, S.; Zeng, Y.; Zhou, X.; Zeng, L.; Liu, M.; Cao, C.; Xia, Y.; Gao, J. Cooking-Related Thermal Comfort and Carbon Emissions Assessment: Comparison between Electric and Gas Cooking in Air-Conditioned Kitchens. Build. Environ. 2024, 265, 111992. https://doi.org/10.1016/j.buildenv.2024.111992. [CrossRef]
- Wei, F.; Walls, W. D.; Zheng, X.; Li, G. Evaluating Environmental Benefits from Driving Electric Vehicles: The Case of Shanghai, China. Transp. Res. Part D Transp. Environ. 2023, 119, 103749. https://doi.org/10.1016/j.trd.2023.103749. [CrossRef]
- Zhang, S.; Jiang, Y.; Zhang, S.; Choma, E. F. Health Benefits of Vehicle Electrification through Air Pollution in Shanghai, China. Sci. Total Environ. 2024, 914, 169859. https://doi.org/10.1016/j.scitotenv.2023.169859. [CrossRef]
- Dai, W.; Wang, S.; Zhang, S.; Zhu, J.; Gu, C.; Sun, Z.; Xue, R.; Zhou, B. A New Portable Open-Path Instrument for Ambient NH3 and on-Road Emission Measurements. J. Environ. Sci. 2024, 136, 606–614. https://doi.org/10.1016/j.jes.2023.01.017. [CrossRef]
- Wu, C.; Lv, S.; Wang, F.; Liu, X.; Li, J.; Liu, L.; Zhang, S.; Du, W.; Liu, S.; Zhang, F.; Li, J.; Meng, J.; Wang, G. Ammonia in Urban Atmosphere Can Be Substantially Reduced by Vehicle Emission Control: A Case Study in Shanghai, China. Journal of Environmental Sciences 2023, 126, 754–760. https://doi.org/10.1016/j.jes.2022.04.043. [CrossRef]
- Ji, A.; Guan, J.; Zhang, S.; Ma, X.; Jing, S.; Yan, G.; Liu, Y.; Li, H.; Zhao, H. Environmental and Economic Assessments of Industry-Level Medical Waste Disposal Technologies–a Case Study of Ten Chinese Megacities. Waste Manage. (Oxford) 2024, 174, 203–217. https://doi.org/10.1016/j.wasman.2023.11.036. [CrossRef]
- Guo, H.; Zhou, F.; Zhang, Y.; Yang, Z. Quantitative Analysis of Sulfur Dioxide Emissions in the Yangtze River Economic Belt from 1997 to 2017, China. Int. J. Environ. Res. Public Health 2022, 19 (17), 10770. https://doi.org/10.3390/ijerph191710770. [CrossRef]
- Ren, H.; Dong, W.; Zhang, Q.; Cheng, J. Identification of Priority Pollutants at an Integrated Iron and Steel Facility Based on Environmental and Health Impacts in the Yangtze River Delta Region, China. Ecotoxicol. Environ. Saf. 2023, 264, 115464. https://doi.org/10.1016/j.ecoenv.2023.115464. [CrossRef]
- Zhu, J.; Guo, B.; Qie, F.; Li, X.; Zhao, X.; Rong, J.; Zong, B. A Sustainable Integration of Removing CO2/NO and Producing Biomass with High Content of Lipid/Protein by Microalgae. J. Energy Chem. 2022, 73, 13–25. https://doi.org/10.1016/j.jechem.2022.04.008. [CrossRef]
- Zhou, J.; Bai, X.; Tian, J. Study on the Impact of Electric Power and Thermal Power Industry of Beijing–Tianjin–Hebei Region on Industrial Sulfur Dioxide Emissions—from the Perspective of Green Technology Innovation. Energy Reports 2022, 8, 837–849. https://doi.org/10.1016/j.egyr.2022.02.039. [CrossRef]
- He, T.; Qian, X.; Huang, J.; Li, G.; Guo, X. A Mediation Analysis of Meteorological Factors on the Association between Ambient Carbon Monoxide and Tuberculosis Outpatients Visits. Front. Public Health 2025, 13, 1526325. https://doi.org/10.3389/fpubh.2025.1526325. [CrossRef]
- Xing, C.; Liu, C.; Lin, J.; Tan, W.; Liu, T. VOCs Hyperspectral Imaging: A New Insight into Evaluate Emissions and the Corresponding Health Risk from Industries. Journal of Hazardous Materials 2024, 461, 132573. https://doi.org/10.1016/j.jhazmat.2023.132573. [CrossRef]
- Zhang, Z.; Guo, J.; Zhang, H.; Xiong, Y.; Li, J.; Wu, K.; He, W. Research on Real-Time Self-Calibration Method for SO2 UV Cameras. Acta Optica Sinica 2023, *43* (12), 1228005. https://doi.org/10.3788/AOS221512. [CrossRef]
- Shifting from End-of-Pipe Supervision to Whole-Process Control: Effectively Enhancing the Level of Atmospheric Environmental Governance—Ningbo Municipal Bureau of Ecology and Environment, Zhenhai Branch. Ningbo Communications 2023, No. 8, 74–75.
- Sun, T.; Luo, Y.; Zhang, Z. Collaborative Governance of Air Pollution Caused by Energy Consumption in the Yangtze River Delta Urban Agglomeration under Low-Carbon Constraints: Efficiency Measurement and Spatial Empirical Testing. Water, Air, Soil Pollut. 2023, 234 (9), 566. https://doi.org/10.1007/s11270-023-06579-z. [CrossRef]
- Xie, S. Research on Ozone Characteristics and Control Strategy Methods in Longwen District, Zhangzhou City, Fujian Province. Ecology and Resources 2024, No. 12, 22–24.
- Zhao, S.; Zhao, D.; Song, Q. Comparative Lifecycle Greenhouse Gas Emissions and Their Reduction Potential for Typical Petrochemical Enterprises in China. J. Environ. Sci. 2022, 116, 125–138. https://doi.org/10.1016/j.jes.2021.05.031. [CrossRef]
- Qu, Y.; Li, J.; Wang, S. Green Total Factor Productivity Measurement of Industrial Enterprises in Zhejiang Province, China: A DEA Model with Undesirable Output Approach. Energy Reports 2022, 8, 307–317. https://doi.org/10.1016/j.egyr.2022.05.094. [CrossRef]
- Mu, H.; Hou, X.; Wu, Z.; Li, J.; Wang, W.; Lu, M.; Liu, X.; Yao, Z. Pollution Characteristics and Ecological Impact of Screening Analysis of Fishing Port Sediments from Dalian, North China. Environ. Health 2024, 2 (10), 702–711. https://doi.org/10.1021/envhealth.4c00042. [CrossRef]
- Chen, Y.; Yang, K.; Yang, M.; Lu, S.; Zhu, Y.; Xu, L.; Qian, M.; Shi, L. Screening of Priority Pollutants and Discussion on Coordinated Monitoring in the Yangtze River Delta Eco-Green Integration Demonstration Zone. Resources and Environment in the Yangtze Basin 2022, *31* (2), 358–365.
- Huang, M. Water Quality Assessment and Pollution Prevention Countermeasures for Huashanxi in Pinghe County. Strait Science 2024, No. 3, 80–83.
- Hu, L.; Jia, G.; Zhang, L. Water Quality Assessment and Pollution Characteristic Analysis of Reservoir-Type Water Sources in Dalian City. Green Science and Technology 2024, *26* (12), 64–70. https://doi.org/10.16663/j.cnki.lskj.2024.12.039. [CrossRef]
- Qiu, J. Comprehensive Evaluation and Analysis of Water Environmental Quality in Major River Systems in the Shanghai Area. Design of Water Resources & Hydropower Engineering 2025, *44* (1), 13–16. https://doi.org/10.20275/j.cnki.issn.1007-6980.2025.01.003. [CrossRef]
- Sun, C.; Wang, X.; Qiao, X. Multimedia Fate Simulation of Mercury in a Coastal Urban Area Based on the Fugacity/Aquivalence Method. Sci. Total Environ. 2024, 915, 170084. https://doi.org/10.1016/j.scitotenv.2024.170084. [CrossRef]
- Wang, Q.; Xu, H.; Gan, S.; Sun, R.; Zheng, Y.; Craig, N. J.; Sheng, W.; Li, J.-Y. Antibiotics and Endocrine Disrupting Chemicals in Effluent from Wastewater Treatment Plants of a Mega-City Affected the Water Quality of Juvenile Chinese Sturgeon Habitat: Upgrades to Wastewater Treatment Processes Are Needed. Marine Pollution Bulletin 2025, 215, 117840. https://doi.org/10.1016/j.marpolbul.2025.117840. [CrossRef]
- Li, H.; Jin, W.; Zhang, W.; Hu, F.; Ye, J. Research on Comprehensive Treatment of Rural Domestic Sewage in China. Strategic Study of CAE 2022, *24* (5), 154–160. [CrossRef]
- Zhou, H.; Jiang, L.; Xue, S. Analysis of Influent Fluctuation and Operation Strategy of a Wastewater Treatment Plant in Shanghai During the Silent Management Period. China Water & Wastewater 2022, *38* (19), 1–7. https://doi.org/10.19853/j.zgjsps.1000-4602.2022.19.001. [CrossRef]
- Shi, Y.; Zhan, Q.; Zhang, L.; Wang, M.; Ye, H.; Huang, X.; Yang, G.; Cai, Y. Comparison of the Capacity and Characteristics of Representative Floating Plants for Removing Heavy Metals in Phytoremediation. Asian Journal of Ecotoxicology 2022, *17* (3), 316–325.
- Shi, Y.; Zhan, Q.; Zhang, L.; Wang, M.; Wu, D.; Lou, X.; Cai, Y. Study on the Prevention and Remediation Effect of Floating Plants on Heavy Metal Pollution in Freshwater Aquatic Products—Using Silver Crucian Carp as a Model. Quality and Safety of Agro-Products 2022, No. 1, 83–89.
- Liu, S.; Sun, F.; Ji, Y. Analysis of Spatiotemporal Distribution of Suspended Solids and Tidal Influence in Shanghai’s Major Rivers and Lakes. Water Resources Protection 2025, *41* (1), 178–185.
- Jiang, L.; Chen, M.; Huang, Y.; Peng, J.; Zhao, J.; Chan, F.; Yu, X. Effects of Different Treatment Processes in Four Municipal Wastewater Treatment Plants on the Transport and Fate of Microplastics. Sci. Total Environ. 2022, 831, 154946. https://doi.org/10.1016/j.scitotenv.2022.154946. [CrossRef]
- Perez, C. N.; Carré, F.; Hoarau-Belkhiri, A.; Joris, A.; Leonards, P. E. G.; Lamoree, M. H. Innovations in Analytical Methods to Assess the Occurrence of Microplastics in Soil. J. Environ. Chem. Eng. 2022, 10 (3), 107421. https://doi.org/10.1016/j.jece.2022.107421. [CrossRef]
- Ding, Q.; Wang, H.; Yu, D.; Song, J.; Zhang, G.; Wang, Y. Basic Data Platform for Environmental Capacity and Carrying Capacity Calculation of Soil Organic Pollutants in Ningbo. Journal of Agro-Environment Science 2024, *43* (11), 2604–2614.
- Guo, Y.; Lin, K.; Gao, X.; Zheng, Q.; Zhou, T.; Zhao, Y. Disinfection Efficacy of Slightly Acidic Electrolyzed Water on Microorganisms: Application in Contaminated Waste Sorting Rooms across Varied Scenarios. J. Cleaner Prod. 2024, 467, 142938. https://doi.org/10.1016/j.jclepro.2024.142938. [CrossRef]
- Li, C.; Ling, L.; Tan, J.; Lin, X.; Wang, H.; Sun, B.; Li, Z. Challenges, Breakthroughs, and Prospects of Environmental DNA Technology in Aquatic Biological Monitoring. Journal of Shanghai Ocean University 2023, *32* (3), 564–574.
- Hu, L.; Xue, J.; Wu, H. Composition and Distribution of Bacteria, Pathogens, and Antibiotic Resistance Genes at Shanghai Port, China. Water 2024, 16 (18), 2569. https://doi.org/10.3390/w16182569. [CrossRef]
- Zhao, H.; Li, X.; Shen, X. Monitoring, Evaluation, and Prevention Measures of Road Traffic Noise in Areas Outside the Central Urban District of Dalian. Environmental Protection and Circular Economy 2023, *43* (3), 62–64.
- Zhou, Y. Practice of Urban Acoustic Environmental Protection—A Case Study of Environmental Noise Control in Shanghai. China Environmental Protection Industry 2022, No. 6, 25–29.
- Duan, D.; Leng, P.; Li, X.; Mao, G.; Wang, A.; Zhang, D. Characteristics and Occupational Risk Assessment of Occupational Silica-Dust and Noise Exposure in Ferrous Metal Foundries in Ningbo, China. Front. Public Health 2023, 11, 1049111. https://doi.org/10.3389/fpubh.2023.1049111. [CrossRef]
Figure 1.
The Historical trajectory of the Petrochemical Industry’s Global Environmental Impact.
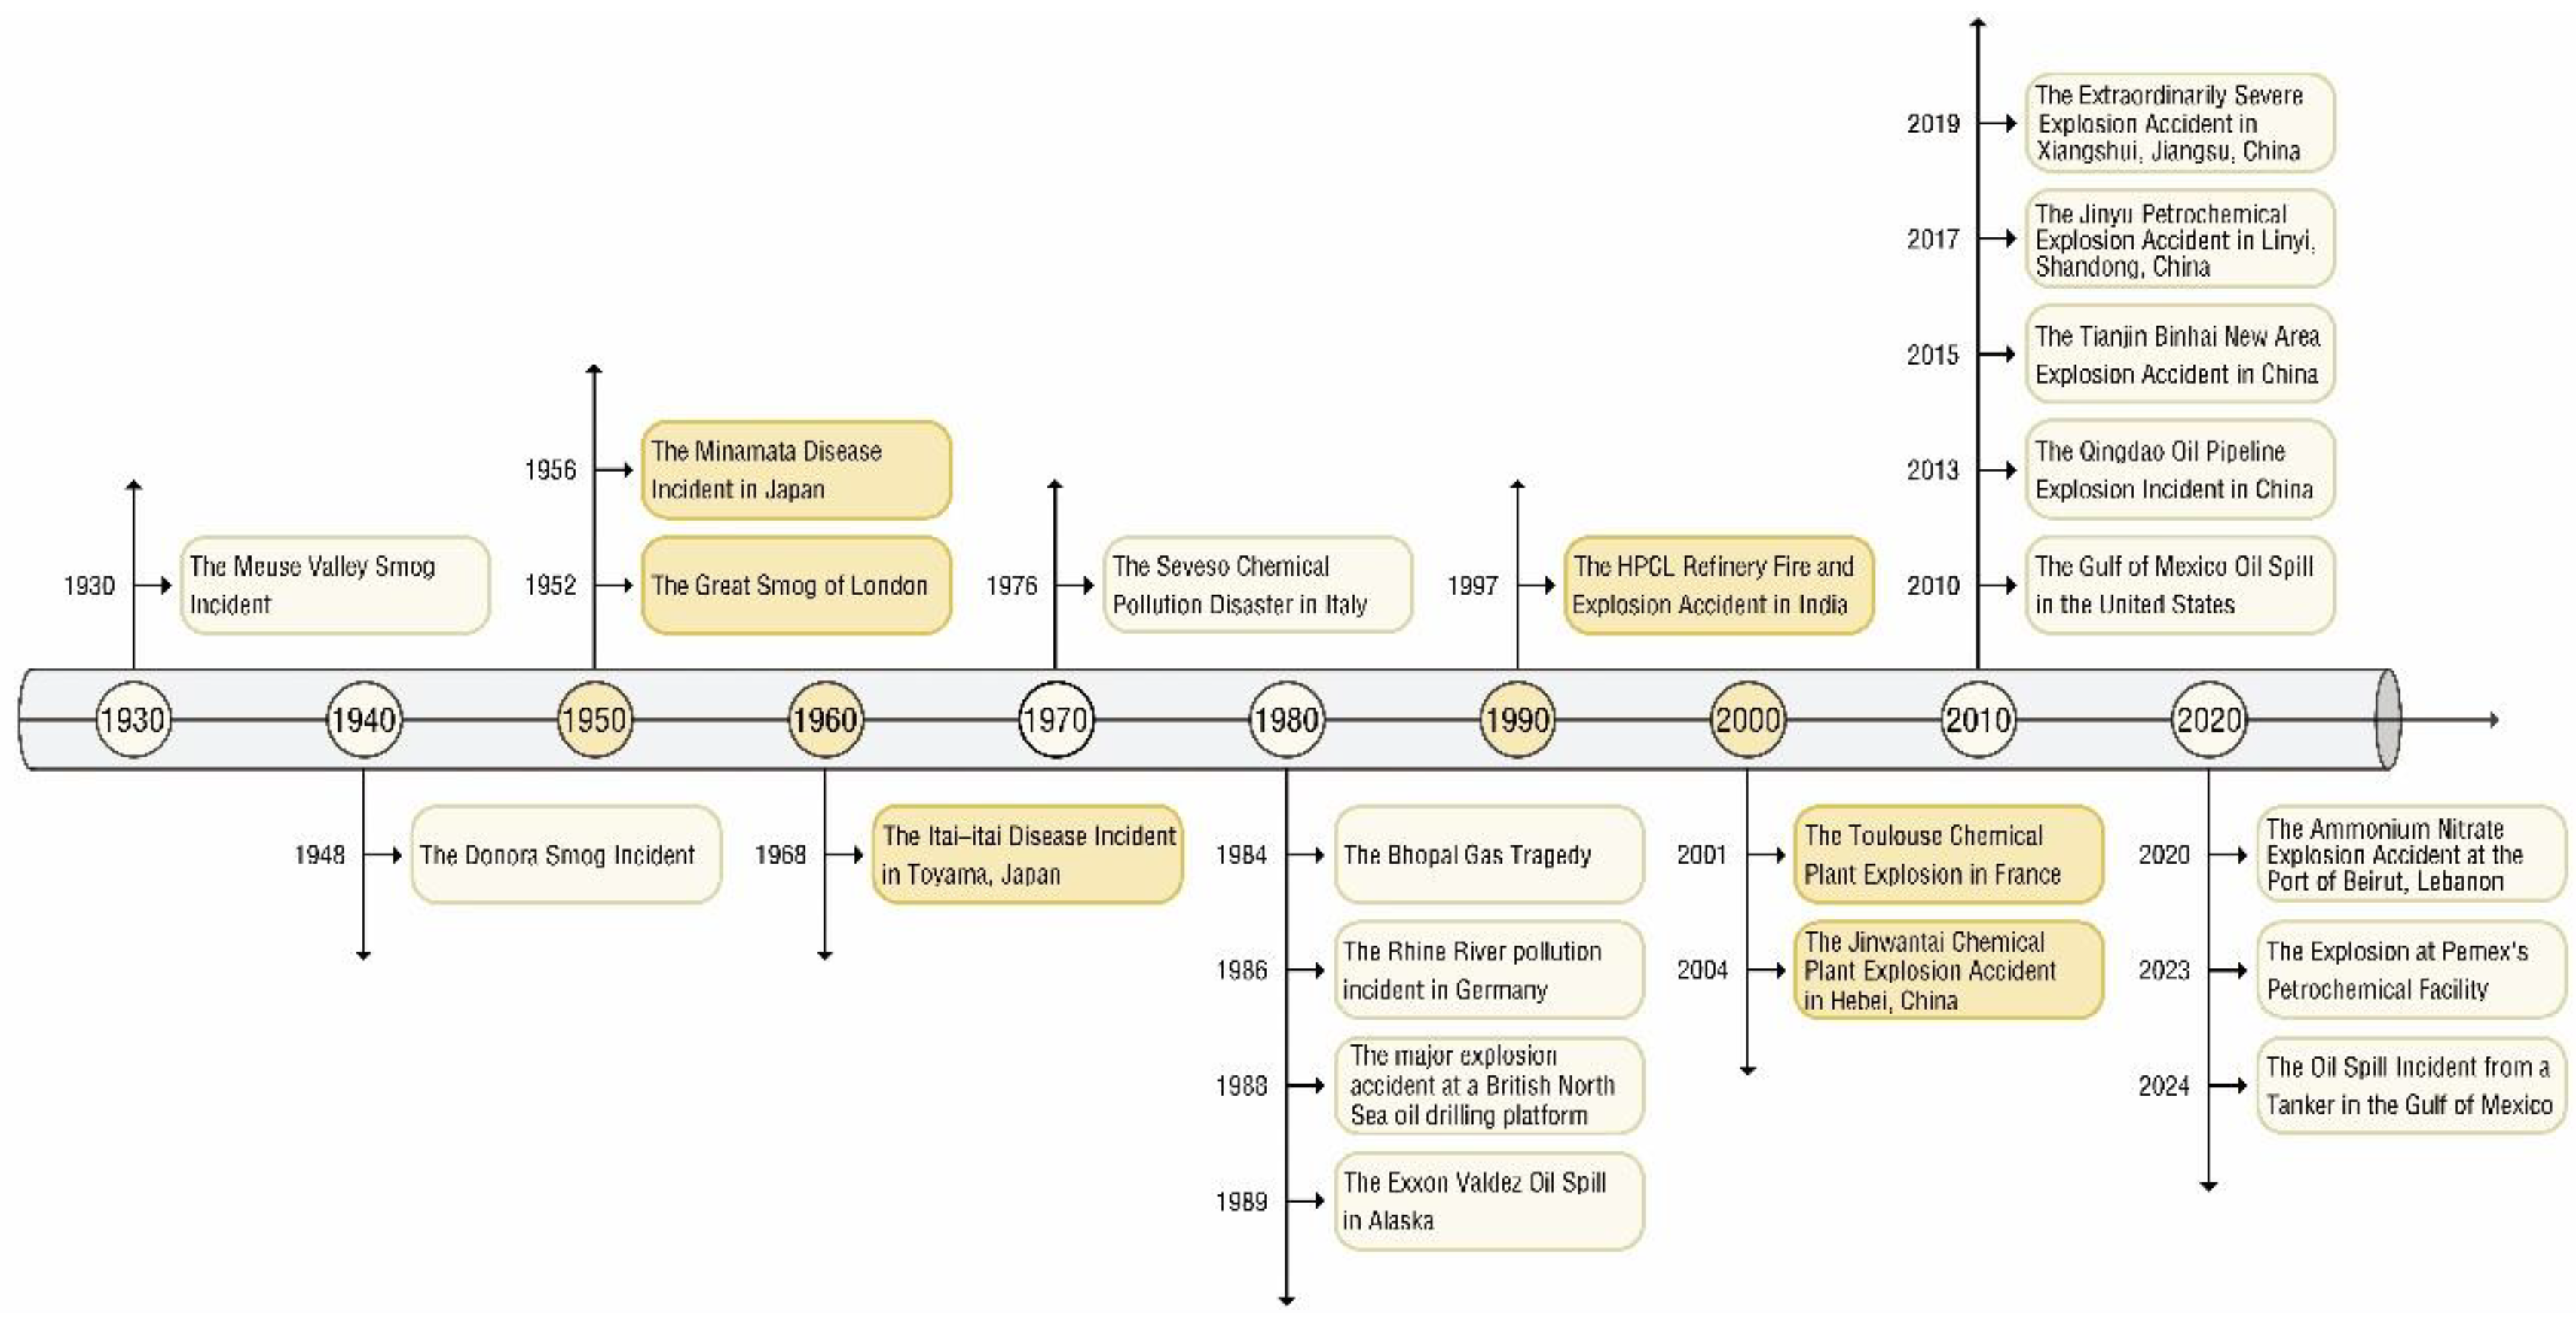
Figure 2.
Geographical and Petrochemical Industry Profiles of the Seven Major Petrochemical Port Cities in China.
Figure 2.
Geographical and Petrochemical Industry Profiles of the Seven Major Petrochemical Port Cities in China.

Figure 3.
The Logical Framework of this Study’s Methodology.
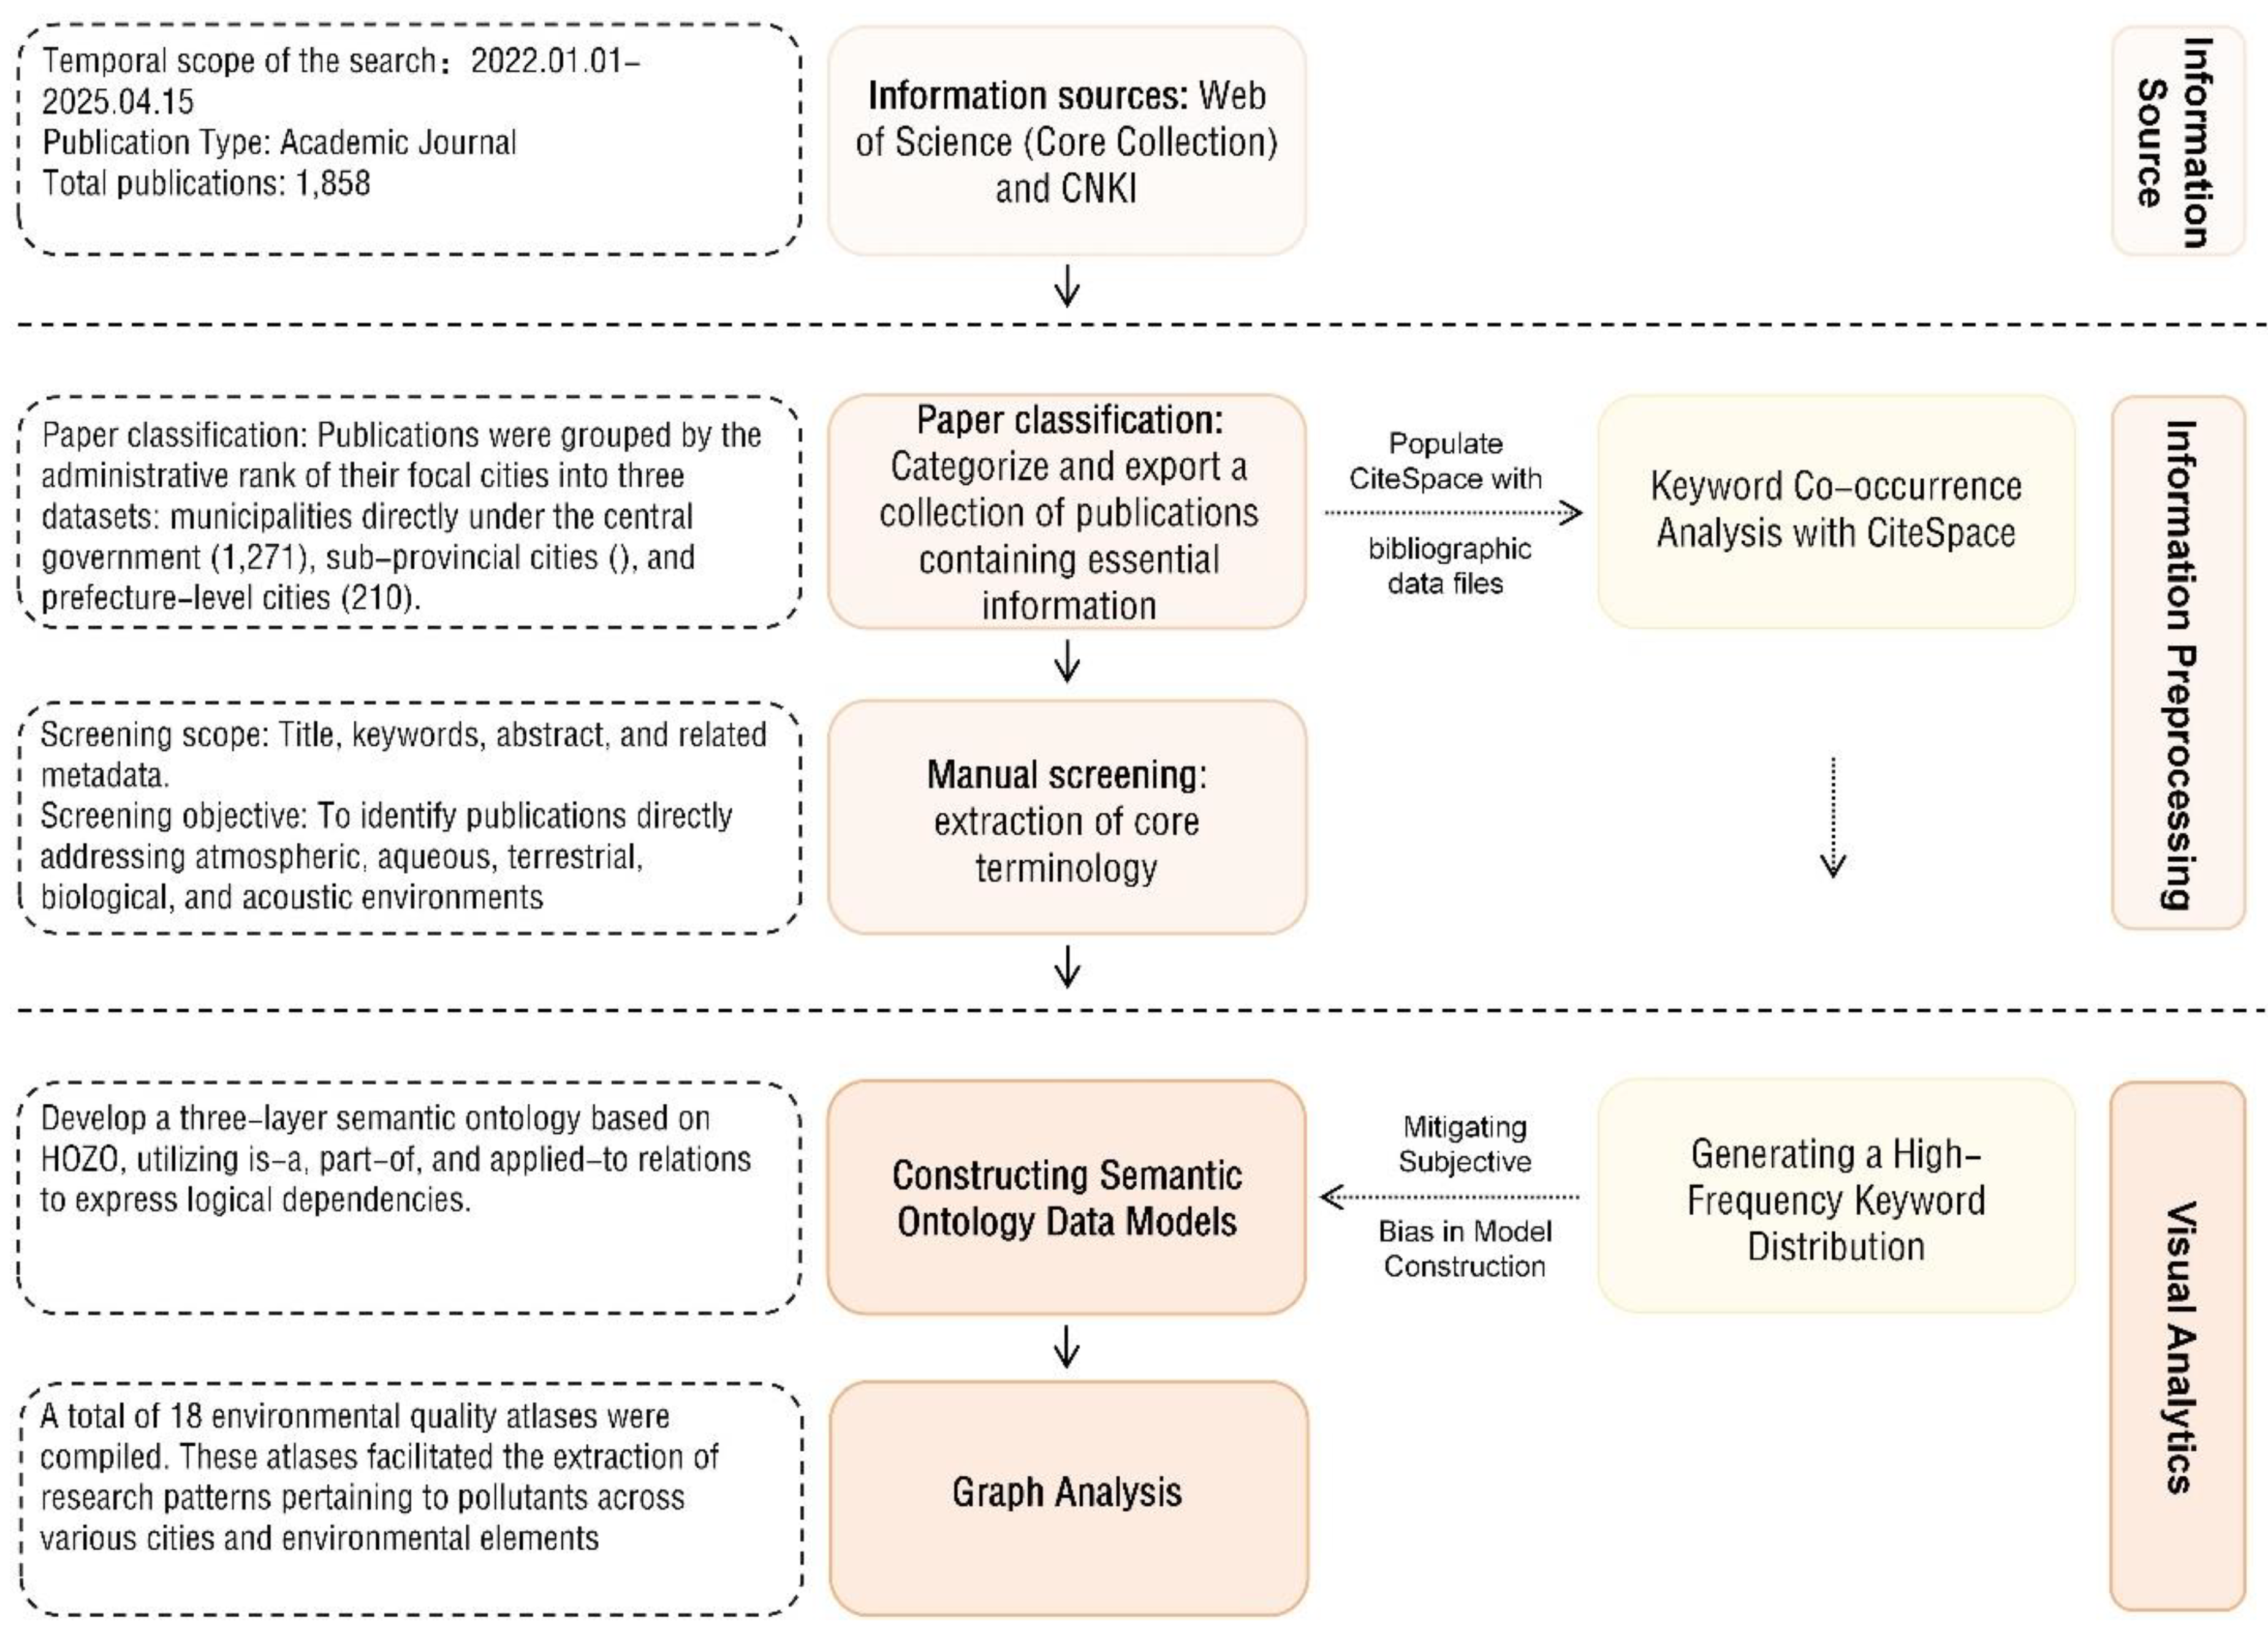
Figure 4.
The PRISMA flow diagram of the search and selection process.
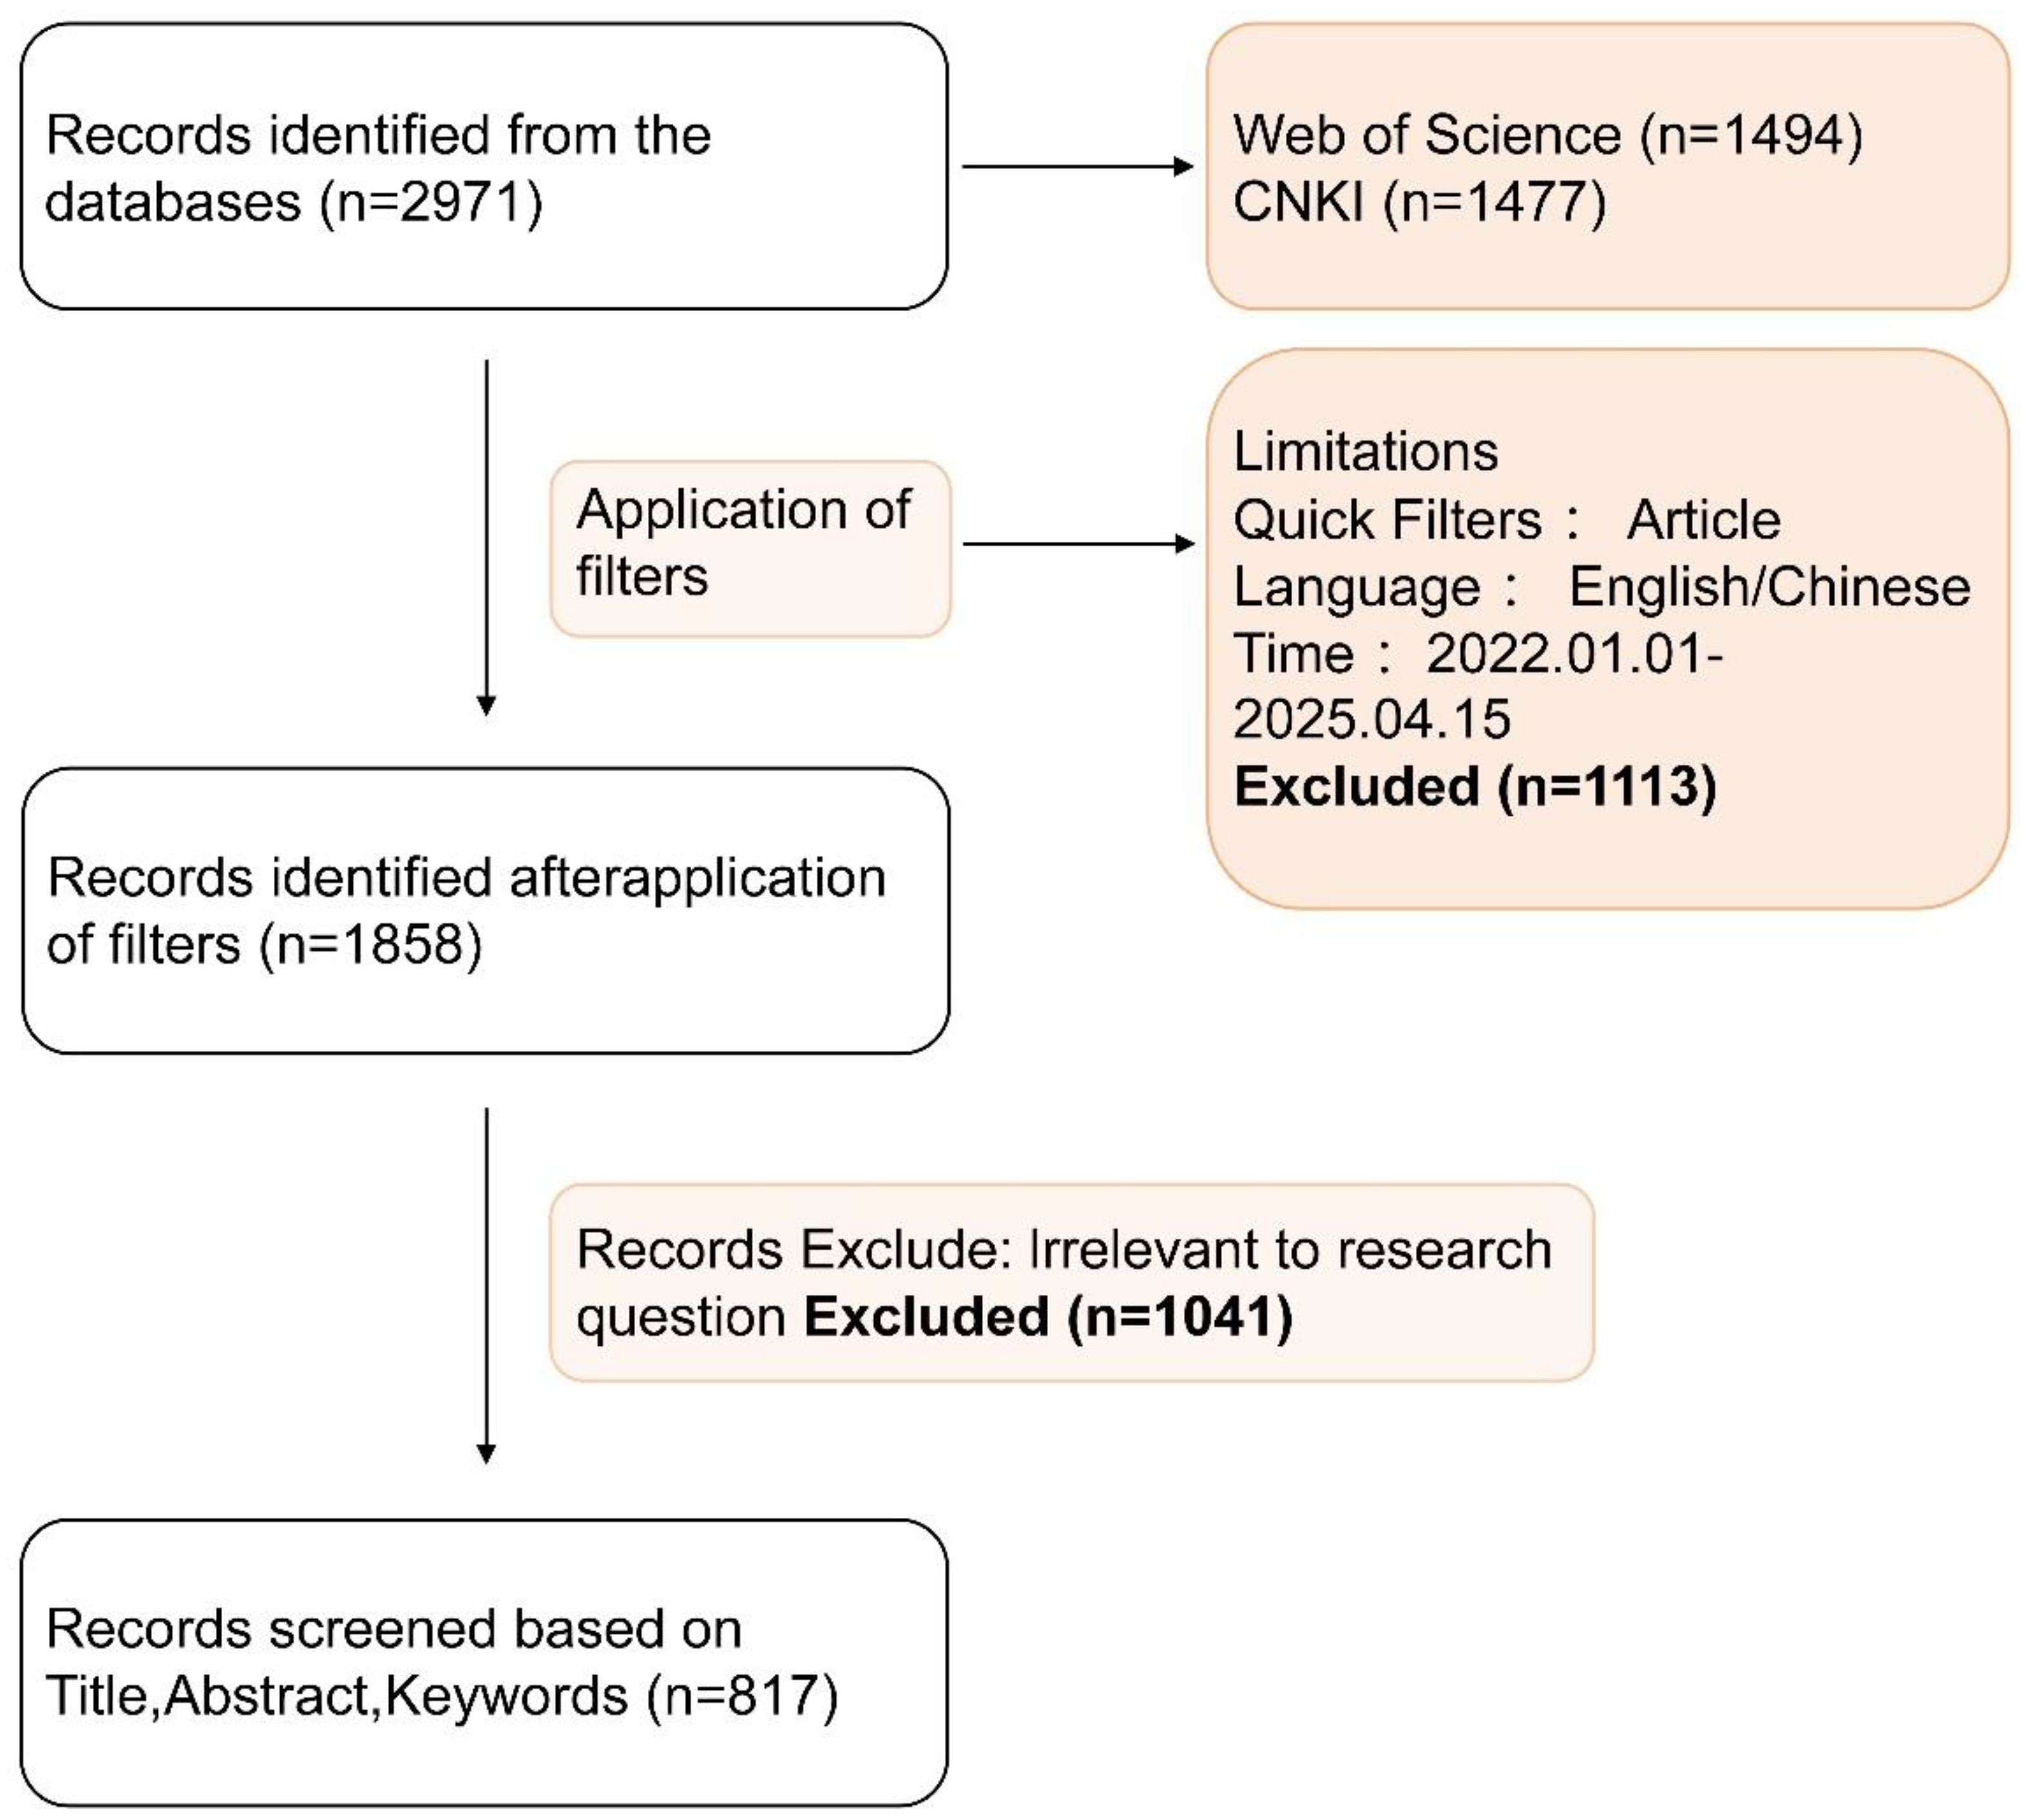
Figure 5.
Semantic Ontology Mapping of Aerosols in Municipalities Directly Under the Central Government.
Figure 5.
Semantic Ontology Mapping of Aerosols in Municipalities Directly Under the Central Government.
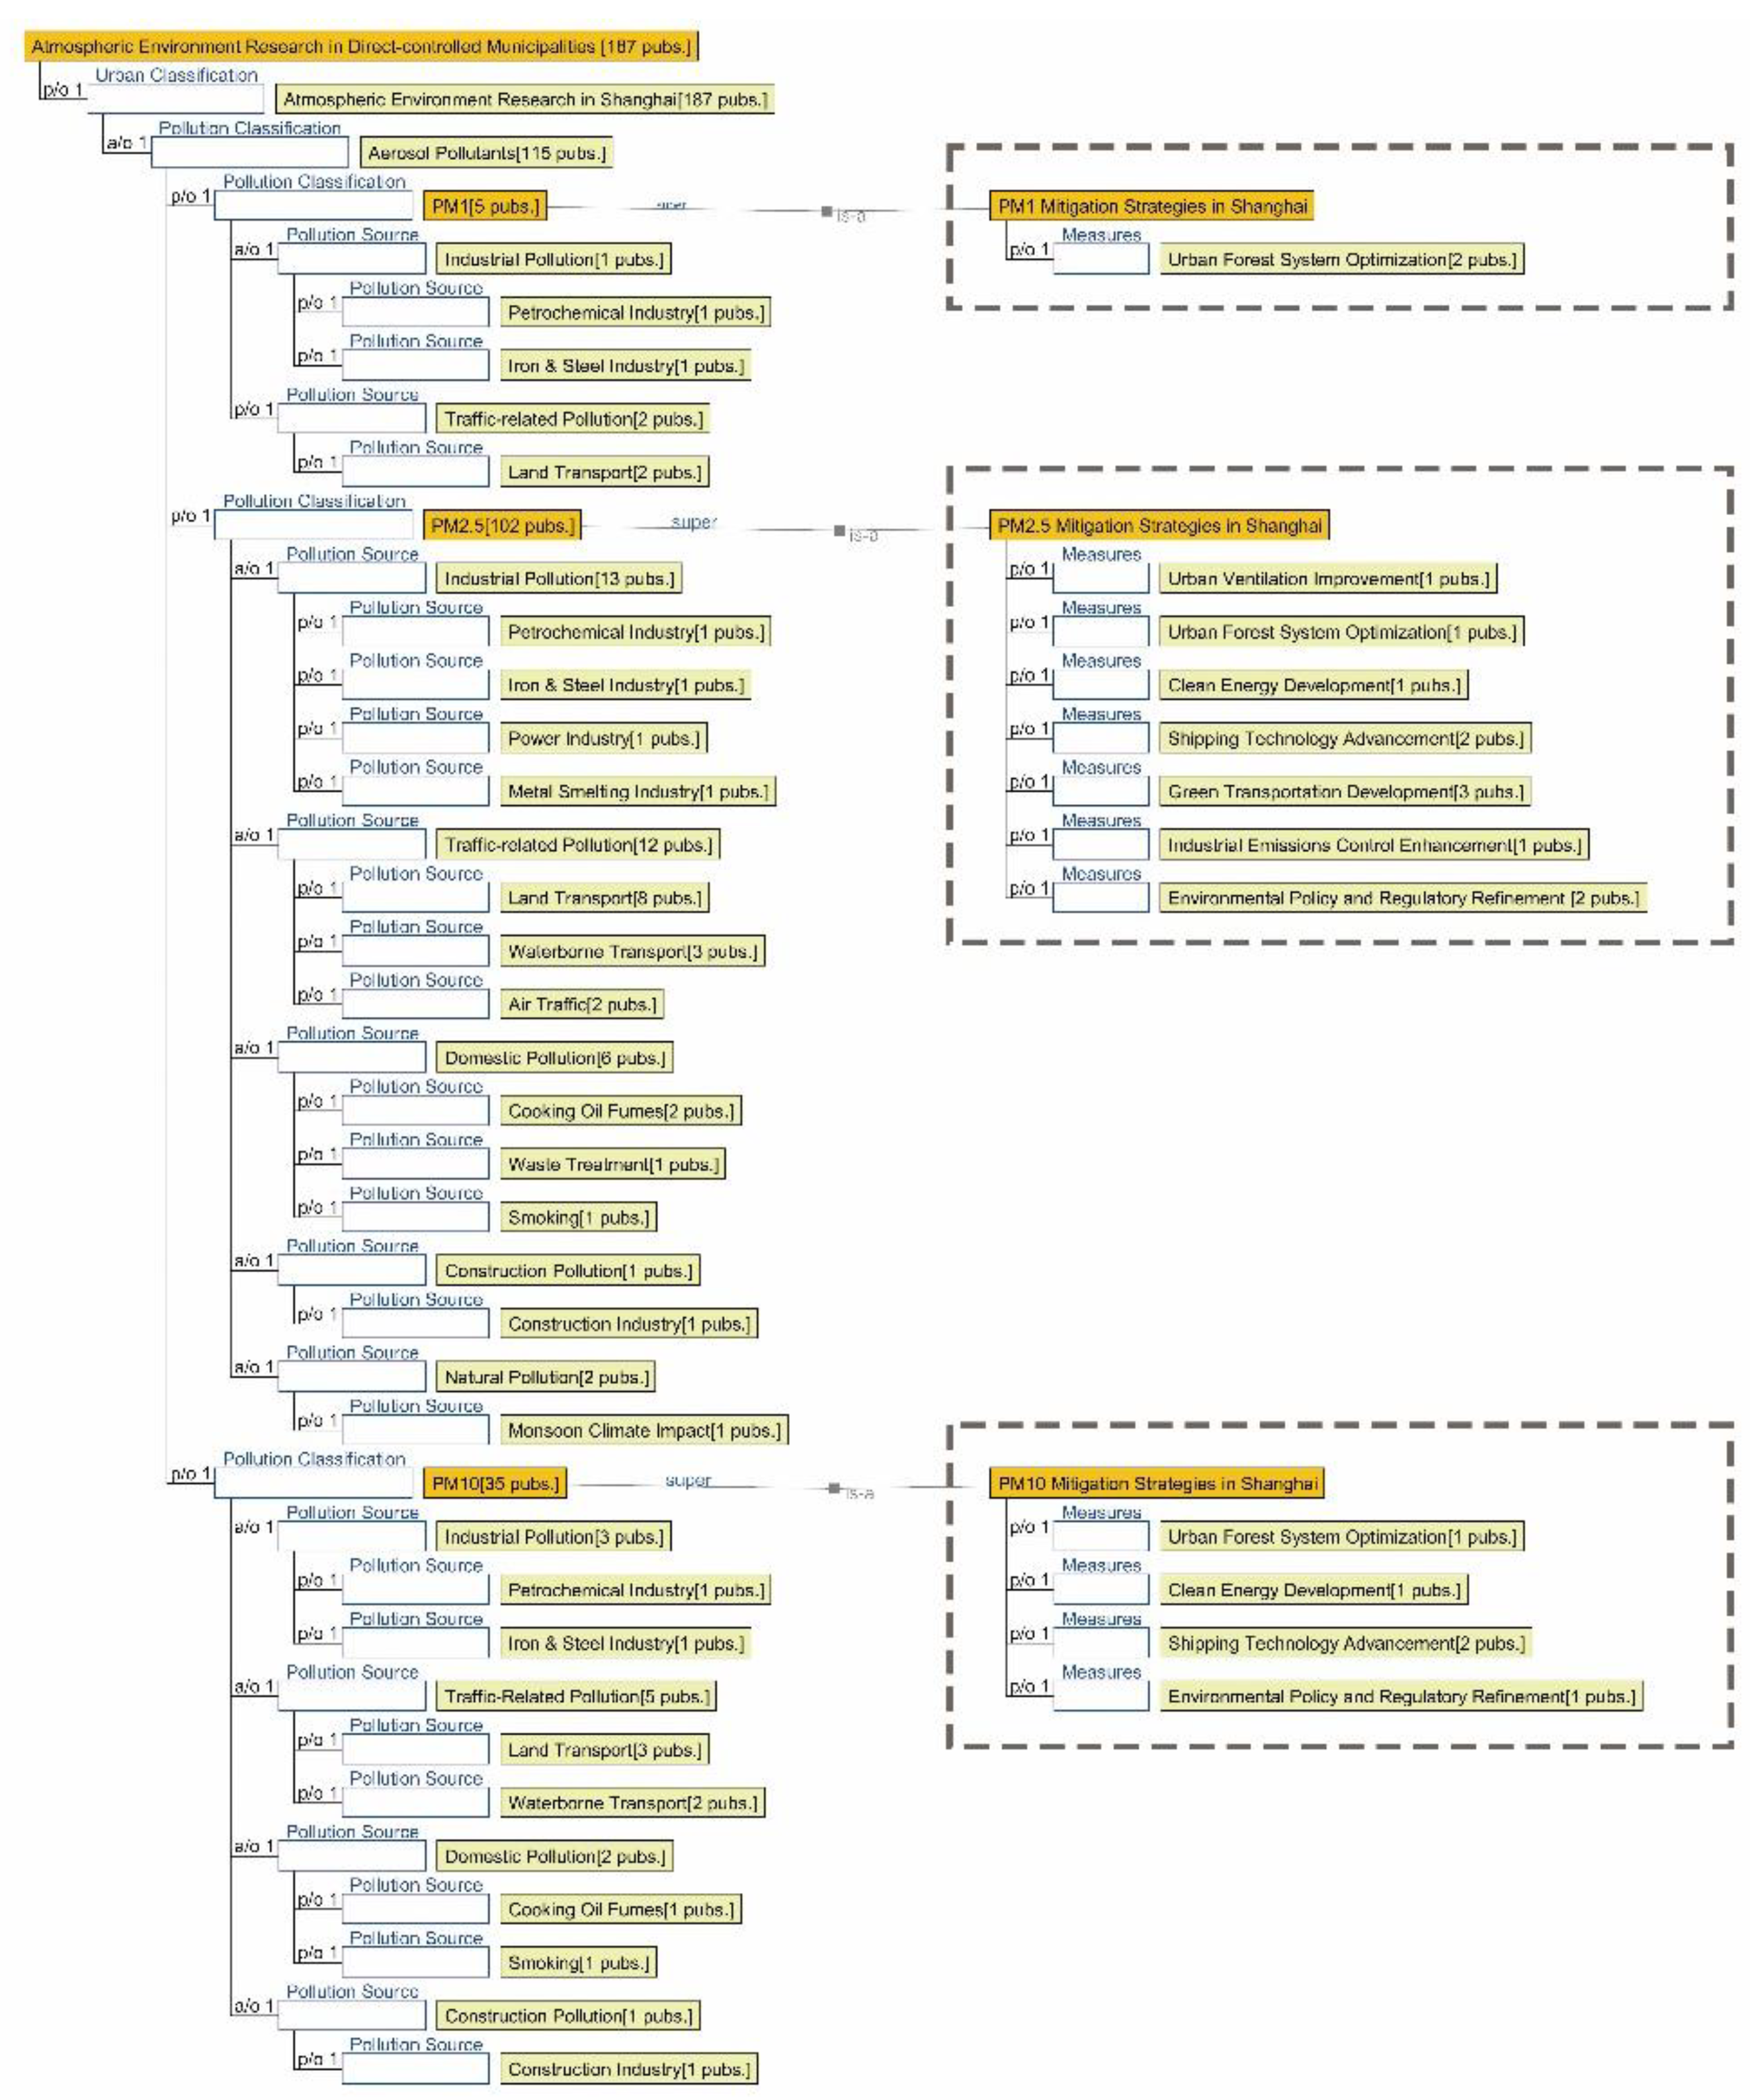
Figure 6.
Semantic Ontology Mapping of Aerosols in Sub-Provincial Level Cities.
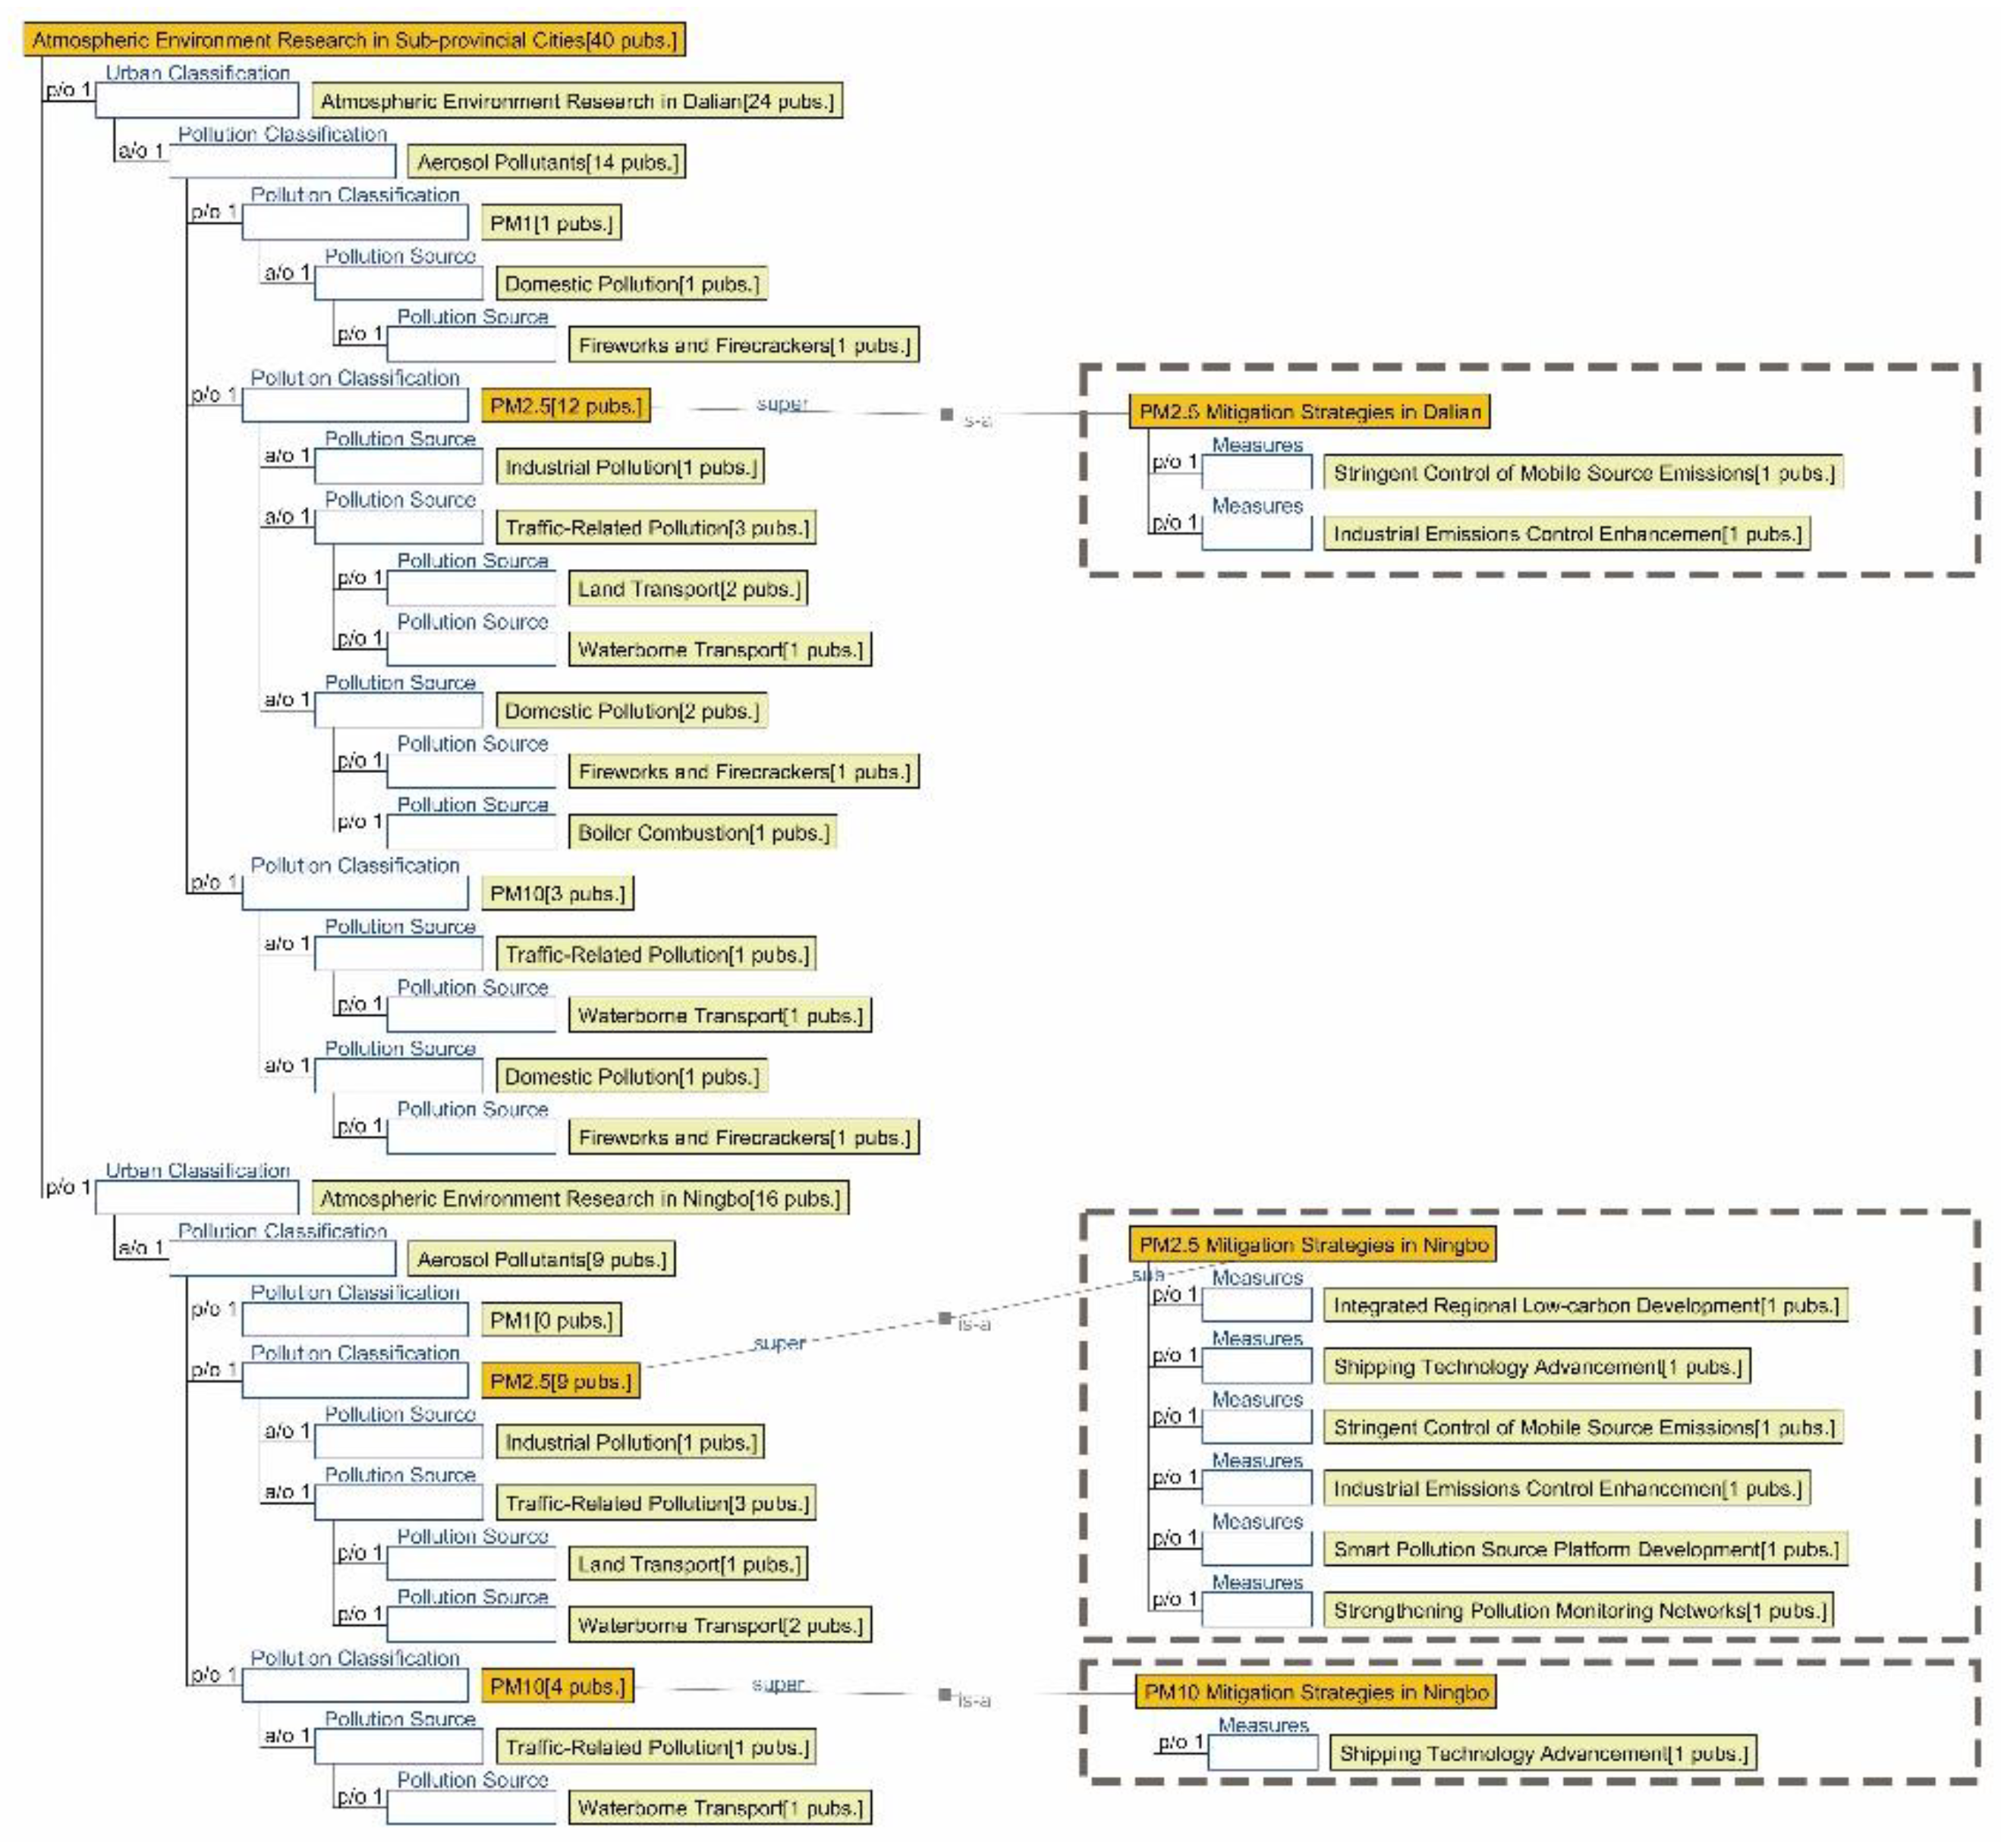
Figure 7.
Semantic Ontology Mapping of Aerosols in Prefecture-Level Cities.
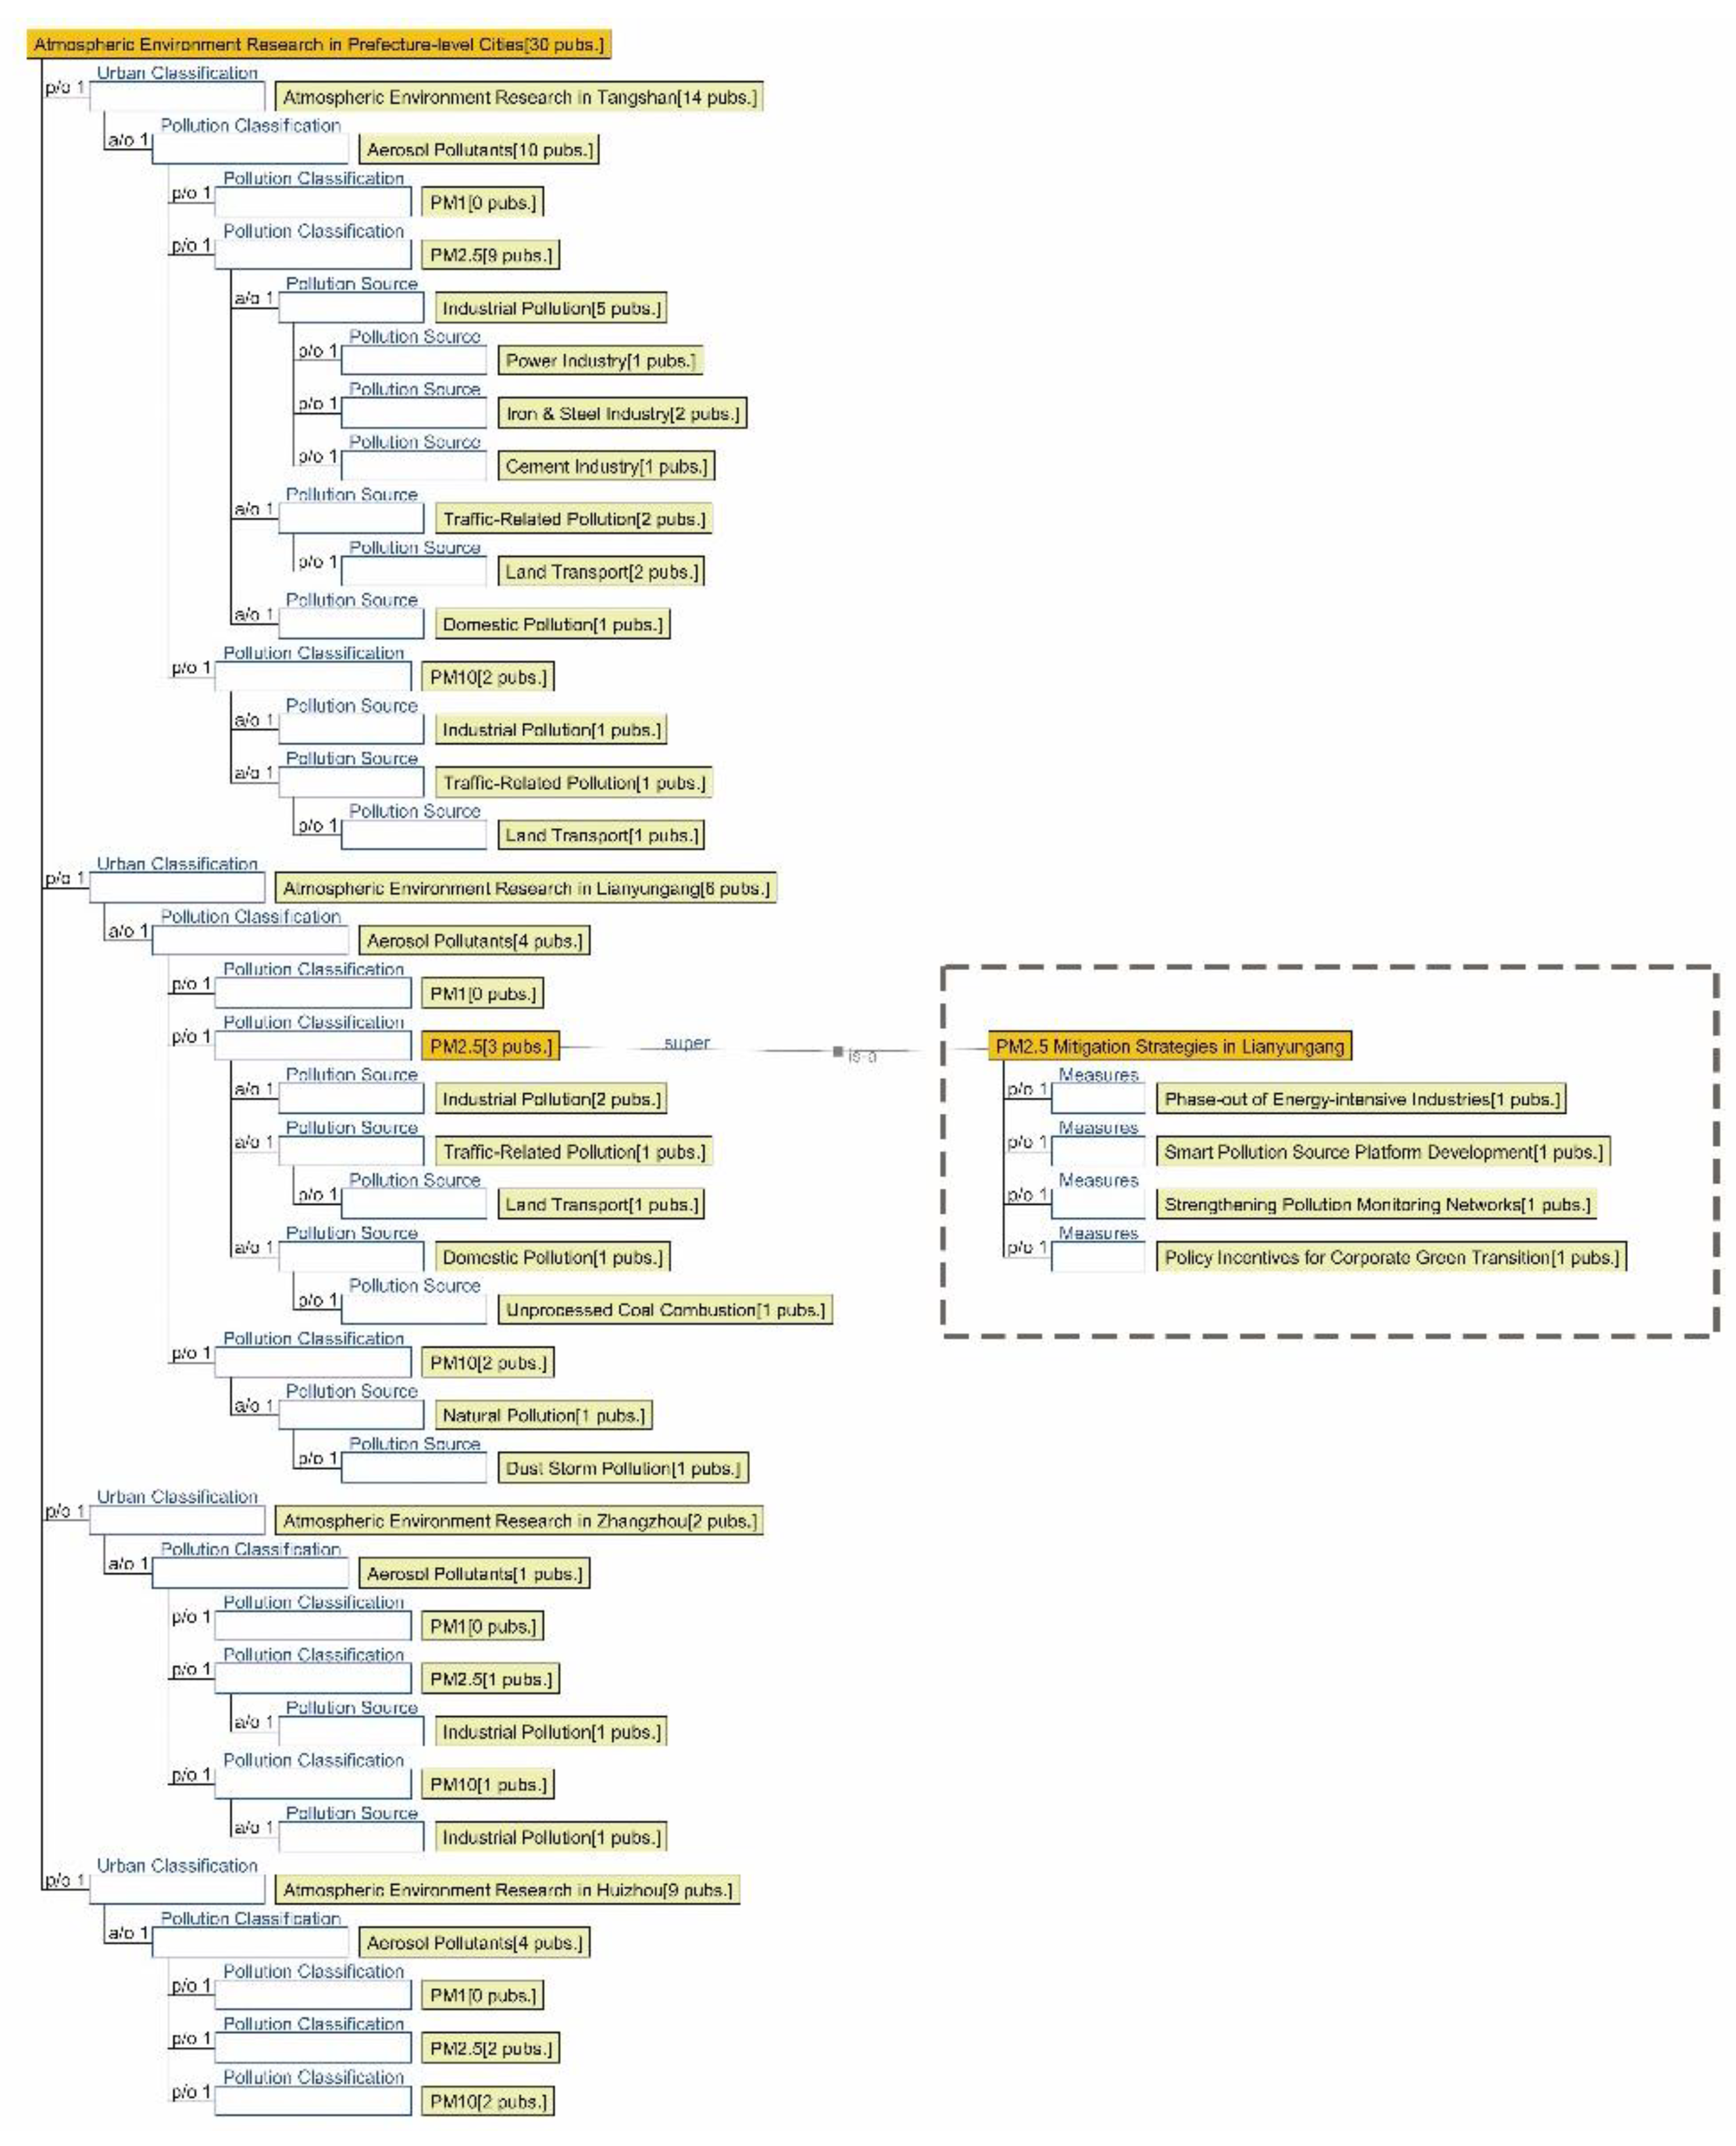
Figure 8.
Statistics on the number of papers addressing correlations among aerosol pollution sources across different cities.
Figure 8.
Statistics on the number of papers addressing correlations among aerosol pollution sources across different cities.

Figure 9.
Semantic Ontology Mapping of Gaseous Pollutants in Municipalities Directly Under the Central Government.
Figure 9.
Semantic Ontology Mapping of Gaseous Pollutants in Municipalities Directly Under the Central Government.
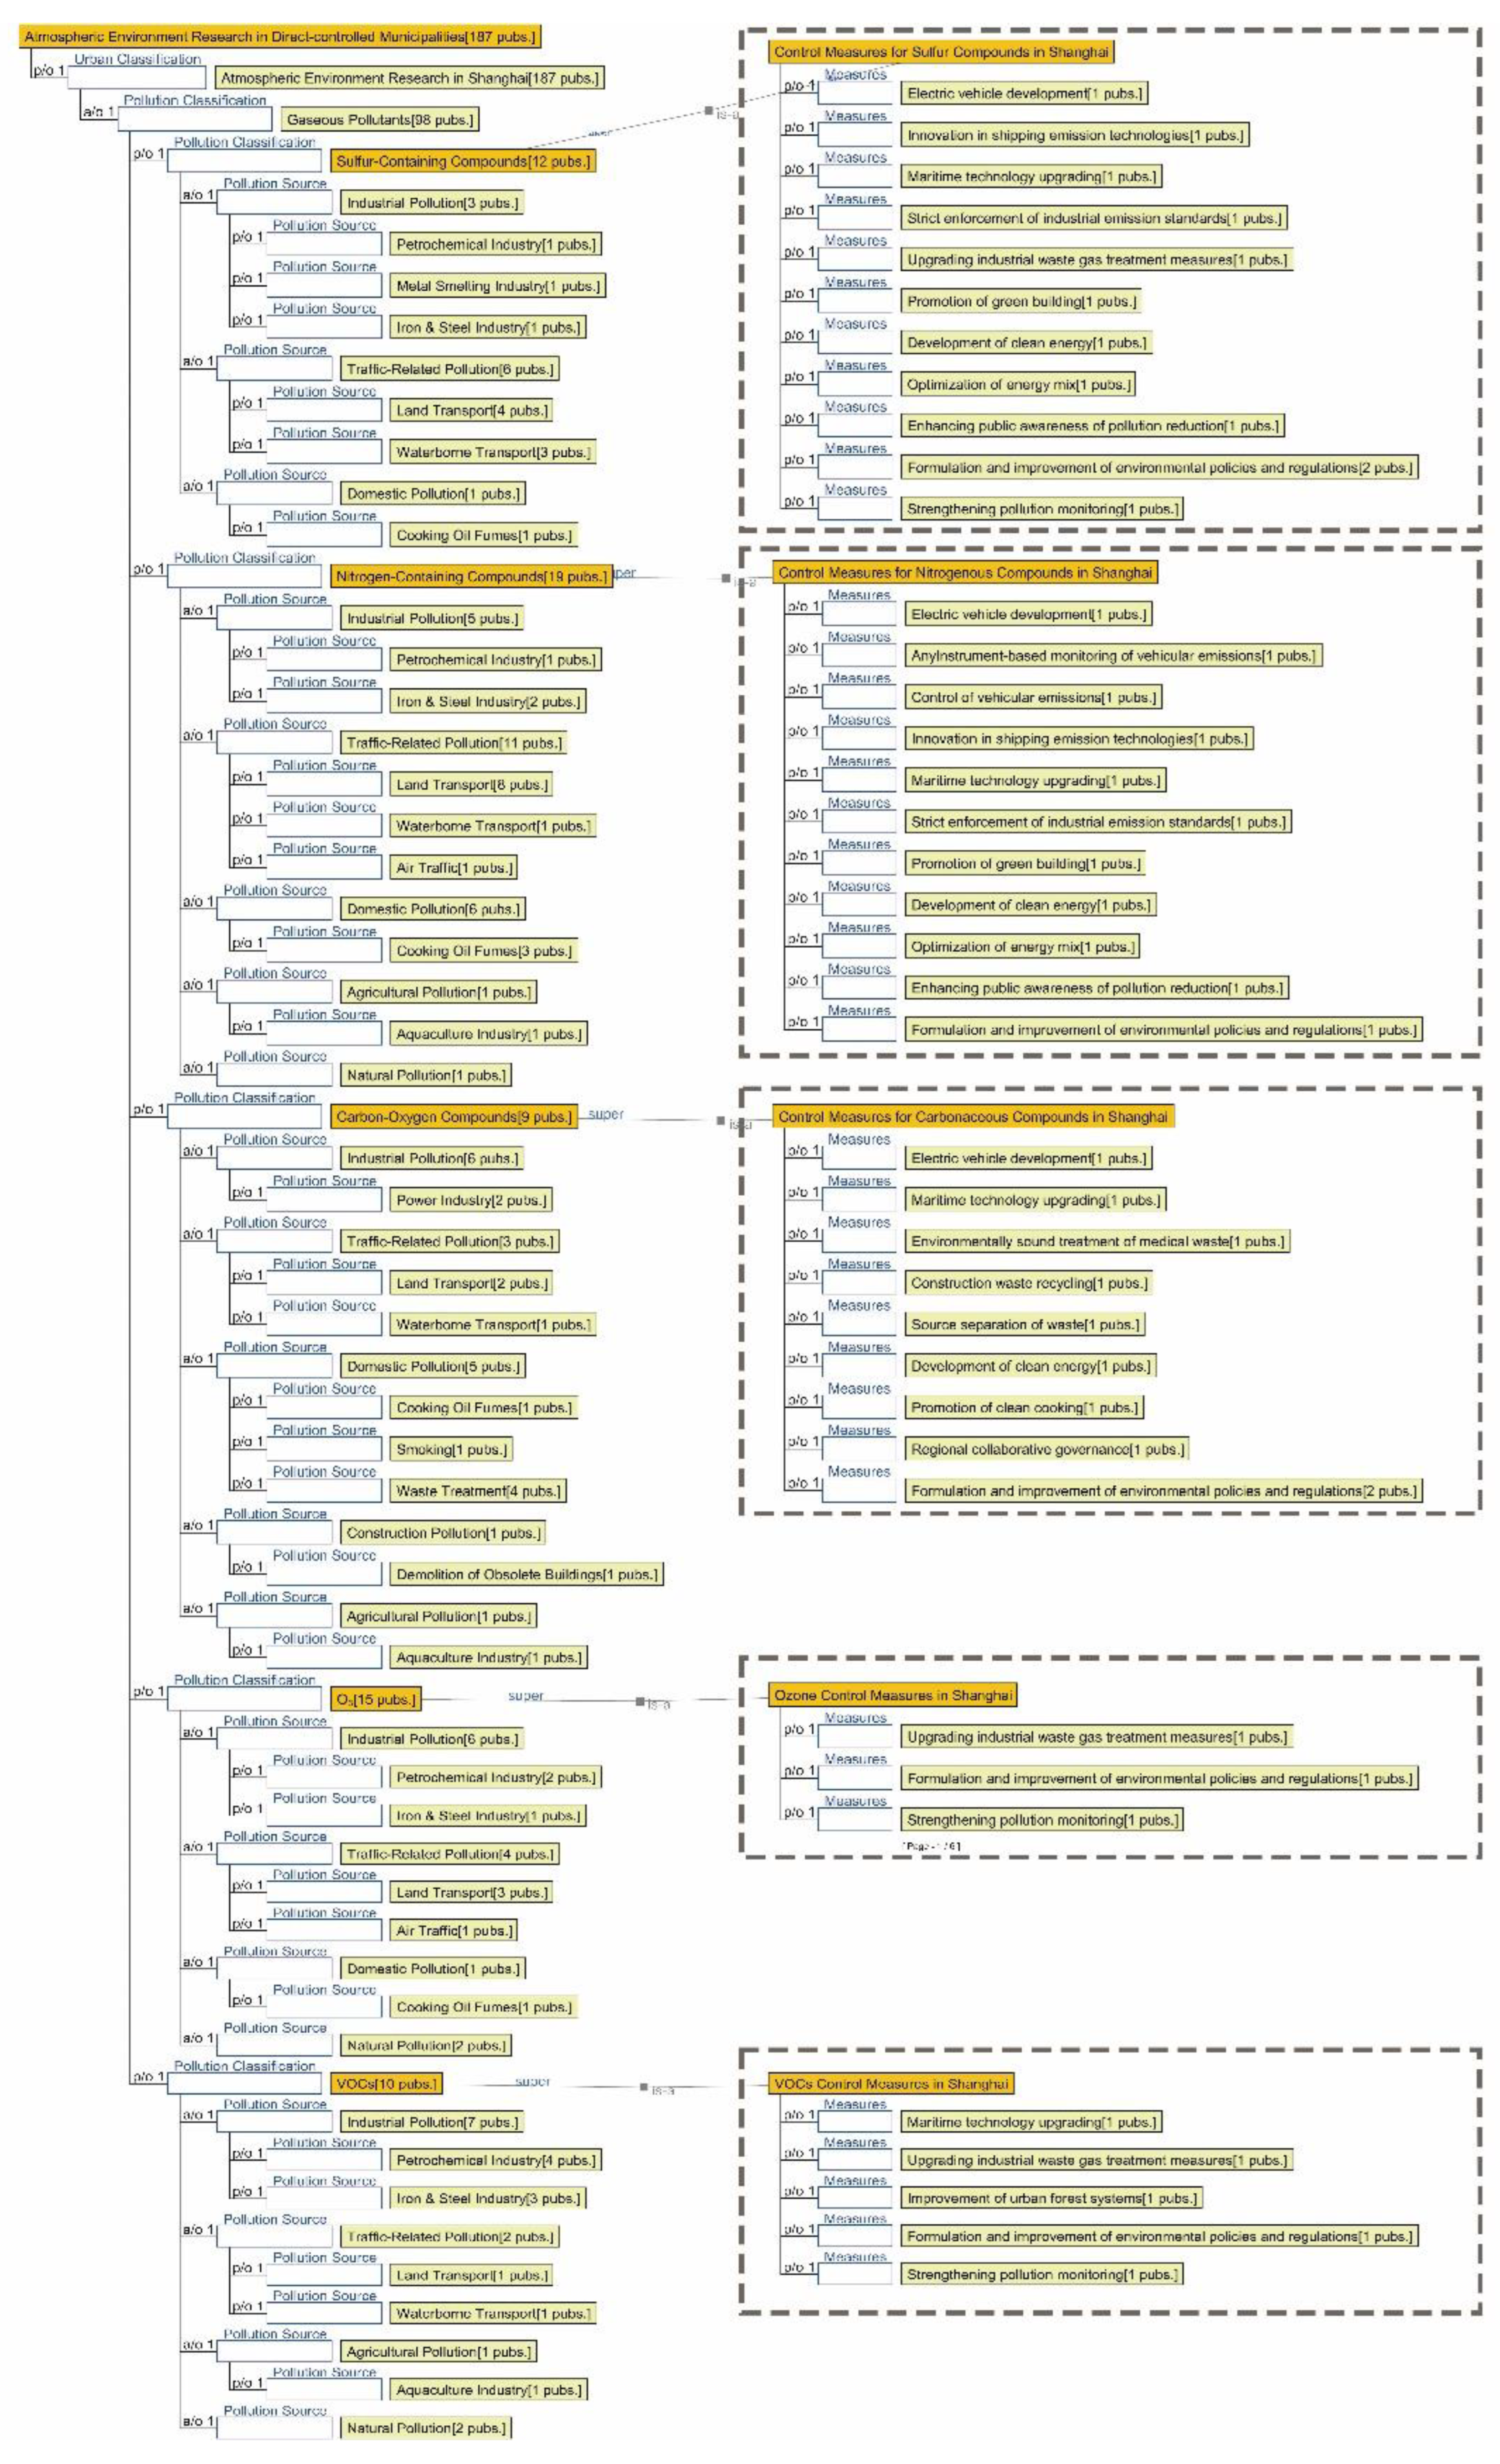
Figure 10.
Semantic Ontology Mapping of Gaseous Pollutants in Sub-Provincial Level Cities.
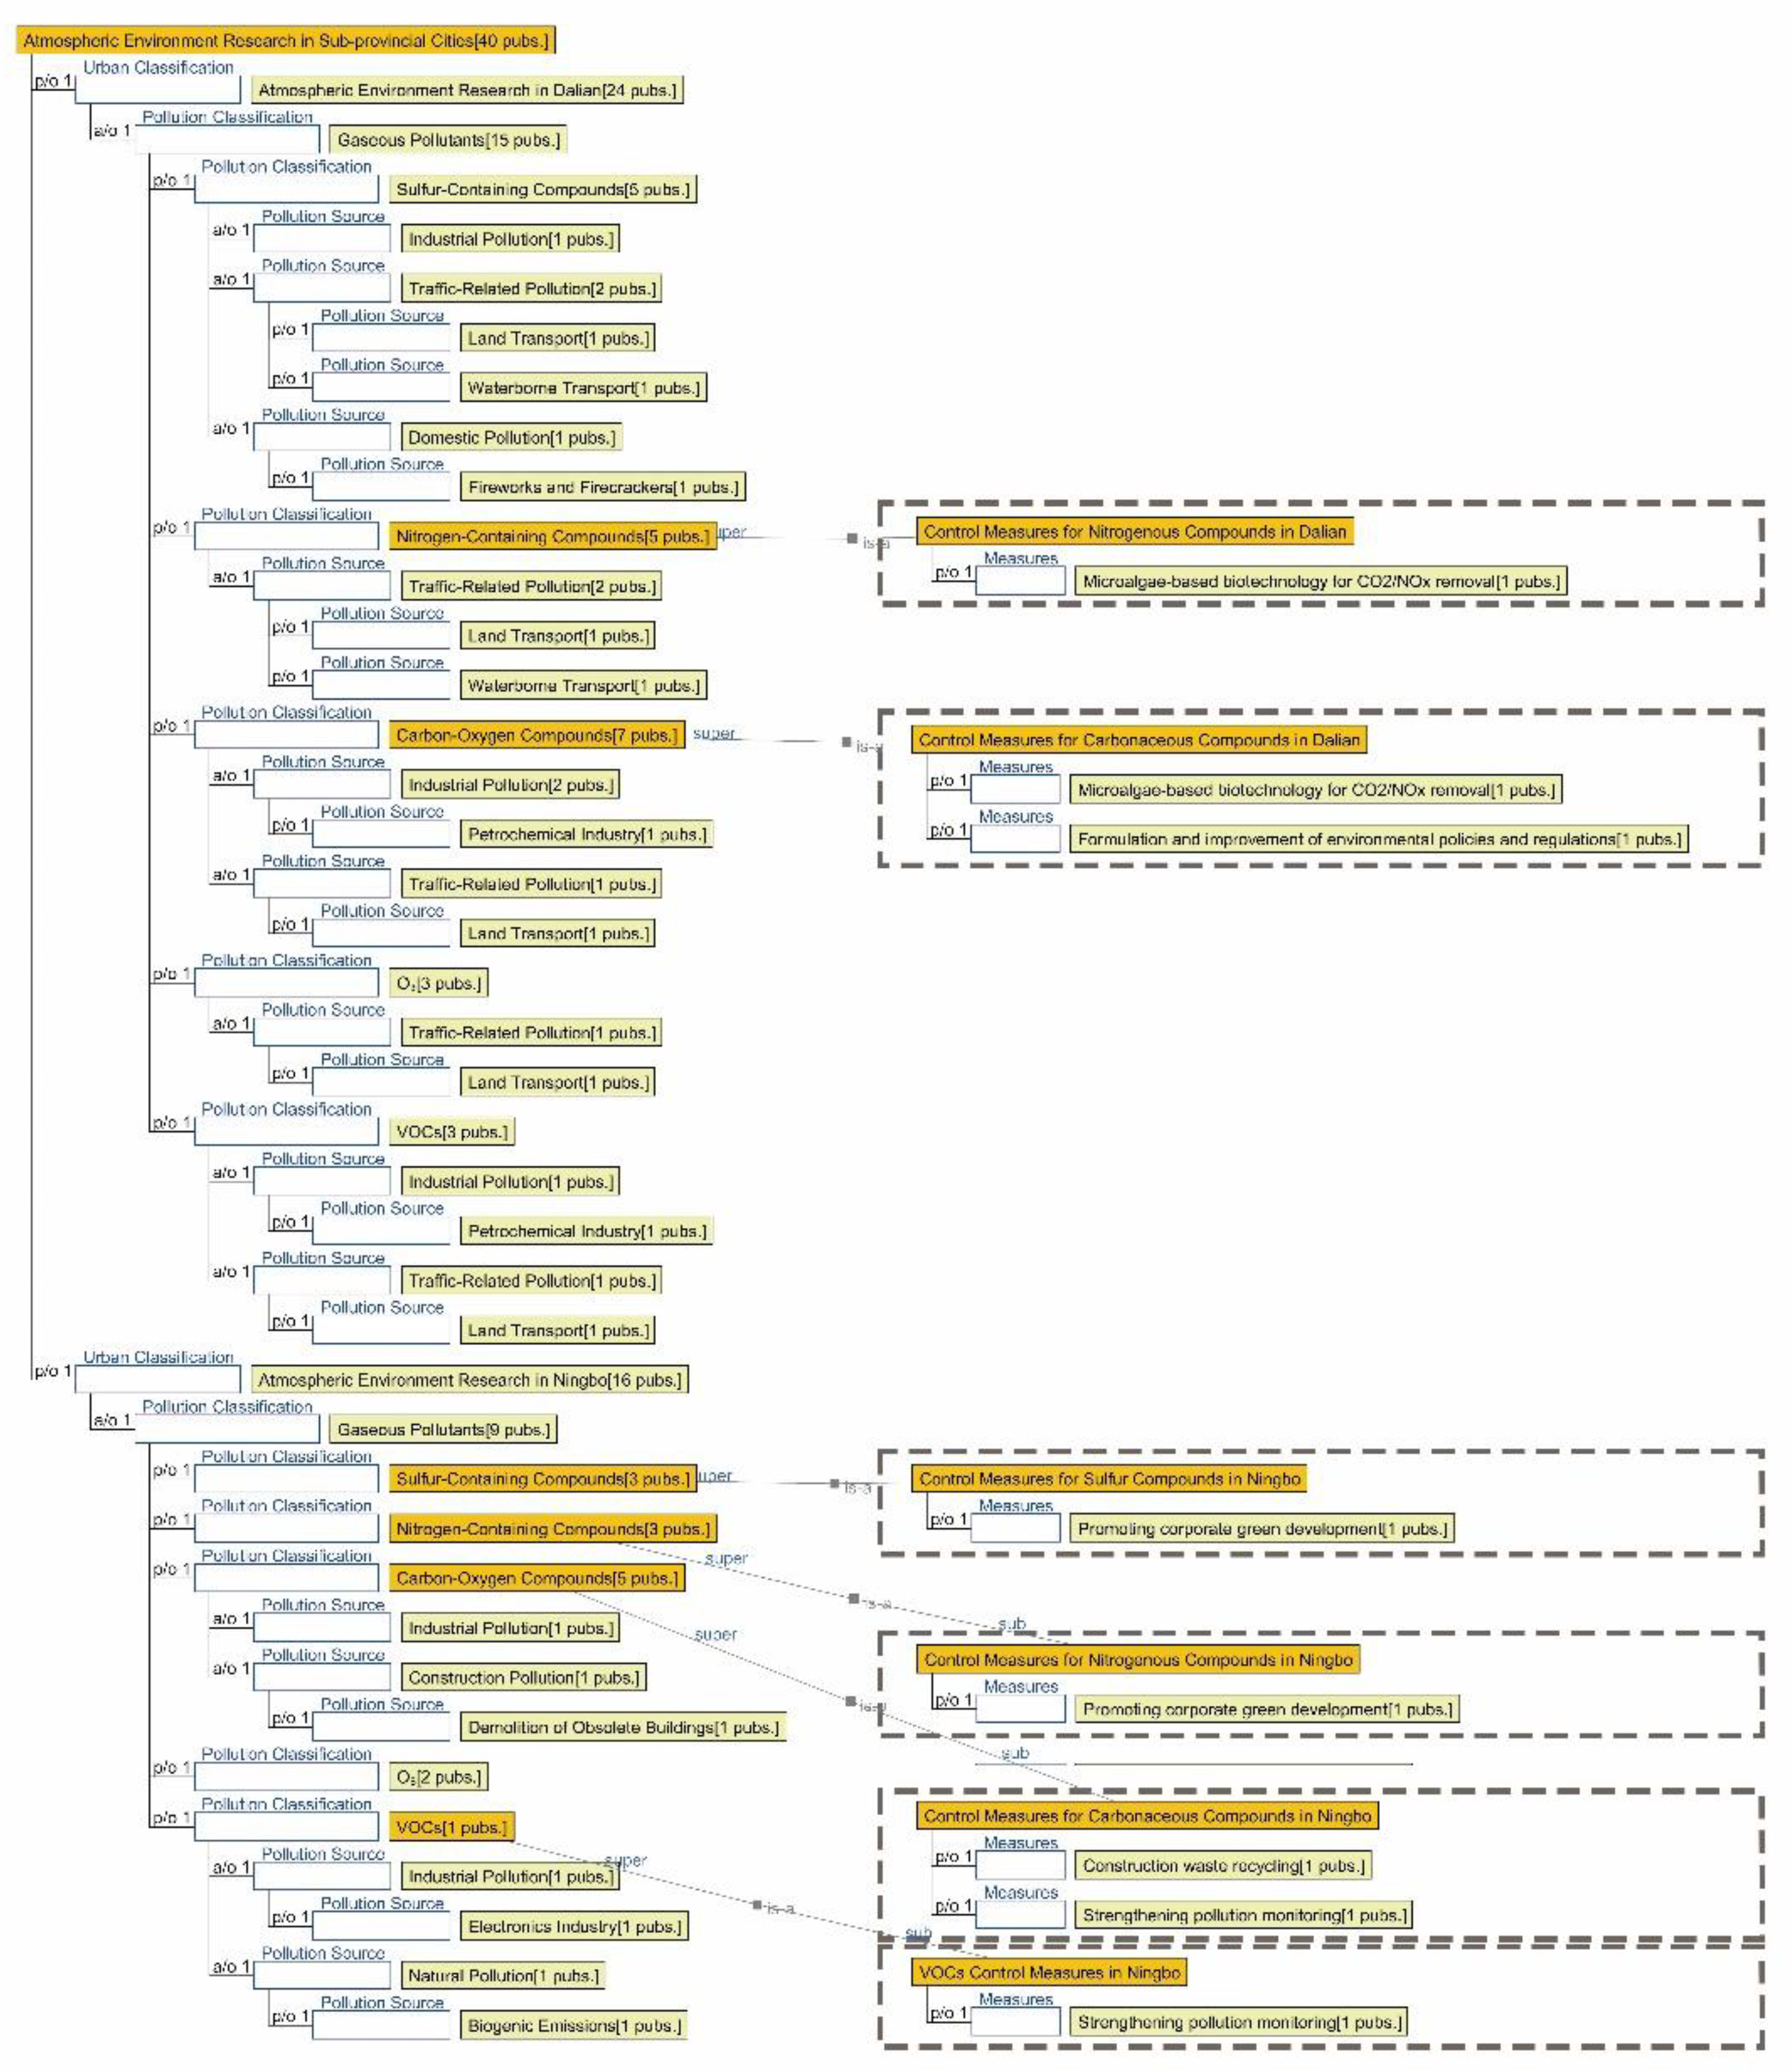
Figure 11.
Semantic Ontology Mapping of Gaseous Pollutants in Prefecture-Level Cities.
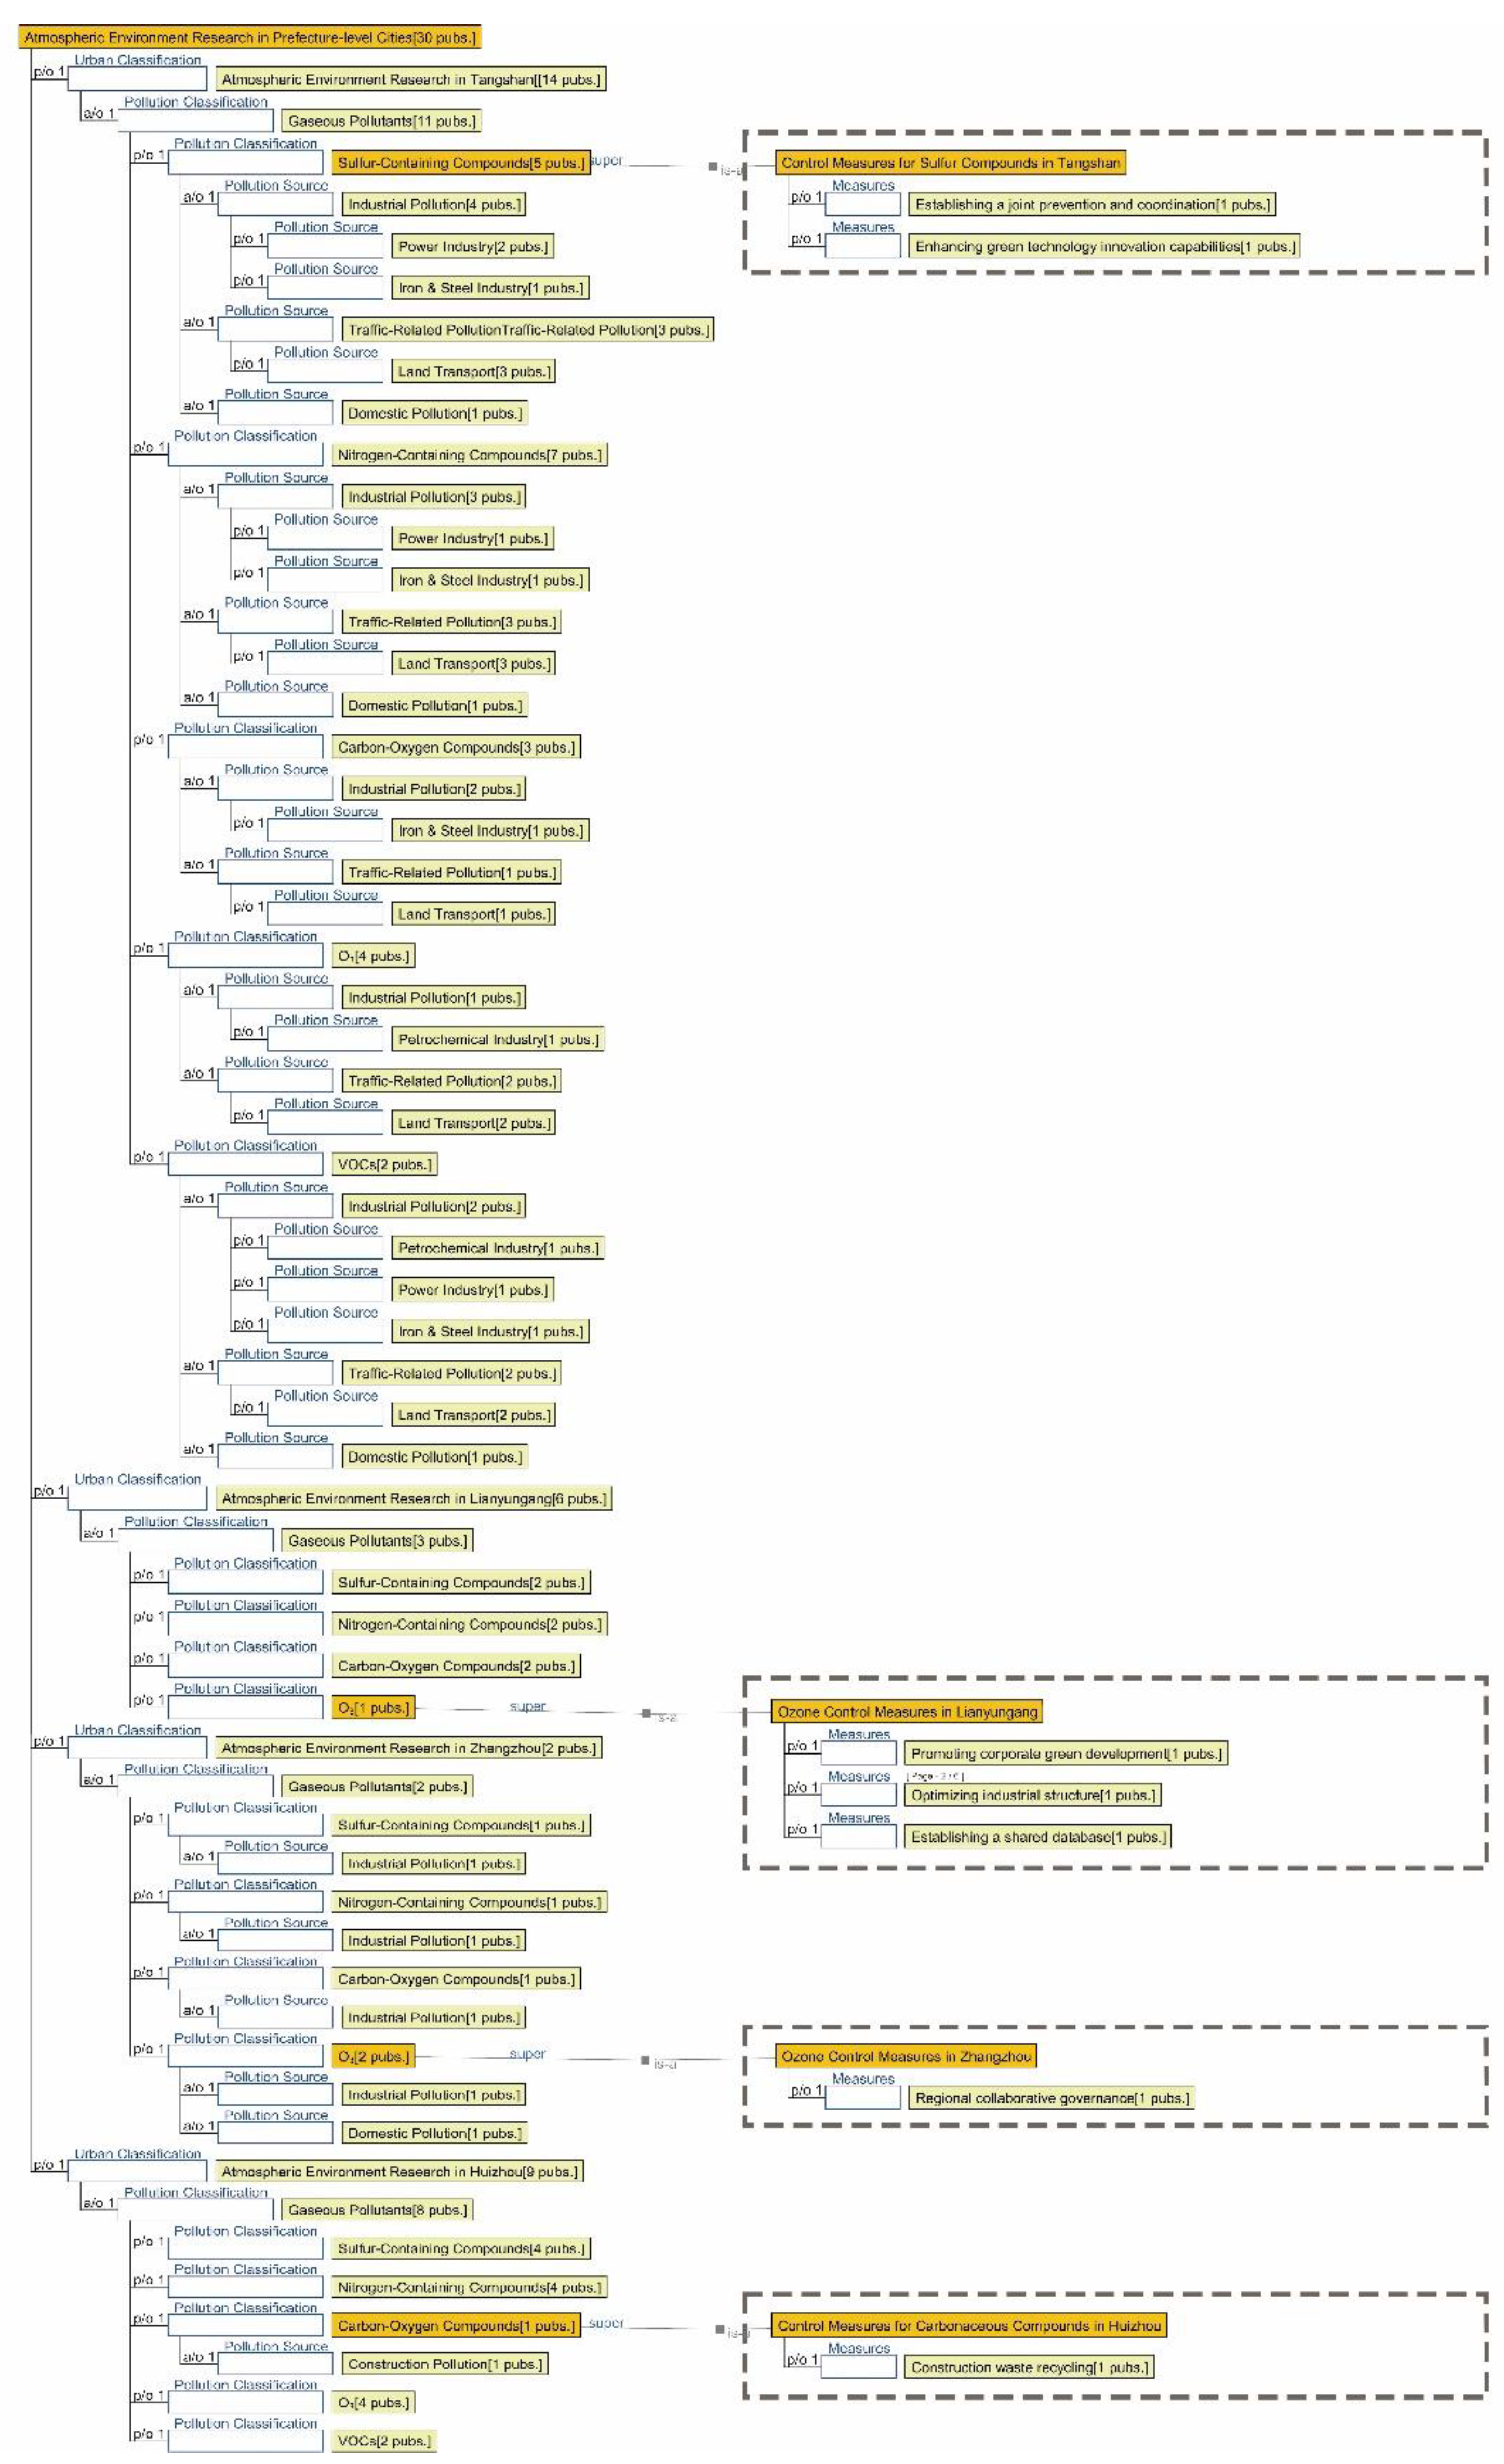
Figure 12.
Statistics on the number of papers addressing correlations among gaseous pollutant sources across different cities.
Figure 12.
Statistics on the number of papers addressing correlations among gaseous pollutant sources across different cities.
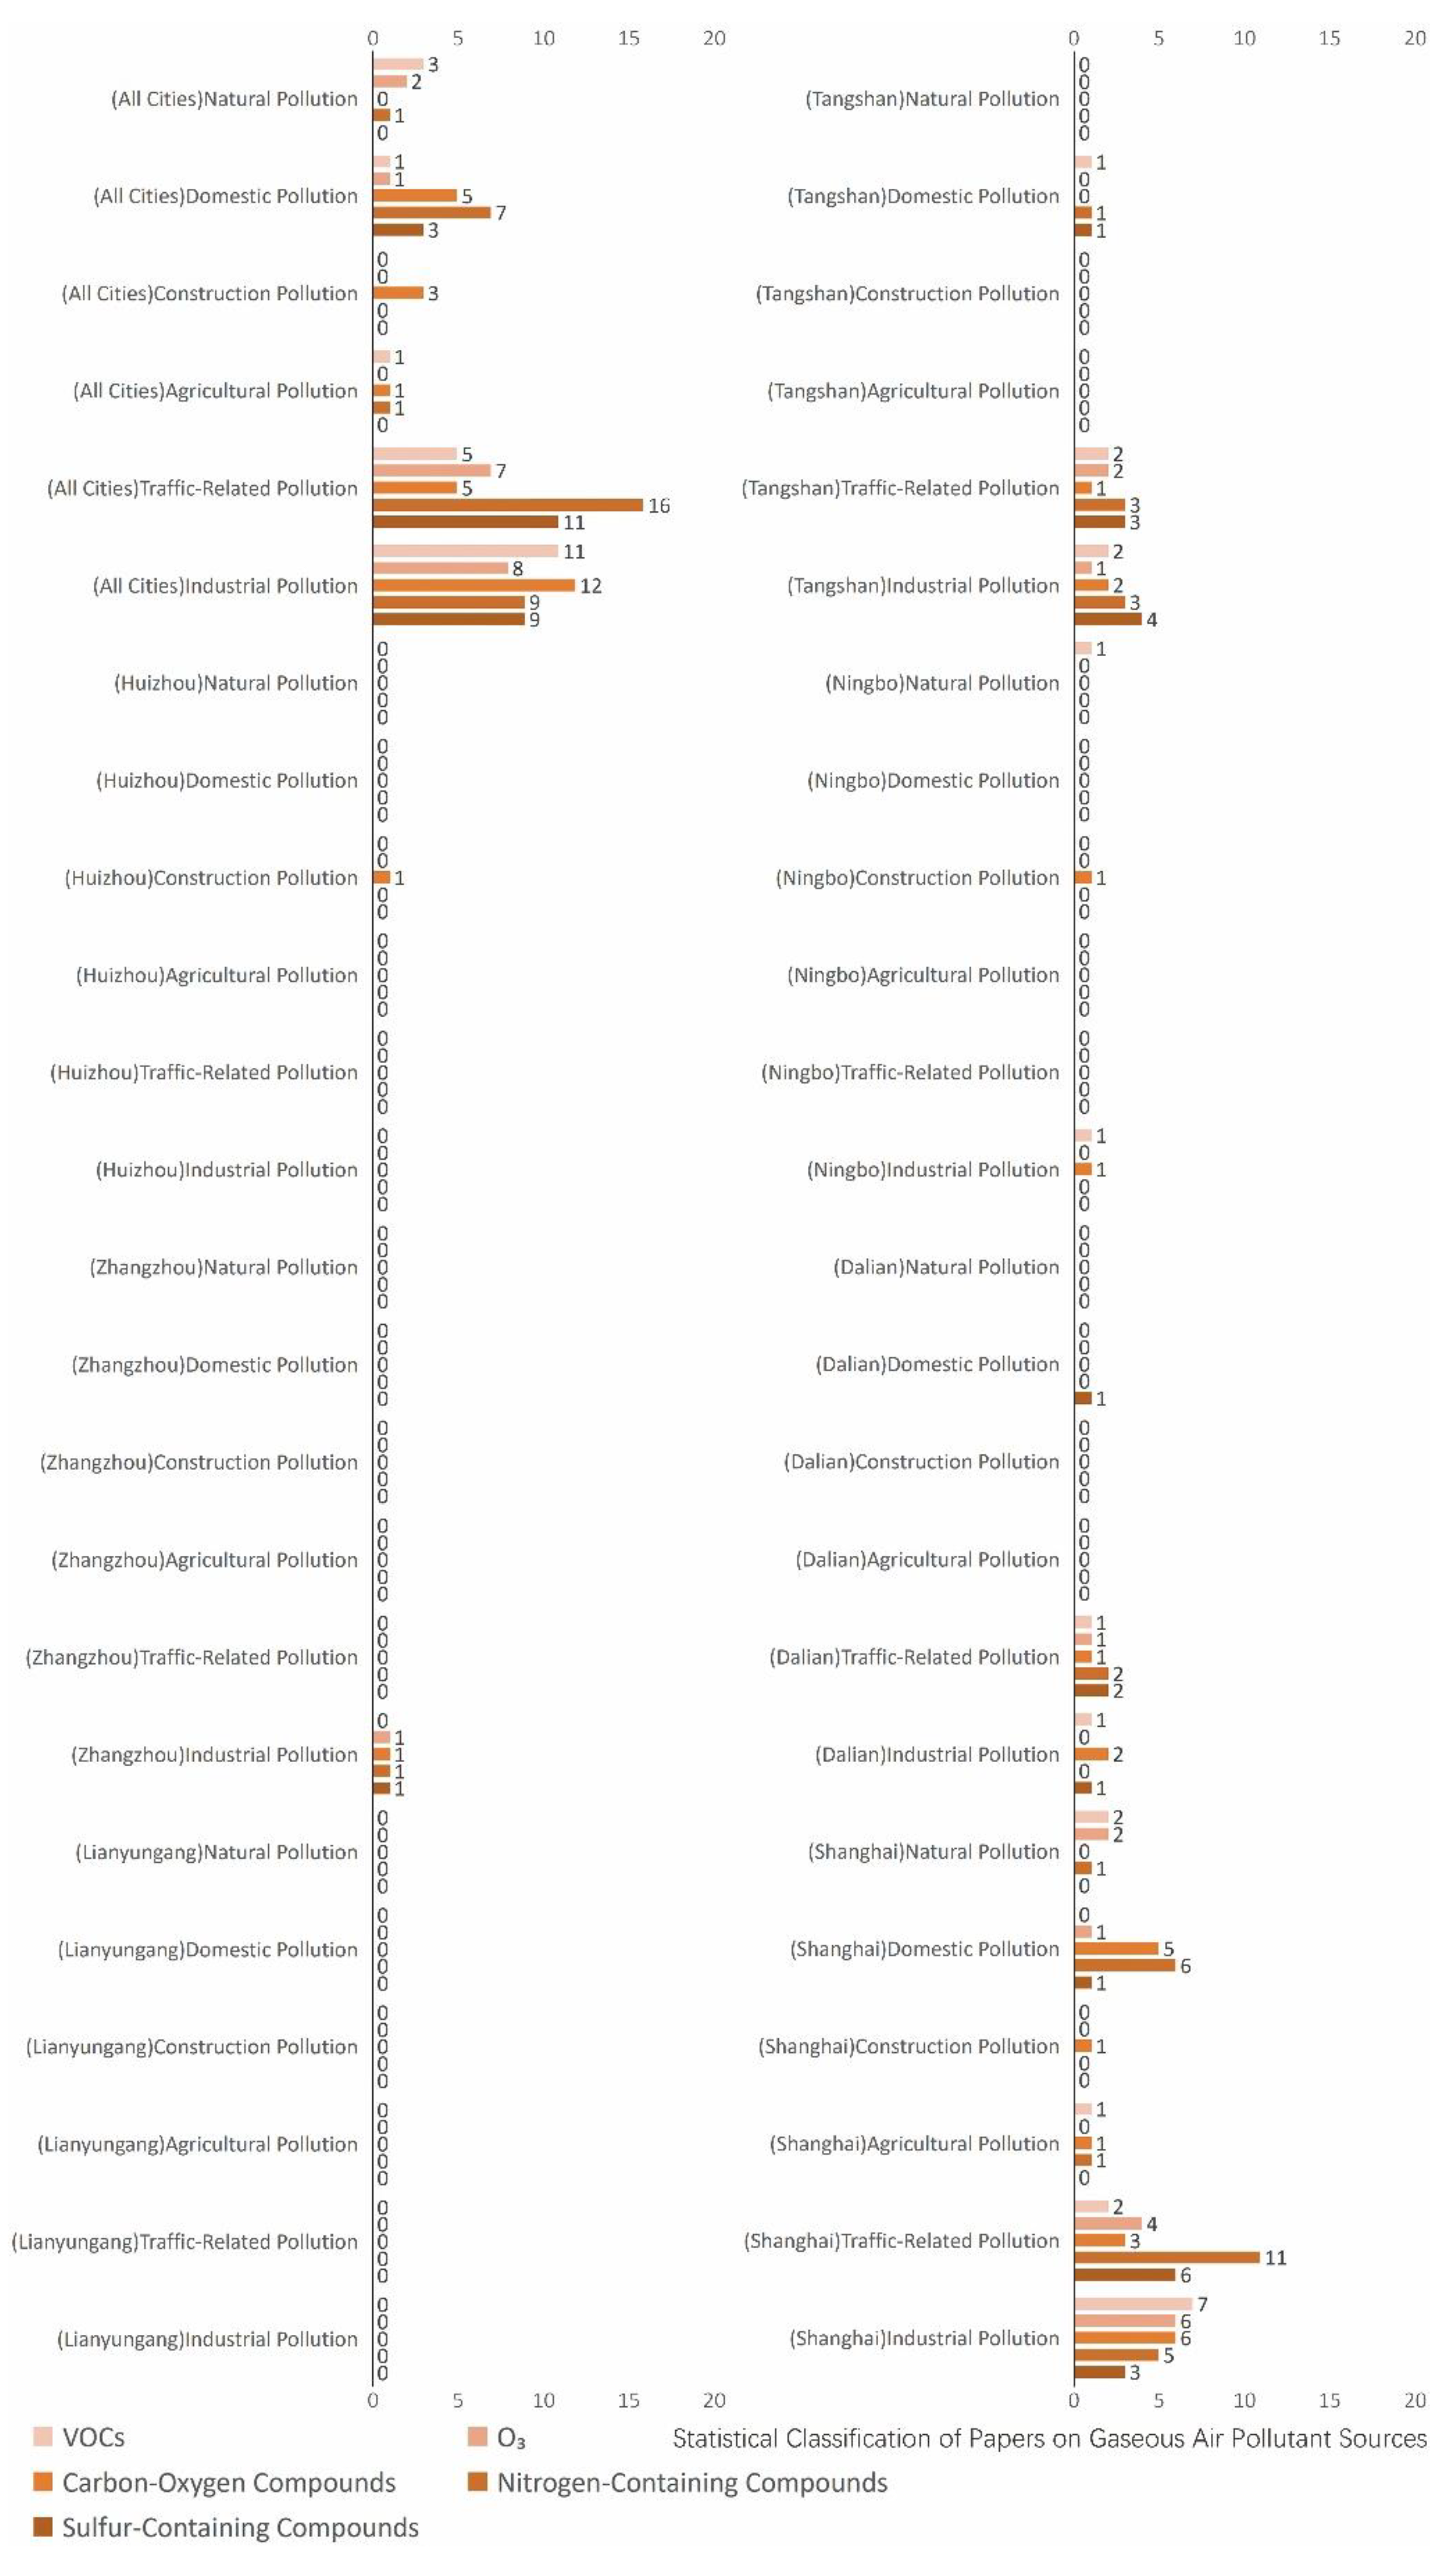
Figure 13.
Semantic Ontology Mapping of Water Environments in Municipalities Directly Under the Central Government.
Figure 13.
Semantic Ontology Mapping of Water Environments in Municipalities Directly Under the Central Government.
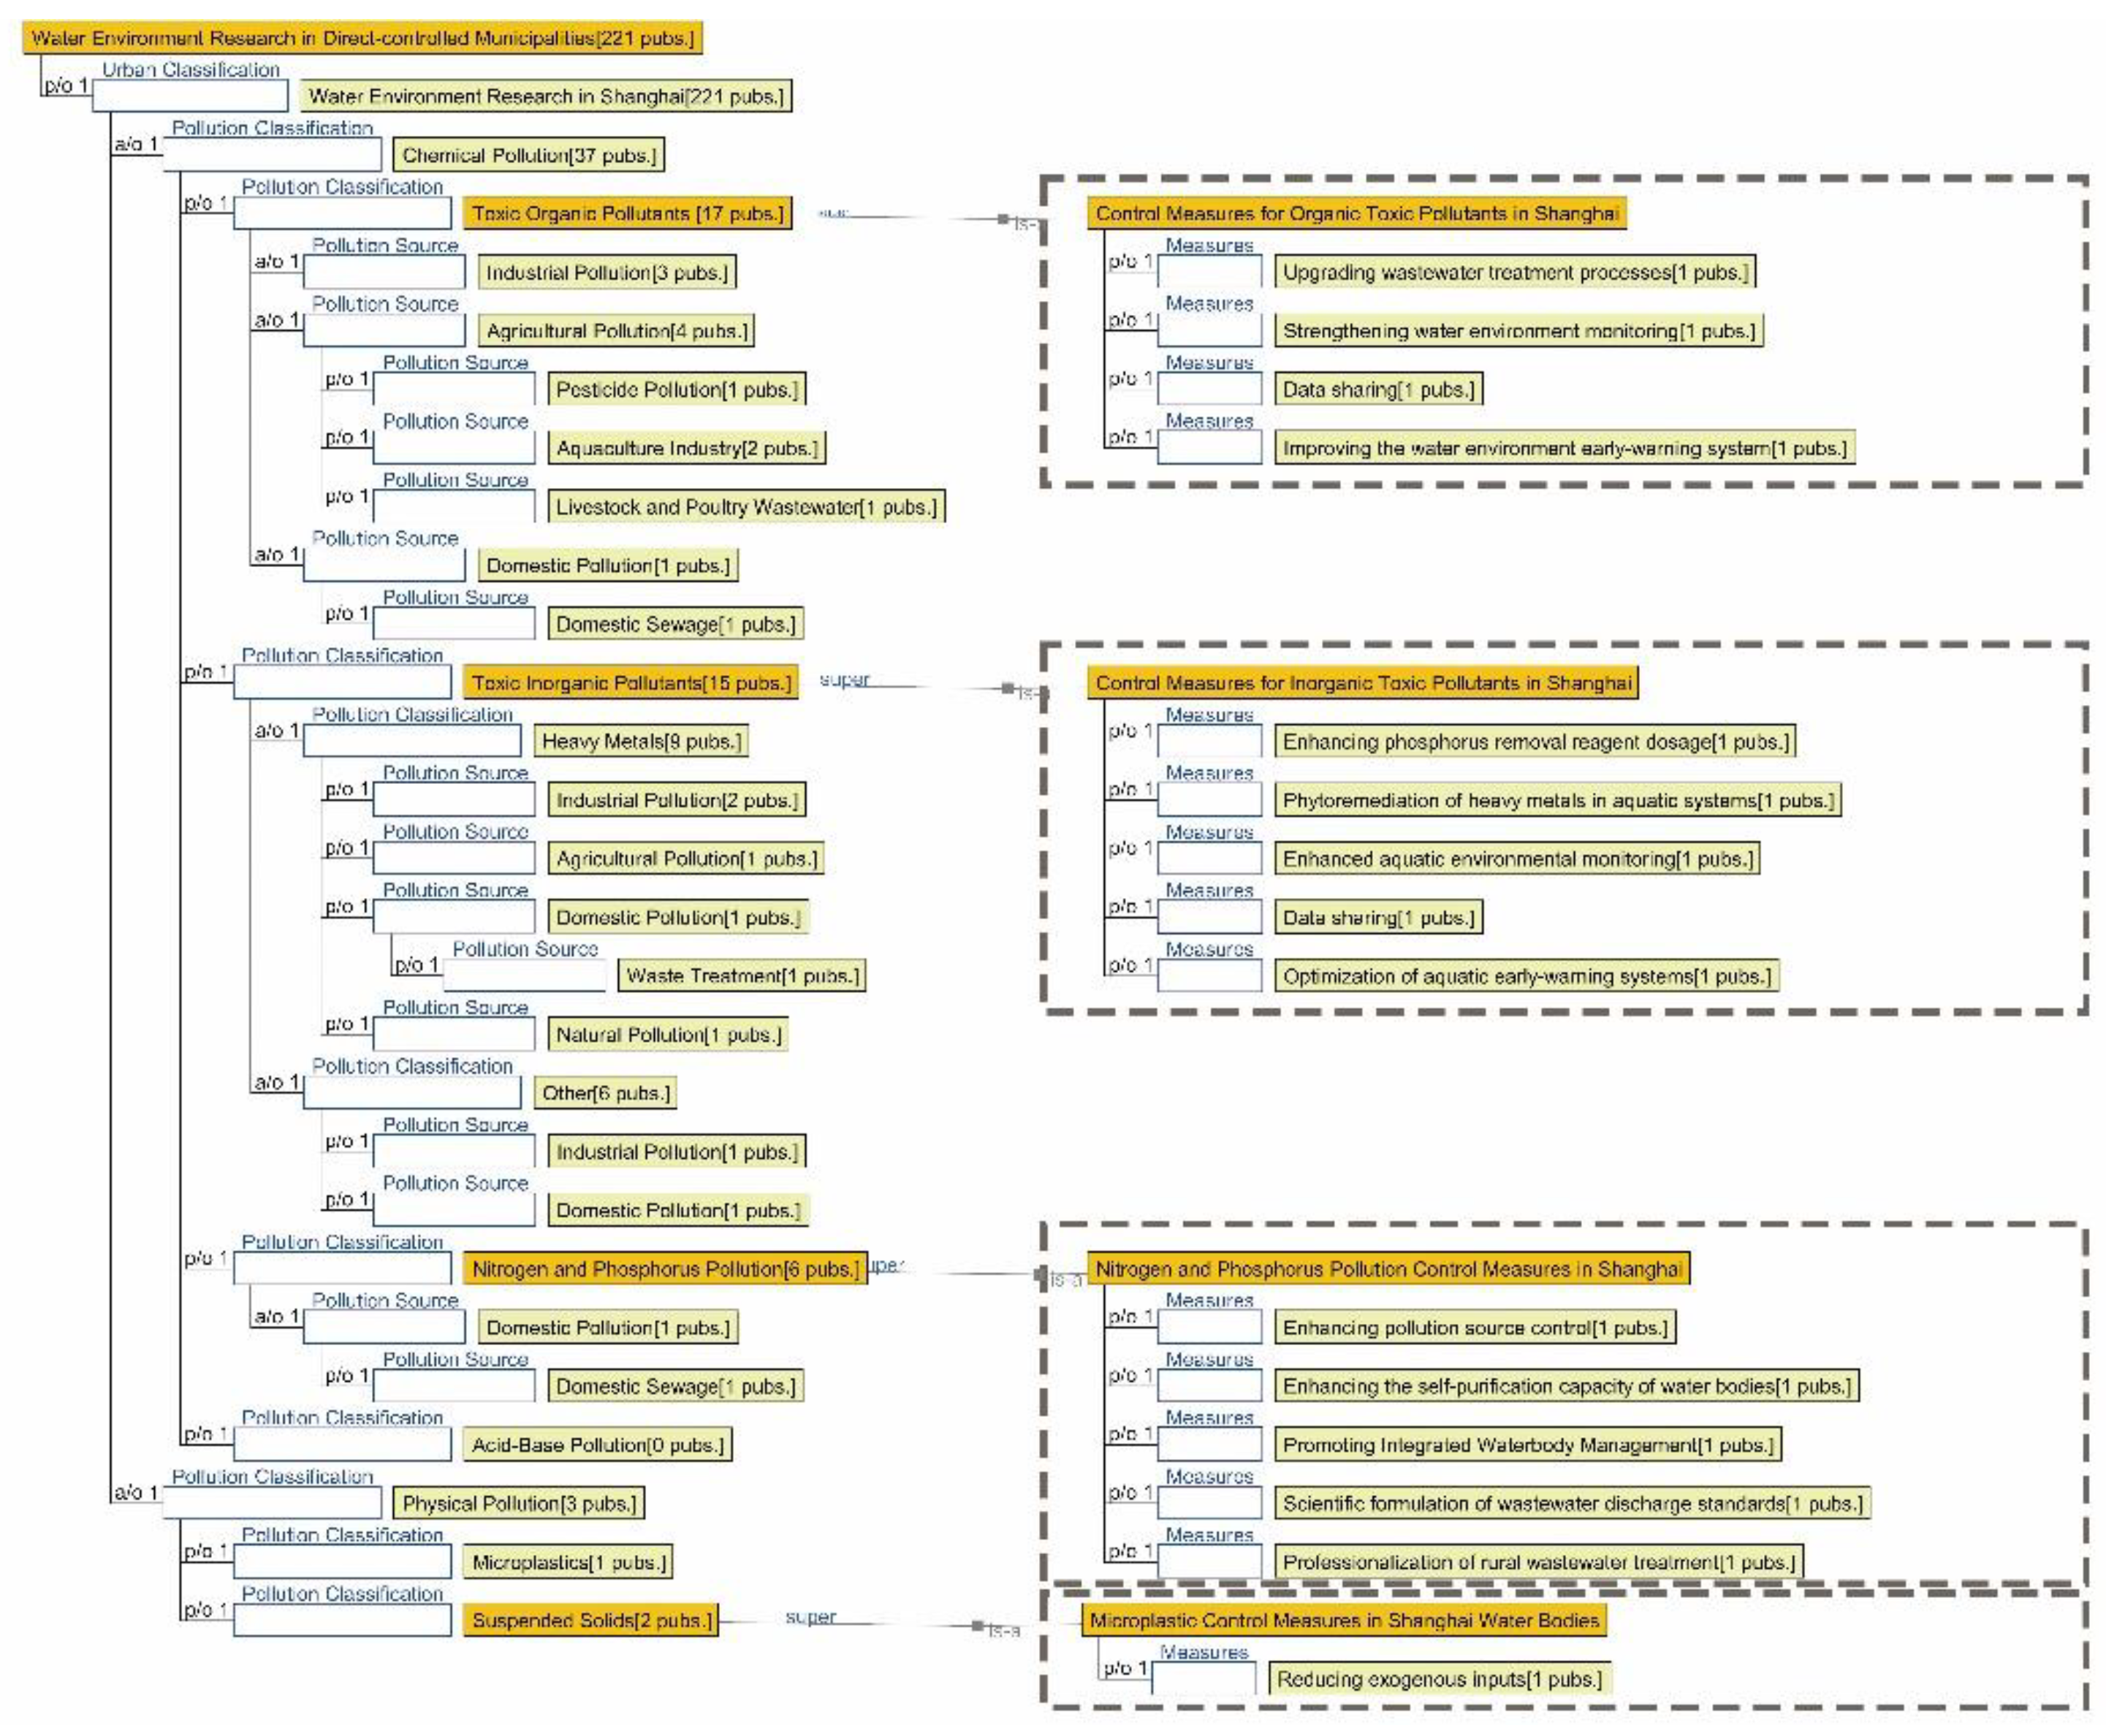
Figure 14.
Semantic Ontology Mapping of Water Environments in Sub-Provincial Level Cities.
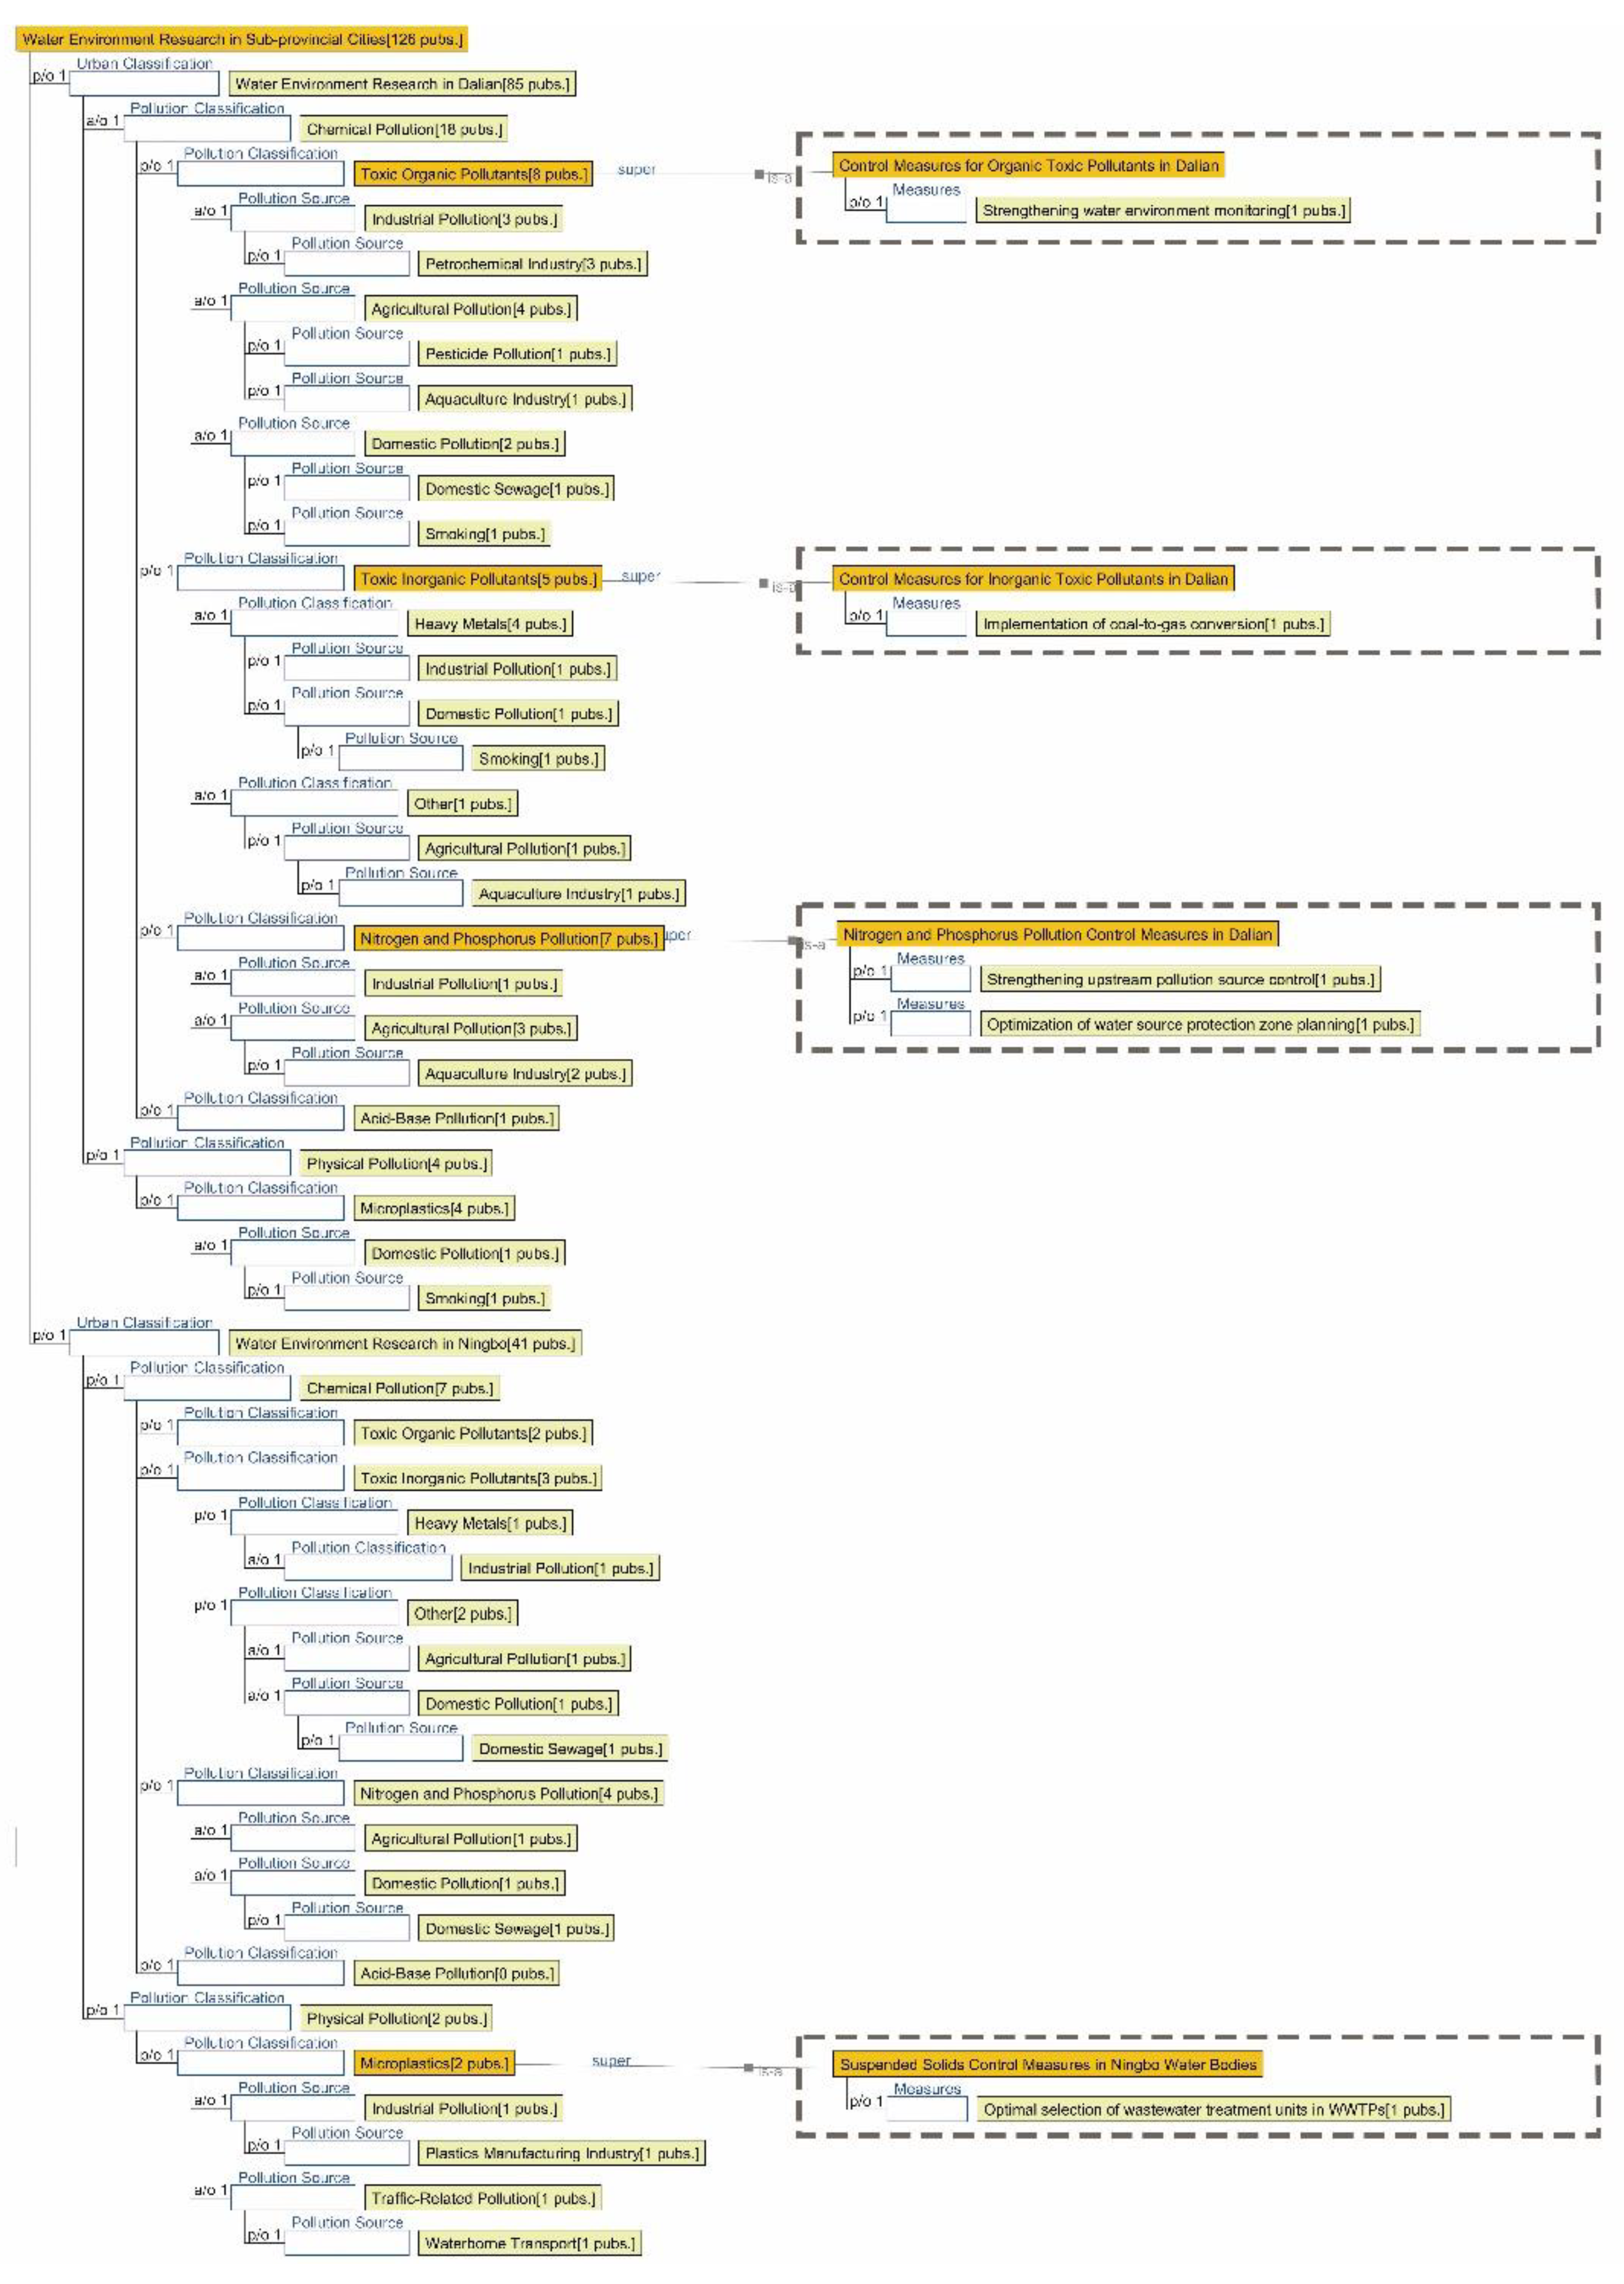
Figure 15.
Semantic Ontology Mapping of Water Environments in Prefecture-Level Cities.
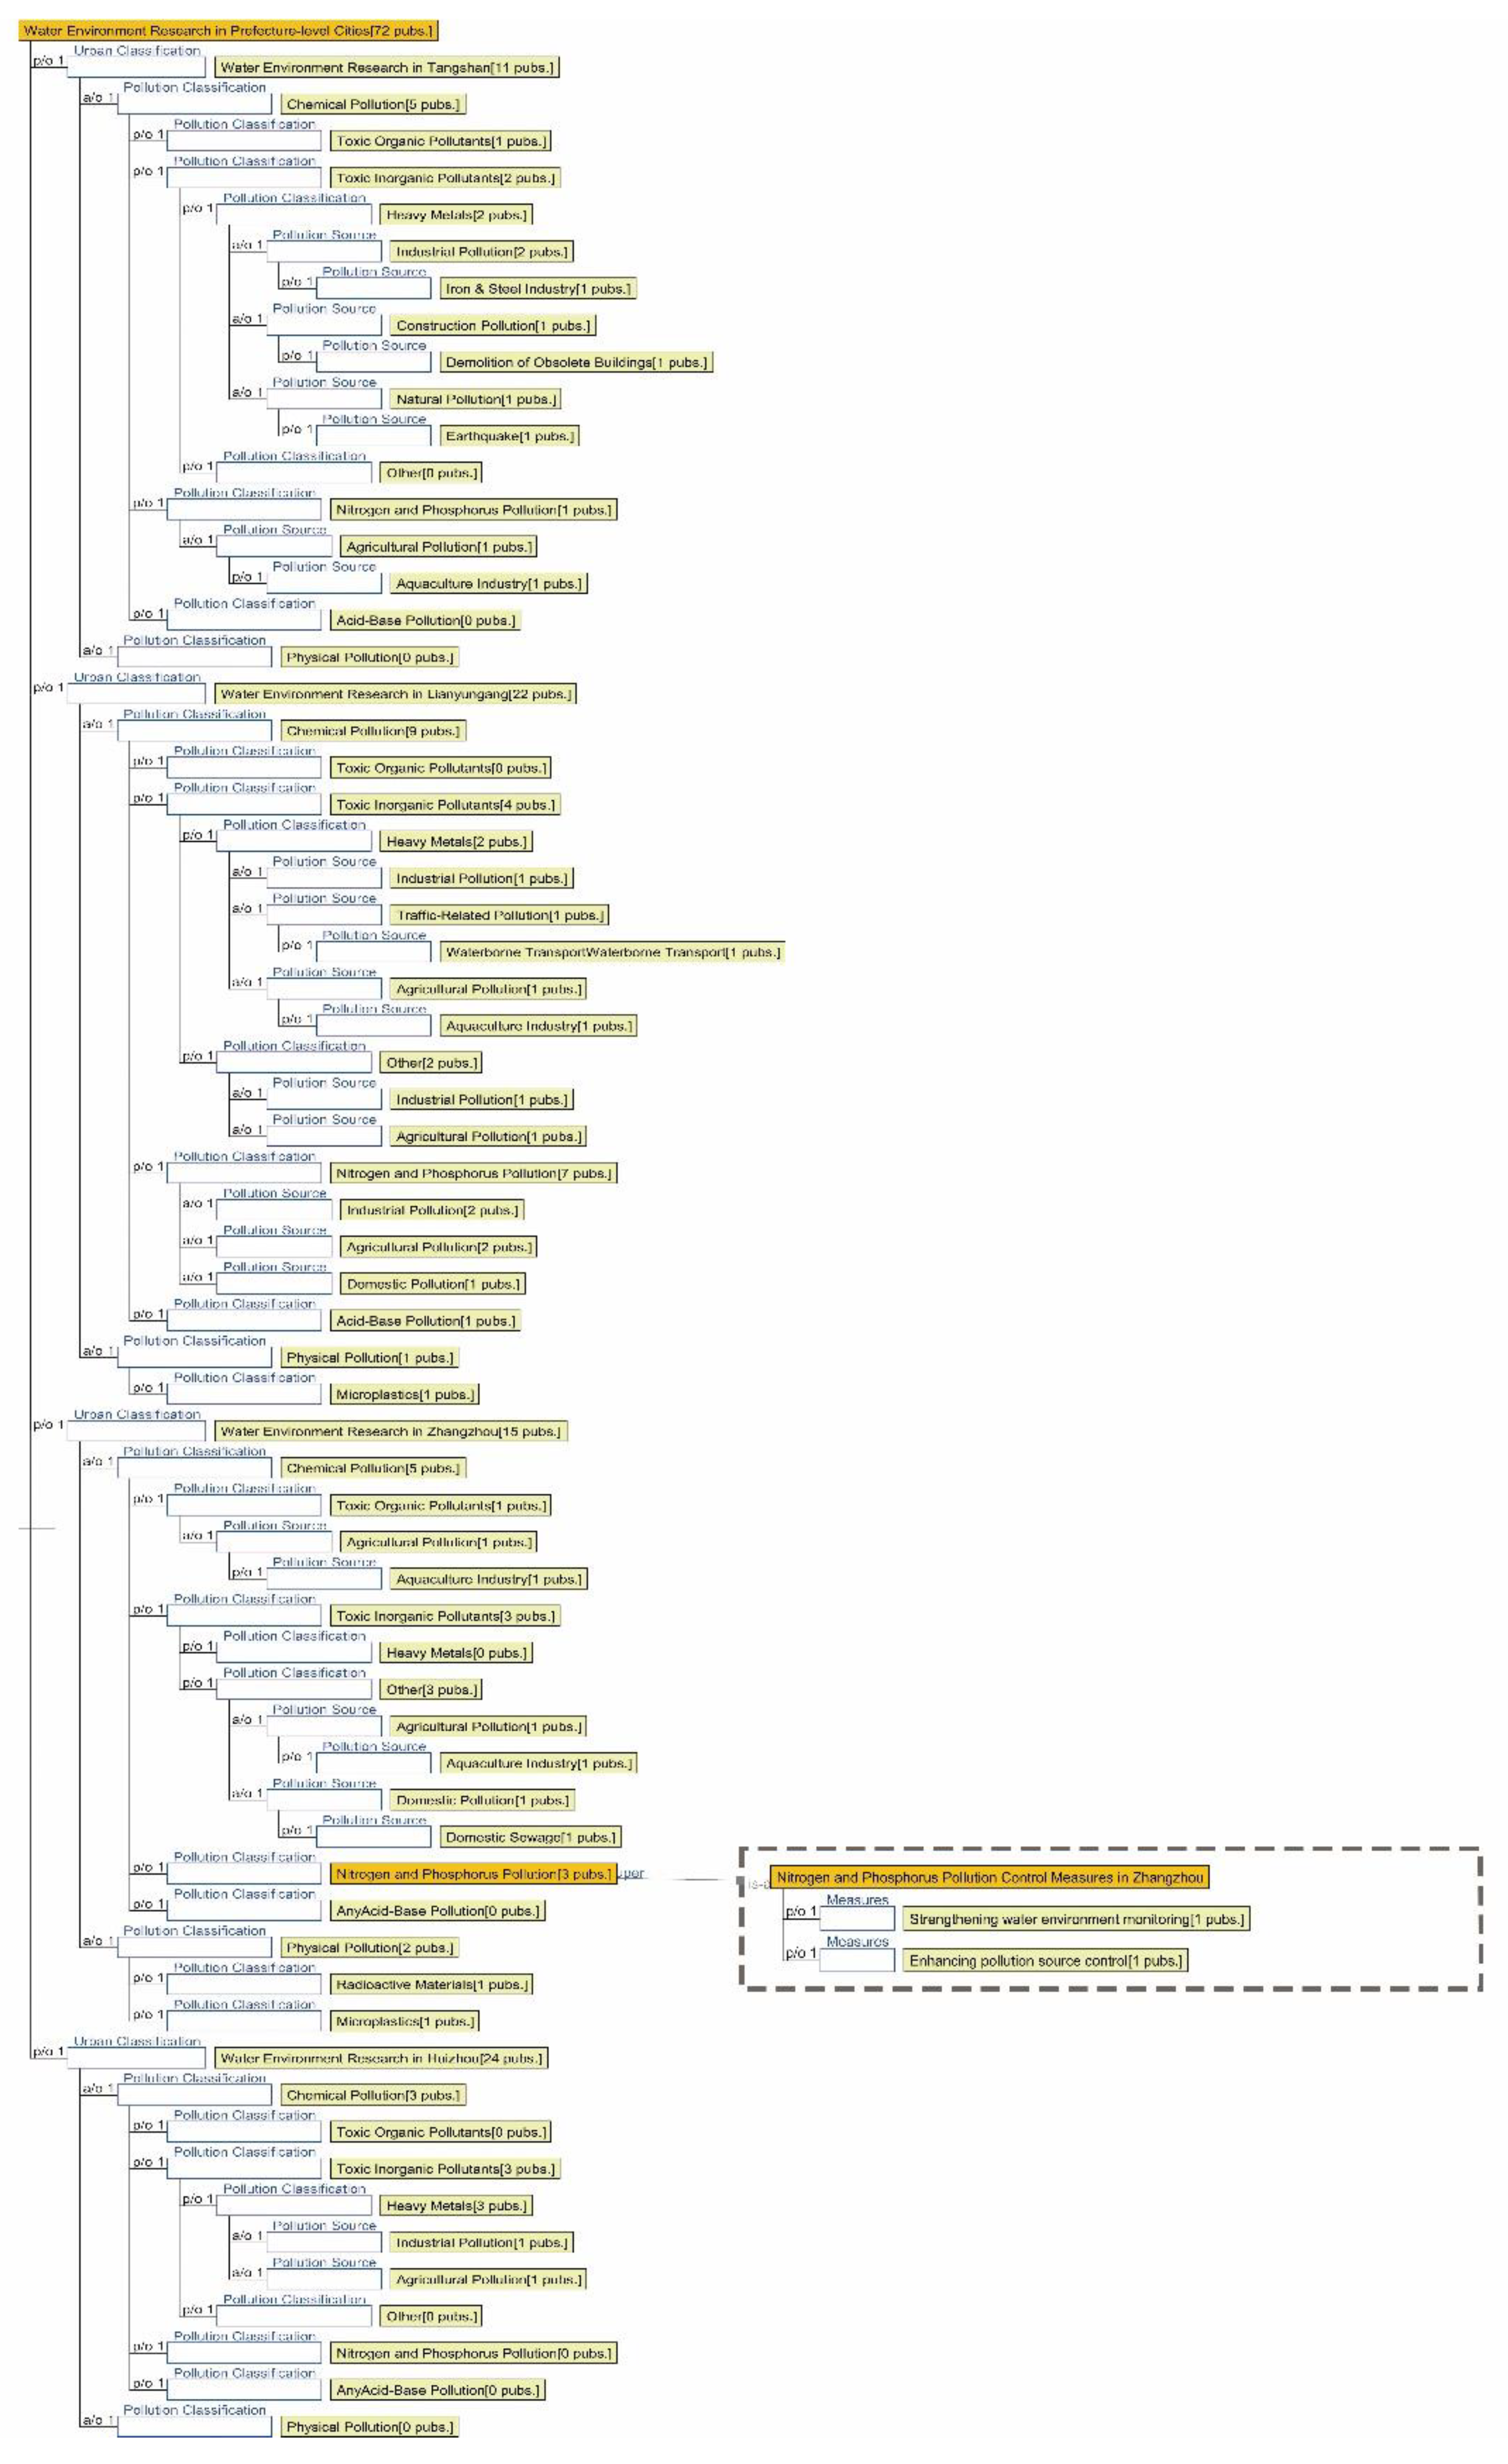
Figure 16.
Statistics on the number of papers addressing correlations among aquatic pollutant sources across different cities.
Figure 16.
Statistics on the number of papers addressing correlations among aquatic pollutant sources across different cities.
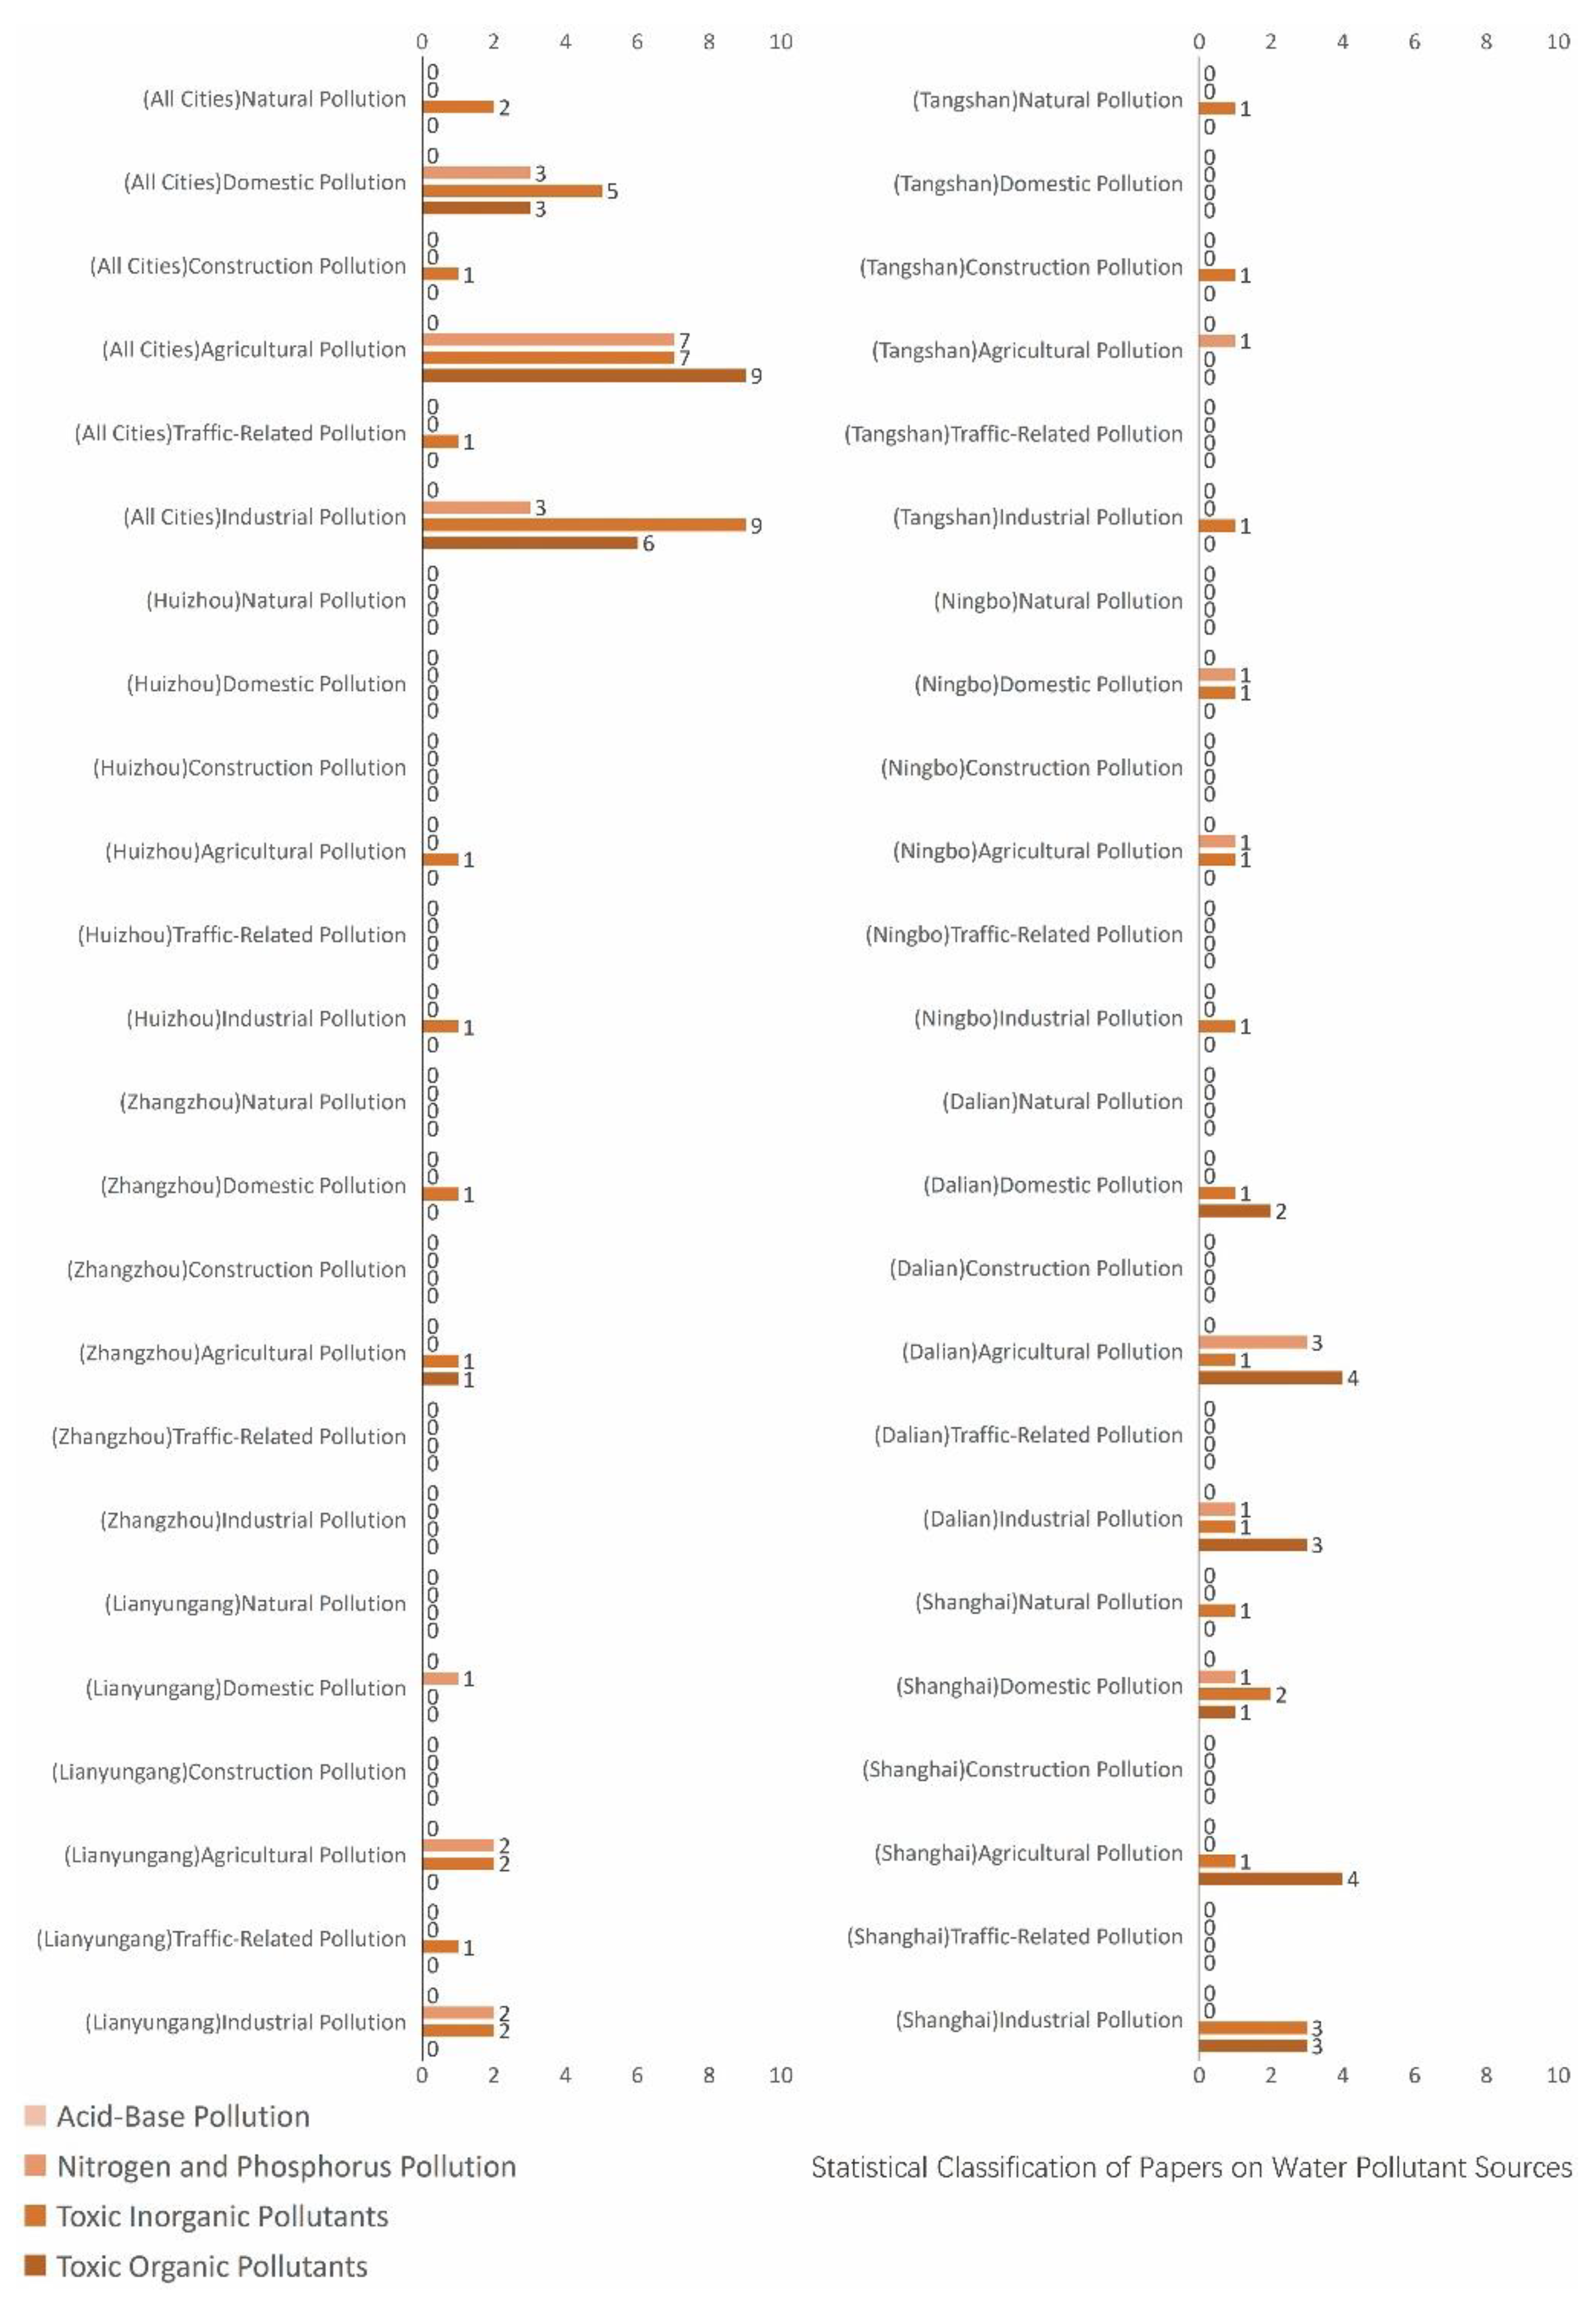
Figure 17.
Semantic Ontology Mapping of Soil Environments in Municipalities Directly Under the Central Government.
Figure 17.
Semantic Ontology Mapping of Soil Environments in Municipalities Directly Under the Central Government.
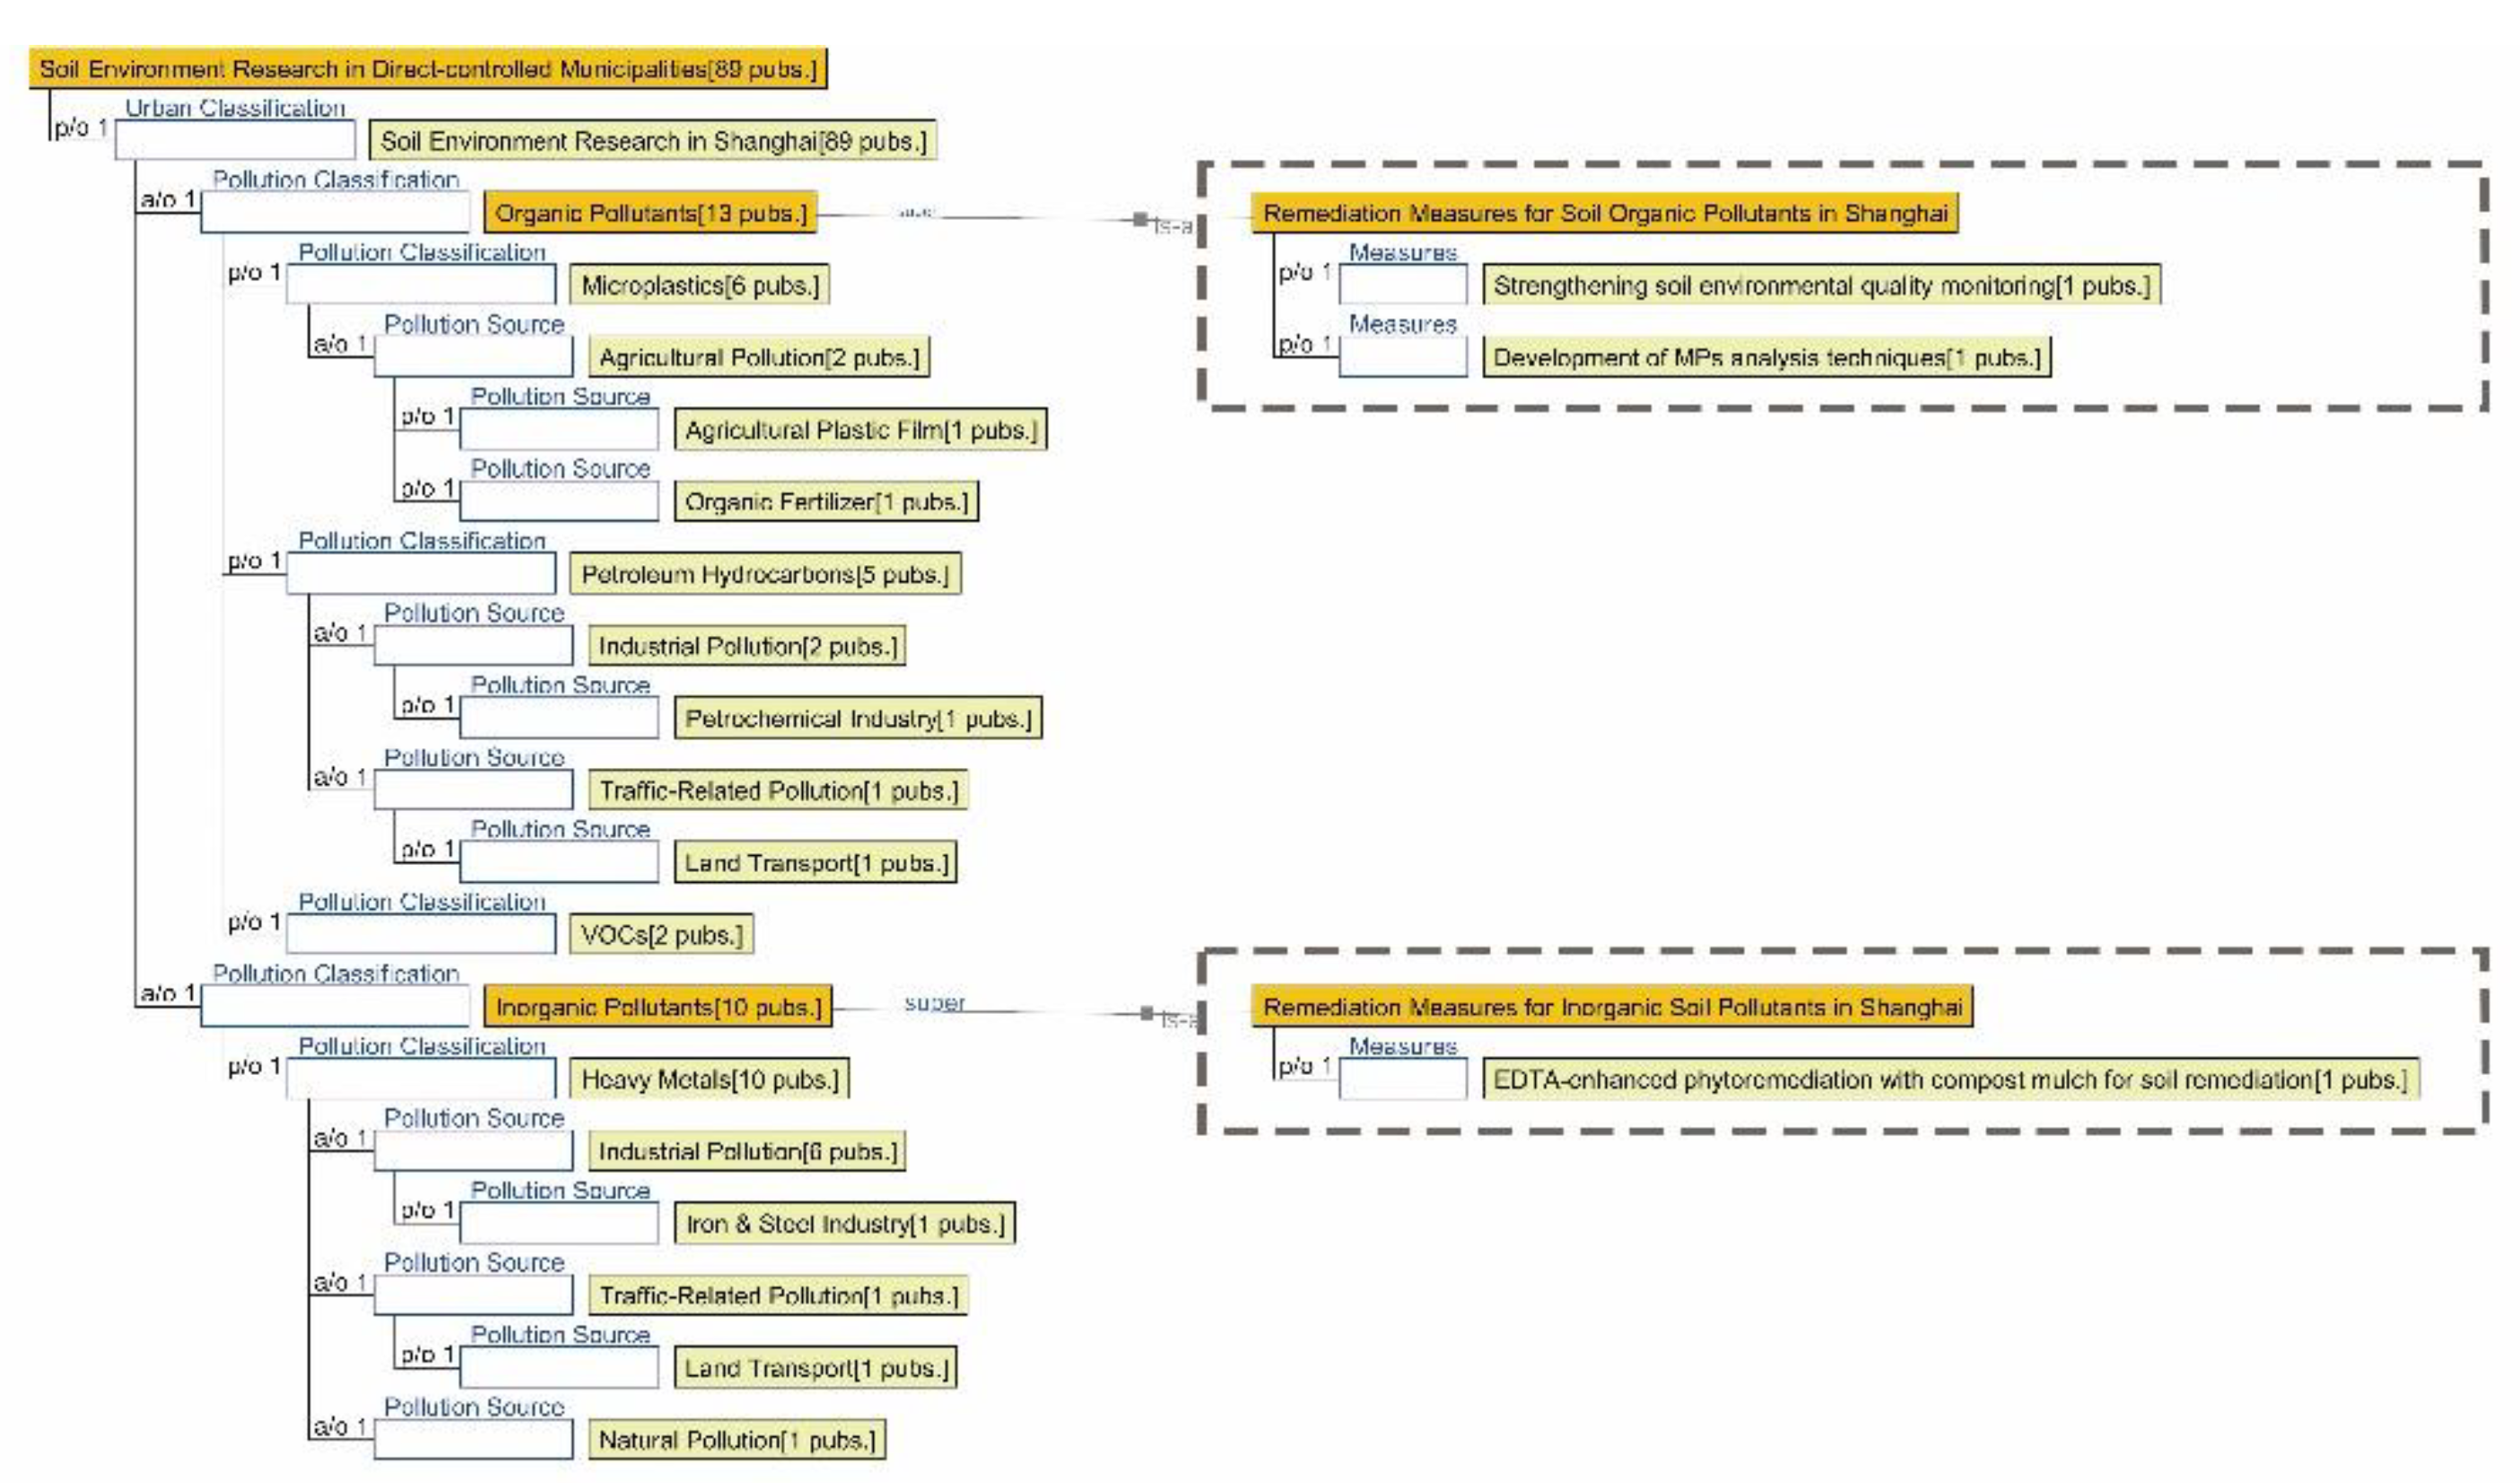
Figure 18.
Semantic Ontology Mapping of Soil Environments in Sub-Provincial Level Cities.
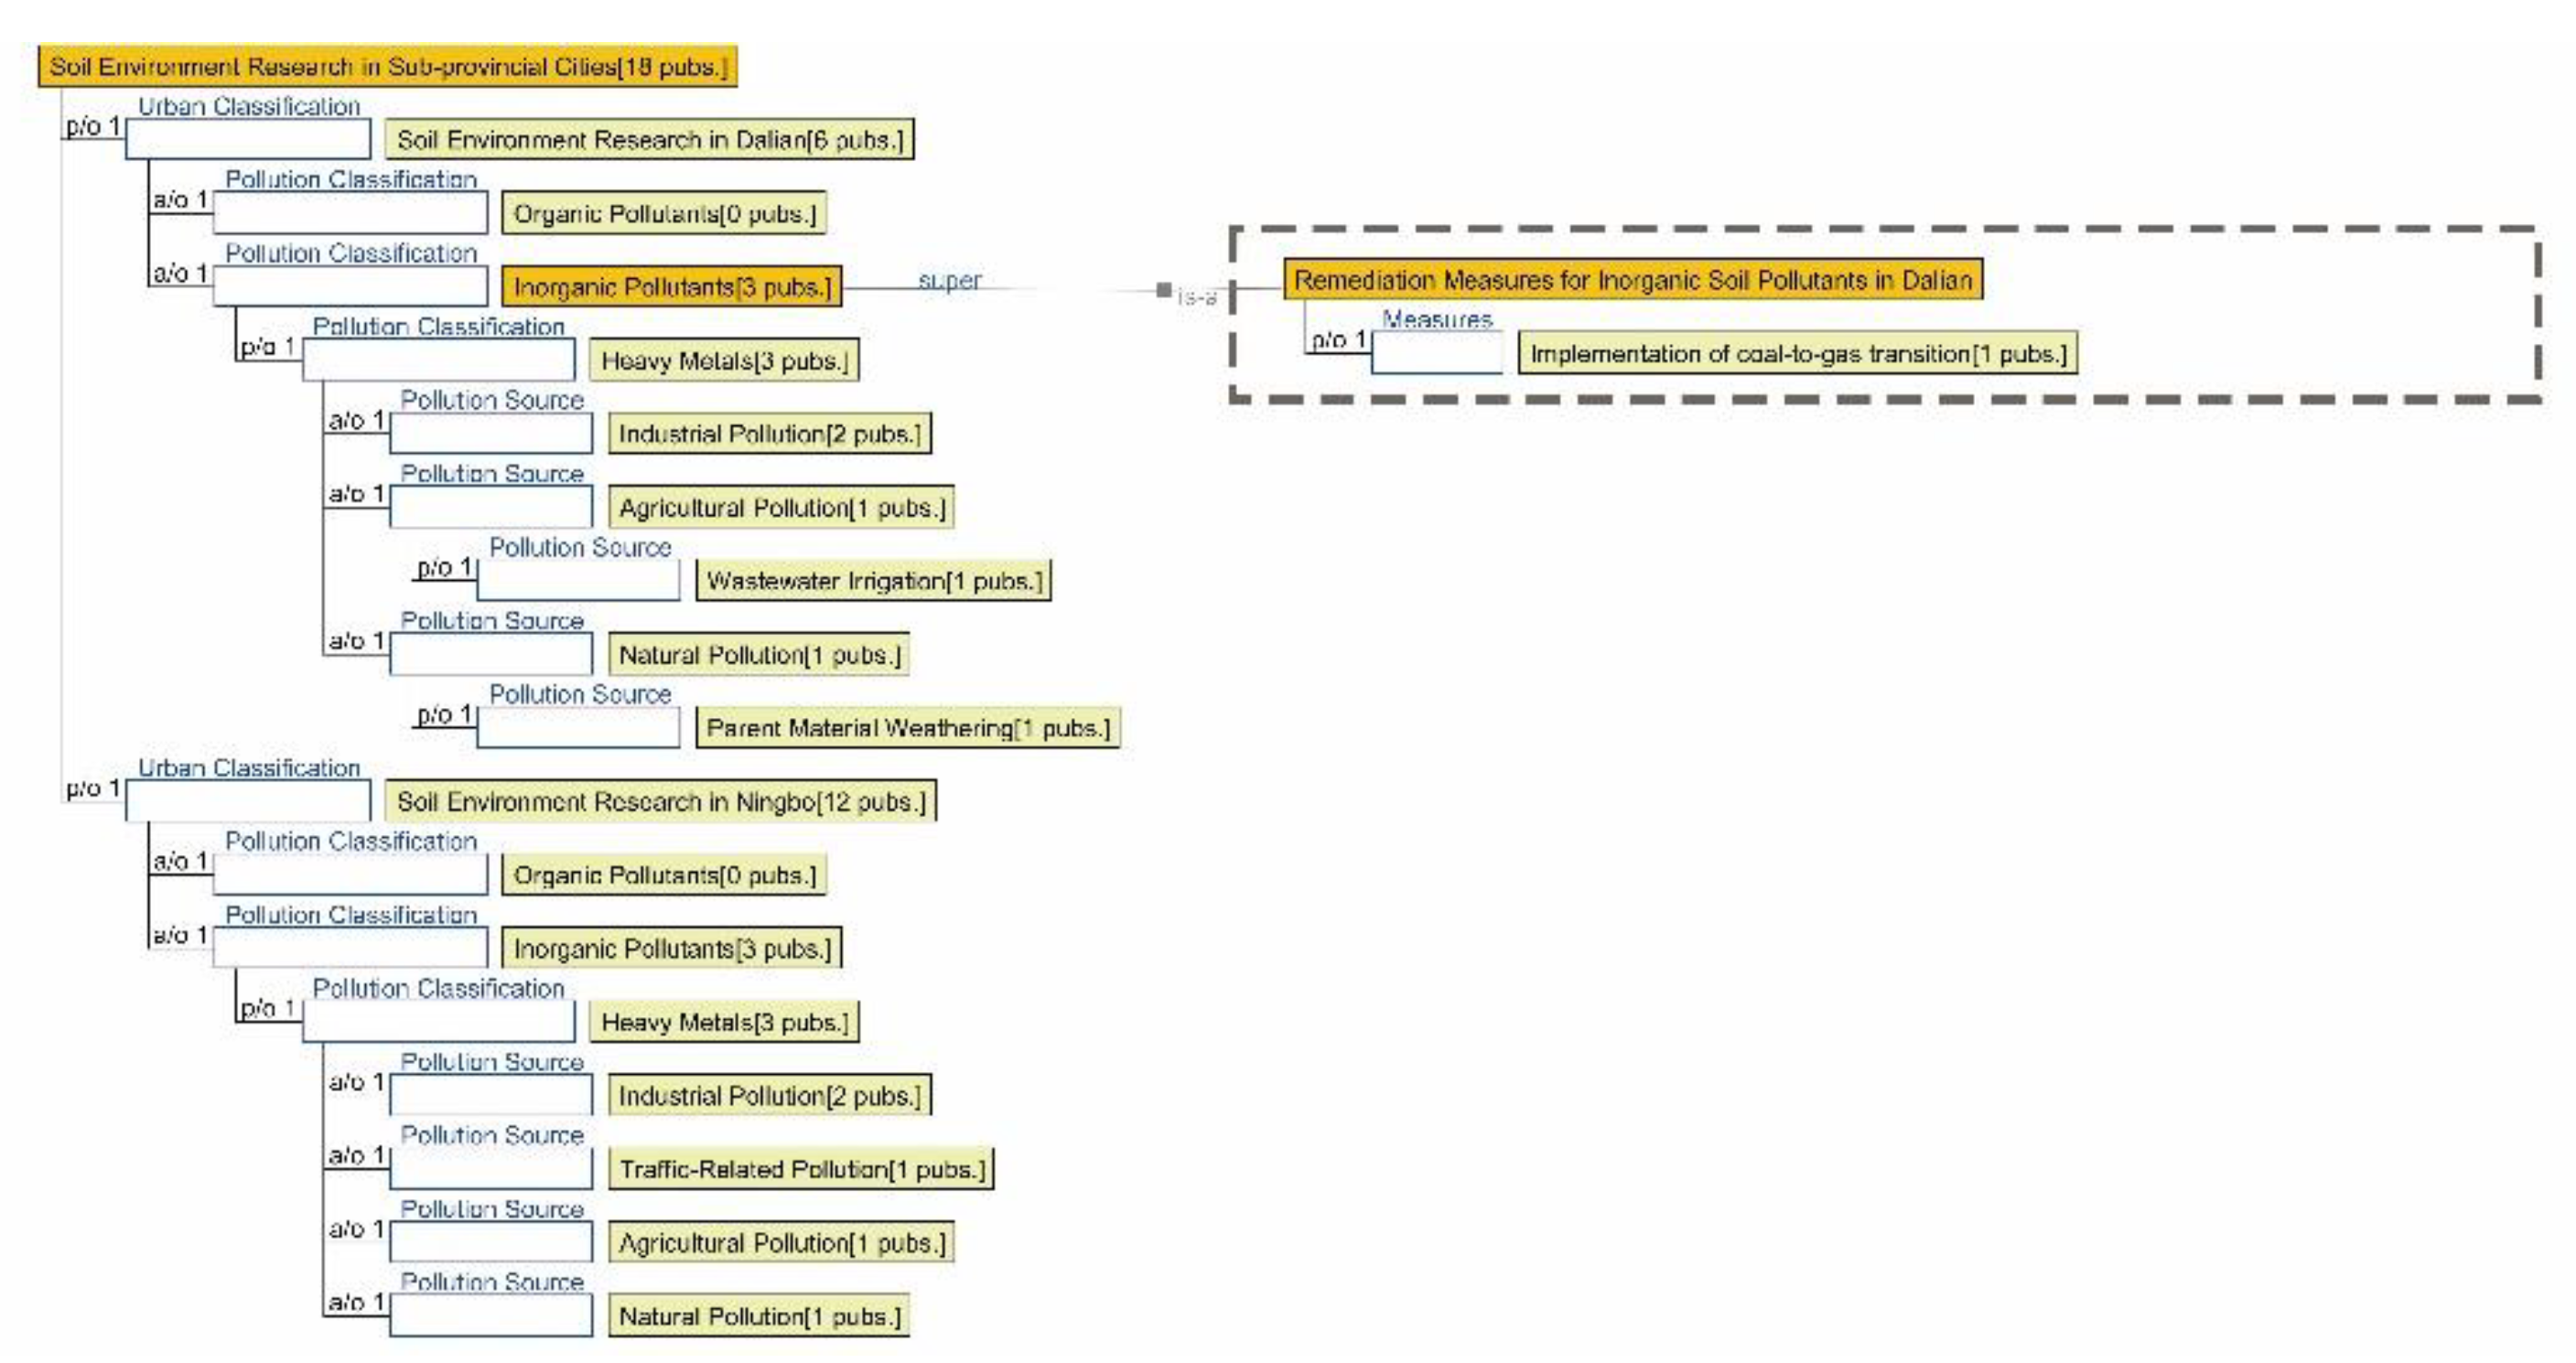
Figure 19.
Semantic Ontology Mapping of Soil Environments in Prefecture-Level Cities.
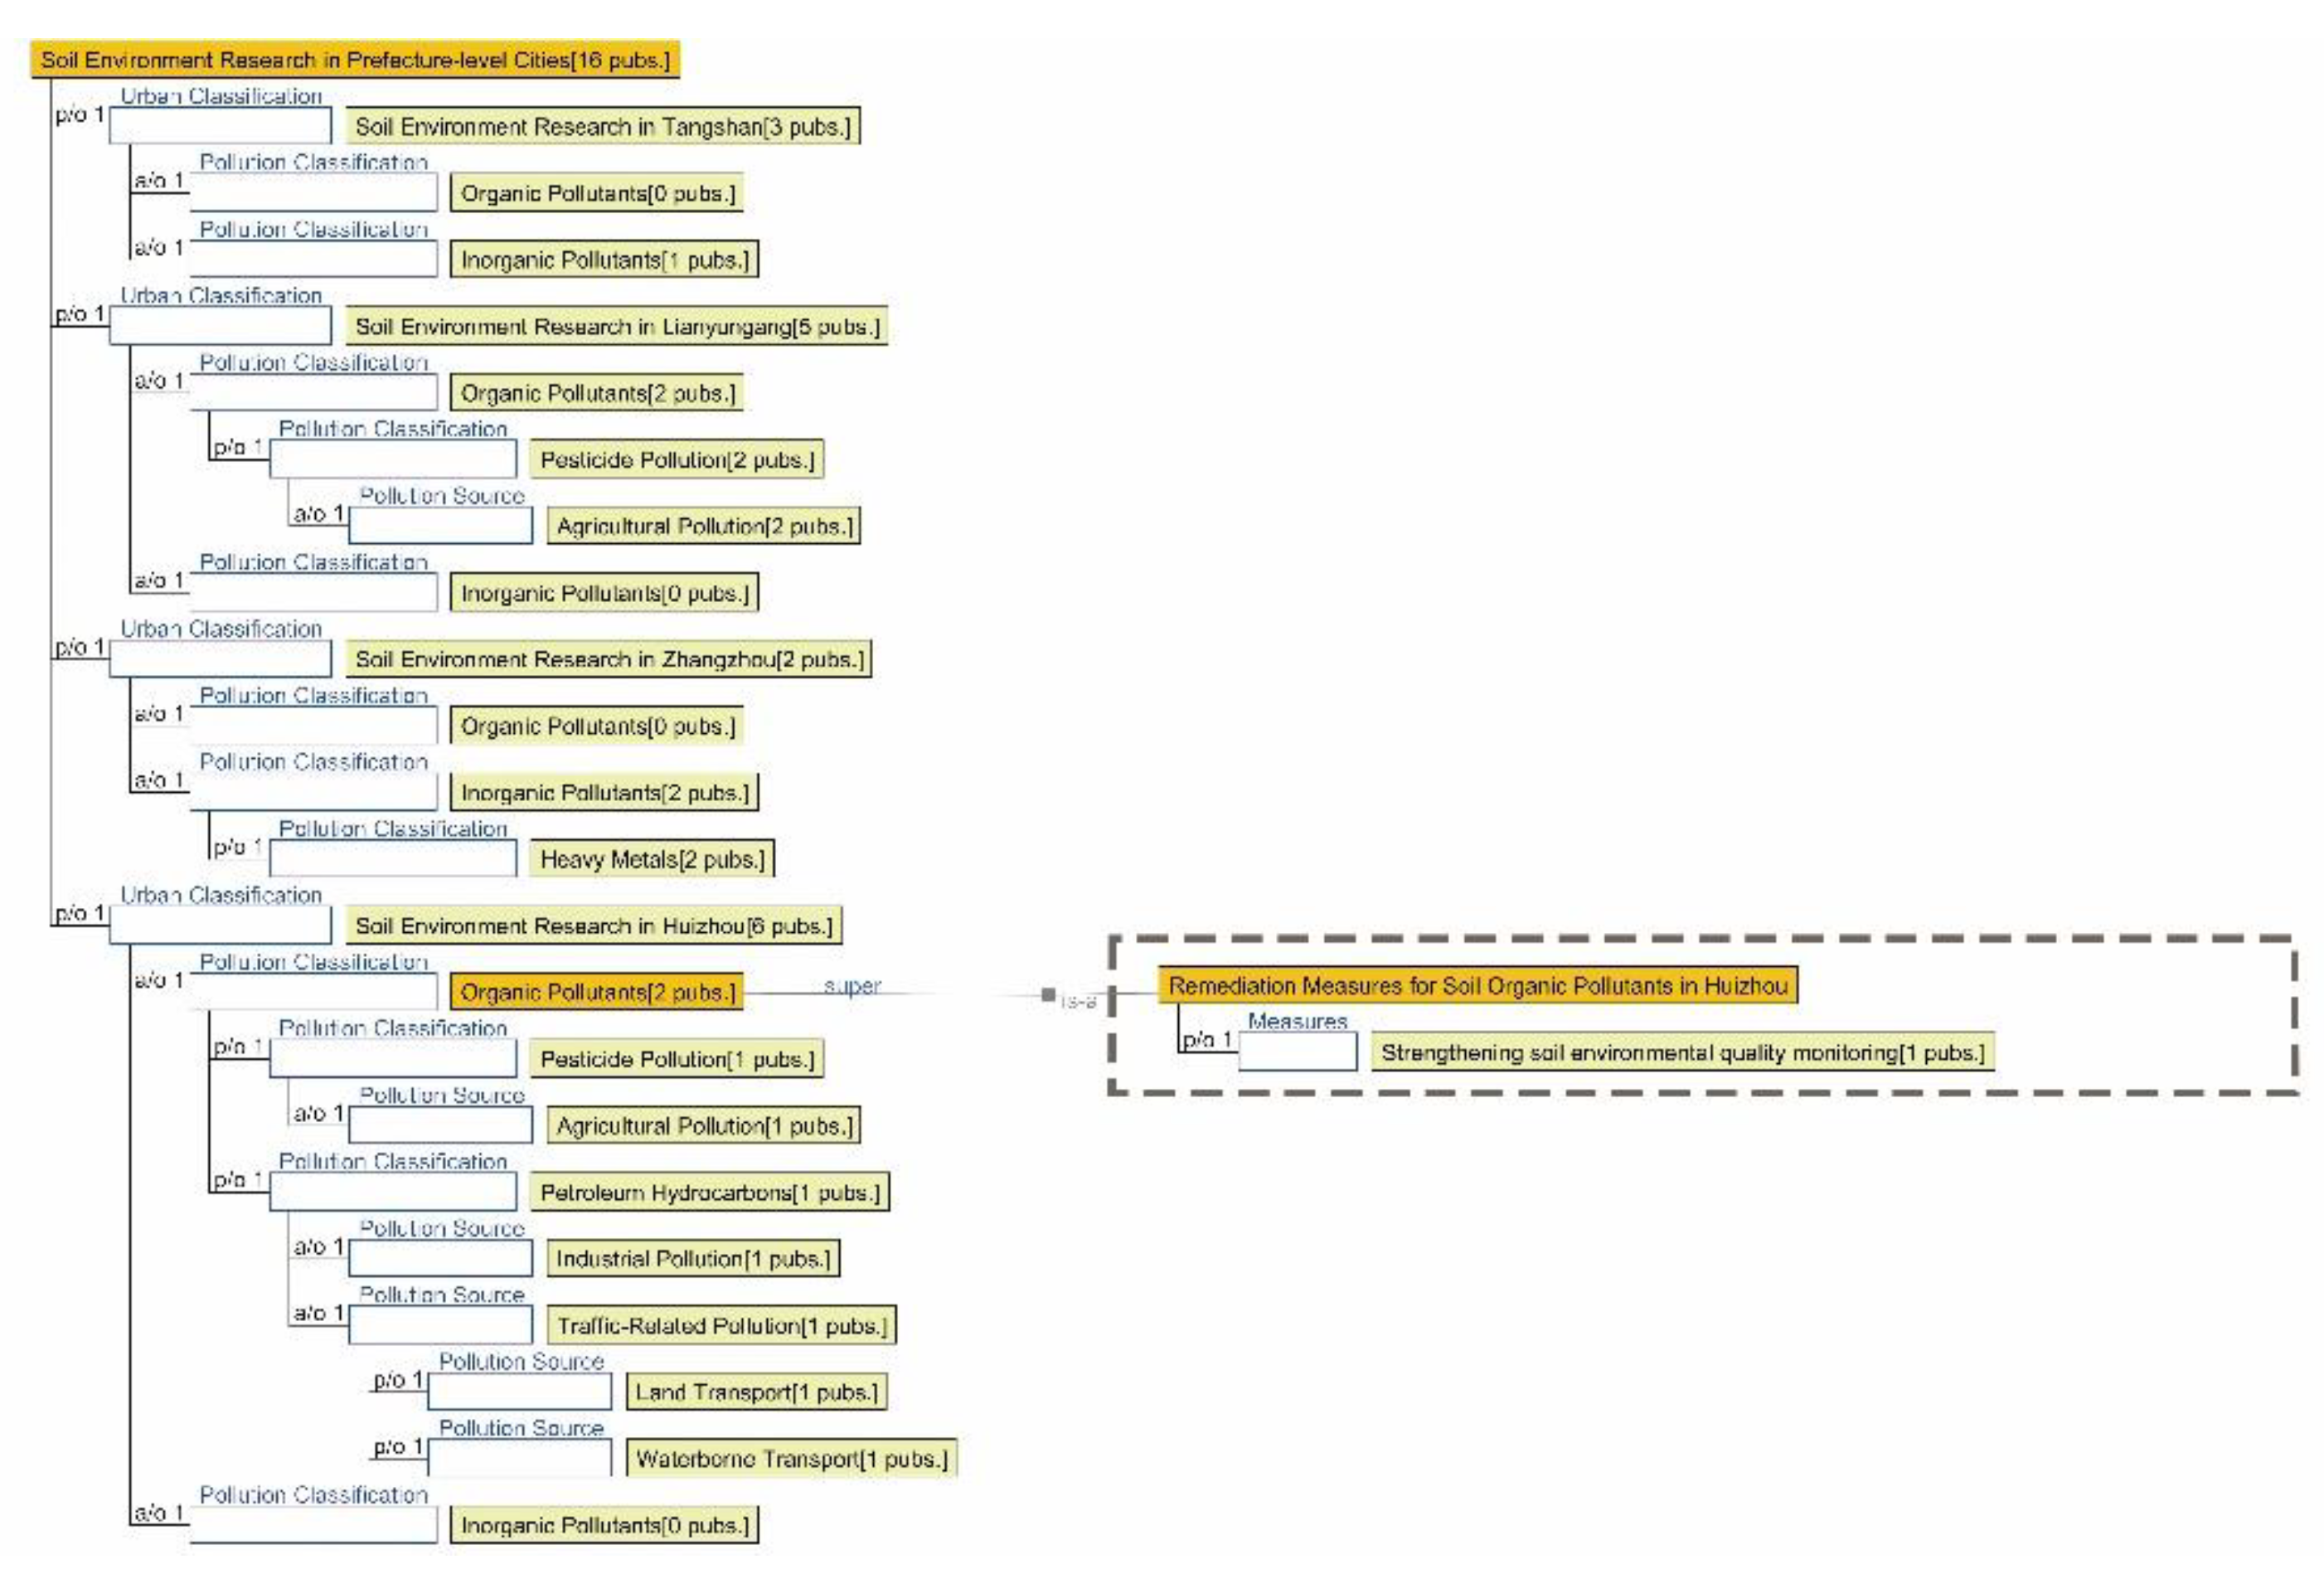
Figure 20.
Semantic Ontology Mapping of Biological Environments in Municipalities Directly Under the Central Government.
Figure 20.
Semantic Ontology Mapping of Biological Environments in Municipalities Directly Under the Central Government.
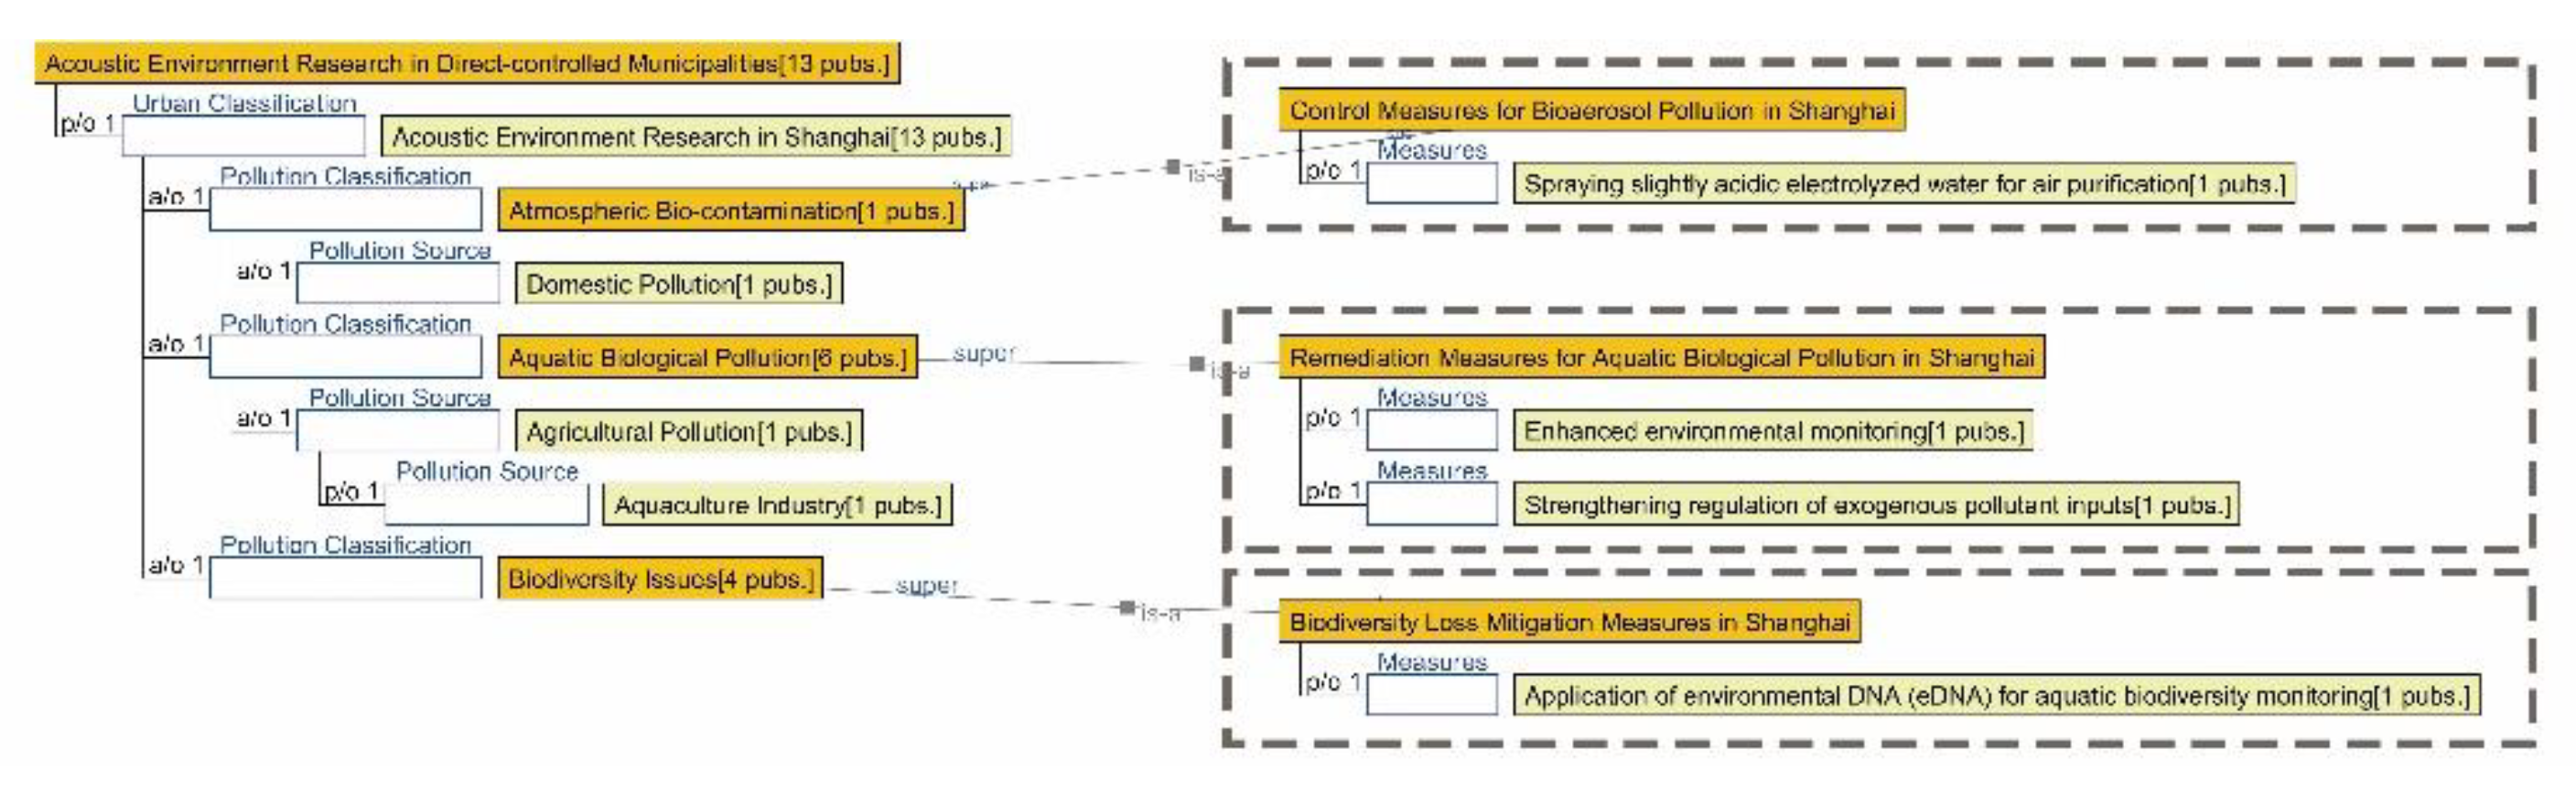
Figure 21.
Semantic Ontology Mapping of Biological Environments in Sub-Provincial Level Cities.
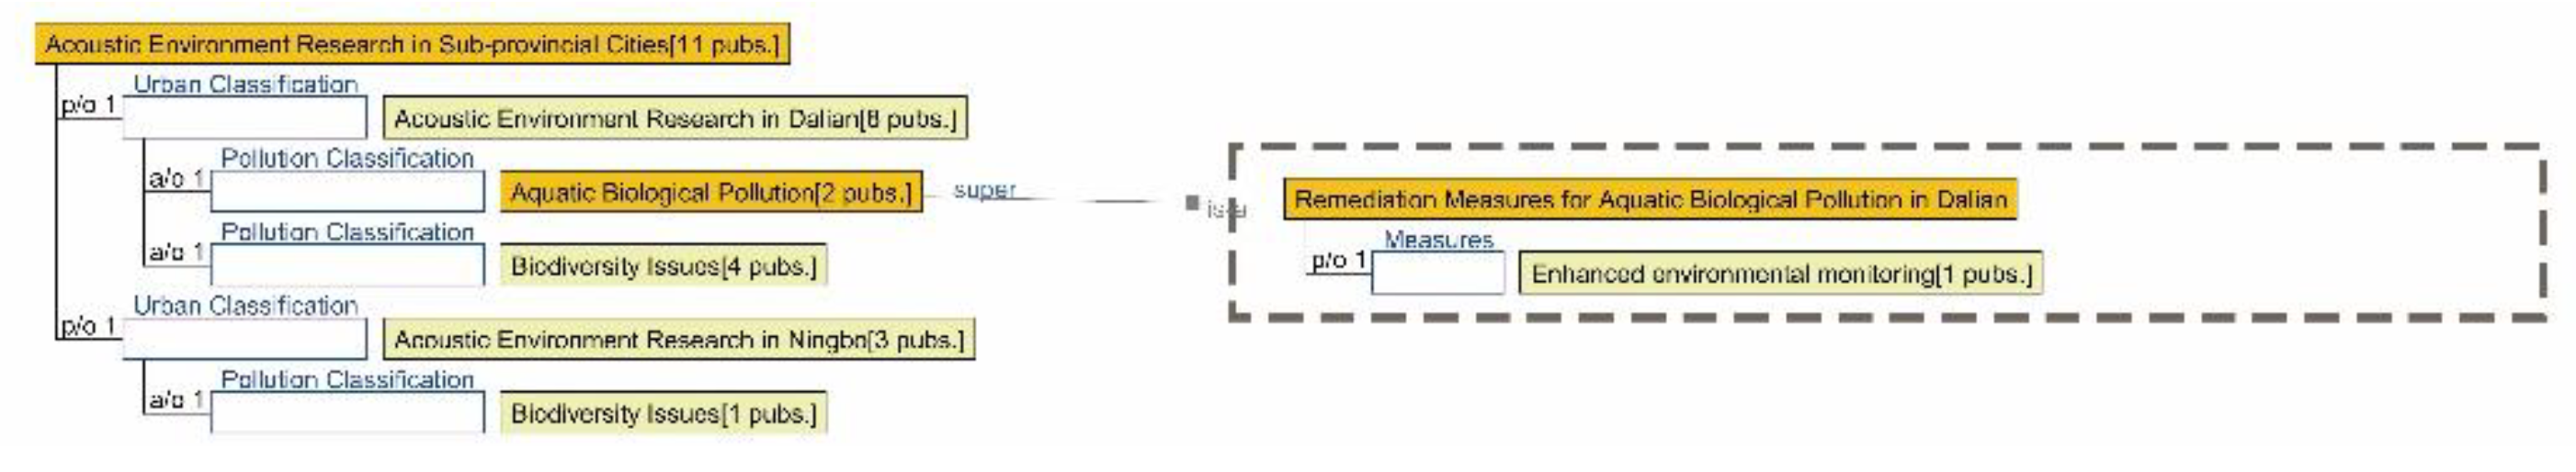
Figure 22.
Semantic Ontology Mapping of Biological Environments in Prefecture-Level Cities.
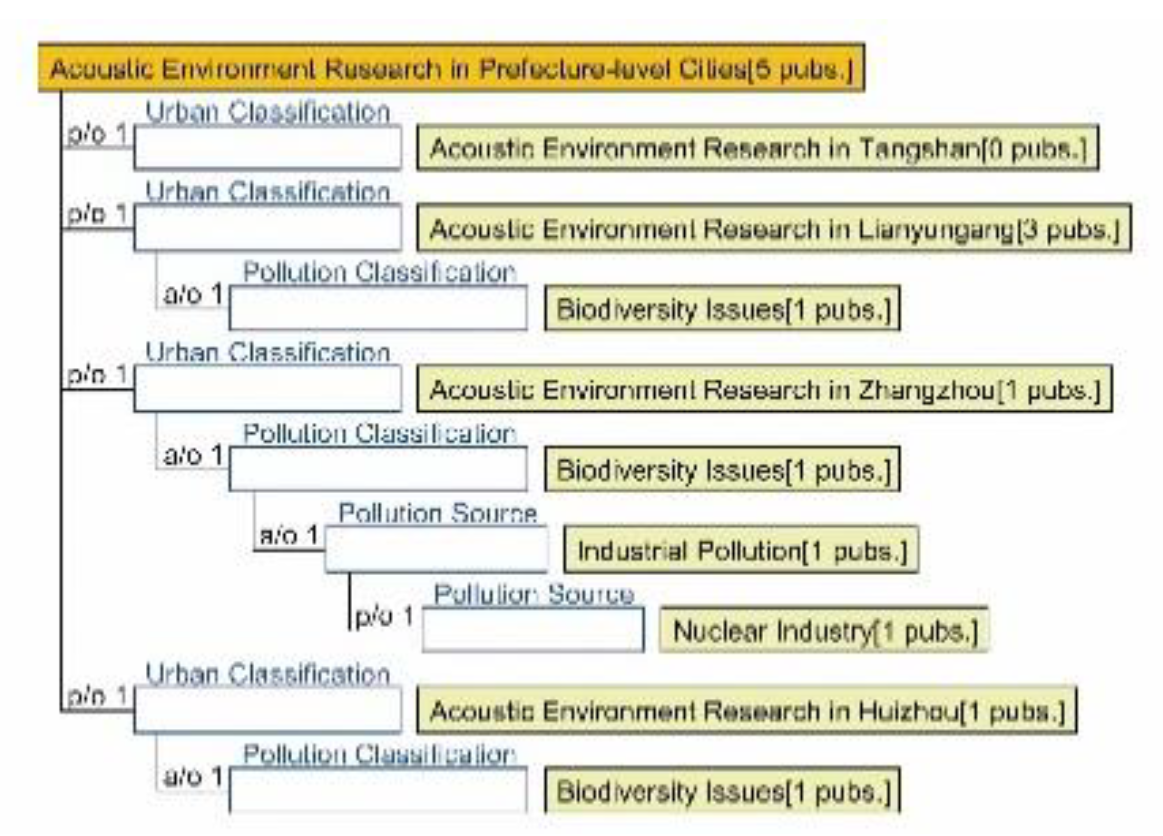
Figure 23.
Semantic Ontology Mapping of Acoustic Environments in Municipalities Directly Under the Central Government.
Figure 23.
Semantic Ontology Mapping of Acoustic Environments in Municipalities Directly Under the Central Government.
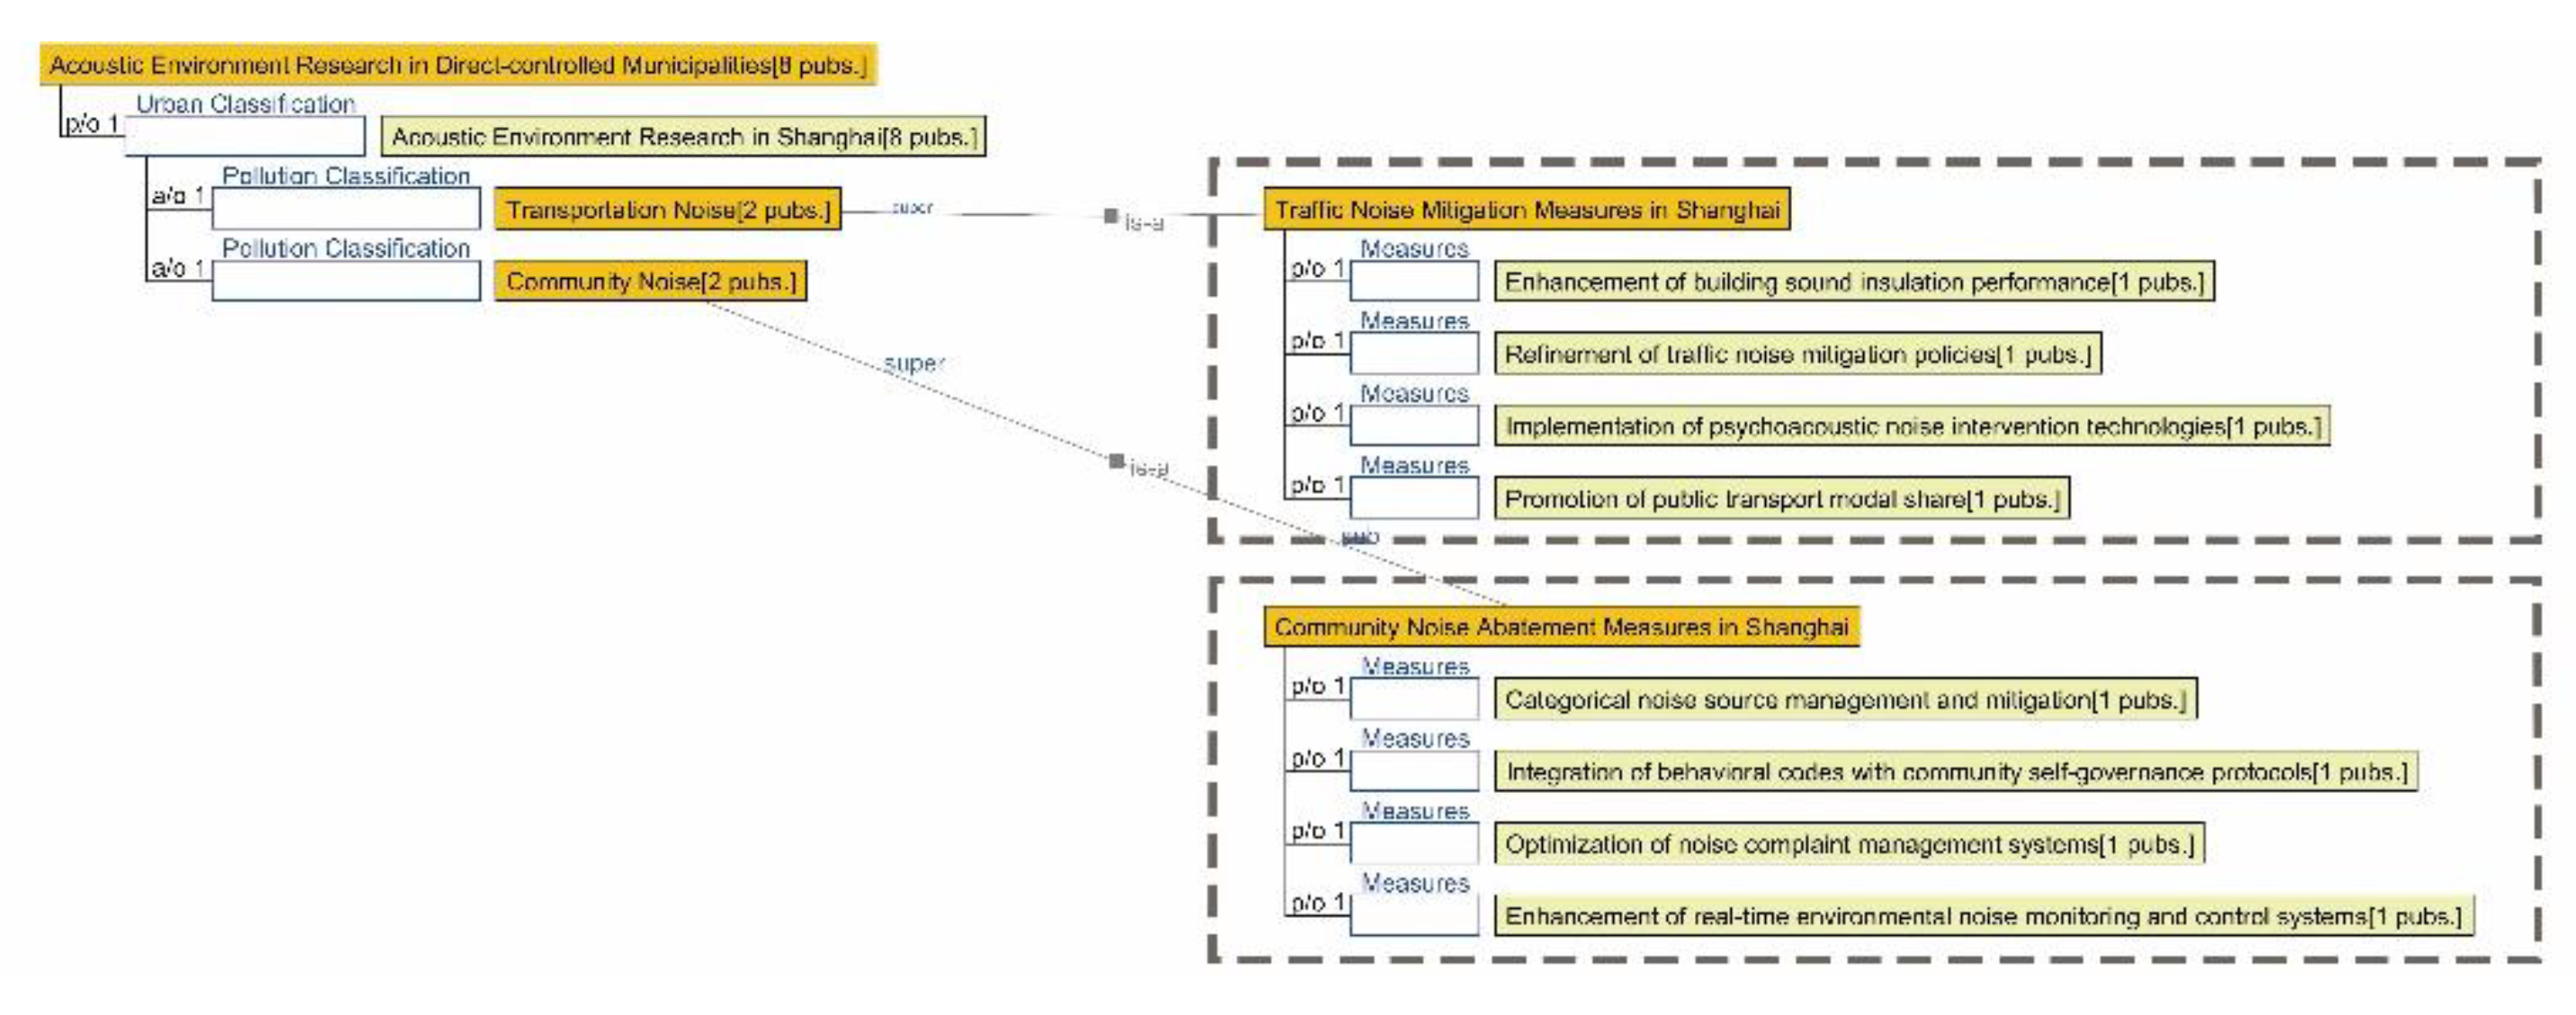
Figure 24.
Semantic Ontology Mapping of Acoustic Environments in Sub-Provincial Level Cities.
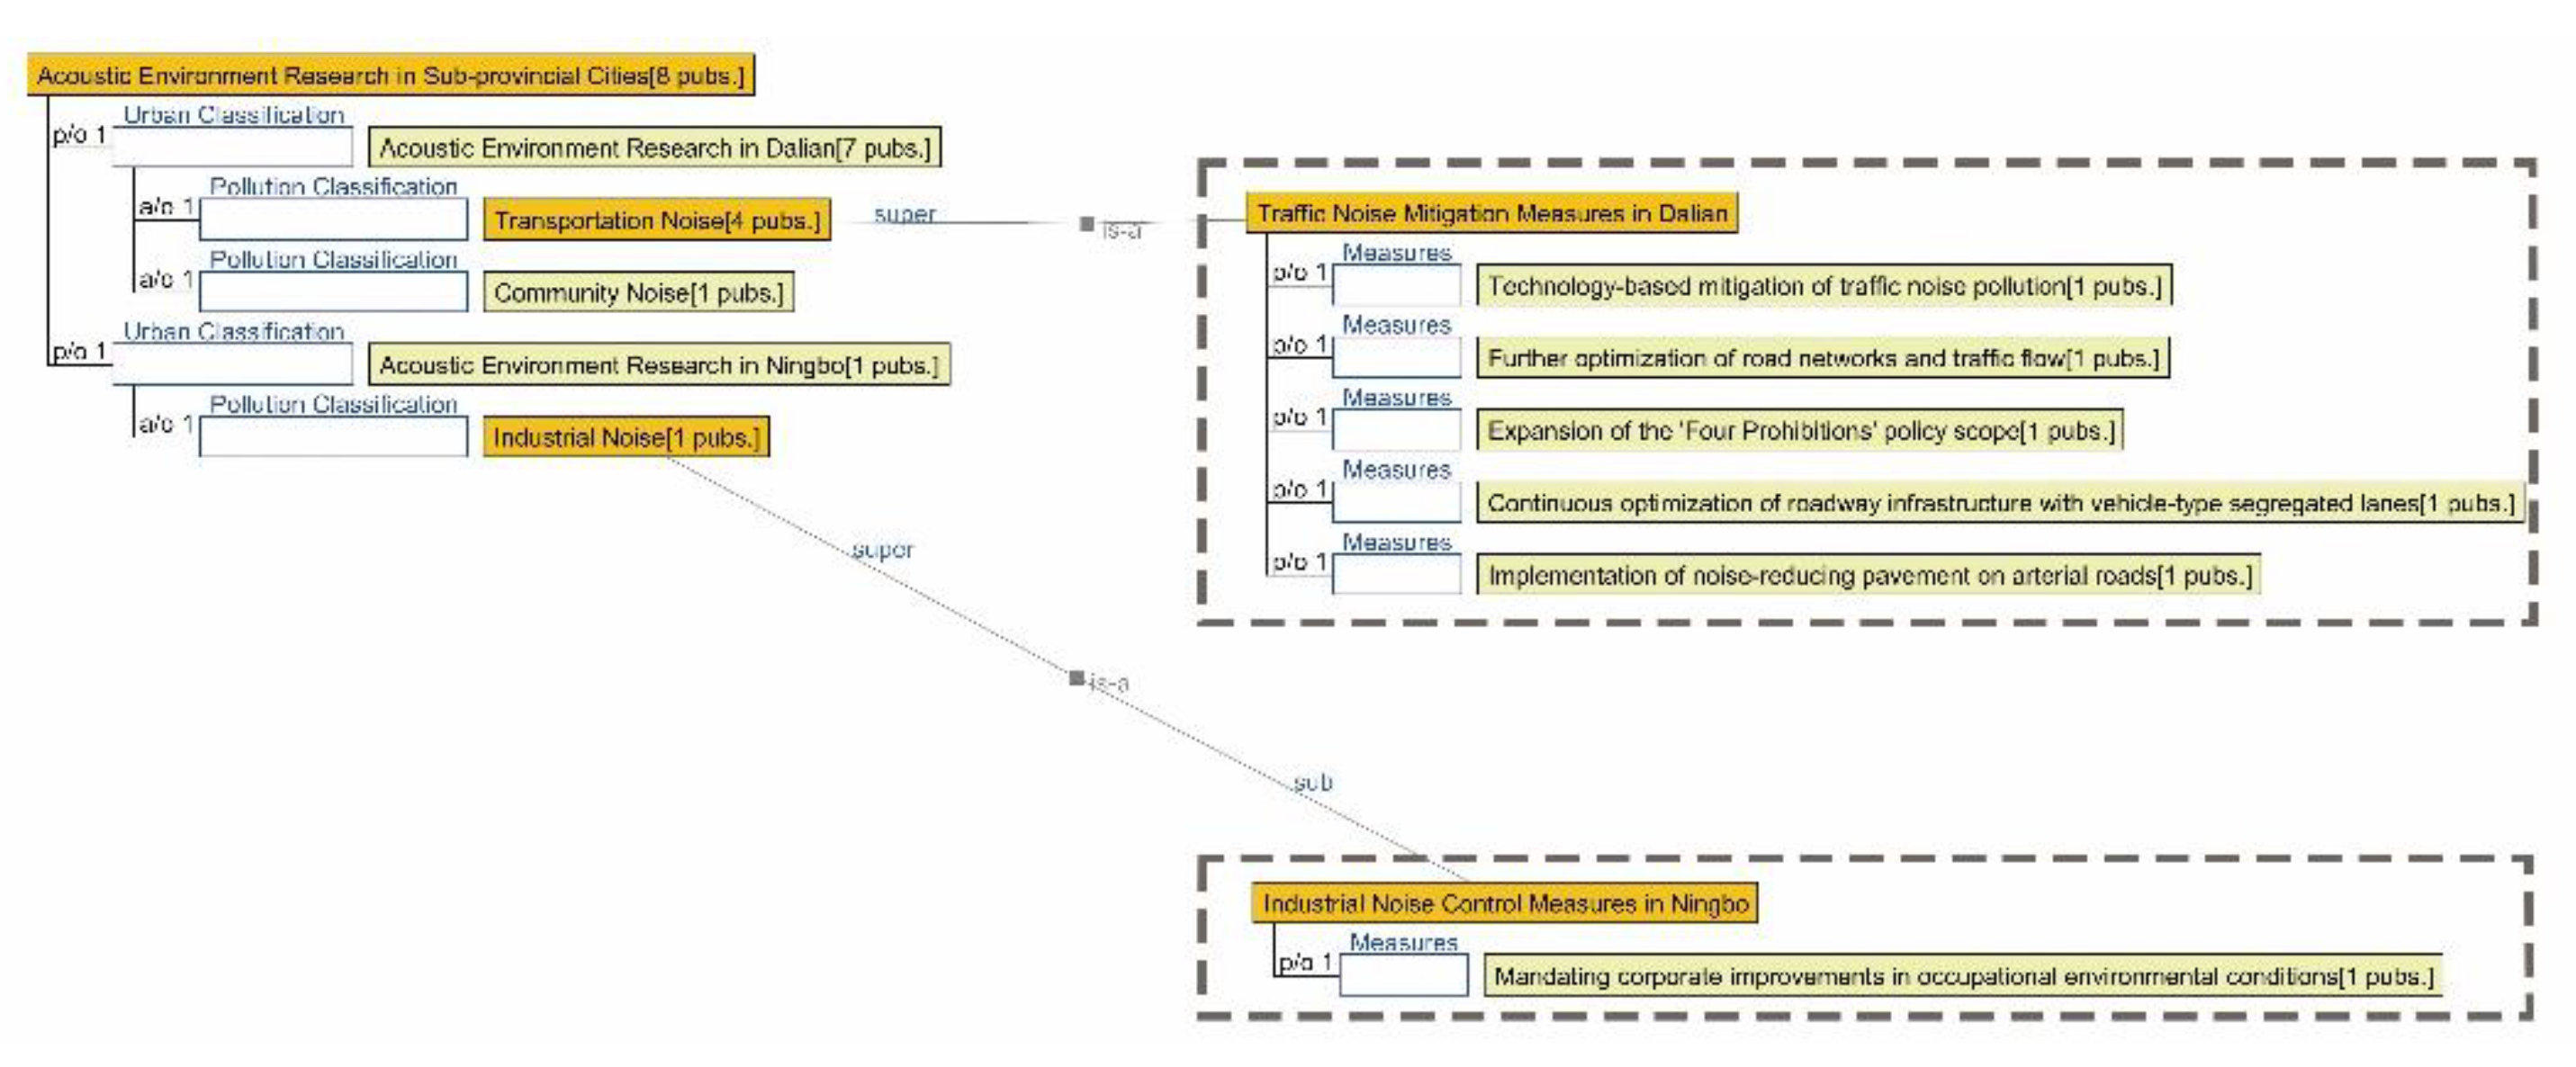
Figure 25.
Semantic Ontology Mapping of Acoustic Environments in Prefecture-Level Cities.
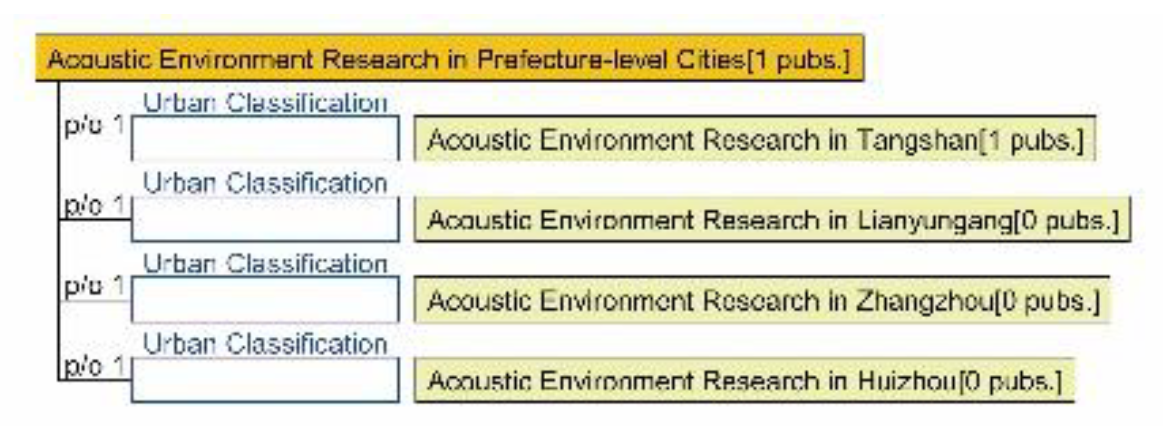

Table 1.
Co-occurrence network map of keywords in Chinese and English scholarly literature.
 Municipality directly under the central government (WOS) |
 Municipality directly under the central government (CNKI) |
 Sub-provincial level city (WOS) |
 Sub-provincial level city (CNKI) |
 Prefecture-level City (WOS) |
 Prefecture-level City (CNKI) |
Table 2.
High-Centrality Keywords from WOS (Municipality directly under the central government).
| Keywords | Centrality | Count | Keywords | Centrality | Count |
| Ecosystem services | 0.42 | 13 | Policy | 0.16 | 33 |
| Generation | 0.27 | 7 | Influencing factors | 0.16 | 15 |
| Economic growth | 0.26 | 12 | Yangtze river economic belt | 0.16 | 10 |
| Financial constraints | 0.24 | 4 | Public attention | 0.16 | 3 |
| Design | 0.22 | 7 | Sustainable development | 0.15 | 31 |
| Particulate matter [Atmospheric Environment] |
0.20 | 22 | Corporate governance | 0.15 | 18 |
| Drivers | 0.20 | 3 | Areas | 0.15 | 11 |
| Responsibility | 0.19 | 20 | Resolution | 0.15 | 5 |
| Energy consumption | 0.19 | 11 | Haze [Atmospheric Environment] |
0.15 | 3 |
| PM2.5 concentrations [Atmospheric Environment] |
0.19 | 3 | Deep learning | 0.14 | 10 |
| Life cycle assessment | 0.18 | 22 | Aerosol [Atmospheric Environment] |
0.14 | 6 |
| Trends | 0.18 | 15 | Social responsibility | 0.13 | 17 |
| Chemistry | 0.18 | 5 | Deposition | 0.13 | 6 |
| Municipal solid waste | 0.17 | 6 | Media attention | 0.13 | 3 |
| Exposure | 0.16 | 35 | Challenges | 0.13 | 2 |
Table 3.
High-Centrality Keywords from CNKI (Municipality directly under the central government).
| Keywords | Centrality | Count | Keywords | Centrality | Count |
| 上海(Shanghai) | 0.18 | 16 | 重金属(Heavy metals) | 0.02 | 5 |
| 水环境(Water environment) [Aquatic Environment] |
0.08 | 8 | 水质评价(Water quality assessment) [Aquatic Environment] |
0.02 | 5 |
| 土壤(Soil) [Soil Environment] |
0.07 | 6 | 上海市(Shanghai) | 0.02 | 2 |
| 地下水(Groundwater) [Aquatic Environment] |
0.04 | 5 | 发展环境(Development environment) | 0.02 | 1 |
| 养殖(Aquaculture) | 0.04 | 1 | 发布特征(Emission characteristics) | 0.01 | 2 |
| 幼蟹(Juvenile crabs) | 0.03 | 2 | 评估(Assessment) | 0.01 | 2 |
| 土壤污染(Soil pollution) [Soil Environment] |
0.03 | 1 | 工业地块(Industrial sites) | 0.01 | 2 |
| 空气质量(Air quality) [Atmospheric Environment] |
0.02 | 9 | 绿色经济(Green economy) | 0.01 | 2 |
| 水质(Water quality) [Aquatic Environment] |
0.02 | 7 | 浮水植物(Floating aquatic plants) | 0.01 | 2 |
Table 4.
High-Centrality Keywords from WOS(Sub-provincial level city).
| Keywords | Centrality | Count | Keywords | Centrality | Count |
| Satisfaction | 0.42 | 4 | Identification | 0.17 | 8 |
| Energy consumption | 0.37 | 4 | Diversity | 0.17 | 3 |
| Pollution | 0.34 | 10 | China | 0.16 | 6 |
| Quality | 0.33 | 8 | Performance | 0.15 | 16 |
| Catalyst | 0.31 | 6 | Evolution | 0.14 | 7 |
| Removal | 0.26 | 4 | Fabrication | 0.14 | 2 |
| Particulate matter [Atmospheric Environment] |
0.22 | 7 | Degradation | 0.14 | 2 |
| Source apportionment | 0.21 | 6 | Hydrogenation | 0.14 | 2 |
| Energy | 0.20 | 15 | Water quality [Aquatic Environment] |
0.13 | 2 |
| Impact | 0.20 | 11 | Model | 0.12 | 10 |
| Life cycle assessment | 0.20 | 4 | Carbon | 0.12 | 2 |
| Environmental impacts | 0.20 | 2 | Catalysts | 0.11 | 7 |
| Nanosheets | 0.19 | 6 | Air source heat pump | 0.11 | 1 |
| Long term exposure | 0.19 | 2 | Emissions | 0.09 | 4 |
| 15System | 0.17 | 9 | 30Environment | 0.09 | 3 |
Table 5.
High-Centrality Keywords from CNKI(Sub-provincial level city)
| Keywords | Centrality | Count | Keywords | Centrality | Count |
| 宁波(Ningbo) | 0.02 | 7 | 协同治理(Collaborative governance) | 0.01 | 2 |
Table 6.
High-Centrality Keywords from WOS(Prefecture-level City)
| Keywords | Centrality | Count | Keywords | Centrality | Count |
| Abundance | 0.40 | 4 | Haze | 0.16 | 2 |
| Water [Aquatic Environment] |
0.33 | 4 | Model | 0.15 | 7 |
| Management | 0.33 | 4 | Construction waste | 0.15 | 2 |
| Air pollution [Atmospheric Environment] |
0.33 | 3 | Atmospheric mercury | 0.15 | 1 |
| Allocation principles | 0.29 | 1 | Aerosols | 0.14 | 2 |
| Exposure | 0.26 | 4 | Air pollution accidents [Atmospheric Environment] |
0.13 | 1 |
| Sea [Aquatic Environment] |
0.26 | 4 | Bayesian networks | 0.13 | 1 |
| Beijing-Tianjin-Hebei region | 0.19 | 3 | Assessments | 0.13 | 1 |
| Emissions | 0.19 | 2 | Framework | 0.13 | 2 |
| Heavy metals | 0.19 | 2 | Air quality [Atmospheric Environment] |
0.12 | 2 |
| Pearl river delta [Aquatic Environment] |
0.18 | 4 | PM2.5 concentrations [Atmospheric Environment] |
0.11 | 2 |
| China | 0.17 | 15 | Pollution | 0.11 | 2 |
| Contamination | 0.17 | 3 | Sustainable development | 0.10 | 2 |
| Energy | 0.16 | 2 | Impact | 0.09 | 5 |
| Deep learning | 0.16 | 4 | Environment | 0.09 | 3 |
Table 7.
High-Centrality Keywords from WOS(Prefecture-level City)
| Keywords | Centrality | Count | Keywords | Centrality | Count |
| 唐山市(Tangshan) | 0.06 | 5 | 污染源(Pollution sources) | 0.01 | 2 |
| 空气质量(Air quality) [Atmospheric Environment] |
0.04 | 9 | 惠州市( Huizhou) | 0.01 | 2 |
| 水环境(Water environment) [Aquatic Environment] |
0.01 | 7 | 低碳(Low-carbon) | 0.01 | 1 |
| 水质(Water quality) [Aquatic Environment] |
0.01 | 5 | 臭氧(Ozone) [Atmospheric Environment] |
0.01 | 1 |
| 水质评价(Water quality assessment) [Aquatic Environment] |
0.01 | 3 | 污染物(Pollutants) | 0.01 | 1 |
| 治理(Governance) | 0.01 | 2 |
Table 8.
Analysis of the Proportional Distribution of Research Papers on Different Aerosol Types Across Various Cities.
Table 8.
Analysis of the Proportional Distribution of Research Papers on Different Aerosol Types Across Various Cities.
 |
 |
 |
 |
|||
| All Cities | Shanghai | Dalian | Ningbo | |||
 |
 |
 |
 |
|||
| Tangshan | Lianyungang | Zhangzhou | Huizhou | |||
Table 9.
Analysis of the Proportional Distribution of Research Papers on Gaseous Pollutants Categories Across Cities.
Table 9.
Analysis of the Proportional Distribution of Research Papers on Gaseous Pollutants Categories Across Cities.
 |
 |
 |
 |
|||
| All Cities | Shanghai | Dalian | Ningbo | |||
 |
 |
 |
 |
|||
| Tangshan | Lianyungang | Zhangzhou | Huizhou | |||
Table 10.
Analysis of the Proportional Distribution of Research Papers on Aquatic Pollutant Categories Across Cities.
Table 10.
Analysis of the Proportional Distribution of Research Papers on Aquatic Pollutant Categories Across Cities.
 |
 |
 |
 |
|||
| All Cities | Shanghai | Dalian | Ningbo | |||
 |
 |
 |
 |
|||
| Tangshan | Lianyungang | Zhangzhou | Huizhou | |||
Disclaimer/Publisher’s Note: The statements, opinions and data contained in all publications are solely those of the individual author(s) and contributor(s) and not of MDPI and/or the editor(s). MDPI and/or the editor(s) disclaim responsibility for any injury to people or property resulting from any ideas, methods, instructions or products referred to in the content. |
© 2025 by the authors. Licensee MDPI, Basel, Switzerland. This article is an open access article distributed under the terms and conditions of the Creative Commons Attribution (CC BY) license (http://creativecommons.org/licenses/by/4.0/).
Copyright: This open access article is published under a Creative Commons CC BY 4.0 license, which permit the free download, distribution, and reuse, provided that the author and preprint are cited in any reuse.


