Submitted:
30 September 2025
Posted:
30 September 2025
You are already at the latest version
Abstract
The study presents a systematic machine-learning study of the solubility of diverse pharmaceutical acids in deep eutectic solvents (DESs). Using an automated Du-al-Objective Optimization with Iterative feature pruning (DOO-IT) framework, we analyze a solubility dataset compiled from the literature for eight pharmaceutically important carboxylic acids and augmented with new measurements for mefenamic and niflumic acids in choline chloride– and menthol–based DESs, yielding N = 1,020 data points. Analysis with the corrected Akaike Information Criterion (AICc) reveals two distinct basins of high performance: an ultra-parsimonious 6‑descriptor model and a high-accuracy 16‑descriptor model, exposing a previously unrecognized duality in optimal model complexity. The 6‑descriptor model offers excellent predictive power suitable for rapid virtual screening, while the 16‑descriptor model—featuring a COS-MO‑RS–derived solubility descriptor—delivers the best absolute accuracy for applica-tions requiring maximum quantitative fidelity. These complementary models enable a practical two-tier screening strategy. The dual-solution landscape clarifies the trade-off between complexity and cost in QSPR for DES systems and shows that phys-ically meaningful energetic descriptors can replace or enhance explicit COSMO‑RS predictions depending on the application.
Keywords:
solubility
; deep eutectic solvents
; machine learning
; nuSVR
; solubility prediction
; COSMO-RS
; molecular descriptors
; mefenamic acid
; niflumic acid
1. Introduction
Carboxylic acids and their derivatives play a hugely important role in pharmacy; they are not simple active medicinal substances but also key structural motifs used to design new biologically active molecules [1,2,3]. Due to the presence of a carboxyl group, they can participate in proton dissociation, form hydrogen bonds, undergo conjugation with plasma proteins, and influence absorption and distribution processes in the body. In pharmaceutical practice, aromatic and aliphatic acids are found as components of anti-inflammatory, analgesic, antioxidant, or diuretic drugs. Their bioavailability and effectiveness often depend on the form of salt, esters, or complexes in which they occur [4,5]. The experimental part of this study is focused on two pharmaceutically important compounds, namely mefenamic acid and niflumic acid, belonging to the broad class of non-steroidal anti-inflammatory drugs (NSAIDs) [6,7]. Mefenamic acid is widely used for treating mild to moderate pain, including menstrual pain (dysmenorrhea), and for inflammatory conditions requiring short-term pain relief [8,9,10]. Niflumic acid, in addition to its anti-inflammatory and analgesic properties, is also used as a research tool in pharmacology, for example, as a non-specific blocker of certain ion channels (e.g., chloride channels), which makes it an interesting subject for research beyond typical therapeutic applications [11,12,13]. Their physicochemical properties have direct practical consequences, particularly limited solubility in the aqueous phase, which complicates oral and parenteral formulations and necessitates the use of auxiliary agents such as solubilizers, surfactants, or salts [14,15,16]. Additionally, several other carboxylic acids were considered during the construction of a machine learning model. Flufenamic acid is used as an anti-inflammatory drug, although its clinical application is currently limited [17,18,19]. Ibuprofen and ketoprofen are some of the most widely used NSAIDs with analgesic and antipyretic properties [20,21,22,23,24]. They are widely available over-the-counter and are generally well-tolerated. Probenecid represents another category of acid use; it's a uricosuric drug used to treat gout and extend the half-life of antibiotics by inhibiting renal excretion [25,26]. In addition to synthetic drugs, there is also a broad group of natural acids, most often phenolic, found in plants and having significant biological potential [5,27,28]. Ferulic acid is a powerful antioxidant that protects against oxidative stress and is used in research on neurodegenerative diseases [29,30]. Caffeic acid shows anti-inflammatory, anti-cancer, and hepatoprotective activity [31,32,33]. p-Coumaric acid and syringic acid also belong to the phenolic acids, with antioxidant properties and potential significance in the prevention of lifestyle diseases [34,35,36,37,38].
The solubility of a particular substance is one of the most critical parameters in pharmacy, materials chemistry, and process engineering [39,40]. In the context of the pharmaceutical industry, the solubility of an active pharmaceutical ingredient (API) determines both pharmacokinetic properties and production and storage strategies. The poor solubility of many organic molecules limits bioavailability, necessitating the use of modified forms (e.g., amorphous formulations, nanocrystallization, and lipid carriers) and increasing product development costs [41,42]. Beyond the pharmacological aspect, solubility also influences the selectivity of extraction processes, the efficiency of crystallization, purification, and recycling of raw materials, as well as the environmental behavior of compounds [43,44]. It is also a multifactorial property affected by temperature, pH, ionic strength, pressure, and specifically the thermodynamic properties of the solid matter (lattice energy, polymorphism) and specific interactions with solvent molecules [45,46,47]. In light of this, precise solubility profiles are key not only for evaluating drug efficacy but also for predicting product stability and the risk of adverse physicochemical transformations during storage and administration.
Among various techniques used for solubility enhancement of APIs [41,48,49], deep eutectic solvents (DESs) are particularly interesting and promising. DESs are a flexible and increasingly studied class of liquid systems formed by mixing appropriate hydrogen bond donors and acceptors, which leads to a significant reduction in the melting point relative to the starting components [50,51,52,53]. DES are distinguished by a number of properties useful in a pharmaceutical context: low volatility (which promotes safety and reduces emissions), a wide spectrum of polarity and acidity, significant "tunability" through component selection, and the ability to solubilize compounds of various chemical natures [54,55]. In pharmacy, DES are being researched as extraction media for isolating natural products, as potential carriers for formulations that enhance the solubility and bioavailability of APIs, and as so-called THEDES (therapeutic deep eutectic solvents), i.e. systems in which the components themselves may have biological activity or facilitate drug stabilization and delivery [56,57,58,59]. At the same time, the vast combinatorial space of possible components and molar ratios necessitates the use of accelerated testing methodologies and predictive tools, as an empirical review of all variants is costly and time-consuming.
In this context, computational solubility prediction, especially using QSPR and advanced machine learning methods, is becoming a strategic tool [60,61,62,63]. QSPR models translate the relationship between molecular structure and macroscopic properties, while modern ML algorithms (including neural networks, graph models, and ensemble strategies) can capture complex, non-linear patterns and interactions between multiple variables. Neural networks offer particularly great flexibility: they can integrate different types of representations (physicochemical descriptors, fingerprints, molecular graphs, and features describing composition and properties) and learn relationships that are difficult to capture with traditional linear models [64,65,66]. Recently, such neural networks were successfully employed for solubility predictions of drugs [67,68,69]. At the same time, the question arises of balancing the simplicity and interpretability of models with their ability to accurately represent reality. In practice, this means the need for careful descriptor selection, cross-validation, estimation of prediction uncertainty, and techniques to prevent overfitting.
The purpose of this work was to create a predictive model for estimating the solubility of various pharmaceutically active carboxylic acids. The model was developed by combining COSMO-RS-derived molecular descriptors with machine learning methods, based on our newly established DOO-IT (Dual-Objective Optimization with ITerative feature pruning) framework. New experimental data for mefenamic acid and niflumic acid were obtained for this study, which were supplemented with solubility values found in literature for a number of acids used in the pharmaceutical realm. The constructed models were thoroughly validated, and their performance was discussed, highlighting their effectiveness and the potential for generalization.
2. Results and Discussion
2.1. Solubility Measurements of Mefenamic Acid and Niflumic Acid
Figure 1 summarizes the mole-fraction solubilities at 25 °C of mefenamic acid (xMEF) and niflumic acid (xNIF) in choline chloride- and menthol-containing DESs, with full numerical values in Table S1 (xMEF) and Table S2 (xNIF). Across all systems, xMEF spans 1.38 × 10⁻⁴ to 1.40 × 10⁻² and xNIF 2.38 × 10⁻⁴ to 2.11 × 10⁻², and menthol-based DESs generally afford higher solubility than their choline-chloride analogues for both compounds. The highest xMEF is observed for Men/TRG 1:3 (1.40 × 10⁻²), with Men/TEG also giving elevated values, while the highest xNIF appears for Men/GLY 1:1 (2.11 × 10⁻²) and remains high in Men/TRG 1:1–1:3. Within the choline chloride series, ChCl/DEG 1:1 provides the top xMEF (6.49 × 10⁻³), and ChCl/TRG 1:1 gives the top xNIF (1.47 × 10⁻²). Considering the hydrogen-bond donors (HBDs), TRG and TEG are associated with the largest solubilities in the menthol series, GLY is particularly favorable for xNIF at 1:1, and DEG stands out for xMEF in the choline chloride series; the effect of HBD fraction is system-specific; for example, xMEF increases from 3:1 to 1:3 in Men/TRG, xNIF maximizes at 1:1 in Men/GLY, and values decrease beyond 1:1 in ChCl/DEG (xMEF) and ChCl/TRG (xNIF).
2.2. Identifying an Optimal Predictive Model via the DOO-IT Framework
The DOO-IT (Dual-Objective Optimization with Iterative feature pruning) framework, aiming to find the most accurate and parsimonious machine learning model, was applied to an extended dataset of new solubility measurements and literature data for pharmaceutical acids in deep eutectic solvents. In total, N = 1020 points characterize the solubility of a variety of pharmaceutical acids in choline chloride and menthol-based deep eutectic solvents. The DOO-IT pipeline performs repeated dual-objective optimizations, minimizing at the same time MAE and model complexity. It combines an iterative backward feature pruning and candidate models selected based on the Pareto front are ranked by the corrected Akaike Information Criterion (AICc) to select solutions that balance fit and parsimony. This three-stage workflow allows for fully automated and unbiased selection of the optimal model, defined as both accurate and parsimonious. The repetition of the procedure with varying selection of the number and types of molecular descriptors allows for effective probing of the complex relationships between data and molecular descriptors. The result of so many trials of the protocol is provided in Figure 2. This is the central pillar of the model development, visualizing the outcome of the DOO-IT model selection workflow. The presentation of the AICc distribution as a function of the number of descriptors used for the model training enables direct quality model assessment. The red envelope curve, which traces the minimum AICc value achievable for a given number of descriptors, illustrates the fundamental trade-off between accuracy and simplicity inherent in QSPR modeling. A clear, non-linear trend is immediately apparent. The AICc values drop precipitously from a high baseline with 3-4 descriptors to a deep minimum at 6-7 descriptors. This initial decline signifies that each of these first few descriptors adds substantial explanatory power, capturing the primary physicochemical drivers of solubility and drastically improving the model's performance with minimal risk of overfitting. Beyond this point, the curve exhibits a more complex behavior, rising and then gradually descending to a second, even lower minimum. This pattern confirms that a simplistic feature selection approach is insufficient and a systematic, iterative pruning strategy is essential to navigate this rugged optimization landscape.
The most significant finding illustrated in Figure 2 is the existence of two distinct "basins of excellence," highlighted by the green boxes. This discovery directly refers to the "duality" in our article's title, emphasizing that not a single "best" model is presented, but a strategic choice between two high-performing, yet fundamentally different, modeling philosophies. The results of the AICc stability analysis reveal two distinct centers of excellent performance rather than a single minimum. One basin is centered around 6 descriptors (an ultra-parsimonious) and the other at 16 descriptors (the high-performance). The convex envelope of the best models shows that intermediate complexities are in many cases suboptimal or redundant for the present chemical space. This outcome indicates that distinct, scientifically meaningful descriptor combinations can achieve competitive performance via different mechanisms. Two separate models can therefore be regarded as the ones with optimal performance, depending on the intended task. A simple, general model (the 6-descriptor one) that captures the main drivers of solubility with high efficiency and a more complex, nuanced model (the 16-descriptor one) that adds subtle but important interaction terms to achieve the highest possible accuracy. This duality is a crucially important finding, once again proving the robustness and usefulness of the developed DOO-IT framework. It also highlights that the machine learning model space can be very complex and requires a thorough analysis to select the optimal model.
The first basin, located at 6 descriptors, represents the pinnacle of model parsimony, which has important implications. The descriptors forming this model likely represent the most fundamental and universal properties of the organic acid molecules that dictate their behavior in DES. Indeed, this particular model utilized the following descriptors: log(xAPICOSMO), EvdW,API, ΔHH1, ΔHH2, ΔHH4, and ΔHBA1. Hence, for the studied set of data, the dispersion contribution of API and relative hydrophobicity values are the most dominant contributions to the solubility. Also the relative value of acceptability at vicinal σ-potential regions is important. The second high-performance model utilizes 16 descriptors (log(xAPICOSMO), μAPI, Etot,API, EMisfit,API, EHB,API, EvdW,API, μDES, EMisfit,DES, ΔHBD1(12), ΔHBD4, ΔHH1, ΔHH2, ΔHH4, ΔHBA1, ΔHBA2, and ΔHBA4. This set of descriptors reveals the complex nature of solute-DES interactions under saturated conditions and the necessity of extension of the core features of the former model with additional polarity hydrogen bonding capacity of solute and solvent. Hence, the extended 16-descriptor solution integrates a broader set of energetic and interaction terms, capturing solvation phenomena with higher resolution.
It is imperative to contextualize these findings within a crucial methodological framework. The dataset exclusively comprises organic acids of pharmaceutical relevance, including well-known compounds such as ketoprofen, ibuprofen, ferulic acid, probenecid, caffeic acid, p-coumaric acid, syringic acid, and flufenamic acid. A significant and unresolved challenge in modeling such systems is the unknown dissociation state (pKa) of acidic solutes within the complex, non-aqueous environment of deep eutectic solvents (DES), which are rich in both hydrogen bond donors (HBD) and acceptors (HBA). Lacking a reliable method to determine the precise ionization state of each acid in every unique DES, we adopted a necessary and consistent simplification: all molecular descriptors were calculated for the neutral, non-dissociated forms of the molecules. Despite this crude simplification, the remarkable accuracy of the resulting models is particularly noteworthy. It strongly suggests that the fundamental physicochemical properties of the parent molecule are the dominant drivers of solubility and that our modeling framework is robust enough to capture these governing relationships despite the simplification of the solute's ionization state.
2.3. Performance of the Optimal Solubility Models
As indicated above, the stability analysis based on the AICc criterion revealed the existence of two “basins of excellence”, which means that two specific models were selected for a detailed inspection. The results of the Dual-Objective Optimization for the 6-descriptor model are presented in Figure 3, while the 16-descriptor model is described in detail in Figure 4. The plots highlight the inherent trade-off between accuracy and model complexity. The collection of non-dominated solutions forms a clear Pareto front (dark purple points), which represents the best accuracy attainable at any given level of complexity. Models lying to the right of this front (grey points) are inferior since a simpler and more accurate alternative exists. Coloring of the points along the Pareto front according to the nu hyperparameter reveals a consistent pattern: lower nu values yield simpler models with reduced SV ratios, whereas higher nu values give rise to more complex models characterized by larger SV ratios.
The Pareto analysis and 1-SE rule for the 6-descriptor set favored the chosen model (trial 1793) that slightly trades the very best MAE for substantially lower complexity. The trial 1790 model offers a slightly lower MAE value but is more complex when taking into account the support-vector ratio. The parity plot shows tight clustering around y=x for both training and held-out test points, indicating low bias and excellent generalization. This final 6-descriptor model demonstrates strong predictive performance on the held-out test set, achieving a coefficient of determination (R²) of 0.947, indicating that approximately 95% of the variance in the target variable is explained by the model. The mean absolute error (MAE) of 0.0746 and root mean squared error (RMSE) of 1.831 reflect reasonable average prediction errors. However, there is a small but noticeable gap between MAE and RMSE, suggesting that there are some outliers or systematic deviations. The mean absolute percentage error (MAPE) of 7.46% further corroborates the model’s high relative accuracy. Residual analysis reveals negligible bias (mean residual = 1.642) and a standard deviation (0.811) consistent with the RMSE, supporting the assumption of homoscedastic and unbiased errors. Collectively, these metrics indicate a robust, acceptable calibrated model with promising generalization capability.
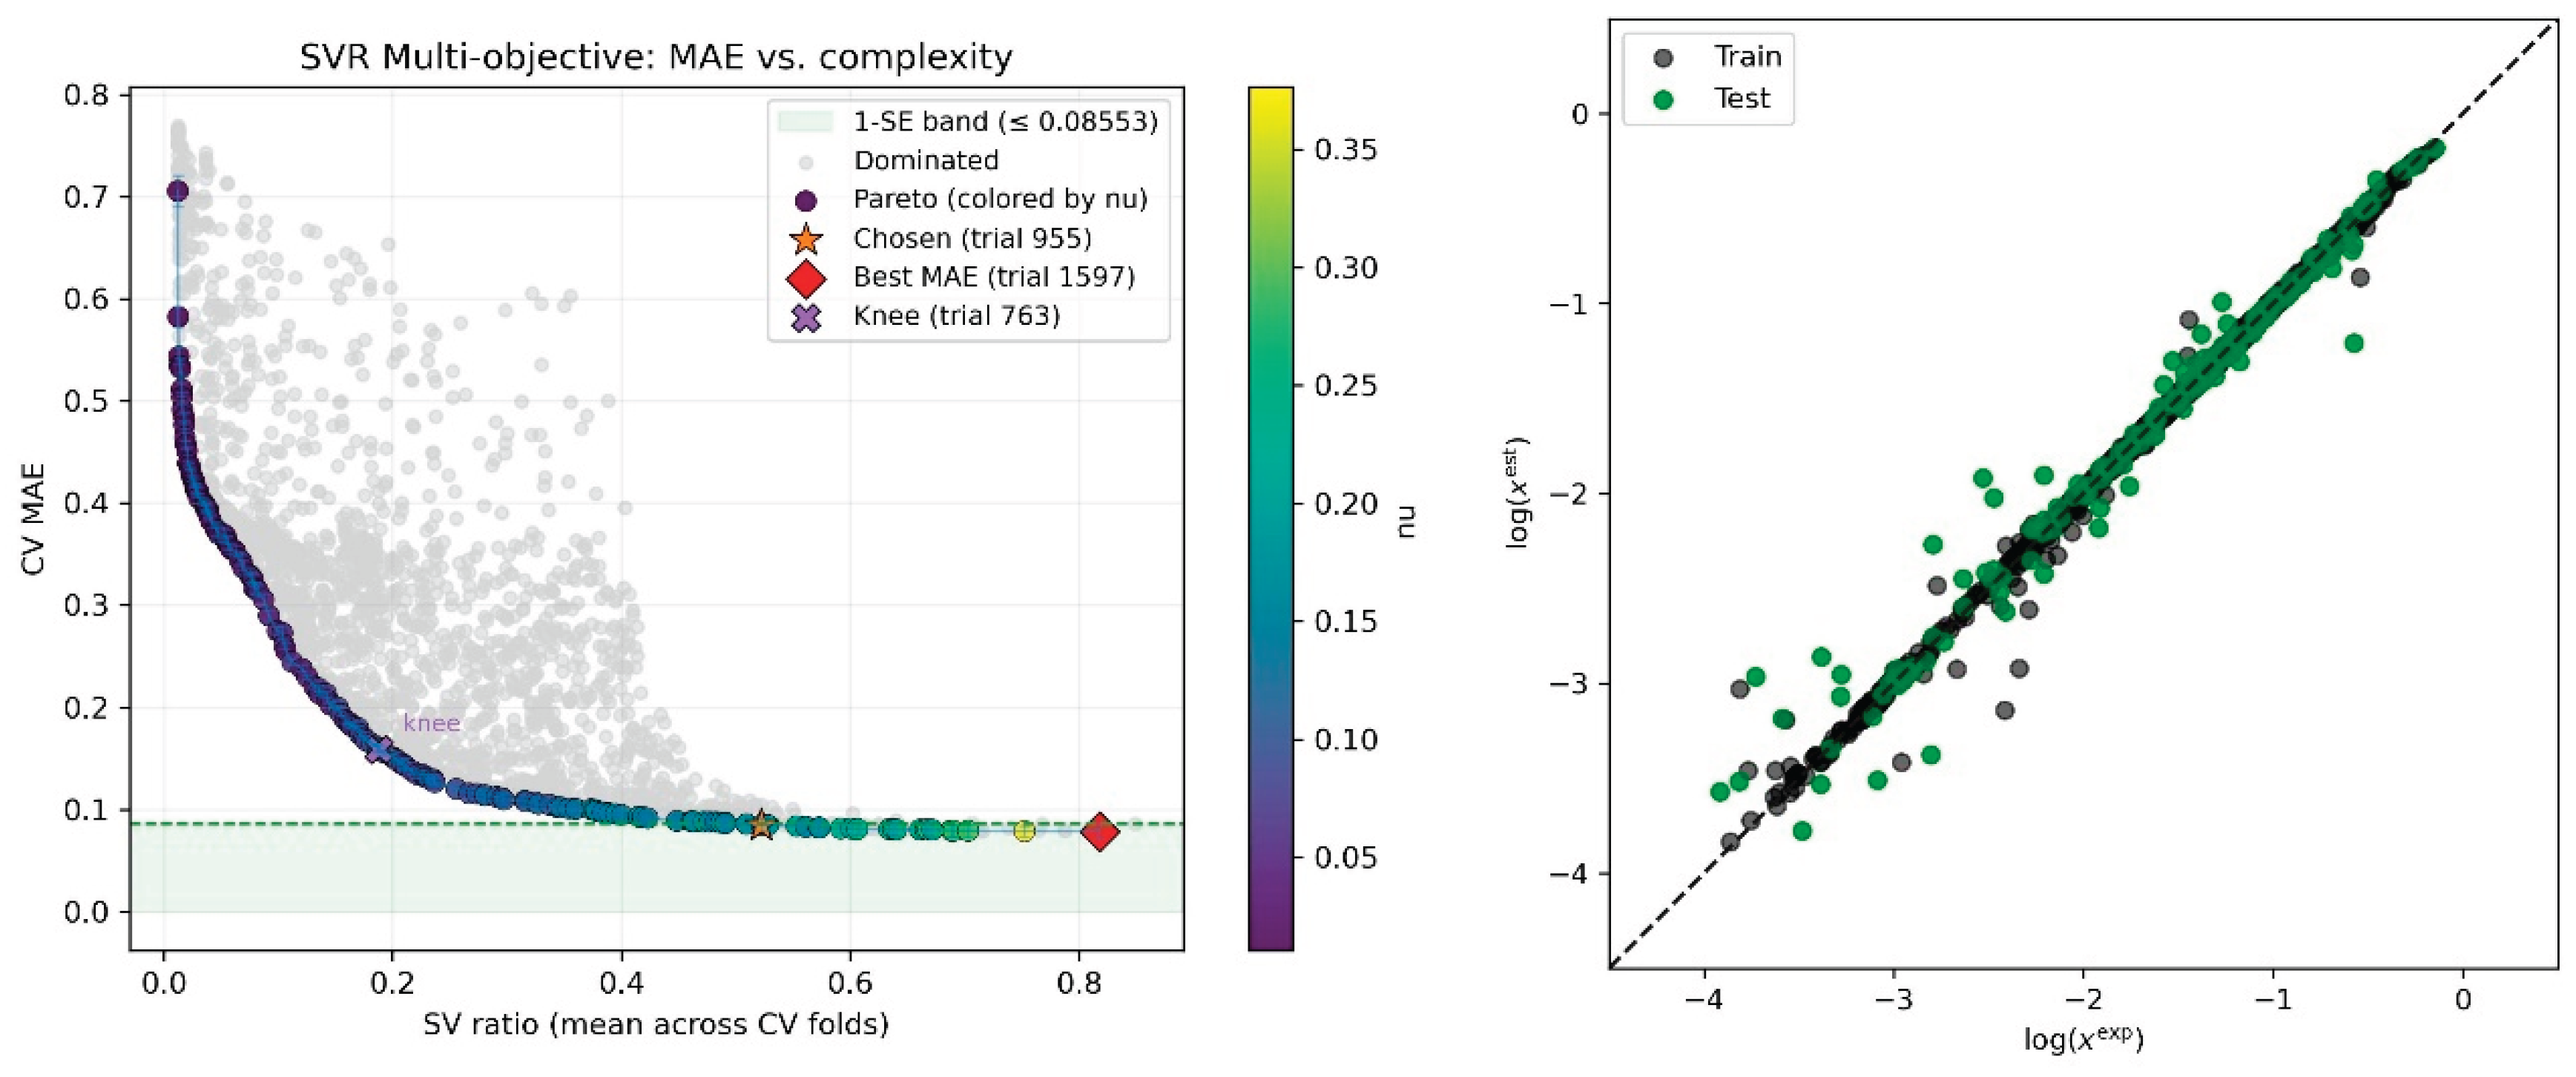
In the case of the high-performance 16-descriptor solution, trial 955 was selected over trial 1597, being much less complex with only a minimal drop in the MAE value. The parity for this model is on an excellent level and the scatter is minimal, as evidenced in the right panel of Figure 3. The model significantly extends the descriptor set compared to the ultra-parsimonious 6-descriptor one and consequently provides a more complete description of the balance between solute–solvent and solvent–solvent interactions. The finalized model built on 16 descriptors shows strong performance on the holdout test set, with R² = 0.970, meaning it explains about 97% of the variance in the target. Error magnitudes are modest (MAE = 0.047; RMSE = 1.795), and the noticeable gap between RMSE and MAE suggests occasional outliers or mild systematic deviations. A MAPE of 4.67% further supports the model’s high relative accuracy. Residuals indicate limited bias (mean = 1.611) and variability (SD = 0.793) consistent with the RMSE, aligning with the assumption of homoscedastic, essentially unbiased errors. Collectively, these results point to a well-calibrated, robust model with promising generalization potential, although it is much more complex compared to an ultra-parsimonious one.
3. Materials and Methods
3.1. Materials
Mefenamic acid and niflumic acid (both ≥97%, Sigma-Aldrich, St. Louis, MO, USA) were used as received. The hydrogen-bond acceptors were choline chloride (ChCl, CAS 67-48-1, ≥99%) and menthol (Men, CAS 89-78-1, ≥98.5%), and the hydrogen-bond donors comprised ethylene glycol (ETG, CAS 107-21-1), diethylene glycol (DEG, CAS 111-46-6), triethylene glycol (TEG, CAS 112-27-6), tetraethylene glycol (TRG, CAS 112-60-7), glycerol (GLY, CAS 56-81-5), 1,2-propanediol (P2D, CAS 57-55-6), and 1,3-butanediol (B3D, CAS 107-88-0); all polyols/polyethers were obtained from Sigma-Aldrich with stated purity ≥99%. Methanol (analytical grade, CAS 67-56-1; Chempur, Piekary Śląskie, Poland) was used for sample handling where applicable. Unless otherwise specified, all chemicals were employed without additional purification.
3.2. Solubility Measurements Procedure
A similar methodology to [70] was employed, adapted here for mefenamic acid (MEF) and niflumic acid (NIF). Each DES was prepared at the target molar ratio by gentle heating with stirring until a clear single phase formed, then equilibrated to 25 °C. Pre-equilibrated aliquots were spiked with an excess of MEF or NIF, sealed, and agitated isothermally for 24 h at approximately 60 rpm. After equilibration, suspensions were maintained at 25 °C, supernatants were withdrawn, filtered through 0.22 μm PTFE syringe filters, and analyzed by UV–Vis. Spectra were collected from 200 to 500 nm in quartz cuvettes; analytical wavelengths were set at the absorption maxima (λMEFmax = 351 nm; λNIFmax = 344 nm). Concentrations obtained from UV–Vis were converted to mole-fraction solubilities (xMEF or xNIF) using molar masses and the density of each saturated solution; densities were determined gravimetrically at 25 °C. All measurements were performed in triplicate.
Calibration curves were established for each compound using methanolic stock solutions and serial dilutions. For MEF: calibration range 0.002 to 0.078 mg mL-1, slope 28.265, intercept -0.010, linearity R2 = 0.9993, LOD = 0.00261 mg mL-1, LOQ = 0.00790 mg mL-1. For NIF: calibration range 0.005 to 0.090 mg mL−1, slope 18.808, intercept -0.006, linearity R2 = 0.9994, LOD = 0.00272 mg mL-1, LOQ = 0.00825 mg mL-1.
3.3. COSMO-RS Computations
Application of the COSMO-RS framework [71,72,73,74,75] requires appropriate representation of molecular diversity. This is done by performing the conformational analysis prior to the determination of any thermodynamic properties. For this purpose, the default protocol was applied, taking advantage of the COSMOconf (version 2023, BIOVIA COSMOlogic) / TURBOMOLE (version 7.7, 2023, TURBOMOLE GmbH) tandem for the generation of the most representative structures for all solutes and solvent molecules. The applied protocol is consistent with previously published schemes [76,77,78]. For each molecule, up to ten low-energy conformations were determined for both gas and condensed phases, the latter accounting for solvent effects under the conductor-like screening model. The resulting "cosmo" and "energy" files were generated using the BP_TZVPD_FINE_24.ctd parameter set, essential for thermodynamic calculations in COSMOtherm, which requires application of the RI-BP/TZVP//TZVPD-FINE level of theory.
3.4. Molecular Descriptors
Two distinct sets of molecular descriptors were generated using the COSMO-RS theory. The first set of descriptors comprised interaction energies from solubility calculations [79,80,81]. While the standard iterative solubility protocol is typically sufficient, it frequently yields erroneous predictions of complete miscibility for highly soluble solutes in DES systems [87,88,89,90]. For these cases, complete solid-liquid equilibrium (SLE) calculations were mandated. Requisite thermodynamic fusion data for the solid solutes, including melting temperature, Tm, and enthalpy of fusion, ΔHfus, were obtained by averaging available literature values [91]. The heat capacity of fusion was approximated as constant, ΔCp,fus≈ΔSfus≈ΔHfus/Tm. The resulting Gibbs free energy of fusion values, ΔGfus=ΔHfus-TΔSfus, utilized in the calculations are provided in the Supplementary Materials. The COSMO-RS output files yielded five primary descriptors for each solute: total intermolecular interaction energy, Eint,API, its constituent electrostatic misfit, Emisfit,API, hydrogen bonding, EHB,API, and van der Waals, EvdW,API, contributions, as well as the chemical potential and μAPI. Analogous descriptors for the DES solvent (Eint,DES, Emisfit,DES, EHB,DES, EvdW,DES, and μDES, were calculated as the sum of the individual DES components, weighted by their respective molar fractions in the solute-free mixture. Relative descriptors, defined as the difference between the solute and DES values, were also included. Additionally, the computed solubility values from COSMO-RS were similarly included, log(xAPICOSMO).
Apart from this, the final set of molecular descriptors was augmented with values derived from σ-potential distributions. The standard COSMO-RS output consists of 61 data points covering the charge density range of -0.03e/Å2÷+0.03e/Å2. Consistent with prior machine learning applications, this data was reduced by averaging values over 0.005 intervals. This process resulted in a 12-step function defining three characteristic regions of the σ-potential: hydrogen bond donor (HBD1÷4, -0.03e/Å2 to -0.01 e/Å2), hydrophobicity, (HH1÷4, from -0.01e/Å2 to +0.01 e/Å2), and acceptability (Hydrogen Bond Acceptor, HBA1÷4, from +0.01e/Å2 to +0.03 e/Å2). Consequently, four descriptors were generated for each region, leading to 24 descriptors of this type for the solute, the solvent, and the relative difference between them.
3.5. Dataset
The values of molecular descriptors were computed for all components of studied systems, including pharmaceutical acids and DES constituents. The set of solutes included compounds for which new solubility measurements were included in this paper, namely mefenamic acid and niflumic acid. In addition, the values of already published solubility data of ketoprofen, ibuprofen, ferulic acid, probenecid, caffeic acid, p-coumaric acid, syringic acid, and flufenamic acid in DES were included. In total, the dataset comprised N=1020 mole fractions at saturated conditions in choline chloride, betaine, and menthol-based DES with variety of proportions of different HBA counterparts. Both dry and water-diluted systems were included if available. All data, including solubility values, fusion data, computed solubility, and all molecular descriptors, are available in the Supplementary Materials.
3.6. Machine Learning Protocol
3.6.1. Core Algorithm and Data Preprocessing
The machine learning workflow was centered on the nu-Support Vector Regression (nuSVR) algorithm [92], chosen for its demonstrated ability to effectively model complex, non-linear relationships often present in QSPR studies [93,94,95]. To handle these non-linearities, the Radial Basis Function (RBF) kernel was selected. The RBF kernel is a powerful and flexible choice, capable of mapping features into an infinite-dimensional space, which allows it to model intricate decision boundaries while requiring the tuning of only a single parameter, gamma. The optimization of the nuSVR hyperparameters was conducted as follows: the regularization parameter C and the nu parameter were directly optimized. The kernel coefficient gamma, which dictates the influence of each support vector, was optimized via a guided, data-driven strategy. For each optimization cycle, a baseline gamma_base value was heuristically determined from the median pairwise squared Euclidean distance of the training data subset [96,97]. The optimizer then refined this anchor by searching for an optimal logarithmic scaling factor. This approach focuses the search on a physically relevant scale, enhancing optimization efficiency. Prior to model training, two standard preprocessing steps were performed. First, the full dataset (N=1020) was partitioned into a training set (80%) and a held-out test set (20%) using a fixed random seed to ensure reproducibility. Second, all molecular descriptors in the training set were standardized by removing the mean and scaling to unit variance using the StandardScaler from scikit-learn [98,99]. As SVR algorithms are sensitive to feature scaling, this step ensures that no single descriptor disproportionately influences the model due to its magnitude. The same scaling transformation was subsequently applied to the test set.
3.6.2. Dual-Objective Optimization Protocol
To explicitly manage the inherent trade-off between model accuracy and simplicity, a dual-objective optimization (DOO) strategy was implemented using the Optuna framework (v. 3.2) [100,101,102]. The TPE sampler within Optuna was configured to simultaneously minimize two competing objectives, which were evaluated using a 5-fold cross-validation scheme on the training data. The first objective was predictive accuracy, quantified by the Mean Absolute Error (MAE). The second objective was model complexity, quantified by the mean support vector (SV) ratio. The SV ratio is calculated for each fold as the number of support vectors divided by the number of training samples in that fold, providing an intrinsic measure of complexity for nuSVR models. A model with a lower SV ratio is considered more parsimonious.
Hence, the outcome of a dual-objective optimization is a set of solutions forming a Pareto front. This front consists exclusively of non-dominated solutions. A solution is considered non-dominated if no other solution exists that is superior in one objective without being inferior in the other. In other words, to improve a non-dominated solution with respect to one objective, a trade-off in the form of a degradation in the other objective must be accepted. Conversely, a dominated solution is one for which at least one other solution exists that offers better performance in one objective while being no worse in the other, making it an objectively suboptimal choice.
3.6.3. Iterative Model Refinement and Candidate Selection
The framework employs an iterative backward pruning methodology to integrate feature selection directly into the optimization process. This automatic procedure relies, therefore, on both Dual-Objective Optimization and Iterative features pruning (DOO-IT). The procedure begins with the complete descriptor set. A full DOO is executed, producing a Pareto front of non-dominated models. From this front, a single candidate model for the current iteration is selected, governed by the 1-Standard Error (1-SE) rule [103,104]. This involves identifying the most accurate model on the front and defining a performance threshold based on its standard error; the simplest model (lowest SV ratio) within this threshold is then chosen. Once a candidate is selected, its features are ranked based on permutation importance with 10 repeats [105]. The least impactful descriptor is then eliminated, and the procedure repeats with a new, full DOO on the reduced feature set. This cycle continues until a specified minimum number of features is reached, generating a series of robust, parsimonious candidate models at each level of complexity.
3.6.4. Final Model Selection via Information Criterion
To objectively select the single best model from the family of candidates generated by the iterative procedure, an information-theoretic criterion was used: the corrected Akaike Information Criterion (AICc) [106,107,108,109]. AICc provides a principled method for model selection by balancing goodness-of-fit against model complexity, thereby penalizing overfitting. As nuSVR is a non-probabilistic model lacking an explicit likelihood function, a pseudo-AICc formulation was adopted, a common practice for algorithm-based models. This approach approximates the log-likelihood term by assuming Gaussian residuals and estimates it from the model's Residual Sum of Squares (RSS). The critical component in this calculation is the effective number of parameters, k. For nuSVR, k was estimated as the number of support vectors plus two additional terms representing the model's bias (intercept) and the estimated error variance. This pseudo-AICc formulation enabled a principled, quantitative comparison between models of varying complexity. The candidate model exhibiting the minimum pseudo-AICc value across all runs and iterations was chosen as the final, most justified solution for subsequent analysis.
The DOO-IT framework was implemented as a fully automated pipeline using Python 3.10 [110] with the scikit-learn [111], Optuna [102], and pandas [112] libraries. To rigorously assess solution stability, the entire procedure was repeated fifteen independent times. Each dual-objective optimization within this process was configured to run for 2000 trials, ensuring a comprehensive exploration of the solution space.
4. Conclusions
The study addresses the challenge of solubility prediction, a problem of central importance in pharmaceutical and green chemistry research. Accurate predictive models therefore provide a powerful tool to reduce experimental workload, accelerate drug development pipelines, and enable the rational design of novel solvent systems such as DESs that combine efficiency with environmental compatibility. The Dual-Objective Optimization with Iterative feature pruning (DOO-IT) framework was applied for this task.
The study demonstrated that stability analysis of the DOO-IT framework uncovered not a single global optimum but two distinct regions of predictive excellence for modeling solubility of pharmaceutical acids in deep eutectic solvents. On one side of the solution landscape lies an ultra-parsimonious six-descriptor model that combines high predictive performance with minimal computational cost. Importantly, this model does not rely on COSMO-RS solubility input, instead exploiting physically meaningful descriptors that capture key thermodynamic drivers such as solvent–solute chemical potential differences, hydrogen-bonding characteristics, and van der Waals interactions. As a result, it provides a reliable and interpretable tool for rapid prescreening of candidate systems, especially in contexts where extensive quantum-chemical calculations or fusion data are unavailable. At the other extreme, a sixteen-descriptor model emerges as the configuration with the lowest corrected Akaike Information Criterion and the highest overall predictive accuracy. This model integrates COSMO-RS logarithmic solubility as an anchor descriptor, which enables it to correct systematic deviations at solubility extremes and deliver near-perfect agreement with experimental values. Although more resource-intensive, this solution is particularly valuable for applications where the highest quantitative fidelity is required, such as in fine-tuning formulation parameters or guiding late-stage development decisions.
By revealing these two complementary “basins of excellence,” our analysis highlights the versatility of the DOO-IT framework in identifying multiple, scientifically meaningful optima that balance accuracy, parsimony, and interpretability. The findings also extend our previous works, where a single model was sufficient to describe a narrower chemical space. In the present, more diverse dataset, the appearance of dual optimal regimes underscores the importance of tailoring model complexity to the scope of the prediction task. Taken together, these results suggest a pragmatic two-tiered strategy for future studies of solubility in deep eutectic solvents and related systems. Initial high-throughput screening can be effectively performed with the COSMO-RS-free parsimonious model, while subsequent high-precision evaluation of promising candidates can benefit from the expanded descriptor set that incorporates COSMO-RS calculations. This workflow balances efficiency with accuracy, making it possible to explore broader chemical spaces without sacrificing predictive reliability. Looking forward, validating the transferability of both models to other classes of solvents, as well as developing ensemble or adaptive strategies that dynamically combine parsimonious and high-performance regimes, will further enhance the applicability of this approach in green chemistry and pharmaceutical design.
Supplementary Materials
The following supporting information can be downloaded at the website of this paper posted on Preprints.org.
Author Contributions
Conceptualization, P.C.; methodology, P.C., T.J., and M.P.; software, P.C.; validation, P.C., T.J. and M.P.; formal analysis, P.C., T.J., J.G., A.K., and M.P.; investigation, P.C, T.J., J.G., A.K., and M.P.; resources, P.C, T.J., and M.P.; data curation, P.C., T.J., M.P.; writing—original draft preparation, P.C., T.J. and M.P.; writing—review and editing, P.C., T.J. and M.P.; visualization, P.C., T.J. and M.P.; supervision, P.C.; project administration, P.C. All authors have read and agreed to the published version of the manuscript.
Funding
This research received no external funding.
Institutional Review Board Statement
Not applicable.
Informed Consent Statement
Not applicable.
Data Availability Statement
The original contributions presented in this study are included in the article/supplementary material. Further inquiries can be directed to the corresponding author.
Conflicts of Interest
The authors declare no conflicts of interest.
References
- Lamberth, C.; Dinges, J. Different Roles of Carboxylic Functions in Pharmaceuticals and Agrochemicals. Bioact. Carboxylic Compd. Classes Pharm. Agrochem. 2016, 1–11. [Google Scholar]
- Bharate, S.S. Carboxylic Acid Counterions in FDA-Approved Pharmaceutical Salts. Pharm. Res. 2021, 38, 1307–1326. [Google Scholar] [CrossRef]
- Bagby, M.O.; Johnson, R.W.; Daniels, R.W.; Contrell, R.R.; Sauer, E.T.; Keenan, M.J.; Krevalis, M.A.; Staff, U.B. Carboxylic Acids. Kirk-Othmer Encycl. Chem. Technol. 2003. [Google Scholar]
- Ballatore, C.; Huryn, D.M.; Smith, A.B. Carboxylic Acid (Bio)Isosteres in Drug Design. ChemMedChem 2013, 8, 385. [Google Scholar] [CrossRef] [PubMed]
- Kumar, N.; Goel, N. Phenolic acids: Natural versatile molecules with promising therapeutic applications. Biotechnol. Reports 2019, 24, e00370. [Google Scholar] [CrossRef]
- Arfeen, M.; Srivastava, A.; Srivastava, N.; Khan, R.A.; Almahmoud, S.A.; Mohammed, H.A. Design, classification, and adverse effects of NSAIDs: A review on recent advancements. Bioorg. Med. Chem. 2024, 112, 117899. [Google Scholar] [CrossRef]
- Panchal, N.K.; Prince Sabina, E. Non-steroidal anti-inflammatory drugs (NSAIDs): A current insight into its molecular mechanism eliciting organ toxicities. Food Chem. Toxicol. 2023, 172, 113598. [Google Scholar] [CrossRef]
- Cimolai, N. The potential and promise of mefenamic acid. Expert Rev. Clin. Pharmacol. 2013, 6, 289–305. [Google Scholar] [CrossRef]
- Mustafa, H.; Daud, S.; Sheraz, S.; Bibi, M.; Ahmad, T.; Sardar, A.; Fazal, T.; Khan, A.; Abid, O. ur R. The Chemistry and Bioactivity of Mefenamic Acid Derivatives: A Review of Recent Advances. Arch. Pharm. (Weinheim). 2025, 358, e70004. [Google Scholar] [CrossRef]
- Jahromi, B.N.; Tartifizadeh, A.; Khabnadideh, S. Comparison of fennel and mefenamic acid for the treatment of primary dysmenorrhea. Int. J. Gynecol. Obstet. 2003, 80, 153–157. [Google Scholar] [CrossRef]
- Balderas, E.; Ateaga-Tlecuitl, R.; Rivera, M.; Gomora, J.C.; Darszon, A. Niflumic acid blocks native and recombinant T-type channels. J. Cell. Physiol. 2012, 227, 2542–2555. [Google Scholar] [CrossRef]
- Nakano, T.; Inoue, H.; Fukuyama, S.; Matsumoto, K.; Matsumura, M.; Tsuda, M.; Matsumoto, T.; Aizawa, H.; Nakanishi, Y. Niflumic Acid Suppresses Interleukin-13–induced Asthma Phenotypes. 2012; 173, 1216–1221. [Google Scholar] [CrossRef]
- Abdelbari, M.A.; El-Gazar, A.A.; Abdelbary, A.A.; Elshafeey, A.H.; Mosallam, S. Investigating the potential of novasomes in improving the trans-tympanic delivery of niflumic acid for effective treatment of acute otitis media. J. Drug Deliv. Sci. Technol. 2024, 98, 105912. [Google Scholar] [CrossRef]
- Adam, A.; Schrimpl, L.; Schmidt, P.C. Some Physicochemical Properties of Mefenamic Acid. Drug Dev. Ind. Pharm. 2000, 26, 477–487. [Google Scholar] [CrossRef]
- Takács-Novák, K.; Szoke, V.; Völgyi, G.; Horváth, P.; Ambrus, R.; Szabó-Révész, P. Biorelevant solubility of poorly soluble drugs: Rivaroxaban, furosemide, papaverine and niflumic acid. J. Pharm. Biomed. Anal. 2013, 83, 279–285. [Google Scholar] [CrossRef]
- Ullah, I.; Baloch, M.K.; Ullah, I.; Mustaqeem, M. Enhancement in aqueous solubility of Mefenamic acid using micellar solutions of various surfactants. J. Solution Chem. 2014, 43, 1360–1373. [Google Scholar] [CrossRef]
- Guinamard, R.; Simard, C.; Del Negro, C. Flufenamic acid as an ion channel modulator. Pharmacol. Ther. 2013, 138, 272. [Google Scholar] [CrossRef] [PubMed]
- Madhavan, M.; Hwang, G.C.C. Design and evaluation of transdermal flufenamic acid delivery system. Drug Dev. Ind. Pharm. 1992, 18, 617–626. [Google Scholar] [CrossRef]
- Chi, Y.; Li, K.; Yan, Q.; Koizumi, S.; Shi, L.; Takahashi, S.; Zhu, Y.; Matsue, H.; Takeda, M.; Kitamura, M.; et al. Nonsteroidal Anti-Inflammatory Drug Flufenamic Acid Is a Potent Activator of AMP-Activated Protein Kinase. J. Pharmacol. Exp. Ther. 2011, 339, 257–266. [Google Scholar] [CrossRef]
- Moses, V.S.; Bertone, A.L. Nonsteroidal anti-inflammatory drugs. Vet. Clin. North Am. - Equine Pract. 2002, 18, 21–37. [Google Scholar] [CrossRef]
- Vane, J.R.; Botting, R.M. Mechanism of Action of Nonsteroidal Anti-inflammatory Drugs. Am. J. Med. 1998, 104, 2S–8S. [Google Scholar] [CrossRef]
- Ghanim, A.M.; Girgis, A.S.; Kariuki, B.M.; Samir, N.; Said, M.F.; Abdelnaser, A.; Nasr, S.; Bekheit, M.S.; Abdelhameed, M.F.; Almalki, A.J.; et al. Design and synthesis of ibuprofen-quinoline conjugates as potential anti-inflammatory and analgesic drug candidates. Bioorg. Chem. 2022, 119, 105557. [Google Scholar] [CrossRef] [PubMed]
- Maleškić Kapo, S.; Rakanović-Todić, M.; Burnazović-Ristić, L.; Kusturica, J.; Kulo Ćesić, A.; Ademović, E.; Loga-Zec, S.; Sarač-Hadžihalilović, A.; Aganović-Mušinović, I. Analgesic and anti-inflammatory effects of diclofenac and ketoprofen patches in two different rat models of acute inflammation. J. King Saud Univ. - Sci. 2023, 35, 102394. [Google Scholar] [CrossRef]
- Wang, Y.; Han, Q.; Zhang, H.; Yan, Y. Evaluation of the binding interactions of p-acetylaminophenol, aspirin, ibuprofen and aminopyrine with norfloxacin from the view of antipyretic and anti-inflammatory. J. Mol. Liq. 2020, 312, 113397. [Google Scholar] [CrossRef]
- García-Rodríguez, C.; Mujica, P.; Illanes-González, J.; López, A.; Vargas, C.; Sáez, J.C.; González-Jamett, A.; Ardiles, Á.O. Probenecid, an Old Drug with Potential New Uses for Central Nervous System Disorders and Neuroinflammation. Biomed. 2023, 11, 1516. [Google Scholar] [CrossRef]
- Robbins, N.; Koch, S.E.; Tranter, M.; Rubinstein, J. The history and future of probenecid. Cardiovasc. Toxicol. 2012, 12, 1–9. [Google Scholar] [CrossRef]
- Robbins, R.J. Phenolic acids in foods: An overview of analytical methodology. J. Agric. Food Chem. 2003, 51, 2866–2887. [Google Scholar] [CrossRef]
- Al Jitan, S.; Alkhoori, S.A.; Yousef, L.F. Phenolic Acids From Plants: Extraction and Application to Human Health. Stud. Nat. Prod. Chem. 2018, 58, 389–417. [Google Scholar]
- Dong, X.; Huang, R. Ferulic acid: An extraordinarily neuroprotective phenolic acid with anti-depressive properties. Phytomedicine 2022, 105, 154355. [Google Scholar] [CrossRef]
- Ali, S.A.; Saifi, M.A.; Pulivendala, G.; Godugu, C.; Talla, V. Ferulic acid ameliorates the progression of pulmonary fibrosis via inhibition of TGF-β/smad signalling. Food Chem. Toxicol. 2021, 149, 111980. [Google Scholar] [CrossRef]
- Sroka, Z.; Cisowski, W. Hydrogen peroxide scavenging, antioxidant and anti-radical activity of some phenolic acids. Food Chem. Toxicol. 2003, 41, 753–758. [Google Scholar] [CrossRef]
- Khan, F.A.; Maalik, A.; Murtaza, G. Inhibitory mechanism against oxidative stress of caffeic acid. J. Food Drug Anal. 2016, 24, 695–702. [Google Scholar] [CrossRef]
- Cizmarova, B.; Hubkova, B.; Bolerazska, B.; Marekova, M.; Birkova, A. Caffeic acid: a brief overview of its presence, metabolism, and bioactivity. Bioact. Compd. Heal. Dis. - Online ISSN 2574-0334; Print ISSN 2769-2426 2020, 3, 74–81. [Google Scholar]
- Srinivasulu, C.; Ramgopal, M.; Ramanjaneyulu, G.; Anuradha, C.M.; Suresh Kumar, C. Syringic acid (SA) ‒ A Review of Its Occurrence, Biosynthesis, Pharmacological and Industrial Importance. Biomed. Pharmacother. 2018, 108, 547–557. [Google Scholar] [CrossRef] [PubMed]
- Ogut, E.; Armagan, K.; Gül, Z. The role of syringic acid as a neuroprotective agent for neurodegenerative disorders and future expectations. Metab. Brain Dis. 2022, 37, 859–880. [Google Scholar] [CrossRef]
- Shimsa, S.; Mondal, S.; Mini, S. Syringic acid: A promising phenolic phytochemical with extensive therapeutic applications. R&D Funct. Food Prod. 2024, 1, 1–14. [Google Scholar]
- Boz, H. p-Coumaric acid in cereals: presence, antioxidant and antimicrobial effects. Int. J. Food Sci. Technol. 2015, 50, 2323–2328. [Google Scholar] [CrossRef]
- Pei, K.; Ou, J.; Huang, J.; Ou, S. p-Coumaric acid and its conjugates: dietary sources, pharmacokinetic properties and biological activities. J. Sci. Food Agric. 2016, 96, 2952–2962. [Google Scholar] [CrossRef]
- Savjani, K.T.; Gajjar, A.K.; Savjani, J.K. Drug solubility: importance and enhancement techniques. ISRN Pharm. 2012, 2012, 195727. [Google Scholar] [CrossRef]
- Martínez, F.; Jouyban, A.; Acree, W.E. Pharmaceuticals solubility is still nowadays widely studied everywhere. Pharm. Sci. 2017, 23, 1–2. [Google Scholar] [CrossRef]
- Jain, S.; Patel, N.; Lin, S. Solubility and dissolution enhancement strategies: current understanding and recent trends. Drug Dev. Ind. Pharm. 2015, 41, 875–887. [Google Scholar] [CrossRef]
- Rashid, M.; Malik, M.Y.; Singh, S.K.; Chaturvedi, S.; Gayen, J.R.; Wahajuddin, M. Bioavailability Enhancement of Poorly Soluble Drugs: The Holy Grail in Pharma Industry. Curr. Pharm. Des. 2019, 25, 987–1020. [Google Scholar] [CrossRef]
- Bhattachar, S.N.; Deschenes, L.A.; Wesley, J.A. Solubility: it’s not just for physical chemists. Drug Discov. Today 2006, 11, 1012–1018. [Google Scholar] [CrossRef]
- Coltescu, A.R.; Butnariu, M.; Sarac, I. The importance of solubility for new drug molecules. Biomed. Pharmacol. J. 2020, 13, 577–583. [Google Scholar] [CrossRef]
- Chaturvedi, K.; Shah, H.S.; Nahar, K.; Dave, R.; Morris, K.R. Contribution of Crystal Lattice Energy on the Dissolution Behavior of Eutectic Solid Dispersions. ACS Omega 2020, 5, 9690–9701. [Google Scholar] [CrossRef] [PubMed]
- Censi, R.; Di Martino, P. Polymorph Impact on the Bioavailability and Stability of Poorly Soluble Drugs. Molecules 2015, 20, 18759–18776. [Google Scholar] [CrossRef]
- Chmiel, K.; Knapik-Kowalczuk, J.; Paluch, M. How does the high pressure affects the solubility of the drug within the polymer matrix in solid dispersion systems. Eur. J. Pharm. Biopharm. 2019, 143, 8–17. [Google Scholar] [CrossRef]
- Singh, D.; Bedi, N.; Tiwary, A.K. Enhancing solubility of poorly aqueous soluble drugs: critical appraisal of techniques. J. Pharm. Investig. 2018, 48, 509–526. [Google Scholar] [CrossRef]
- Mahesha, B.S.; Sheeba, F.R.; Deepak, H.K. A comprehensive review of green approaches to drug solubility enhancement. Drug Dev. Ind. Pharm. 2025, 51, 659–669. [Google Scholar] [CrossRef]
- Smith, E.L.; Abbott, A.P.; Ryder, K.S. Deep Eutectic Solvents (DESs) and Their Applications. Chem. Rev. 2014, 114, 11060–11082. [Google Scholar] [CrossRef]
- Hansen, B.B.; Spittle, S.; Chen, B.; Poe, D.; Zhang, Y.; Klein, J.M.; Horton, A.; Adhikari, L.; Zelovich, T.; Doherty, B.W.; et al. Deep Eutectic Solvents: A Review of Fundamentals and Applications. Chem. Rev. 2021, 121, 1232–1285. [Google Scholar] [CrossRef]
- El Achkar, T.; Greige-Gerges, H.; Fourmentin, S. Basics and properties of deep eutectic solvents: a review. Environ. Chem. Lett. 2021, 19, 3397–3408. [Google Scholar] [CrossRef]
- Paiva, A.; Craveiro, R.; Aroso, I.; Martins, M.; Reis, R.L.; Duarte, A.R.C. Natural Deep Eutectic Solvents – Solvents for the 21st Century. ACS Sustain. Chem. Eng. 2014, 2, 1063–1071. [Google Scholar] [CrossRef]
- Liu, Y.; Friesen, J.B.; McAlpine, J.B.; Lankin, D.C.; Chen, S.N.; Pauli, G.F. Natural Deep Eutectic Solvents: Properties, Applications, and Perspectives. J. Nat. Prod. 2018, 81, 679–690. [Google Scholar] [CrossRef]
- Omar, K.A.; Sadeghi, R. Physicochemical properties of deep eutectic solvents: A review. J. Mol. Liq. 2022, 360, 119524. [Google Scholar] [CrossRef]
- Emami, S.; Shayanfar, A. Deep eutectic solvents for pharmaceutical formulation and drug delivery applications. Pharm. Dev. Technol. 2020, 25, 779–796. [Google Scholar] [CrossRef]
- Shah, P.A.; Chavda, V.; Hirpara, D.; Sharma, V.S.; Shrivastav, P.S.; Kumar, S. Exploring the potential of deep eutectic solvents in pharmaceuticals: Challenges and opportunities. J. Mol. Liq. 2023, 390, 123171. [Google Scholar] [CrossRef]
- Kalantri, S.; Vora, A. Eutectic solutions for healing: a comprehensive review on therapeutic deep eutectic solvents (TheDES). Drug Dev. Ind. Pharm. 2024, 50, 387–400. [Google Scholar] [CrossRef]
- Abdelquader, M.M.; Li, S.; Andrews, G.P.; Jones, D.S. Therapeutic deep eutectic solvents: A comprehensive review of their thermodynamics, microstructure and drug delivery applications. Eur. J. Pharm. Biopharm. 2023, 186, 85–104. [Google Scholar] [CrossRef]
- Raevsky, O.A.; Grigorev, V.Y.; Polianczyk, D.E.; Raevskaja, O.E.; Dearden, J.C. Aqueous Drug Solubility: What Do We Measure, Calculate and QSPR Predict? Mini-Reviews Med. Chem. 2019, 19, 362–372. [Google Scholar] [CrossRef]
- Fowles, D.J.; Connaughton, B.J.; Carter, J.W.; Mitchell, J.B.O.; Palmer, D.S. Physics-Based Solubility Prediction for Organic Molecules. Chem. Rev. 2025. [Google Scholar] [CrossRef]
- Boobier, S.; Hose, D.R.J.; Blacker, A.J.; Nguyen, B.N. Machine learning with physicochemical relationships: solubility prediction in organic solvents and water. Nat. Commun. 2020 111 2020, 11, 1–10. [Google Scholar] [CrossRef]
- Ghanavati, M.A.; Ahmadi, S.; Rohani, S. A machine learning approach for the prediction of aqueous solubility of pharmaceuticals: a comparative model and dataset analysis. Digit. Discov. 2024. [Google Scholar] [CrossRef]
- Wu, Y. chen; Feng, J. wen Development and Application of Artificial Neural Network. Wirel. Pers. Commun. 2018, 102, 1645–1656. [Google Scholar] [CrossRef]
- Panapitiya, G.; Girard, M.; Hollas, A.; Sepulveda, J.; Murugesan, V.; Wang, W.; Saldanha, E. Evaluation of Deep Learning Architectures for Aqueous Solubility Prediction. ACS Omega 2022, 28, 40. [Google Scholar] [CrossRef] [PubMed]
- Corso, G.; Stark, H.; Jegelka, S.; Jaakkola, T.; Barzilay, R. Graph neural networks. Nat. Rev. Methods Prim. 2024, 4, 1–13. [Google Scholar] [CrossRef]
- Designing solvent systems using self-evolving solubility databases and graph neural networks - Chemical Science (RSC Publishing). Available online: https://pubs.rsc.org/en/content/articlehtml/2023/sc/d3sc03468b (accessed on 23 September 2025). [CrossRef]
- Tosca, E.M.; Bartolucci, R.; Magni, P. Application of artificial neural networks to predict the intrinsic solubility of drug-like molecules. Pharmaceutics 2021, 13, 1101. [Google Scholar] [CrossRef]
- Wang, S.; Di, J.; Wang, D.; Dai, X.; Hua, Y.; Gao, X.; Zheng, A.; Gao, J. State-of-the-Art Review of Artificial Neural Networks to Predict, Characterize and Optimize Pharmaceutical Formulation. Pharm. 2022, 14, 183. [Google Scholar] [CrossRef]
- Cysewski, P.; Jeliński, T.; Kukwa, O.; Przybyłek, M. From Molecular Interactions to Solubility in Deep Eutectic Solvents: Exploring Flufenamic Acid in Choline-Chloride- and Menthol-Based Systems. Molecules 2025, 30, 3434. [Google Scholar] [CrossRef]
- Klamt, A. Conductor-like screening model for real solvents: A new approach to the quantitative calculation of solvation phenomena. J. Phys. Chem. 1995, 99, 2224–2235. [Google Scholar] [CrossRef]
- Klamt, A. COSMO-RS: From quantum chemistry to fluid phase thermodynamics and drug design; 1st ed.; Elsevier: Amsterdam, The Netherlands, 2005; ISBN 9780444519948. [Google Scholar]
- Klamt, A.; Eckert, F.; Hornig, M.; Beck, M.E.; Bürger, T. Prediction of aqueous solubility of drugs and pesticides with COSMO-RS. J. Comput. Chem. 2002, 23, 275–281. [Google Scholar] [CrossRef]
- Klamt, A.; Eckert, F.; Arlt, W. COSMO-RS: An alternative to simulation for calculating thermodynamic properties of liquid mixtures. Annu. Rev. Chem. Biomol. Eng. 2010, 1, 101–122. [Google Scholar] [CrossRef]
- Dassault Systèmes. COSMOtherm, Version 24.0.0; BIOVIA: San Diego, CA, USA, 2024. [Google Scholar]
- Jeliński, T.; Przybyłek, M.; Różalski, R.; Romanek, K.; Wielewski, D.; Cysewski, P. Tuning Ferulic Acid Solubility in Choline-Chloride- and Betaine-Based Deep Eutectic Solvents: Experimental Determination and Machine Learning Modeling. Molecules 2024, 29, 3841. [Google Scholar] [CrossRef]
- Cysewski, P.; Jeliński, T.; Przybyłek, M.; Mai, A.; Kułak, J. Experimental and Machine-Learning-Assisted Design of Pharmaceutically Acceptable Deep Eutectic Solvents for the Solubility Improvement of Non-Selective COX Inhibitors Ibuprofen and Ketoprofen. Molecules 2024, 29, 2296. [Google Scholar] [CrossRef]
- Cysewski, P.; Jeliński, T.; Przybyłek, M. Exploration of the Solubility Hyperspace of Selected Active Pharmaceutical Ingredients in Choline- and Betaine-Based Deep Eutectic Solvents: Machine Learning Modeling and Experimental Validation. Molecules 2024, 29, 4894. [Google Scholar] [CrossRef]
- COSMOtherm, version 24.0.0, Dassault Systèmes, Biovia: San Diego, CA, USA, 2022.
- Klamt, A.; Eckert, F.; Arlt, W. COSMO-RS: An Alternative to Simulation for Calculating Thermodynamic Properties of Liquid Mixtures. Annu. Rev. Chem. Biomol. Eng. 2010, 1, 101–122. [Google Scholar] [CrossRef]
- Klamt, A. COSMO-RS: From quantum chemistry to fluid phase thermodynamics and drug design; Elsevier: Amsterdam, The Netherlands, 2005; ISBN 9780444519948. [Google Scholar]
- Klamt, A. Conductor-like Screening Model for Real Solvents: A New Approach to the Quantitative Calculation of Solvation Phenomena. J. Phys. Chem. 1995, 99, 2224–2235. [Google Scholar] [CrossRef]
- Klamt, A.; Eckert, F.; Hornig, M.; Beck, M.E.; Bürger, T. Prediction of aqueous solubility of drugs and pesticides with COSMO-RS. J. Comput. Chem. 2002, 23, 275–281. [Google Scholar] [CrossRef] [PubMed]
- Cordova, I.W.; Teixeira, G.; Ribeiro-Claro, P.J.A.; Abranches, D.O.; Pinho, S.P.; Ferreira, O.; Coutinho, J.A.P. Using Molecular Conformers in COSMO-RS to Predict Drug Solubility in Mixed Solvents. Ind. Eng. Chem. Res. 2024, 63, 9565–9575. [Google Scholar] [CrossRef]
- Vilas-Boas, S.M.; Abranches, D.O.; Crespo, E.A.; Ferreira, O.; Coutinho, J.A.P.; Pinho, S.P. Experimental solubility and density studies on aqueous solutions of quaternary ammonium halides, and thermodynamic modelling for melting enthalpy estimations. J. Mol. Liq. 2020, 300, 112281. [Google Scholar] [CrossRef]
- Freire, M.G.; Carvalho, P.J.; Santos, L.M.N.B.F.; Gomes, L.R.; Marrucho, I.M.; Coutinho, J.A.P. Solubility of water in fluorocarbons: Experimental and COSMO-RS prediction results. J. Chem. Thermodyn. 2010, 42, 213–219. [Google Scholar] [CrossRef]
- Miller, M.B.; Chen, D.-L.; Luebke, D.R.; Johnson, J.K.; Enick, R.M. Critical Assessment of CO 2 Solubility in Volatile Solvents at 298.15 K. J. Chem. Eng. Data 2011, 56, 1565–1572. [Google Scholar] [CrossRef]
- Acree, W.; Chickos, J.S. Phase Transition Enthalpy Measurements of Organic and Organometallic Compounds. Sublimation, Vaporization and Fusion Enthalpies From 1880 to 2010. 2010.
- Schölkopf, B.; Smola, A.J.; Williamson, R.C.; Bartlett, P.L. New support vector algorithms. Neural Comput. 2000, 12, 1207–1245. [Google Scholar] [CrossRef]
- Yao, X.J.; Panaye, A.; Doucet, J.P.; Zhang, R.S.; Chen, H.F.; Liu, M.C.; Hu, Z.D.; Fan, B.T. Comparative study of QSAR/QSPR correlations using support vector machines, radial basis function neural networks, and multiple linear regression. J. Chem. Inf. Comput. Sci. 2004, 44, 1257–1266. [Google Scholar] [CrossRef]
- Shi, Y. Support vector regression-based QSAR models for prediction of antioxidant activity of phenolic compounds. Sci. Rep. 2021, 11, 8806. [Google Scholar] [CrossRef]
- Cherkasov, A.; Muratov, E.N.; Fourches, D.; Varnek, A.; Baskin, I.I.; Cronin, M.; Dearden, J.; Gramatica, P.; Martin, Y.C.; Todeschini, R.; et al. QSAR modeling: Where have you been? Where are you going to? J. Med. Chem. 2014, 57, 4977–5010. [Google Scholar] [CrossRef]
- Gretton, A.; Borgwardt, K.M.; Rasch, M.J.; Schölkopf, B.; Smola, A. A kernel two-sample test. J. Mach. Learn. Res. 2012, 13, 723–773. [Google Scholar]
- Muandet, K.; Fukumizu, K.; Sriperumbudur, B.; Schölkopf, B. Kernel mean embedding of distributions: A review and beyond. Found. Trends Mach. Learn. 2017, 10, 1–141. [Google Scholar] [CrossRef]
- scikit-learn Developers. StandardScaler—scikit-learn 1.7.2 Documentation. Available online: https://scikit-learn.org/stable/modules/generated/sklearn.preprocessing.StandardScaler.html (accessed on 18 September 2025).
- scikit-learn Developers. 7.3.1. Standardization, or Mean Removal and Variance Scaling—scikit-learn User Guide. Available online: https://scikit-learn.org/stable/modules/preprocessing.html (accessed on 18 September 2025).
- Optuna Developers. Multi-Objective Optimization with Optuna—Optuna Documentation (stable). Available online: https://optuna.readthedocs.io/en/stable/tutorial/20_recipes/002_multi_objective.html (accessed on 18 September 2025).
- Yanase, T. Announcing Optuna 3.2. Optuna Blog (Medium). Available online: https://medium.com/optuna/announcing-optuna-3-2-cfbfbe104d5f (accessed on 18 September 2025).
- Akiba, T.; Sano, S.; Yanase, T.; Ohta, T.; Koyama, M. Optuna: A Next-generation Hyperparameter Optimization Framework. In Proceedings of the ACM SIGKDD International Conference on Knowledge Discovery and Data Mining; ACM: New York, NY, USA, 2019; pp. 2623–2631. [Google Scholar]
- Breiman, L.; Friedman, J.H.; Olshen, R.A.; Stone, C.J. Classification and regression trees; Routledge, 2017; ISBN 9781351460491. [Google Scholar]
- Hastie, T.; Tibshirani, R.; Friedman, J. The Elements of Statistical Learning: Data Mining, Inference, and Prediction, 2nd ed.; Springer: New York, NY, USA, 2009. [Google Scholar] [CrossRef]
- Breiman, L. Random forests. Mach. Learn. 2001, 45, 5–32. [Google Scholar] [CrossRef]
- Sugiura, N. Further analysis of the data by Akaike’s information criterion and the finite corrections. Commun. Stat. - Theory Methods 1978, 7, 13–26. [Google Scholar] [CrossRef]
- Hurvich, C.M.; Tsai, C.-L. Regression and Time Series Model Selection in Small Samples. Biometrika 1989, 76, 297–307. [Google Scholar] [CrossRef]
- Burnham, K.P.; Anderson, D.R. Model Selection and Multimodel Inference: A Practical Information-Theoretic Approach, 2nd ed.; Springer: New York, NY, USA, 2002. [Google Scholar] [CrossRef]
- Portet, S. A primer on model selection using the Akaike Information Criterion. Infect. Dis. Model. 2020, 5, 111–128. [Google Scholar] [CrossRef]
- Python Software Foundation. Python 3.10 Documentation. Available online: https://docs.python.org/3.10/ (accessed on 18 September 2025).
- Pedregosa, F.; Varoquaux, G.; Gramfort, A.; et al. Scikit-learn: Machine Learning in Python. J. Mach. Learn. Res. 2011, 12, 2825–2830. Available online: https://www.jmlr.org/papers/v12/pedregosa11a.html (accessed on 18 September 2025).
- pandas Development Team. pandas-dev/pandas: Pandas, Version 2.3.0; Zenodo: Geneva, Switzerland, 2025. [Google Scholar] [CrossRef]
Figure 1.
Experimental mole-fraction solubility of (A) mefenamic acid and (B) niflumic acid in choline chloride– or menthol–containing deep eutectic solvents (DESs).
Figure 1.
Experimental mole-fraction solubility of (A) mefenamic acid and (B) niflumic acid in choline chloride– or menthol–containing deep eutectic solvents (DESs).
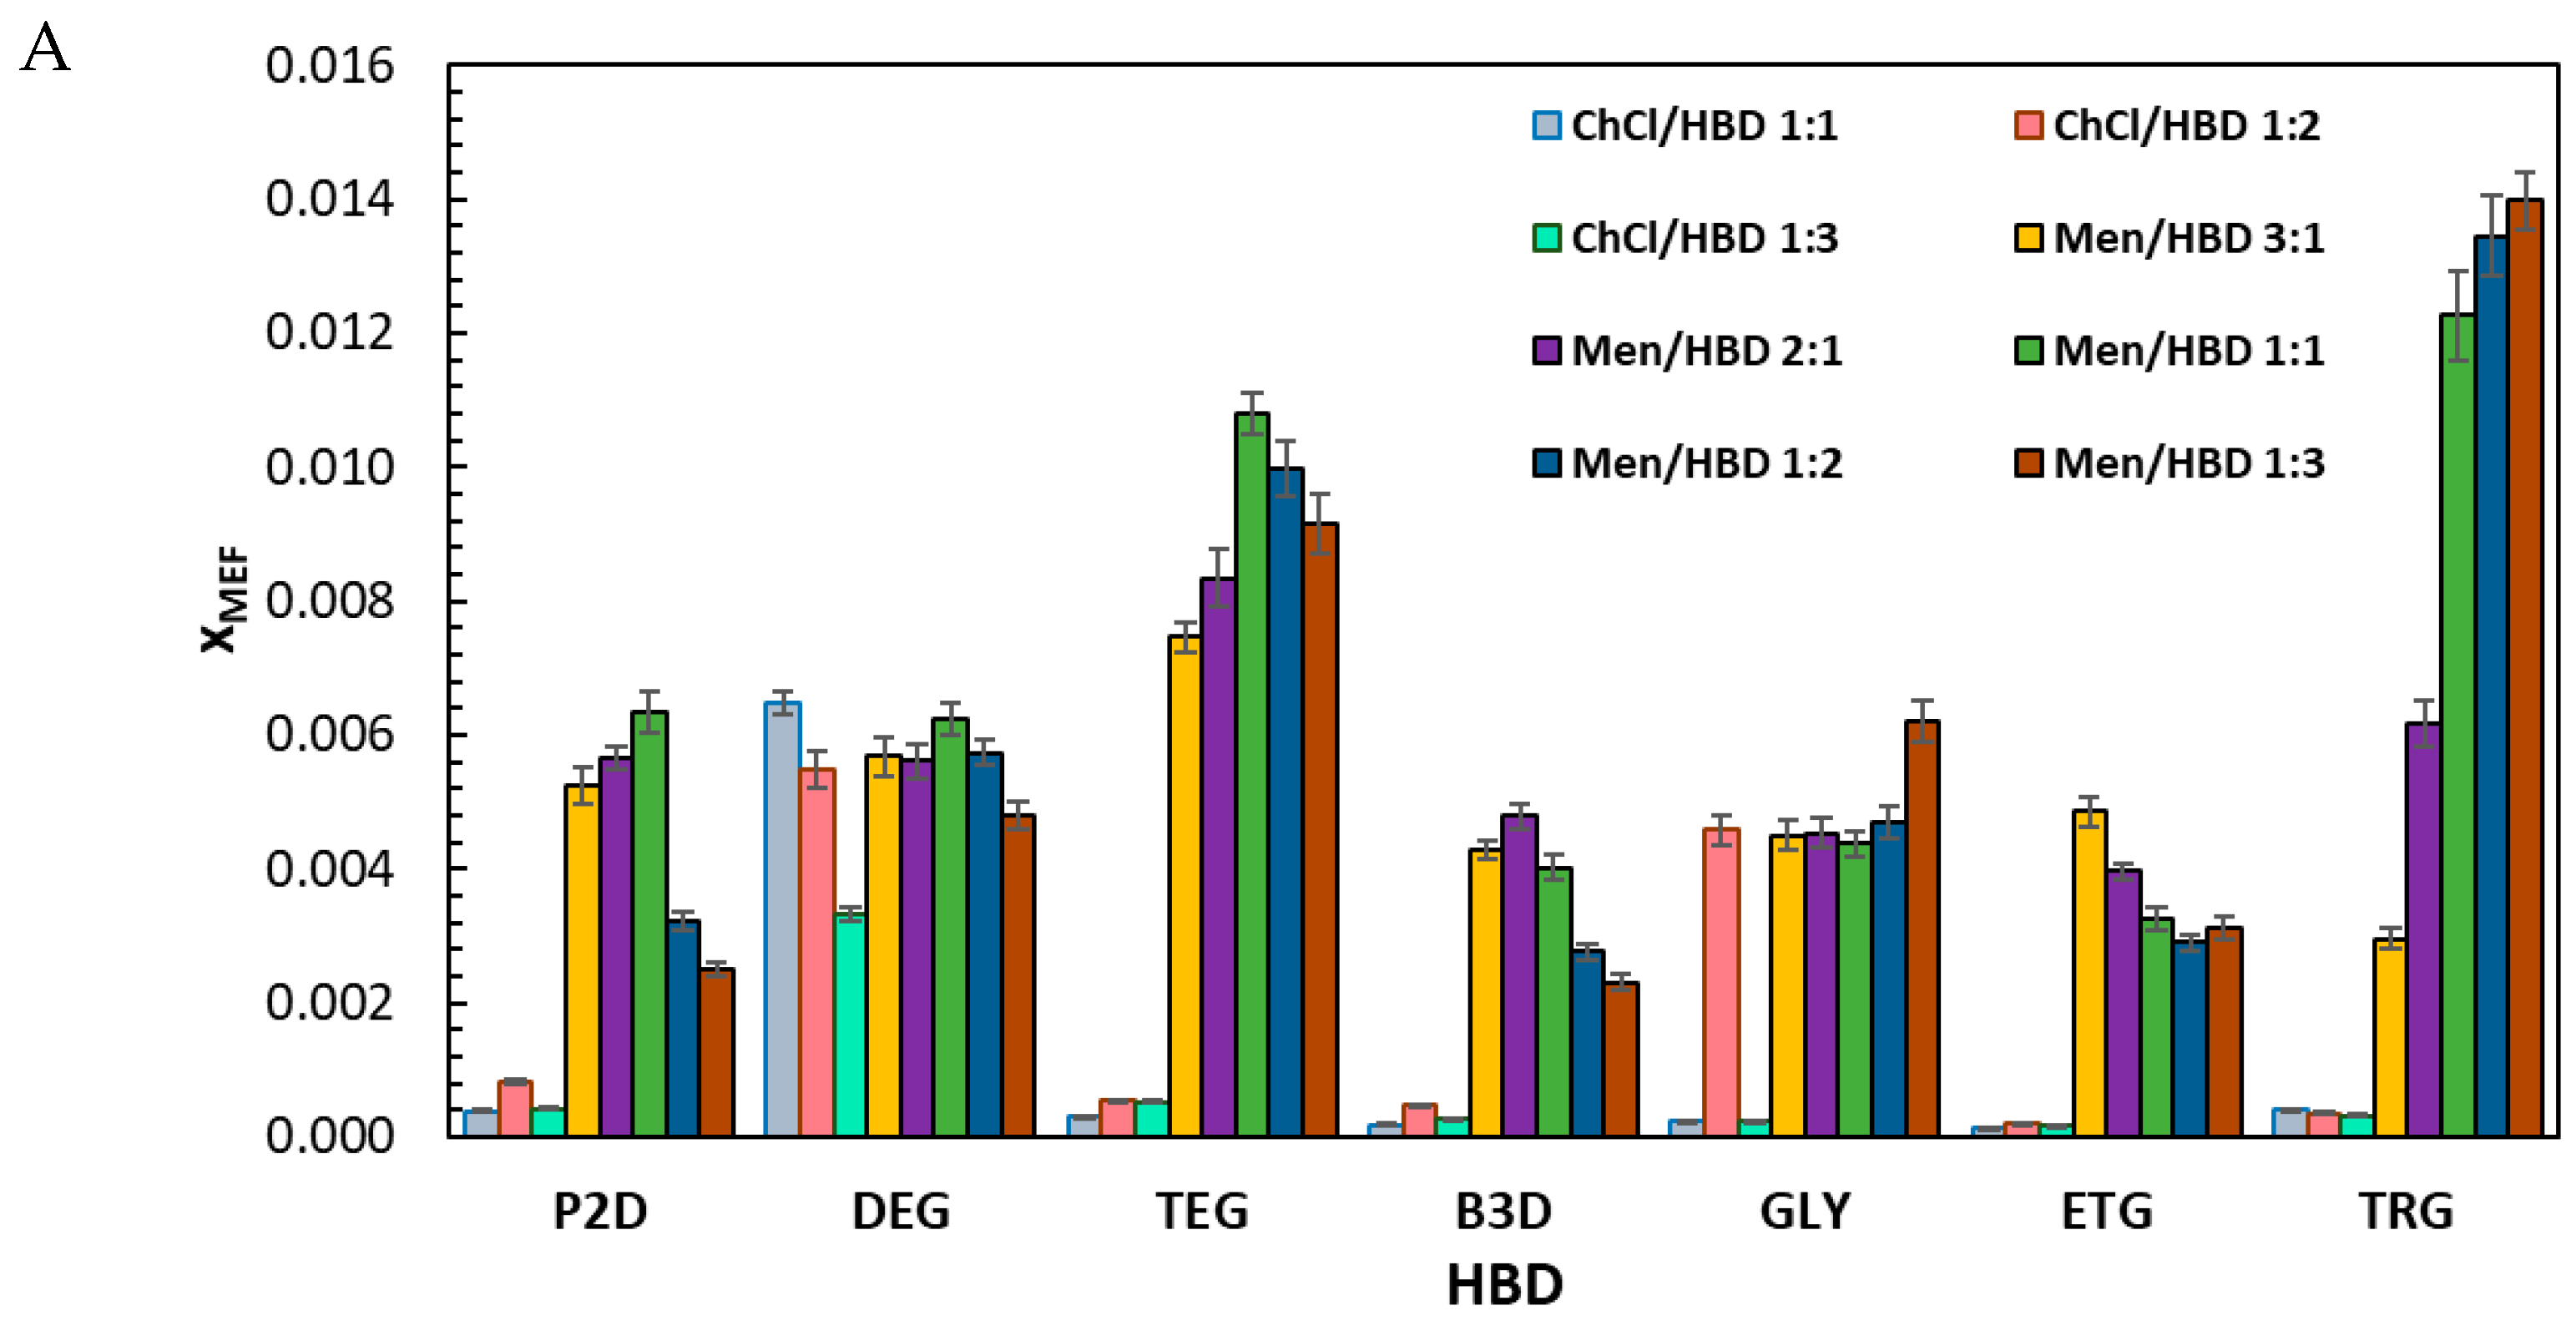
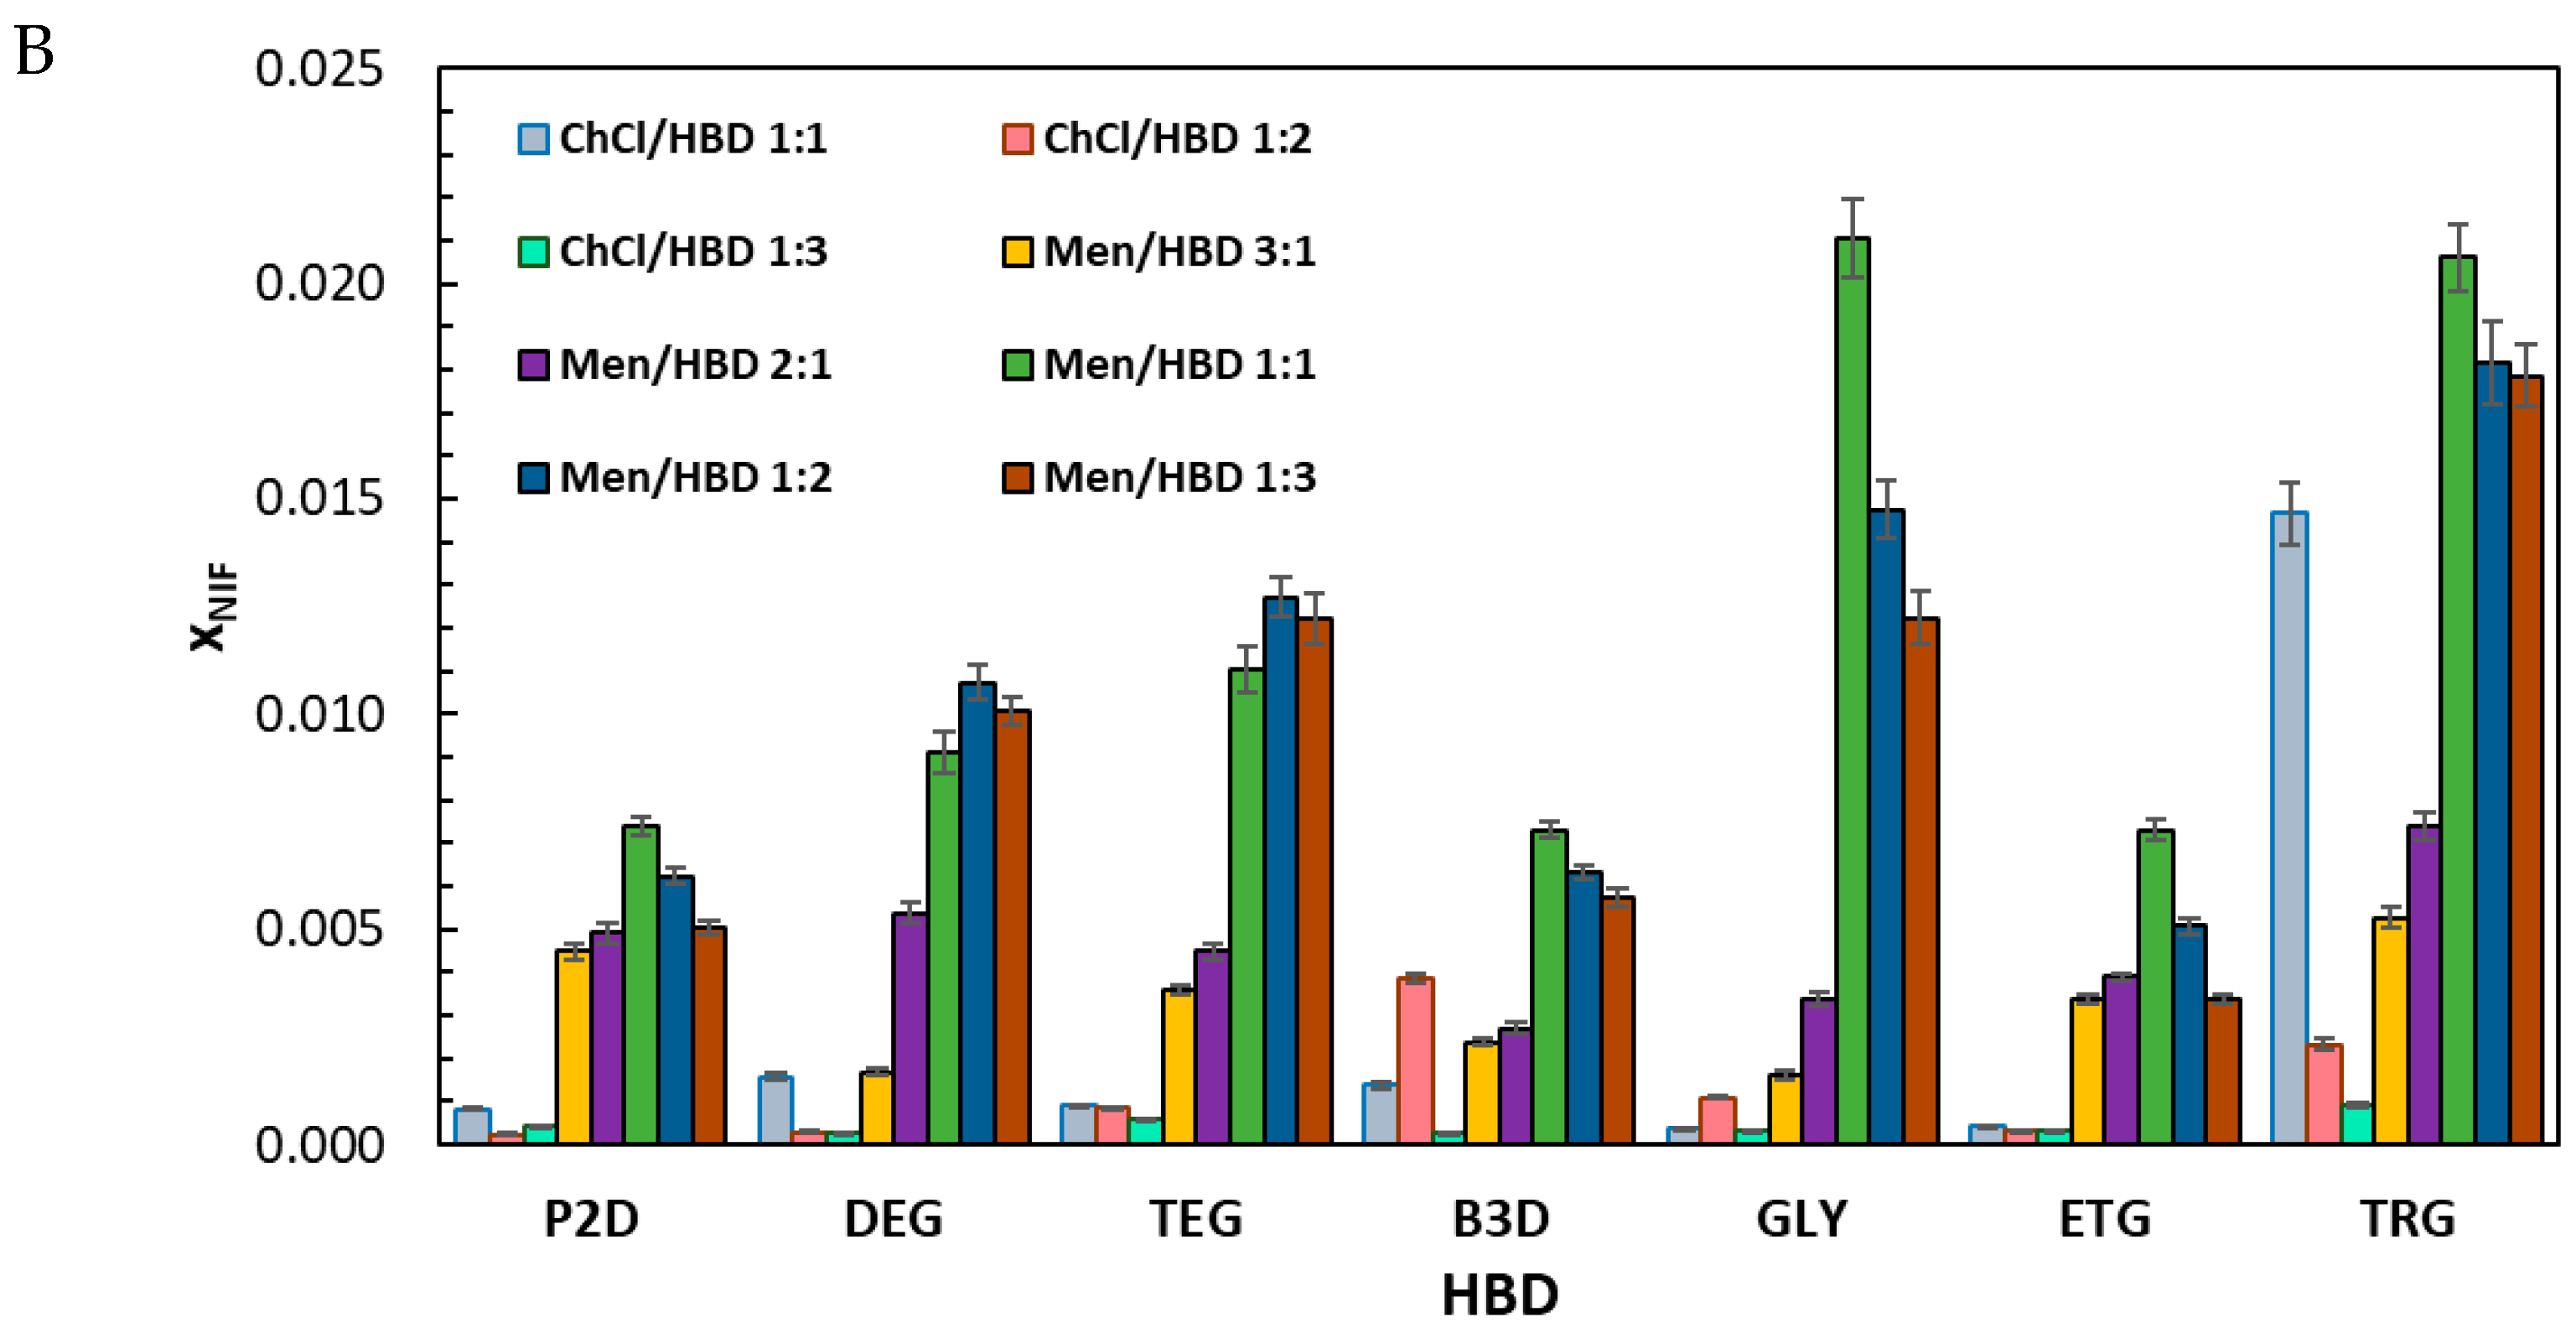
Figure 2.
Stability analysis of the DOO-IT model selection workflow for predicting solubility of pharmaceutical acids in DES. The figure illustrates the corrected Akaike Information Criterion (AICc) values obtained for the best models at successive steps of iterative feature pruning, aggregated over independent optimization turns. Different symbols denote alternative runs with different initial numbers of descriptors for which models were extracted from the Pareto front. The red curve marks the envelope of lowest AICc scores across different descriptor counts. Two distinct “basins of excellence” (green boxes) are visible for either 6 or 16 descriptors.
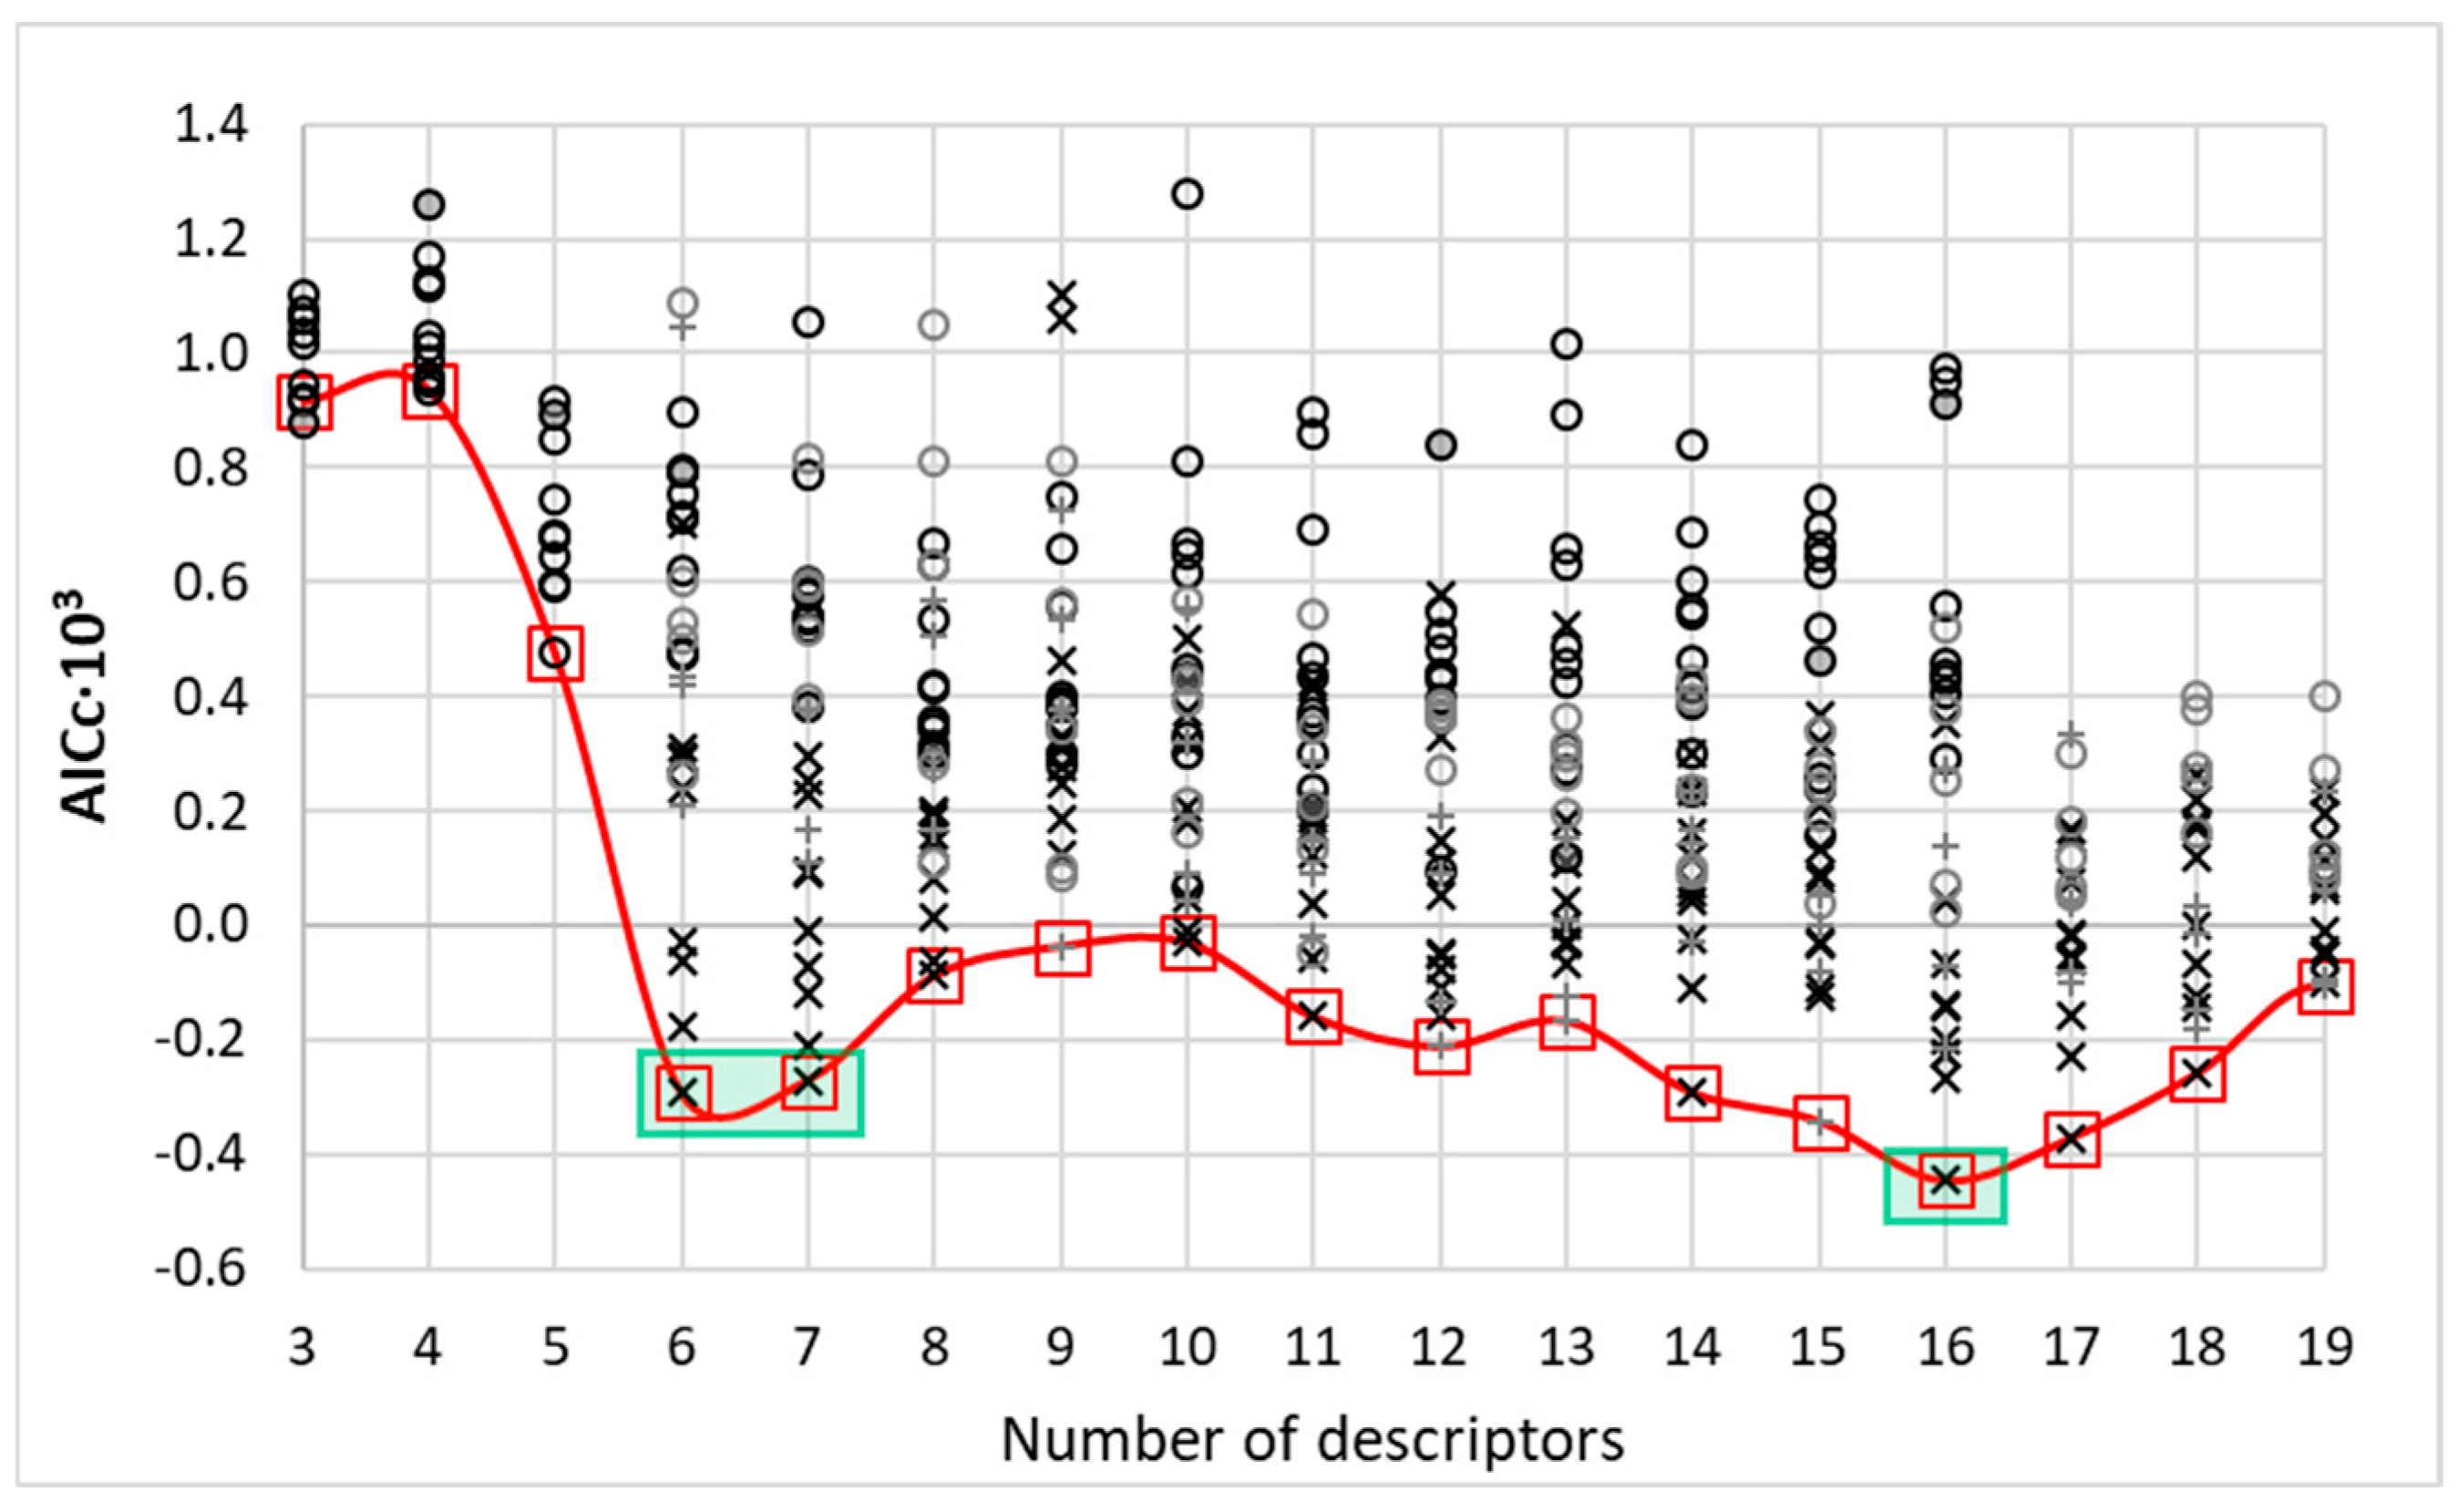
Figure 3.
Dual-objective optimization and tentative model selection for the 6-descriptor model. The figure shows the balance between predictive accuracy (CV MAE) and model complexity (SV ratio). Each point corresponds to a distinct nuSVR model, while the Pareto front (dark purple points, shaded by the nu hyperparameter) marks the set of non-dominated solutions. The final model (trial 1793, orange star) was chosen according to the 1-Standard Error (1-SE) rule, which selects the least complex model falling within the 1-SE performance band (green region) of the best-performing candidate (trial 1790, red diamond). The parity plot in the right panel of the figure shows the agreement between the experimental (exp) and estimated (est) values of logarithmic mole fraction solubility (log(x)) for the selected optimal model.
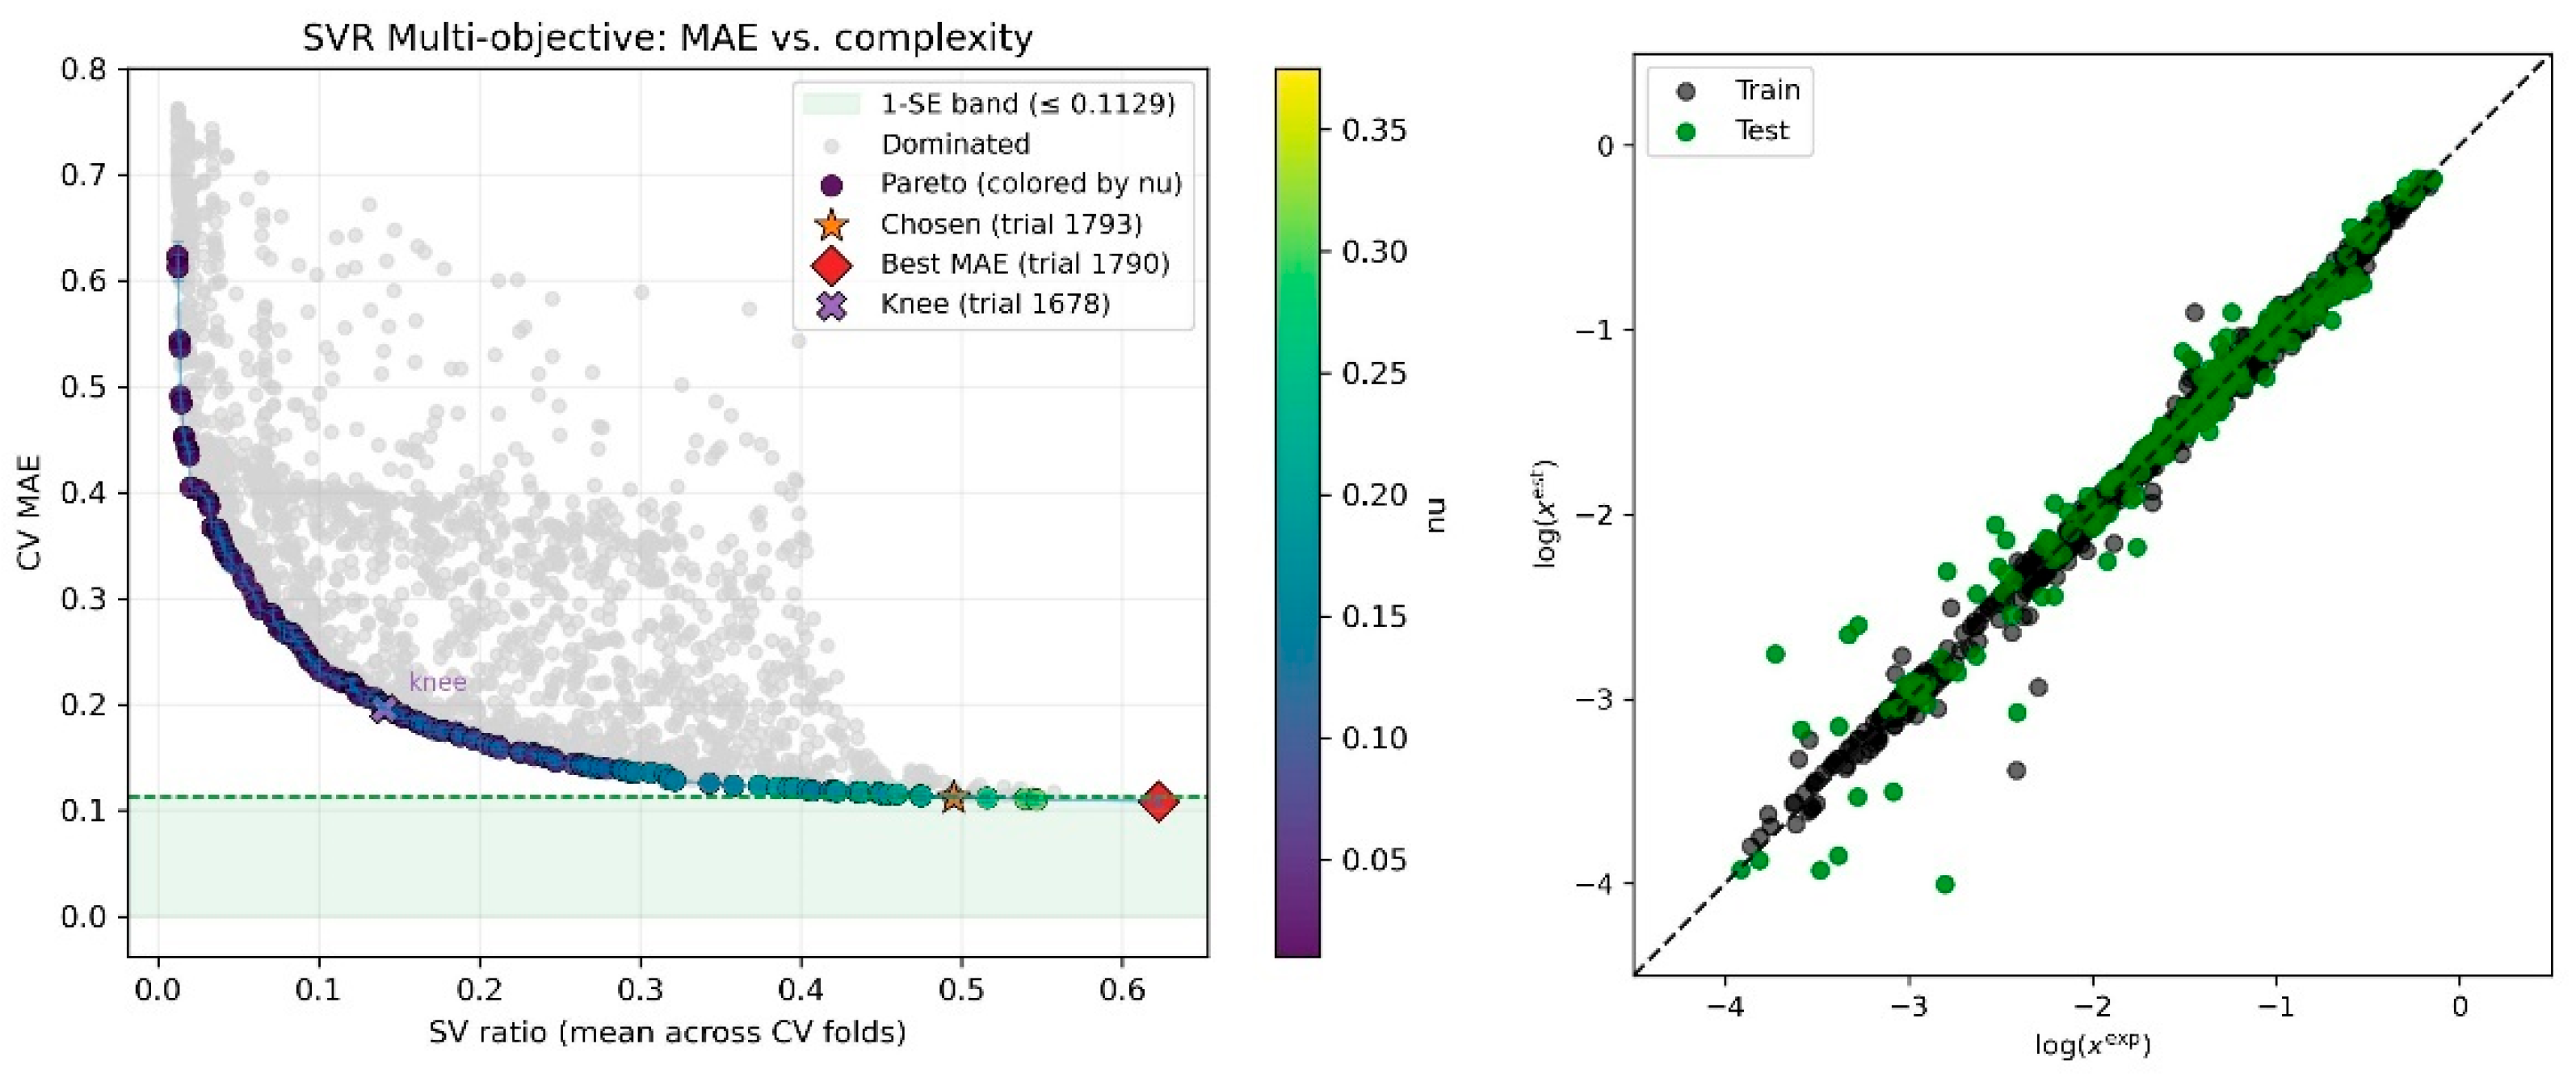
Figure 4.
Dual-objective optimization and tentative model selection for the 16-descriptor model. The figure shows the balance between predictive accuracy (CV MAE) and model complexity (SV ratio). Each point corresponds to a distinct nuSVR model, while the Pareto front (dark purple points, shaded by the nu hyperparameter) marks the set of non-dominated solutions. The final model (trial 955, orange star) was chosen according to the 1-Standard Error (1-SE) rule, which selects the least complex model falling within the 1-SE performance band (green region) of the best-performing candidate (trial 1597, red diamond). The parity plot in the right panel of the figure shows the agreement between the experimental (exp) and estimated (est) values of logarithmic mole fraction solubility (log(x)) for the selected optimal model.
Disclaimer/Publisher’s Note: The statements, opinions and data contained in all publications are solely those of the individual author(s) and contributor(s) and not of MDPI and/or the editor(s). MDPI and/or the editor(s) disclaim responsibility for any injury to people or property resulting from any ideas, methods, instructions or products referred to in the content. |
© 2025 by the authors. Licensee MDPI, Basel, Switzerland. This article is an open access article distributed under the terms and conditions of the Creative Commons Attribution (CC BY) license (http://creativecommons.org/licenses/by/4.0/).
Copyright: This open access article is published under a Creative Commons CC BY 4.0 license, which permit the free download, distribution, and reuse, provided that the author and preprint are cited in any reuse.


