
Submitted:
27 September 2025
Posted:
30 September 2025
You are already at the latest version
Abstract
Wireless multicast networks are progressively utilizing random linear network coding (RLNC), a progression that has been advanced by the rising prominence of the Internet of Things, 5G, and e-health.But the efficiency of these networks has been hindered by the large quantity of data they gather. Thus congestion may be occasioned by the enormous amount of data generated at any node in such an application. A new approach for detecting network congestion through algebraic means is presented in this work, using well-known algebraic technique called SVD (singular value decomposition). Data analysis cannot be performed using ordinary This is especially true for networks when nodes demand more system resources, such when people are having interactive video sessions. operations; therefore, we apply a statistical concept called the coefficient of variation to massive data sets to reach a conclusion about congestion in the network.
Keywords:
Congestion
; SVD (singular value decomposition)
; LR (linear regression)
; CV (Co-efficient of Variation)
; throughput
; delay
; entropy
1. Introduction
The Internet has already been recognised as a global communication network, and it has revolutionised the social, economic, and political landscapes around the world. Resources on the internet have been wisely distributed among its stakeholders. Congestion refers to an uneven distribution of resources that results in bottleneck conditions. It was first identified by Davies (1972), Rudin (1981), and Nagale (1984). They defined network congestion as an internet outage that can severely impair QoS parameters [1]. When a computer network becomes overwhelmed, packet loss, delay and the frequency of packet re-transmissions all increase at the same time. Congestion, in other terms, is a loss of network performance when a network is severely congested. To understand congestion, consider a situation where an end-user streams packets to another end-user through a group of network nodes, as illustrated in Figure 1. Obviously, user1 packets may encounter network congestion as a result of the untimely, unspecified traffic density created by other users. This motivates network engineers to keep a vigil on the network by observing a portion of the traffic at the MAC layer so as not to compromise QoS parameters. Different research works have presented various methods to cope with this issue and few congestion-level defining protocols [2]. New networks comprising many nodes with attractive applications like IoT demand continuous monitoring and evaluation of needed QoS parameters and a few security concerns [3].
In literature, we found two methods for asserting and analyzing network congestion [4]:
1.Active method
This method generates and injects probes to learn about possible network congestion. The effect of this injected probe is observed on performance matrices. e.g., network throughput, packet loss ratio delay, etc. This method provides a real-time analysis of network performance. For example, in Linux operating systems, the data-gathering command ping is used to check network connectivity and the functioning of a particular node, as shown in Figure 2. After receiving the ping command, the destination replies to the host with an acknowledgment. The ping command also returns the number of hops between the source and the destination.
2. Passive Method
Passive methods deal with real-time traffic situations [5, 6], e.g., fault tolerance. Passive network monitoring is an approach that involves the capturing and analysis of existing network traffic to gain insights into network behavior, performance and security. Capturing packets instantly from any network flow for determining various packet parameters like source and destination addresses and packet size enables detailed examination. Such examinations are defined as granular traffic analysis. Post-capture analysis helps in real-time insight of the network traffic.Table1 shows a list of source based congestion control techniques in different research works.
To minimise the congestion problem, we propose a new technique called SVDULR based on SVD and CV called connection-aware congestion identification in RLNC-based networks and its impact on QoS. The proposed SVD technique monitors the increase in congestion on different links, which is reflected in the data matrix. The unwanted part of this data can be removed by applying SVD to these huge matrices. Thus simplifying calculation and optimising QoS. The objectives of this proposed work can be summarised as:
1. To propose an innovative concept of applying SVD to a channel matrix
2. Applying LR to remove outliers in results obtained from the simulation
3. Applying CV in comparing the effect of link congestion on QoS parameters.

Table 1.
List of source based congestion control.
| Year | Title | Approach | Features | Performance Metrics |
|---|---|---|---|---|
| 2004 | Binary increase congestion control (BIC) for fast Long-distance networks |
Loss based | BIMD, limited slow-start | Throughput, Fairness |
| 2005 | TCP-A Reno: Improving efficiency-friendliness trade offs of TCP congestion control algorithm |
Loss & delay Based with bandwidth Estimation |
Dynamically adjusts the TCP response function based on congestion level estimation via RTT measurement. |
TCP friendliness, Efficiency |
| 2006 | Compound TCP: A scalable and TCP-friendly congestion control for high-speed networks |
Loss & delay based |
Add a delay based component into Std TCP reno congestion avoidance |
BW scalability |
| 2007 | TCP-fusion:A hybrid congestion control algorithm For high speed networks |
Loss based | TCP-Fusion exploits three useful characteristics of TCP-Reno, TCP-Vegas and TCP-Westwood in its congestion avoidance strategy |
Efficiency Fairness |
| 2008 | CUBIC: A new TCP-friendly high-speed TCP Variant |
Loss based | Uses a cubic window growth function In order to improve |
Intra-protocol fairness, RTT-fairness, TCP- Friendliness. |
| 2009 | Sync-TCP: A new approach to high speed congestion control |
Delay based | Exploits synchronization, adaptive Queue-delay-based CWND Decrease Rule, RTT-Independent CWND Increase rule |
Throughput, TCP Friendliness |
| 2010 | TCP Libra: Derivation, analysis, and comparison With other RTT-fair TCPs |
Loss based | Multiplying the congestion window by The square of the RTT during the Additive increase por- tion of the TCP |
RTT-fairness TCPfriend liness , Bandwidth |
| 2011 |
HCC TCP: hybrid congestion control for high- speed networks |
Loss ,delay Based |
The two approaches (delay loss) in The Algorithm are dynamically Transferred Into each other according to the network status. |
Throughput, TCP Friendliness |
| 2020 | Research of Wireless Congestion Control Algorithm Based on EKF | Throughput based | Kalman filtering and bandwidth | Throughput,fairness |
| 2022 | A hierarchical congestion control method in clustered internet of things | Packet loss avg energy |
Cluster based congestion control | Packet loss avg energy Delay |
2. Litrature Review
Different works have discussed various congestion identification issues and proposed different solutions to address the problem in all types of networks. In the sequel we discuss a few such works:
A bunch of traffic flows between two nodes that results in congestion on a shared path can be resolved using SVD (Singular Value Decomposition). The method only needs delay information between nodes to determine congestion. Simulation results reflect that the technique can be applied to different topologies [7].
The different flows being clustered depending upon the comparison test discussed in [7] are investigated further and called flow mates in [8]. One flow is selected from each cluster and compared with one representative flow from another cluster. However, short-lived HTTP creates an accuracy problem in Flow Mate.
Just similar to [7], the work in [9] described topologies with multiple sources sending information to a single destination. The inter-arrival times at the destination are measured using passive technique. Average entropy for each flow is determined with the assumption that the flow belongs to the same cluster. The flow is classified under the cluster with the lowest average entropy. But the drawback of this method is that it gives accurate results only when cross-flow traffic is low.
Rezaei et al. in [10] described a broad framework for traffic categorization based on deep learning. The method introduces widely used deep learning techniques and shows how they are used to traffic categorization problems. Next, it discussed unresolved issues, difficulties, and prospects related to traffic categorization.
The work in [11], proposes a two-phase congestion control system for IoT networks, dividing the network into clusters and addressing congestion within each cluster using congestion scores and buffer statistics. This method is particularly effective for small and distributed networks, where congestion can be efficiently managed using a source method like TCP, which uses indirect methods like packet loss or delay. The study also highlights the importance of network size in addressing congestion.
To improve TCP performance in wireless mesh networks,A pace scheme called Mesh Adaptive Pacing (MAP) is introduced in [12],which is hybrid between acknowledgment based TCP and rate control scheme. The scheme is implemented both at sender as well as mesh gateway. Experimental results suggest improvement in performance compare to TCP Reno.
The work in [13] looks at how traffic optimization is affected by congestion avoidance in a star topology where a central node is connected to dispersed secondary nodes that have various preferences. Based on decreasing preferences and congestion rates, agents randomly choose secondary nodes. Multivariate statistics, which show the most uniform distribution, were shown to effectively capture the nonlinear dependency of agent distribution on the number of secondaries.
The work in [14] investigates the effect of link failure or congestion under RLNC. Results demonstrate that the effect of congestion is minimal on qos parameters.
The work in [15] described a PACE RLNC approach that generates source symbols with programmed redundant packets. Two techniques, PACE-Uniform and PACE-Burst, are proposed. Simulations demonstrate that PACE-Uniform greatly lowers source symbol latency compared to tail RLNC while keeping the loss probability constant.
The work in [16], discussed a new technique called dynamic deep neural network-particle swarm optimization (DDNN-PSO) to assist the Intelligent Transportation System (ITS) in managing traffic-related issues and enhancing overall system performance. Using the PSO method to optimize weight parameters increases its overall performance. Primarily source based methods used in handling congestion issues for limited size networks. But for large network, source based methods are not effective. Therefore routing based congestion methods are used in such cases.Table2 shows details of few routing based research works.
Table 2.
List of router based congestion control.
| Year | Title | Approach | Congestion measure | Performance Metrics |
|---|---|---|---|---|
|
2007 |
LRED: a robust and responsive AQM Algorithm Using packet Loss Ratio measurement |
LRED (propor -tional Controller) |
Instantaneous Queue Length Packet loss ratio |
Fast response time, Robustness, flexible system Link utilization, low Queuing delay, Low complexity |
| 2007 | Active queue management algorithm considering queue And load states Tradeoffs of TCP congestion Control algorithm |
PAQM | Queue length input rate response function Based on congestion level estimation Via RTT measurement. |
TCP friendliness, Efficiency |
| 2008 | Design of a stabilizing AQM controller For large-delay |
IMC-PID (control Theoretic) |
Stability, robustness, Convergence, High linkutilization And small delay Jitter. |
Stability, robustness, Convergence, high linkutilization and Small delay Jitter. |
| 2009 | Effective RED: an algorithm to Improve RED's performanceby Reducing packet Loss rate |
Queue length (both instantaneous and Average) Input Rate Loss rate |
Throughput, packet drops, fully compatible With RED, |
|
| 2021 | Traffic and Energy Aware Optimization for Congestion Control in Next Generation Wireless Sensor Networks |
ant colony Optimization |
Entropy | Throughput,delay, Packet delivery ratio |
| 2021 | A Centralized and Dynamic Network Congestion Classification Approach for Heterogeneous Vehicular Networks |
Deep learning | Throughput,Delay | packetloss ratio |
| 2022 | Effect of congestion avoidance due to congestion information provision on optimizing agent dynamics on an Endogenous star network topology |
agent based Multivariate Analysis |
Delay | Delay |
| 2023 |
Connection aware congestion Identification In rlnc based networks and it’s impact On QoS |
Coefficient of Variation |
Entropy,delay ,jitter | PDR,Delay,jitter |
| 2023 | Effect of link failure on QoS Parameters under the influence of field and generation size in wireless Network |
link condition |
delay,packet Buffered |
delay,packetbuffered |
| 2023 | A machine learning based Distributed Congestion Control Protocol for Multi-hop wireless networks |
network load | machine learning | Throughput,packet Delivery ratio |
The work in [17] compares support vector machines (SVM) with artificial neural networks (ANN) as a congestion detection approach for wireless sensor networks (WSNs). The focus is on elements that are critical to resolving network congestion issues, such as node retention, traffic rate, and the number of sensor nodes.
The Work in [18], describes a hybrid congestion control strategy for Named Data Networks (NDN). It makes use of Software-Defined Network (SDN) features to accomplish global resource scheduling and network information acquisition. NDN improves service quality by creating a synergistic interaction between the two processes and initiating consumer and router control mechanisms in response to specific network congestion circumstances.
The work in [19] introduces a framework that separates the sliding window of sliding-window random linear network coding (RLNC) from the transmission control protocol (TCP). This results in the improvement of a few QoS parameters, viz., good put, in-order delivery delay, and decoding complexity.
The work in [20], provide a reinforcement learning architecture that allows for dynamic modification to enhance network performance by severing the RLNC sliding window's connection to TCP. This results in more effective use of network resources as RLNC can adjust to network circumstances without previous knowledge. The outcomes demonstrate notable gains in decoding complexity, good put, and in-order delivery latency.
The prevalent use of ubiquitous computing has increased the demand for more network resources,those are already exhausted. Therefore optimizing resource usage with accuracy is highly expected. This is specially true in Bitcoin and Ethereum Decentralization for Bitcoin and Ethereum Networks. The work in [21] uses a coefficient of variation technique from probability theory and statistics to assess decentralization in the Bitcoin and Ethereum systems. The approach computes the distribution of blocks produced and address balances, demonstrating that Bitcoin mining is about 27.3% decentralized while its wealth is 16.5% decentralized. This approach may be used to determine decentralization in any block chain system.
The work in [22] looks at the urban expressway's macroscopic basic diagram, which explains features like occupancy and speed. Hysteresis in network road traffic defines availability and occupancy of traffic on various roadways. The analysis of data traffic volumes is aided by the coefficient of variation.
The work in [23] describes the application of RLNC in 5G using two communication protocols, coded and uncoded. Coded protocol makes use of coding-aware acknowledgments and RLNC, whereas uncoded uses feedback mechanisms. Coding increases efficiency, thus resulting in efficient use of resources and reducing congestion.
The work in [24] addresses the significant propagation delays and complicated surroundings of satellite-to-ground communications by examining the Vegas congestion mechanism of the Space Communication Protocol Standard Transport Protocol (SCPS-TP). It offers a reaching law and sliding mode-based predictive control technique for satellite communication, integrates interference impacting satellite communication links into a discrete model, and blends interference estimate with controller design. The robustness of the algorithm is demonstrated by the simulation results, which also highlight its ability to prevent jamming and maximize satellite network capacity usage.
The work in [25] introduces a novel deep learning strategy that uses a bidirectional neural network to learn temporal data and graph attention architecture to capture spatial correlations. This allows the reconstruction of missing data using tensor decomposition, numerical statistics, and deep learning techniques. Experimental findings indicate that the strategy outperforms alternative benchmark methodologies.
The work in [26], demonstrates the possibility for enhanced performance in Internet congestion management (CC) systems and emphasises the necessity for fresh ideas and advancements in this well-liked topic of study. Additionally, it provides broad CC standards for analysis and comparison with current designs. We formally choose the following research papers from the literature to serve as inspiration for expanding our study to show that the impact of congestion may be minimised by using SVD in combination with a statistically defined coefficient of variation.
3. Background
The work is based on RLNC (random linear network coding), which mixes source packets based on the generation size chosen, codes the packets using Galois field arithmetic GF(2p), and then securely transmits the coded packets [15]. By diagnosing congestion and implementing congestion mitigation techniques utilising SVD, we expand on the work covered in [14]. The many approaches to congestion control previously discussed and summed show that statistical techniques are a more effective way to assess congestion in any network. We develop a new statistical notion called coeffient of variation for this purpose. The work in [22, 23] motivates us for applying the concept of coefficient of variation in given wirelessnetwork.
Table 3.
Few works which motivates development of this research work.
| Title | Outcomes | Motivation |
|---|---|---|
| Research on the Macroscopic Fundamental Diagram for Shanghai urban expressway network[22](2017) | Traffic management | Applying Coefficient of Variation in analyzing network congestion |
| Effect of link failure on QoS parameters under the influence of field and generation size in wireless network[14](2023) | Impact of link failure on QoS parameters | Managing congestion using RLNC without SVD |
| On the Benefits of Coding for Network Slicing[23](2024) | Resource managements | Application of RLNC in 5G |
The literature on congestion shows that the following statistical parameters can be used to discuss the effect of congestion on any wireless network:1.Geo spatial Data Analysis. 2.Regression Models. 3.Neural Networks. 4. Time Series Models. 5. Integration of External Data. 6. Continuous model evaluation and adjustment can be a powerful tool to improve traffic congestion. But we adopt linear regression in analysis and predict unknown values by utilising already available data from previous computations. Further discussion on all these parameters is beyond the limits of discussion in this research article, but one can refer to [27].
3.1. How SVD Works for Congestion Detection
Singular value decomposition(SVD ) is mathematical tool that helps in determining matrices structure which represents a channel. Ex: For a mxn matrix say ‘A’ with rank r the svd for A can be defined as
Figure 3 illustrate the proposed work. Packets generated at source node are sent to next relay node after performing RLNC. It is expected in general sense that there is a fair allocation of network resources to all nodes. But over hungry nodes may consume network resources in excess thus resulting in shortage of network resources. When a node sends it’s traffic on a particular link and finds scarce resource availability,indicating the network nodes has met with congestion. Two different flow of packets which are merged at one particular node is computed and forwarded to next node. where r is the rank of A and it’s singular values are: with be it’s left and right orthonormal singular vectors respectively. Such that is an rxr diagonal matrix containing the singular values of A.As expressed in Equation (1),The values in ‘A’ can be approximated by keeping the principle components and removing the smallest values that are basically nonessential for analysis. A condition called bottleneck occurs when normal packet flows experience delays which is essentially more than the threshold value permitted, We discuss this in result section next.
As A is splitted into its components, which are U,Σ,V, we therefore only compute the column vector of U, the row vector of V, and the singular values..Now the relay node is capable of creating coefficient matrix (2)
The encoded packet at each node is represented as (3)
From Equation (3), We conclude that the coded packets are the product of VT and singular values.
3.2. Identification of Congestion
During transmission in any network, the send rate ratio is defined as the number of packets sent by, say, node 1 to the number of packets sent by node 2, with the assumption that the system resources are fair shared. However, to maintain perfect fairness among nodes, the send_rate ratio (SR) should be between 0<SR<1. A low coefficient of variation is highly desired as it reflects the least number of packets lost. when a node betrays and sends more traffic compared to its allocated traffic density. The situation provokes congestion, as the number of packets sent exceeds the data handling capacity of the network. To overcome this situation, the reason behind congestion has to be identified. Most of the earlier works have laid emphasis on packet buffering for defining congestion. However, this argument can be extended to additional QoS parameters, viz., throughput, packet delivery ratio, delay, and jitter. Network congestion occurs when the demand for network resources exceeds the capacity of the network, resulting in delays and packet loss. Understanding the variability of data transmission via measures such as the coefficient of variation can aid in better prediction or management of congestion. High variability may indicate unpredictable spikes in network traffic, exacerbating congestion issues. A coefficient of variation is a statistical measure to estimate the dispersion of value due to unpredictable spikes in a given data set relating to its mean variance. Mathematically, coefficient of variation (CV) is defined as the ratio of std_deviation to the mean value of the quantity as expressed in equation 4.
Coefficient of Variation (CV)=std_deviation/mean value (4)
When addressing congestion in networking, the coefficient of variation may be a useful metric for understanding the variability of data packet arrival times or network loads. A larger coefficient of variation may suggest a more unpredictable flow of traffic, which may contribute to network congestion. To gauge the consistency of data, a distribution of packets among different paths linking different nodes—a path with a smaller coefficient of variation—can be considered. The congestion can be managed by observing the coefficient of variation as shown in Table 3. Equation 5 describes how we can fix the threshold value under different link congestion to identify congestion. Further, the application of the coefficient of variation can be found in [21].
where u ≥ z ≥y ≥x variables
Table 3.
Co-efficient of Variation for different QoS parameters.
| Co-efficient of Variation (CV)=std/avg | Packet-loss(%) | Packet delivery ratio(%) |
Throughput | Delay | Jitter | Entropy |
|---|---|---|---|---|---|---|
| RLNC method | 13.26 | 6.5 | 24.5 | 75.46 | 18.33 | 39.11 |
| Proposed method | 10.8 | 5.6 | 19 | 63.48 | 2.93 | 39.22 |
| Proposed method(1 link congested) | 3.8 | 11.24 | 33.045 | 64.32 | 2.159 | 37.61 |
| Proposed method(2 link congested) | 3.79 | 11.34 | 26.76 | 60.41 | 2.24 | 45.69 |
4. Network Simulation
In this section, we present the outcomes of experiments performed to investigate the effect of svd and linear regression on QoS parameters, namely delay, jitter, and throughput. We first describe the parameters used for the experimental setup.
4.1. Simulation Parameters
For conducting the simulation,We have consider a wireless network, G = (N, E),where N = {0,. . . , r + i − 1} be the number of nodes and be the the number of edges. with the following parameters:
r: number of edges.
i: Number of nodes (intermediate )
b: The number of symbols selected from the message blocks' finite field
g: The number of randomly chosen network graphs
p:link loss probability
We have experimented with the variables r, i, and b. For fixed values of r, i, and b, we have repeated the experiment g times with randomly chosen graphs.
4.2. Network Model
We create a network model with n nodes as shown in Figure 4. The nodes are placed such that their euclidean distance is predetermined and fixed. Channels are created among different nodes. One symbol's transmission time from the finite field GF(q) may be thought of as a constant value across all channels.
4.3. Results and Discussion
Various performance parameters results discussed below shows, our proposed method SVDULR performed better. Also we have correlated our results with that of the work presented in [2,14]:
4.3.1. Packet_loss
Packet loss occurs when one or more packets fail to reach their destination. Figure 5(a) shows the packet_loss variation as a function of the number of congested links. The comparative study between the normal method and the proposed SVDULR method reflects the deviation of packet loss from a fixed threshold value. Obviously, this point of deviation can be fixed as the identification point and can be referred to as the link failure point. Further we have correlated our work with [2],to demonstrate that it’s working at par with other method adopted in [2].
4.3.2. Entropy
Entropy is the measure of information available at any node and it varies as packets moves from one node to next relay node,the heuristic packet rate variation at any node in turn affects entropy. In the present context it can be viewed as the no of packets transmitted between nodes. Figure 6 shows the entropy variation as a function of no of congested link. The comparative study between the normal method and the proposed SVDULR method reflects the deviation of entropy from a fixed threshold value. Obviously this point of deviation can be fixed as the identification point and can be referred as link failure point from Equation (2).
4.3.3. Packet-Delivery Ratio
Packet-delivery ratio is the defined as the no of packets successfully delivered at destination to the no of packets actually transmitted. Figure 7 shows the Packet-delivery ratio variation as a function of no of congested link. The comparative study between the normal method and the proposed SVDULR method reflects the deviation of Packet-delivery ratio from a fixed threshold value. Obviously this point of deviation can be fixed as the identification point and can be referred as link failure point
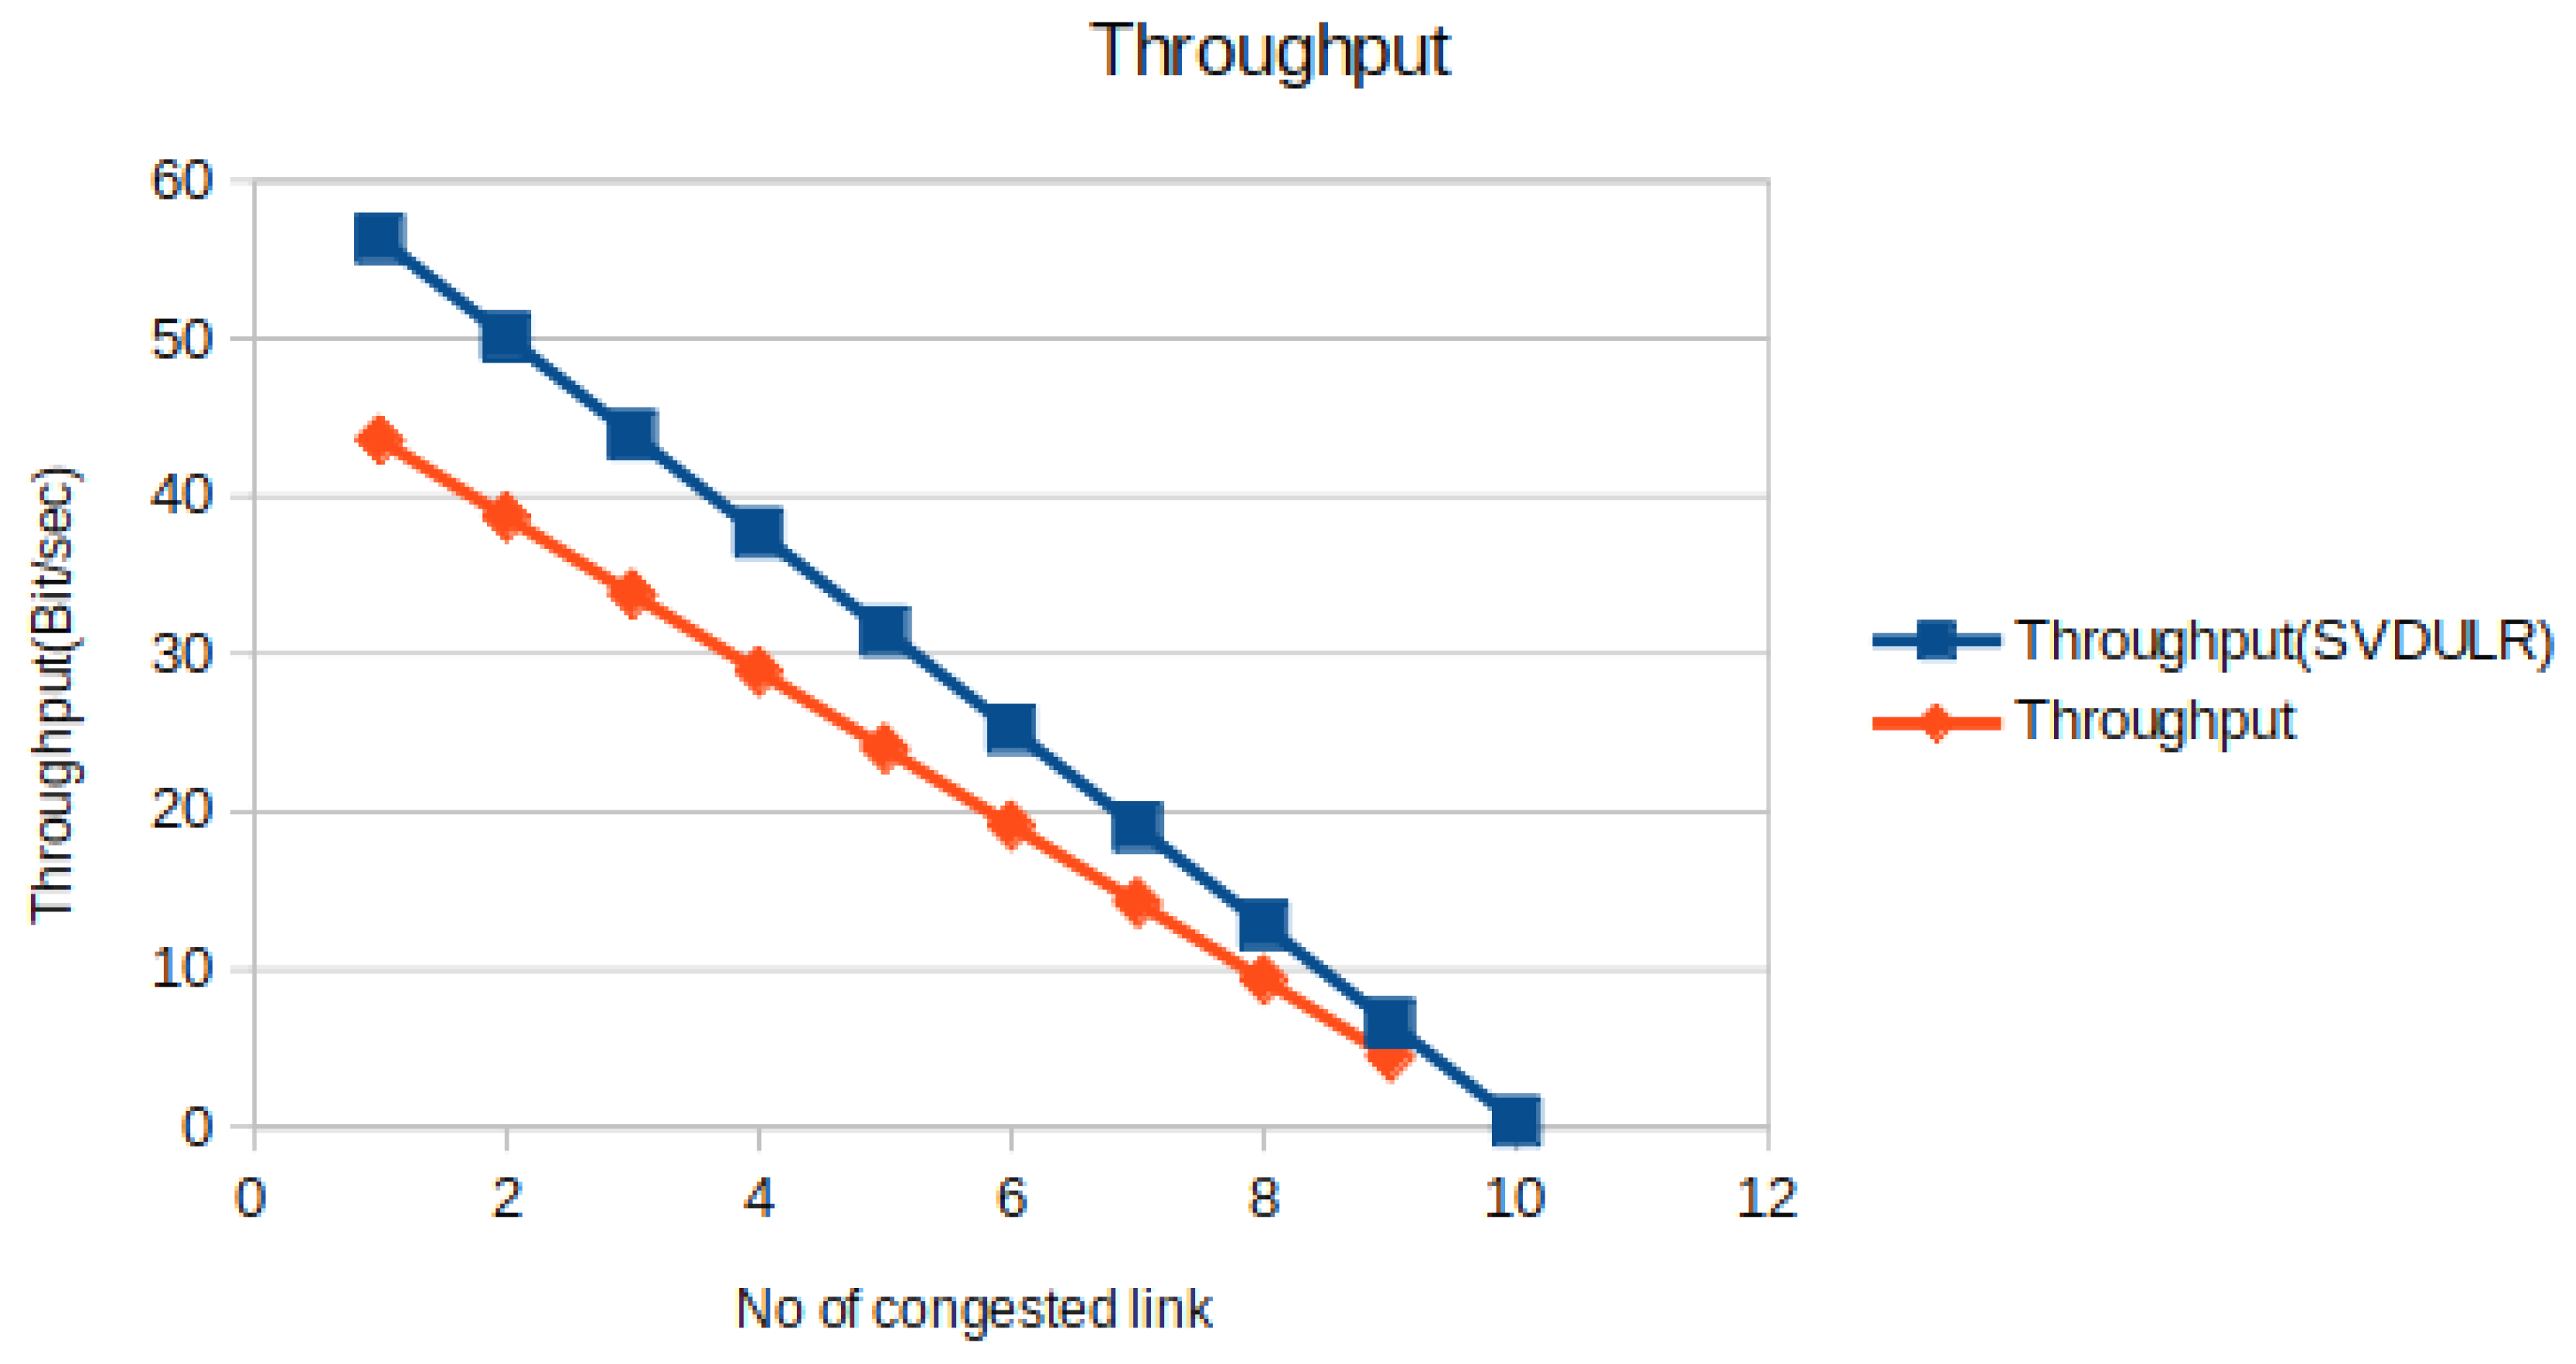
4.3.4. Throughput
Throughput is defined as the no of packets sent during a specified amount of time. FigURE shows the throughput variation as a function of no of congested link. The comparative study between the normal method and the proposed SVDULR method reflects the deviation of throughput from a fixed threshold value. Obviously this point of deviation can be fixed as the identification point and can be referred as link failure point
Figure 7.
No of congested link verses Throughput.
4.3.5 Delay
Delay is defined as the time elapse between arrival and transmission of a packet. Figure 8 shows the delay variation as a function of no of congested link. The comparative study between the normal method and the proposed SVDULR method reflects the deviation of delay from a fixed threshold value. Obviously this point of deviation can be fixed as the identification point and can be referred as link failure point
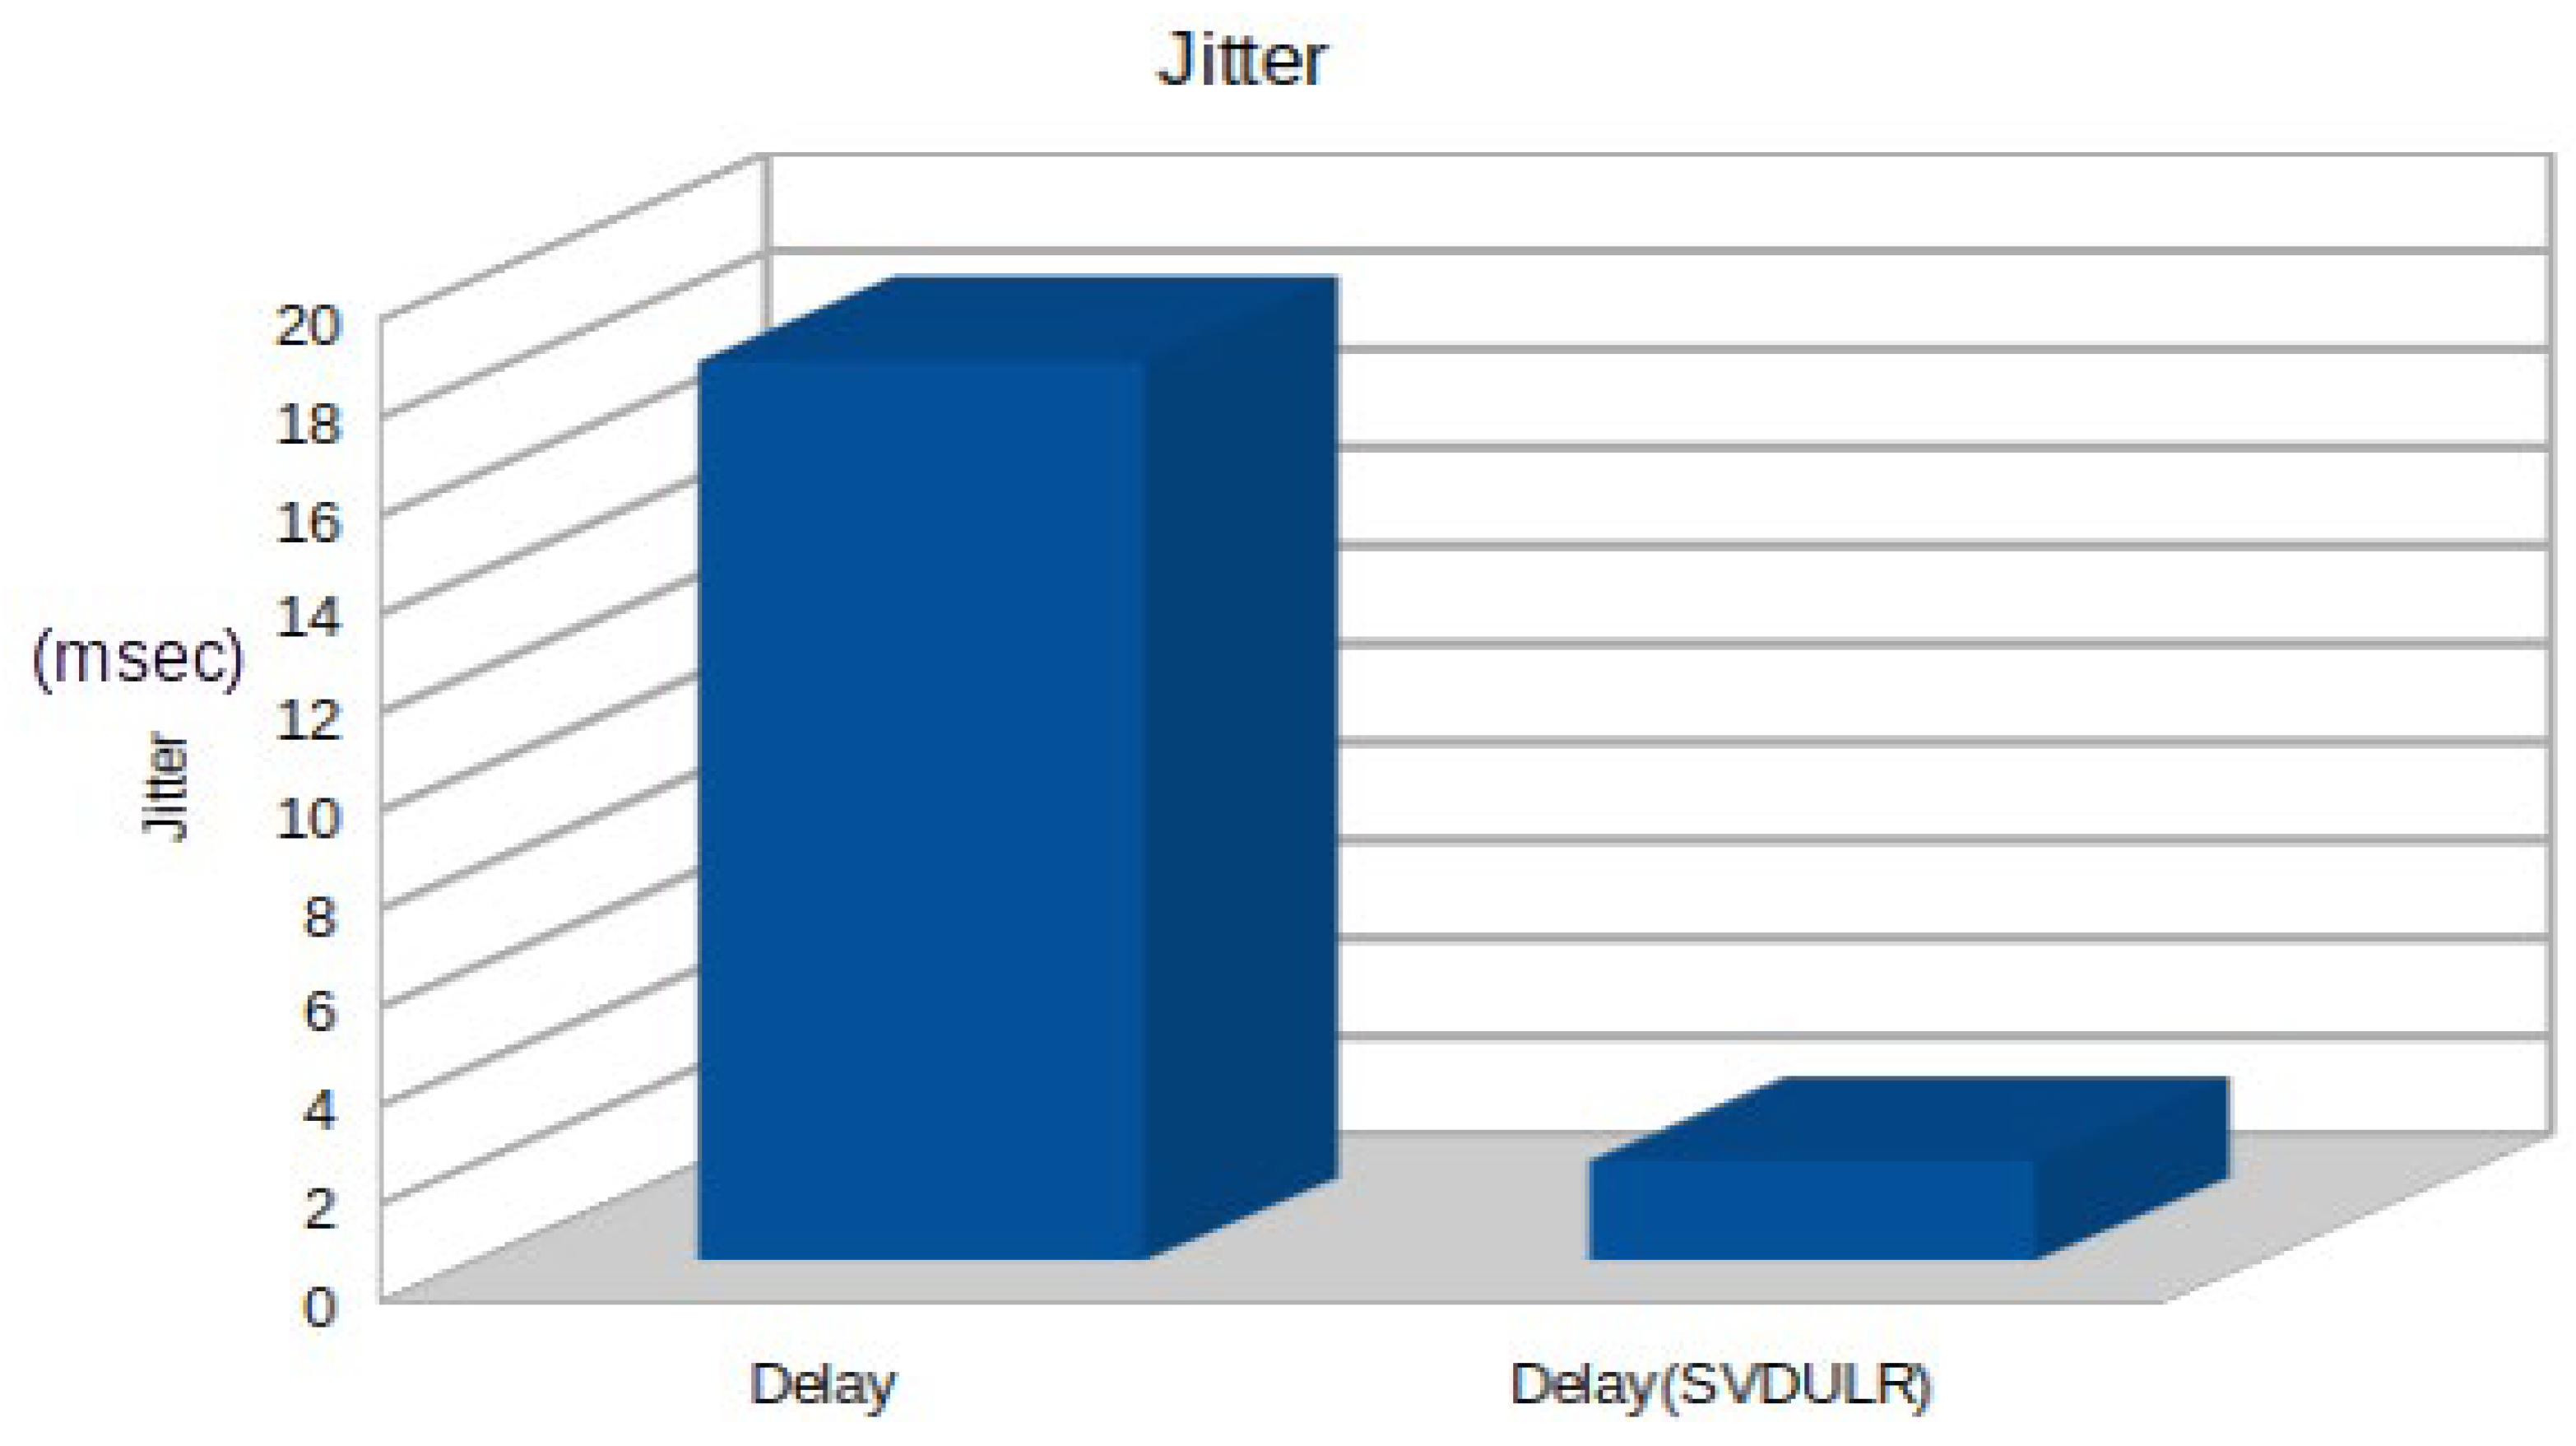
4.3.6. Jitter
The term jitter refers to the fluctuation of delays between two points, causing multiple distinct delays at different times. In order to effectively analyse small system configuration changes that could potentially cause delays, it is crucial to have a strong grasp of variation. In a system that handles time-sensitive activities like live streaming, it's crucial to have a deep understanding of subtle distinctions. Packets can experience varying delays as they traverse between nodes. Figure 9 compares jitter variation between normal case and SVDULR.
Conclusions
The proposed work, “Connection-aware congestion identification in RLNC-based networks and its impact on QoS,” is a novel congestion identification and improvement method. In this work, we stressed the need for using different QoS parameters for deciding the fate of a node as congested. The outcome of our results proves this outlook. We do not claim that the coefficient of variation is the only benchmark for evaluating and describing congestion in any network, but to highlight it as one of the choices. This is especially true in network conditions facing huge data analysis. Adding to this is the use of RLNC as the technique. As many wireless multicast networks are adopting random linear network coding (RLNC) as the better choice, due to the rise of the internet of things, 5G, and e-health. However, the large amount of data collected limits their performance, especially in networks with interactive video sessions. As future work, we can consider varying link probability as an independent parameter and monitor it’s effect again on various QoS parameters.
Acknowledgment
The authors wish to acknowledge that this work is not funded by any agency
Conflict of interest
The authors wish to acknowledge that they do not have any conflict of interest regarding any kind of funding towards this research work.Further, we do not share any personal relationships with other people or organisations that could inappropriately influence (bias) their work.
References
- A: Kushwaha, Ratneshwer Gupta,"Congestion control for high-speed wired network: A systematic literature review,Journal of Network and Computer Applications",Volume 45, (2014), Pages 62-78, ISSN 1084-8045. [CrossRef]
- Amit Grover, R. Mohan Kumar, Mohit Angurala, Mehtab Singh, Anu Sheetal, R. Maheswar,"Rate aware congestion control mechanism for wireless sensor networks",Alexandria Engineering Journal,Volume 61, Issue 6,(2022),Pages 4765-4777,ISSN 1110 -0168. [CrossRef]
- Amin Shahraki, Amir Taherkordi, Øystein Haugen, Frank Eliassen,"Clustering objectives in wireless sensor networks: A survey and research direction analysis",Computer Networks,Volume 180,2020,107376,ISSN 1389-1286. [CrossRef]
- J. Liu, F. J. Liu, F. Liu and N. Ansari, "Monitoring and analyzing big traffic data of a large-scale cellular network with Hadoop" in IEEE Network, vol. 28, no. 4, pp. 32-39, July-14. 20 August 2014. [CrossRef]
- Se-Hee Han, Myung-Sup Kim, Hong-Taek Ju, James Won-Ki Hong, "The architecture of NG-MON: A passive network monitoring system for high-speed IP networks",International Workshop on Distributed Systems: Operations and Management, Springer, 2002, pp. 16–27.
- Ehrlich, Marco & Biendarra, Alexander & Trsek, Henning & Wojtkowiak, Emanuel & Jasperneite, Juergen. . "Passive Flow Monitoring of Hybrid Network Connections regarding Quality of Service Parameters for the Industrial Automation" ,(2017.
- Yousaf, M.M. , Welzl, M., & Yener, B.," Accurate Shared Bottleneck Detection Based On SVD and Outliers Detection", TECHNICAL REPORT - NSG-DPS-UIBK-01, AUGUST 2008. [Google Scholar]
- Gul, Raja Sana,Ahmad, Dr Arbab Waheed.," Intelligent Congestion Control In Internet of Vehicles (IoV) employing Network Slicing in Beyond 5G (B5G) Architecture.", TechRxiv. Preprint. [CrossRef]
- Chakchai So-In, "A survey of network traffic monitoring and analysis tools", in: Cse 576m computer system analysis project, Washington University in St. Louis, 2009.
- Shahbaz Rezaei, Xin Liu," Deep learning for encrypted traffic classification: An overview", IEEE Commun. Mag. 57 (5) (2019) 76–81.
- Sadaf Mokhtari, Hamid Barati, Ali Barati,"A hierarchical congestion control method in clustered internet of things",The Journal of Super computing (2022) 78:11830–11855. [CrossRef]
- ElRakabawy, S.M. , Lindemann, C.,"Practical Rate-Based Congestion Control for Wireless Mesh Networks",David, K., Geihs, K. (eds) Kommunikation in Verteilten Systemen (KiVS). Informatik aktuell. Springer, Berlin, Heidelberg(2009). [CrossRef]
- Tsuzuki, S. , Yanagisawa, D., & Nishinari, K.," Effect of congestion avoidance due to congestion information provision on optimizing agent dynamics on an endogenous star network topology",(2022) Scientific Reports, 12(1), 1-16. [CrossRef]
- Syed abidhusain, Baswaraj Gadgay,"Effect of link failure on QoS parameters under the influence of field and generation size in wireless network",Tuijin Jishu/Journal of Propulsion Technology (2023)ISSN: 1001-4055 Vol. 44 No.
- Sreekrishna Pandi, Frank Gabriel and Juan A. Cabrera and Simon Wunderlich and Martin Reisslein and Frank H. P. Pandi,“PACE: Redundancy Engineering in RLNC for Low-Latency Communication"(2017)IEEE Access,volume 5, pages, 20477-20493.
- R. Zhang, J. R. Zhang, J. Zhang, L. Liu, Z. Yan and M. Dong, "Research on Active Detection Method of Network Congestion," GLOBECOM,(2022) IEEE Global Communications Conference, Rio de Janeiro, Brazil, 2022, pp. 4685-4690. [CrossRef]
- T. Kavitha, N. T. Kavitha, N. Pandeeswari, R. Shobana, V.R. Vinothini, K. Sakthisudhan, A. Jeyam, A. Jasmine Gnana Malar,"Data congestion control framework in Wireless Sensor Network in IoT enabled intelligent transportation system",Measurement, 2022; e24. [Google Scholar] [CrossRef]
- J. Alejandrino, R. J. Alejandrino, R. Concepcion, S. Lauguico, M. G. Palconit, A. Bandala and E. Dadios, "Congestion Detection in Wireless Sensor Networks Based on Artificial Neural Network and Support Vector Machine",2020 IEEE 12th International Conference on Humanoid, Nanotechnology, Information Technology, Communication and Control, Environment, and Management (HNICEM), Manila, Philippines, 2020, pp. 1-6. [CrossRef]
- Ma, T. , Pang, X., Zeng, S.et al.,"A hybrid congestion control scheme for Named Data Networking via SDN",Discov Appl Sci6, 246 (2024). [CrossRef]
- shahzad , rashid ali , amir haider and hyung seok kim,"Learning-Based Adaptive Sliding-Window RLNC for High Bandwidth-Delay Product Networks" ,IEEE access volume 11, 2023.
- Keke Wu, Bo Peng, Hua Xie and Shaobin Zhan,"A Coefficient of Variation Method to Measure the Extents of Decentralization for Bitcoin and Ethereum Networks",International Journal of Network Security, Vol.22, No.2, PP.191-200, Mar. 2020. [CrossRef]
- Shi, Xinyi & Lin, Hangfei.. "Research on the Macroscopic Fundamental Diagram for Shanghai urban expressway network",(2017) Transportation Research Procedia. 25. 1300-1316. [CrossRef]
- Esfahanizadeh, Homa & Adat Vasudevan, Vipindev & Kim, Benjamin & Siva, Shruti & Kim, Jennifer & Cohen, Alejandro & Médard, Muriel. (2024),"On the Benefits of Coding for Network Slicing", 1505-1510. [CrossRef]
- Liu, S. , Wu, D. & Zhang, LY.,"Sliding Mode-based Predictive Congestion Control in a Satellite Space Information Transmission Network",.Int. J. Control Autom. Syst.20, 2523–2533 (2022). [CrossRef]
- Wang, Z. , Zhuang, D., Li, Y., Zhao, J., & Sun, P. (2023).," ST-GIN: An Uncertainty Quantification Approach in Traffic Data Imputation with Spatio-Temporal Graph Attention and Bidirectional Recurrent United Neural Networks",2023 IEEE 26TH INTERNATIONAL CONFERENCE ON INTELLIGENT TRANSPORTATION SYSTEMS (ITSC), 1454-1459.
- Abbasloo, S. ,"Internet Congestion Control Bench marking",(2023) https://arxiv.org/abs/2307. 1005. [Google Scholar]
- Douglas, C. ,Elizabeth A,G. Geoffrey,“Introduction to linear regression analysis" Wiley5th edition.
Figure 1.
Congestion due to link failure or buffer overflow.
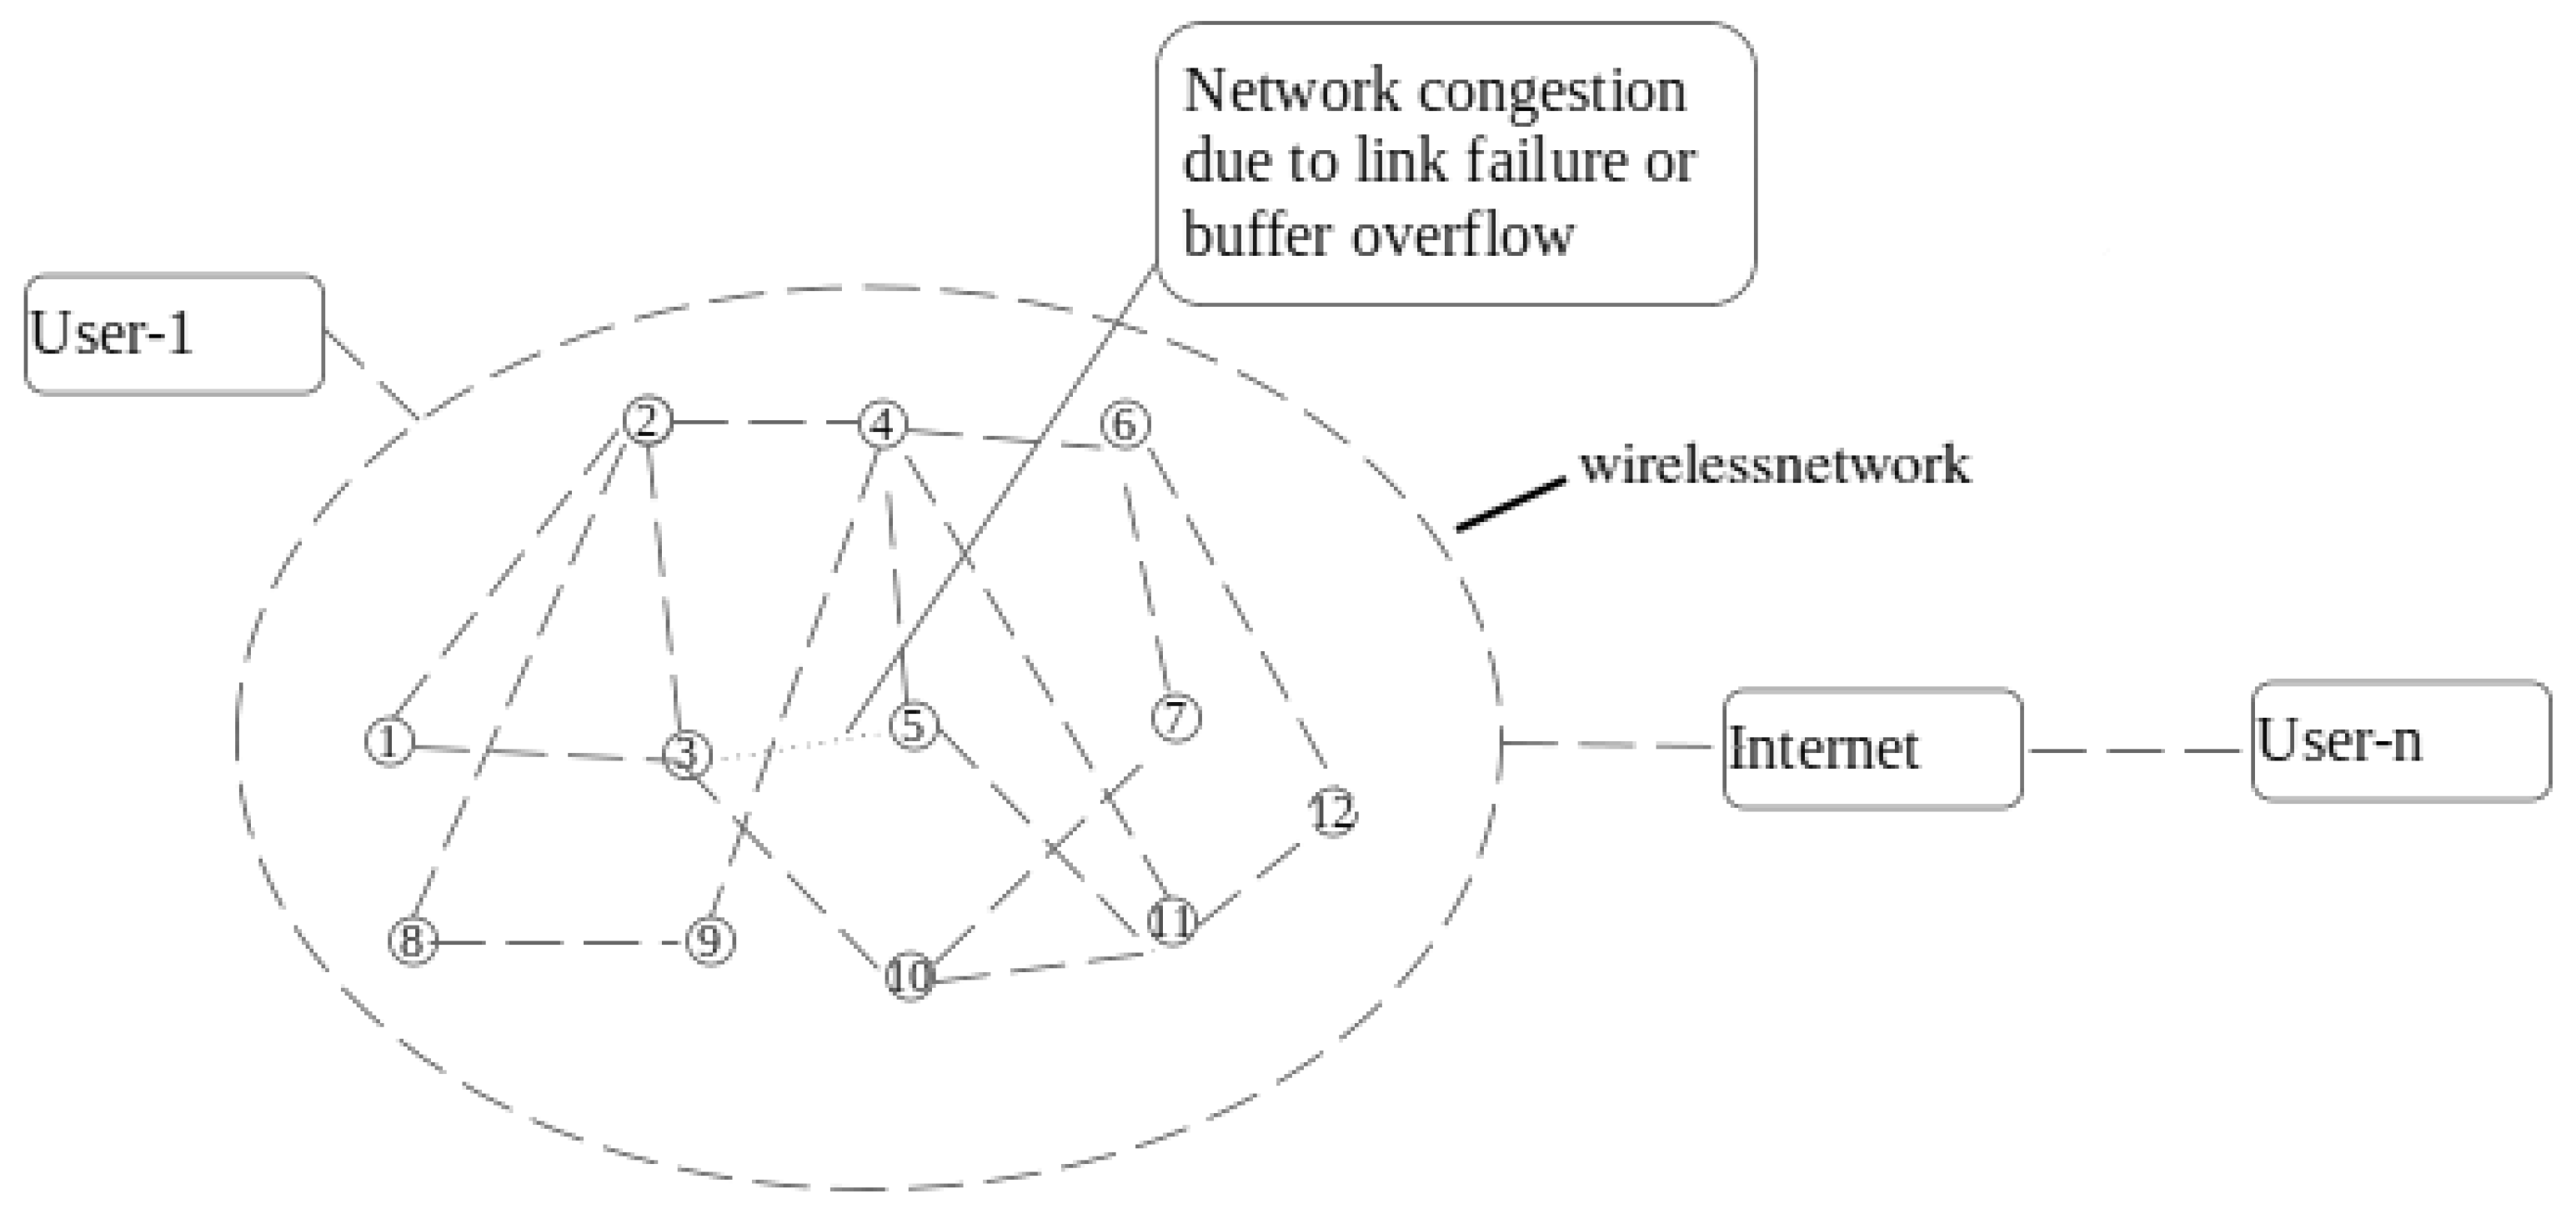
Figure 2.
ping command for checking network connectivity.
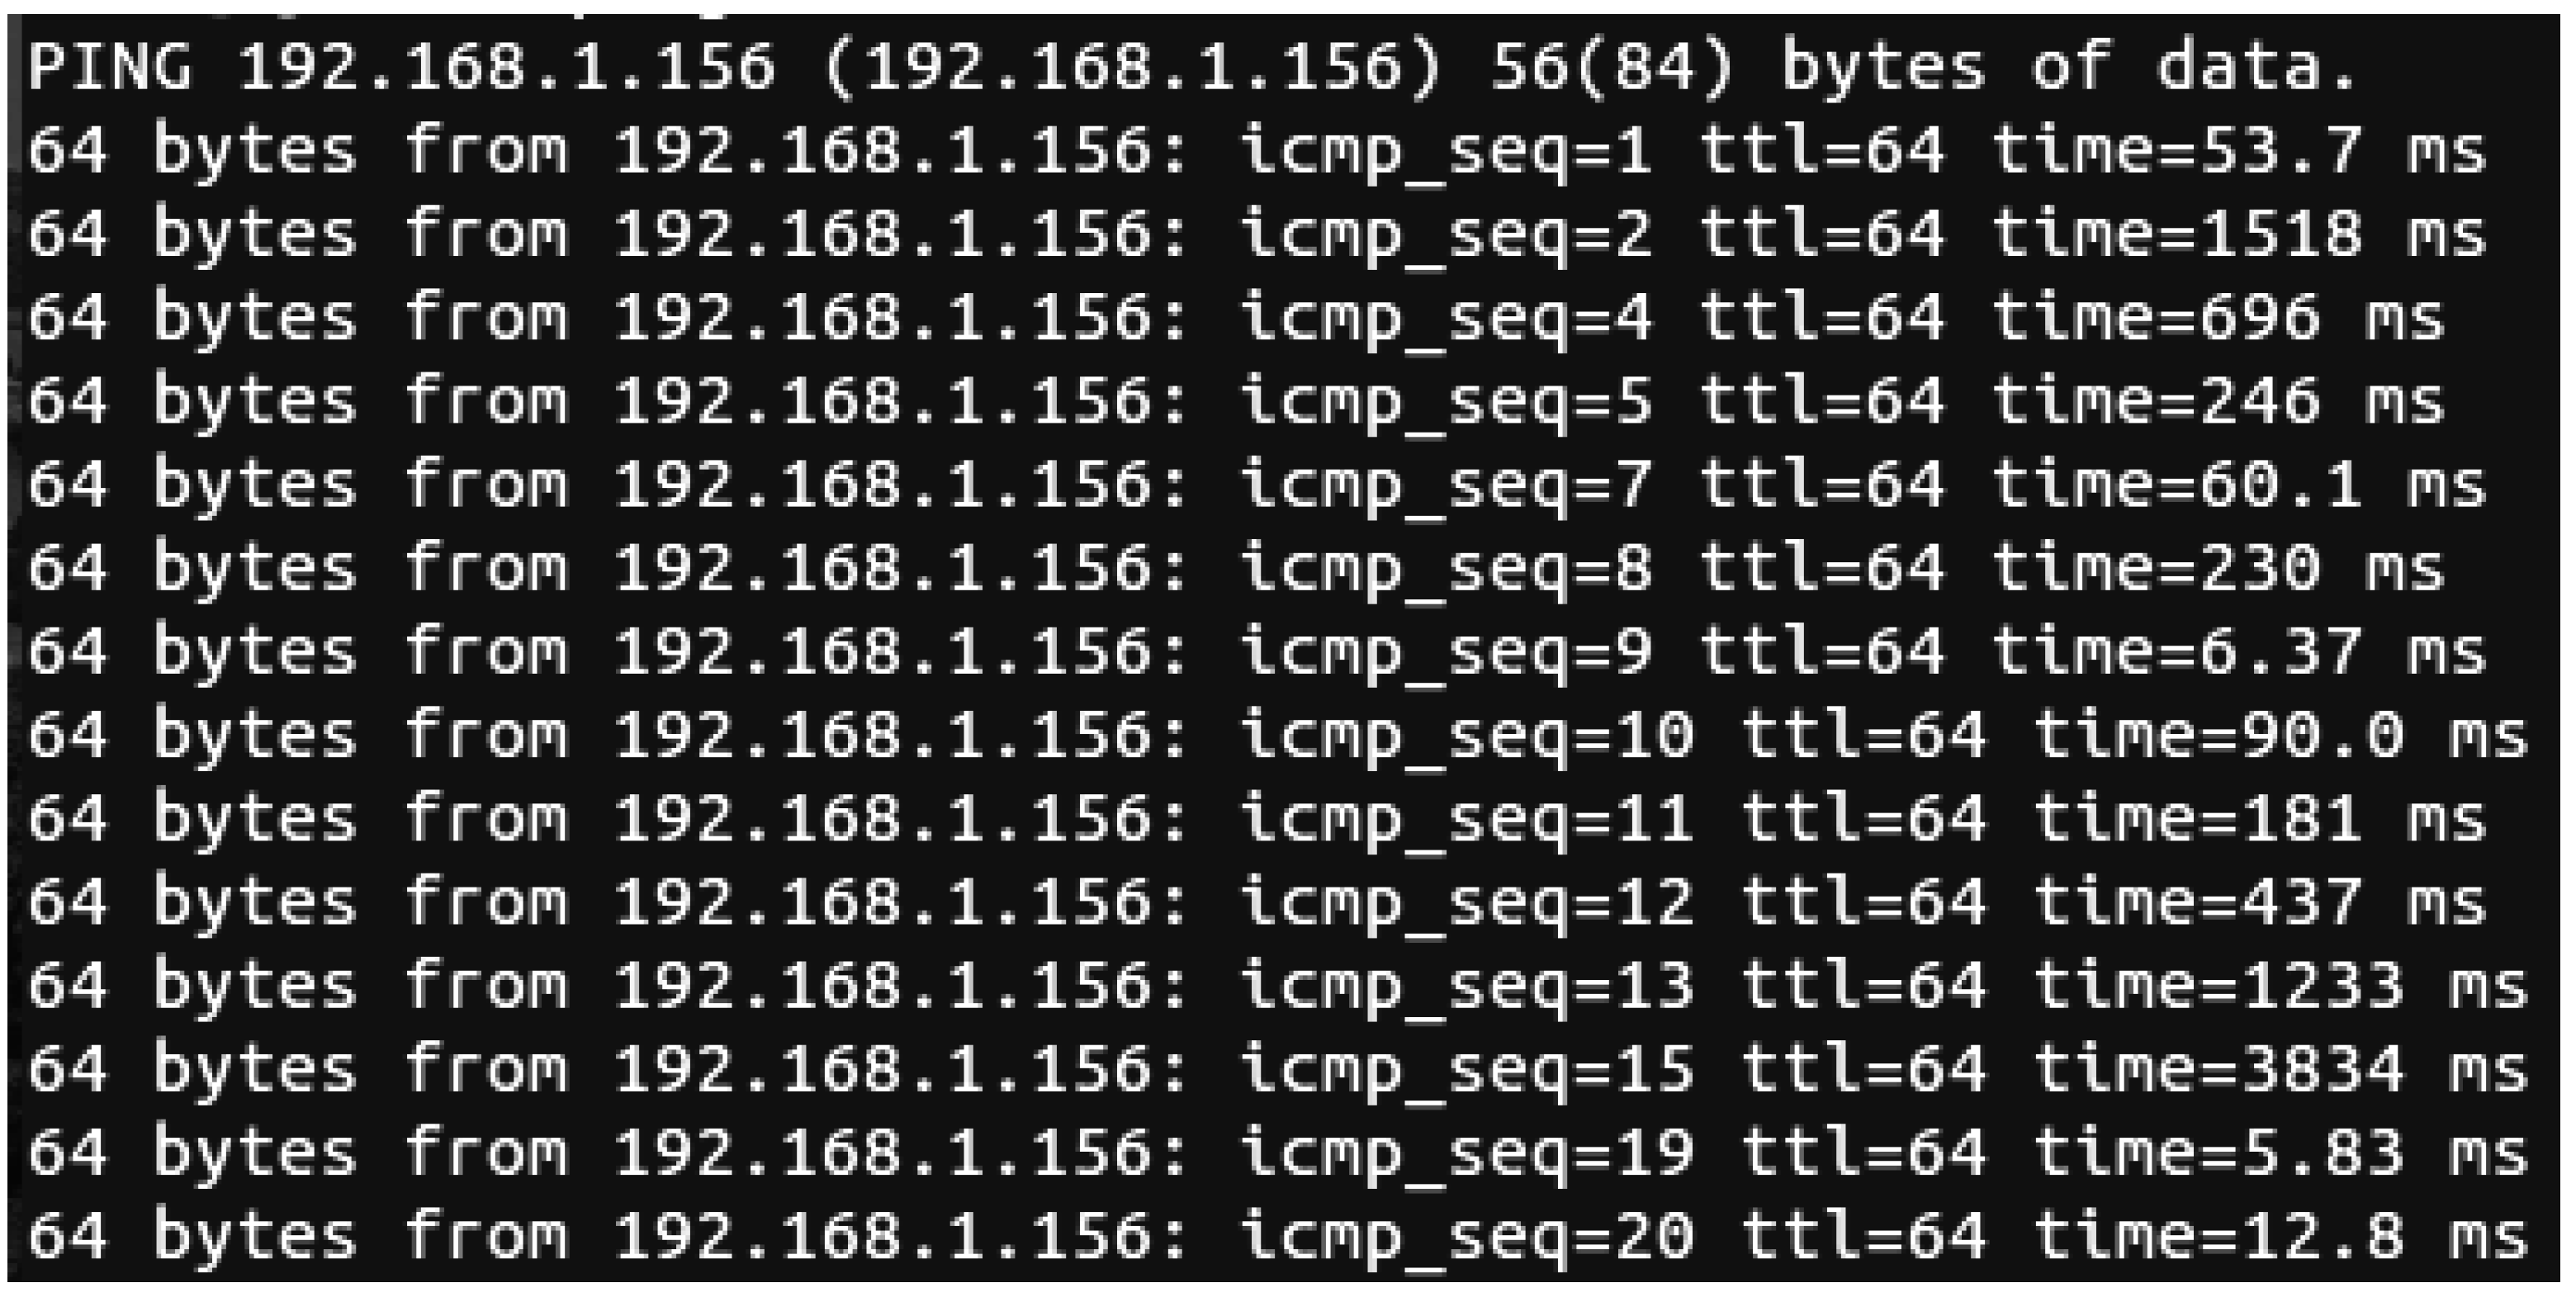
Figure 3.
Flow chart depicting the proposed congestion process.
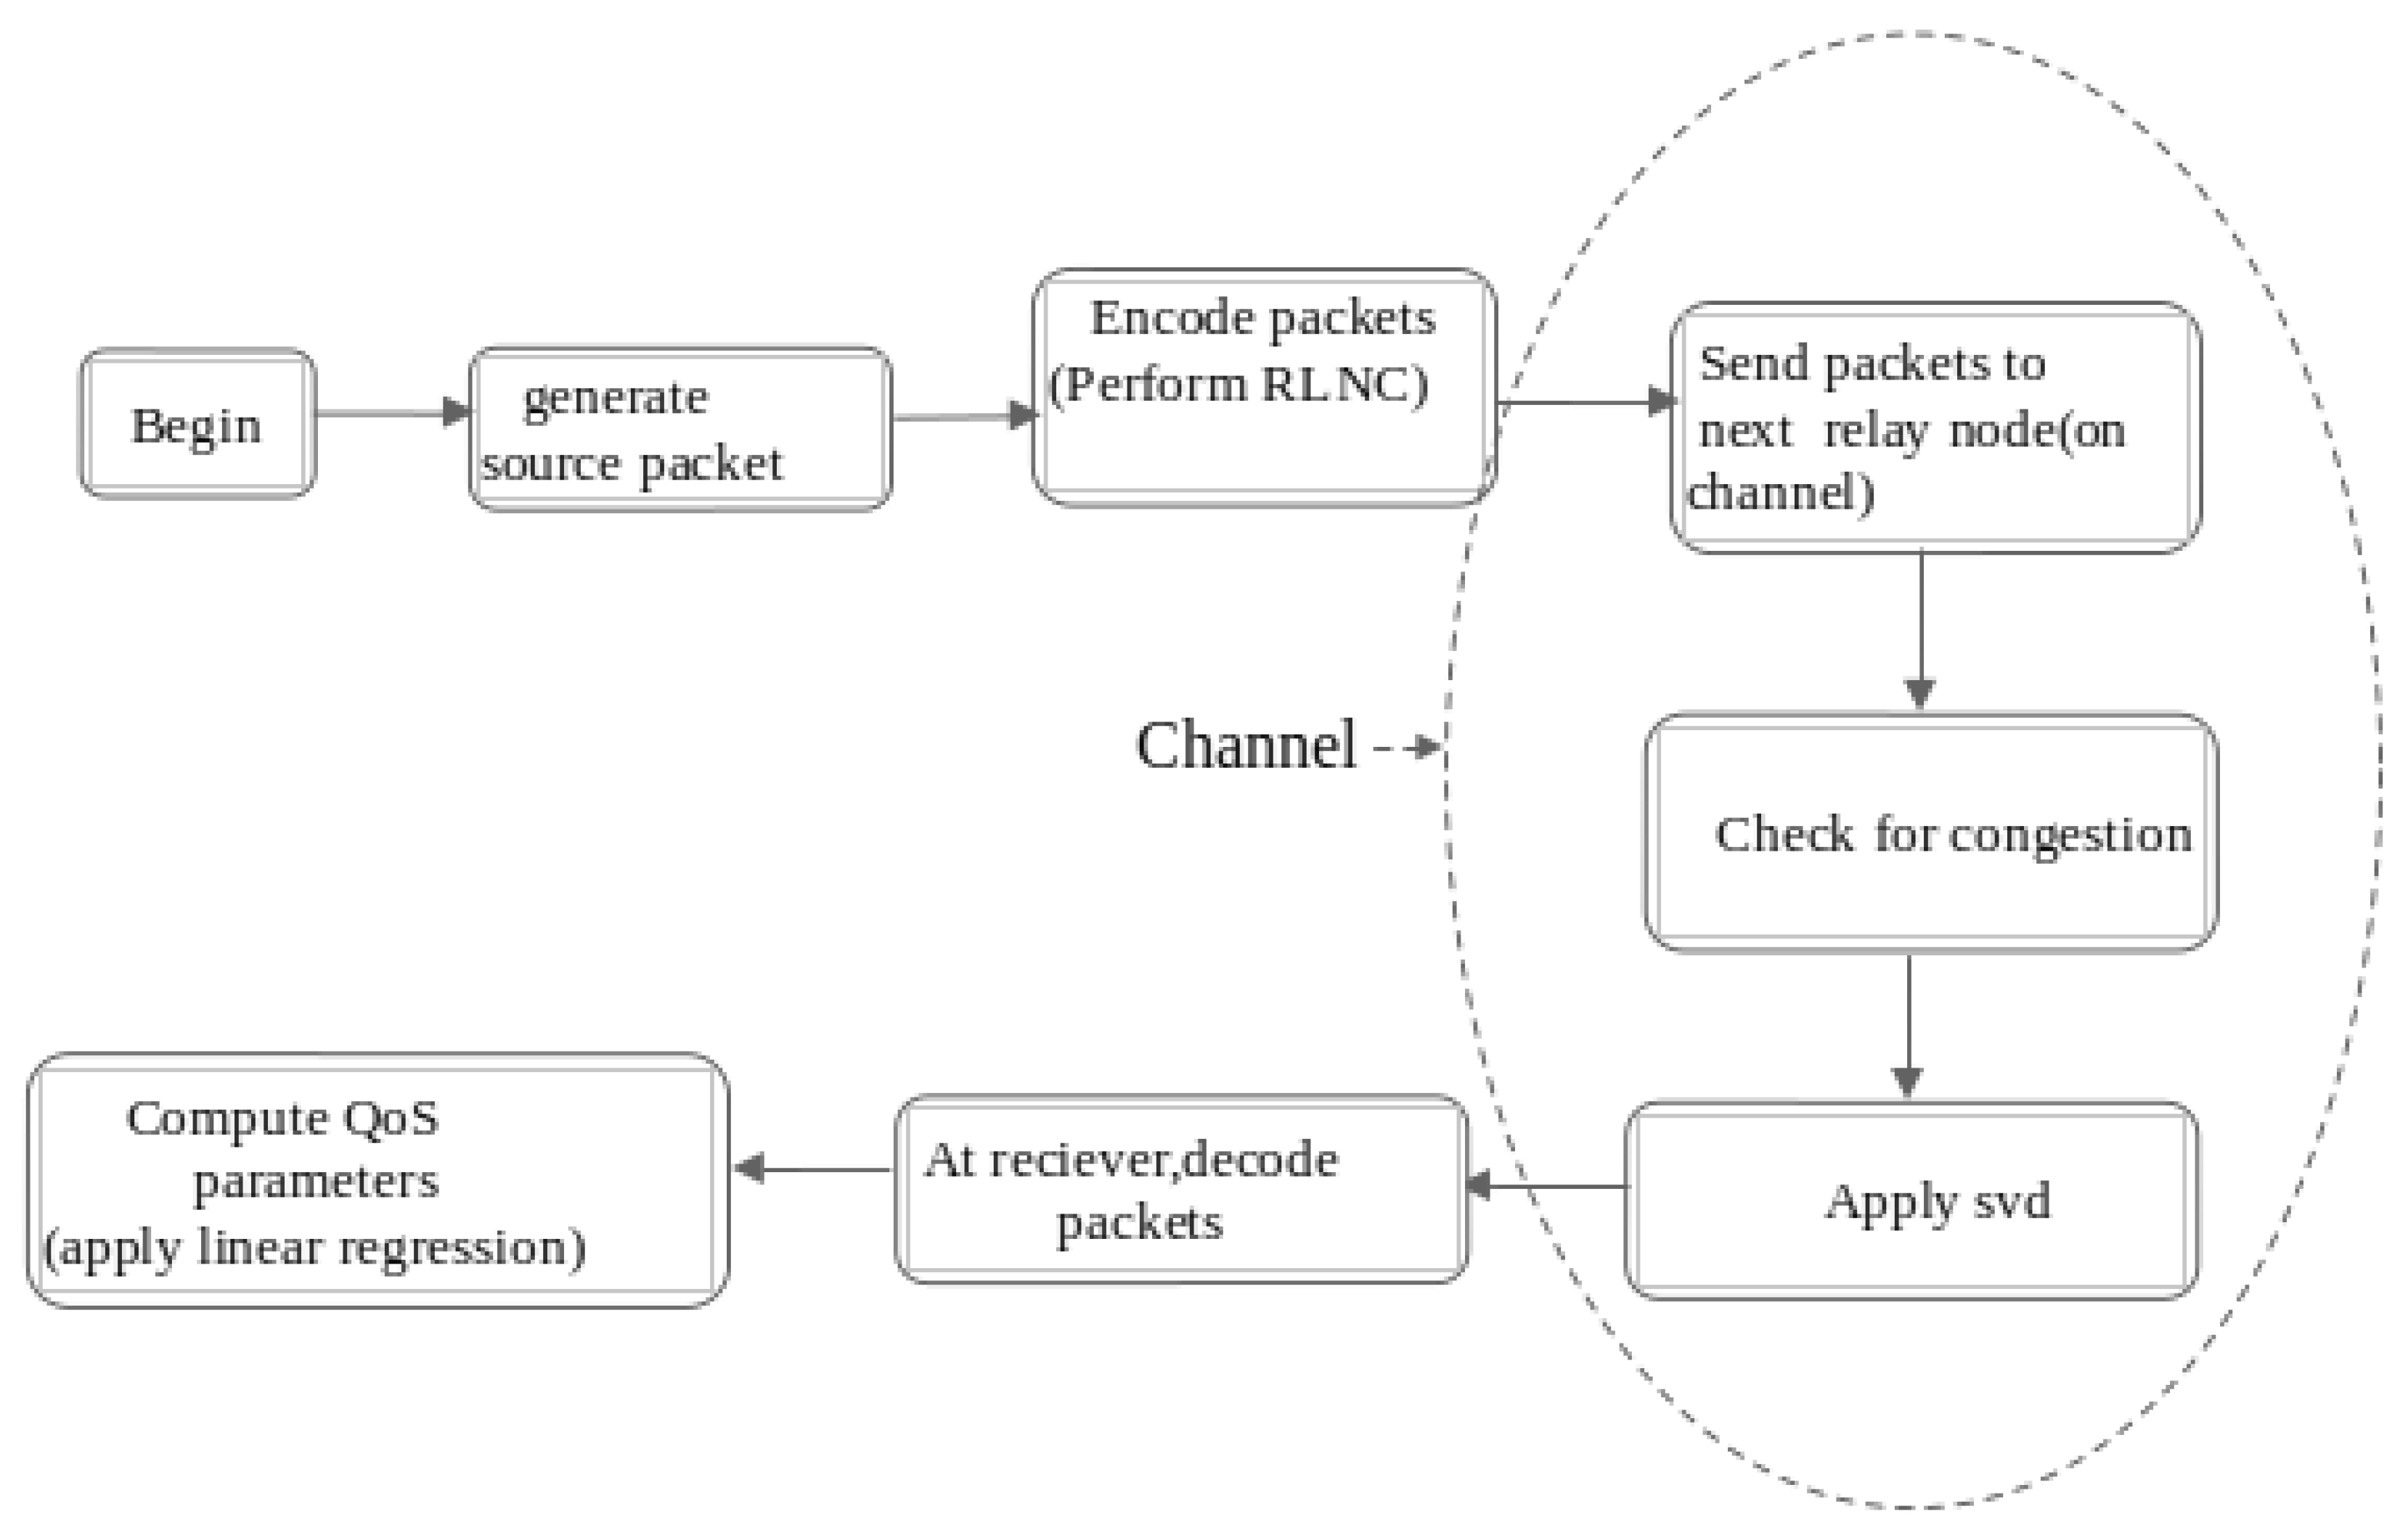
Figure 4.
Placement of nodes.
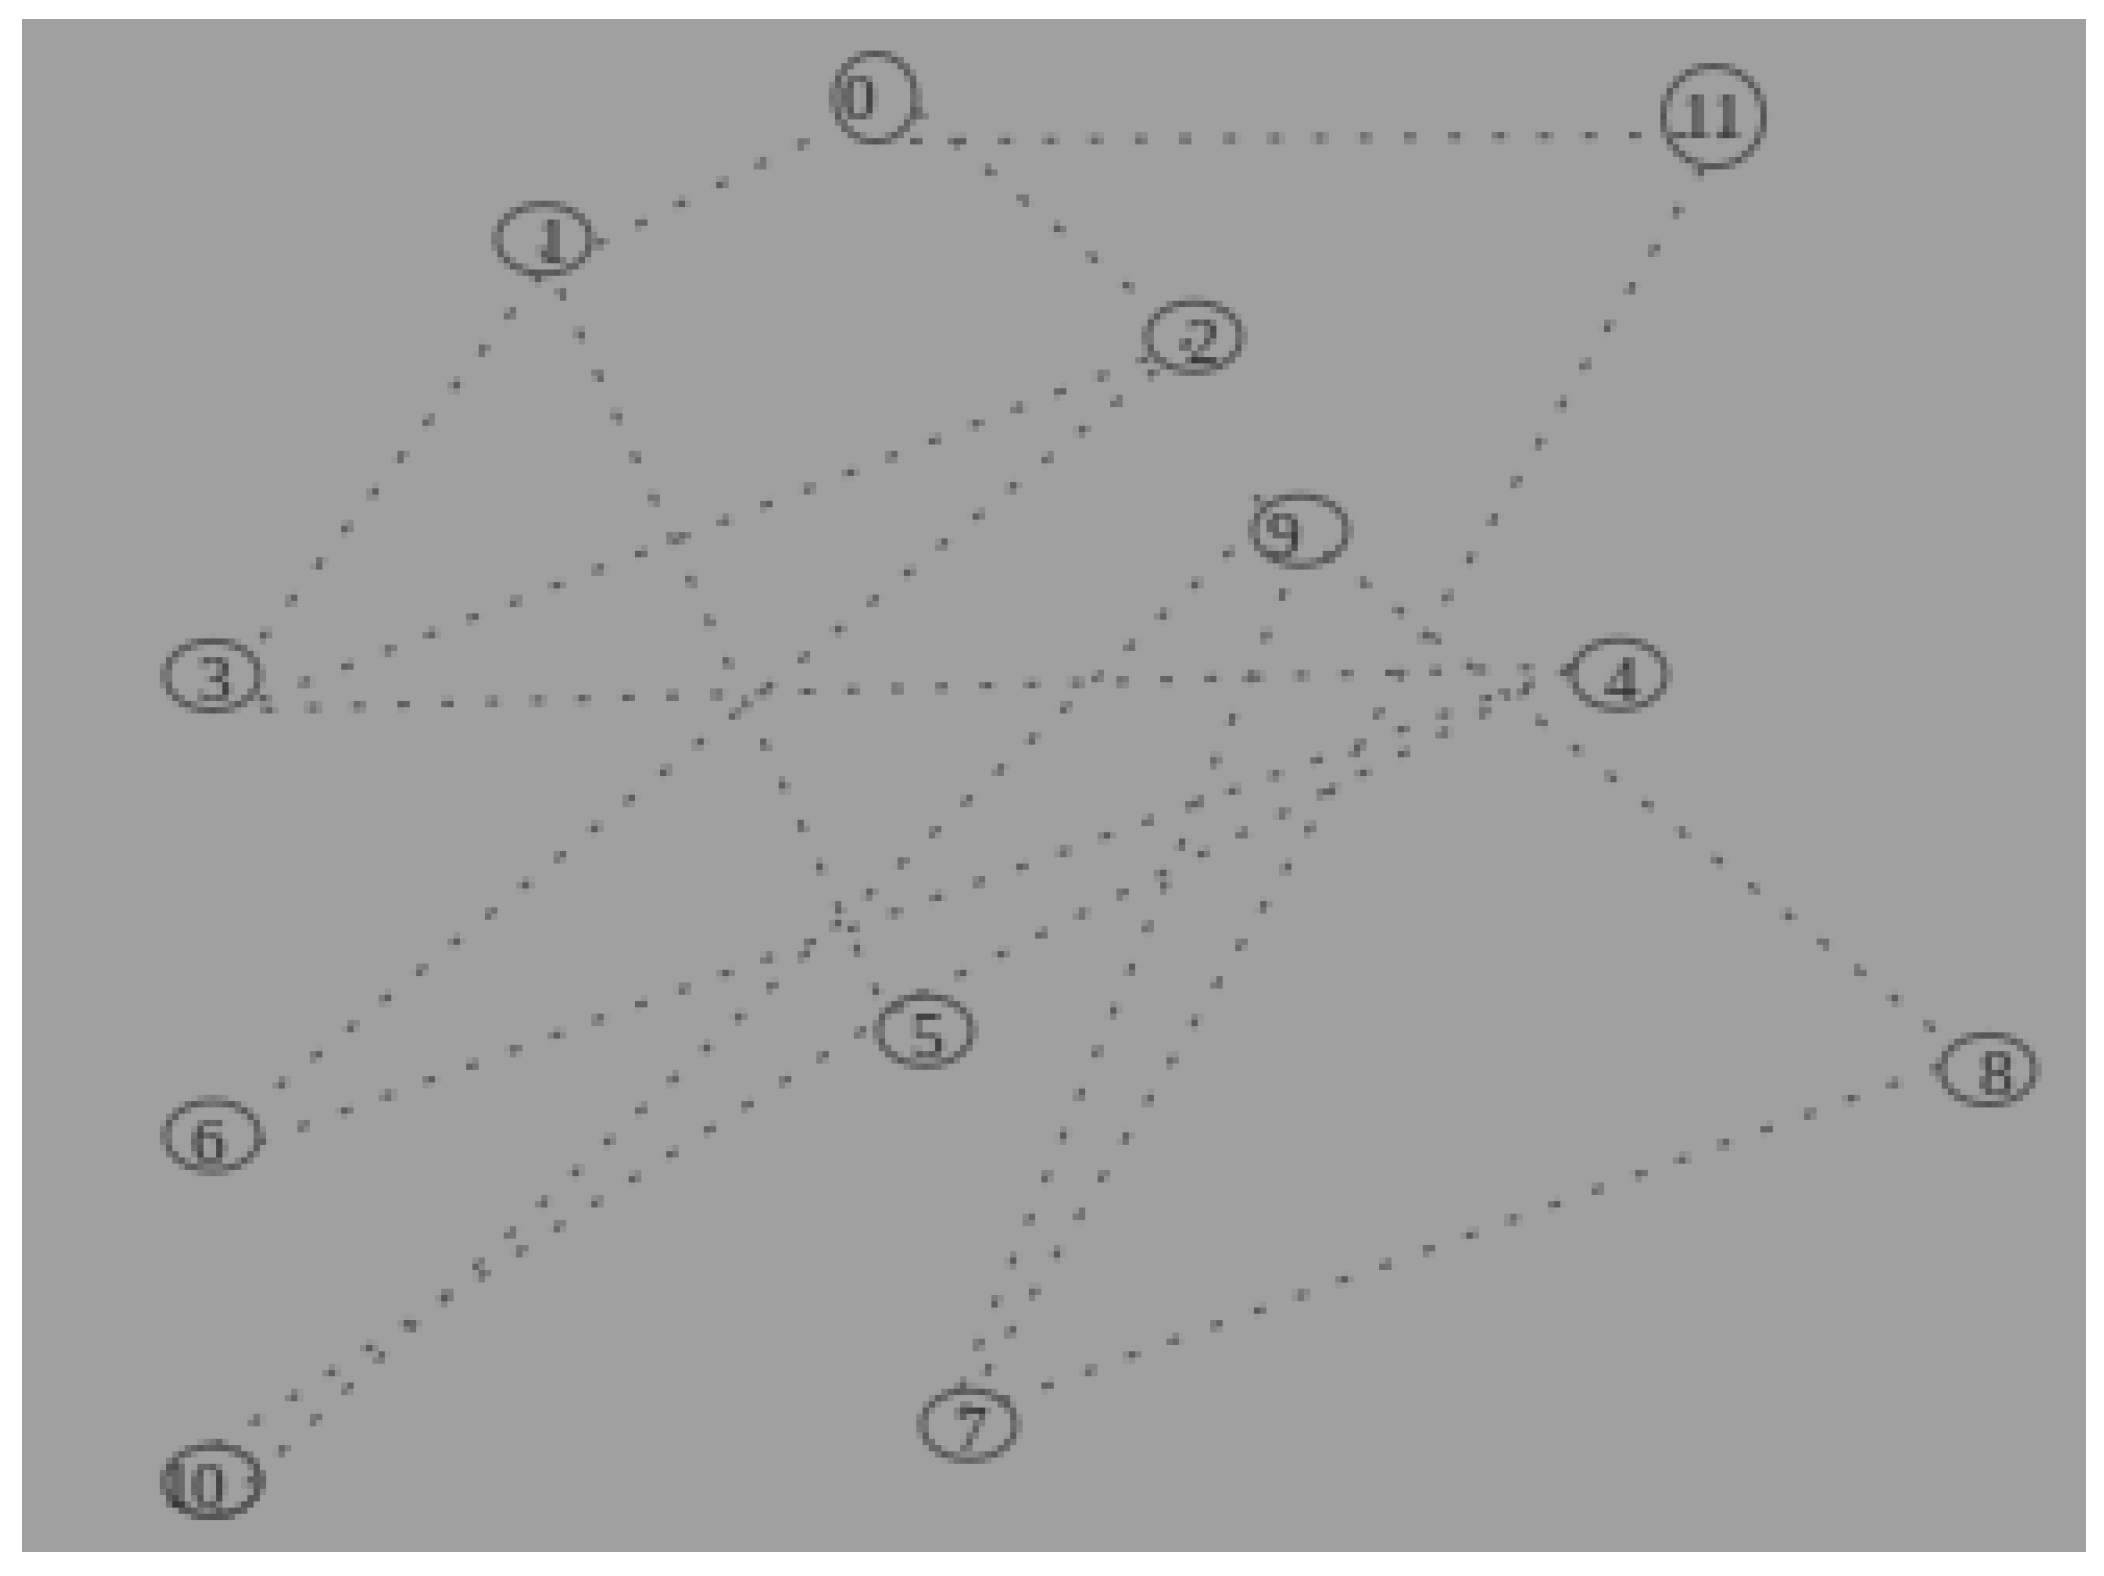
Figure 5.
(a):No of congested link verses Packet loss. (b):No of congested link verses Packet loss.
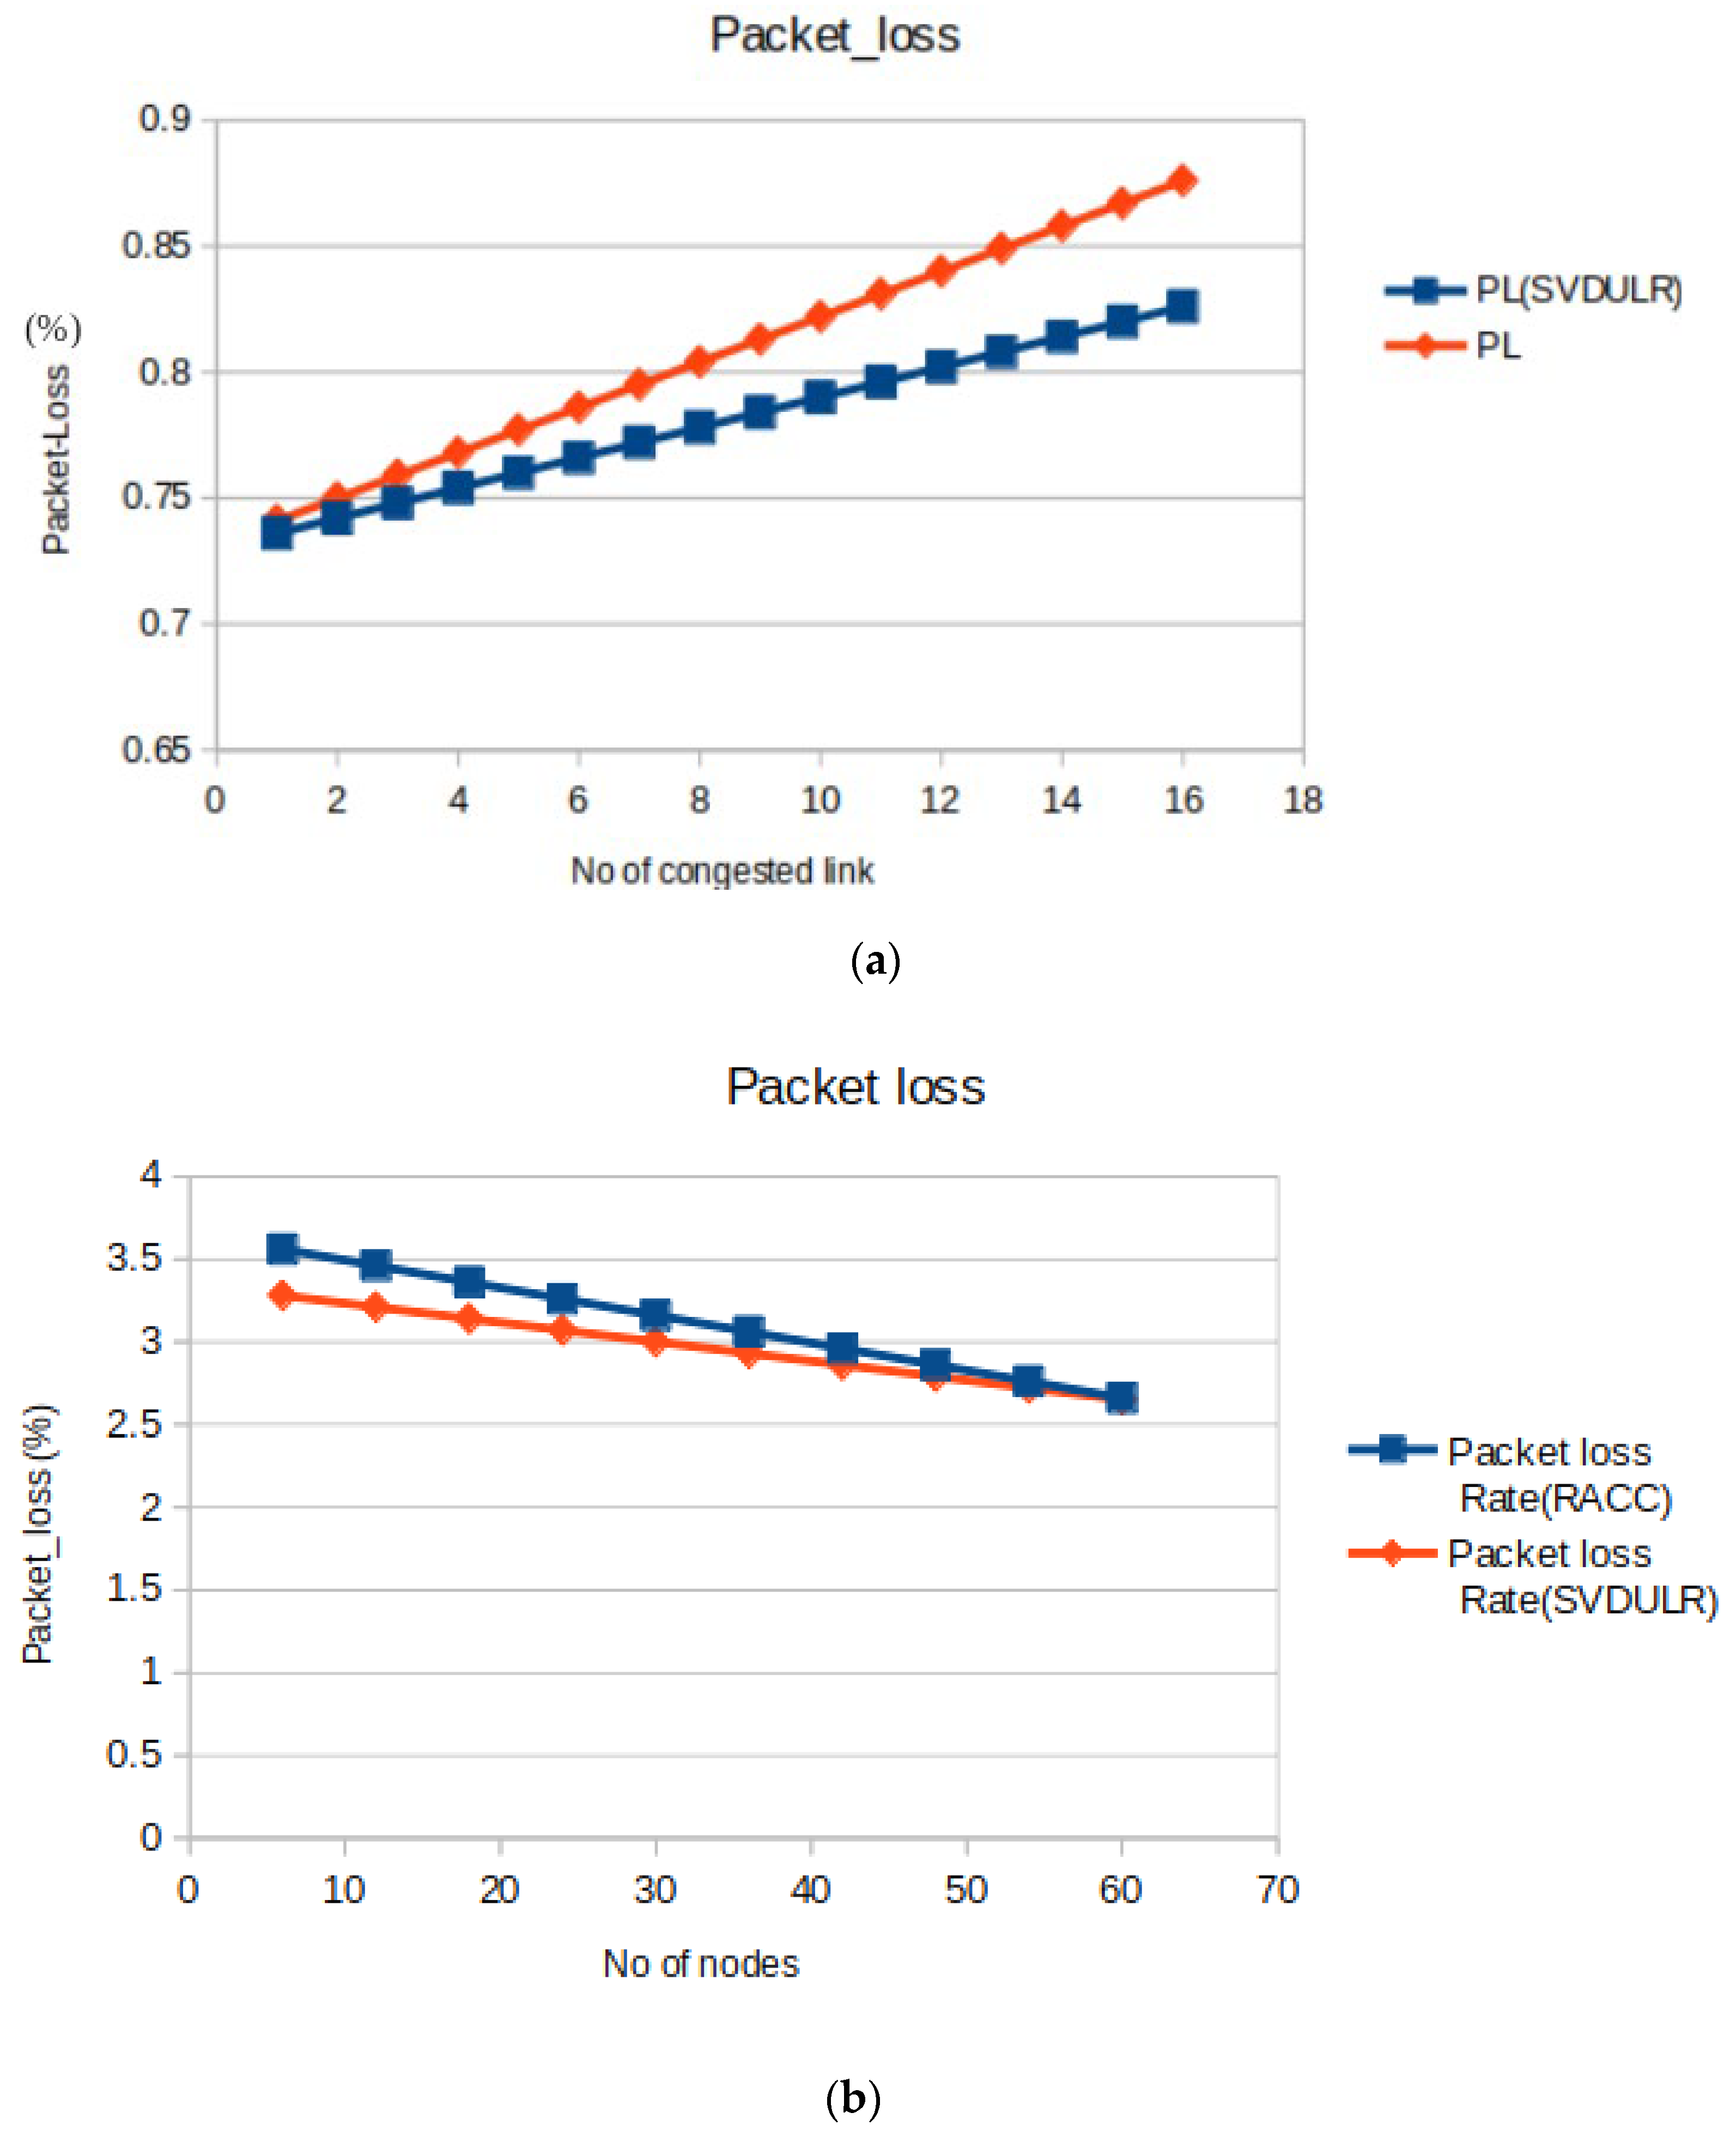
Figure 6.
No of congested link verses Entropy.
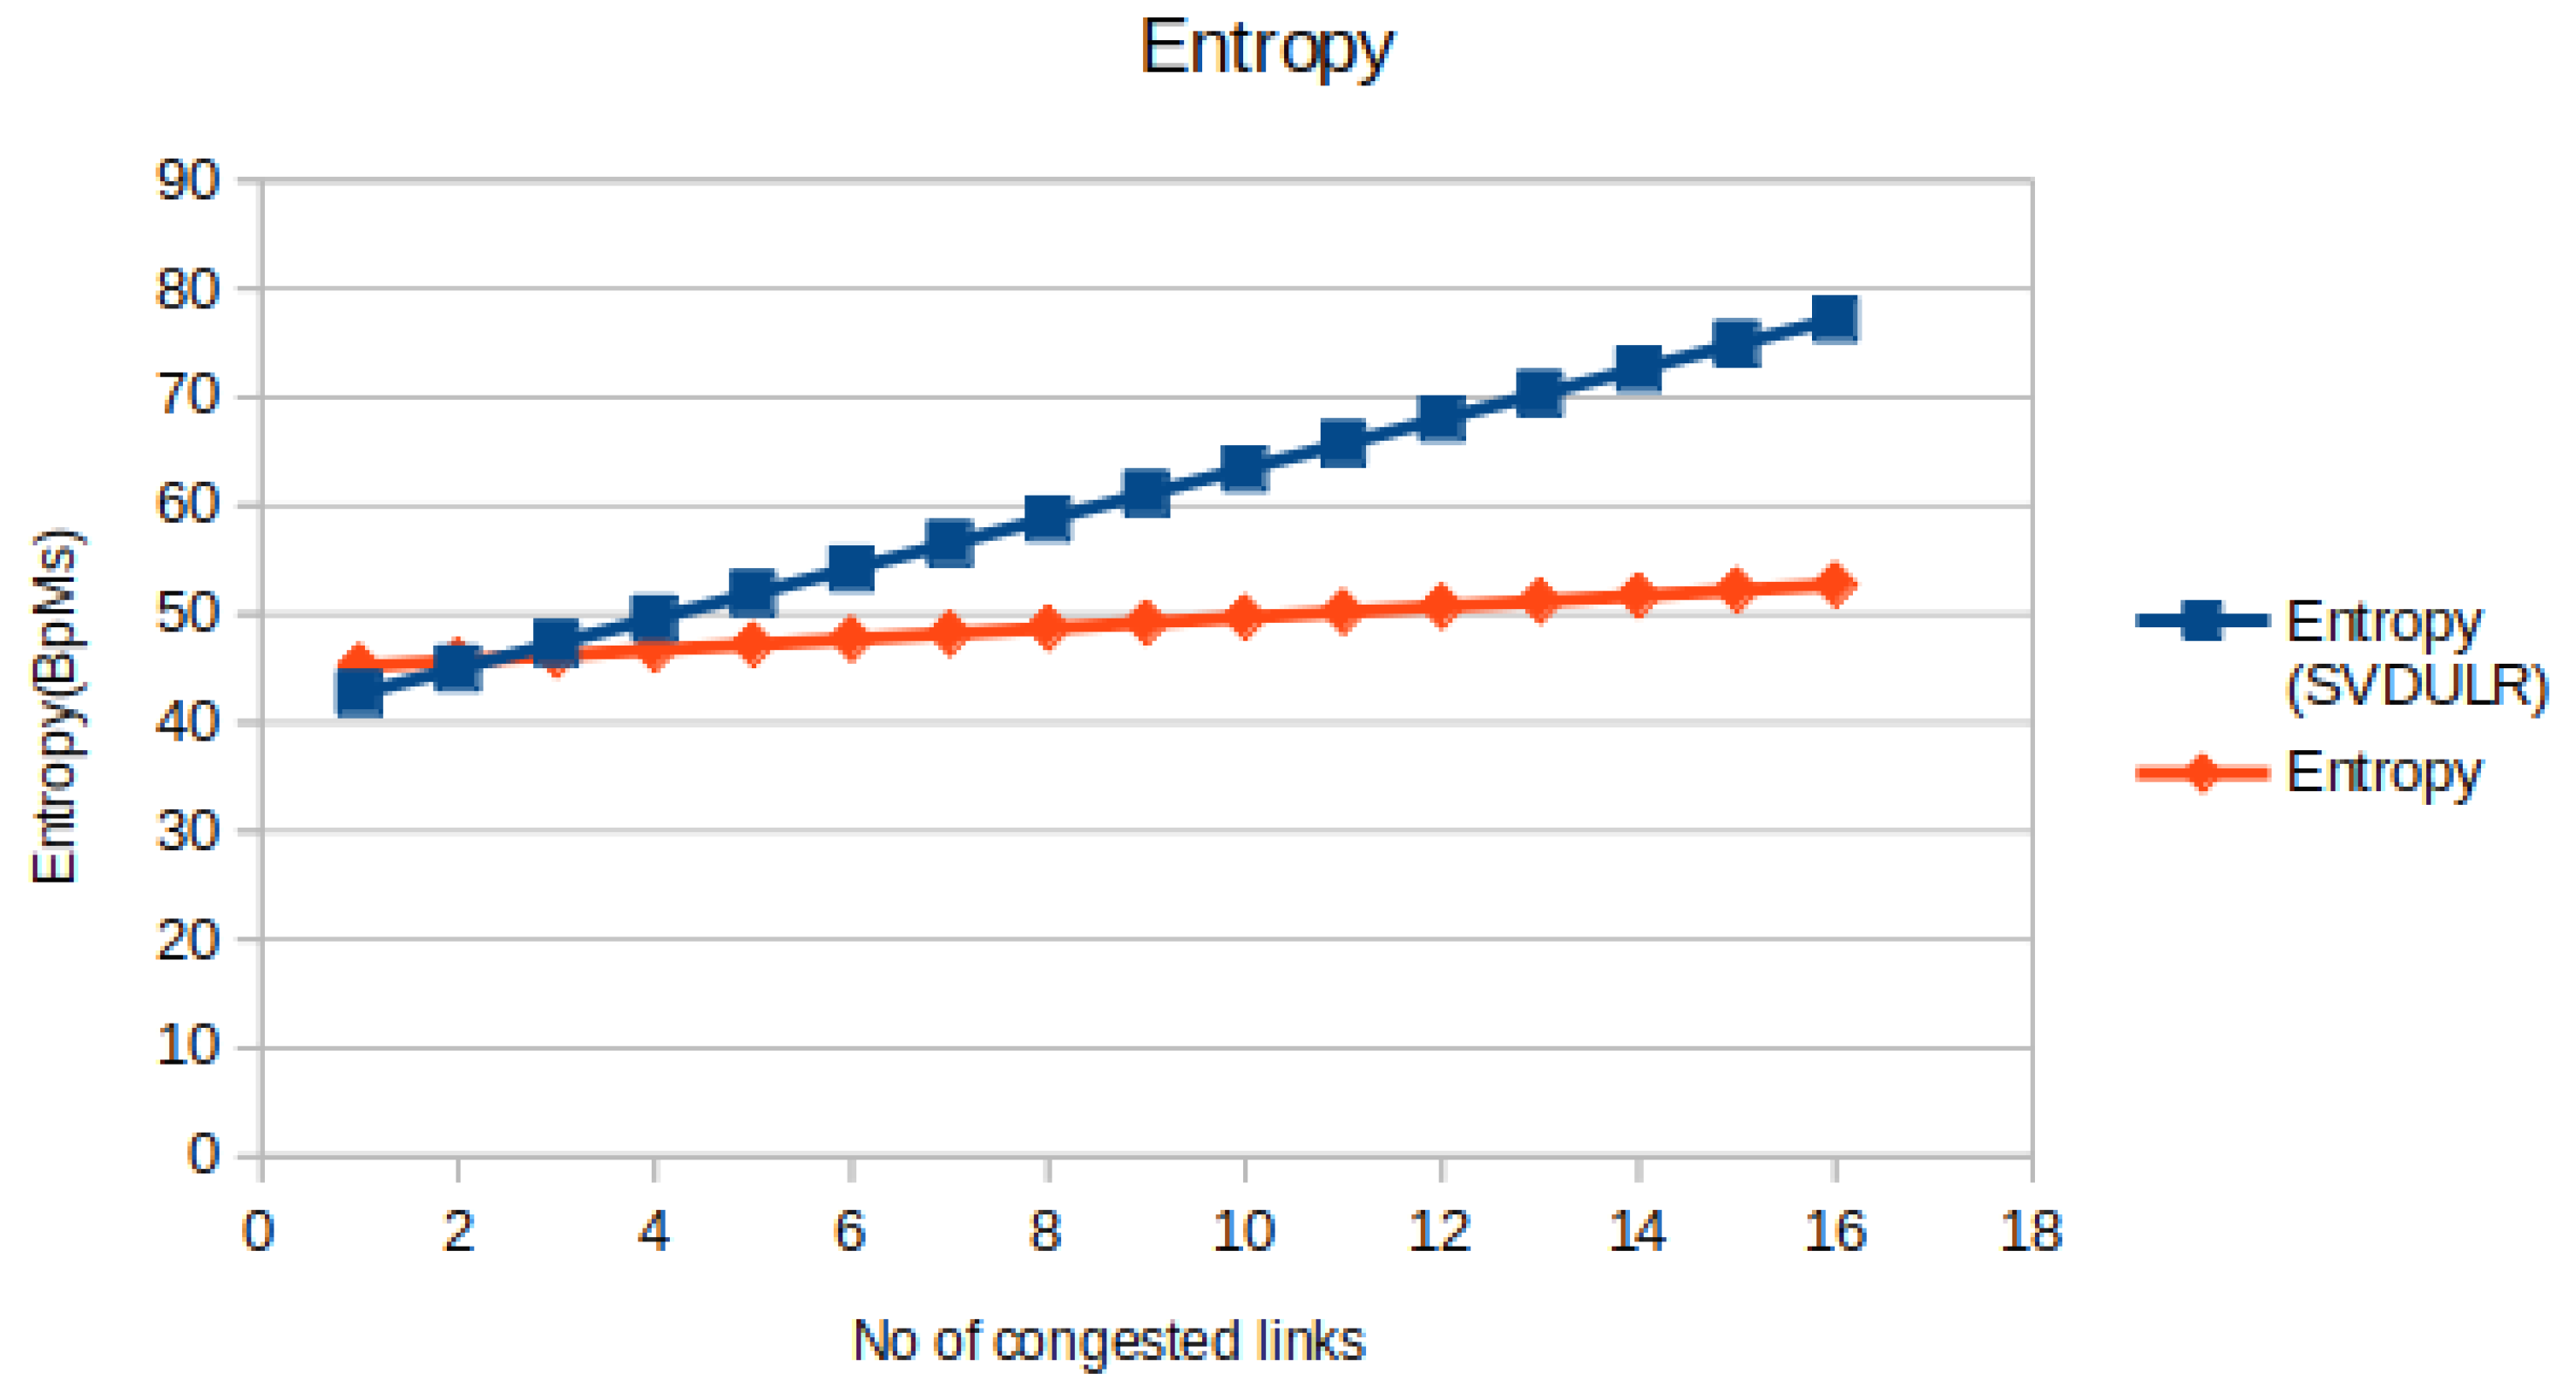
Figure 7.
No of congested link verses PDR.
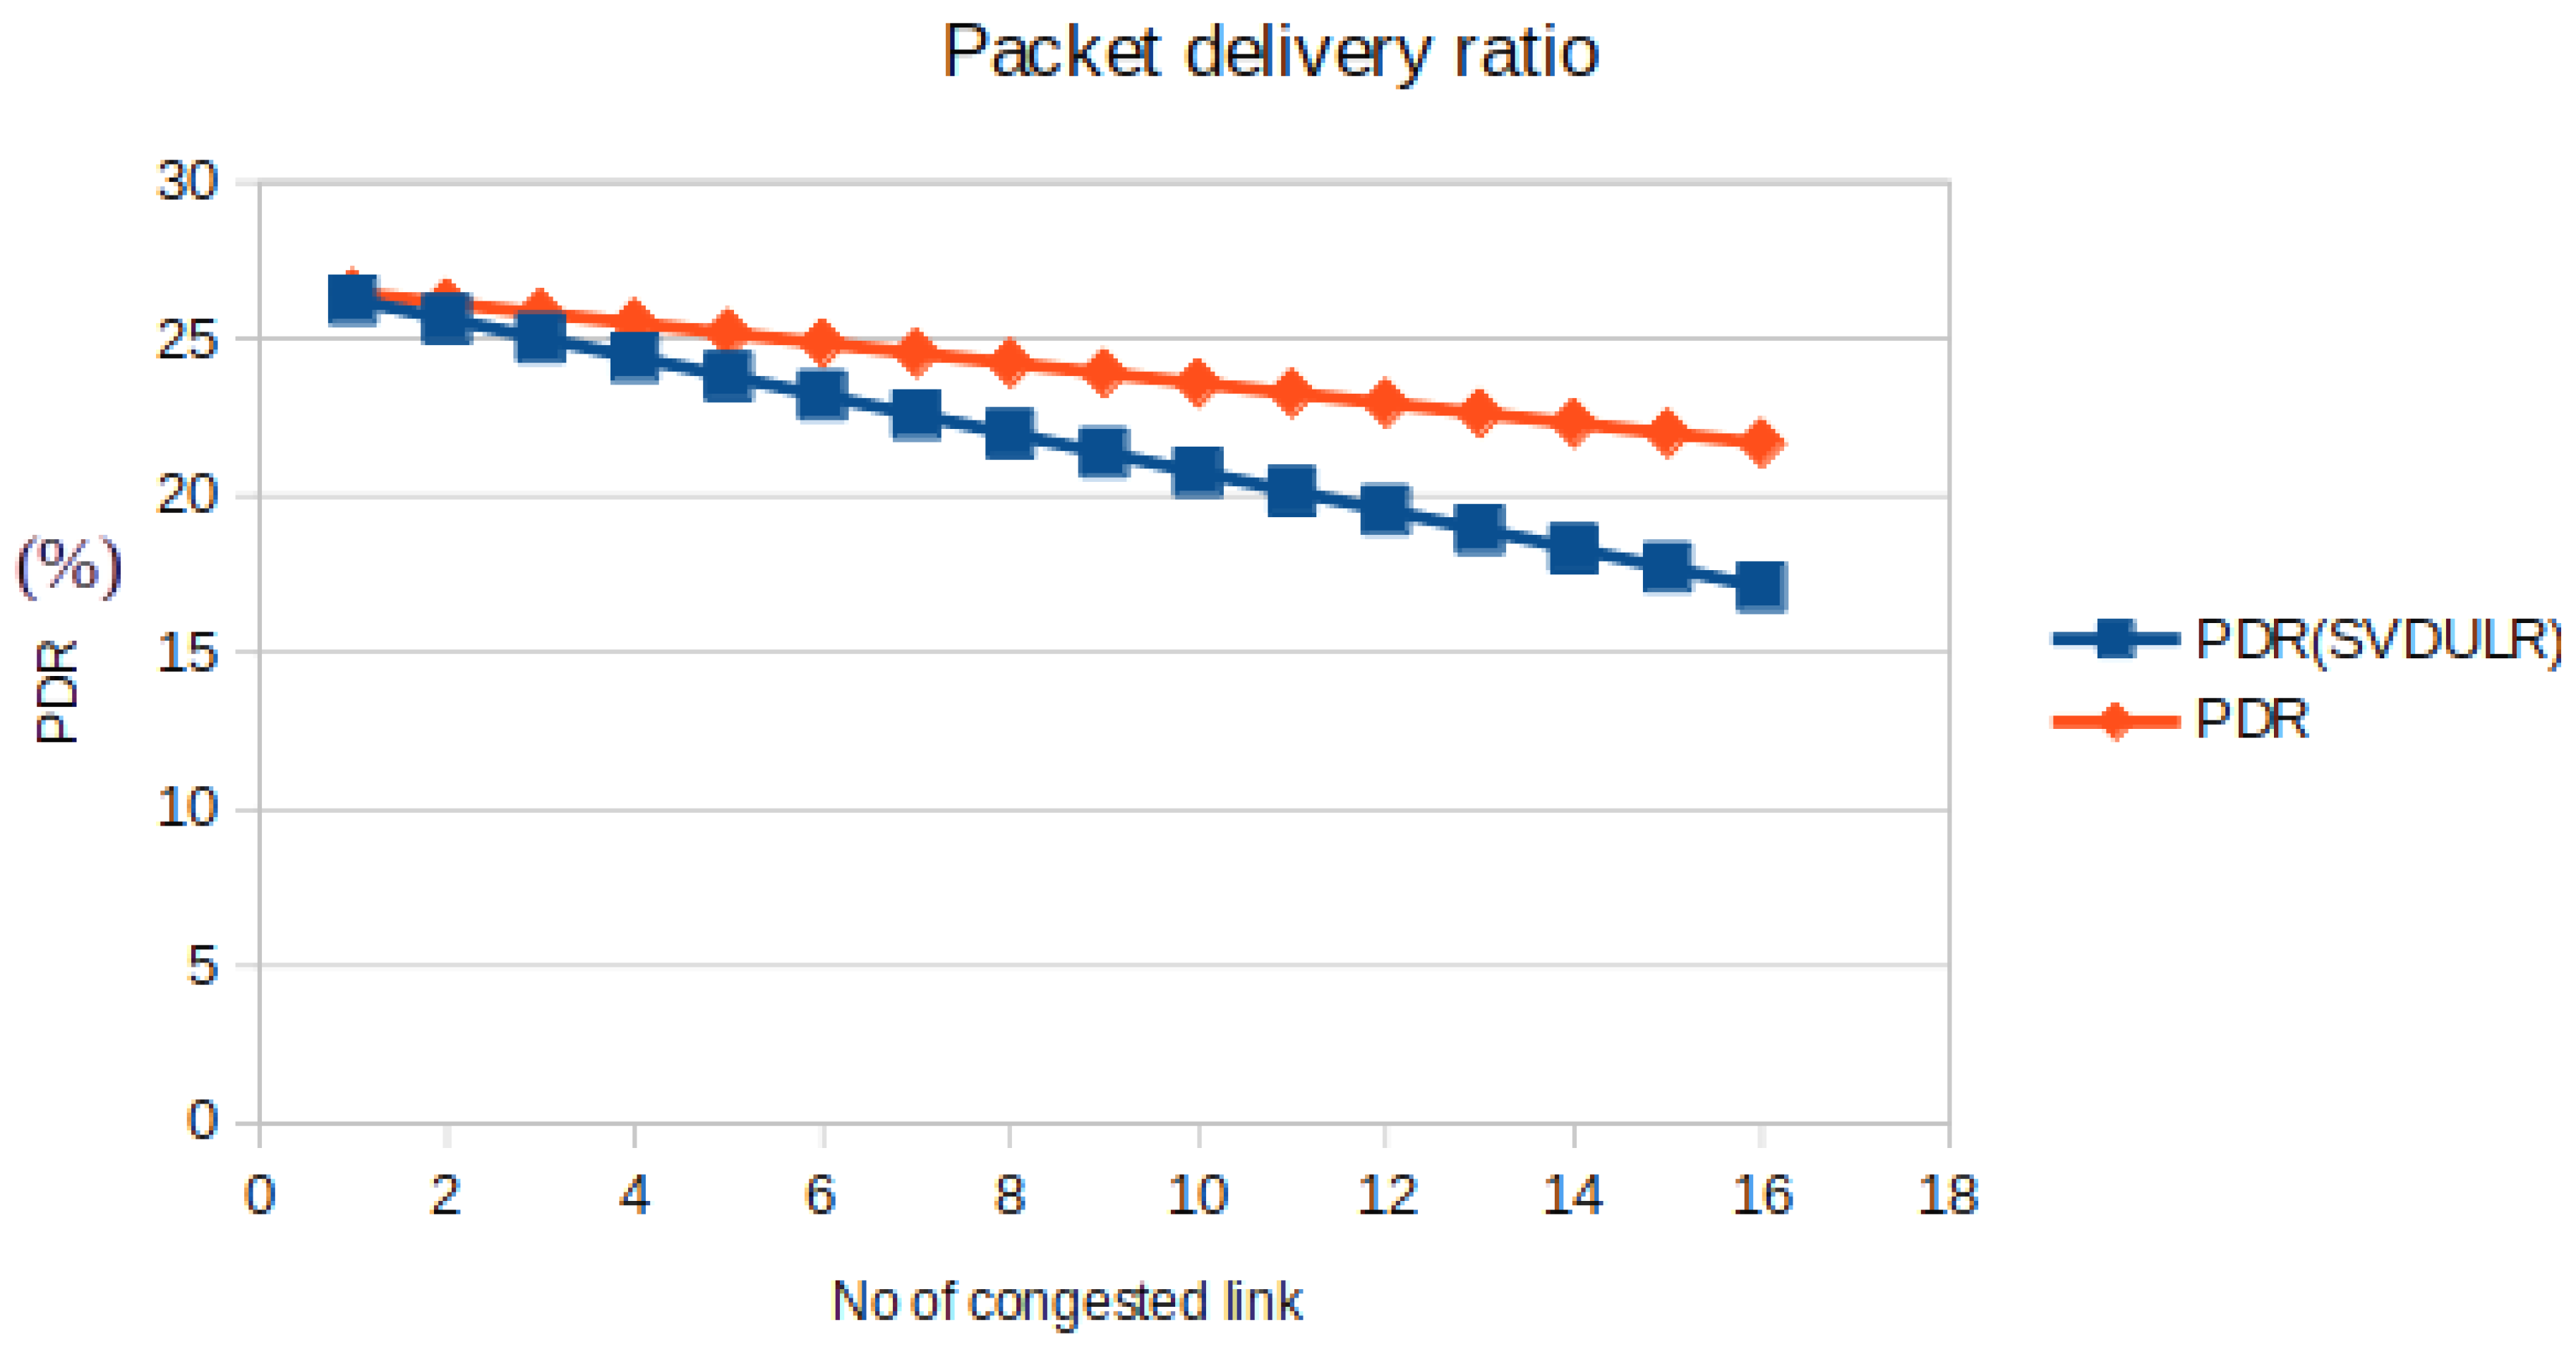
Figure 8.
No of cogested link verses delay.

Figure 9.
Jitter comparison.
Disclaimer/Publisher’s Note: The statements, opinions and data contained in all publications are solely those of the individual author(s) and contributor(s) and not of MDPI and/or the editor(s). MDPI and/or the editor(s) disclaim responsibility for any injury to people or property resulting from any ideas, methods, instructions or products referred to in the content. |
© 2025 by the authors. Licensee MDPI, Basel, Switzerland. This article is an open access article distributed under the terms and conditions of the Creative Commons Attribution (CC BY) license (http://creativecommons.org/licenses/by/4.0/).
Copyright: This open access article is published under a Creative Commons CC BY 4.0 license, which permit the free download, distribution, and reuse, provided that the author and preprint are cited in any reuse.


