Submitted:
28 September 2025
Posted:
29 September 2025
You are already at the latest version
Abstract
Large Language Models (LLMs) are emerging as powerful tools for automating business process modeling, promising to streamline the translation of textual process descriptions into Business Process Model and Notation (BPMN) diagrams. However, the extent to which these Al systems can produce high-quality BPMN models has not yet been rigorously evaluated. This paper presents an early evaluation of five LLM-powered BPMN generation tools, that automatically convert textual process descriptions into BPMN models. To assess the quality of these Al-generated models, we introduce a novel structured evaluation framework that scores each BPMN diagram across three key process model quality dimensions: clarity/readability, correctness, and completeness, covering both accuracy and diagram understandability. Using this framework, we conducted experiments where each tool was tasked with modeling the same set of textual process scenarios, and the resulting diagrams were systematically scored based on the criteria. This approach provides a consistent and repeatable evaluation procedure and offers a new lens for comparing LLM-based modeling capabilities. Our findings reveal that while current LLM-based tools can produce BPMN diagrams that capture the main elements of a process description, they often exhibit errors such as missing steps, inconsistent logic, or modeling rule violations, highlighting limitations in achieving fully correct and complete models. The clarity and readability of the generated diagrams also vary, indicating that these Al models are still maturing in generating easily interpretable process flows. We conclude that although LLMs show promise in automating BPMN modeling, significant improvements are needed for them to consistently generate both syntactically and semantically valid process models.
Keywords:
AI-assisted modeling
; bpmn
; business process modeling
; large language models
; process model quality
1. Introduction
The increasing capabilities of Large Language Models (LLMs) have significantly expanded the scope of tasks that can be addressed through artificial intelligence [1]. Among these, the automated generation of structured content from natural language inputs has gathered particular attention in domains that rely on formal representations, such as Business Process Management (BPM) [2]. As a discipline concerned with the design, execution, and optimization of organizational processes, BPM relies heavily on business process (BP) Modeling, and specifically on standardized notations like the Business Process Model and Notation (BPMN), the de facto standard for modeling BPs in industry. Creating high-quality BPMN models, however, remains a time-consuming and expert-driven task. Traditional modeling requires not only technical fluency in BPMN syntax but also the ability to translate textual process descriptions into logically sound and semantically accurate diagrams [3]. This translation process is prone to errors, omissions, and inconsistencies, especially when conducted under tight deadlines or by users without specialized training. In this context, LLMs offer a promising alternative [4]. Their ability to interpret unstructured text and generate structured outputs suggests a potential to produce early-stage modeling, enhance accessibility for non-expert users, and reduce the cognitive and technical load involved in formal model construction. Despite this potential, there is a notable lack of empirical evidence regarding the quality of BPMN diagrams generated by LLMs. While prior research has explored the use of LLMs for activity extraction or summarization tasks, the application of these models to the generation of complete and correct BPMN diagrams has received limited systematic evaluation [5]. In particular, key dimensions of model quality have not been sufficiently examined in the context of LLM-driven modeling tools.
To address this gap, this study undertakes a structured assessment of five LLM-based BPMN generation tools, that can convert textual process descriptions into BPMN diagrams. Using a standardized evaluation framework grounded in established quality metrics from the BPM literature, the tools are tested against a representative and formally enriched process scenario. The quality of the resulting models is analyzed across three input prompt styles, allowing for a comparative perspective on tool performance under varying linguistic conditions. This approach provides new insights into the current capabilities and limitations of LLM-based modeling systems. By evaluating these tools not only in terms of syntactic validity but also in terms of semantic accuracy and visual comprehensibility, the study contributes to the broader discourse on AI-assisted modeling and offers guidance for both researchers and practitioners interested in integrating LLMs into BPM workflows.
The rest of the paper is structured as follows: Section 2 reviews the foundations of BP modeling and the emergence of LLM-based tools. Section 3 outlines the research methodology and evaluation design. Section 4 introduces the quality assessment framework, while Section 5 details the experimental setup. Section 6 presents the evaluation results, and Section 7 discusses the findings and concludes the study.
2. Business Process Modeling and the Emergence of LLM-Based Tools
In today’s rapidly evolving technological and regulatory landscape, organizations face mounting pressure to streamline operations, reduce inefficiencies, and adapt quickly to change. To address these challenges, BPM has emerged as a fundamental discipline, enabling firms to design, monitor, control, and optimize the execution of BPs in a structured manner [6,7]. It plays a pivotal role in aligning operational activities with organizational goals, improving performance, and supporting compliance with industry and legal standards [8,9].
At the core of BPM lies BP modeling, a key practice that enables the graphical representation of processes in a way that is both comprehensive and accessible to stakeholders across different functions [10]. BP modeling supports process documentation, analysis, and reengineering by providing a visual foundation for identifying redundancies, bottlenecks, and opportunities for automation [11]. Through the simulation of “what-if” scenarios, organizations can forecast the outcomes of changes before implementation, thereby mitigating risk and supporting informed decision-making [12]. Real-world examples, such as the use of BP modeling by Tesco and Wedgwood to optimize logistics and reduce costs, illustrate its practical value [5]. Moreover, BP modeling fosters collaboration between business and IT by establishing a common language for process communication [13]. Standards such as BPMN - maintained by the Object Management Group (OMG) - enhance this collaboration by providing a syntax that is both machine-readable and human-interpretable, facilitating the transition from design to execution [14,15].
Concurrently, Large Language Models (LLMs) have emerged as transformative tools in artificial intelligence, revolutionizing how natural language is processed and utilized across disciplines. These models - such as ChatGPT, Gemini, and Llama - are capable of understanding, generating, and processing human language at an advanced level, significantly reducing the need for manual input in text-based tasks [16,17]. Trained on vast datasets and built with billions of parameters, LLMs demonstrate exceptional scalability and generalization capabilities, allowing them to perform well in complex reasoning, summarization, translation, and even code generation tasks [17].
Their usability spans diverse domains, from content creation and customer service to more specialized fields such as law [18], finance [19], education [20], and healthcare [21]. LLMs also serve as powerful personal and professional assistants, contributing to significant time savings and improved productivity [22,23]. As models increase in size and complexity, emergent abilities such as commonsense reasoning and symbolic manipulation further enhance their utility in structured tasks, including the interpretation and translation of natural language into formal notations [17]. These characteristics make LLMs especially attractive for integration into business applications that require semantic understanding and structured output generation, such as BP modeling.
The convergence of BPM and LLM technologies has enabled the development of AI-driven tools that assist users in translating textual process descriptions into formal BPMN models. These tools support early-stage modeling by providing draft diagrams that can be refined by experts, effectively reducing the modeling effort and enhancing productivity [22,24]. Importantly, they allow non-technical users to engage in process modeling, fostering greater inclusivity and collaboration in business analysis tasks [17].
This study evaluates five (5) representative LLM-based tools designed for BPMN modeling:
- BA-Copilot is a professional assistant that generates editable BPMN diagrams using the BPMN.io toolkit. It generates process models directly in .bpmn format, focusing on structured outputs and practical usability.
- BPMN-Chatbot, an academic prototype from the University of Klagenfurt, explores the potential of natural language interfaces in process modeling, leveraging LLM capabilities.
- Camunda BPMN Copilot is an open-source solution integrated into the Camunda Modeler, enabling prompt-based generation of BPMN models within a widely used modeling environment.
- Nala2BPMN, developed by Bonitasoft, automates the transformation of natural language inputs into BPMN diagrams, focusing on accelerating the design phase.
- ProMoAI is a lightweight research prototype built using Streamlit, designed to demonstrate prompt-to-BPMN generation with minimal user setup.
These tools represent a mix of commercial, open-source, and academic efforts, ensuring coverage across different user needs and technical contexts. Unlike prior works that mostly evaluate general-purpose LLMs (e.g., ChatGPT) on process modeling tasks (e.g., extraction of activities [25], process model generation [26]), this study focuses on tools specifically tailored for BPMN modeling, assessing their performance in generating complex and semantically rich diagrams.
3. Research Methodology
This section outlines the methodological framework followed in this study to evaluate the performance and usability of LLM-based tools in BP modeling. A structured five-step process was implemented to ensure consistency to real-world use cases (Figure 1).
Step 1: Selection of Quality Measures: The evaluation began with the identification of relevant quality dimensions for BP modeling. After a thorough review of the established criteria in the literature, three core measures were selected: Clarity, Correctness, and Completeness. These dimensions reflect essential attributes of well-formed process models and are consistently cited across BPM quality assessment frameworks.
Step 2: Definition of the Scoring System: To enable standardized assessment, a scoring system based on five levels was developed and is introduced in the next section. Each model output was evaluated against the three selected quality measures using this fixed scale, allowing for comparability and qualitative differentiation.
Step 3: Selection of LLM-Based Tools: A representative sample of five tools was chosen for analysis, reflecting a mix of professional, open-source, and academic solutions. The selection included: BA-Copilot, a professional assistant focusing on structured outputs and practical usability; BPMN-Chatbot, an academic prototype emphasizing natural language interaction; Camunda BPMN Copilot, an open-source tool integrated within the Camunda ecosystem; Nala2BPMN, developed by Bonitasoft, focusing on early-stage automation; ProMoAI, a lightweight prototype for prompt-based modeling. The selection process prioritized tools designed or fine-tuned for BPMN generation, rather than general-purpose LLMs.
Step 4: Selection of Process for Evaluation: A standardized process scenario was selected from the official Greek National Registry of Administrative Public Services (MITOS). The selected process titled “Renewal of a driving license (all categories)”, registry number 664541, is employed by the Greek Ministry of Infrastructure and Transport (Transport & Communications Directorate) and applies to holders of Greek/EU licenses [27]. This process is one of the most frequently used public services in Greece, reflecting high citizen engagement. It is well-documented, digitally accessible, and a government priority due to its impact on public safety and mobility. During testing, this real-world reference process allowed consistent comparison of outputs generated by each tool.
Step 5: Execution of Experiments: Each LLM tool was prompted with the standardized process scenario. The generated BPMN models were then assessed according to the predefined scoring system and quality measures. This approach ensures fair comparison and supports structured analysis of each tool’s strengths and limitations.
Altogether, this methodology ensures a consistent basis for evaluating the selected tools, setting the stage for the application of defined quality criteria in the next section.
4. Evaluation Framework
The evaluation of AI-generated BPMN models in this study is grounded in well-established external quality measures. These criteria draw from recognized academic literature and practical modeling guidelines, particularly those highlighted in quality frameworks such as ISO 9126 and the systematic review by Sánchez-González et al. [28]. They serve to assess the functional, structural, and communicative attributes of BPMN diagrams and are critical for determining whether AI-generated outputs meet real-world modeling standards.
Among the most widely recognized external quality dimensions in the literature are Modifiability, which evaluates the ease of editing and the format in which a model is produced; Clarity or Readability, which concerns the model’s visual structure and labeling; Adaptability, which captures the ease with which a model can be migrated between notations or reused across contexts; Maintainability, which reflects the effort required to update or extend a model; Correctness, which ensures the syntactic and semantic validity of a process; Consistency, which relates to the uniformity of logic, data, and terminology across the model; Completeness, which verifies whether all specified elements are included; Descriptiveness, which assesses the informativeness of labels and annotations; and Token-compliance, which evaluates whether the model can be executed through simulation.
4.1. Quality Measures Selection
From this broader landscape, three quality measures were selected for focused evaluation: Correctness, Completeness, and, Clarity. The selection of these metrics was informed by both their prominence in BPMN quality literature and their alignment with the evaluation needs of LLM-based modeling tools.
Additionally, they were selected based on both their prevalence in prior academic frameworks and their critical role in assessing models generated by LLM-based tools. For instance the selection of measures in our study is supported by the approach outlined in [5]. Their LLM-based process modeling framework emphasizes soundness guarantees which refers to correctness, iterative refinement through user feedback for enhancing completeness, and hierarchical, interpretable representations for promoting clarity. While their work does not explicitly define these quality measures, the methodological design aligns closely with the proposed evaluation framework, thereby reinforcing the relevance of our chosen quality measures.
Clarity relates to the visual and structural coherence of the diagram. A well-structured, clearly labeled model improves stakeholder understanding and communication. This metric is supported in 54% of reviewed proposals and aligns with the usability attributes of the ISO 9126 standard [20].
Correctness, is a crucial criterion for assessing syntactic and semantic validity and is referenced in 31% of surveyed frameworks in [20]. It ensures that the model behaves as expected during simulation and adheres to BPMN specification rules. For generative models, correctness is critical to determine whether the tool produces valid executable logic or merely syntactically plausible outputs.
Completeness is foundational for capturing all aspects of the modeled process as described in the input scenario. Omissions, especially of tasks, events, or decision paths, can lead to critical misunderstandings and significantly distort the intended process logic. It is referenced in 69% of frameworks surveyed in the literature [20].
Together, these dimensions provide a balanced assessment of both structural integrity and practical usability in process modeling.
4.2. The 3C Evaluation System
In this subsection the 3C Evaluation System is introduced to assess the external quality of BPMN models based on the three selected dimensions: Clarity, Correctness, and Completeness. Each dimension is evaluated independently using five quality criteria derived from BPMN best practices and based on [29,30]. For each criterion, a five-point ordinal scale is used for scoring, similar to scales in previous BPMN quality research [31] (Table 1). The scores for each criterion are then weighed based on importance (high, moderate, or low) and inform the final score.
The specific criteria for each quality measure are described below; the importance of each criterion is determined in brackets.
Correctness Criteria
- No syntactic/behavioral violations (High): The model must not contain deadlocks, livelocks, or infinite loops.
- No structural errors (High): All elements must be connected and part of a valid flow; there should be no isolated nodes.
- No semantic violations (Moderate): The model must accurately represent the described process logic. This means that the sequence and type of elements in the BPMN model should reflect the intended process behavior.
- No redundant flows/elements (Moderate): Avoid unnecessary components that do not serve a functional purpose.
- All gateway splits must be followed by matching joins (Low): Logical consistency in control flow must be maintained.
Completeness Criteria
- All control flow elements from the prompt are modeled (High).
- The process includes start and end events (High).
- All decision outcomes are modeled (Moderate): Each decision point must have all expected branches (e.g., Yes/No).
- Exception handling is modeled where relevant (Moderate).
- All gateway splits must be followed by matching joins (Low): Logical consistency in control flow must be maintained.
Clarity Criteria
- No misleading or incorrect labels (High): Activity, event, and gateway labels must clearly and accurately reflect their function.
- No unlabeled elements (High): All elements, especially tasks, gateways, and events, must be named to clarify their role in the process.
- No diagram layout issues (Moderate): Models should use consistent spacing and avoid zigzag flows to ensure visual readability.
- No overlapping flows (Moderate): Sequence flows should not cross unnecessarily.
- All outgoing arcs of (X)OR-splits are labeled (Low): Paths from decision gateways must be labeled with conditions to indicate logic.
5. Design of Experiments
Building upon the previously defined evaluation framework, a structured experimental design was developed to systematically assess the performance of the selected LLM-based tools in BP modeling. Specifically, the same process scenario was presented to the tools across three distinct input formats (i.e., prompts). The primary objectives of the experiments were: (i) to evaluate the tools’ ability to represent advanced process logic using complex BPMN elements (e.g., event-based gateways, boundary non-interrupting timer events), and (ii) to assess their ability to interpret and model the same process logic across varied input styles, including step-by-step instructions (prompt 1), a narrative paragraph (prompt 2), and a paragraph with additional irrelevant information (i.e., noise) (prompt 3). All experiments are publicly available online [32] to facilitate reproducibility and future research.
5.1. Selection and Extension of the Process Scenario
The administrative process “Renewal of a Driving License” was selected from the official Greek National Registry of Administrative Public Services (MITOS). This process was selected for several reasons: it is well-documented, widely used by the general public, and familiar to most citizens, making it an accessible and practical case study for evaluating the effectiveness of LLM-based tools in real-world contexts.
However, as the documented steps in the process are primarily sequential and lack exceptional paths or explicit error-handling mechanisms, the authors introduced targeted extensions to the original scenario incorporating more sophisticated process logic. This could address a gap in prior research, which has predominantly examined LLMs’ performance in modeling fundamental BPMN elements (e.g., start and end events, activities, exclusive and parallel gateways), while overlooking more complex constructs.
By extending the scenario (see Experiments/Process Scenario in [32]), the study aims to determine whether the selected tools can accurately represent advanced logic using appropriate BPMN artifacts - thus directly addressing objective (i) of the experimental design. For this purpose, the following enhancements were introduced to the original process flow:
- Event-driven conditional waiting: A conditional waiting mechanism was added, described as: “The process waits until one of two events occurs: either the applicant submits the missing documents, or 15 days pass without submission”.
- Recurring automated reminders: A recurring non-interrupting reminder mechanism was incorporated, stated as: “As long as the license remains unissued, an automated reminder is sent to the responsible official every 5 working days”.
5.2. Prompt Variations
Given that real-world process descriptions often vary significantly in structure, clarity, and the inclusion of irrelevant information, the authors created three distinct input variations for the selected process scenario (as defined in 5.1). These variations were designed to assess the tools’ ability to interpret and model BPs from diverse types of textual input, thus satisfying the objective (ii) of the experimental design:
- Prompt 1 (Step-by-step instructions): A clearly enumerated list that explicitly outlines each step of the process, providing a highly structured input format.
- Prompt 2 (Paragraph description): An unstructured narrative paragraph describing the overall process flow without explicit enumeration, requiring the tools to implicitly infer and reconstruct the underlying structure.
- Prompt 3 (Noisy paragraph): Similar to Prompt 2, but augmented with additional, irrelevant contextual information (i.e., noise). This variant specifically evaluates the tools’ ability to filter out non-essential content and accurately represent only the relevant process logic in the generated BPMN model.
All three prompts are publicly available online (see Experiments/Prompts in [32]), allowing for examination of their structure and variations.
5.3. Model Generation
Following the definition of the process scenario and the design of three distinct prompt variations, the subsequent phase involved generating BPMN models using the five selected LLM-based tools. Each tool was tested with all three prompts, and to address the inherent variability in LLM-generated outputs, each prompt was executed three times per tool. This procedure resulted in a total of 9 models per tool (i.e., 3 prompts, 3 runs per prompt), leading to a total of 45 models across all tools (i.e., 5 tools, 9 models per tool). All the generated models are publicly available online (see Experiments/BPMN Model Generation in [32]).
To assess the best potential performance of each tool, the authors employed a best-of-three selection strategy. For each tool and prompt, the three generated models were reviewed, and the most accurate or representative model (i.e., the one that best captured the intended process logic) was selected for evaluation. For example, in the case of prompt 2 for Tool X, if the first and second runs produced diagrams with incomplete control flows or semantic errors, while the third run yielded a coherent and complete BPMN model, the third model was selected for further assessment. This approach was chosen to evaluate the best potential performance of each tool rather than averaging results that may have been degraded by suboptimal generations. In addition, this approach aligns with how such tools might be pragmatically employed in practice, where users can iteratively prompt the tool and select the best output among multiple attempts. However, while this strategy avoids over-penalizing tools for occasional poor outputs, it introduces a potential bias by emphasizing best-case performance over average reliability. This methodological limitation is acknowledged and further discussed in Section 7.
As a result of this selection strategy, the final evaluation dataset consisted of 15 BPMN models (i.e., 3 per tool, each representing the best output for each prompt). These models were subsequently evaluated using a structured scoring sheet based on the predefined 3C quality framework (Clarity, Correctness, and Completeness).
5.4. Evaluation Procedure
The final phase of the experimental design focused on the structured evaluation of the 15 selected BPMN models. To ensure consistency and rigor, a standardized scoring sheet was used (see Experiments/Evaluation/Evaluation Scoring Sheet Template in [32]), incorporating a weighted checklist aligned with the predefined quality criteria (see sub-section 4.2). Each author independently evaluated the BPMN diagrams and documented their assessments using their own copy of the scoring sheet.
The scoring sheet template, illustrated in Figure 2, is organized as follows:
- Criteria Organization: The sheet is divided into the three selected quality dimensions - Clarity, Correctness, and Completeness. Under each dimension, specific quality metrics are listed (e.g., “No misleading or incorrect labels”, “No structural correctness violations”, “No missing start/end events”). Each metric is associated with an importance level (High, Moderate, or Low) and a corresponding weight (3, 2, or 1 respectively).
- Evaluation Entries: For each LLM-based tool (e.g., BA Copilot, BPMN Chatbot, Nala2BPMN, Camunda BPMN Copilot, ProMoAI), the scoring sheet records a binary outcome (True/False) for each quality criterion under each prompt (Prompt 1, Prompt 2, Prompt 3). A “True” entry indicates that the model satisfied the criterion, while a “False” entry indicates the presence of an issue. For example, if a model contained clearly labeled activities with no ambiguity, the criterion “No misleading or incorrect labels” would be marked as True, contributing positively to the model’s Clarity score.
- Visual Evidence: Under each prompt, the corresponding BPMN model URL from [32] is referenced, providing traceability to the specific model version evaluated.
- Score Calculation: For each prompt, a raw score is computed by summing the weights of all criteria marked as True. This score is then normalized by dividing it by the maximum possible score within each quality dimension, resulting in a Normalized Score ranging from 0 (lowest) to 5 (highest).
After all five authors independently completed their scoring sheets, the individual assessments were reviewed collectively, and any discrepancies were discussed to reach a consensus. The outcome of this collaborative process is a consolidated scoring sheet (available in Experiments/Evaluation/Evaluation Scoring Sheet Template in [32]), which serves as the foundation for the results presented in the subsequent section.
6. Results
This section presents the results of the evaluation, structured into four analytical perspectives: (i) an illustrative example demonstrating the potential of LLM-based modeling tools, (ii) descriptive statistics comparing average performance across tools, (iii) a correlation analysis of the quality dimensions, and (iv) a fine-grained view of the individual quality criteria, highlighting those most consistently satisfied as well as those that posed the greatest challenges across all tools.
6.1. Selection of Process for Evaluation
To illustrate the significant potential of LLM-based tools, the authors initially present a representative output generated by the Camunda BPMN Copilot in response to prompt 3. The resulting BPMN model (Figure 3) achieved high evaluation scores across all three quality dimensions: Clarity (5.00), Correctness (4.55), and Completeness (4.55).
The diagram demonstrates the tool’s ability to accurately interpret complex process semantics and translate them into a syntactically rich and visually coherent BPMN representation. It notably incorporates advanced BPMN constructs, including an event-based gateway to manage conditional branching and a boundary non-interrupting timer event to model recurring automated reminders. The correct use of these elements reflects an advanced understanding of process logic and formal notation, demonstrating a level of modeling proficiency that approaches that of a human expert.
While the model is of high overall quality, it presents a minor syntactic violation: the path initiated by the non-interrupting timer event lacks a dedicated end event, leaving the exceptional flow formally incomplete. This limitation underscores the potential need for post-generation validation, a point that is further elaborated in Section 7.
6.2. Descriptive Statistics
While the previous example demonstrates the strong potential of LLM-based tools to generate high-quality BPMN models, such results are not consistent across all tools. In practice, the quality of generated models varies significantly depending on the specific tool employed.
Table 2 presents descriptive statistics summarizing the evaluation scores for each tool (BA-Copilot=A, BPMN Chatbot=B, Camunda BPMN Copilot=C, Nala2BPMN=D, ProMoAI=E) across the three quality dimensions and the degree of variation between them. For each dimension, the table includes the average scores per tool (i.e., calculated as the mean of scores from prompts 1, 2, and 3), as well as the overall mean and standard deviation across all tools.
The results reveal substantial variation in tool performance. Camunda BPMN Copilot achieved the highest scores across all three dimensions, with particularly strong performance in Clarity (4.09) and Completeness (4.55). In contrast, ProMoAI exhibited the lowest performance overall, especially in Clarity (0.91) and Completeness (0.45), indicating limited effectiveness in producing comprehensible or complete BPMN diagrams. Furthermore, variations might exist within a single tool across different dimensions. For instance, Nala2BPMN achieved a high score in Completeness (4.55) but performed below average in Correctness (1.97), highlighting that a tool might excel in one dimension while struggling in another one. Figure 4 provides a visual summary of the performance variations discussed above, highlighting both the disparities across tools and across evaluation dimensions, and presenting the relative strengths and weaknesses of each tool.
When considering all tools, Clarity emerged as the highest-scoring dimension on average (mean = 2.85), followed closely by Completeness (2.70). In contrast, Correctness had the lowest average score (mean = 2.18), indicating that syntactic and semantic accuracy remains a common challenge among current tools. This limitation might stem from the inability of some tools to incorporate advanced BPMN constructs (e.g., event-based gateways, non-interrupting boundary timer event) to model the given process logic. As a result, these tools often attempt to approximate the intended process behavior using more familiar or limited BPMN elements, which can lead to syntactic or semantic violations.
In terms of variability, Completeness displayed the highest standard deviation (1.82), highlighting significant disparities in how well tools capture all aspects of the described process. This variability suggests that some tools might overlook or simplify key control flow elements. By contrast, Correctness exhibited the lowest standard deviation (0.75), indicating relatively consistent syntactic behavior across tools, albeit at a generally modest level of accuracy.
6.3. Correlation Between Quality Dimensions
While previous results showed that a single tool might perform well in one quality dimension but poorly in another, the extent to which these dimensions are related remains unclear. To better understand such discrepancies, Pearson correlation coefficients were calculated to assess the degree of association between Clarity, Correctness, and Completeness. This analysis provides insight into whether strong performance in one area, e.g., Clarity, is typically accompanied by strong (or weak) performance in others, revealing potential patterns in tool behavior.
Table 3 presents the Pearson correlation coefficients for each pair of quality dimensions. The results show a strong positive correlation between Clarity and Correctness (r = 0.882), suggesting that tools producing visually clear diagrams are also more likely to generate syntactically and semantically accurate models, and vice versa. This relationship likely reflects an underlying connection between structural readability and accurate logic representation, both of which depend on appropriate use of BPMN syntax. A moderate correlation between Clarity and Completeness (r = 0.525) indicates some degree of alignment between visual clarity and the inclusion of necessary process elements. While clarity might enhance overall comprehension, it does not guarantee that all required components are present. Tools might produce readable diagrams that are nonetheless incomplete. In contrast, the weak correlation between Correctness and Completeness (r = 0.297) suggests that capturing most process elements does not necessarily imply a structurally valid or logically coherent representation. A tool might generate correct process representations without modeling the complete flow, or it might include all elements but arrange them in ways that violate BPMN syntax or semantics.
6.4. Performance Across Individual Quality Criteria
Although the previous analysis examined the relationships between the three quality dimensions, it did not assess how tools perform with respect to the individual quality criteria that constitute these dimensions. In the 3C evaluation system, each dimension consists of multiple specific criteria (e.g., “no unlabeled elements,” “no structural errors”, etc.), and evaluating performance at this level could provide more precise insight into the strengths and limitations of LLM-based modeling tools. This level of analysis could additionally offer practical guidance for future improvements, particularly in addressing recurring omissions or modeling errors.
Figure 5 presents the pass rate for each criterion across all tools and prompts, indicating the proportion of evaluated models in which a criterion was successfully met. The criteria are colored by dimension and sorted by average pass rate, offering a granular view of which quality requirements were most consistently satisfied and which posed greater challenges. For example, the criterion “No overlapping flows” achieved a pass rate of 80%, meaning it was satisfied in 12 out of the 15 evaluated models (i.e., 5 tools, 3 prompts per tool, 1 best run per prompt).
The results reveal substantial variation in pass rates across the 15 criteria, highlighting both strengths and persistent challenges in state-of-the-art LLM-based process modeling tools. The highest pass rates were observed for the Clarity and Completeness criteria “No overlapping flows” (80%) and “No missing control flow elements” (73.33%), respectively. These results indicate that most tools are generally capable of identifying the required process components and presenting them in a visually clean and readable format.
In contrast, several criteria expose critical limitations. Specifically, none of the tools satisfied the criterion “No missing complementary elements” (0% pass rate), indicating a consistent failure to represent supporting process aspects, such as the resource or data perspective. For example, even if the prompts specified the actors of the process scenario (e.g., Transport and Communications Service (TCS) official), tools either omitted BPMN constructs like pools and lanes, or used them incorrectly. Additionally, semantic correctness emerged as another significant challenge. The criterion “No semantic violations” had a pass rate of 20%, indicating that 80% of the evaluated models contained logical inconsistencies (e.g., sequencing activities in ways that contradict the intended process logic described in the prompt).
7. Results
This study presented a systematic evaluation of five LLM-based tools designed to generate BPMN models from a textual process scenario. Using a standardized evaluation framework and a structured experimental design, the analysis uncovered several important insights. The key findings and their implications are summarized below:
(i) State-of-the-art LLM -based tools are capable of modeling complex process scenarios that require advanced BPMN constructs such as event-based gateways and boundary events (sub-section 6.1). The correct usage of these elements demonstrates a sophisticated understanding of formal process notation, with a level of proficiency that approaches that of human experts. This observation supports the conclusions of [33], which corroborated that distinguishing between models created by human experts and those generated by LLMs is not always straightforward.
(ii) Among the evaluated tools, Camunda BPMN Copilot demonstrated the most consistent and high-quality performance across all three evaluation dimensions: Clarity, Correctness, and Completeness (sub-section 6.2). These findings suggest a high level of proficiency in both interpreting process logic and constructing coherent BPMN diagrams. This performance might be attributed to the effective integration of LLM-based natural language processing with the Camunda Modeler’s BPMN-compliant modeling environment. This observation is consistent with [25], which emphasizes that the integration of LLMs with existing, domain-specific tools should be prioritized. Such integration is likely more effective than training LLMs in isolation, as many modeling environments already incorporate extensive process modeling knowledge that LLMs would struggle to replicate.
(iii) Tools that lack support for advanced BPMN constructs often attempt to represent complex process logic using simpler or more familiar elements (sub-section 6.2). As a result, the generated models may deviate from proper syntax or introduce semantic violations. In the context of this study, a representative syntactic error appears in the model generated by BA Copilot for prompt 2 [32], where the gateway labeled “Omissions identified?” lacks any outgoing sequence flows. Similarly, a semantic violation is observed in the model produced by Nala2BPMN for the same prompt [32]. Specifically, the task “Send automated reminder” is placed after the “Make electronic entry in the driving license register” task, contradicting the optional non-interrupting reminder logic described in the scenario. This observation supports the conclusions of [34], which emphasize that in complex scenarios, LLMs are prone to hallucinations, misinterpretation of input, and the generation of structurally unstable or logically inconsistent process models.
(iv) Clarity and Correctness of the LLM-generated models were found to be strongly correlated, indicating a close association between these two dimensions (sub-section 6.3). This suggests that improving one of these dimensions might positively influence the other. Enhancing the visual structure and readability of generated models could contribute to more syntactically and semantically accurate outputs, while promoting correctness in logic and syntax might also result in clearer and more interpretable diagrams. While the direction of influence cannot be determined from correlation alone, these results suggest that optimizing LLM-based process modeling tools with attention to either aspect might yield benefits in both.
(v) LLM-based process modeling tools predominantly focus on the control-flow perspective, while largely omitting complementary perspectives such as the resource and data views (sub-section 6.4). Even when the prompt explicitly mentions process participants or data elements, tools do not incorporate them with appropriate BPMN constructs such as pools, lanes, or data objects. Although these perspectives are not strictly necessary for representing control flow, their consistent absence limits the completeness and contextual richness of the generated models.
(vi) Although Figure 3 illustrates the strong potential of LLM-based modeling tools, it also reveals the need for caution. Despite its overall high quality, the model contains a minor syntactic flaw: the path triggered by the non-interrupting timer event lacks a dedicated end event, leaving the exceptional flow incomplete (sub-section 6.1). This suggests that even the most proficient outputs may introduce structural errors that compromise correctness. Additionally, semantic violations were identified in 80% of the evaluated BPMN models in this study, highlighting it as one of the most consistently unmet quality criteria (sub-section 6.4). This underscores the need for human post-validation to ensure that models are both structurally sound and semantically accurate. This observation aligns with previous literature, which argues that due to their probabilistic nature, LLMs require oversight by human experts [33], and are currently not reliable enough to function independently in professional business environments without human intervention [35].
It is essential that these observations should be considered with caution as several limitations can be acknowledged. First, the evaluation was based on a single, albeit formally enriched, process scenario. While this scenario was chosen for its practical relevance and structural complexity, relying on just one case limits the generalizability of the findings and makes it difficult to assess the consistency of tool performance across diverse modeling contexts. Second, to reflect how these tools might realistically be used, the study adopted a best-of-three selection strategy for each tool and prompt. This approach allowed for the evaluation of each tool’s best-case output, simulating practical use where users may experiment with multiple runs and choose the most accurate result. However, this strategy introduces a potential bias by emphasizing optimal performance, which may not fully capture each tool’s average reliability or output variability. Third, the scoring process involved a degree of subjectivity, as human judgment was required to determine whether specific quality criteria were met. To reduce bias and enhance reliability, all five authors independently completed the scoring sheets and then collaboratively reviewed and reconciled any differences to reach a consensus. However, complete elimination of subjectivity is challenging, and some variation in interpretation among the authors might have influenced the final scores.
Building on the findings and limitations of this study, several promising directions for future research can be identified. First, expanding the evaluation to include a wider range of process scenarios from diverse domains would enhance the generalizability of the findings and allow for a more robust assessment of tool performance across different contexts. Second, rather than focusing solely on best-case outputs, future studies should also analyze average-case performance by evaluating all generated models. This would provide a clearer picture of each tool’s reliability and consistency in practice. Third, future work could investigate the integration of post-processing validation mechanisms - either rule-based or AI-assisted - to automatically detect and correct common syntactic and semantic issues in generated BPMN diagrams. Finally, user-centered studies involving business analysts/modelers and domain experts could help assess the practical usability and trustworthiness of these tools in real-world modeling environments.
In conclusion, while current LLM-based tools show promising capabilities, this initial evaluation reveals that they do not yet “speak” BPMN fluently, highlighting the importance of human oversight. As the technology matures, thoughtful integration with existing modeling environments and targeted improvements in tool reliability will be essential to unlocking their full value in professional BPM practice.
Funding
This research received no external funding.
Conflicts of Interest
The authors declare no conflicts of interest.
References
- Raiaan, M.A.K.; Mukta, M.S.H.; Fatema, K.; Fahad, N.M.; Sakib, S.; Mim, M.M.J.; Ahmad, J.; Ali, M.E.; Azam, S. A Review on Large Language Models: Architectures, Applications, Taxonomies, Open Issues and Challenges. IEEE access 2024, 12, 26839–26874. [Google Scholar] [CrossRef]
- Vidgof, M.; Bachhofner, S.; Mendling, J. Large Language Models for Business Process Management: Opportunities and Challenges. In Business Process Management Forum; Di Francescomarino, C., Burattin, A., Janiesch, C., Sadiq, S., Eds.; Lecture Notes in Business Information Processing; Springer Nature Switzerland: Cham, 2023; Vol. 490, pp. 107–123. ISBN 978-3-031-41622-4. [Google Scholar]
- Laue, R.; Kirchner, K.; Lantow, B.; Edwards, K. Bridging the Gap Between Business Process Modellers and Domain Experts by Variability Patterns. In Transactions on Pattern Languages of Programming V; Wallingford, E., Zdun, U., Kohls, C., Eds.; Springer: Berlin, Heidelberg, 2025; pp. 190–225. ISBN 978-3-662-70810-1. [Google Scholar]
- Grohs, M.; Abb, L.; Elsayed, N.; Rehse, J.-R. Large Language Models Can Accomplish Business Process Management Tasks. In Business Process Management Workshops; De Weerdt, J., Pufahl, L., Eds.; Lecture Notes in Business Information Processing; Springer Nature Switzerland: Cham, 2024; Vol. 492, pp. 453–465. ISBN 978-3-031-50973-5. [Google Scholar]
- Kourani, H.; Berti, A.; Schuster, D.; Van Der Aalst, W.M.P. Process Modeling with Large Language Models. In Enterprise, Business-Process and Information Systems Modeling; Van Der Aa, H., Bork, D., Schmidt, R., Sturm, A., Eds.; Lecture Notes in Business Information Processing; Springer Nature Switzerland: Cham, 2024; Vol. 511, pp. 229–244. ISBN 978-3-031-61006-6. [Google Scholar]
- Dumas, M.; Rosa, M.L.; Mendling, J.; Reijers, H.A. Fundamentals of Business Process Management; 2nd ed.; Springer-Verlag: Berlin Heidelberg, 2018; ISBN 978-3-662-56508-7.
- Swanson, L. An Information-Processing Model of Maintenance Management. International Journal of Production Economics 2003, 83, 45–64. [Google Scholar] [CrossRef]
- Moreira, S.A.S.; Dallavalle, S. Unraveling the Trends in Business Process Management: A Comprehensive Bibliometric Analysis of Management and Business Literature. Business Process Management Journal 2024, 30, 2541–2563. [Google Scholar] [CrossRef]
- Naveed, H.; Khan, A.U.; Qiu, S.; Saqib, M.; Anwar, S.; Usman, M.; Akhtar, N.; Barnes, N.; Mian, A. A Comprehensive Overview of Large Language Models 2024.
- Nousias, N.; Tsakalidis, G.; Vergidis, K. Not yet Another BPM Lifecycle: A Synthesis of Existing Approaches Using BPMN. Information and Software Technology 2024, 171, 107471. [Google Scholar] [CrossRef]
- Grikštaitė, J. Business Process Modelling and Simulation: Advantages and Disadvantages. Global Academic Society Journal: Social Science Insight 2008, 1, 4–14. [Google Scholar]
- Nousias, N.; Tsakalidis, G.; Michoulis, G.; Petridou, S.; Vergidis, K. A Process-Aware Approach for Blockchain-Based Verification of Academic Qualifications. Simulation Modelling Practice and Theory 2022, 121, 102642. [Google Scholar] [CrossRef]
- Tsakalidis, G.; Vergidis, K.; Delias, P.; Vlachopoulou, M. A Conceptual Business Process Entity with Lifecycle and Compliance Alignment. In Proceedings of the International Conference on Decision Support System Technology; Springer, 2019; pp. 70–82. [Google Scholar]
- Object Management Group (OMG) About the Business Process Model And Notation Specification Version 2.0. 2013.
- Yahya, F.; Boukadi, K.; Ben-Abdallah, H. Improving the Quality of Business Process Models: Lesson Learned from the State of the Art. Business Process Management Journal 2018, 25, 1357–1376. [Google Scholar] [CrossRef]
- Gokul, A. LLMs and AI: Understanding Its Reach and Impact. Preprints 2023. [Google Scholar]
- Yang, J.; Jin, H.; Tang, R.; Han, X.; Feng, Q.; Jiang, H.; Zhong, S.; Yin, B.; Hu, X. Harnessing the Power of LLMs in Practice: A Survey on ChatGPT and Beyond. ACM Trans. Knowl. Discov. Data 2024, 18, 1–32. [Google Scholar] [CrossRef]
- Lai, J.; Gan, W.; Wu, J.; Qi, Z.; Yu, P.S. Large Language Models in Law: A Survey. AI Open 2024. [Google Scholar] [CrossRef]
- Feng, Z.; Hu, G.; Li, B.; Wang, J. Unleashing the Power of ChatGPT in Finance Research: Opportunities and Challenges. Financ Innov 2025, 11, 93. [Google Scholar] [CrossRef]
- Firaina, R.; Sulisworo, D. Exploring the Usage of ChatGPT in Higher Education: Frequency and Impact on Productivity. Buletin Edukasi Indonesia 2023, 2, 39–46. [Google Scholar] [CrossRef]
- Javaid, M.; Haleem, A.; Singh, R.P. ChatGPT for Healthcare Services: An Emerging Stage for an Innovative Perspective. BenchCouncil Transactions on Benchmarks, Standards and Evaluations 2023, 3, 100105. [Google Scholar] [CrossRef]
- Szilágyi, R.; Tóth, M. Use of LLM for SMEs, Opportunities and Challenges. Journal of Agricultural Informatics 2023, 14. [Google Scholar] [CrossRef]
- Wolf, V.; Maier, C. ChatGPT Usage in Everyday Life: A Motivation-Theoretic Mixed-Methods Study. International Journal of Information Management 2024, 79, 102821. [Google Scholar] [CrossRef]
- Chen, Y.; Liu, Y.; Yan, J.; Bai, X.; Zhong, M.; Yang, Y.; Yang, Z.; Zhu, C.; Zhang, Y. See What LLMs Cannot Answer: A Self-Challenge Framework for Uncovering LLM Weaknesses 2024.
- Klievtsova, N.; Benzin, J.-V.; Kampik, T.; Mangler, J.; Rinderle-Ma, S. Conversational Process Modelling: State of the Art, Applications, and Implications in Practice. In Business Process Management Forum; Di Francescomarino, C., Burattin, A., Janiesch, C., Sadiq, S., Eds.; Lecture Notes in Business Information Processing; Springer Nature Switzerland: Cham, 2023; Vol. 490, pp. 319–336. ISBN 978-3-031-41622-4. [Google Scholar]
- Kourani, H.; Berti, A.; Schuster, D.; Aalst, W.M.P. van der Evaluating Large Language Models on Business Process Modeling: Framework, Benchmark, and Self-Improvement Analysis 2024.
- National Registry of Administrative Public Services 664541:Renewal of a Driving Licence (All Categories). Available online: https://en.mitos.gov.gr (accessed on 18 May 2025).
- Sánchez-González, L.; García, F.; Ruiz, F.; Piattini, M. Toward a Quality Framework for Business Process Models. International Journal of Cooperative Information Systems 2013, 22, 1350003. [Google Scholar] [CrossRef]
- Mendling, J. Managing Structural and Textual Quality of Business Process Models. In Data-Driven Process Discovery and Analysis; Cudre-Mauroux, P., Ceravolo, P., Gašević, D., Eds.; Lecture Notes in Business Information Processing; Springer Berlin Heidelberg: Berlin, Heidelberg, 2013; Vol. 162, pp. 100–111. ISBN 978-3-642-40918-9. [Google Scholar]
- Mendling, J.; Strembeck, M.; Recker, J. Factors of Process Model Comprehension—Findings from a Series of Experiments. Decision Support Systems 2012, 53, 195–206. [Google Scholar] [CrossRef]
- Vanderfeesten, I.; Cardoso, J.; Mendling, J.; Reijers, H.A.; Van der Aalst, W. Quality Metrics for Business Process Models. BPM and Workflow handbook 2007, 144, 179–190. [Google Scholar]
- BPM-UOM BPM-UOM/Llm_based_tools_for_process_modeling 2025.
- Klievtsova, N.; Benzin, J.-V.; Mangler, J.; Kampik, T.; Rinderle-Ma, S. Process Modeler vs. Chatbot: Is Generative AI Taking over Process Modeling? In Process Mining Workshops; Delgado, A., Slaats, T., Eds.; Lecture Notes in Business Information Processing; Springer Nature Switzerland: Cham, 2025; Vol. 533, pp. 637–649. ISBN 978-3-031-82224-7. [Google Scholar]
- Nour Eldin, A.; Assy, N.; Anesini, O.; Dalmas, B.; Gaaloul, W. Nala2BPMN: Automating BPMN Model Generation with Large Language Models. In Cooperative Information Systems; Comuzzi, M., Grigori, D., Sellami, M., Zhou, Z., Eds.; Lecture Notes in Computer Science; Springer Nature Switzerland: Cham, 2025; Vol. 15506, pp. 398–404. ISBN 978-3-031-81374-0. [Google Scholar]
- Bennoit, C.; Greff, T.; Baum, D.; Bajwa, I.A. Identifying Use Cases for Large Language Models in the Business Process Management Lifecycle. In Proceedings of the 2024 26th International Conference on Business Informatics (CBI), IEEE; 2024; pp. 256–263. [Google Scholar]
Figure 1.
Evaluation Process of AI-based BPMN modeling solutions.
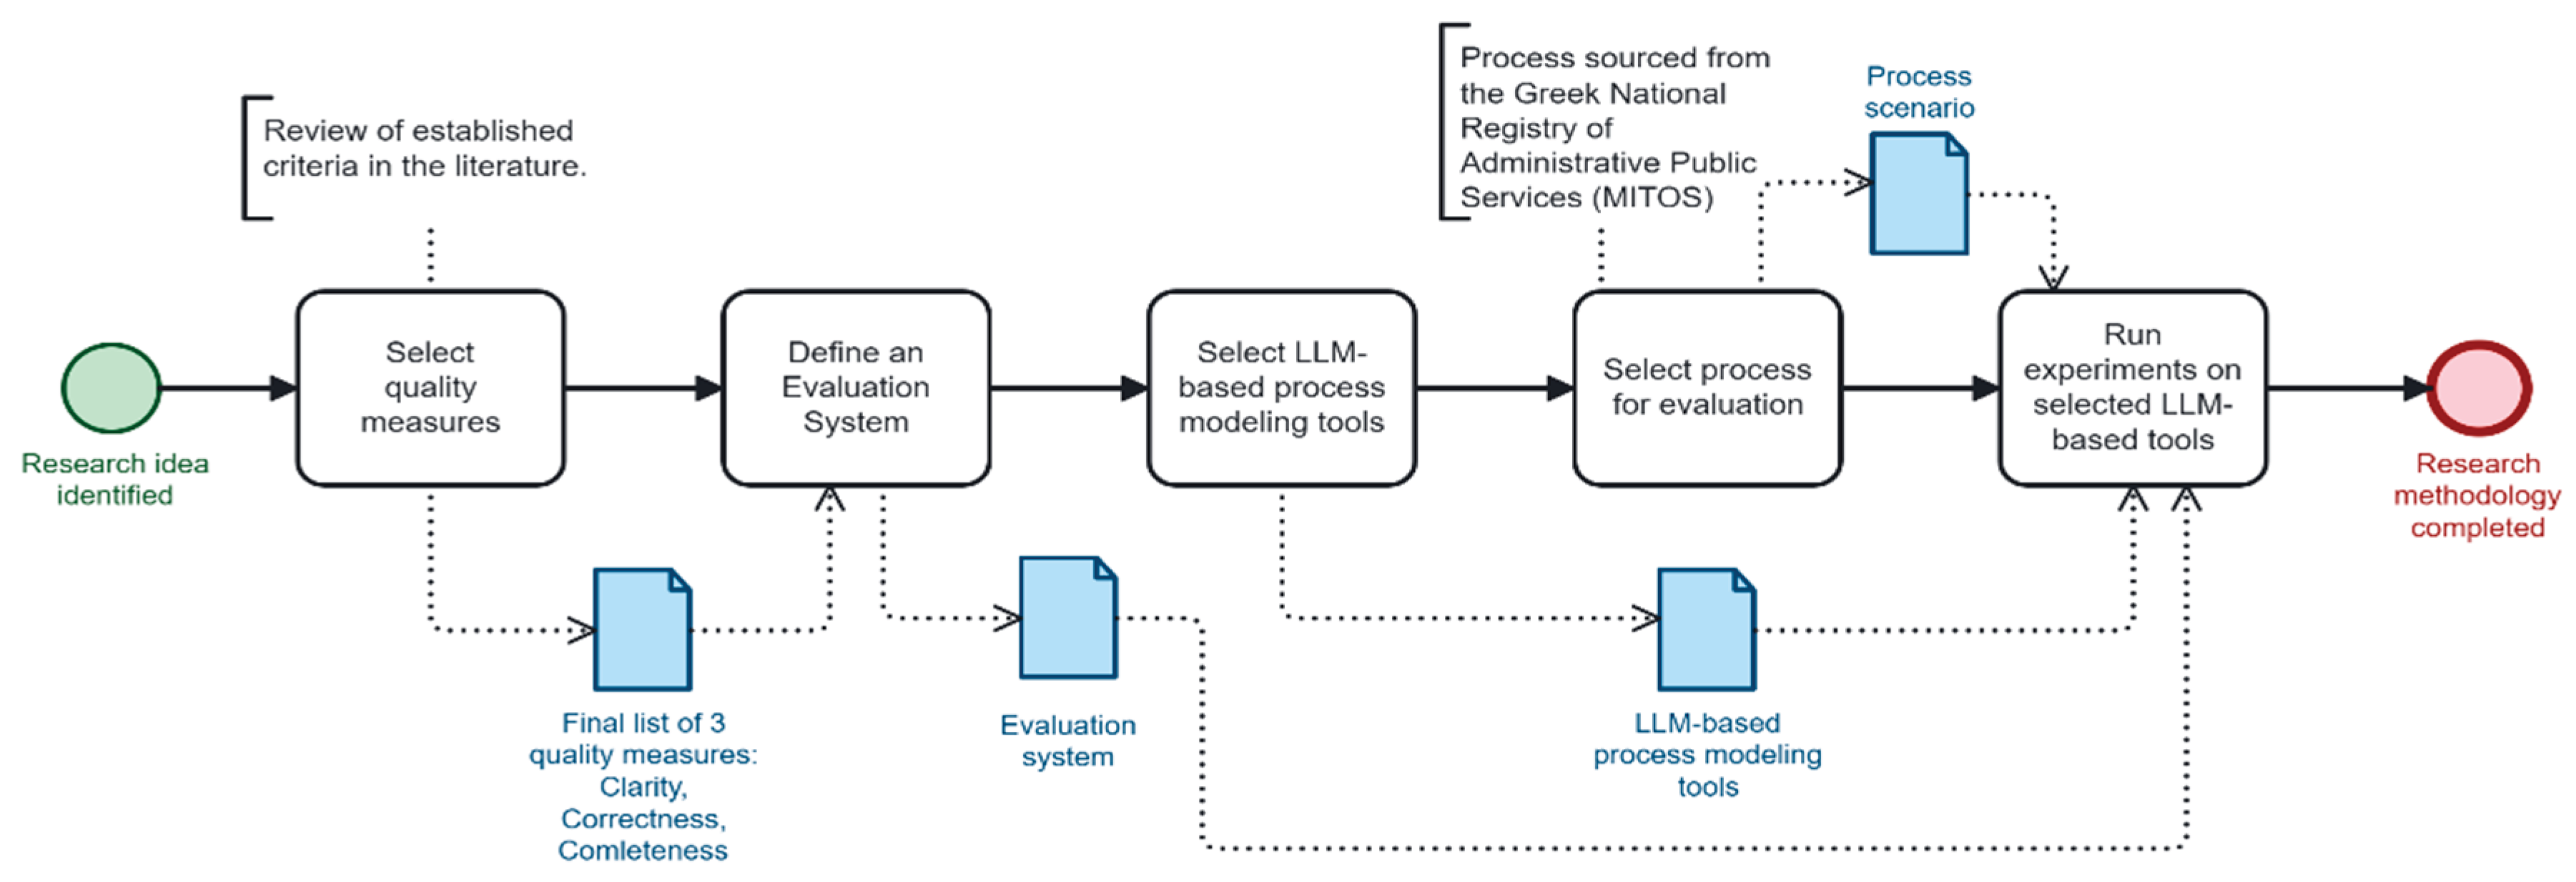
Figure 2.
Structured scoring sheet template.
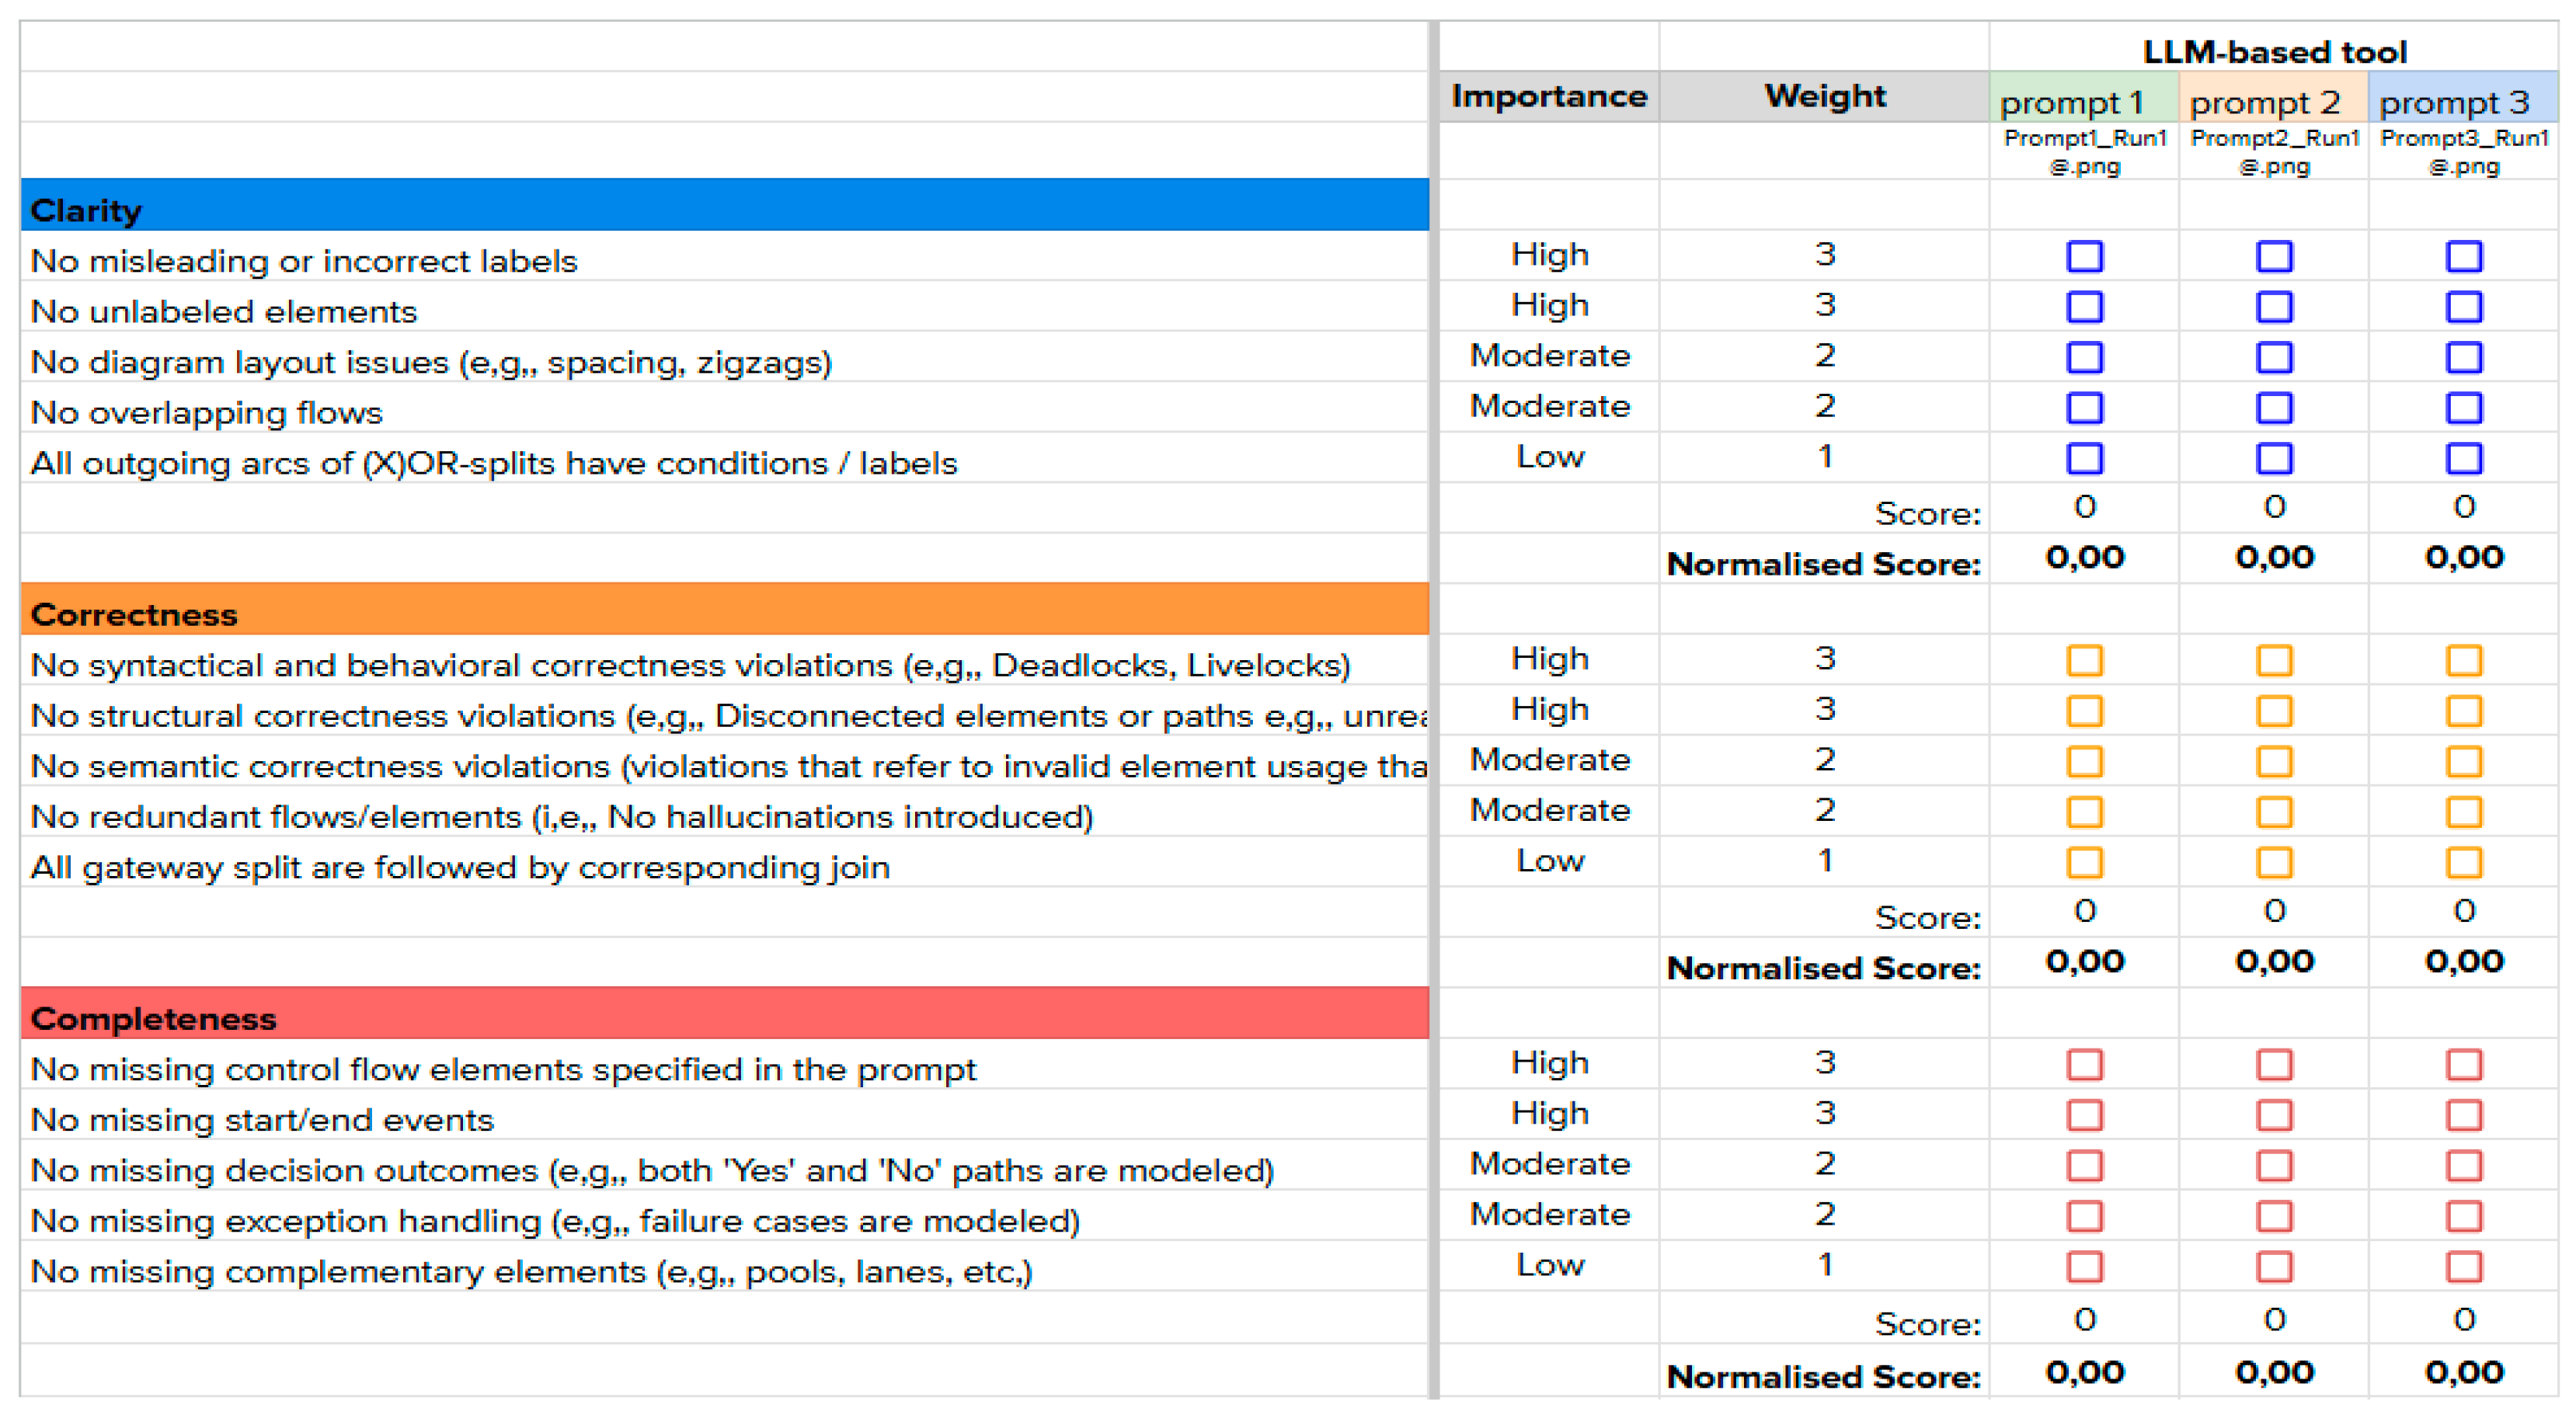
Figure 3.
BPMN model generated by Camunda BPMN Copilot using Prompt 3 (a higher resolution is available online).
Figure 3.
BPMN model generated by Camunda BPMN Copilot using Prompt 3 (a higher resolution is available online).
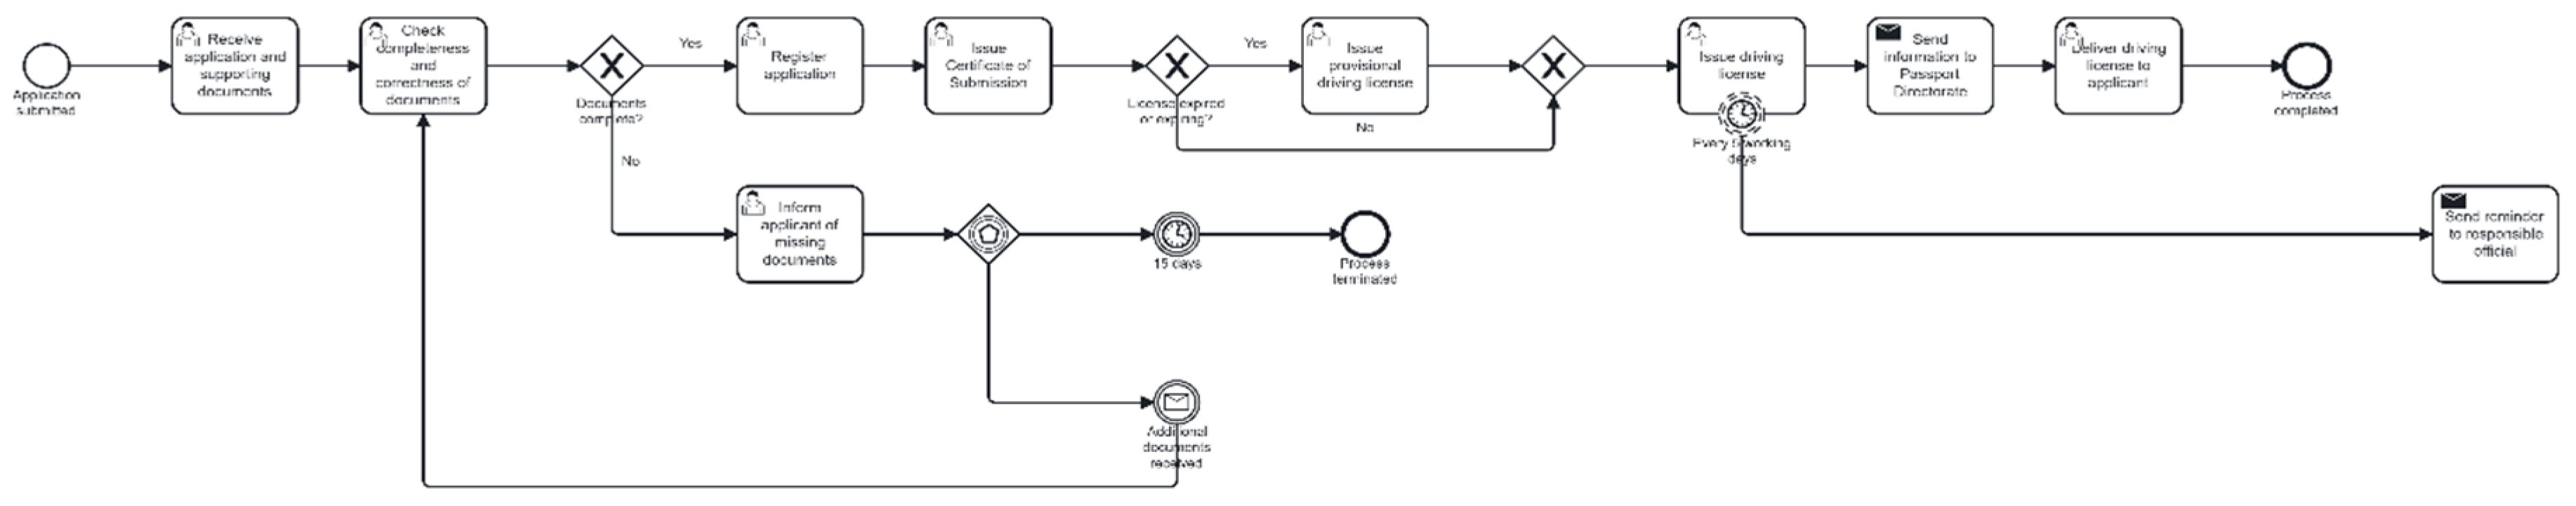
Figure 4.
Average score metric per tool.

Figure 5.
Pass rate of criteria across all tools and prompts.
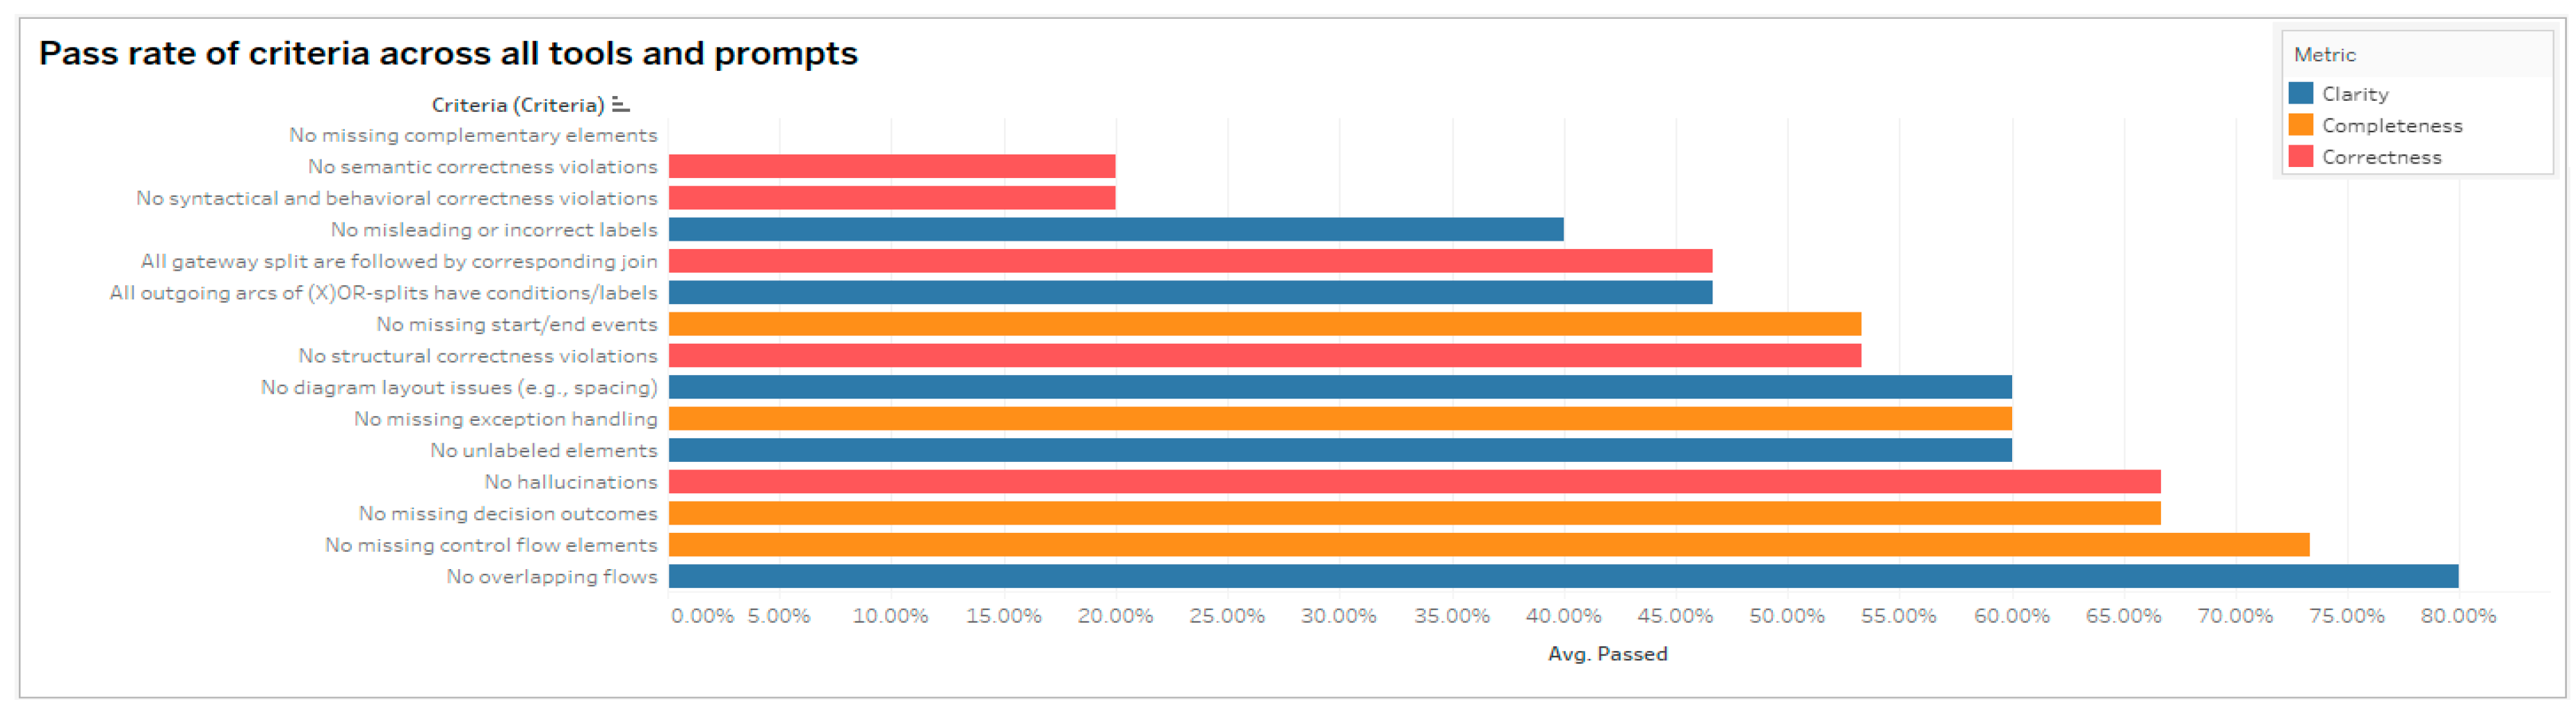

Table 1.
Ordinal Scale Scoring.
| Score | Quality Level | Interpretation |
|---|---|---|
| 5 | Very High | No issues observed. The model is complete, correct, and clearly structured. |
| 4 | High | Only one minor issue is present (low or moderate importance). Overall quality is generally acceptable. |
| 3 | Moderate | One major issue or a combination of moderate and minor issues. The model is usable but requires improvement. |
| 2 | Low | Several issues, including at least one major problem. Overall quality is significantly impaired. |
| 1 | Very Low | Multiple major issues are present, including two or more of high importance. The model lacks usability and reliability. |
Table 2.
Descriptive Statistics.
| Metric | A | B | C | D | E | Mean | St. Dev. |
|---|---|---|---|---|---|---|---|
| Clarity | 2.42 | 3.64 | 4.09 | 3.18 | 0.91 | 2.85 | 1.12 |
| Correctness | 1.52 | 2.73 | 3.33 | 1.97 | 1.36 | 2.18 | 0.75 |
| Completeness | 3.33 | 0.61 | 4.55 | 4.55 | 0.45 | 2.70 | 1.82 |
Table 3.
Pearson Correlation Coeffients.
| Metric | Clarity | Correctness | Completeness |
|---|---|---|---|
| Clarity | 1.000 | 0.882 | 0.525 |
| Correctness | 0.882 | 1.000 | 0.297 |
| Completeness | 0.525 | 0.297 | 1.000 |
Disclaimer/Publisher’s Note: The statements, opinions and data contained in all publications are solely those of the individual author(s) and contributor(s) and not of MDPI and/or the editor(s). MDPI and/or the editor(s) disclaim responsibility for any injury to people or property resulting from any ideas, methods, instructions or products referred to in the content. |
© 2025 by the authors. Licensee MDPI, Basel, Switzerland. This article is an open access article distributed under the terms and conditions of the Creative Commons Attribution (CC BY) license (http://creativecommons.org/licenses/by/4.0/).
Copyright: This open access article is published under a Creative Commons CC BY 4.0 license, which permit the free download, distribution, and reuse, provided that the author and preprint are cited in any reuse.


