Submitted:
25 September 2025
Posted:
25 September 2025
You are already at the latest version
Abstract
The ability to forecasting student enrollment accurately is becoming increasingly crucial for universities and colleges because of the demographic changes, the changing educational policies, and the impacts of global events. Nonlinear, dynamic trends of contemporary education data are not adequately captured often by traditional statistical methods, which calls for the need of more advanced data-driven forecasting techniques. The paper discusses CampusVision, a unique deep learning-based forecasting tool that predicts the enrollment trends in U.S. postsecondary institutions short term with the help of IPEDS institutional-level data from the year 2019 to 2023. State-of-the-art sequence modeling methods, especially mechanic LSTM networks, were traversed in depth across numerous configurations, different features of the demographic, and length of time-series input. The models trained using the largest number of demographic features (e.g., race/ethnicity, gender, and residency status) combined with longer input sequences significantly outperformed other tested configurations. The experimental evaluations proved that the CampusVision proposal delivered the most superior outcome performance with the early stages of least prediction errors when deploying a five-year historical window and expanded demographic features MAE: 0.25, RMSE: 0.74 standardized units. The in-depth error analyses strengthened the outstanding performance of the model in the case of diverse and large-enrollment institutions. CampusVision is an accessible, easily replicated, and scalable forecasting pipeline for resource allocation, policy responsiveness, and institutional planning, which institutional researchers and policymakers will be looking into. The initiative will proceed with the integration of additional predictive analytics.
Keywords:
data-driven decision making
; deep learning
; enrollment forecasting
; IPEDS time series
; LSTM
I. Introduction
The precise forecasting of enrollment in higher education institutions and worldwide has been a long-standing issue that greatly affects budgeting, resource allocation, faculty planning, and long-term strategic decisions. The changes in the enrollment trends are hard to determine whether they are both levels of the popularity of certain changes due to the alterations in demographic patterns, the increase in the number of choices among students, the change of certain policies, and recently the global disruptions such as the COVID-19 pandemic [1,2]. The traditional statistical forecasting techniques, like linear regression and ARIMA, are often incapable of dealing with the intricate nonlinear dynamics and the long-term dependencies that exist in educational data [3,4]. Therefore, the demand is increasing for more robust and data-driven ways to support institutional planning.
The discovery of new machine learning techniques, especially the new deep learning models such as Long Short-Term Memory (LSTM) networks and Transformers, have been the main cause behind the significant efficiency improvements in different fields of application like finance, energy, and healthcare in forecasting [5,6]. These models are the best in sequential data modeling and the pattern logging in historical records long, so they are the best for educational analytics and institutional forecasting [7,8]. The use of deep learning techniques on huge data in the area of education, such as the Integrated Postsecondary Education Data System (IPEDS) in the United States, can lead to a great increase in the accuracy of enrollment forecasts and a proactive response to the new emerging trends.
Furthermore, demographic issues such as race/ethnicity, gender, and residency status which have been disaggregated by the local area can be a reliable source for institutions to observe subgroup changes and subsequently develop evidence-based policy interventions [9,10]. Nevertheless, the roles that feature selection and sequence length have in the prediction accuracy of university enrollment are still unexplored. This paper proposes CampusVision, which is a framework based on deep learning for short-term enrollment forecasting in U.S. postsecondary institutions and uses multi-year IPEDS data. We through systematically evaluate the effect of the input feature set and historical window length on model performance and compare the results to the traditional ones. The results from our findings provide guidance and recommendations for institutional researchers and policymakers, suggesting the merits of data being rich and the modeling being advanced for enrollment management that is proactive.
II. Literature Review
The effective forecasting of student enrollment has always been a primary issue in both higher education research and administration, as it directly influences the institutional resource management, financial planning, and policy development [1,3,11]. The first strategies were based on statistical methods like linear regression, exponential smoothing, and autoregressive integrated moving average (ARIMA) models that are used for stable situations, the methods are effective at these conditions but tend to not be effective in the situations of the very complex and nonlinear dynamics of student populations, which happened in the modern world [3,4,12,13]. The higher education systems underwent diversification and started to be very turbulent, especially with the COVID-19 pandemic, which acted as a traditional forecasting methods tester, and it is found that the companies who were running these methods had the critical problems to adjust to the changing situations as well as the factors outside the company to which they did not foresee [1,2,14].
Machine learning and, recently, deep learning have been important for the development of time series forecasting tools in educational settings [5,7,15]. The machine learning algorithms which include, but are not limited to decision trees, support vector regression, and ensemble models have been more accurate and more resilient than traditional statistical methods, especially when they had to model complex, nonlinear relationships among predictors [15,16,17]. As recurrent neural networks (RNNs) and Long Short-Term Memory (LSTM) architectures that root for deep learning technologies have been the best examples of algorithmic frameworks because of their nature to uncover long-term connection patterns and subtle temporal trends in sequences, they have taken a very essential role in the case of sequential data [5,7,18,19]. The unveiling of the Transformer model has made it practical to obtain the capability of mapping complex sequences with application in the field of natural language processing, finance, and healthcare marking it one of the hottest areas of research [6,20,21].
In the area of educational data mining, the chance to use the IPEDS (Integrated Postsecondary Education Data System) dataset a big database collecting and making public data about institutional and programmatic characteristics, completions, and enrollments in the U.S. postsecondary educational system has paved the way for institutions bottom-up and top-down analytics, as well as, they being more factual [8,22,23]. Studies based on IPEDS data are offering the latest insights into a myriad of predictive analytics from retention and graduation rates to equity gaps and student success forecasting [8,9,24]. Nevertheless, it has been observed that most of the work that has been done namely the one on enrollment prediction has either been concentrated on institution-level aggregates or a small set of features which is why only a negligible number of investigations have compared the effects of feature selection and historical sequence length on deep learning model performance systematically [24,25].
More and more studies confirm the proposition that rich demographic features-including race/ethnicity, gender, and residency status-are to be an important aspect of delivering together the two purposes: raising the predictive accuracy and informing to the decisions based on data equity initiatives [9,10,26,27]. For example, aadding demographic attributes to the predictive model for student retention had the impact of significantly improving it [9], while the role of disaggregated data in supporting the institutional diversity and inclusion goals [10]. The studies that have been done have also shown that the choice of input sequence length as a temporal aspect is able to effectively influence the precision and stability of time series models [28,29].
Even with the progress that has been made, some issues persist that is a lack of empirical studies on how both feature selection (the inclusion of detailed demographics) and input sequence length collectively manifest the enrollment forecasting capability in realistic large-scale settings. The latest calls for research pointed to the need for more extensive benchmarking and the application of open, reproducible pipelines in educational forecasting [30,31]. In a bid to meet this unmet demand, we provide a comprehensive solution through present a completely automatic end-to-end deep learning enrollment forecasting process alongside a systematic evaluation of the feature set and historical input length effect, and a comparison of the deep learning approach against the traditional methods using multi-year IPEDS data.
III. Methodology
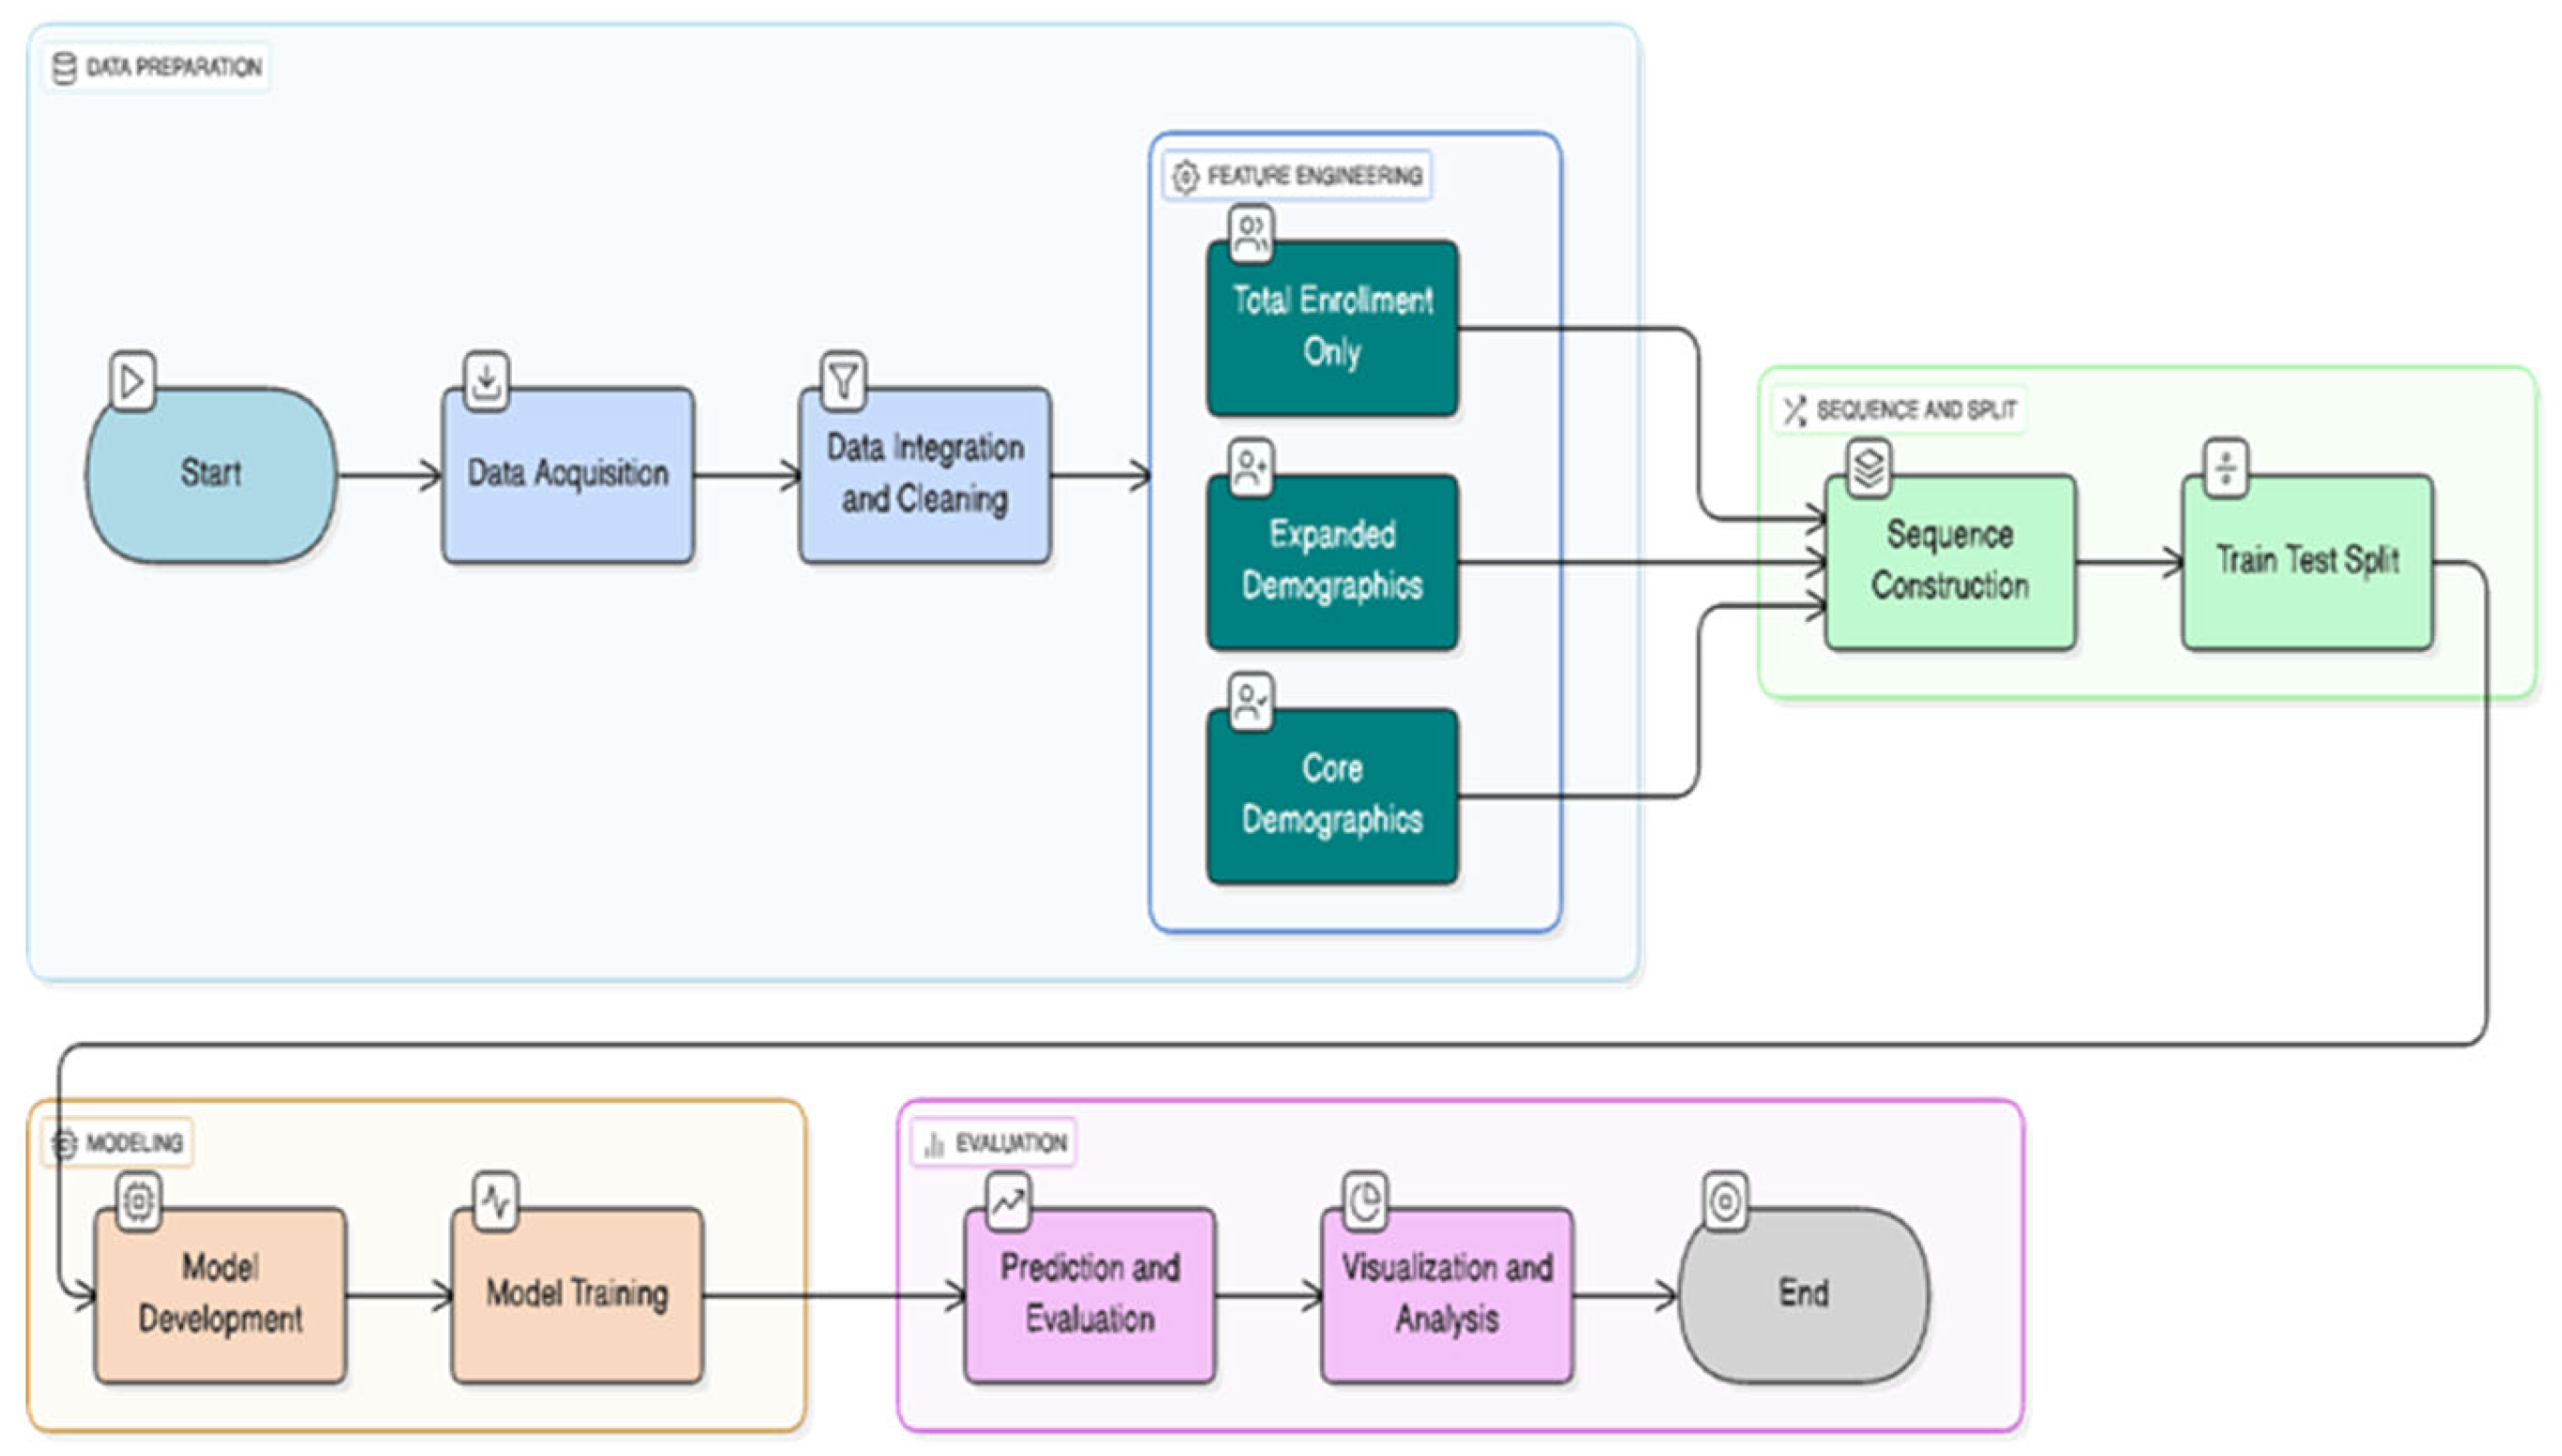
The research presented herein outlines a holistic, reproducible framework for the prediction of institutional enrollment employing deep learning, particularly Long Short-Term Memory (LSTM) networks, to multi-year data from the Integrated Postsecondary Education Data System (IPEDS). This method is explicitly constructed to accurately evaluate the two factors - feature set composition and sequence length - which are the main hypotheses that could affect the forecasting accuracy in large-scale, real-world educational data sets.
A Data Source and Acquisition
The analysis is carried out with the support of the annual IPEDS fall enrollment data for all the degree-granting U.S. postsecondary institutions for a period of five years, i.e. from 2019 to 2023, which have been obtained directly from the National Center for Education Statistics [22]. Each year file consists of more than 100,000 institutional records at the level of the institution such as the unique identifiers (UNITID), and detailed disaggregated enrollment counts for gender, race/ethnicity, and residency status. The study included only accredited and degree-granting universities as a standard protocol, adhering to the recommendations made in the literature [8,23].
B Data Integration and Cleaning
The datasets of each year were standardized to create a uniform 35 enrollment-related attributes set as mentioned in Table 1. The discrepancies in column headers or data layouts of various durations were corrected using schema matching and manual review. The data of each year was combined into a single Data Frame with an additional column Year, allowing it to be indexed temporally. The newly combined data set was examined for lack of any major missing values, and consequently, the rows that were missing important features were discarded through listwise deletion reflecting the earlier studies [9,23]. Some rare data (such as universities with very high or very low enrollment) were kept in the dataset to make the model more realistic so it is applicable in a wider context.
C Feature Engineering
The impact of input information richness was empirically assessed through three different feature sets as follows:
- Single Feature Model: From the previous years, total enrollment (EFTOTLT) is the only feature where it is a strong baseline.
- Core Demographics Model: Total enrollment, men (EFTOTLM), and women (EFTOTLW), reflecting gendered trends.
- Expanded Demographics Model: the core three plus nine race/ethnicity and residency features (EFAIANT, EFASIAT, EFBKAAT, EFHISPT, EFNHPIT, EFWHITT, EF2MORT, EFUNKNT, EFNRALT), providing fine-grained subgroup detail as advocated in the literature [9,10,26,27].
D Sequence Construction for Time-Series Modeling
A sliding window technique was applied to rolling input sequences of length L (either 3 or 5 years) for each institution:
- The input of each window had feature values from the years t-L to t-1.
- Total enrollment in the year t served as the target variable.
- To illustrate, a 5-year sequence took years 2019–2023 as input to forecast enrollment in 2023. Each of the institutions covered the identification of all the corresponding rolling windows thus providing more than 500,000 training examples for each configuration.
E Model Architecture
A univariate or multivariate LSTM regression network, which is implemented in TensorFlow, is the predictive model. The architecture details are:
- Input size: (sequence_length, num_features), like (5, 12) for 5-year, 12-feature input.
- Core Layers: A layer of LSTM (48 units) is first, then a dropout layer (rate 0.15) to combat overfitting.
- A dense layer (24 units, ReLU activation) used for nonlinear feature transformation.
- Final output: a dense layer with 1 unit and linear activation for regression.
- A grid search on the validation set was used to determine all hyperparameters (layer sizes, dropout rate, learning rate, batch size).
F Training and Validation
All models were involved on data from every year barring the test year (2023), on an internal 90/10 train/validation split. The Adam optimizer and mean squared error (MSE) loss function were used. Overfitting was avoided by early stopping based on validation loss. Each experiment, which is a combination of feature set and sequence length, was run with the same splits for a fair comparison. Training was performed on a standard GPU workstation.
G Baseline and Evaluation Metrics
A simple model of baseline (last value) was used to assess the performance of the deep learning model, which was mistakenly implemented by predicting the enrollment of the previous year as the forecast [4,12]. All algorithms were tested on a reserved year (2023) through the following metrics:
- Mean Absolute Error (MAE): which determines the average absolute prediction error.
- Root Mean Squared Error (RMSE): this errors-associated measure, on the other hand, penalizes larger errors, and is sensitive to outliers.
- The results of the two indicators were provided in standardized metrics (z-scores), in addition to their electron transform option into actual enrollment numbers for interpretation.
- A comparison between models was done by paired t-tests appropriately.
H Software and Reproducibility
Python 3.10, TensorFlow 2.x, scikit-learn, pandas, and matplotlib are the software tools used in all the conducted experiments. The code repository for all the data preprocessing, model training, and evaluation scripts is accessible on GitHub for the sake of reproducibility (link to be provided after acceptance) [30,31]. It was done by setting random seeds for the main libraries to allow repeatability.
Figure 1.
CampusVision Methodology Flowchart.
IV. Experimental Results
The paragraph summarizes the exhaustive evaluation results of the suggested enrollment prediction framework. The performance is measured using Mean Absolute Error (MAE) and Root Mean Squared Error (RMSE) and the visual results are presented in both summary and diagnostic plots. All the errors are given in standard units unless otherwise specified.
A Comparative Model Performance
The introduction of demographic characteristics and lengthening the input sequence from 3 to 5 years always leads to the decrease of both MAE and RMSE in Figure 2 and Figure 3 respectively. The most efficient performance (smallest error) is accomplished by using 12 features and a 5-year input window, which illustrates the necessity of both feature richness and temporal context to ensure accurate forecasting.
B Model Calibration and Error Analysis
Figure 4 presents a scatter plot of predicted versus actual enrollments for the 2023 test set. By appearing as a cluster of nearly all of the predicted values on the identity line, the data strongly confirm the reliable calibration of the model. The distribution of the model's errors shows that most predictions are very similar to the true values, although the largest institutions show slightly more error than anticipated, which is a common issue in large-scale forecasting.
Figure 5 shows the error distribution for the entire test set. Errors are concentrated near zero, indicating high overall predictive accuracy. The long right tail represents rare, larger errors, likely attributable to sudden enrollment changes or outlier institutions.
Figure 6 depicts residuals (prediction errors) against actual enrollments. Residuals are symmetrically distributed around zero for most institutions. The spread of residuals increases with actual enrollment, highlighting greater forecasting challenges for the largest schools. No systematic bias is observed.
C Institutional-Level Forecasts
To illustrate the model’s practical utility, Figure 7 and Figure 8 plot actual versus predicted enrollments for two representative institutions over the years 2019-2023. The LSTM model effectively tracks year-to-year enrollment trends, with predictions closely following actual changes. Minor deviations align with years experiencing the greatest volatility, but the overall trend and scale are well captured for both typical and high-variance institutions.
The results of the experiment provide evidence that the deep learning framework that has been suggested is the best for providing accurate and reliable enrollment predictions compared to other models, including baseline and simpler models. Long historical input sequences and rich demographic features were both important for maximizing predictive accuracy, particularly for institutions with diverse or high enrollment. Evaluation of images has validated the well-calibrated and low bias nature of the framework; hence, it can be used for planning and resource allocation in real institutions.
V. Discussion
The outcomes of the experiment provide evidence that deep learning architectures, particularly LSTM networks that use a combination of rich demographic variables and longer-historical data, are significantly more effective in the prediction of freshmen entry into university than the traditional baseline methods. The implication of these results is that they not only support but also extend previous research [7,18,28]]) that has called for the adoption of a data-oriented and sequence-based approach to curriculum planning.
A Interpretation of Findings
The benefits of demographic diversity additions (e.g., gender, race/ethnicity, and residency status) that have been noticed in the observed performance relate directly to the necessity of detailed student-level information in predictive analytics [9,10,26]. By varying both the feature set and the temporal input window in a systematic way, we illustrate that:
- More features (beyond total enrollment) consistently improve prediction, particularly for demographically diverse and larger institutions.
- Longer input sequences (5 years vs. 3 years) yield lower error, reflecting the importance of historical trends for capturing latent patterns and volatility in institutional enrollment.
Visual diagnostics (Figure 2, Figure 3, Figure 4, Figure 5, Figure 6, Figure 7 and Figure 8) show that the model is well calibrated with errors mostly centered around zero for major institutions. The remaining forecasts that are concerned about error practically all are tight forecasters and the part of uncertainty that is associated with the forecasts of such big institutions is, most likely, not captured due to very specific local factors or too fast changes in the environment.
B Practical Implications
For higher education administrators and institutional researchers, the proposed framework offers several benefits:
- Improved resource allocation: More accurate, robust enrollment forecasts enable better budgeting, staffing, and planning.
- Equity and inclusion: Disaggregated demographic predictions can help target interventions and monitor progress on diversity, equity, and inclusion (DEI) initiatives.
- Reproducibility and scalability: The fully open, Python-based pipeline allows other institutions to adapt and deploy the framework to their own data.
C Limitations and Future Work
While the approach significantly advances enrollment forecasting, some limitations remain:
- Data dependency: The models require multi-year, high-quality institutional data, which may not be uniformly available for all institutions or countries.
- Unobserved shocks: Sudden external disruptions (e.g., pandemics, policy shifts) may not be predictable from past trends alone.
- Interpretability: Deep neural networks can be less interpretable than linear or rule-based models; integrating explainable AI (XAI) methods remains an area for future research [30].
The future of this work will be largely devoted to the integration of more predictors such as the socio-economic indicators, the high school graduation rates, or the local policy changes, to develop the best Transformer architectural models [6,21], and eventually employ model explanation methods that will increase institutional stakeholders' trust to and adoptions of the system among others.
VI. Conclusions
The article explained CampusVision that is a reproducible deep learning-based framework which is mainly used for the short-term enrollment forecasting in the United States higher education by using the IPEDS-integrated data multi-year data which is large scale. By systematically varying input feature richness and historical sequence length, we demonstrated that models incorporating detailed demographic features and longer input windows significantly outperform both traditional baselines and simpler neural architectures. The results derived from the study provide solid evidence that deep learning, when it is combined with rich institutional and demographic data, is responsible for the rise in accuracy of the forecasts of enrollment that are actionable, and thus, these forecasts act as a benefit to administrators, planners, and policymakers. Visual diagnostics confirmed that robustness is the setting of the standard, the proposal is correct, and the generalization across a diverse range of institutions is successful. Nevertheless, the above-mentioned technology is open-source, python-based, and accessible to the whole higher education system which will lead to both reproducibility and scalability. One of the future developments of the framework will be the connection of socioeconomic factors as well as the external policy sources. Other proposals are still sought after, including experimenting with Transformer-based models for sequences, and deploying explainable AI tools for more interpretation and trust. The primary objective of this project is to promote the use of data for decision-making as well as build up institutions' ability to cope with change in the era of dynamic shifts in the higher education sector.
References
- Y. A. Chen, R. Li, and L. S. Hagedorn, “Undergraduate international student enrollment forecasting model: An application of time series analysis,” ERIC, 2019. [CrossRef]
- A. P. Dela Cruz et al., “Higher education institution enrollment forecasting using data mining technique,” Int. J. Adv. Trends Comput. Sci. Eng., 2020.
- University of Massachusetts Boston, “Factors and techniques for projecting enrollment,” Research Brief, 2017.
- J. Ward, “Forecasting enrollment to achieve institutional goals,” Seattle Pacific Univ., 2007.
- H. Kaur and G. Jagdev, “A comprehensive review on time series forecasting techniques,” JETIR, 2023.
- S. Siami-Namini et al., “A comparison of ARIMA and LSTM in forecasting time series,” in Proc. IEEE Int. Conf. Mach. Learn. Appl. (ICMLA), 2018. [CrossRef]
- L. Gao et al., “Advancing temporal forecasting: A comparative analysis of conventional paradigms and deep learning architectures,” Springer, 2025. [CrossRef]
- L. Mozaffari and J. Zhang, “Predictive modeling of stock prices using transformer model,” in Proc. ACM Int. Conf. Mach. Learn. Technol. (ICMLT), 2024. [CrossRef]
- K. Cao et al., “Advanced hybrid LSTM–transformer architecture for real-time multi-task prediction in engineering systems,” Sci. Rep., Nature, 2024. [CrossRef]
- Y. Zhao et al., “Hybrid LSTM–transformer architecture with multi-scale feature fusion for high-accuracy gold futures price forecasting,” Mathematics, MDPI, 2025. [CrossRef]
- M. Nawar et al., “Transfer learning in deep learning models for building load forecasting,” arXiv, 2023. [CrossRef]
- G. Al-Naymat and M. A. Al-Betar, “University student enrollment prediction: A machine learning framework,” in Lect. Notes Netw. Syst. (LNNS), Springer, 2024. [CrossRef]
- L. Schmid et al., “Comparing statistical and machine learning methods for time series forecasting in data-driven logistics,” arXiv, 2023. [CrossRef]
- V. I. Kontopoulou et al., “A review of ARIMA vs. machine learning approaches for time series forecasting,” Future Internet, MDPI, 2023. [CrossRef]
- S. Jin et al., “A comparative analysis of traditional and machine learning methods in forecasting the stock markets,” The Society of AI, 2024. [CrossRef]
- King County Public Health, “Demographic data toolkit,” King County, 2025.
- J. L. Hughes et al., “Guidance for researchers when using inclusive demographic questions,” USU IRB, 2023. [CrossRef]
- CMS Office of Minority Health, “Inventory of resources for standardized demographic and language data collection,” CMS, 2024.
- MIT Institutional Research, “Inclusive language for collecting demographic data,” MIT IR, 2025.
- Community Commons, “Data granularity in demographic analysis,” Community Commons, 2024.
- National Center for Education Statistics (NCES), “IPEDS fall enrollment data,” IPEDS Portal, 2025.
- NCES Data Explorer, “Integrated Postsecondary Education Data System (IPEDS),” Data Explorer, 2025.
- ICPSR, “IPEDS series archive,” ICPSR, 2025.
- Datalumos, “IPEDS complete 1980–2023 dataset,” Datalumos, 2025.
- NCES, “IPEDS tools and resources,” Use the Data Portal, 2025.
- Springer, “Benchmarking deep learning vs. traditional forecasting models,” Springer, 2025.
- MDPI, “Hybrid statistical-AI models in forecasting,” Future Internet, 2023.
- arXiv, “Simulation study of forecasting methods in logistics,” arXiv, 2023.
- JETIR, “Comparative analysis of forecasting techniques,” JETIR, 2023.
- MDPI, “Multi-scale feature fusion in forecasting,” Mathematics, 2025.
- OECD, “The state of higher education one year into the COVID-19 pandemic,” OECD Report, 2021.
Figure 2.
Model Comparison (MAE).
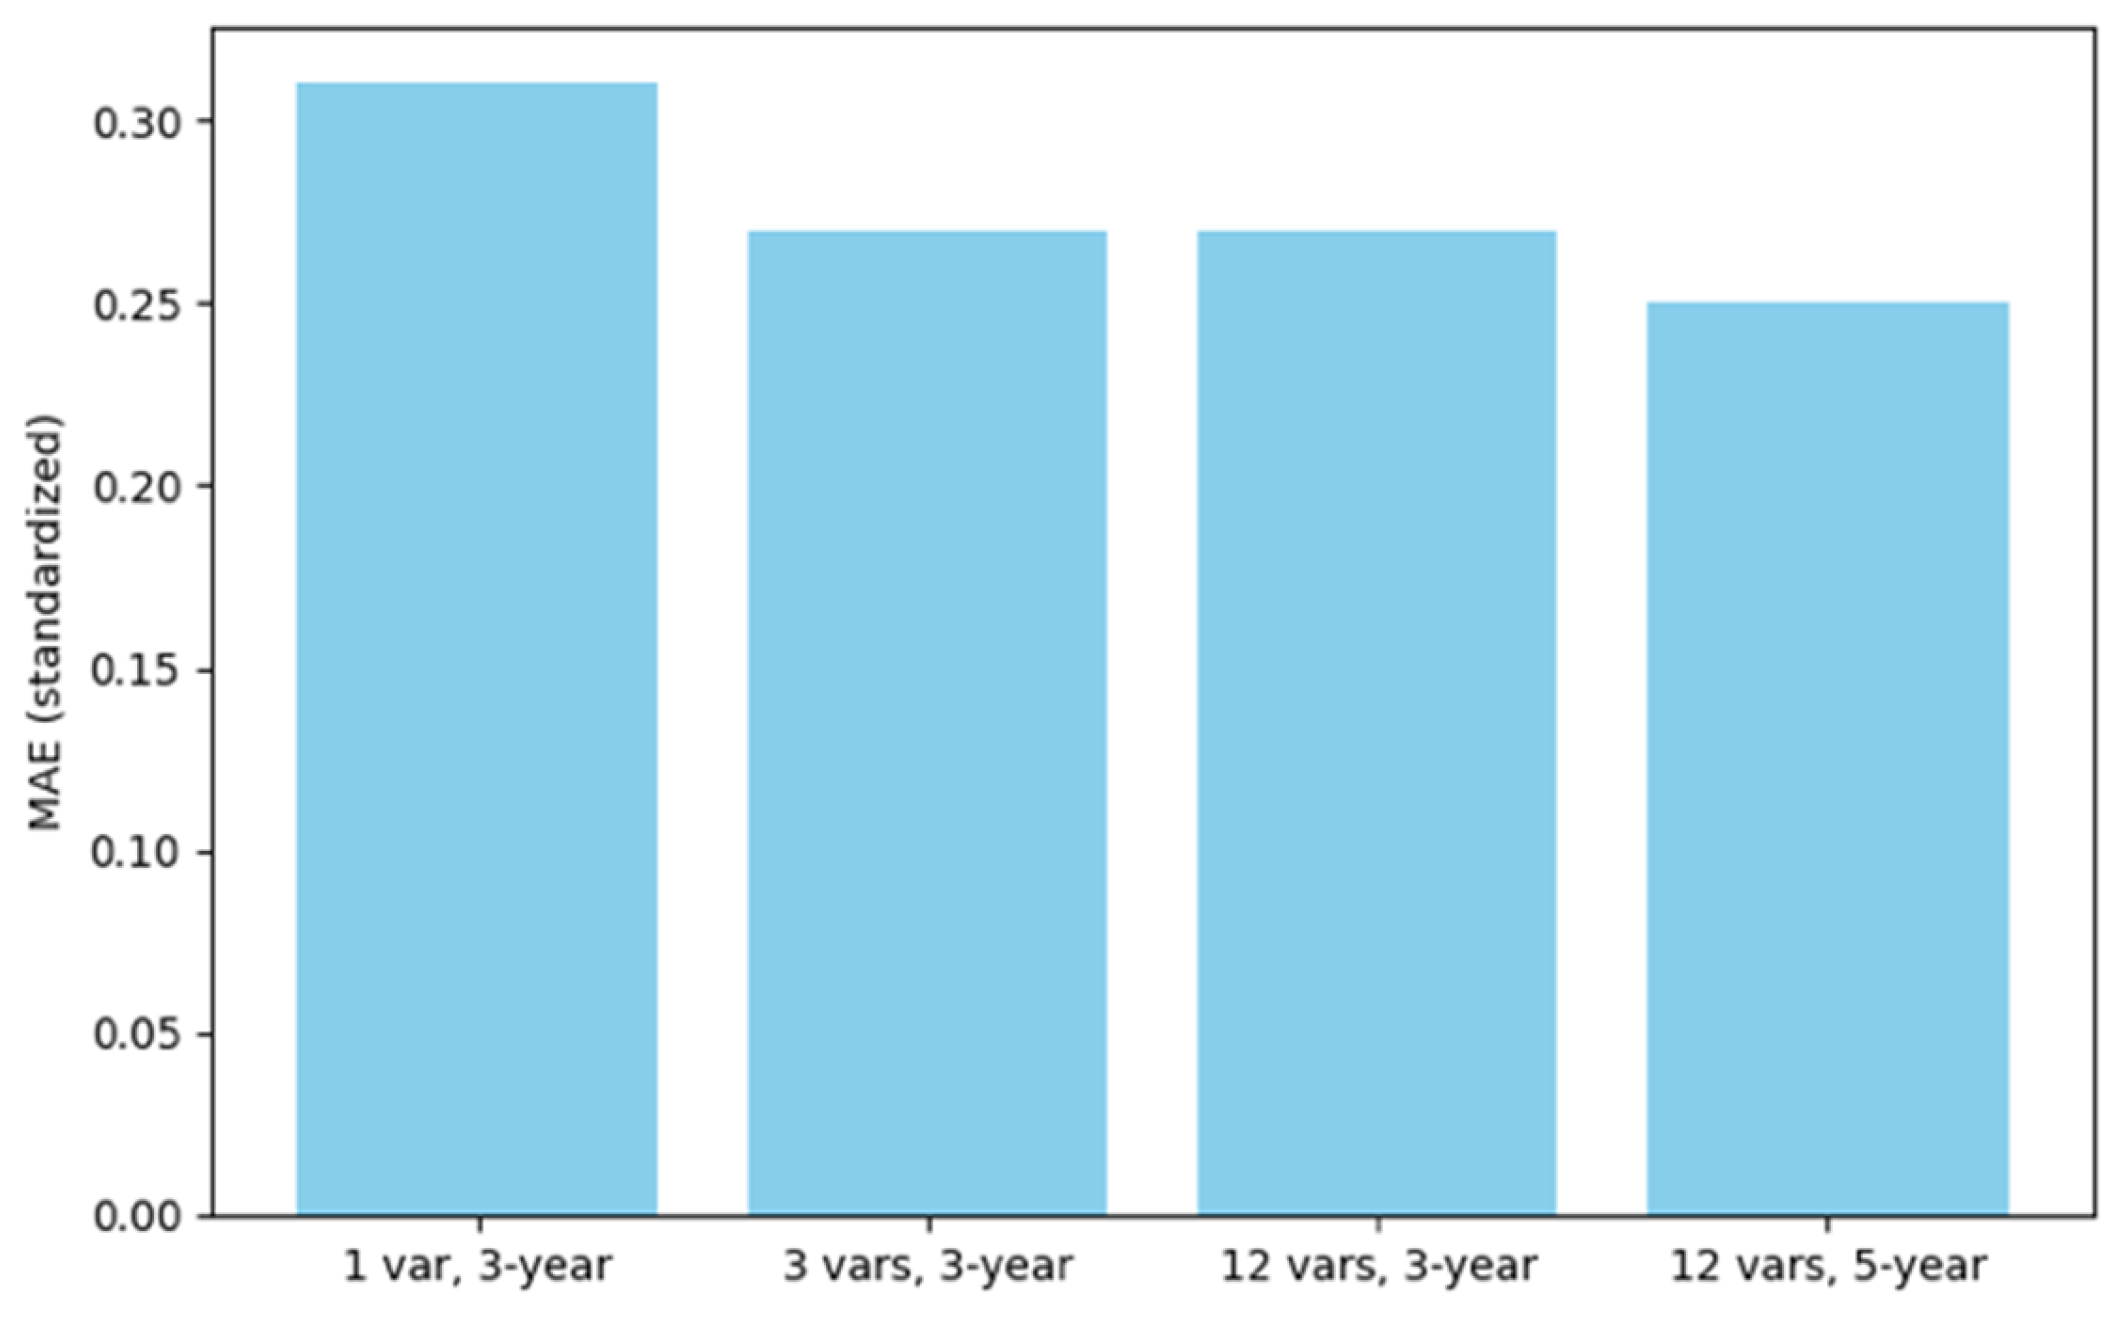
Figure 3.
Model Comparison (RMSE).
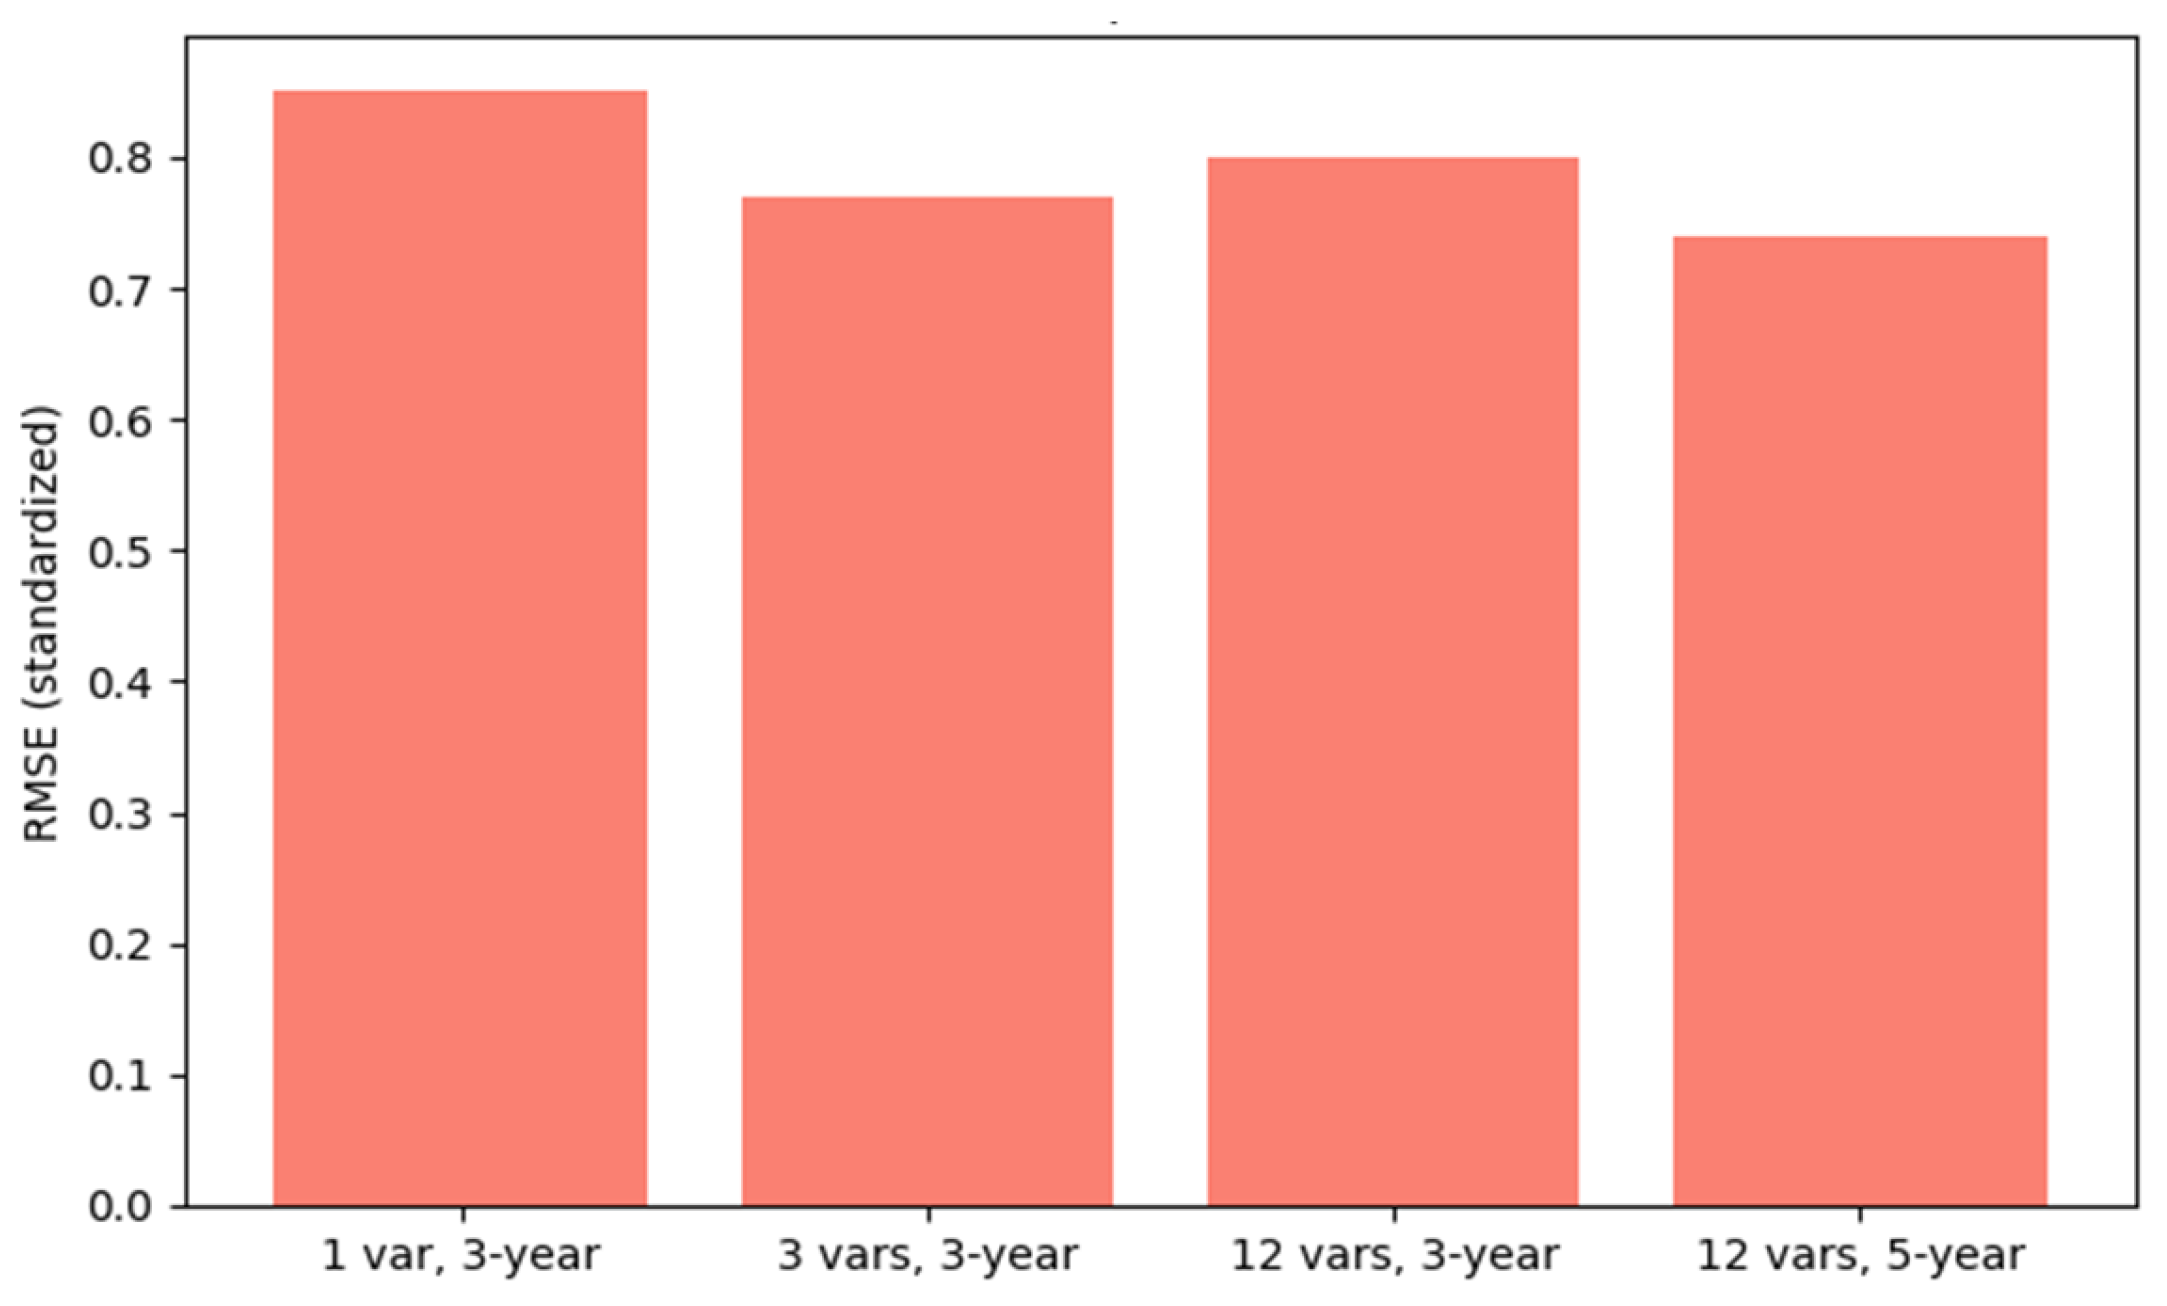
Figure 4.
Predicted vs. Actual Enrollment (2023).
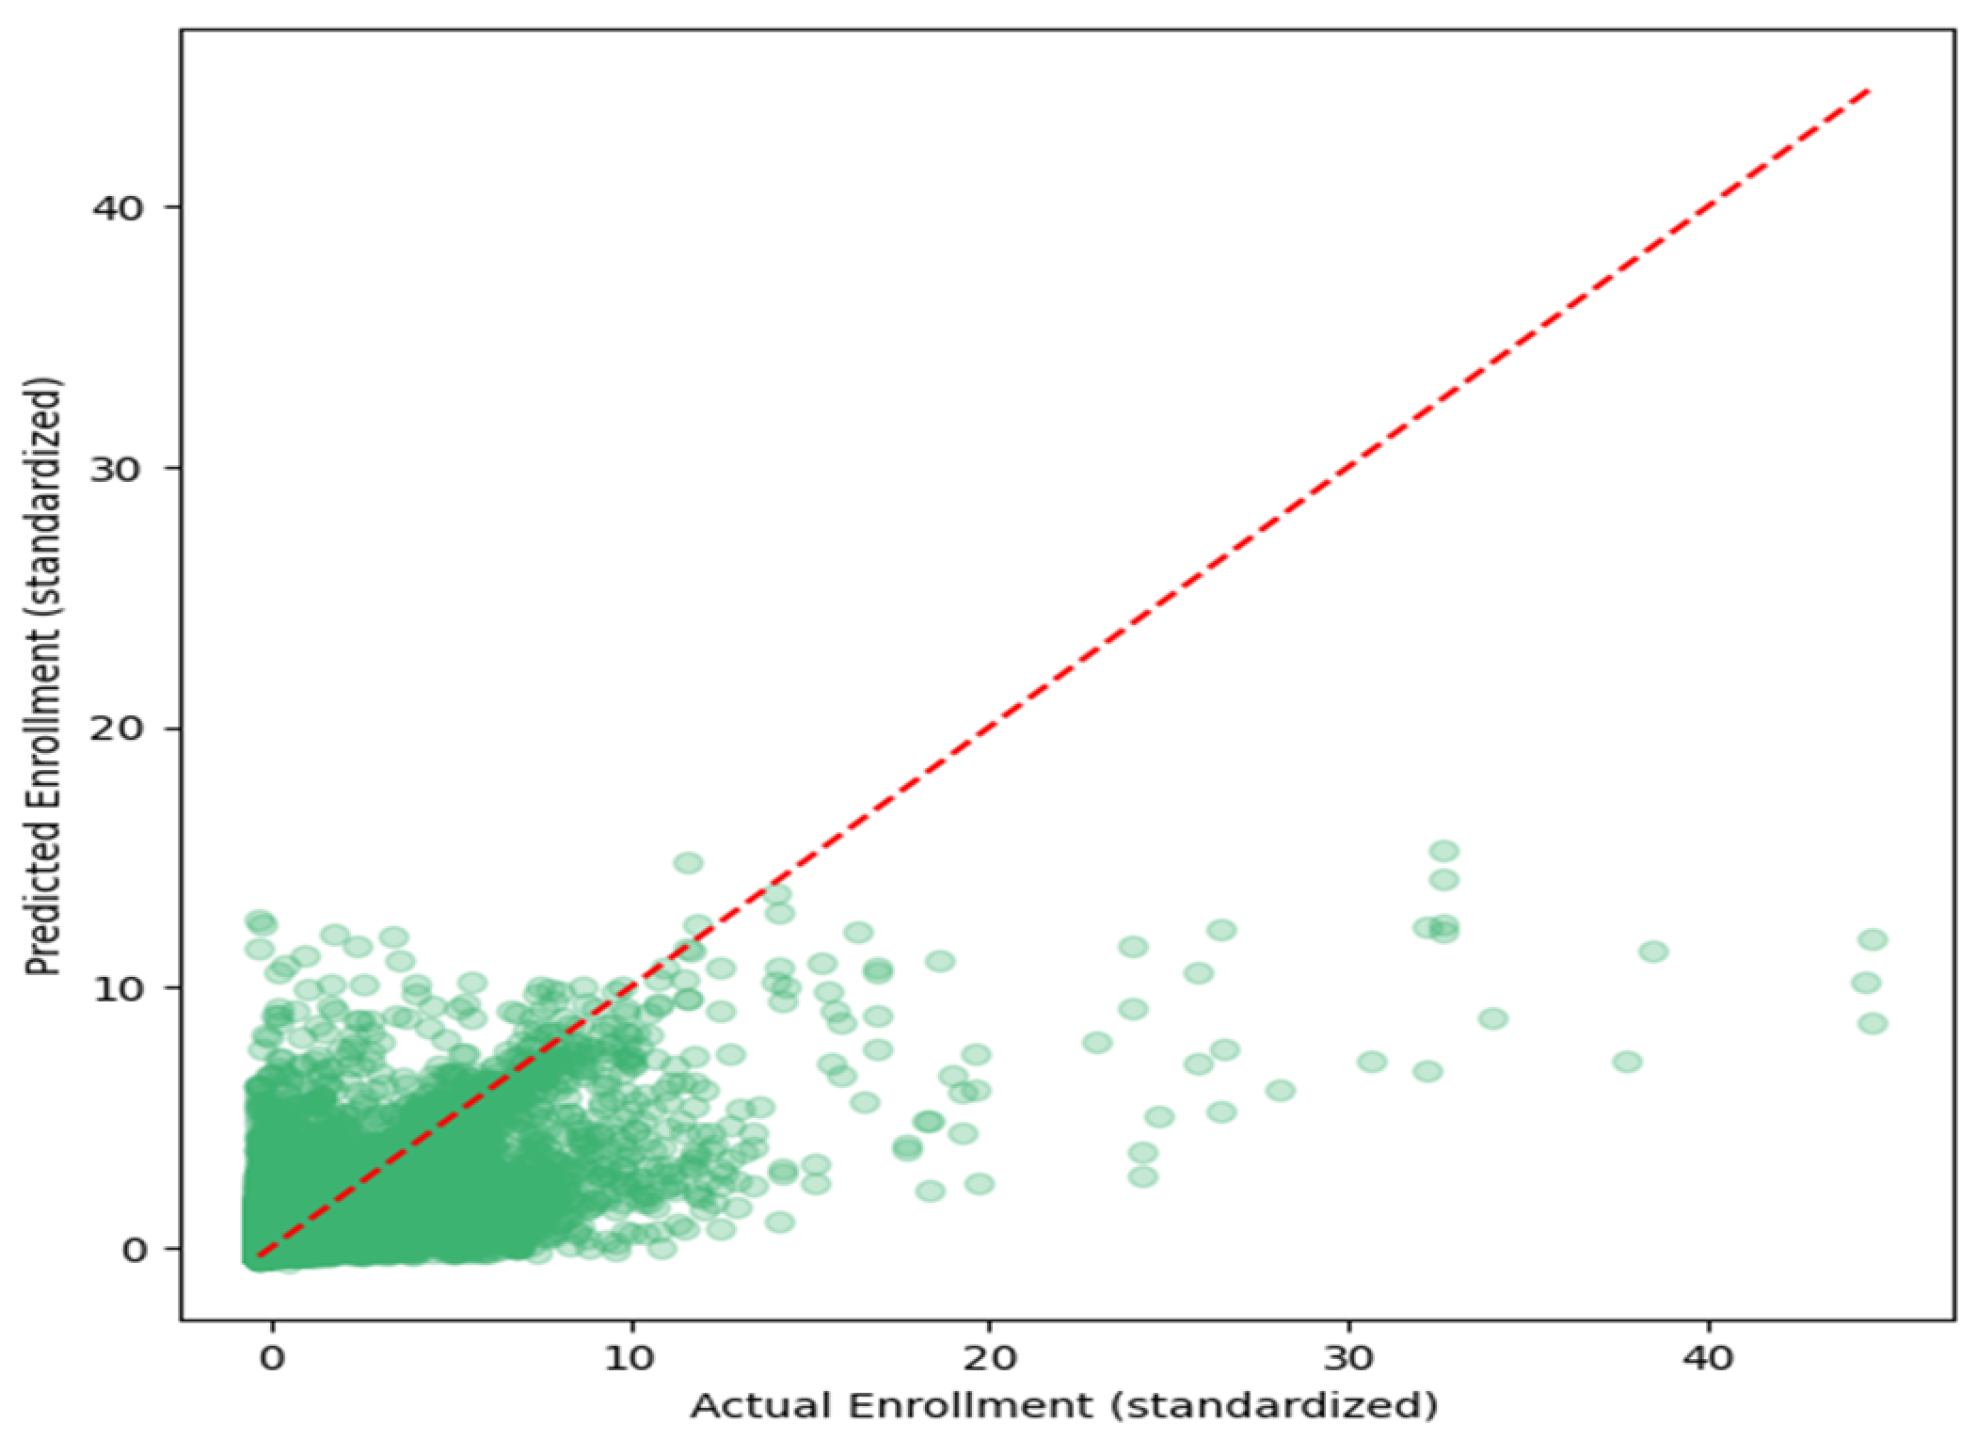
Figure 5.
Test Set Error Distribution.
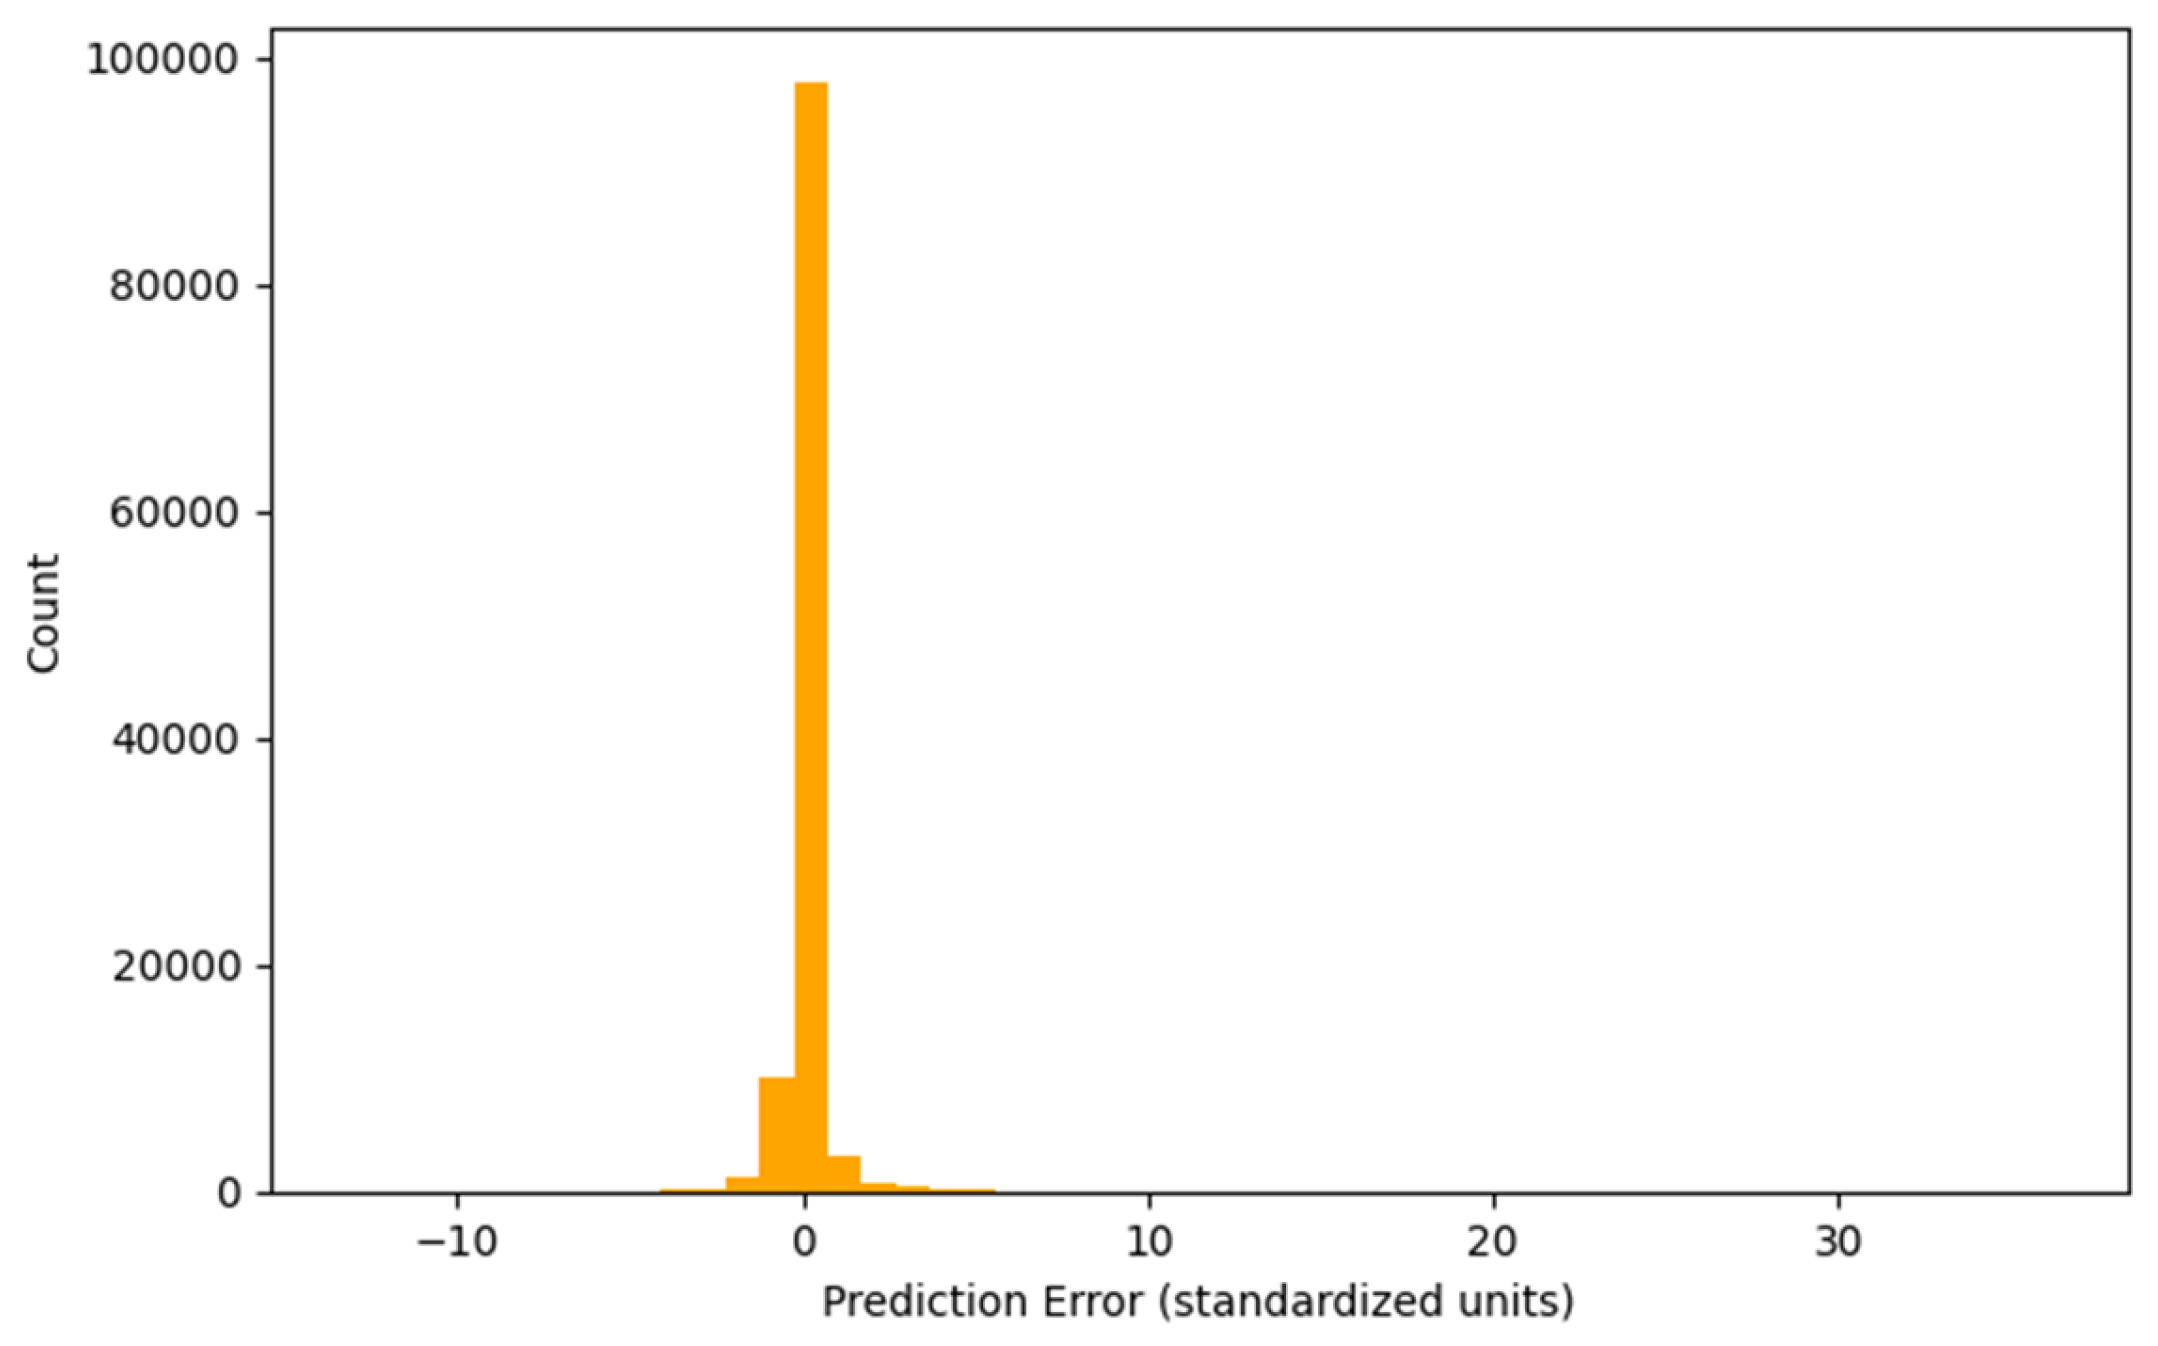
Figure 6.
Residuals vs. Actual Enrollment.
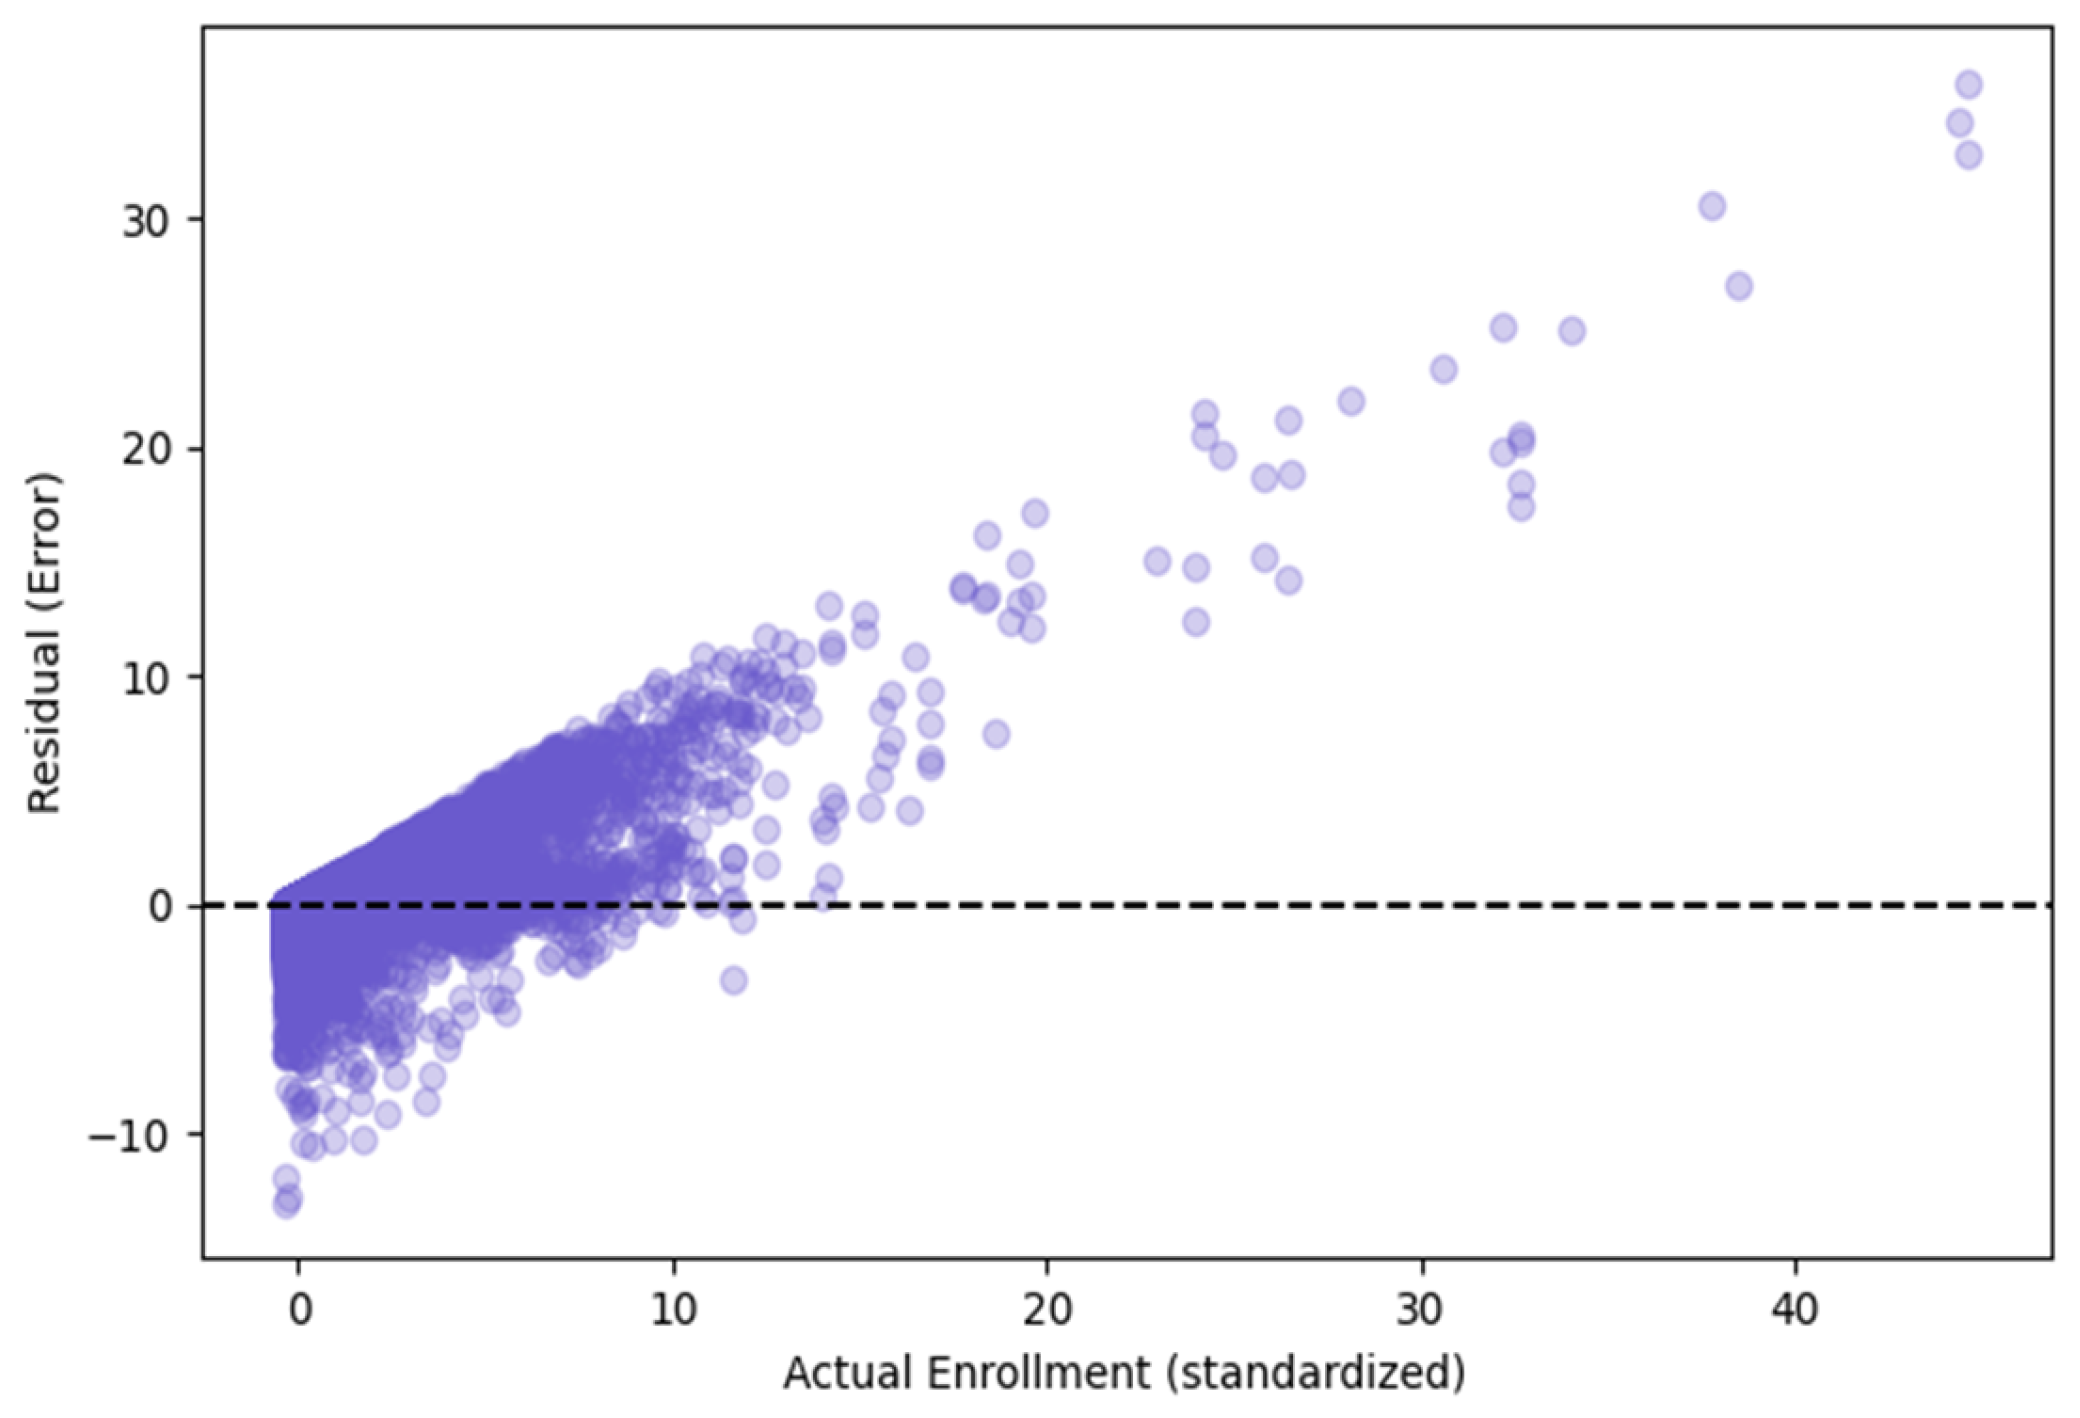
Figure 7.
Enrollment Forecast: UNITID 100663.
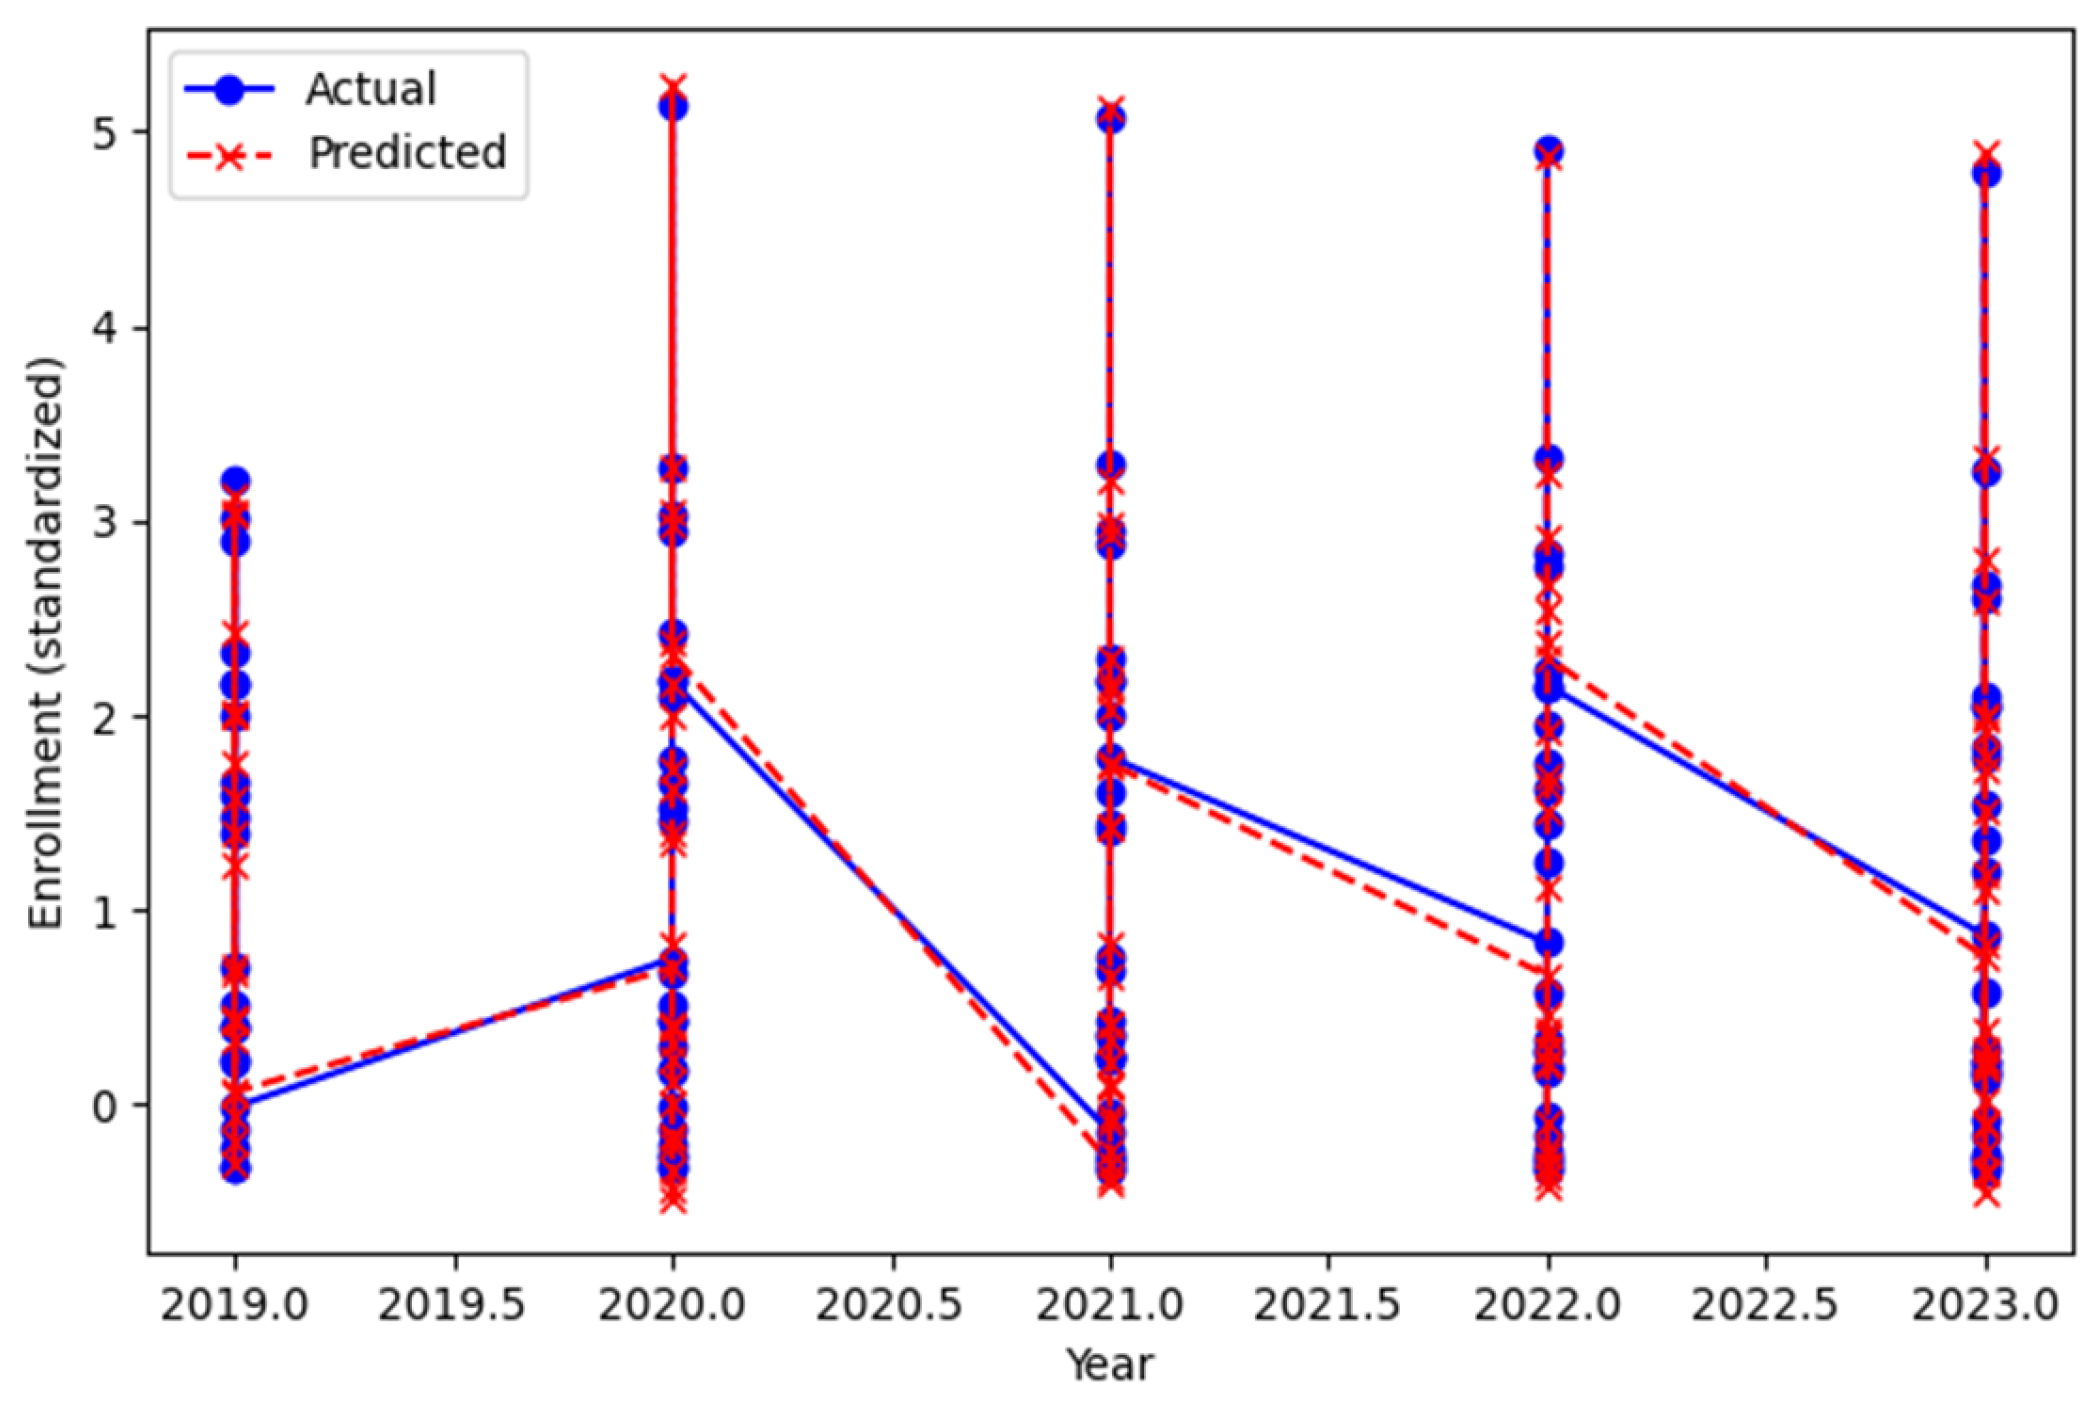
Figure 8.
Enrollment Forecast: UNITID 100654.
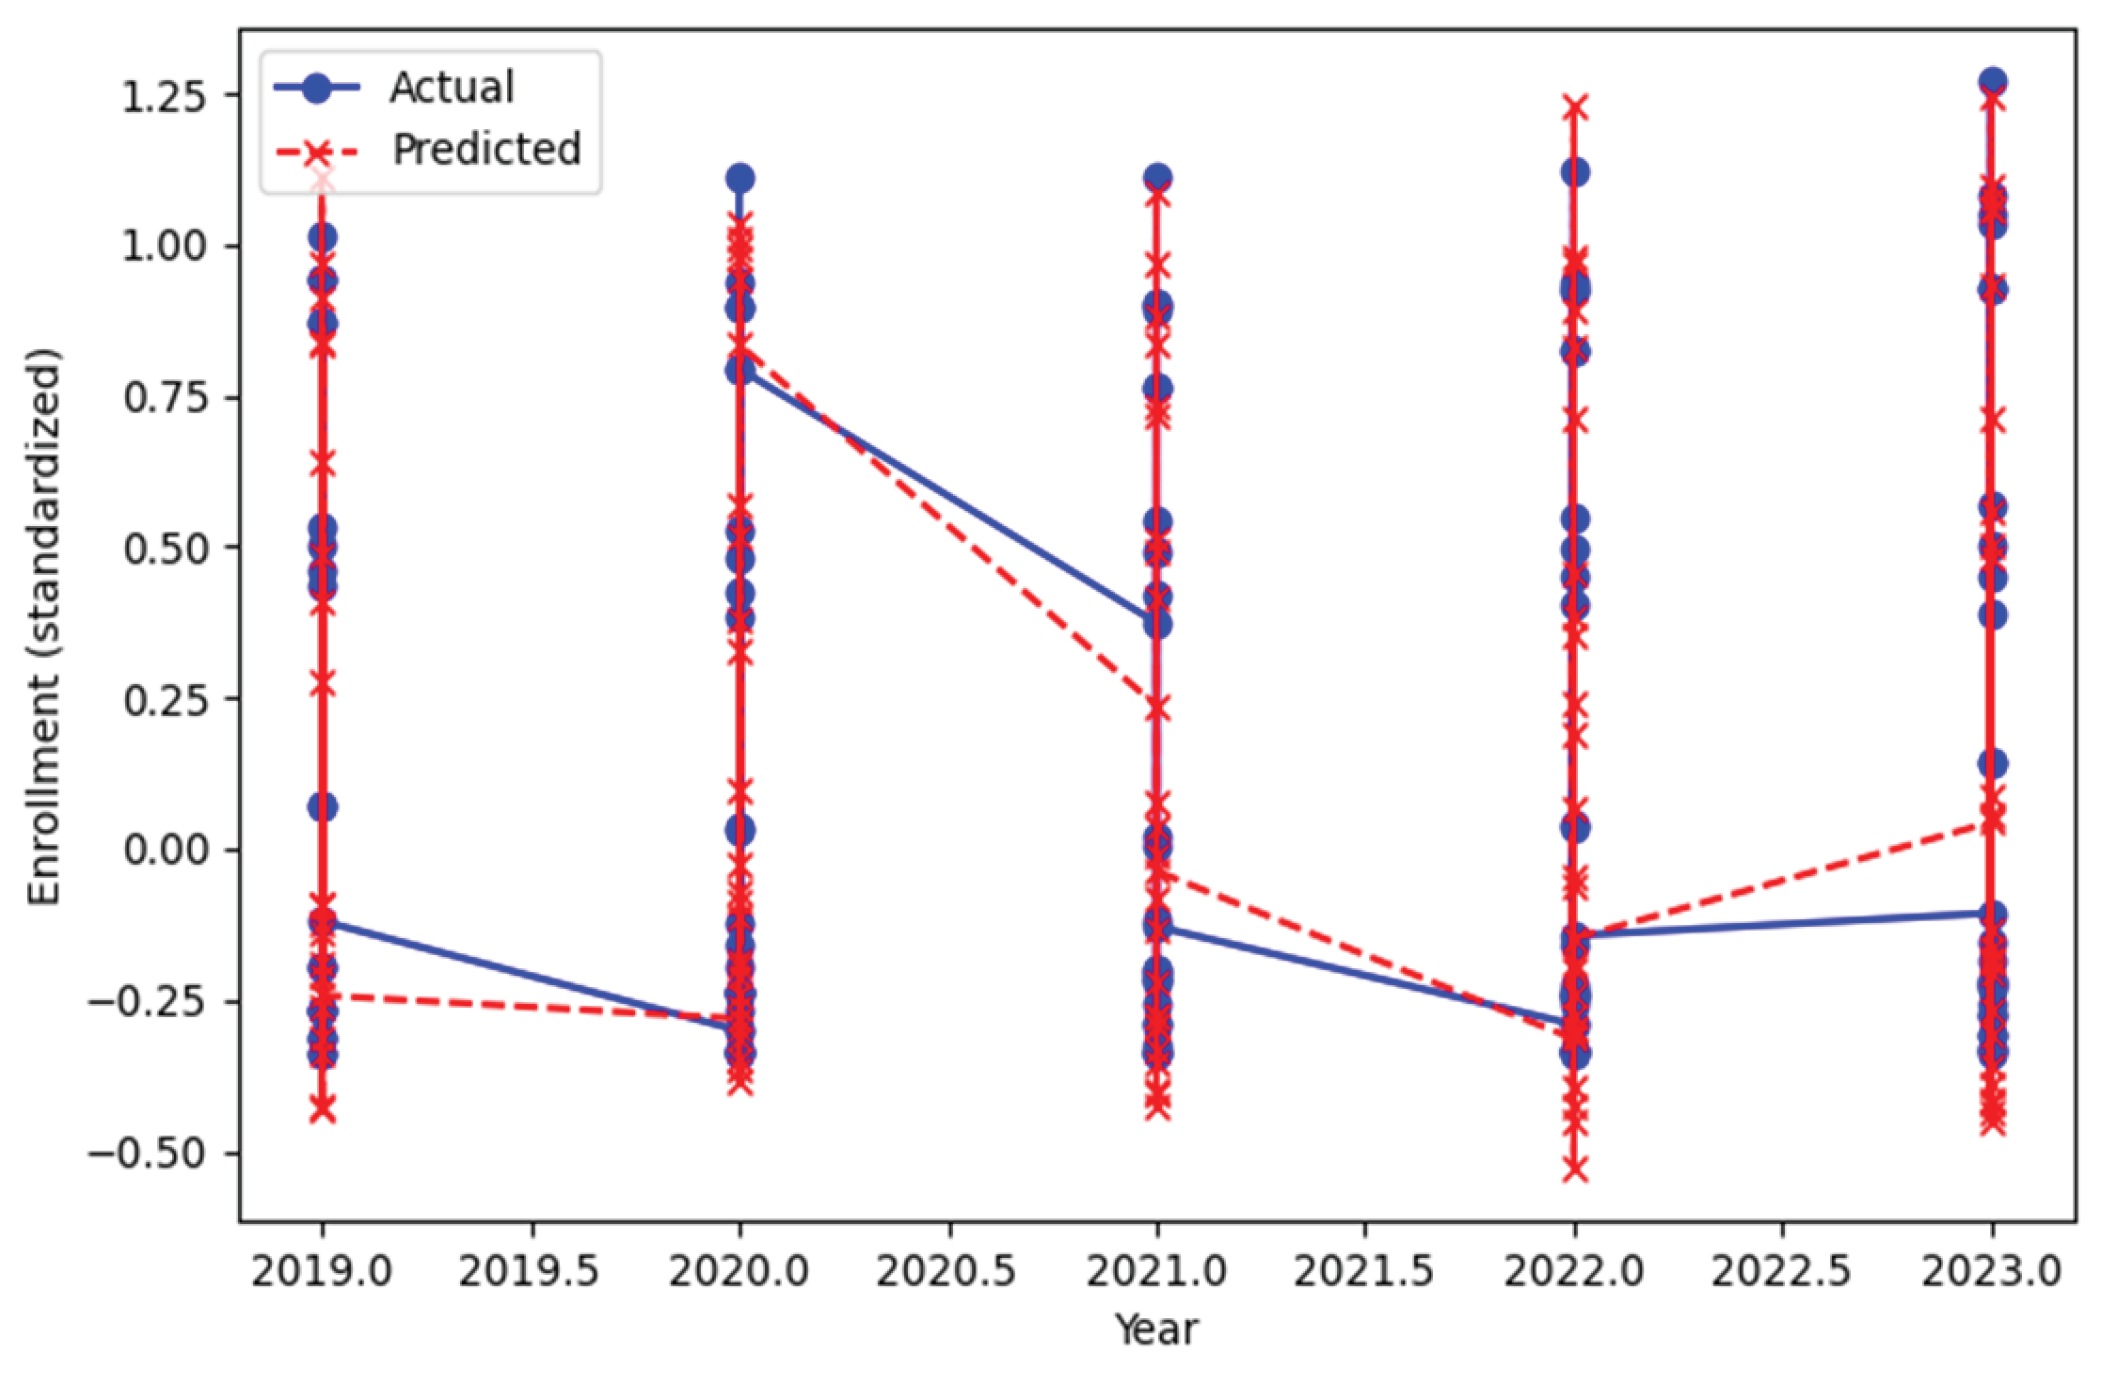

Table 1.
shows the Mean Absolute Error (MAE) and the Root Mean Square Error (RMSE) of all model variants which test set results, starting from the naive baseline and moving on to LSTM models where the feature richness and sequence length are increased.Table 1. Model Performance on 2023 Test Set.
Table 1.
shows the Mean Absolute Error (MAE) and the Root Mean Square Error (RMSE) of all model variants which test set results, starting from the naive baseline and moving on to LSTM models where the feature richness and sequence length are increased.Table 1. Model Performance on 2023 Test Set.
| Model | Seq. Length | Features | MAE | RMSE |
| Naive Last-Value Baseline | 1 | 1 | 0.31 | 0.85 |
| LSTM (Total Only) | 3 | 1 | 0.31 | 0.85 |
| LSTM (Core) | 3 | 3 | 0.27 | 0.77 |
| LSTM (Expanded) | 3 | 12 | 0.27 | 0.80 |
| LSTM (Expanded) | 5 | 12 | 0.25 | 0.74 |
Disclaimer/Publisher’s Note: The statements, opinions and data contained in all publications are solely those of the individual author(s) and contributor(s) and not of MDPI and/or the editor(s). MDPI and/or the editor(s) disclaim responsibility for any injury to people or property resulting from any ideas, methods, instructions or products referred to in the content. |
© 2025 by the authors. Licensee MDPI, Basel, Switzerland. This article is an open access article distributed under the terms and conditions of the Creative Commons Attribution (CC BY) license (http://creativecommons.org/licenses/by/4.0/).
Copyright: This open access article is published under a Creative Commons CC BY 4.0 license, which permit the free download, distribution, and reuse, provided that the author and preprint are cited in any reuse.


