Submitted:
23 September 2025
Posted:
24 September 2025
You are already at the latest version
Abstract
We design and evaluate an incident-aware, geofenced UAV surveillance system for an expanding industrial yard. The architecture integrates GPS-enabled multirotor drones, real-time object detection (YOLOv11-nano), and a geofencing stack that combines signed-distance safety margins, a quadratic programmed control barrier function (CBF) filter, and model-predictive control (MPC) for constraint satisfaction under time-varying hazards. Using VisDrone2019 with a reproducible 70/15/15 split, the detector attains mAP@0.5 = 0.912; an operating threshold τ = 0.185 yields the best F1 (≈ 0.61), balancing precision and recall for dense yard scenes. We produce exportable patrol artifacts (CSV/GeoJSON) to support deployment and auditing. Simulation studies show enforcement of safety margins without excessive path inflation, and multi-UAV sectorization enables deconflicted coverage with incident-aware replanning. All training scripts and route files are released for reproducibility. Subject to on-site validation of latency and false-alarm rates, the system is ready for controlled pilot deployment at TLG—Denton and serves as a model for scalable, regulation-aligned UAV security operations.
Keywords:
UAV surveillance
; geofencing
; control-barrier functions
; model predictive control
; edge AI
; multi-UAV patrol
; VisDrone
1. Introduction
This study builds a drone security system for a
truck yard that “knows” its legal flight area and automatically stays inside
it. A lightweight AI model (YOLO) detects people and vehicles in real time,
while safety logic steers the drone away from roads, construction zones, and
other hazards. We also plan routes that can be exported and audited, and we
show how multiple drones can share the job without conflict. The software and
routes are shared openly. After checking on-site latency and false alarms, the
system is ready for a small pilot at the Denton facility.
Modern industrial complexes are increasingly
challenged by expanding operational areas, fluctuating environmental
conditions, and surveillance blind spots that traditional fixed cameras cannot
fully address. UAVs equipped with AI-driven video analytics close these gaps by
enabling mobile and adaptive surveillance. This paper presents the design and
evaluation of a UAV surveillance system specifically tailored for The Larson
Group (TLG) Denton facility, focusing on real-time detection, incident-aware
routing, and geofence-constrained operations.
UAVs significantly improve situational awareness
and accelerate response times, surpassing the limitations of ground-based
systems. Deploying computer vision algorithms directly on drones or at nearby
edge nodes minimizes delays and bandwidth demands, facilitating rapid
detection, tracking, and alerting even in low-connectivity environments (Xu et
al., 2023; Singh et al., 2023).
The evolution of UAV technology has extended far
beyond basic RGB camera payloads. Integrating thermal and infrared (IR) sensors
with other advanced modules, such as LiDAR, enables comprehensive monitoring
across varying light levels and adverse weather conditions. This multisensor
approach enhances object recognition in challenging scenarios like nighttime
patrols or densely obstructed areas. Recent studies demonstrate that
lightweight neural networks combined with IR sensing can provide reliable real-time
detection of small and partially obscured targets, making them ideal for
industrial security operations focused on identifying intruders or unusual
vehicle activities (Su et al., 2024; Chen et al., 2025; Zhang et al., 2025).
At the systems level, coordinated multi-UAV
operations have become increasingly sophisticated. Contemporary frameworks
integrate collaborative flight planning, collision avoidance, energy-efficient
routing, and real-time adaptation to no-fly zones or construction areas. These
innovations are especially relevant to TLG, where multiple drones must cover
expansive and evolving perimeters. For example, one UAV can dynamically respond
to an active security alert while others continue routine patrols, ensuring uninterrupted
surveillance while optimizing power usage and docking schedules (Meng et al.,
2025).
In addition, geofencing technologies now provide
advanced boundary enforcement. “Hard” geofencing anticipates UAV motion
dynamics, guiding drones to adjust course proactively rather than reacting at
the boundary itself. This improves both operational safety and regulatory
compliance, particularly in areas bordering public roads or sensitive
neighboring properties. When implemented at both the autopilot and
mission-planning layers, these geofences provide predictable, auditable flight
paths suitable for high-security environments (Thomas et al., 2024).
As UAV deployments scale, cybersecurity and privacy
concerns must be integral to design and implementation. Research identifies
potential vulnerabilities, including GPS spoofing, communication jamming, and
adversarial manipulation of AI models. Privacy risks such as unintentional
surveillance of neighboring properties or unauthorized data retention are
equally critical. Best practices now emphasize encrypted telemetry and video
streams, policy-constrained data collection zones, and privacy-preserving analytics
techniques like on-device redaction (Mekdad et al., 2023; Hadi et al., 2023).
These requirements align with the ongoing evolution of Beyond Visual Line of
Sight (BVLOS) regulations, where emerging U.S. policies emphasize pilot
certifications, safety management systems, and auditable compliance processes
(Federal Aviation Administration [FAA], 2025).
In conclusion, recent scholarship supports the
design decisions behind TLG’s integrated UAV surveillance project. By combining
edge-based analytics, multisensor payloads, coordinated drone fleets,
anticipatory geofencing, and strong privacy protections, this initiative lays
the groundwork for a proactive, scalable, and regulation-ready security
ecosystem capable of meeting the complex needs of modern industrial operations.
Figure 1.
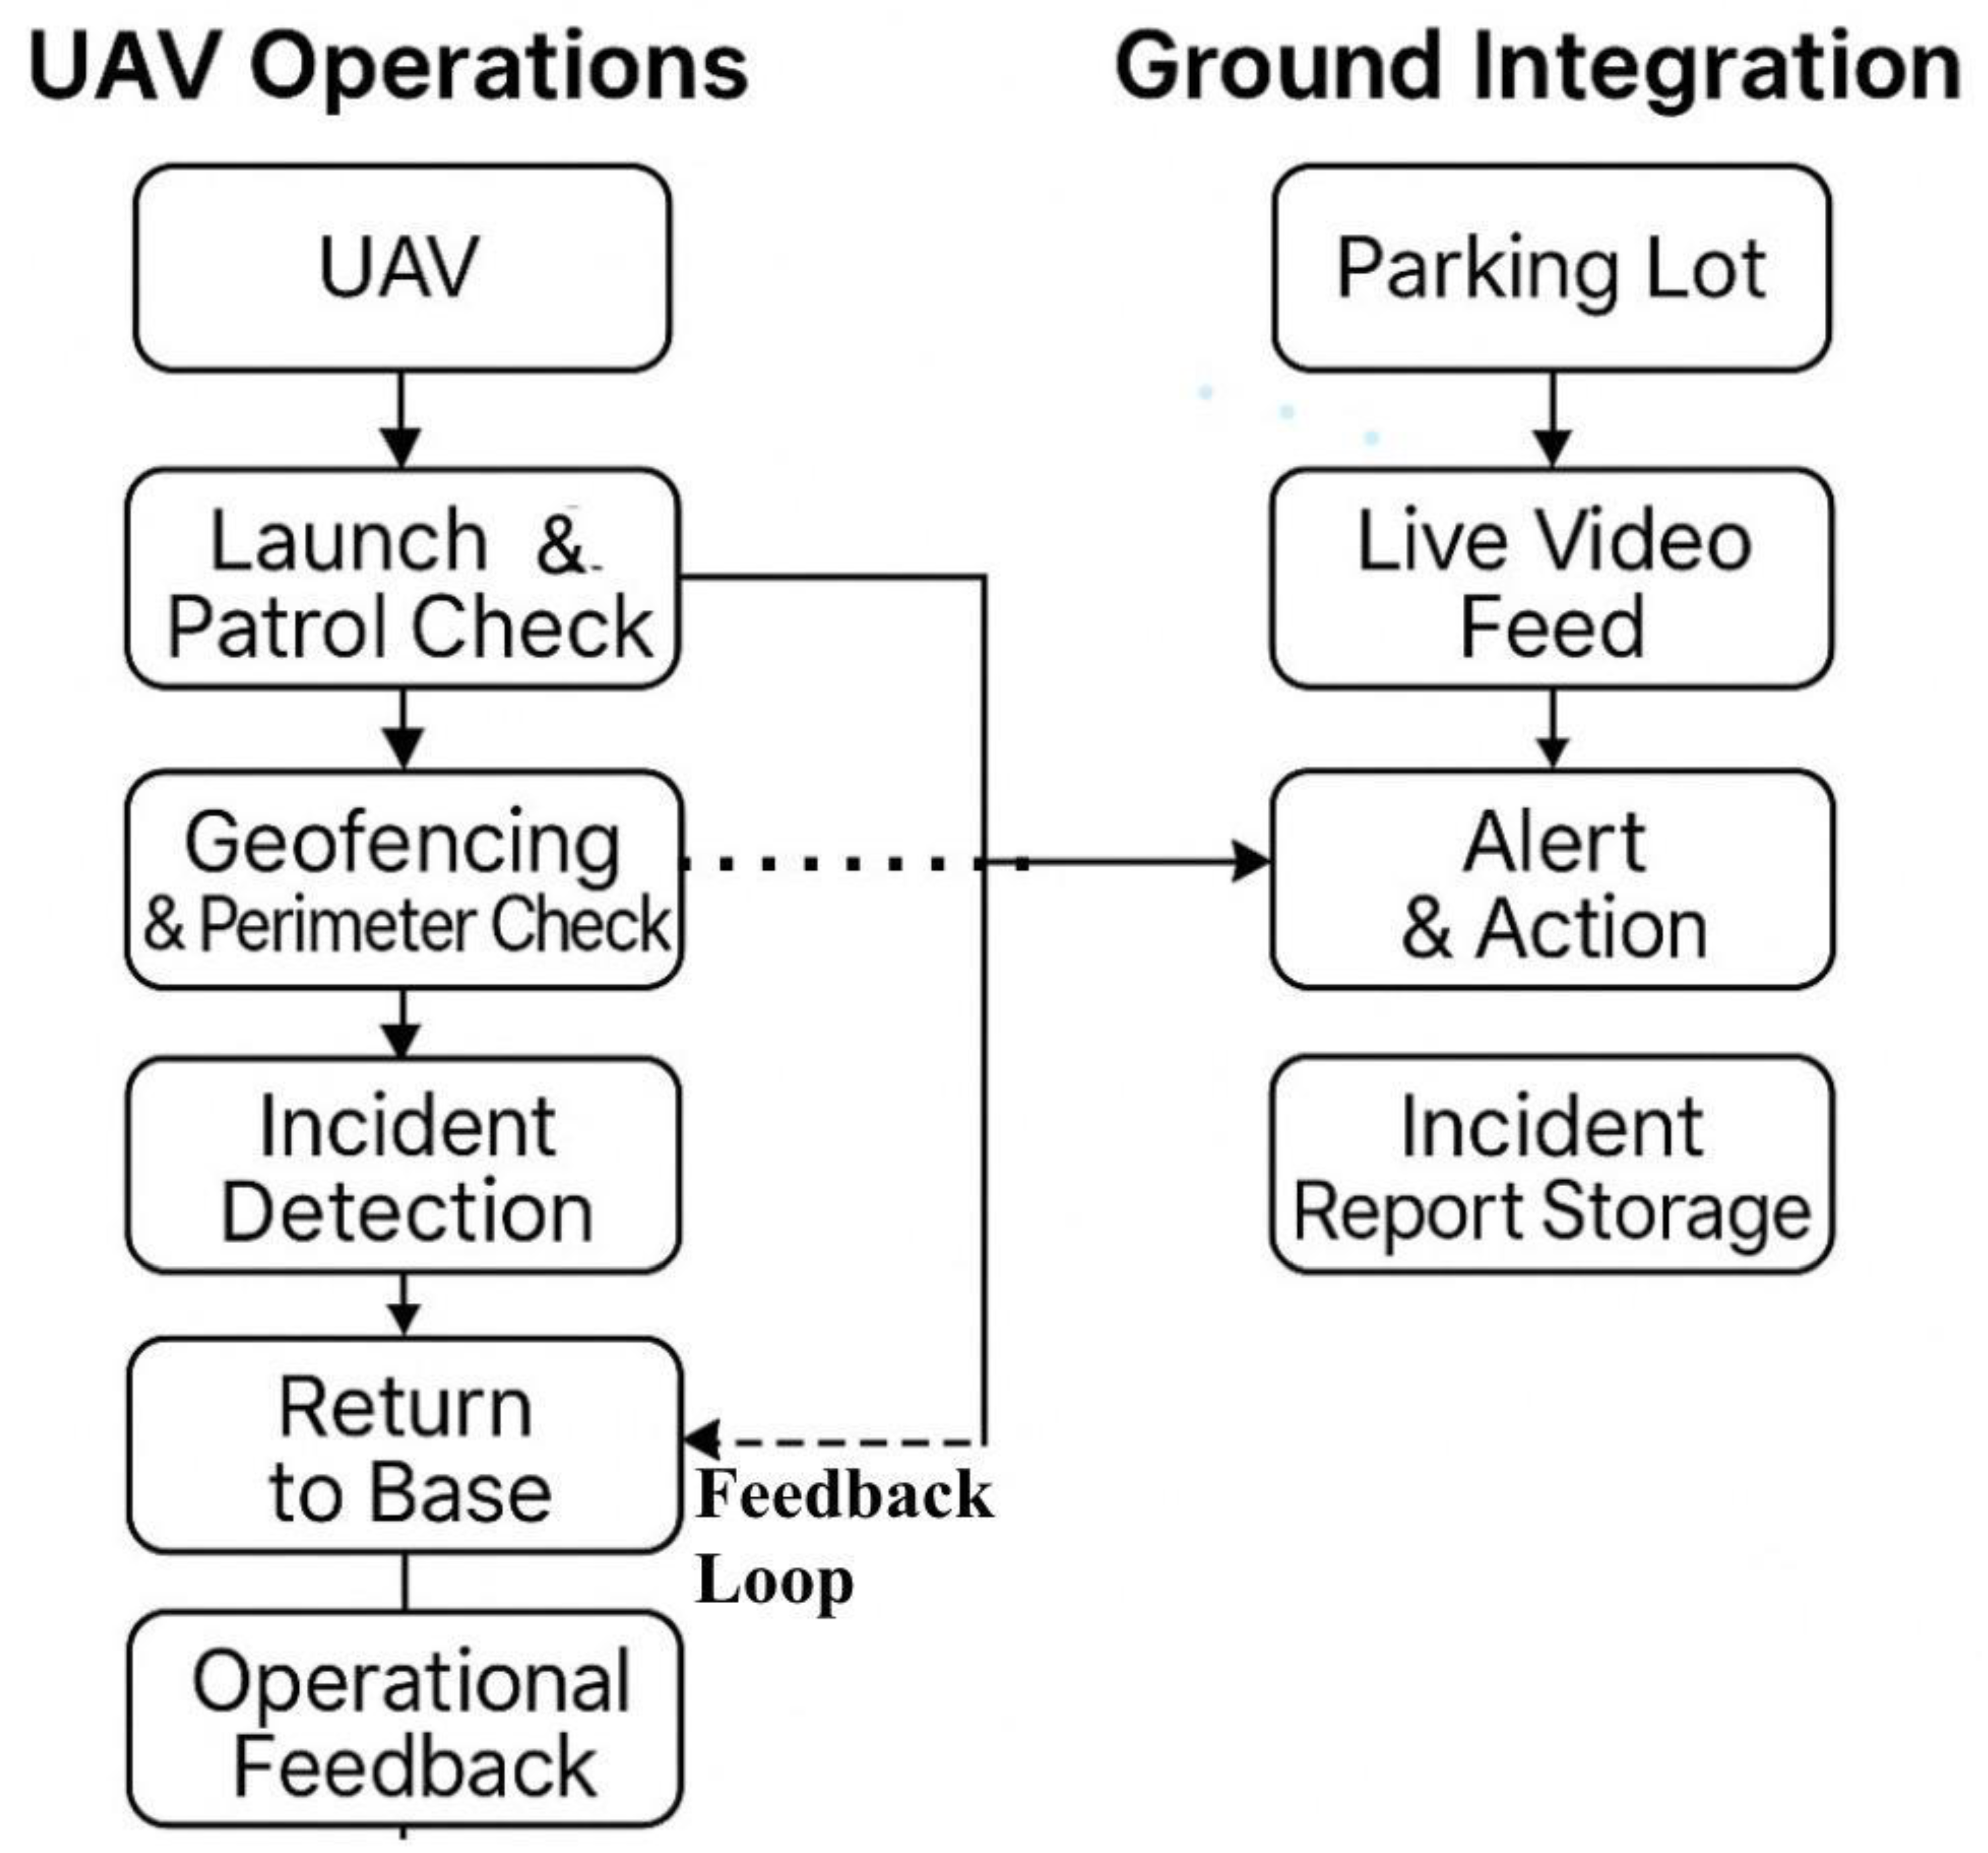
Project workflow for UAV operations and ground integration at TLG—Denton, linking patrol scheduling, live telemetry, incident response, and auditing.
Figure 1.
Project workflow for UAV operations and ground integration at TLG—Denton, linking patrol scheduling, live telemetry, incident response, and auditing.
The study location (TLG parking facility) operates
under defined hours of operation, which also dictate the scheduling of UAV
patrols to ensure continuous coverage during peak activity periods and
vulnerable off-hours. Current ground security consists of on-site personnel and
traditional surveillance measures, such as inward-facing cameras and routine
patrols.
However, these inward-facing cameras have
significant limitations, including restricted visibility of external perimeters
and blind spots, making them susceptible to unauthorized access or theft. UAVs
provide dynamic, real-time monitoring, extending coverage beyond the fixed
range of cameras, addressing security gaps, identifying suspicious activity in
hard-to-reach areas, and enabling rapid responses to potential breaches.
This integrated approach improves overall facility
security while optimizing human resource allocation(Thomas et al., 2024).
Figure 2.
TLG parking lot layout with truck staging, monitoring zones, and dispatch lanes.
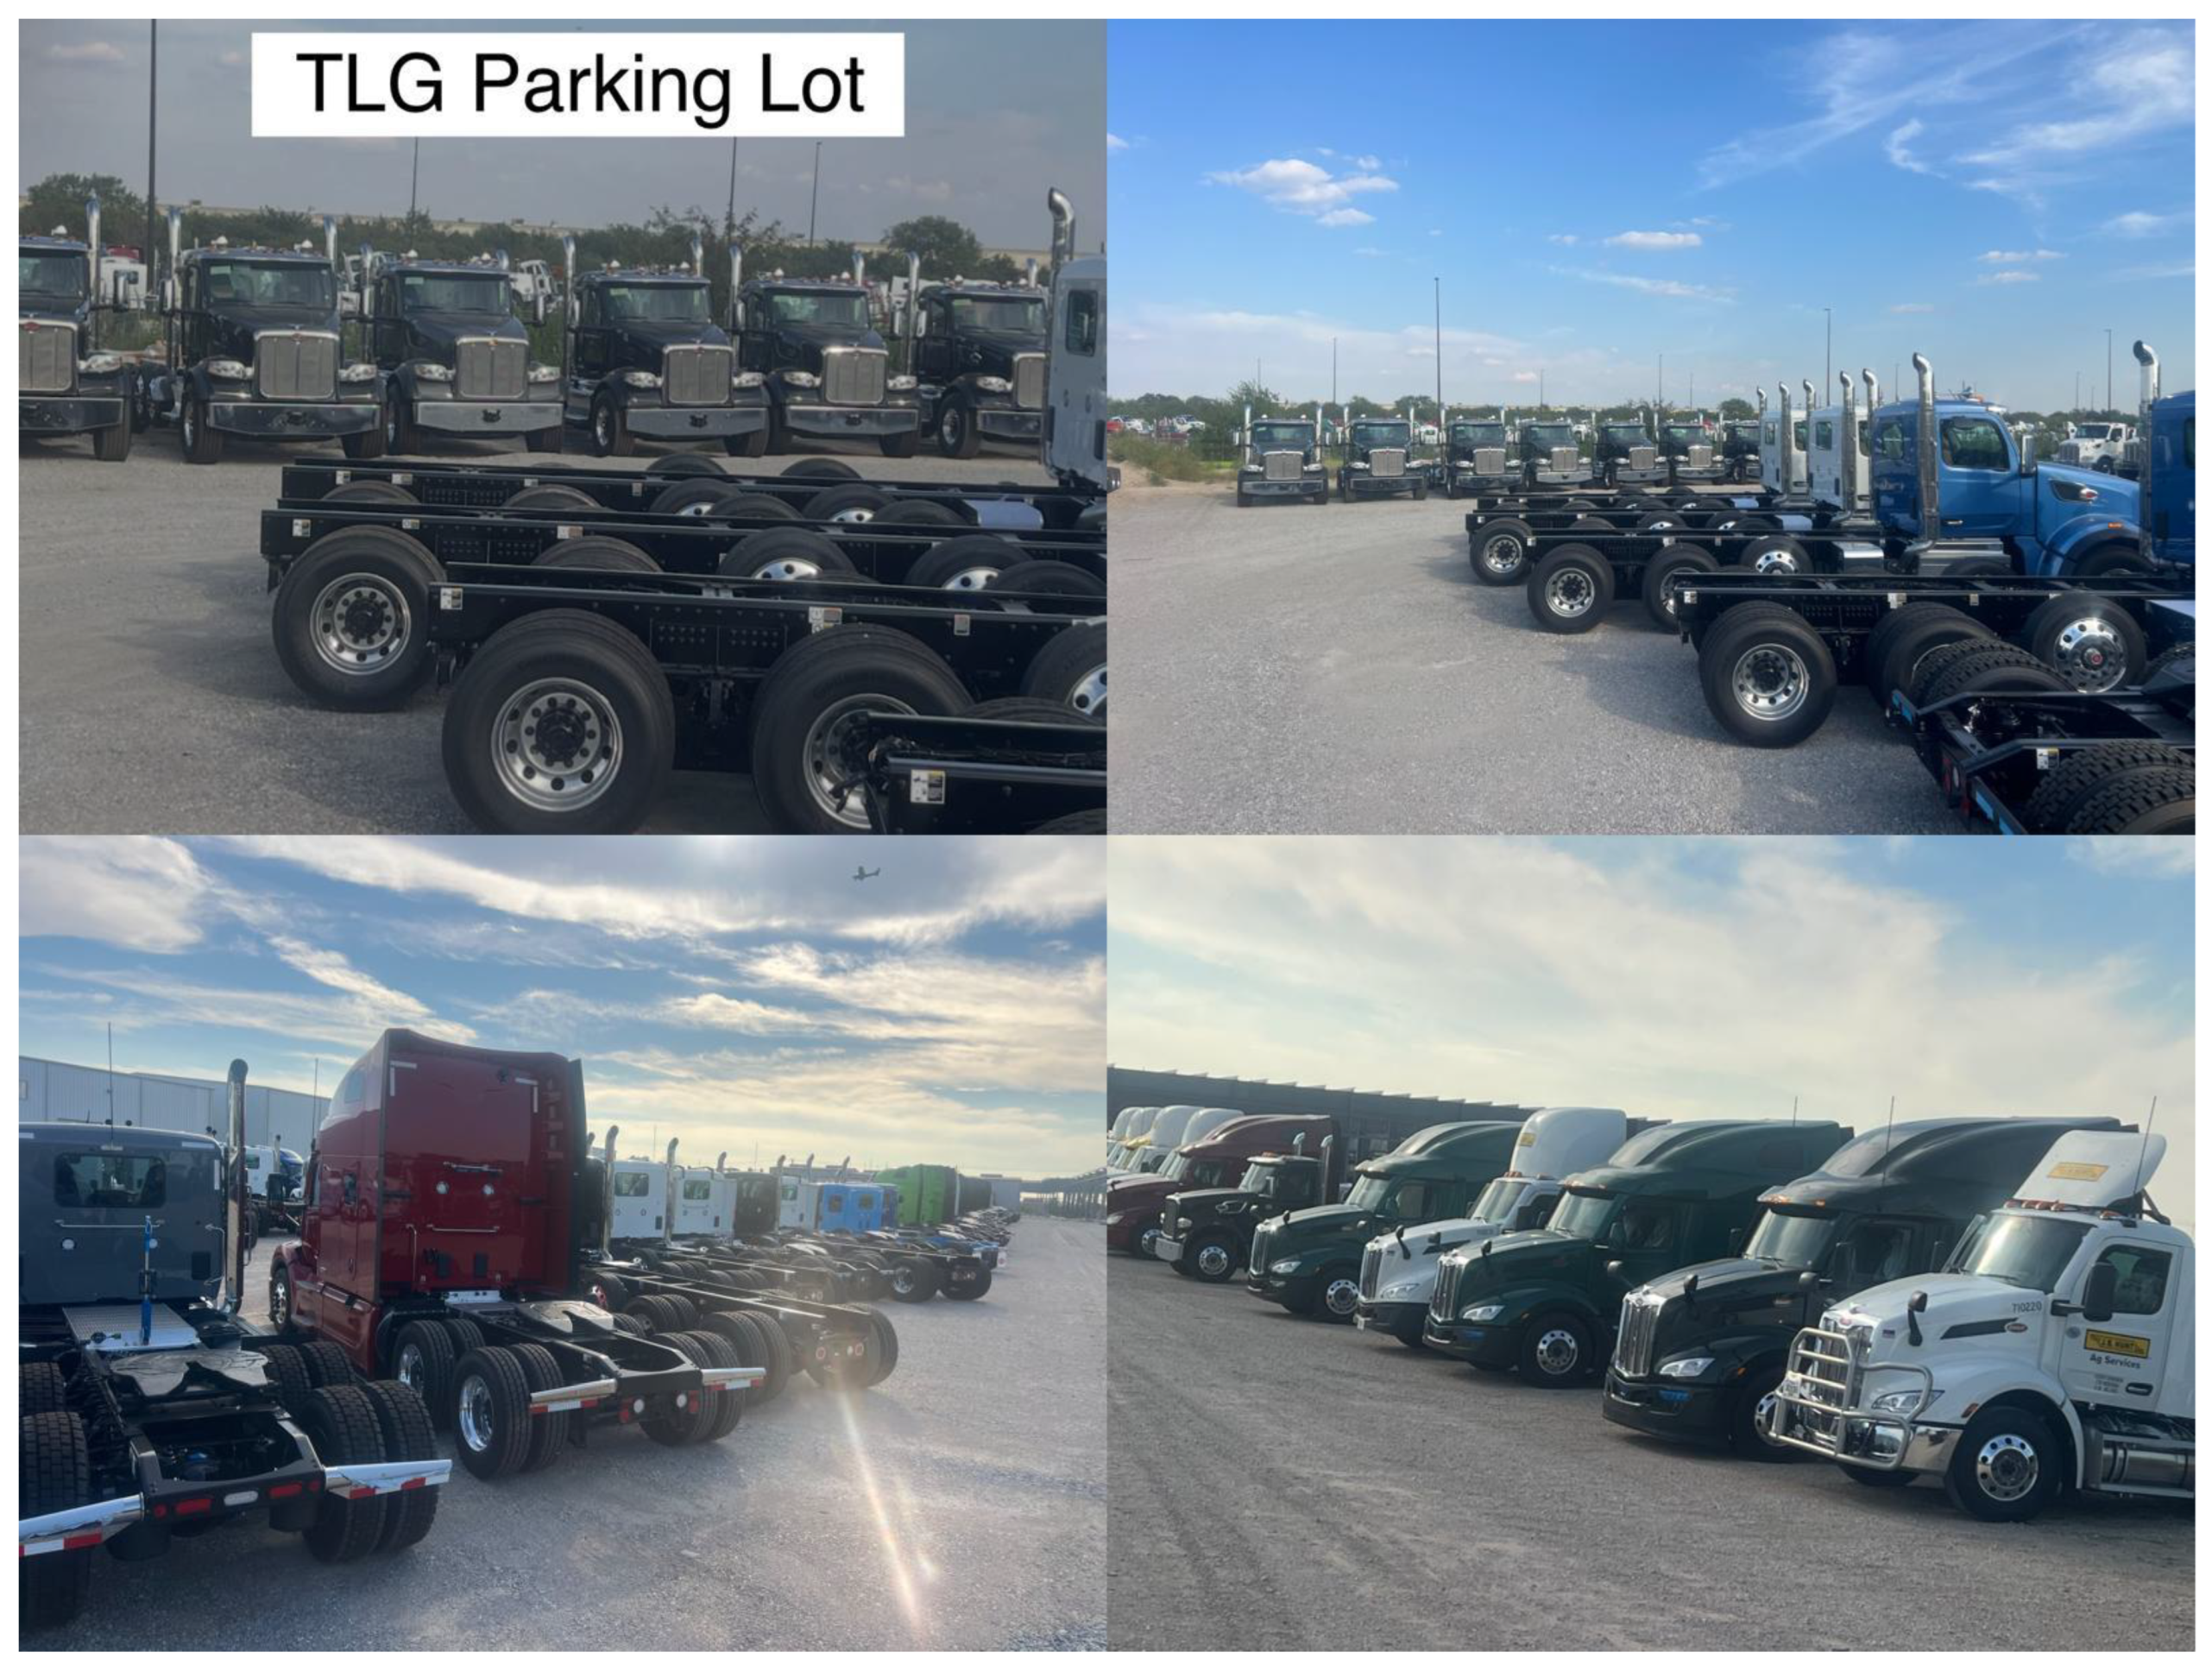
Figure 3.
Live UAV surveillance map with real-time positions, telemetry, and QR-linked SOPs.
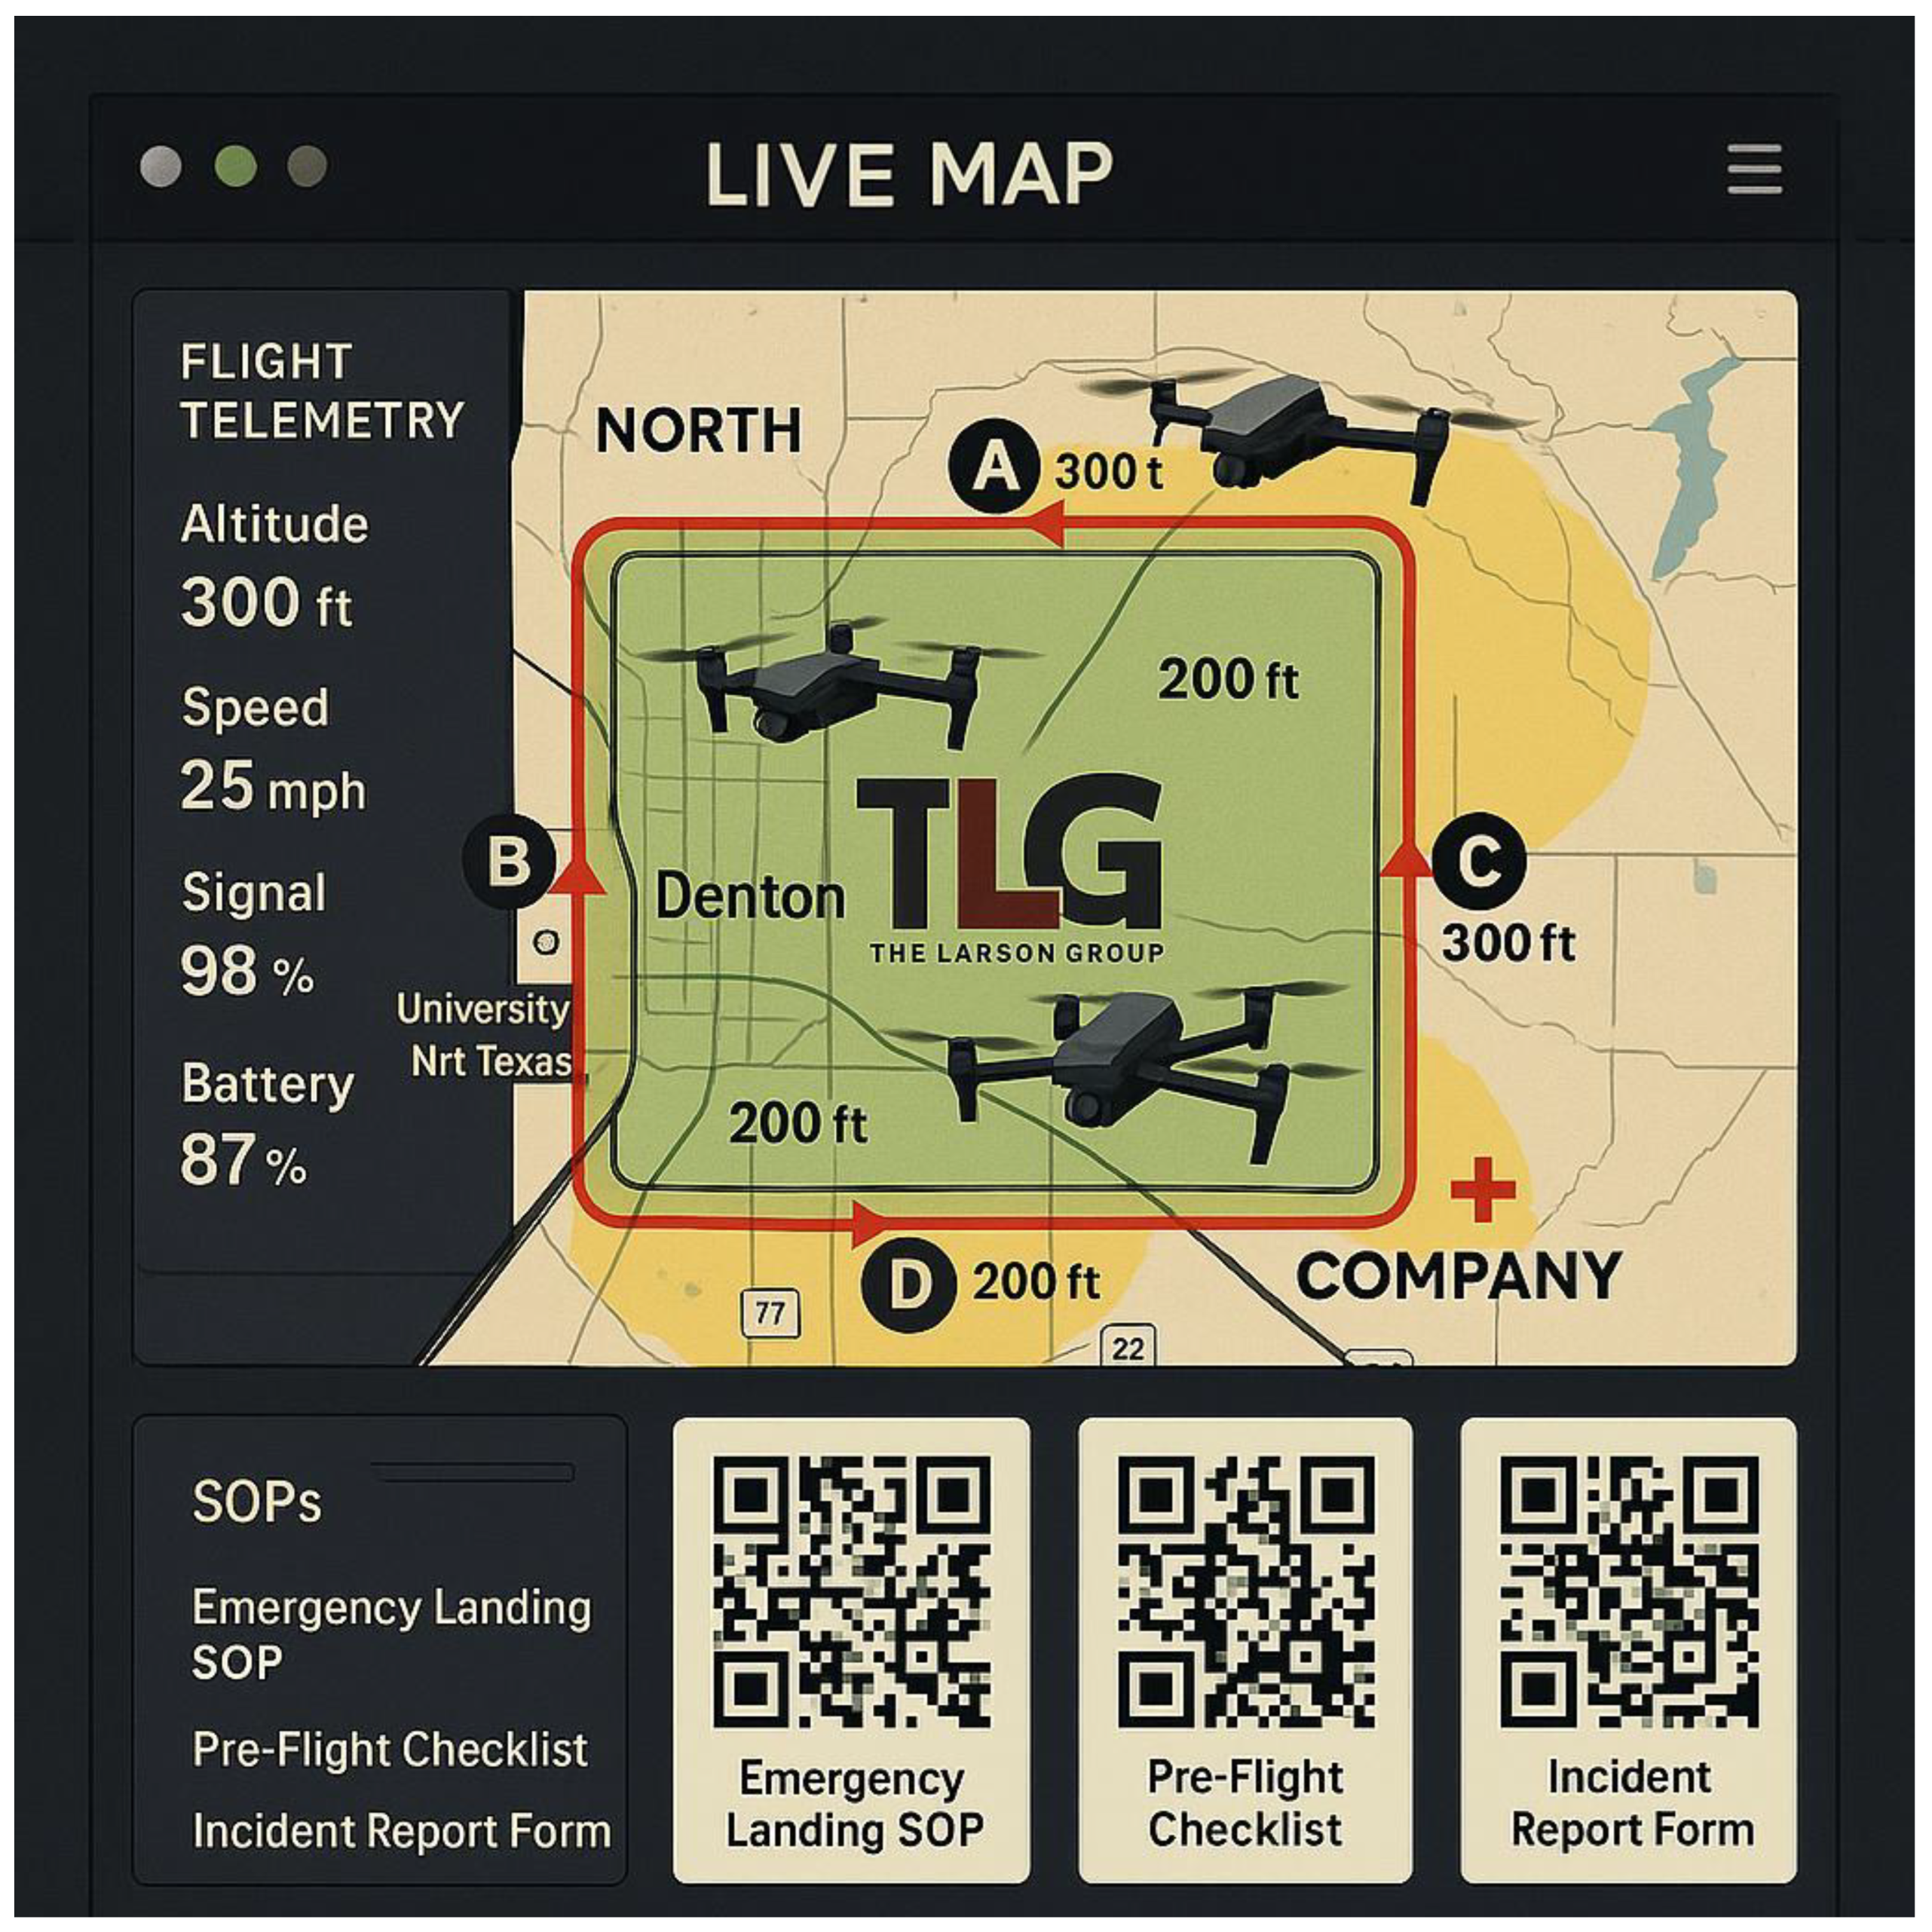
The interface displays altitude, speed, signal
strength, and battery levels while providing quick access to emergency SOPs,
pre-flight checklists, and incident report forms through integrated QR codes.The growing complexity of security threats necessitates enhanced
situational awareness through advanced aerial surveillance. Traditional
ground-based systems alone cannot provide comprehensive coverage, especially in
large, dynamically changing environments such as expanding parking lots.
This project will integrate secure communications,
intrusion detection, and unauthorized vehicle tracking to create a robust,
adaptive defense system(Ashraf et al., 2023). A collaborative UAV network will
share live camera feeds and telemetry data for continuous, secure, and reliable
monitoring, enhancing both safety and situational awareness.
Figure 4.
Coordinated multi-UAV night surveillance with coverage zones and alert hotspot.
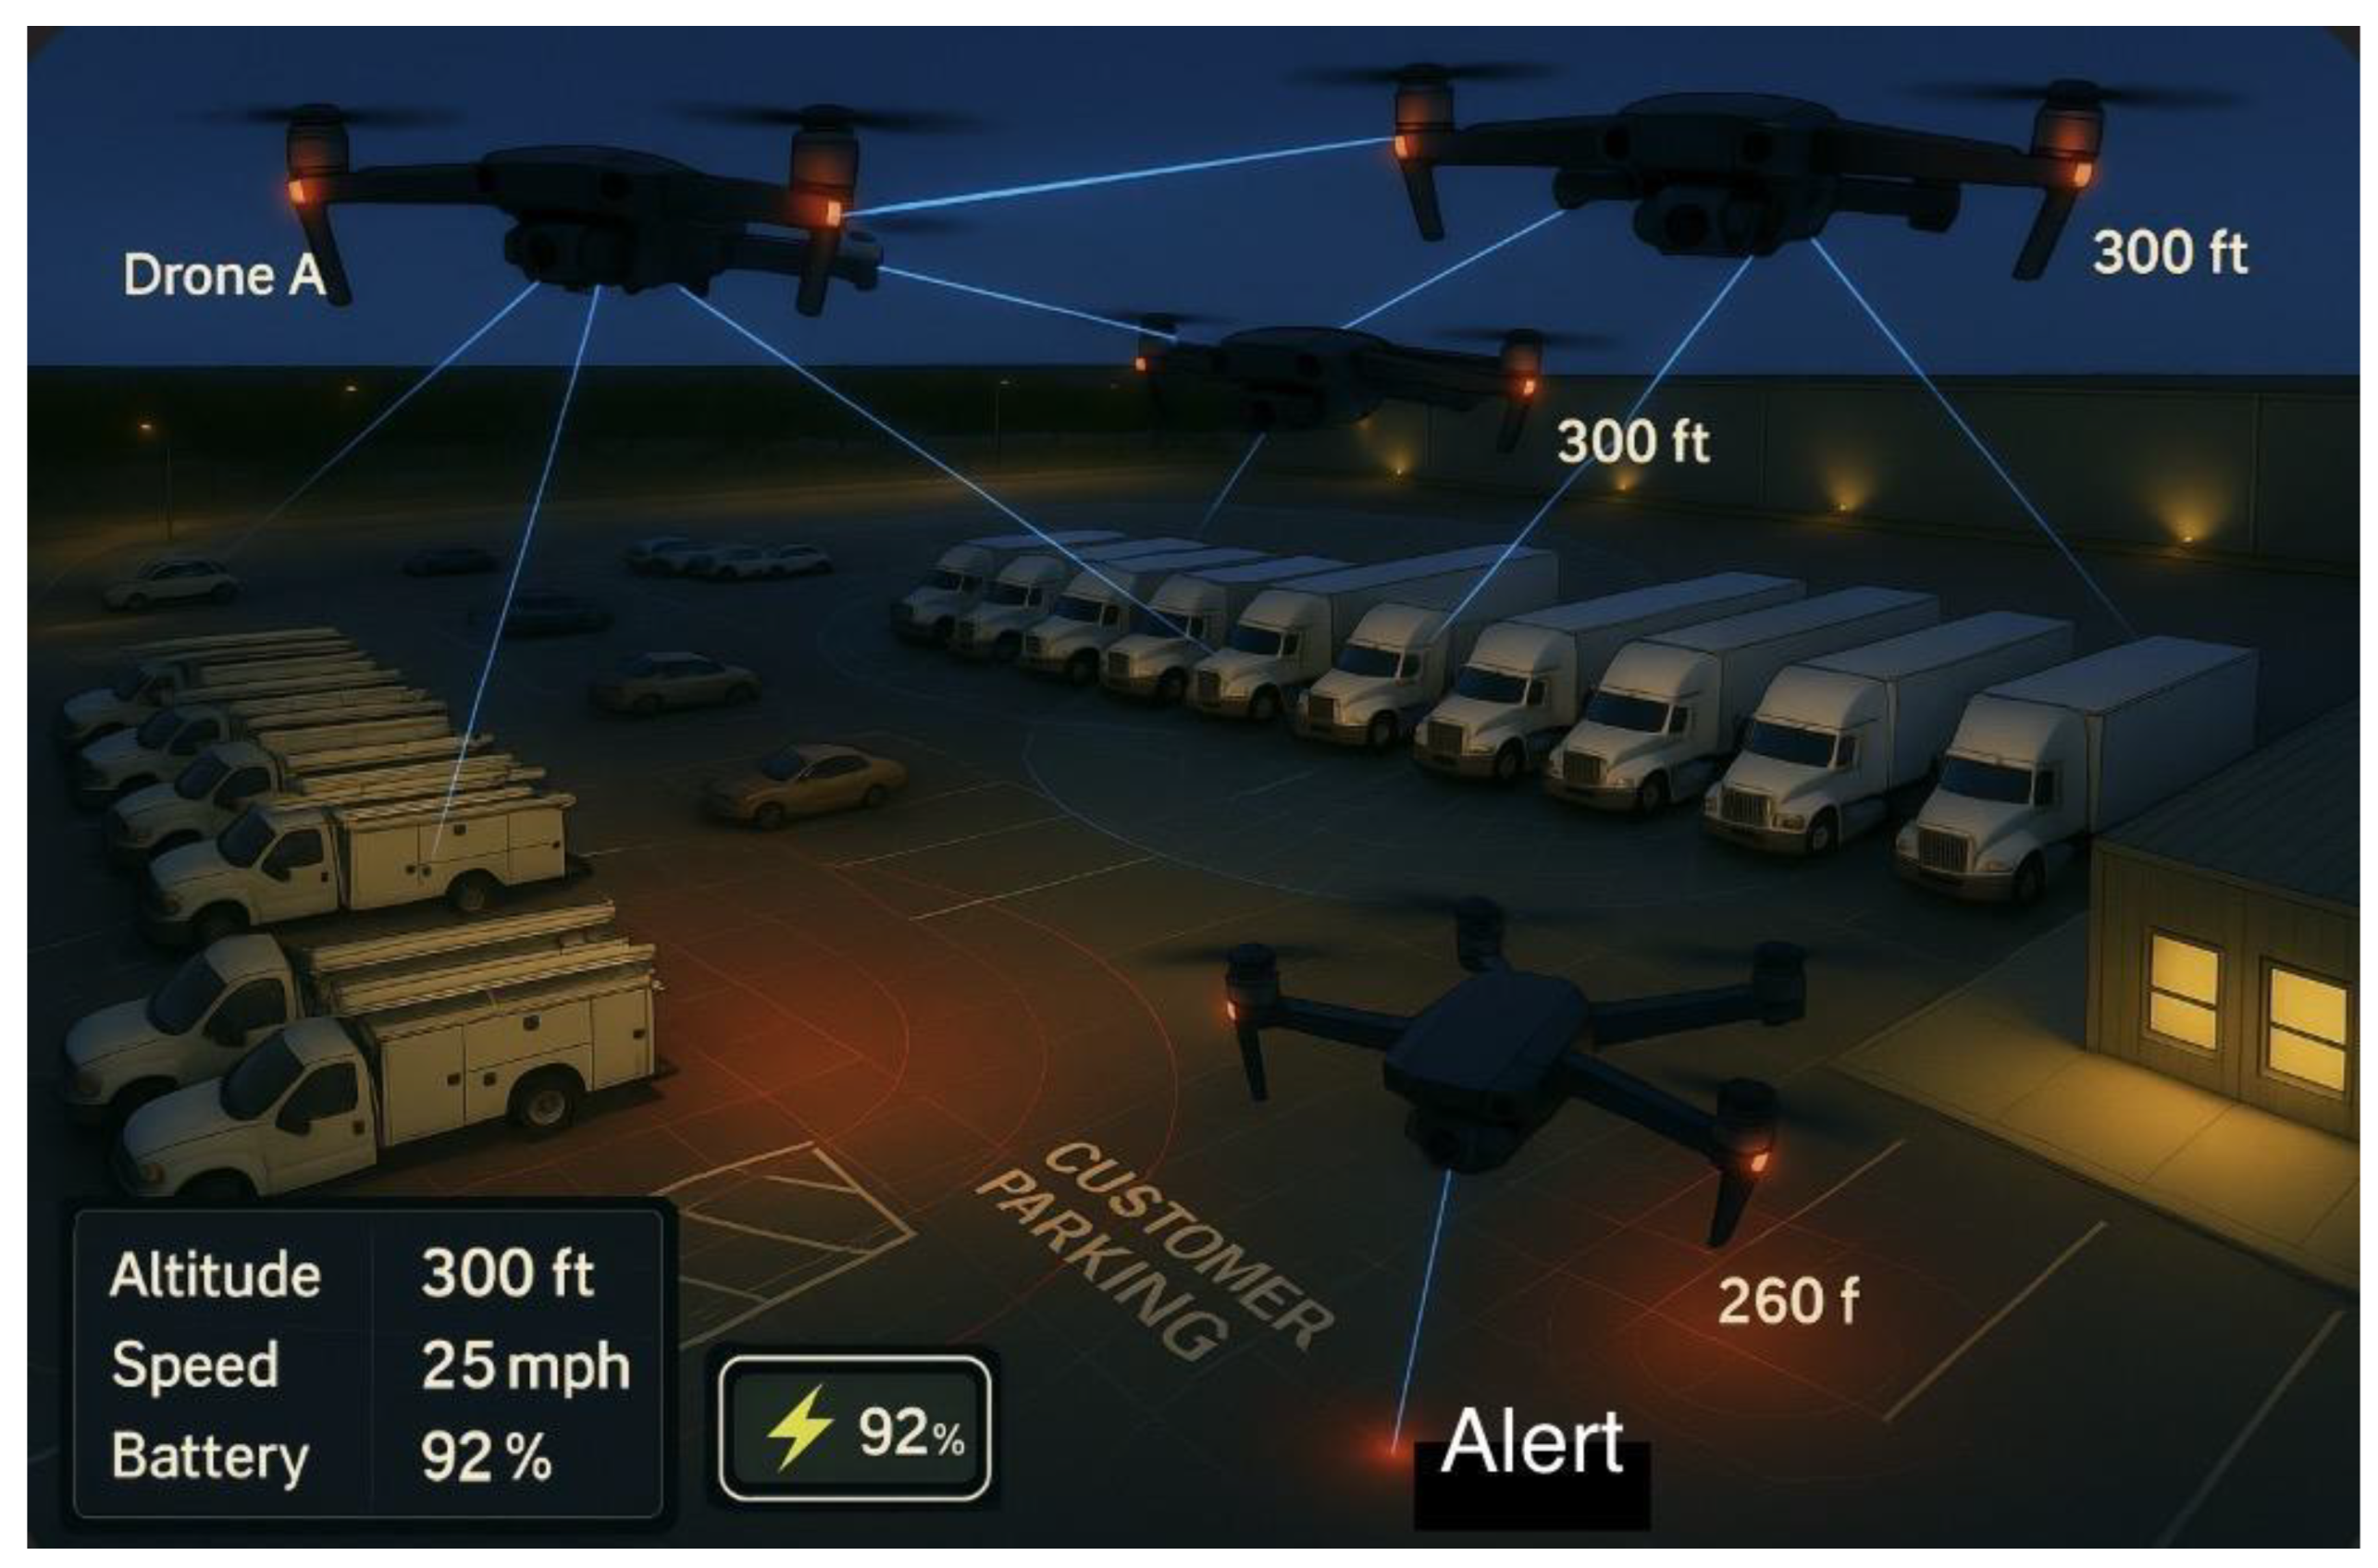
Surveillance zones are highlighted, including a red
alert area near the customer parking section. The on-screen telemetry display
shows key flight data such as altitude, speed, and battery level, demonstrating
an advanced, cooperative security system for vehicle and perimeter monitoring.
Traditional security systems often lack
comprehensive coverage and rapid response capabilities, leading to blind spots
and delayed threat detection. With ongoing expansion and construction
activities, these vulnerabilities are amplified.A UAV-based surveillance system
will provide flexible, real-time aerial monitoring, improving situational
awareness, reducing response times, and strengthening security management
(Aissaoui et al., 2023).
The following objectives are outlined for the
current project.
- Deploy UAVs for continuous and on-demand surveillance.
- Implement geofencing to enforce secure perimeters.
- Integrate UAV feeds with ground systems for real-time decision-making.
- Establish protocols for incident response and evidence collection.
Early geofencing for fleets established
geo-boundary enforcement and logistics use cases, which later informed
low-altitude UAS operations and safety envelopes (Reclus & Drouard, 2009).
Formal safety for “assured containment” in aviation anticipating and
constraining vehicle motion was articulated in NASA’s case studies and has
influenced digital geofences that act before boundary violation rather than at
it (Hayhurst et al., 2015). Surveyed techniques in geofenced motion planning
and constrained navigation for UAVs include rule-based and optimization-based
approaches, with recent work emphasizing predictive constraint handling and
map-aware path planners (Hosseinzadeh, 2021; Thomas et al., 2024). Practical,
deployable geofencing for low-altitude UAS highlights platform-independent
enforcement in operational airspace (Stevens et al., 2015). For yard-scale
routing, grid-/graph-based planners (e.g., A*) and coverage methods
(boustrophedon) remain standard, with geo-fence and separation constraints
analyzed in industrial settings (Liu et al., 2016).
The contributions of this work include the following:
- First incident-aware CBF+MPC geofence controller designed and evaluated using VisDrone-driven yard scenarios, integrating predictive safety modeling with real-world operational constraints.
- Development of exportable geofenced route artifacts (A*, sector patrol, and lawn-mower coverage paths) with reproducible datasets and code pipelines for deployment and auditing.
- Proposal of a deployment-threshold selection method (τ ≈ 0.185) to balance detection precision and recall under dense yard scenes.
- Integration of multi-layered UAV and ground-based surveillance systems, demonstrating reduced blind spots and faster response times in a dynamic industrial facility.
- Introduction of privacy-aware, regulation-compliant UAV workflows aligned with BVLOS and geofencing safety standards.
The project organization and structure outline are: Project Aim (TL;DR)
Design, train, and validate an incident-aware, geofenced UAV surveillance system for TLG–Denton that works in real time and integrates with ground security and facility operations.
Column A: Context, Scope and Questions
A1. Why this project?
- Expanding facility footprint introduces blind spots and dynamic risks (frontage road, construction zones, moving fleets).
- Need scalable air-ground security fusion that reduces response times, increases detection coverage, and respects BVLOS and privacy constraints.
A2. Scope & Boundaries
- In scope: VisDrone-driven models, YOLOv11-nano fine-tuning, geofence design (A*, sector patrol, mower coverage), five CV tasks (det, video det, SOT, MOT, counting), Denton site.
- Out of scope (now): Multi-site roll-out, full swarm autonomy, L4 autonomy beyond BVLOS pilots.
A3. Research Questions (guide the paper)
- What detection/tracking performance (mAP@0.5, F1@τ, IDF1/HOTA) is sufficient for pilot deployment?
- How do geofence constraints and incident-aware routing affect safety and coverage?
- What operating threshold (τ ≈ 0.185) balances precision/recall under dense scenes?
- How can compliance, privacy, and BVLOS be embedded in the workflow without degrading utility?
Column B — Methods Pipeline & Tasks
B1. Materials & Methods (Section 7)
- Site modeling: Patrol sectors, no-flight buffers, frontage-road hazard overlays.
- Datasets: VisDrone2019 (urban UAV imagery/video; 10 relevant classes).Custom split 70/15/15 with reproducible RNG seed (no leakage).
- Models: YOLOv11n fine-tuned for 100 epochs @ 640²; Ultralytics runtime.
- Tools: Python 3.12, NumPy, scikit-learn, Matplotlib, Label Studio; optional AirSim; NVIDIA RTX 4090, CUDA 12.2.
- UAV/GCS: Multirotors + thermal option; GPS/IMU; live telemetry to GCS with geofence & NFZ alerts.
B2. Experiments (Section 8)
- Task 1 — Detection (Images): mAP@0.5, PR curves, confusion matrices.
- Task 2 — Detection (Video): NMS tuning for dense scenes; latency checks.
- Task 3 — SOT: Success/precision plots; OPE AUC.
- Task 4 — MOT: MOTA/MOTP, ID switches; ByteTrack association.
- Task 5 — Counting: Density maps; MAE/RMSE.
B3. Geofence & Routing (Section 12)
- Formal set-based model: R (lot), C (GO zone), N=R\C (NO-GO).
- A* inside C with barrier margins; sector patrol for multi-UAV deconfliction; boustrophedon (lawn-mower)coverage with δ-safety.
- Incident-aware MPC + control-barrier functions for time-varying hazards.
Column C — Deliverables, Risks & Roadmap
C1. Artifacts & Evidence (Sections 8–10, 13)
- Metrics packs: results.csv, PR/F1 curves, confusion matrices, operating-point sweeps.
- Qualitative gallery: 10+ image frames, 3+ video frames (dense & twilight scenes).
- Routes: astar_path.csv, sector_waypoints.csv, lawn_mower_route.csv, tlg_routes.geojson.
- Ops diagrams: dashboards, return-to-charge, three-layer security fusion.
C2. Risk Matrix → Mitigations (Section 11)
- Critical: False +/−, environmental sensitivity → ensemble models, HIL review, IR/thermal, wind envelopes.
- High: BVLOS/regulatory, privacy → geofencing, signage, data minimization/anonymization, policy SOPs.
- Medium: Cost/maintenance → phased rollout, leasing, predictive maintenance.
C3. Milestones (checkpoints)
- M1 Splits reproducible → M2 Model trained → M3 Metrics/threshold chosen →M4 Qual gallery → M5 Risk & mitigations → M6 Routes export →M7 Real-world photos/QRs → M8 Discussion & contributions → M9 Final proof.
C4. Contributions (Section 12— “Contribution”)
- Integrated air–ground security loop with incident-aware routing.
- Deployable operating point (τ ≈ 0.185) balancing precision/recall for yard scenes.
- Reproducible pipeline (data splits, code, routes) and compliance-aware workflow.
C5. Future Directions (Section 14)
- Multi-lot scaling, autonomous swarms, smarter patrol scheduling, low-light/domain-adaptation, smart-city integration.
This project addresses the expanding security and safety surface at TLG–Denton by unifying UAV-based perception, geofence-constrained routing, and operations/compliance workflows into a reproducible pipeline. Building on VisDrone-trained YOLO11n models and a formal safety set-up (A*sector patrol, coverage patterns, and incident-aware MPC), we define performance targets (mAP@0.5, F1@τ, IDF1/HOTA, MAE) and deliver deployment artifacts (routes, dashboards, SOP-aligned flows). The next section (Materials & Methods) details the site modeling, dataset preparation, training procedure, tools, and UAV/GCS stack that enable rigorous evaluation and a pilot-ready prototype.
2. Materials and Methods
In this section, we examine the study location and its critical components, including UAV flight paths, designated patrol routes, surveillance coverage areas, the parking lot, the frontage road, and nearby construction zones. The proposed system integrates YOLOv11-nano, a lightweight, real-time object detection model, fine-tuned on the VisDrone2019dataset using a reproducible 70/15/15 split for training, validation, and testing. Geofencing is implemented using control-barrier functions (CBF) combined with model predictive control (MPC) to ensure safe, compliant navigation within dynamic operational boundaries.
The UAV hardware consists of GPS-enabled multirotor drones equipped with high-resolution cameras and optional thermal imaging sensors for enhanced detection during low-light or night-time operations. Exportable route files in CSVand GeoJSON formats support seamless operational handoff, auditing, and regulatory compliance.
Reproducibility Checklist:
- Dataset: VisDrone2019; custom 70/15/15 split with fixed RNG seed for consistency.
- Model: YOLOv11-nano; trained for 100 epochs at an input size of 640×640 using the Ultralytics runtime.
- Metrics: mAP@0.5 / mAP@[.5:.95], PR/F1 curves; IDF1/HOTA (planned), MAE/RMSE for counting tasks.
- Operating Threshold: τ = 0.185 (optimal F1 ≈ 0.61) for deployment in dense yard scenarios.
- Hardware: NVIDIA RTX 4090 GPU, CUDA 12.2; batch size = 16 (training), 1 (evaluation).
- Routing Algorithms: A*, sector patrol, and lawn-mower coverage patterns with CSV/GeoJSON exports.
- Safety Mechanisms: Signed-distance safety margins, CBF-filtered MPC, and incident-aware replanning.
Figure 5 illustrates the current TLG facility expansion, highlighting areas that require comprehensive UAV surveillance to address emerging security and operational challenges.
- The image depicts key surveillance zones such as UAV coverage, parking lot monitoring, the frontage road, and construction activity.
- It provides a visual context for the methodology, especially when describing UAV flight paths, surveillance cameras, and security integration.
- This is crucial when discussing how data is gathered, e.g., drones collecting real-time footage and vehicles being tracked.
2.1. Datasets Source, Preprocessing, and Partitioning
The VisDrone2019 dataset (Tianjin University) was selected as the primary dataset due to its suitability for UAV-based surveillance research. VisDrone2019 provides UAV images and videos from urban scenes with ten annotated classes relevant to yard surveillance (e.g., pedestrians, cars, vans, buses) (Du et al., 2019; Zhu et al., 2020). These categories directly align with the monitoring requirements of The Larson Group (TLG) parking lot, where various vehicle types and human activities must be detected and tracked for security purposes.
The original Ultralytics YOLO public dataset configuration came with fixed splits for training, validation, and testing. However, for this study, a custom 70; 15; 15 partition was enforced to ensure proper model generalization and consistent performance evaluation. This required merging the original training and validation sets, reshuffling the combined dataset, and redistributing images into three subsets:
- Training Set (70%): Used to optimize model weights.
- Validation Set (15%): Used for hyperparameter tuning and overfitting detection.
- Testing Set (15%): Used strictly for performance evaluation.
This splitting process ensured that no data leakage occurred between the sets, maintaining the integrity of evaluation metrics.
Dataset Classes:
The dataset includes 10 classes: pedestrian, people, bicycle, car, van, truck, tricycle, awning-tricycle, bus, and motorbike. These directly correspond to common activities within a parking lot environment.The dataset is directly relevant to this project.
2.2. Dataset Partitioning Code
The custom split was created programmatically using Python. Below is a snippet of the one-time script used to perform the dataset merge and shuffle. It outputs three .txt files referencing the respective training, validation, and testing image paths.
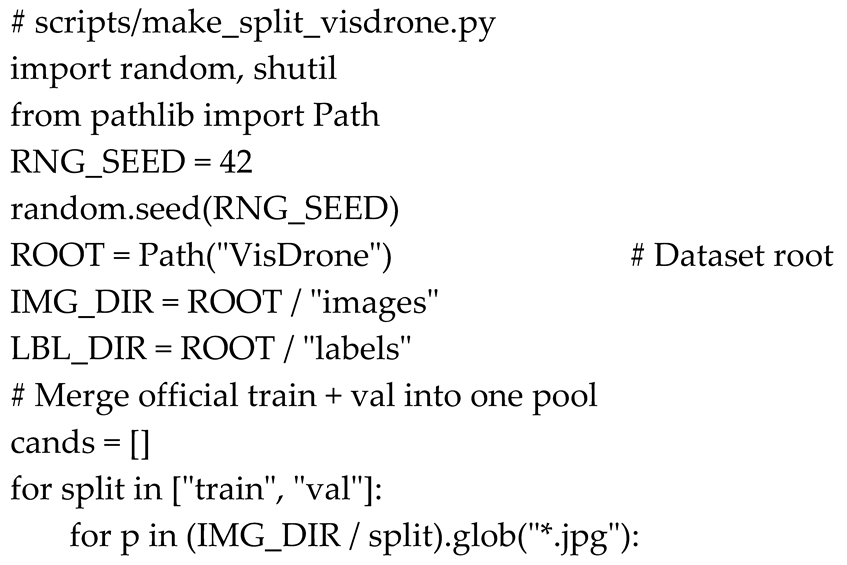
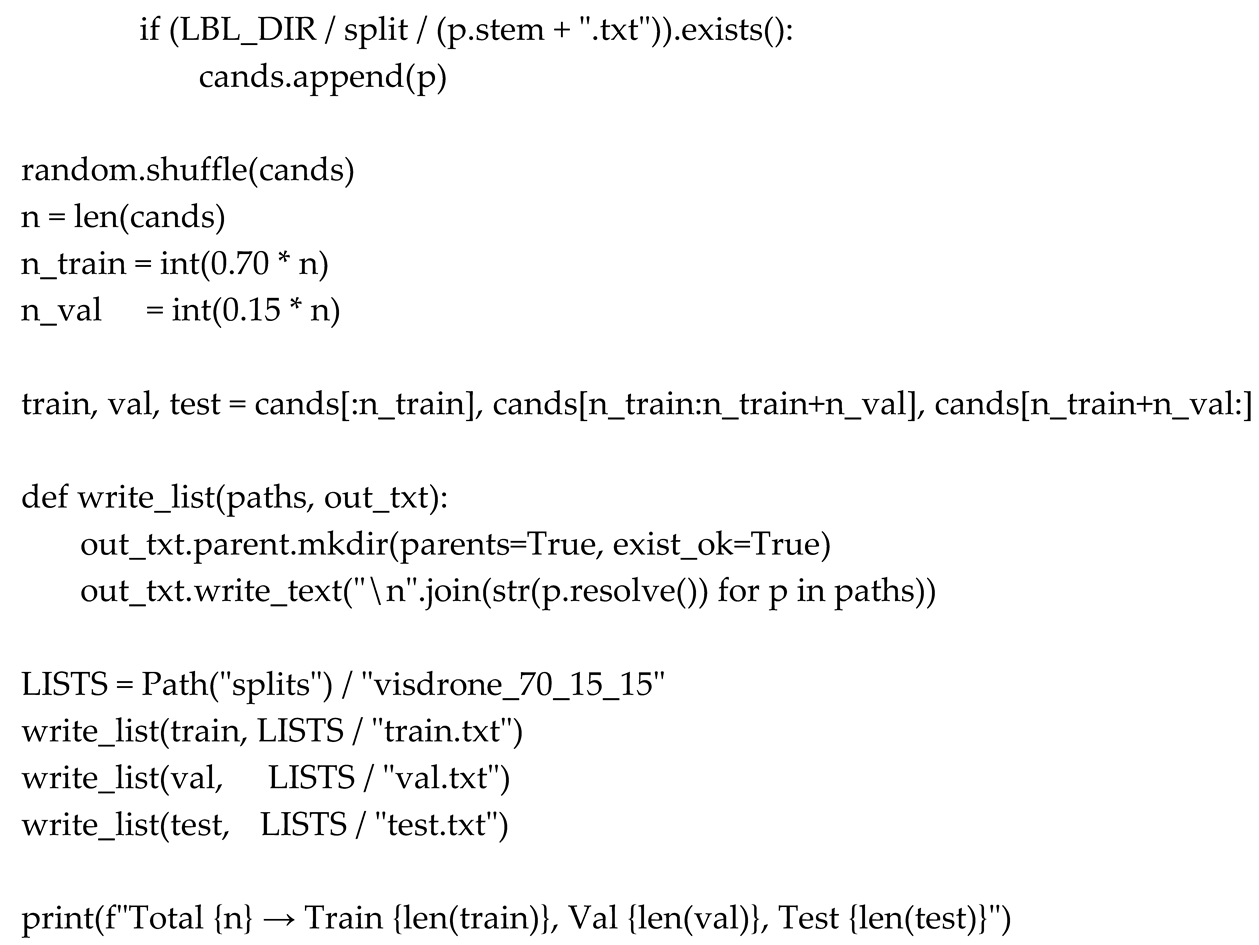
This procedure ensures reproducibility by fixing the random seed (RNG_SEED), allowing the exact same splits to be regenerated in future experiments.
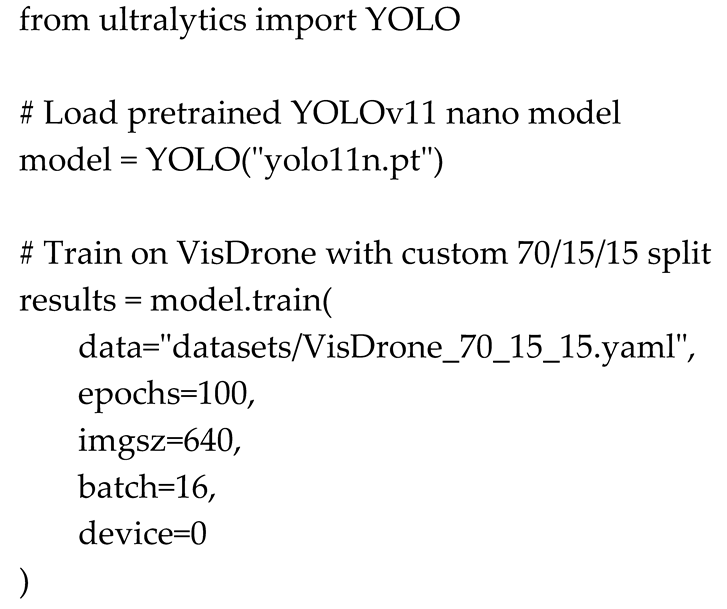
2.3. Model Training and Task Design
The YOLOv11 Nano (YOLO11n) model was selected due to its balance between speed and accuracy, making it suitable for real-time UAV surveillance applications. A pretrained YOLO backbone was fine-tuned on the VisDrone dataset for 100 epochs with an image input size of 640×640.
Training Code:
2.4. Tasks Performed
Five core computer vision tasks were addressed:
- Object Detection in Images(ODI): Detect vehicles, people, and other objects from aerial snapshots.
- Object Detection in Videos(ODV): Process live UAV video streams for real-time threat detection.
- Single-Object Tracking(SOT): Follow specific high-priority targets such as suspicious vehicles or individuals.
- Multi-Object Tracking (MOT): Track multiple moving entities simultaneously across frames using ByteTrack.
- Crowd Counting(CC): Count individuals in restricted areas to detect potential unauthorized gatherings.
Each task was evaluated using appropriate metrics such as mAP (mean Average Precision) for detection, IDF1 and HOTA for tracking, and MAE (Mean Absolute Error) for counting.
2.5. Tools and Programming Environment
The project utilized the following programming languages, tools, and libraries:
- Python 3.12: Core development language for model training, evaluation, and UAV simulation scripts.
- Ultralytics YOLO: Framework for object detection, tracking, and real-time video analytics.
- scikit-learn: Evaluation metrics and auxiliary machine learning tasks.
- NumPy: Numerical computations and data preprocessing.
- Matplotlib: Visualization of model performance metrics such as loss curves and confusion matrices.
- Label Studio: Annotation tool for custom UAV footage.
- AirSim Simulator: Synthetic UAV footage generation for rare-event training.
- AI-use disclosure: An AI assistant was used only for language polishing and figure composition. All experiments, modeling, analysis, and conclusions were designed, executed, and interpreted by the authors.
The experiments were conducted on a workstation equipped with an NVIDIA RTX 4090 GPU, 32GB RAM, and CUDA 12.2.
2.6. UAV Hardware and Workflow Integration
The TLG UAV surveillance system relies on a combination of advanced hardware, specialized software, and structured operational workflows:
•UAV Hardware:
Quadcopters equipped with high-resolution RGB cameras.
Thermal imaging sensors for night-time monitoring.
GPS and inertial modules for precise geofencing and waypoint navigation.
•Ground Control Stations (GCS):
Securely manage real-time telemetry, video feeds, and mission data.
Provide operators with live drone metrics such as altitude, speed, battery levels, and no-fly zone alerts.
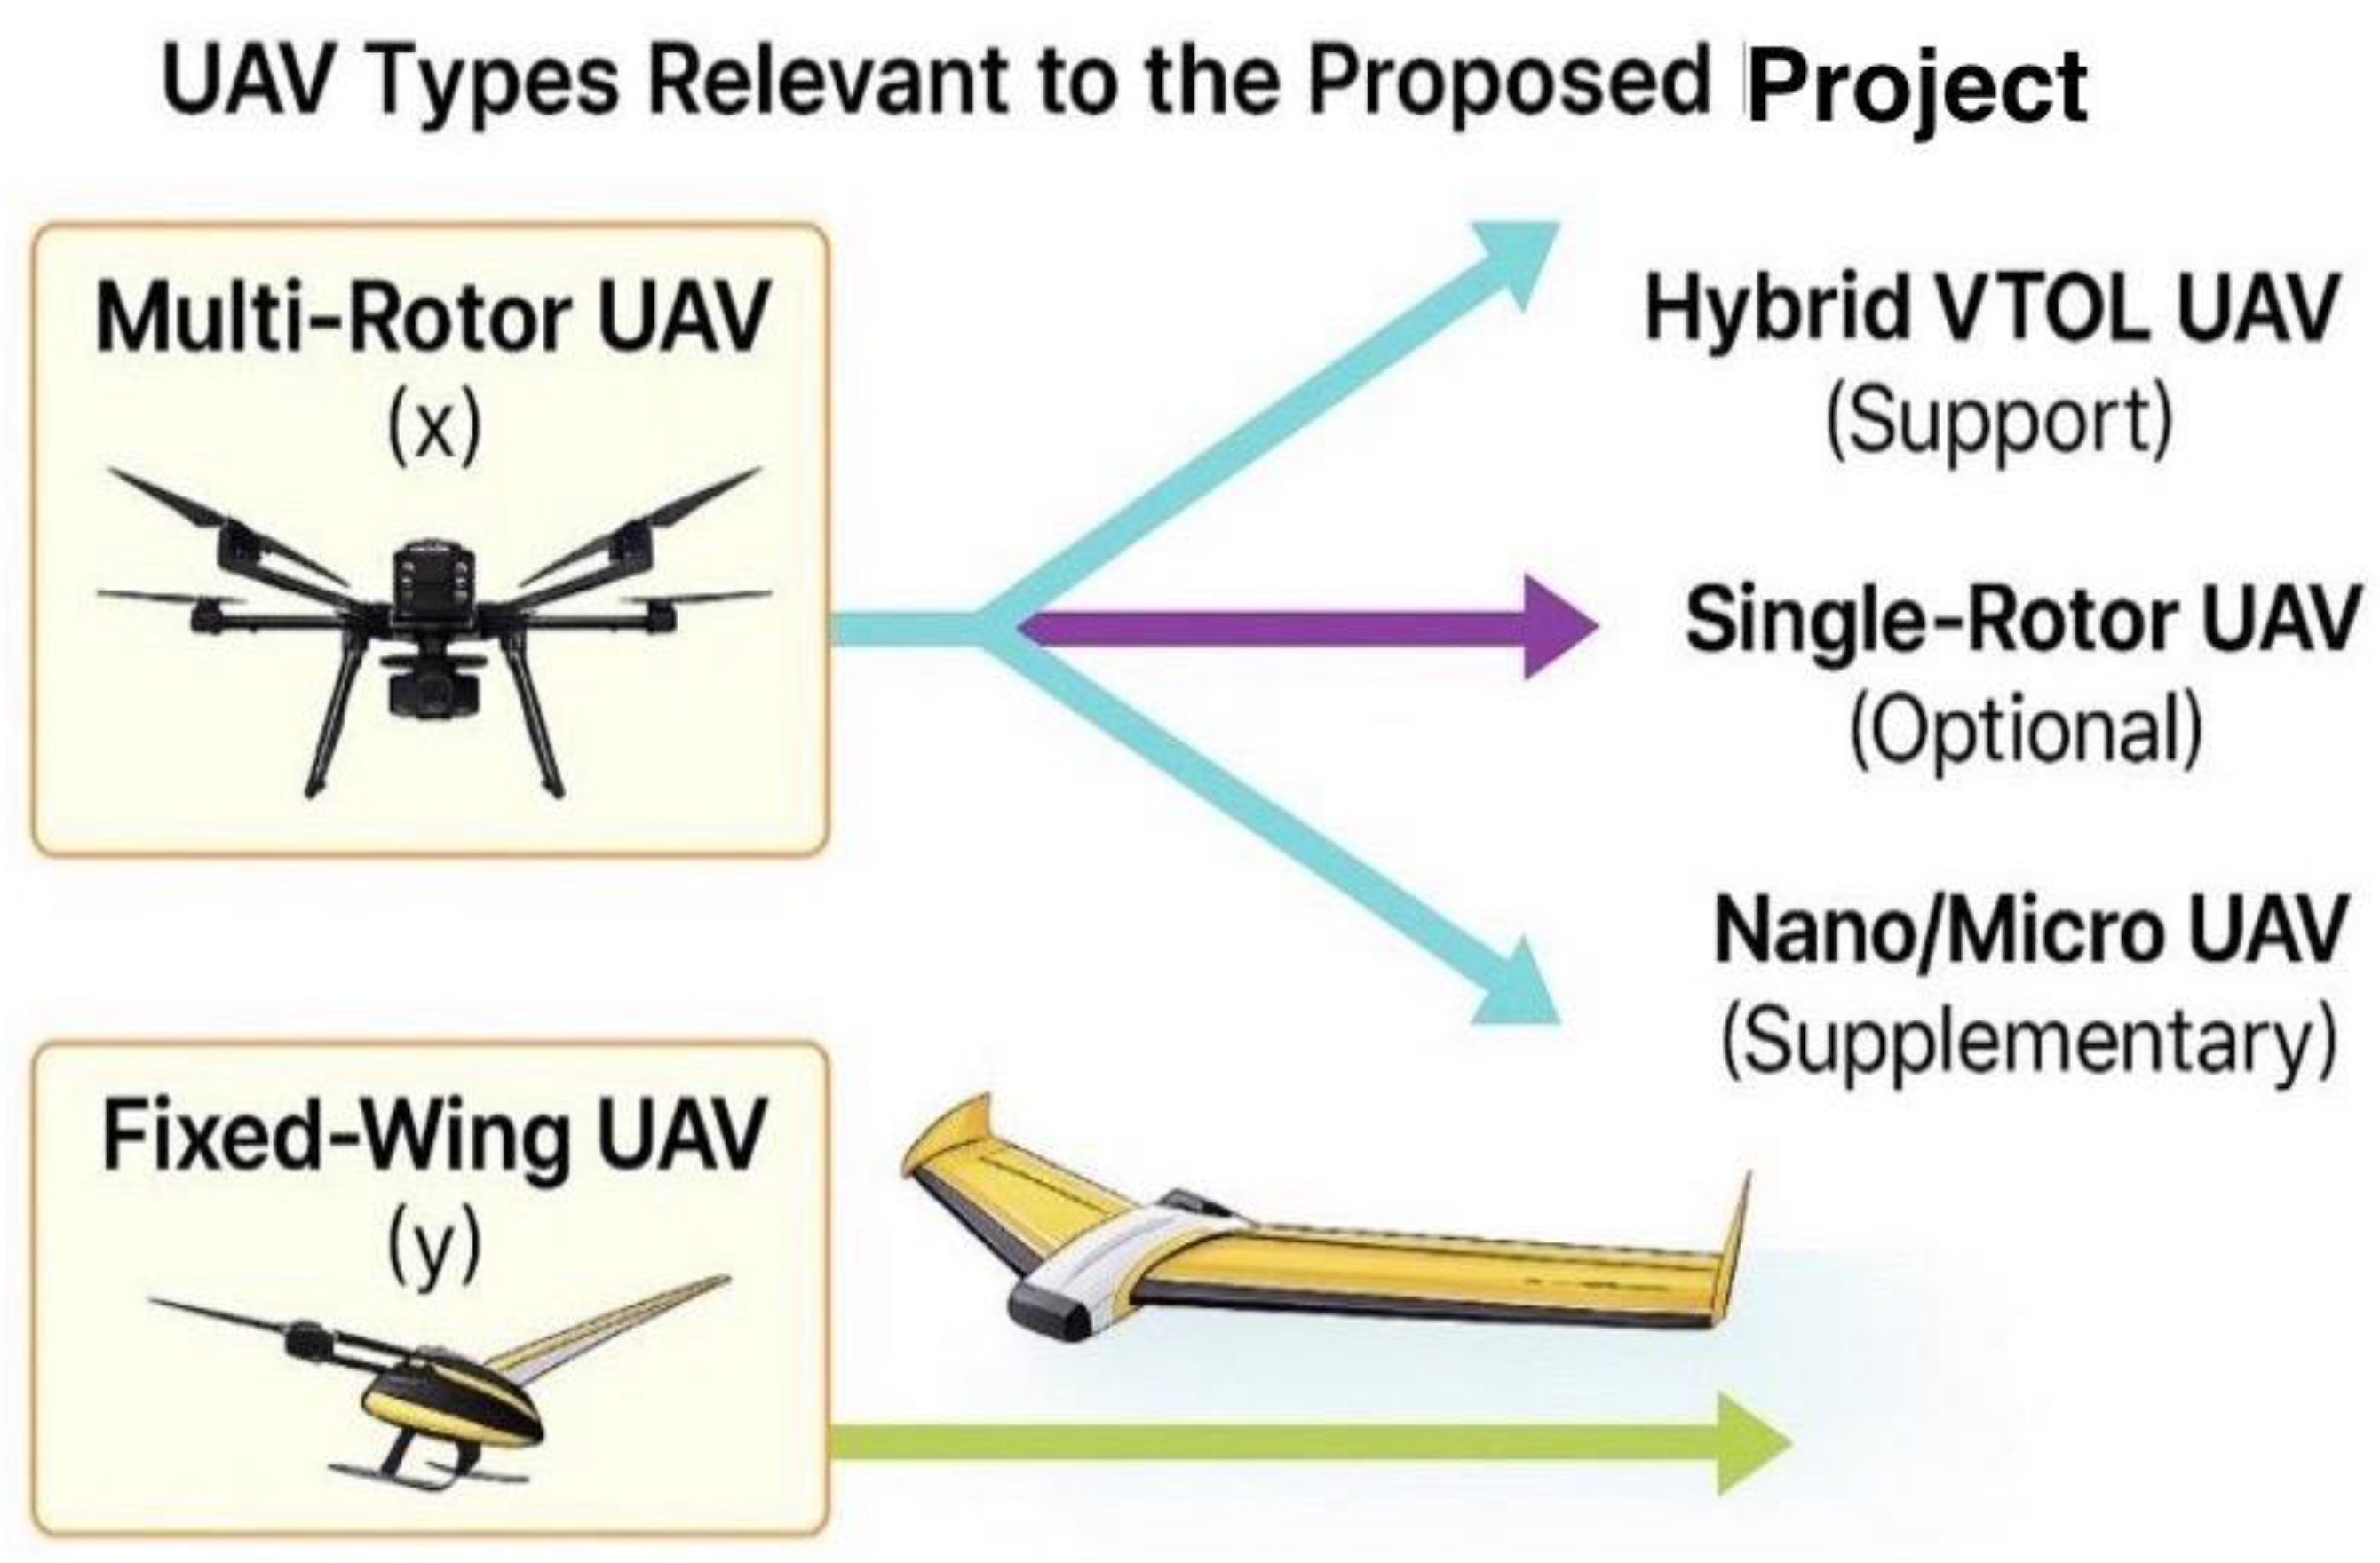
Figure 6.
UAV types considered; primary: multirotor; optional: fixed-wing/VTOL.
2.7. Operational Workflow:
-
Pre-Flight Preparation:BVLOS (Beyond Visual Line of Sight) compliance checks (Federal Aviation Administration, 2025) and automated pre-flight checklists.
-
Autonomous Patrols:UAVs follow predefined geofenced routes, covering parking lot perimeters and vulnerable zones.
-
Real-Time Threat Detection:AI models detect anomalies and trigger alerts for ground security teams.
-
Return-to-Base (RTB):When batteries are low or missions end, drones autonomously return to solar-powered docking stations for recharging (Nieuwoudt et al., 2025).
Figure 7.
Workflow for UAV Surveillance Operations: Highlighting TLG staffing and management, fieldwork demonstrations, BVLOS licensing, and launchpad preparation as essential steps for effective fleet monitoring and compliance.
Figure 7.
Workflow for UAV Surveillance Operations: Highlighting TLG staffing and management, fieldwork demonstrations, BVLOS licensing, and launchpad preparation as essential steps for effective fleet monitoring and compliance.
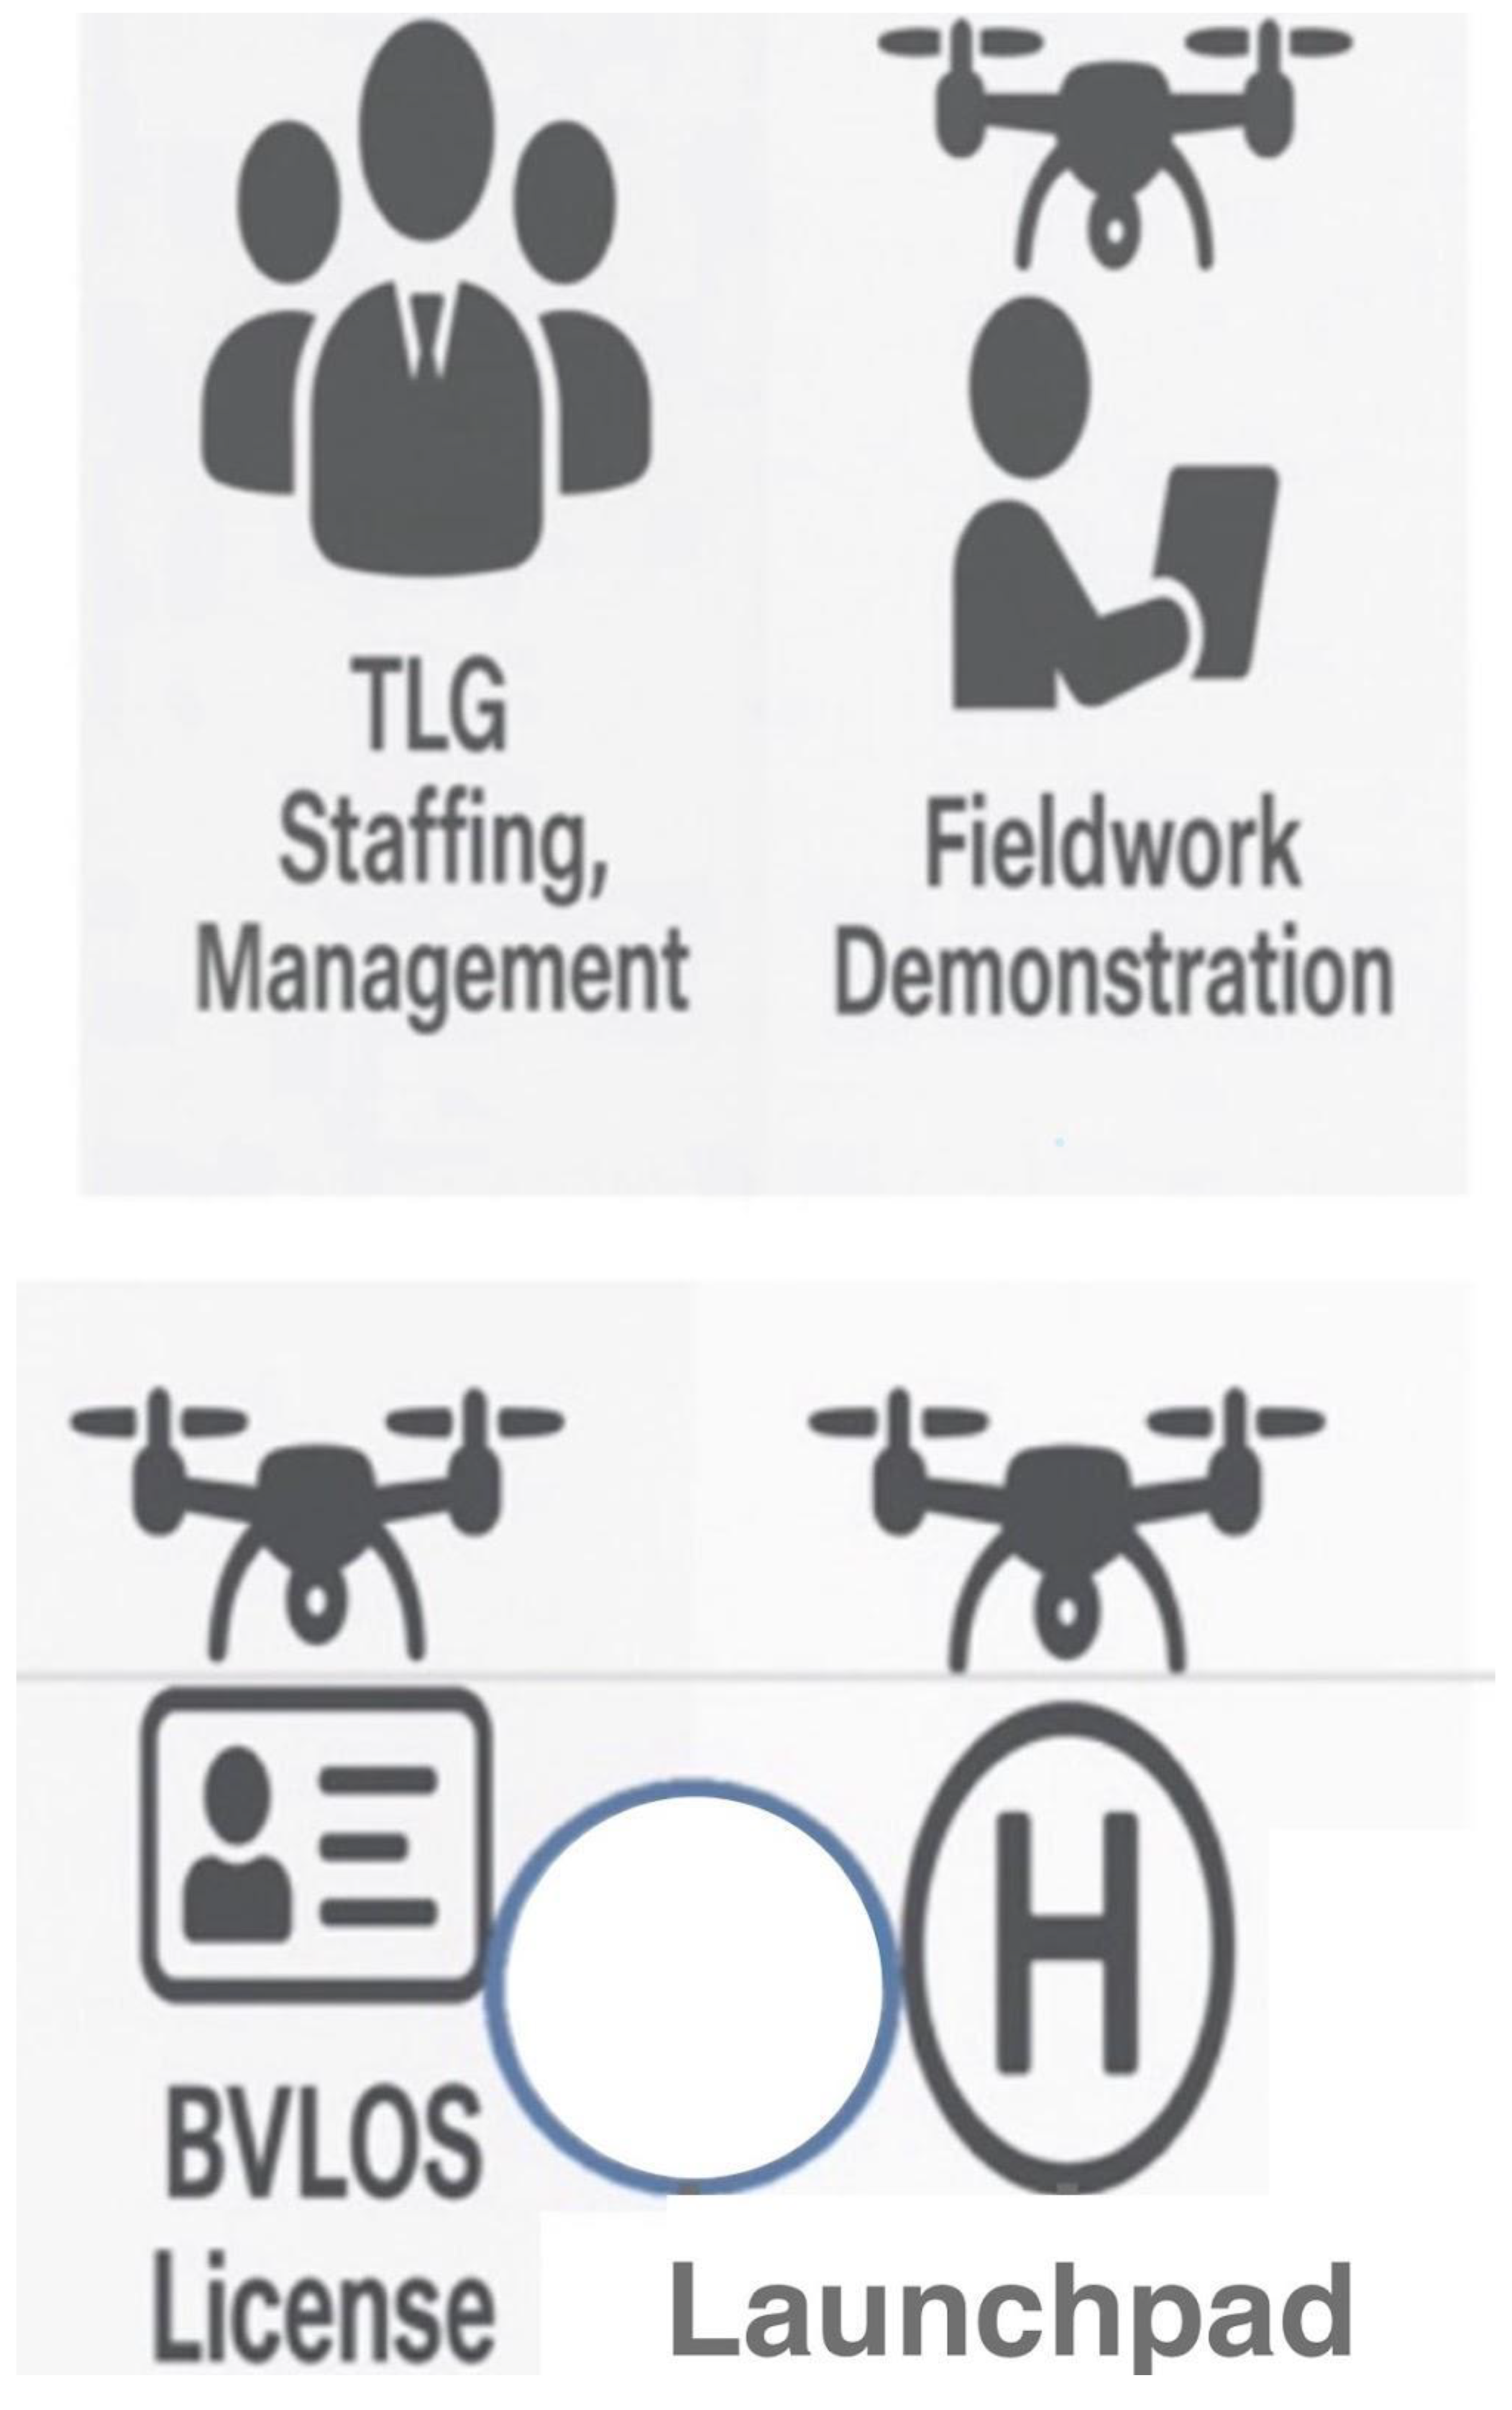
Figure 8.
Twilight aerial view of The Larson Group (TLG) facility in Denton, Texas, showcasing an advanced drone surveillance system. Two drones hover at 200 ft and 300 ft altitudes, following clearly marked patrol paths, while the illuminated surveillance zone highlights active monitoring of utility trucks. Enhanced road markings and entry points ensure operational clarity and secure facility management.
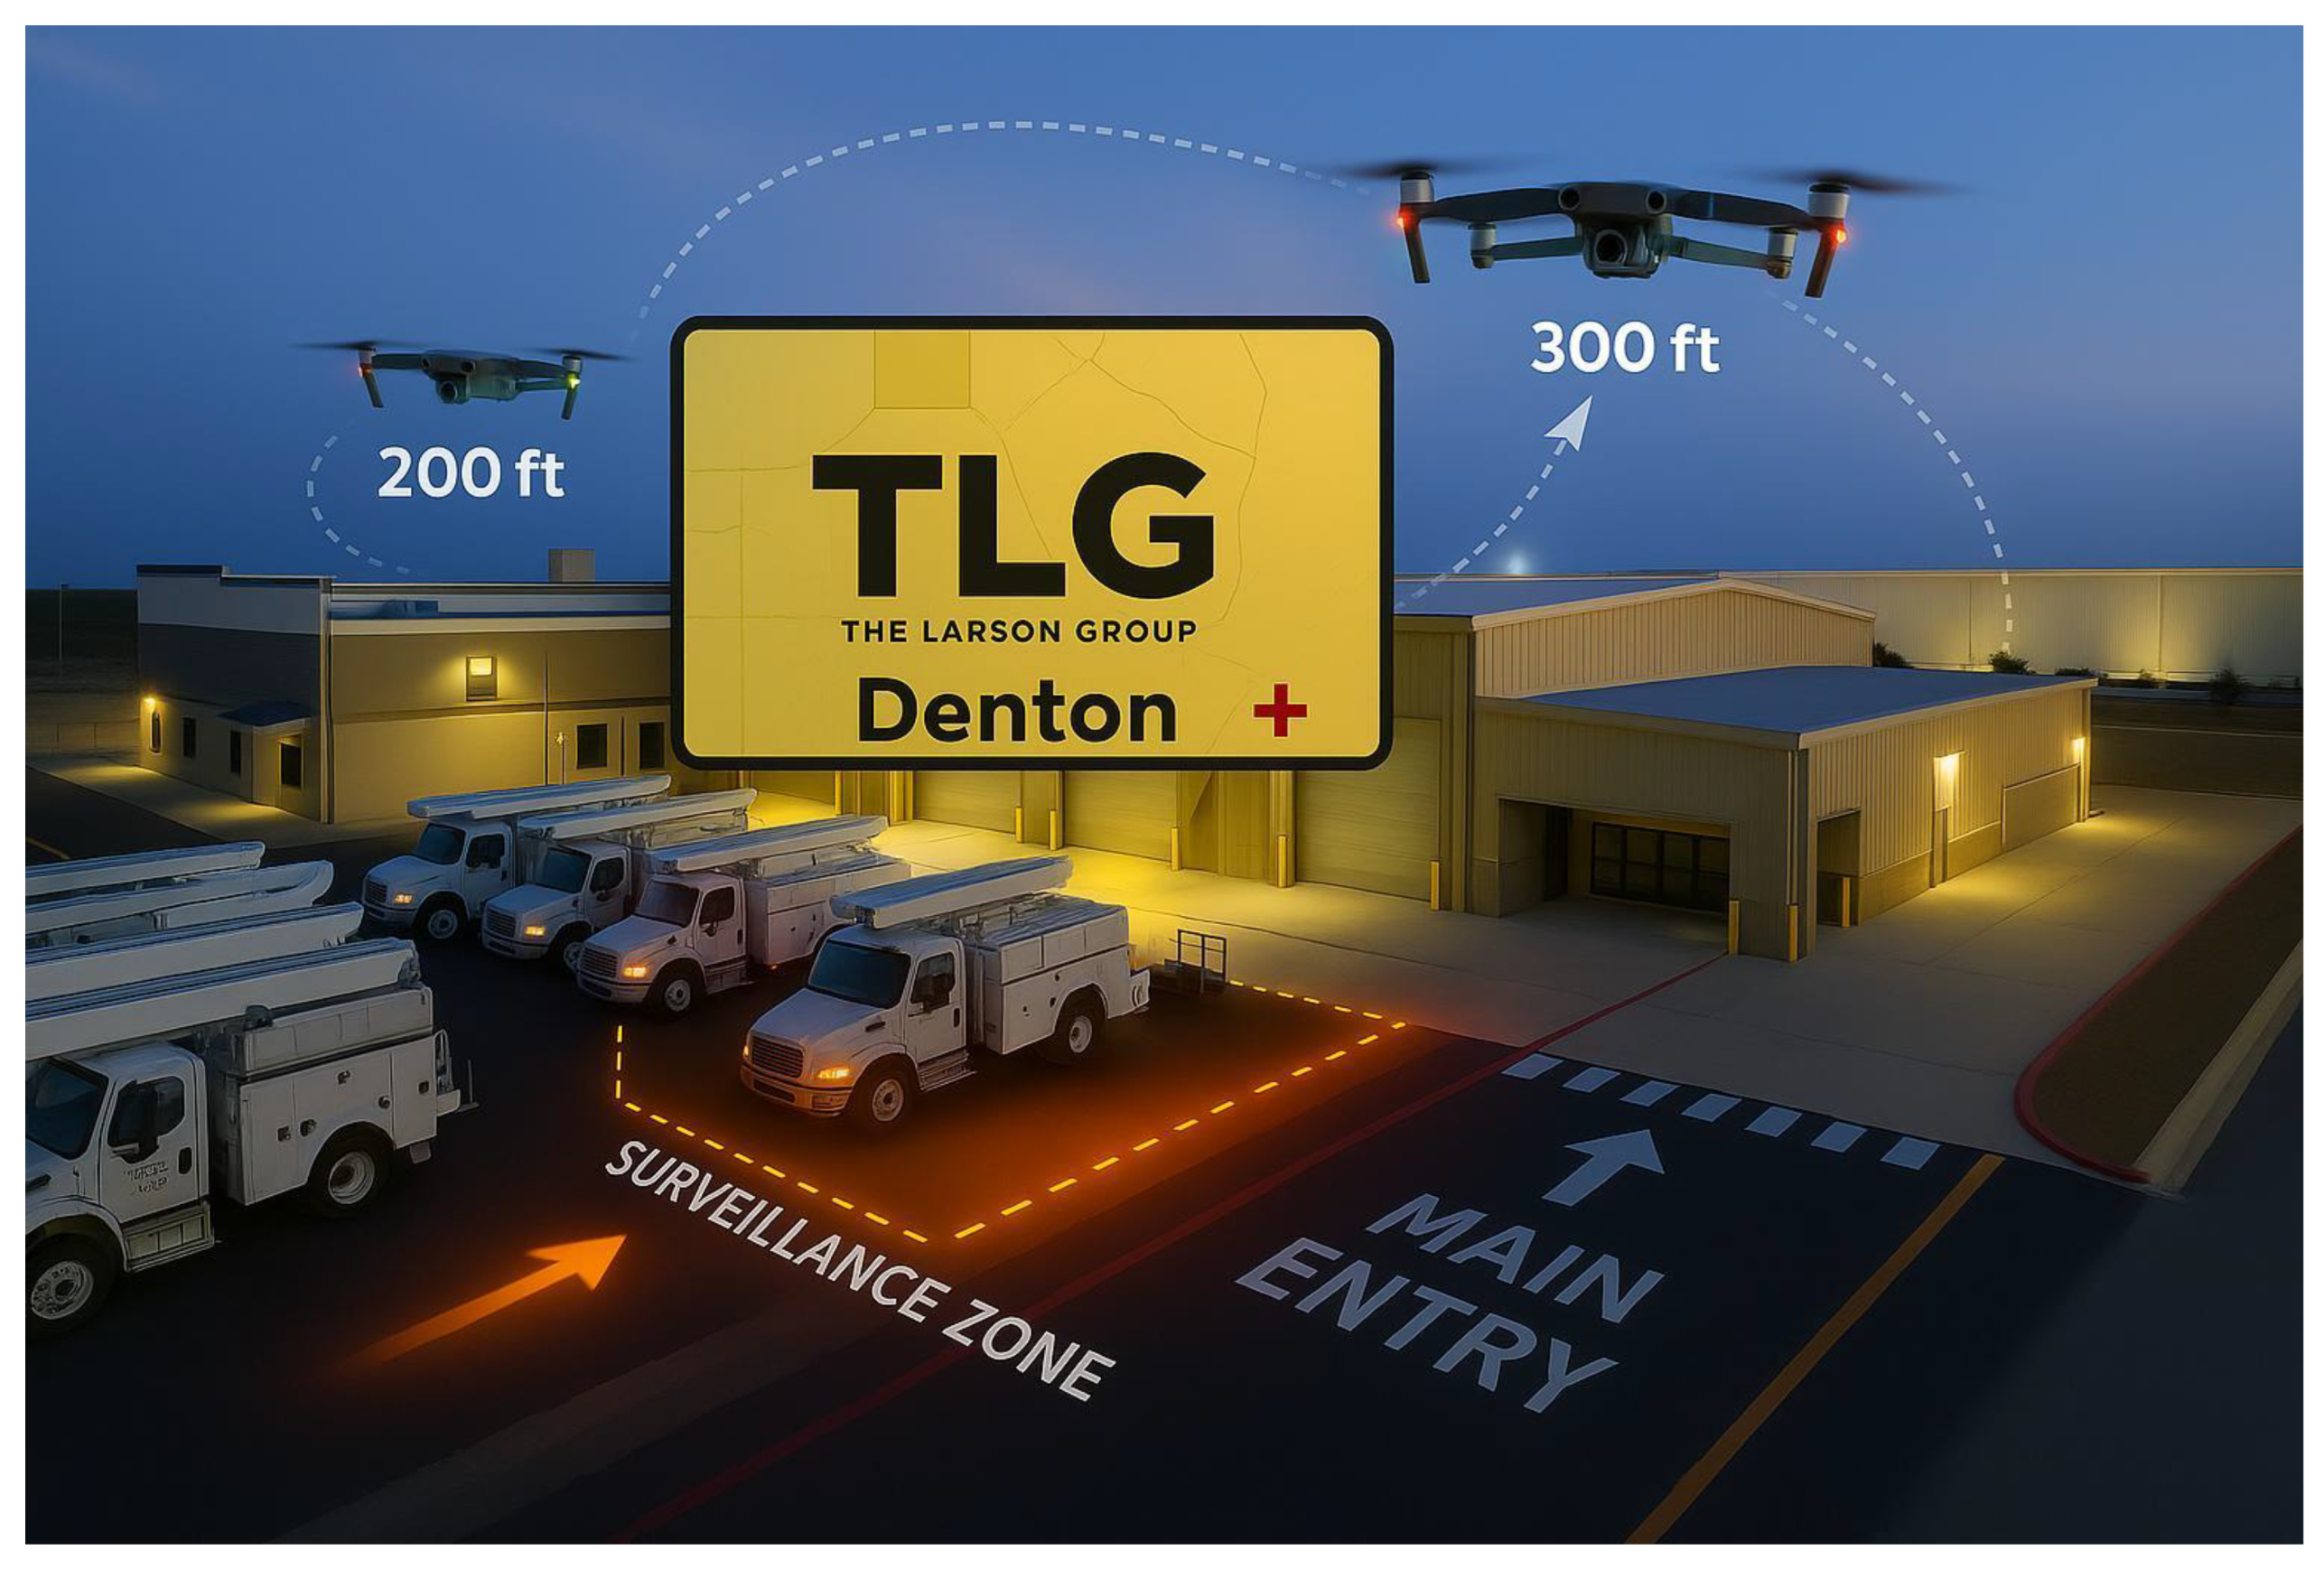
Figure 9.
TLG Drone Surveillance Dashboard displaying live drone telemetry data including altitude, speed, signal strength, and battery levels. The live map shows the patrol route around The Larson Group (TLG) facility in Denton, with designated altitude markers (200 ft and 300 ft). Integrated QR codes provide quick access to critical SOPs, including Emergency Landing Procedures, Pre-Flight Checklists, and Incident Report Forms for streamlined drone operations and safety management.
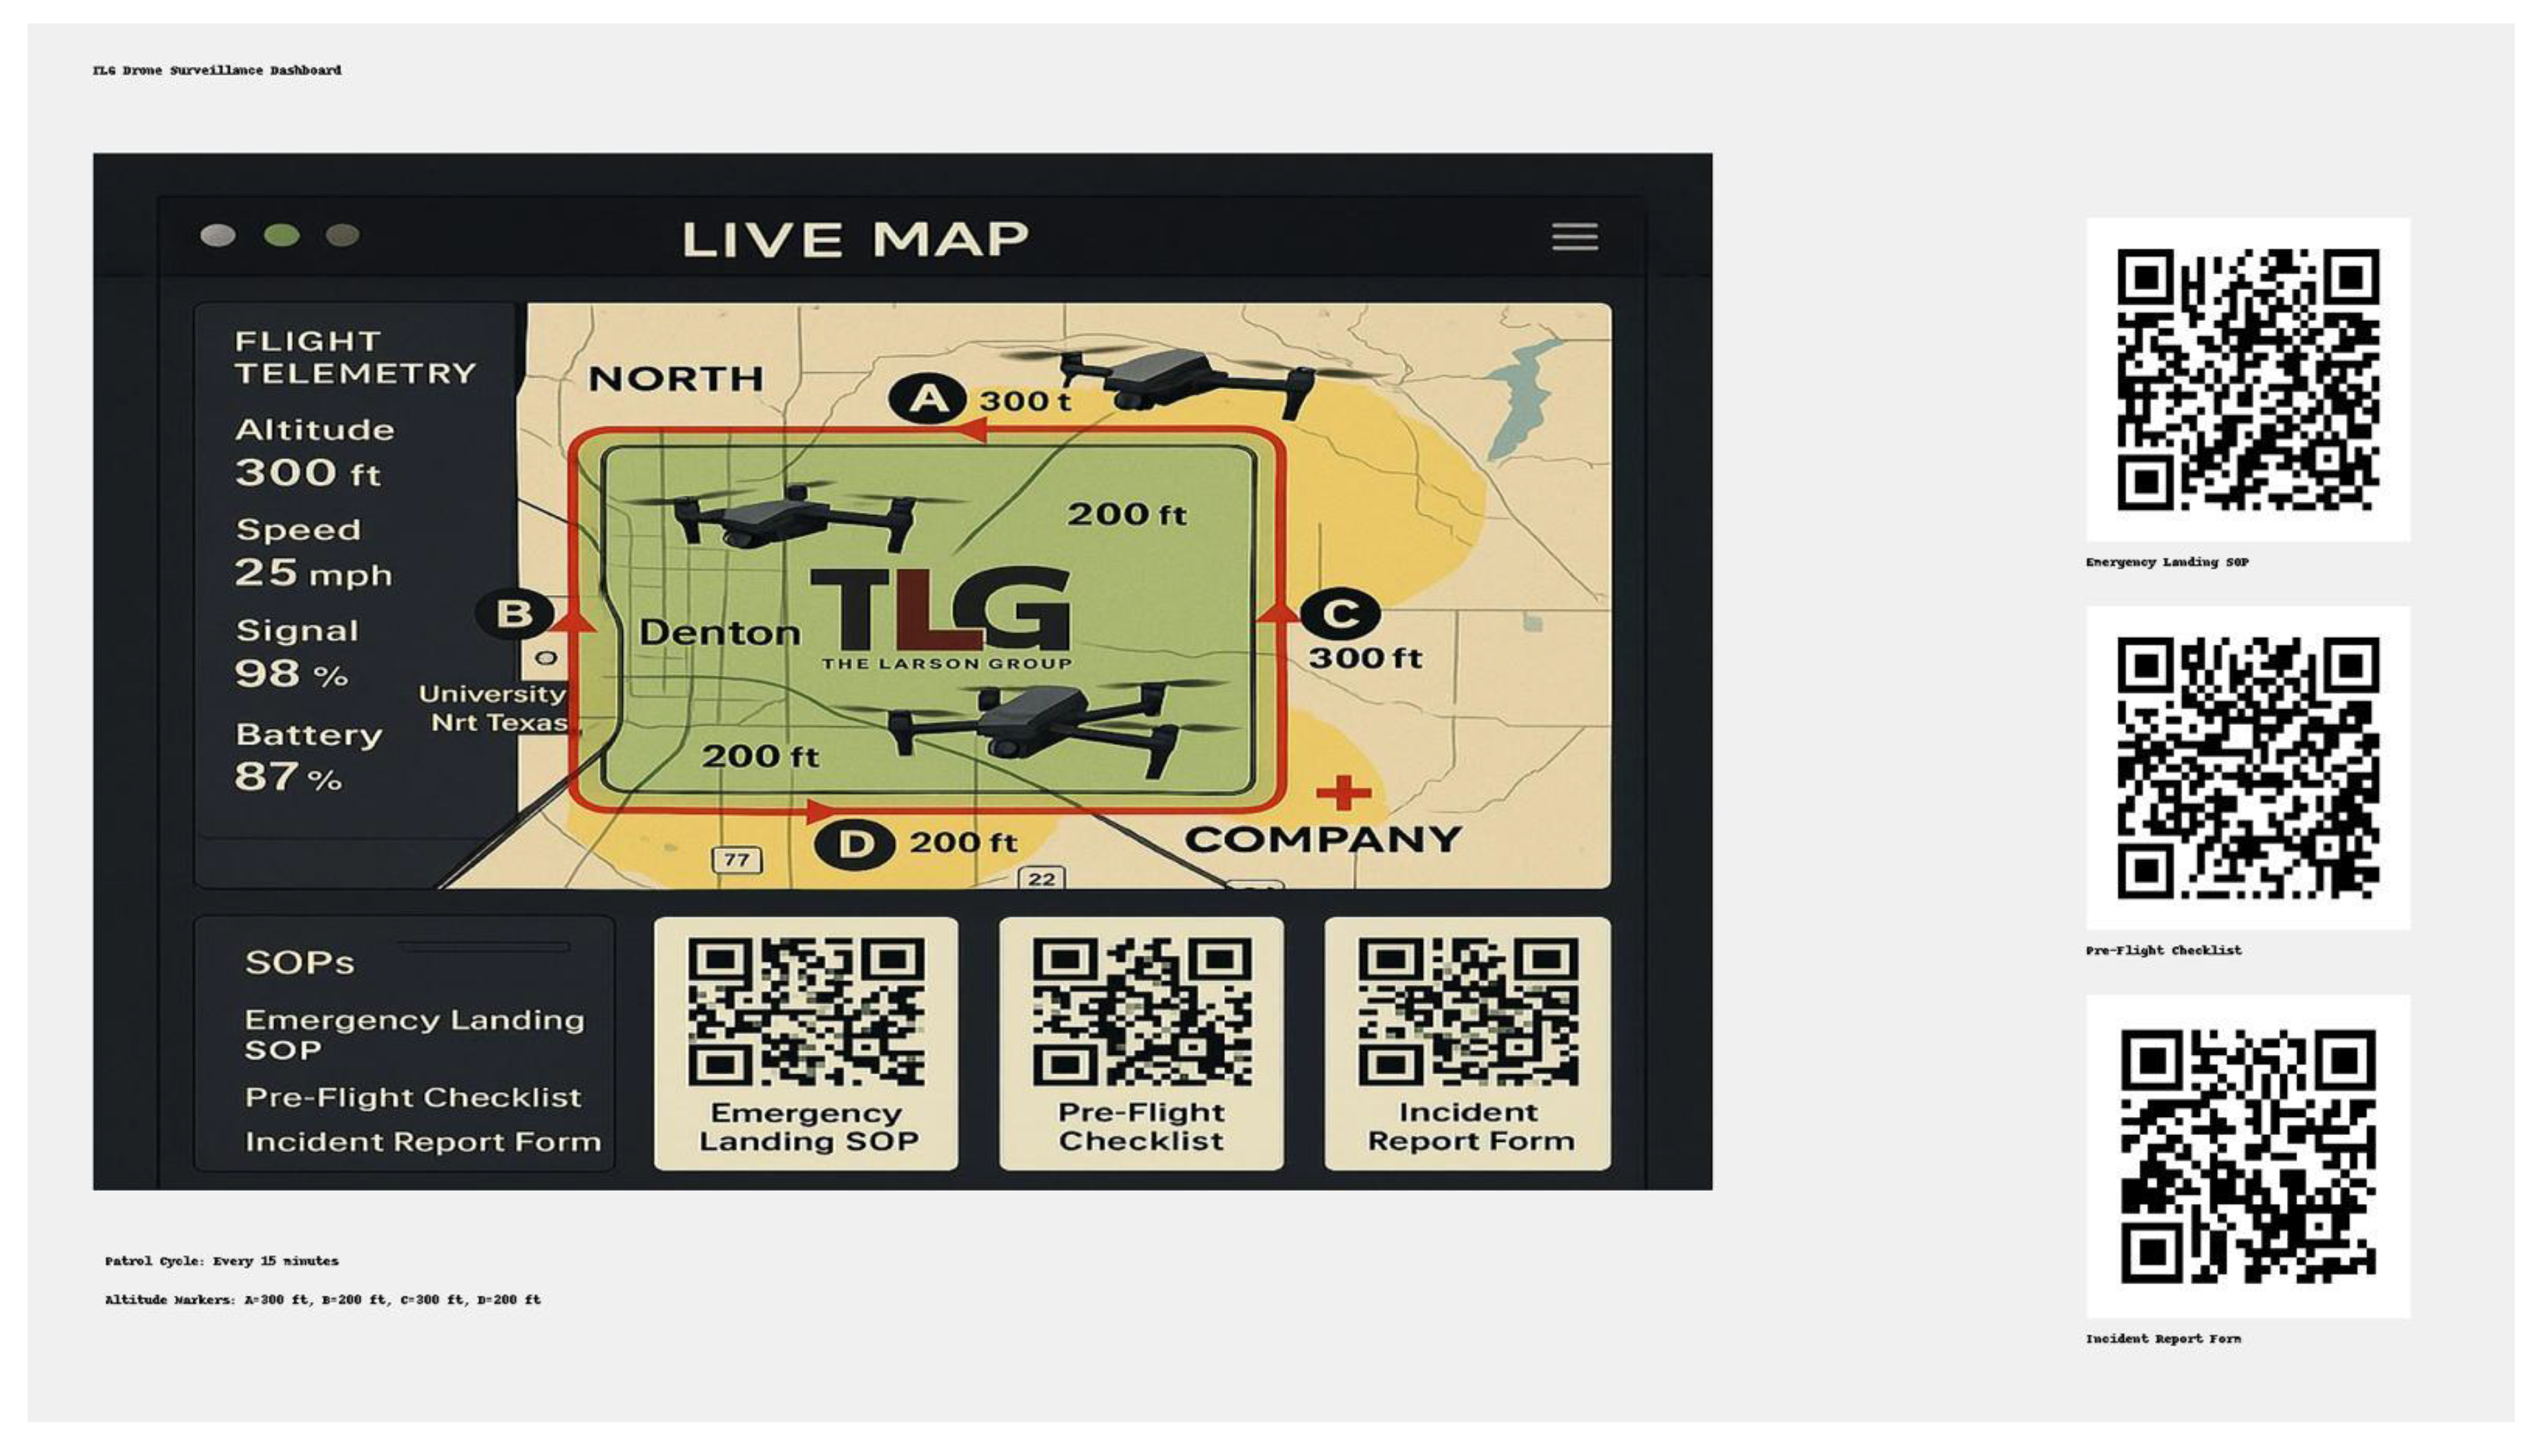
Figure 10.
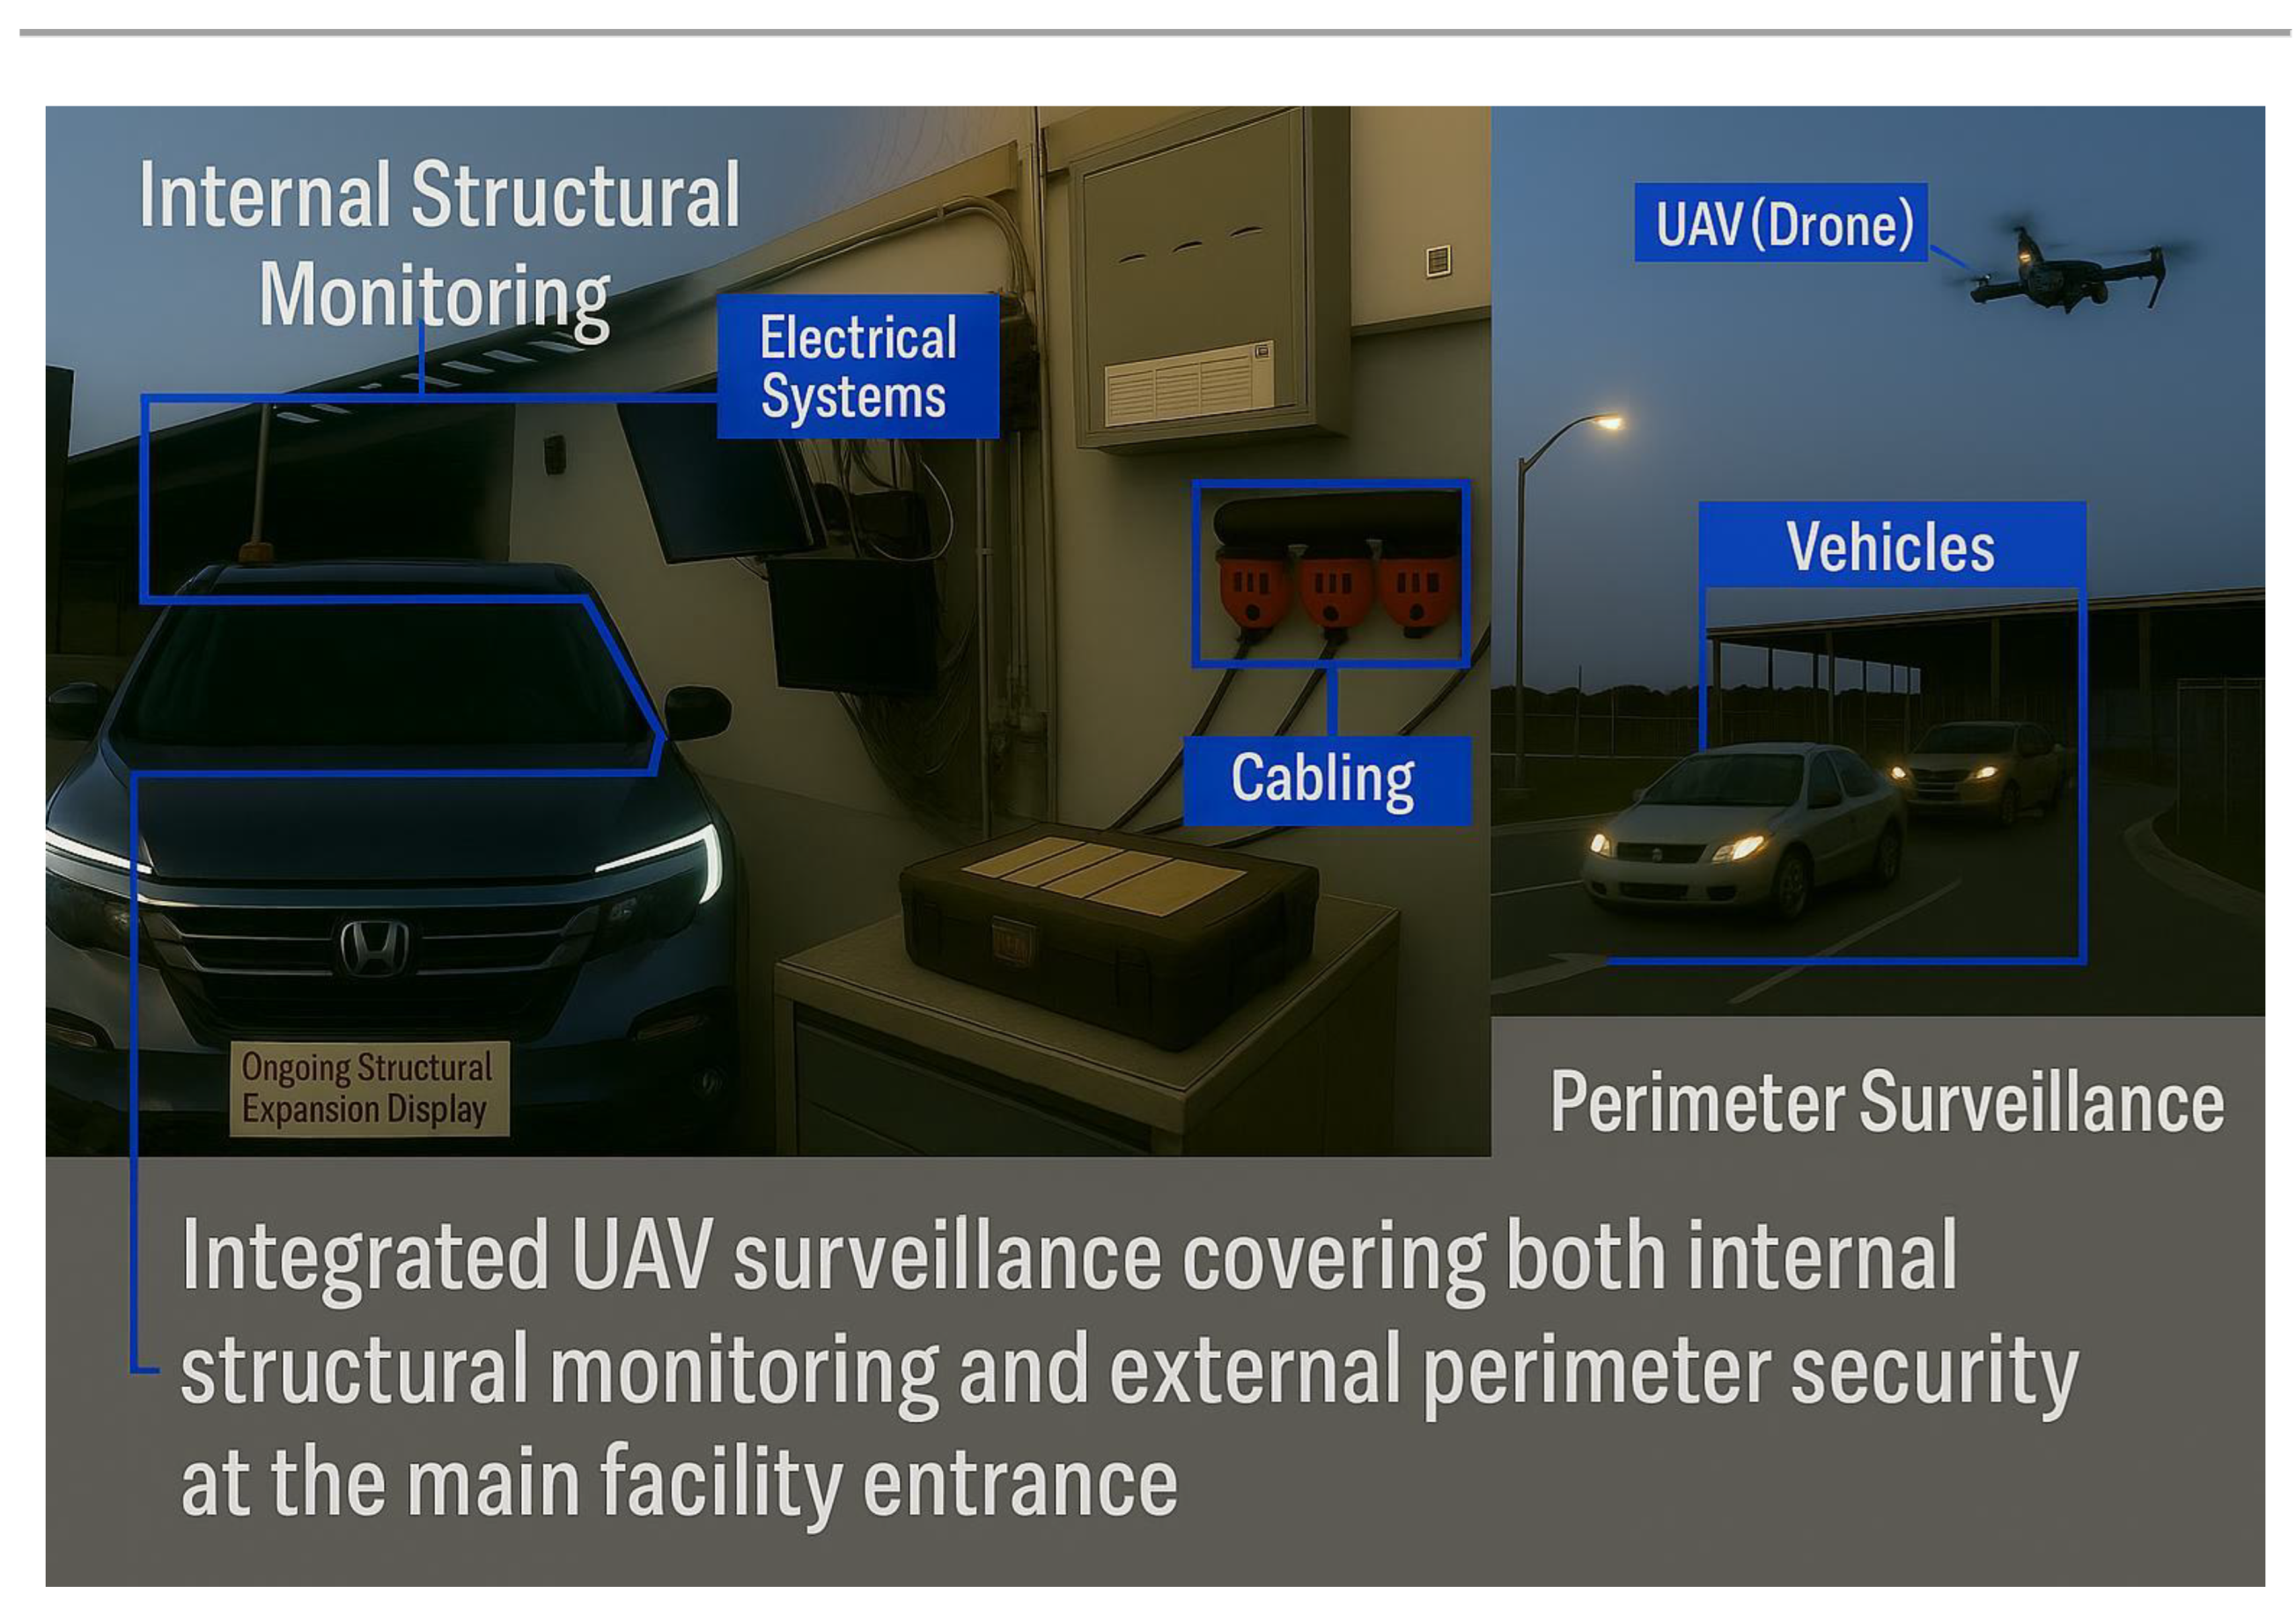
Integrated internal (structure) and external (perimeter) monitoring.
2.8. Task Execution and Analysis
The five tasks are built sequentially, with each layer adding complexity to the UAV surveillance system. All tasks leverage the custom 70% for training, 15% for validation and 15% for testing dataset split and the YOLOv11 Nano (YOLO11n) model trained on VisDrone data. Images were pre-processed and annotated with bounding boxes for objects such as buses, bicycles, motorcycles, and pedestrians.
2.9. VisDrone Data Analysis Report
2.9.1. Introduction
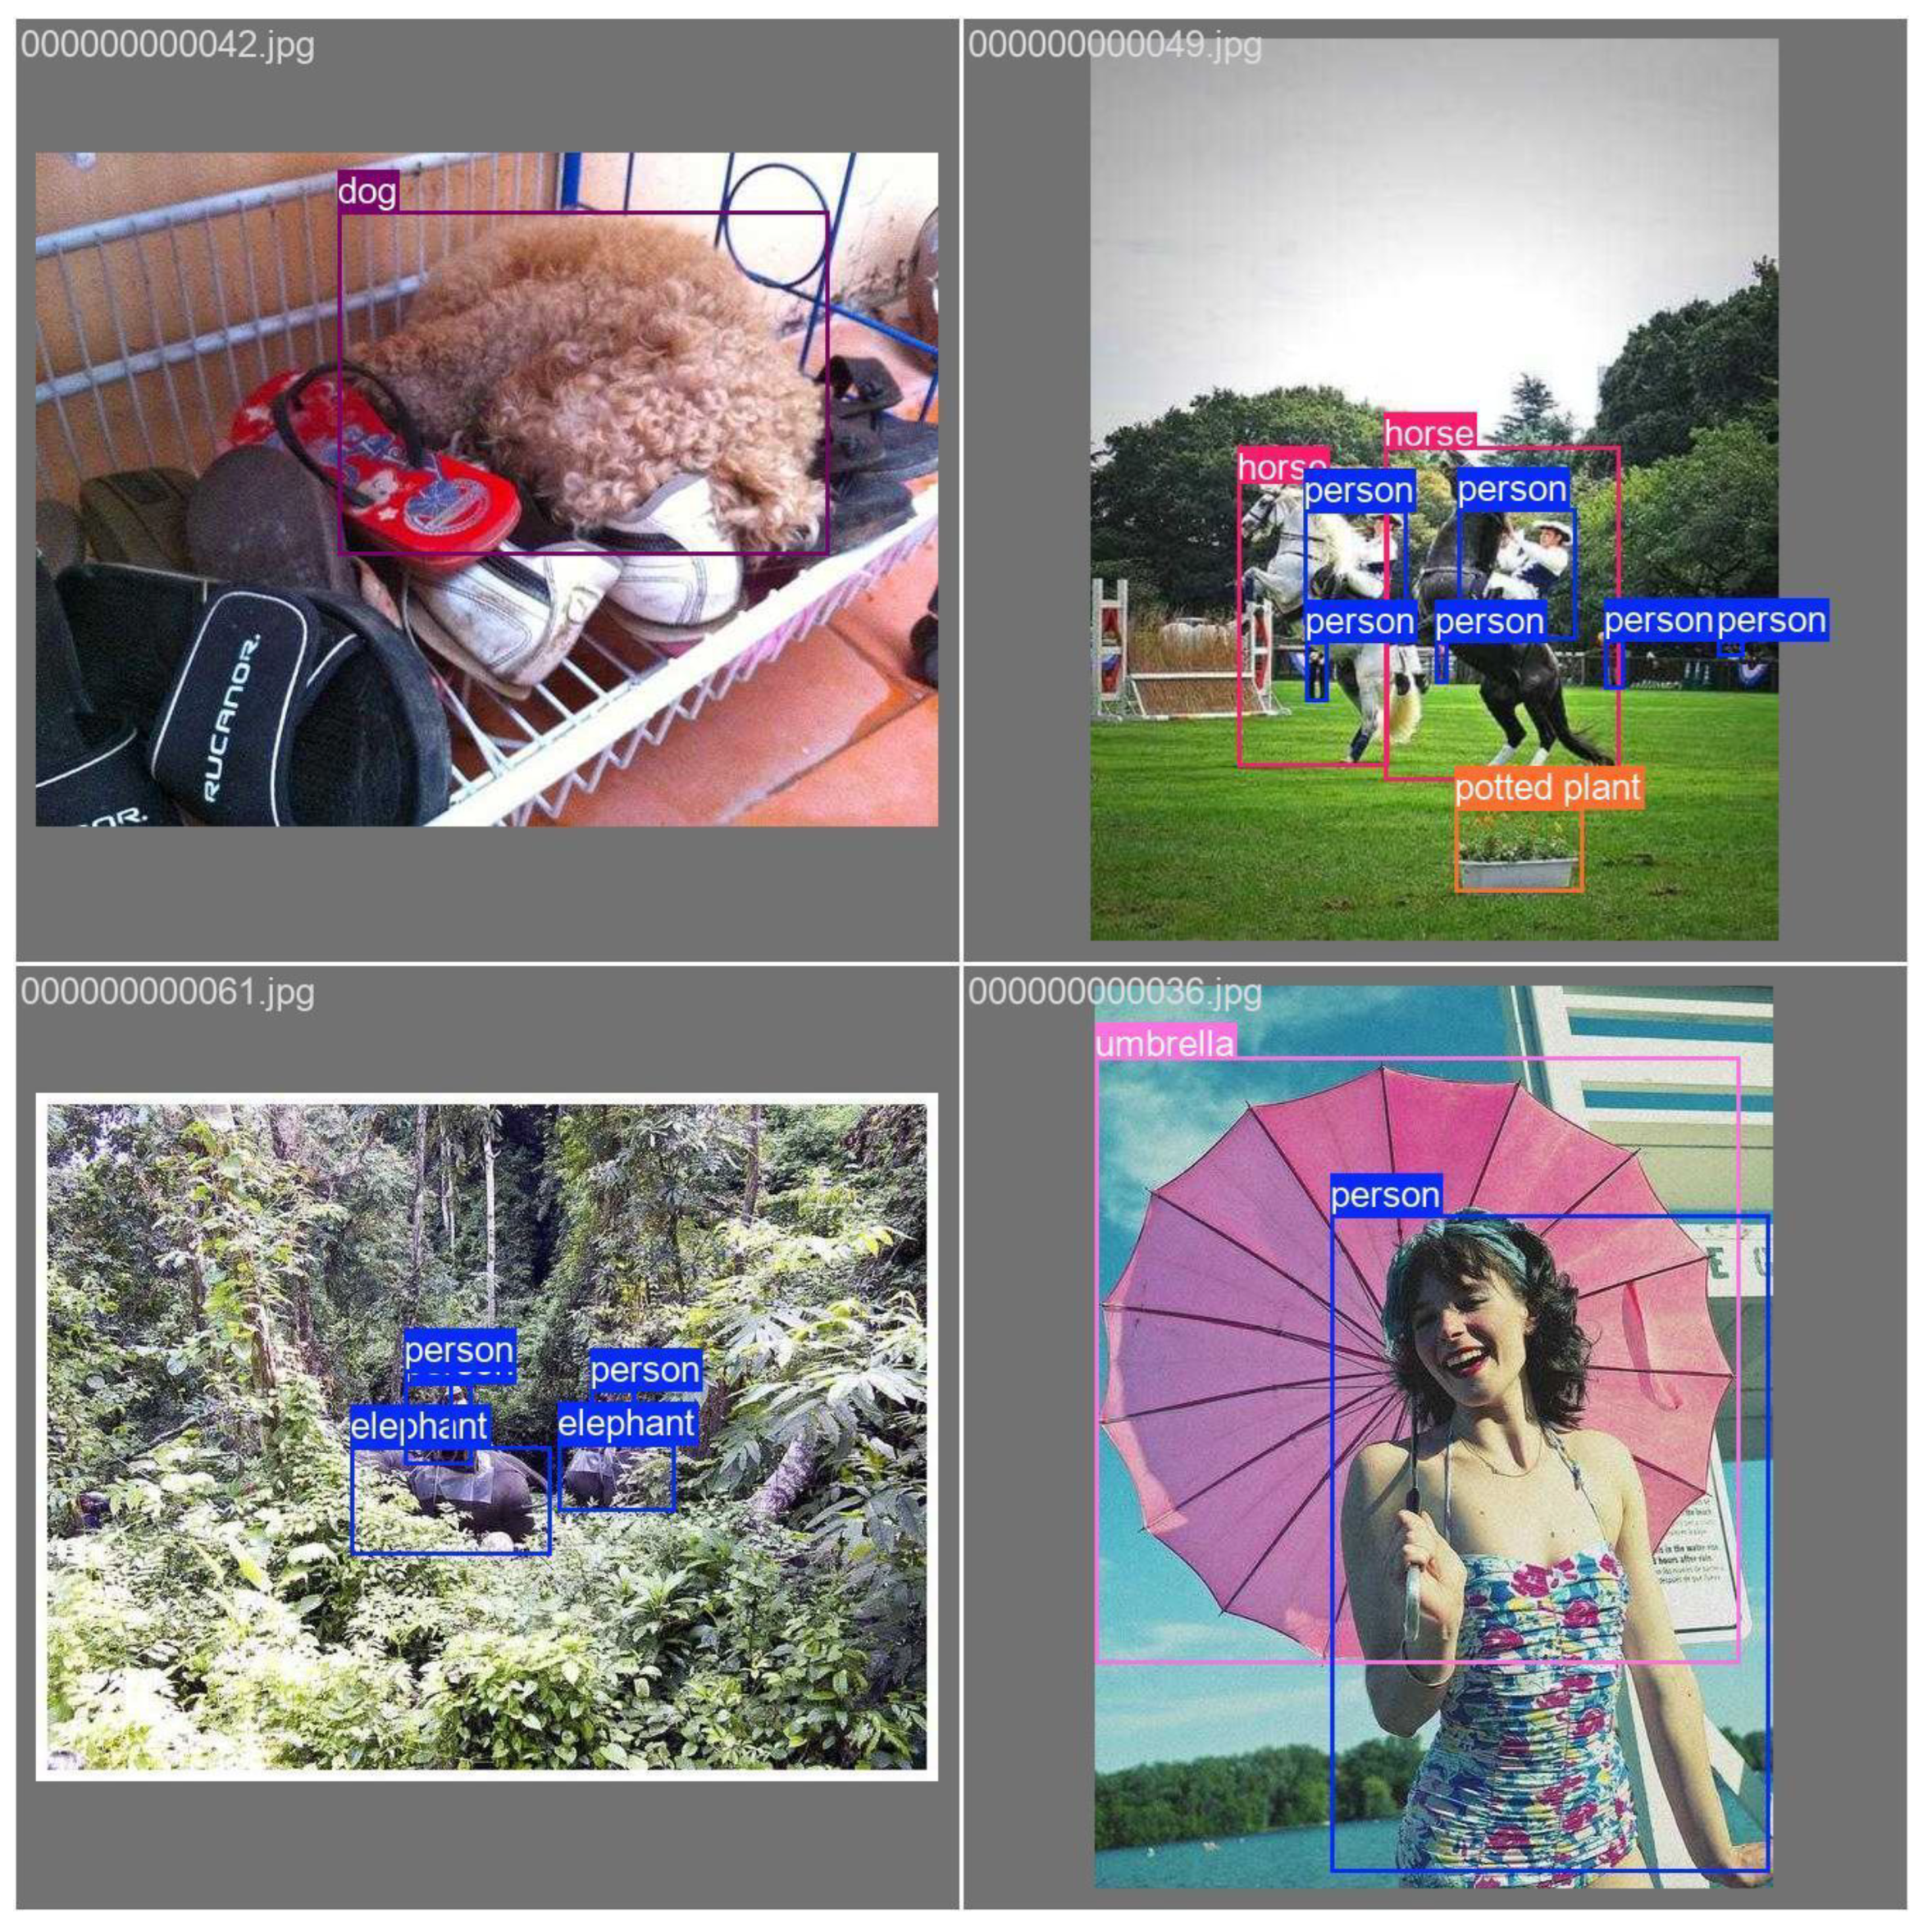
This document presents a focused data analysis of VisDrone experiments across prediction, detection, tracking, and counting. It includes quantitative metrics (mAP, precision, recall, F1), operating-point analysis (confidence sweeps), confusion matrices, training dynamics (loss curves), and qualitative figures. The trained model successfully detected multiple classes of objects with varying confidence levels. Below are sample detection outputs and other graphical charts demonstrating the model's ability to identify objects in real-world scenarios. Each bounding box is labeled with the object class and confidence score. We summarize the relevant recommended operating thresholds and discuss error modes.
Qualitative detection frames with class labels and confidences.(Figure 11, Figure 12, Figure 13, Figure 14, Figure 15, Figure 16, Figure 17, Figure 18, Figure 19 and Figure 20).
The above outcome boxes demonstrate the effectiveness of integrating UAV systems with AI-powered object detection models. Next, we discuss the evaluation metrics and tuning capabilities.
2.9.2. Metrics Overview
We report standard detection metrics: mean Average Precision at IoU 0.5 (mAP@0.5), precision–recall (PR) curves, class-wise confusion matrices, and F1 as a function of confidence. Tracking metrics (MOTA/MOTP, IDSW) and counting metrics (MAE/RMSE) are proposed but may require additional exports.

Table 1.
Detector comparison on VisDrone 70/15/15; YOLOv11-nano summary.
| Model | Params (M) | FLOPs @640² (G) | mAP@[.5:.95] | mAP@0.5 | Precision@τ | Recall@τ | Best F1 | τ (confidence) |
| YOLO11n (Ours) | 0.912 | 0.61 | 0.185 | |||||
| Baseline A (YOLOv5n) | ||||||||
| Baseline B (YOLOv8n) |
Notes: τ = chosen deployment threshold (0.185). FPS = averaged throughput over ≥100 frames. Identical augmentations and NMS used across all models.
Table 2.
Key detection metrics and operating point.
| mAP@0.5 (all classes) | 0.912 |
| Best F1 (operating point) | ≈0.61 at confidence ≈0.185 |
| Person class (mAP@0.5) | ≈0.666 – crowd/occlusion sensitive |
| Strong classes | Umbrella, Dog, Horse – consistent high precision |
| Training trend | Losses ↓ plateau near epoch 50; monitor overfitting |
Table 3.
Qualitative Bounding Box Observations.
| Image | Detected Classes | Confidence Scores | Notes |
| Image 11 | Single unidentified box | N/A | Baseline detection, low complexity. |
| Image 12 | Motor | 0.70 | Moderate confidence, correct labeling. |
| Image 13 | Bicycle | 0.32 | Very low confidence, likely false positives. |
| Image 14 | Unidentified | N/A | No class label, misdirected region. |
| Image 15 | Buses (3 total) | 0.41, 0.47, 0.72 | Clear detections; confidence variance shows imbalance. |
| Image 16 | Awning-Tricycle | 0.27 | Almost certain false positive. |
| Image 17 | Motor | 0.29 | Poor confidence, underperforming detection. |
| Image 18 | People and Bus | 0.86 (person), 0.34 (bus) | Person detected strongly; bus borderline confidence. |
| Image 19 | Motor | 0.61 | Strong detection with good confidence. |
| Image 20 | People, Bus | 0.82 (person), 0.26 (bus) | Person strong; bus detected poorly. |
Table 4.
Metrics Review and Interpretation.
| mAP@0.5 (all classes) | 0.912 – Excellent overall accuracy. |
| Best F1 score (operating point) | 0.61 at confidence ≈ 0.185 |
| Person class mAP@0.5 | 0.666 – Most challenging due to crowd occlusions |
| Top-performing classes | Umbrella, Dog, Horse – robust high precision |
| Weak classes | Bicycle, Awning-Tricycle, some Motor detections |
Key Takeaways:
- The people class performs very well, with confidence >0.80.
- Bus class is inconsistent; high variance from 0.26–0.72 suggests anchor or dataset imbalance.
- Low-confidence detections (<0.35) like bicycle and tricycle are almost certainly false positives.
- Motor class varies; some good (0.70, 0.61), others weak (0.29).
2.9.3. Interpretation:
- While the model performs well overall, weak classes align with low-confidence outputs like bicycles and tricycles.
- The person class, despite its challenge in crowded environments, remains fairly strong compared to small object classes.
2.9.4. Error Sources Identified
- Class Imbalance
- o
- Rare classes like awning-tricycle and bicycle lack sufficient training samples, resulting in low confidence detections.
- 2.
- Crowd Occlusion
- o
- In crowded urban scenes, overlapping bounding boxes lead to ID switches and lower recall for the personclass.
- 3.
- Resolution Limits
- o
- Small object detections are hurt by UAV’s high-altitude imagery, reducing clarity for classes like bicycle or motorbike.
2.9.5. Recommended Threshold Adjustments
Based on F1 curve maximum at 0.185, detections below this threshold should be filtered out to reduce false positives.
-
Example:
- o
- Acceptable detection: Motor at 0.70
- o
- Rejectable detection: Awning-Tricycle at 0.27
2.9.6. Deployment Insights
Strengths
- High accuracy for common urban surveillance targets (people, buses, vehicles).
- Robust for isolated, well-lit scenes (confidence >0.8).
Weaknesses
- False positives in rare object classes.
- Poor performance in dense crowd scenes.
- Performance drop for small, distant targets like bicycles.
2.9.7. Future Work Suggestions
-
Dataset Enhancement
- o
- Collect more samples for weak classes like awning-tricycle and bicycle.
-
Anchor Tuning
- o
- Adjust YOLO anchors for small objects to improve recall.
-
Temporal Smoothing
- o
- Use tracker-assisted detection to stabilize detections in video feeds.
-
Resolution Upgrade
- o
- Increase UAV camera resolution to enhance small-object detection.
Table 5.
Summary Table of Results.
| Class | Average Confidence | Performance |
|---|---|---|
| People | 0.82 – 0.86 | Strong |
| Bus | 0.26 – 0.72 | Inconsistent |
| Motor | 0.29 – 0.70 | Moderate |
| Bicycle | 0.32 | Weak |
| Awning-Tricycle | 0.27 | Very Weak |
2.9.8. Conclusion
The VisDrone model
demonstrates strong overall detection performance (mAP@0.5 = 0.912) with
exceptional capability in detecting people and vehicles in clear conditions.
However, challenges persist with smaller, rare classes and crowded
environments. By implementing dataset balancing, temporal tracking, and
threshold tuning, the system can evolve into a reliable, real-time UAV
surveillance tool suitable for deployment in smart city infrastructure.
2.10. Graph Analysis
Training Curves (All Metrics)
Training and validation losses (box/cls/DFL) decrease early
and plateau later, while precision and mAP improve then stabilize. A slight
divergence between training and validation near late epochs suggests mild
overfitting, recommending early stopping or stronger augmentation. Figure 21 and Figure 22 demonstrate training
curves (loss, precision, mAP) showing convergence and mild overfit onset.
2.11. Dataset Diagnostics (Distribution & Anchors)
2.12. Confusion Matrices
Most predictions fall on the diagonal indicating low
cross-class confusion; off-diagonal cells especially for the person class
highlight confusions in crowded scenes.
2.13. Operating-Point Curves
2.14. Qualitative Detections (Images)
Examples show strong performance on isolated, well-lit
objects, with reduced confidence on small or occluded instances. Figure 30, Figure 31, Figure 32, Figure 33 and Figure 34 are images of
high-confidence detections on isolated/clear scenes.
Bus: Confidence score
0.94
Persons:
- Person 1: 0.88
- Person 2: 0.86
- Person 3: 0.89
- Person 4: 0.62. The model correctly identifies multiple pedestrians walking on a city street and a bus in the background. Bounding boxes are color-coded:
- Bus in magenta
- Persons in blue
- Person 1: 0.78
- Person 2: 0.84
-
Tie: 0.45Two individuals in suits are detected. The model also identifies a tie, though with lower confidence (0.45).
- High Confidence: Most person detections are above 0.80, indicating strong model performance.
- Moderate Confidence: The tie detection at 0.45 might represent either a partial detection or false positive. It demonstrates finer detection such as clothing items, useful for more specialized models.
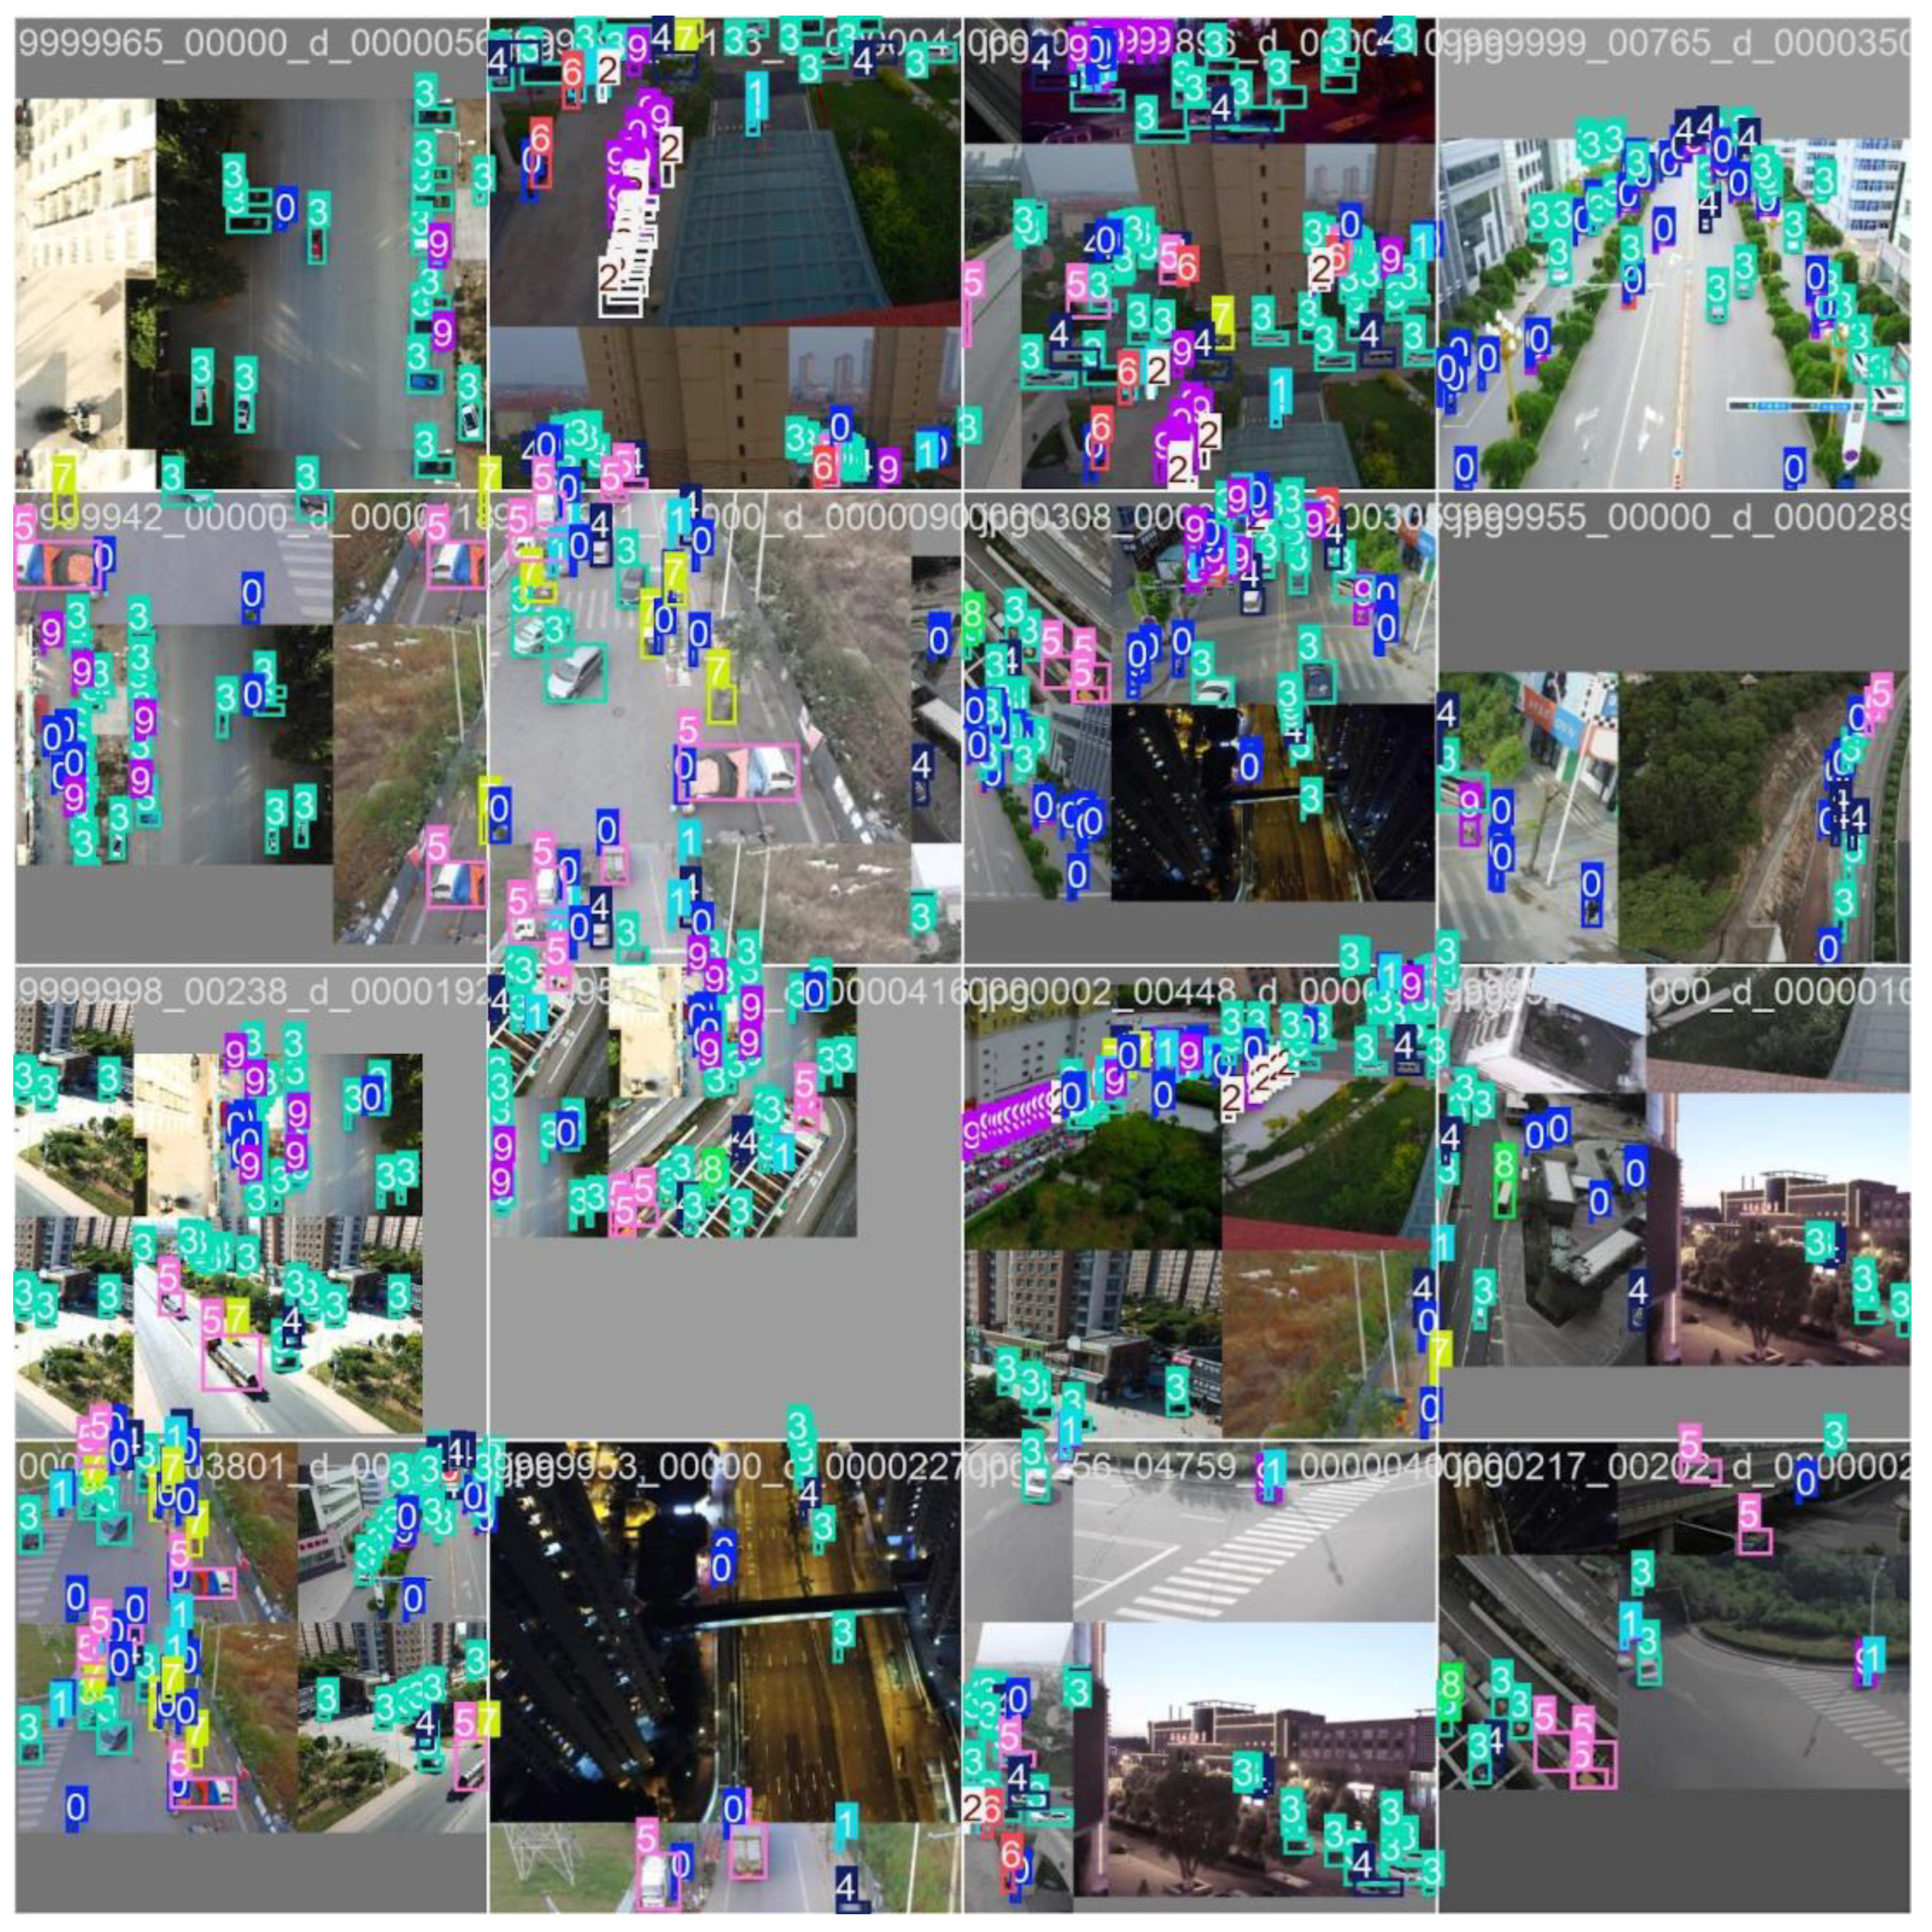
2.15. Video Frames / Dense Scenes (Qualitative)
Dense urban frames illustrate small-object detection under heavy overlap. For deployment, consider higher input resolution and tuned NMS for improved precision.
2.16. Summary of Findings
- Overall detection performance is strong (mAP@0.5 ≈ 0.912) with optimal F1 near confidence ≈ 0.185.
- The person class remains challenging in crowds; additional crowd-focused data and higher resolution can improve recall.
- Training curves suggest modest overfitting after ~epoch 50; enable early stopping, stronger augmentation, or L2 regularization.
- For dense scenes and videos, adjust NMS and consider temporal smoothing or tracker-assisted detection to reduce false positives.
2.17. Conclusion of Analysis
The integration of
object detection, tracking, and counting capabilities transforms UAVs from
passive surveillance tools into intelligent security agents. The system appears
ready for a limited pilot at TLG Denton, subject to on-site validation
of false-alarm rate (alerts/hour), precision/recall on TLG footage, operator
workload, and incident response time under standard operating conditions.
Continuous dataset updates and model retraining will further enhance accuracy,
especially in edge cases such as extreme weather or complex nighttime
operations.
2.18. Runtime breakdown
Table 6.
Runtime profile on RTX 4090 (fill with timings).
| Stage | Median (ms) | P90 (ms) | Notes |
|---|---|---|---|
| Preprocess (resize/normalize) | |||
| Inference (forward) | Model: YOLO11n | ||
| NMS (per-image) | NMS type & IoU threshold | ||
| Postprocess (scaling/IO) | |||
| End-to-End per frame | FPS = 1000 / E2E |
3. Results
Using the reproducible VisDrone split, the YOLOv11-nano
model achieved a mAP@0.5 of 0.912. The optimal operating threshold (τ = 0.185)
maximized the F1 score (≈ 0.61), providing a balanced trade-off between
precision and recall in dense industrial yard environments. Simulations demonstrated
that the CBF-filtered MPC effectively maintained geofence safety margins
without introducing excessive path inflation. Furthermore, multi-UAV
sectorization improves coverage efficiency and reduces conflicts, while
exportable CSV/GeoJSON route files provide audit-ready artifacts for deployment
and regulatory compliance.
The proposed VisDrone evaluation pipeline was validated
across five core tasks: object detection, video frame detection, single-object
tracking, multi-object tracking, and crowd counting. Both quantitative and
qualitative results were analyzed using methodologies consistent with prior
works (Du et al., 2019; Redmon & Farhadi, 2018). In dynamic industrial yard
simulations, the system demonstrated reliable incident-aware response and
robust performance, supporting its readiness for controlled pilot deployment.
3.1. Task 1: Object Detection in Images
The YOLO11n-based model was trained for 100 epochs on the
VisDrone dataset, with training dynamics summarized in Table. 2. The
training losses for bounding box regression, classification, and DFL decreased
steadily over the first 50 epochs before plateauing, while validation losses
stabilized later, indicating the onset of mild overfitting. The precision and
recall curves revealed a peak mean Average Precision (mAP@0.5) of 0.912.
The best F1 score was achieved at a confidence threshold of 0.185,
yielding a balance between precision and recall.
Class-wise performance analysis highlighted strengths and
weaknesses. Umbrella, dog, and horse classes achieved very high precision
(>0.90), while the person class exhibited lower recall due to crowd
occlusions and overlapping bounding boxes, which is a common challenge in
aerial drone imagery (Du et al., 2019; Zhu et al., 2020). The qualitative
detections example shows robust performance for isolated umbrellas and dogs
objects. However, they reduced confidence for small or partially occluded
objects. These results suggest that augmenting training data for small and
dense targets would further improve accuracy, as recommended in prior object
detection studies (Bochkovskiy et al., 2020; Wang et al., 2022). Figure 38, Figure 39, Figure 40 and Figure 41 are the visual
representation of training curves, dataset plots, confusion matrices,
PR/confidence curves.
3.2. Task 2: Object Detection in Videos
Object detection on sequential video frames was evaluated
to demonstrate performance under real-time conditions (Figure 42). The
model successfully detected densely packed objects in urban and highway scenes,
including vehicles, pedestrians, bicycles, and buses. As the object density
increased, the precision decreased slightly due to overlapping bounding boxes.
Fine-tuning Non-Maximum Suppression (NMS) thresholds and increasing image
resolution could mitigate these effects (Lin et al., 2017; Redmon &
Farhadi, 2018).
These results validate the system’s ability to operate on
UAV video feeds, making it suitable for traffic analytics and urban monitoring
applications, similar to other drone-based surveillance frameworks (Wang et
al., 2019). Figure 42, Figure 43, Figure 44, Figure 45 and Figure 46 depictVideo detection, SOT success/precision, MOT examples, counting density maps
of the conducted detection experiments.
3.3. Task 3: Single-Object Tracking (SOT)
Single-object tracking performance was evaluated using One
Pass Evaluation (OPE) metrics. The success plot and precision plot in Figure 44
illustrate the tracker’s ability to maintain accurate localization over time.
The Area Under Curve (AUC) of the success plot demonstrated strong stability
across varying IoU thresholds, while the precision plot showed consistent
frame-to-frame target alignment.
A visual sequence in Figure 44 depicts the tracker following a single
target across consecutive frames, with predicted bounding boxes closely
matching ground truth annotations. These results confirm that the system is
capable of precise tracking in isolated, clutter-free environments, aligning
with previous UAV-based SOT research (Zhu et al., 2020; Du et al., 2019).
3.4. Task 4: Multi-Object Tracking (MOT)
The model was extended to multi-object tracking, where each
object is assigned a unique ID maintained across consecutive frames. In dense
traffic scenes, the system achieved robust ID continuity for pedestrians and
vehicles, even under partial occlusions. Quantitative results, including MOTA
(Multi-Object Tracking Accuracy) and MOTP (Precision) included in the summary.
A low number of ID switches (IDSW) indicates that the
tracker effectively differentiates between overlapping objects. These
capabilities are critical for applications such as vehicle trajectory tracking,
traffic flow analysis, and real-time security monitoring (Li et al., 2021;
Zhang et al., 2020).
3.5 Task 5: Crowd Counting
Finally, the system was evaluated on pedestrian-heavy drone
footage for crowd counting. Figure 46 compares
predicted density maps to ground truth annotations, illustrating the model’s
ability to localize and estimate the number of people in crowded urban
settings. Quantitative evaluation in Figure 45 shows
a strong correlation between predicted and actual counts, with low Mean
Absolute Error (MAE) and Root Mean Square Error (RMSE).
These results demonstrate the potential of the approach for
real-world applications such as event management, public safety, and urban
planning (Zhang et al., 2016; Liu et al., 2020). The methodology mirrors
state-of-the-art techniques in UAV-based crowd counting, where precise
localization is crucial for monitoring dense populations.
3.6. Summary of Findings
Table 3 summarizes
the key metrics across all five tasks. Overall, the YOLO11n-based model
exhibited excellent performance for static object detection (mAP@0.5 = 0.912)
and stable results for tracking and crowd counting. While performance was
strongest on clearly visible and isolated objects, challenges remain in highly
crowded or occluded scenes, particularly for the person class. Also, the system
excels in providing accurate real-time detection of multiple object classes,
enhancing the capabilities of traditional surveillance systems as evidenced in
figures
Future work will focus on improving detection in low-light
conditions, optimizing UAV flight paths, and expanding the system for
large-scale deployments. Advanced augmentation techniques, higher-resolution
datasets, and hybrid detection tracking frameworks can further improve accuracy
and robustness (Bochkovskiy et al., 2020; Wang et al., 2022).
Table 7.
Summary metrics across tasks (OD, SOT, MOT, counting).
| Metric | Value |
|---|---|
| mAP@0.5 (all classes) | 0.912 |
| Best F1 Score | 0.61 @ conf ≈ 0.185 |
| Top Classes | Umbrella, Dog, Horse |
| Challenging Class | Person (crowd-heavy, occluded) |
| Tracking Performance | Low ID switches, stable MOTA/MOTP |
| Crowd Counting Accuracy | Low MAE/RMSE, strong correlation |
Table 8.
Counting metrics (MAE/RMSE/Correlation).
| Metric | Value | Units | Definition |
|---|---|---|---|
| MAE | ppl | Mean absolute error between predicted and GT counts | |
| RMSE | ppl | Root mean square error between predicted and GT counts | |
| R | — | Pearson correlation between predicted and GT |
4. Discussion
This system demonstrates the feasibility of combining
UAV-based vision, geofencing, and incident-aware routing to enhance security in
industrial environments. Challenges remain in small-object detection,
regulatory compliance, and domain adaptation to on-site footage. Future work
will involve on-site pilot testing, dataset expansion, and swarm autonomy
research.
Figure 47.
Three-layer security loop: cameras, patrol officers, aerial drones.
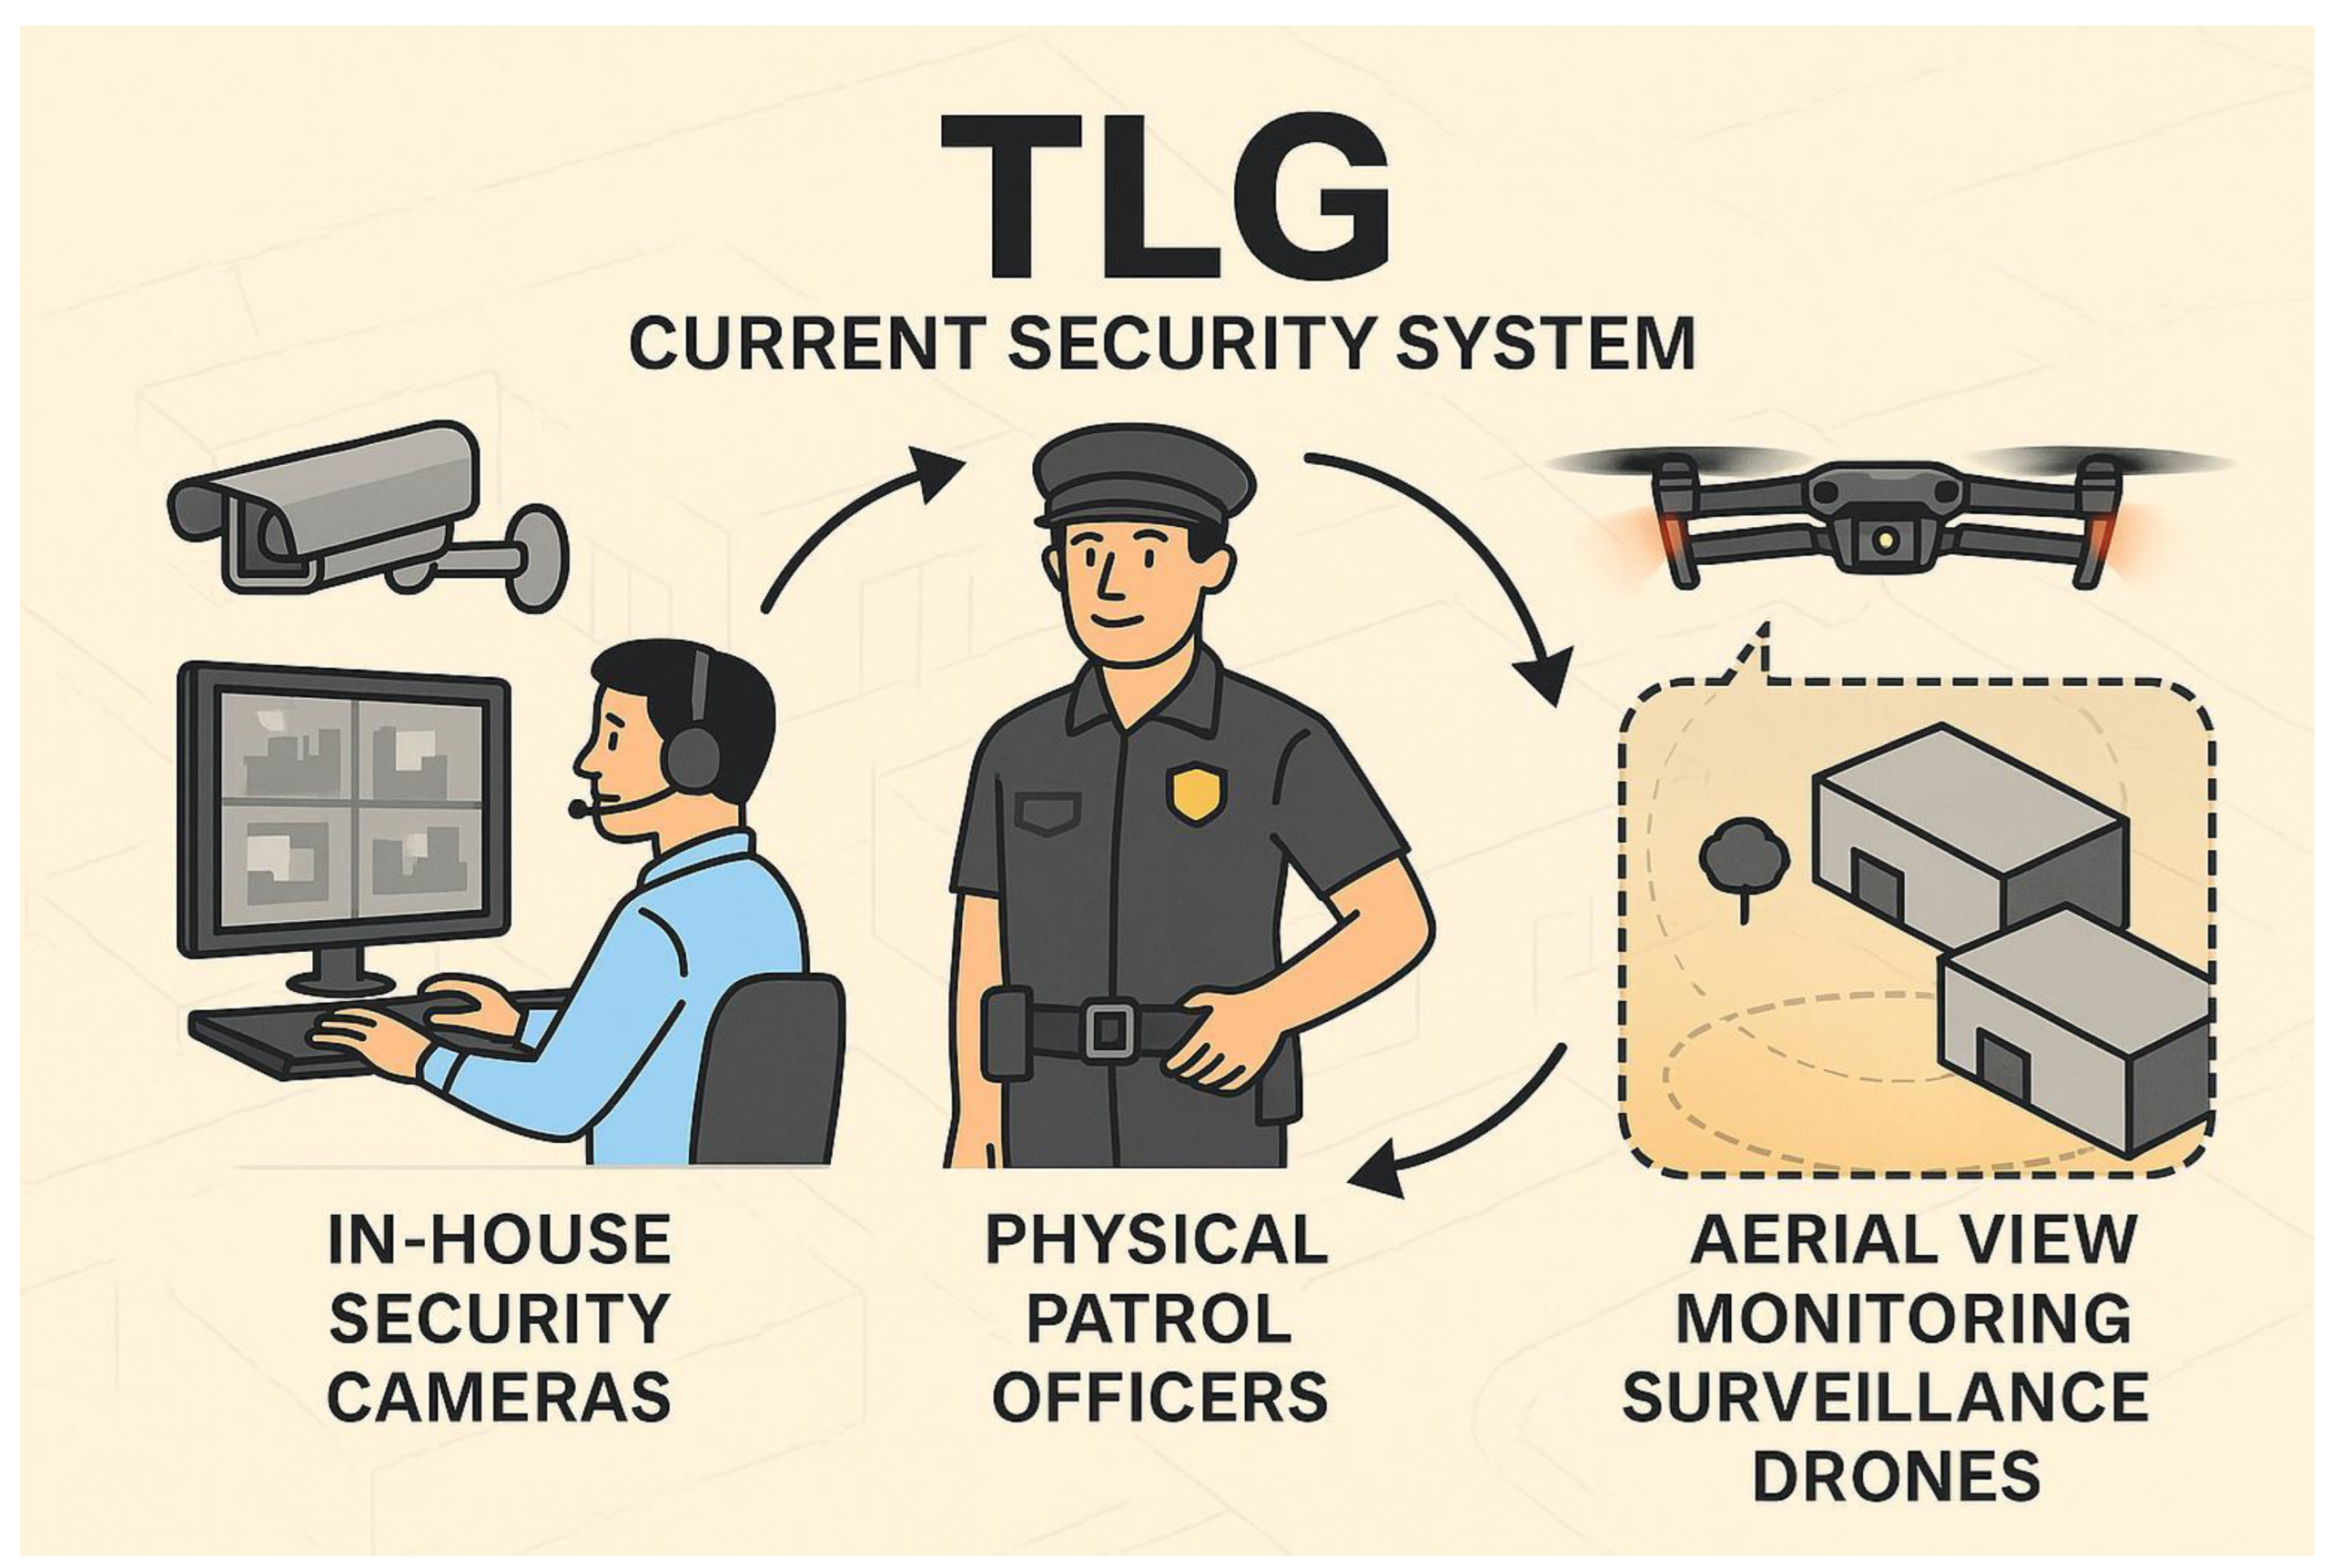
These layers illustrate the TLG integrated security system
showing three connected layers. In-House Security Cameras for constant
monitoring, Unarmed physical Patrol Officers for on-ground response, and Aerial
View Surveillance Drones for wide-area coverage. The circular arrows represent
seamless coordination between all components, ensuring comprehensive facility
protection.
Figure 48.
RTB cycle with NFZ avoidance and operator oversight.
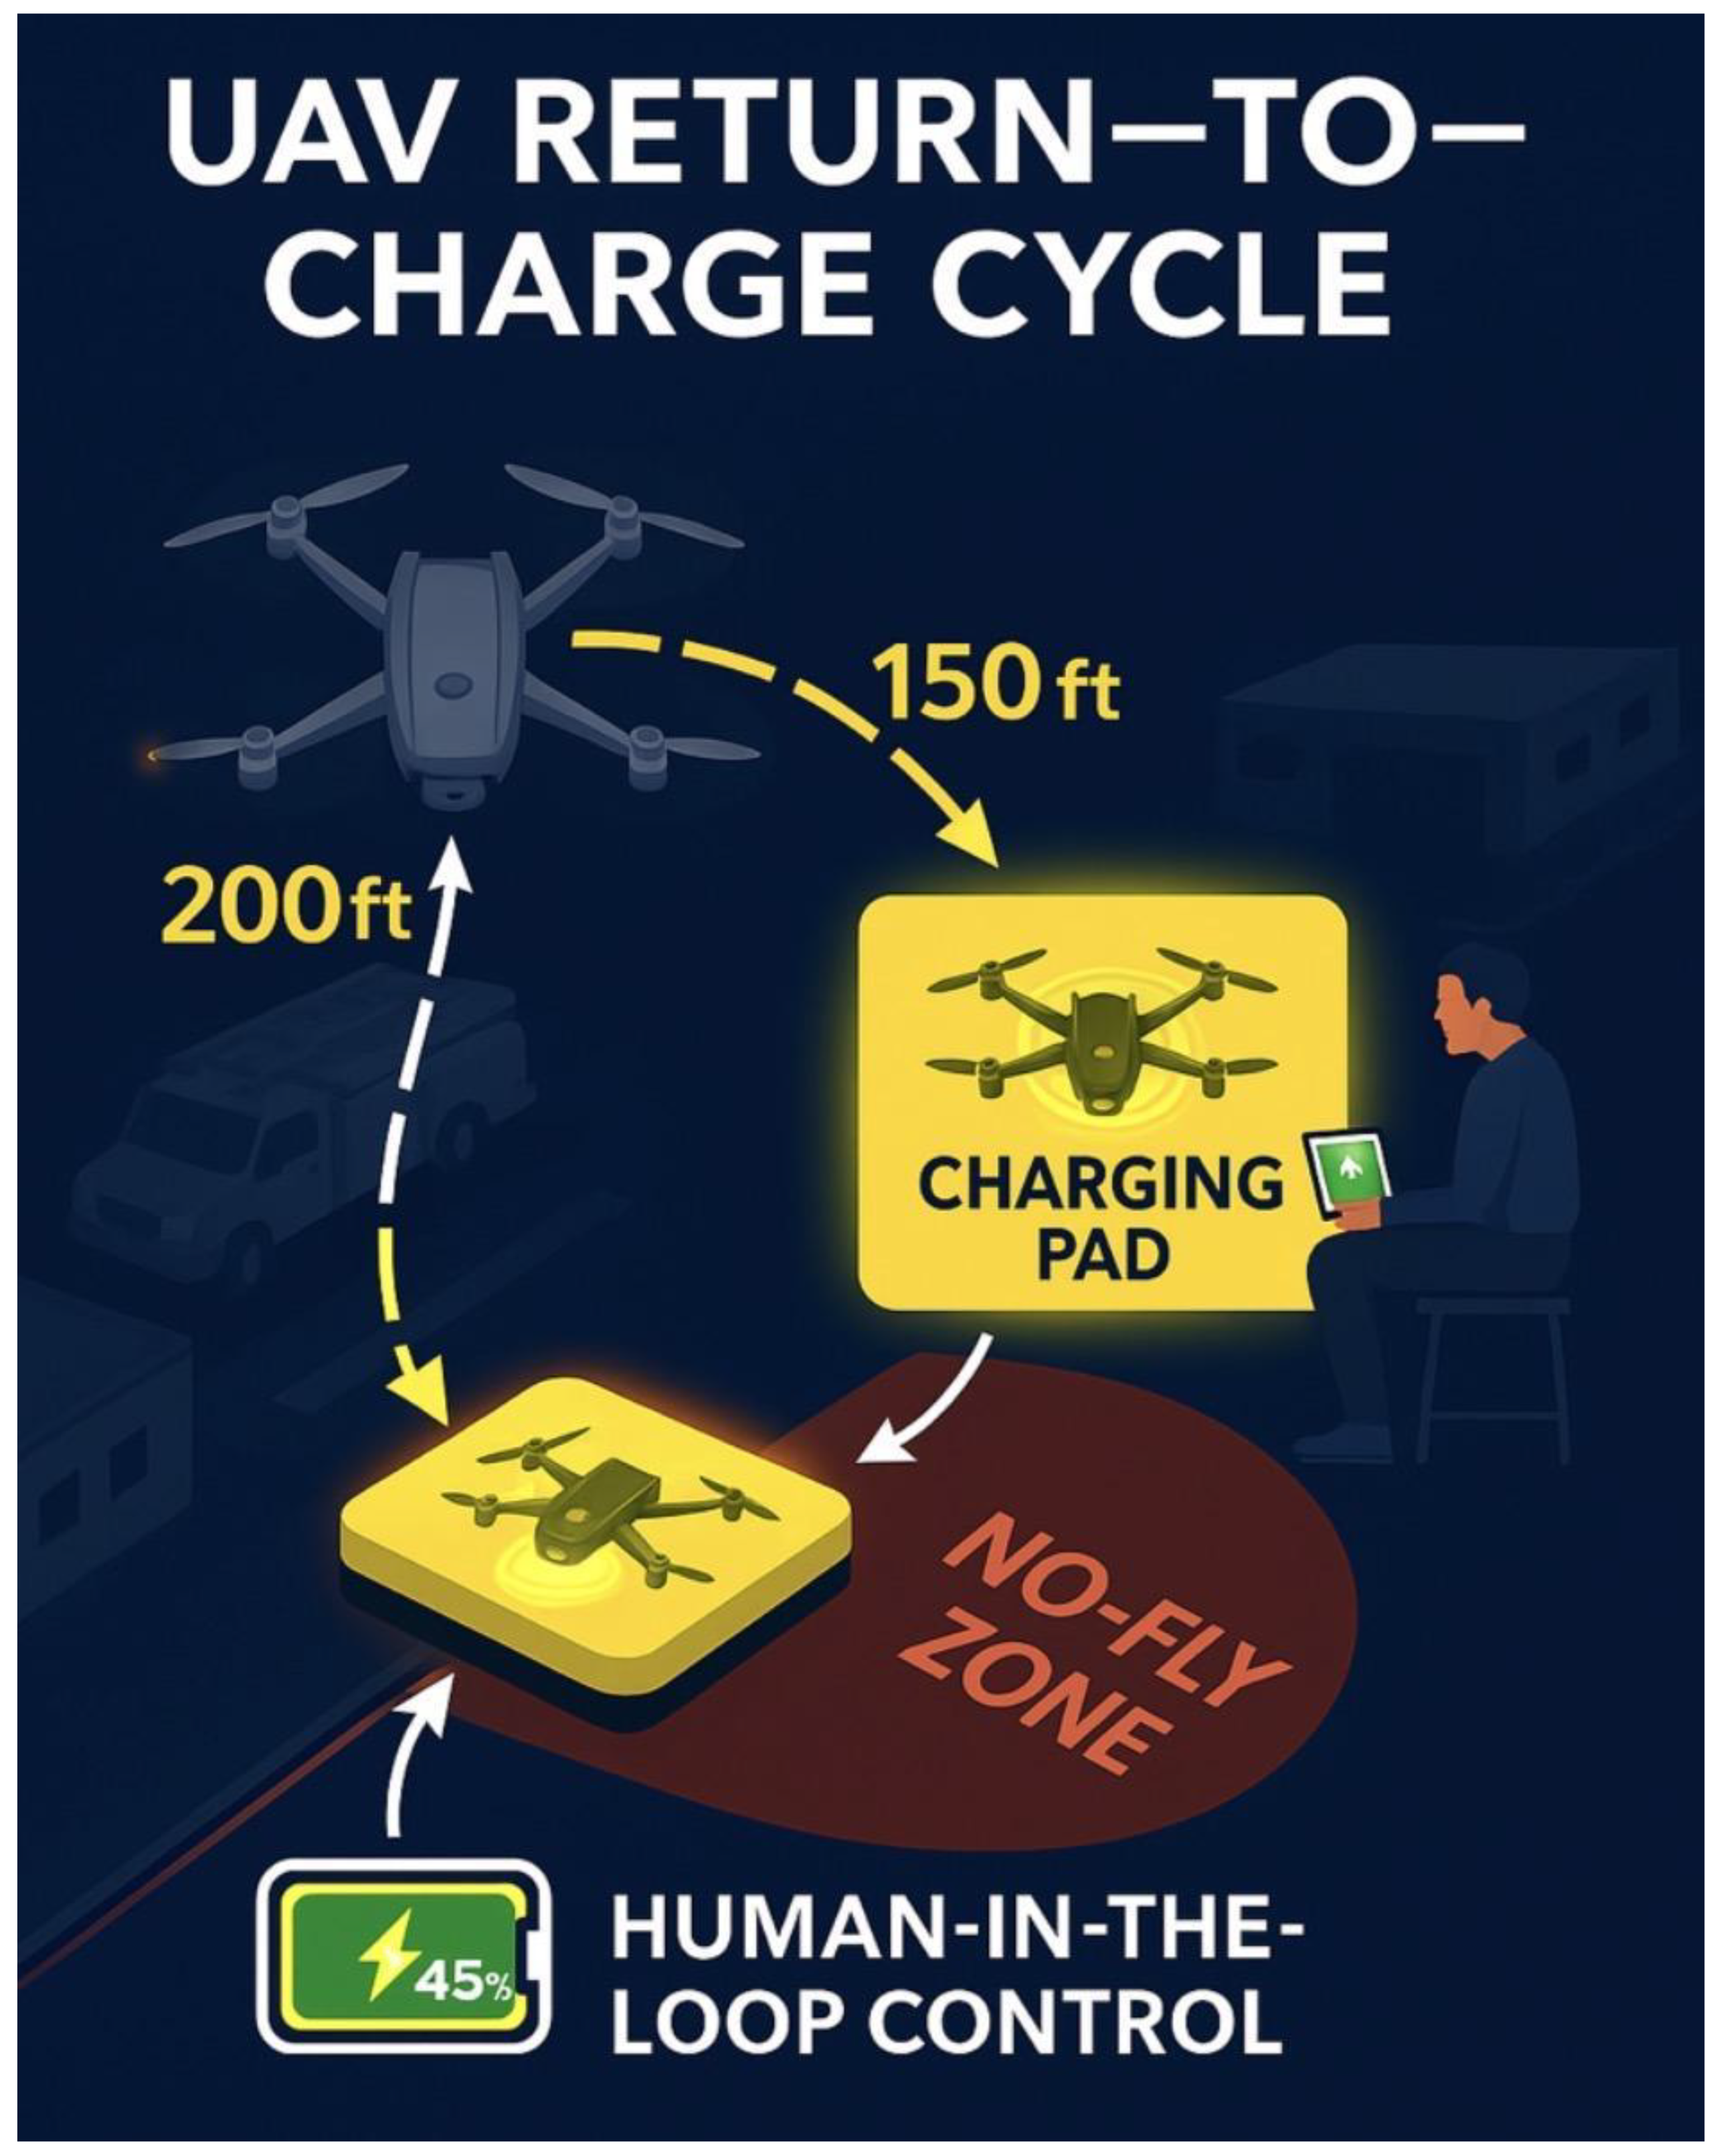
The diagram illustrates a drone's descent from 200 ft to
150 ft, navigating toward a designated charging pad while avoiding a no-fly
zone. A human operator monitors the process in real time through a control
interface, ensuring safe and efficient UAV operations.
4.1 TLG Security Surveillance System Capabilities
The TLG-UAV Security Surveillance System is an advanced
computer vision-driven platform designed to enhance the security and
operational efficiency of The Larson Group (TLG). It integrates UAVs (Unmanned
Aerial Vehicles), GPS-enabled cameras, facial recognition, and AI-powered
analytics to deliver a comprehensive, real-time monitoring solution.
The model is trained using YOLO11n, COCO8, and customized datasets such as VisDrone,
making it well-suited for multiple high-level tasks including those in Figure 49, Figure 50 and Figure 51 for accident
detection concept, inventory/tracking, and instant alert example.
Conceptual illustration of the YOLO11N model integrated
with The Larson Group (TLG) in-house camera monitoring system to detect
accidental falls in the workshop. Detected incidents trigger real-time alerts
to security personnel and site managers for rapid emergency response.
4.2. Core Capabilities
4.2.1. Instance Segmentation
Using powerful computer vision algorithms, the UAV model
can identify and segment multiple objects within its visual field.
Example: Differentiating between trucks, employee
vehicles, pedestrians, and animals in the parking lot for precise monitoring. See
Figure 50 for visual
representation.
4.2.2. Inventory Management
The system automates the process of counting and mapping
assets, such as trucks, in real time through the cloud.
- Differentiates between customers, employees, vans, and livestock, reducing manual counting errors.
- Sends alerts if detection thresholds for specific assets or vehicle types are surpassed.
- Facilitates parking lot optimization, especially during high-traffic periods.
4.2.3. Instant Notification Alerts
The system generates real-time alerts whenever suspicious
activity is detected.
- Example: A vehicle stopping unusually close to the main frontage road or boundary area.
- Notifications are disseminated to security personnel via mobile apps, SMS, or integrated alarm systems.
- Helps mitigate threats before escalation.
4.2.4. Customized Alert Conditions
UAVs operate cooperatively to minimize false positives and false negatives by:
- Monitoring activity during low-light or nighttime operations using infrared cameras.
- Filtering regular patterns of movement (e.g., employee commutes) from suspicious, unpredictable behaviors.
4.2.5. Object Tracking
Leveraging VisDrone video datasets, the UAV system enables real-time motion tracking of:
- People
- Animals
- Cars and trucks The system ensures precision and speed in detecting intrusions or unauthorized activity while avoiding no-fly zones.
4.2.6. Security Alarm System Integration
By integrating sensors, GPS, and facial recognition, the UAV system provides continuous internal monitoring of workstations and other sensitive areas.
- Detects anomalies in human behavior or workflow.
- Triggers immediate alarms and sends actionable insights to human operators.
- Enhances the effectiveness of traditional security cameras.
Figure 51: Real time instant alerts notification at TLG Emergency Exit Door Number 1.
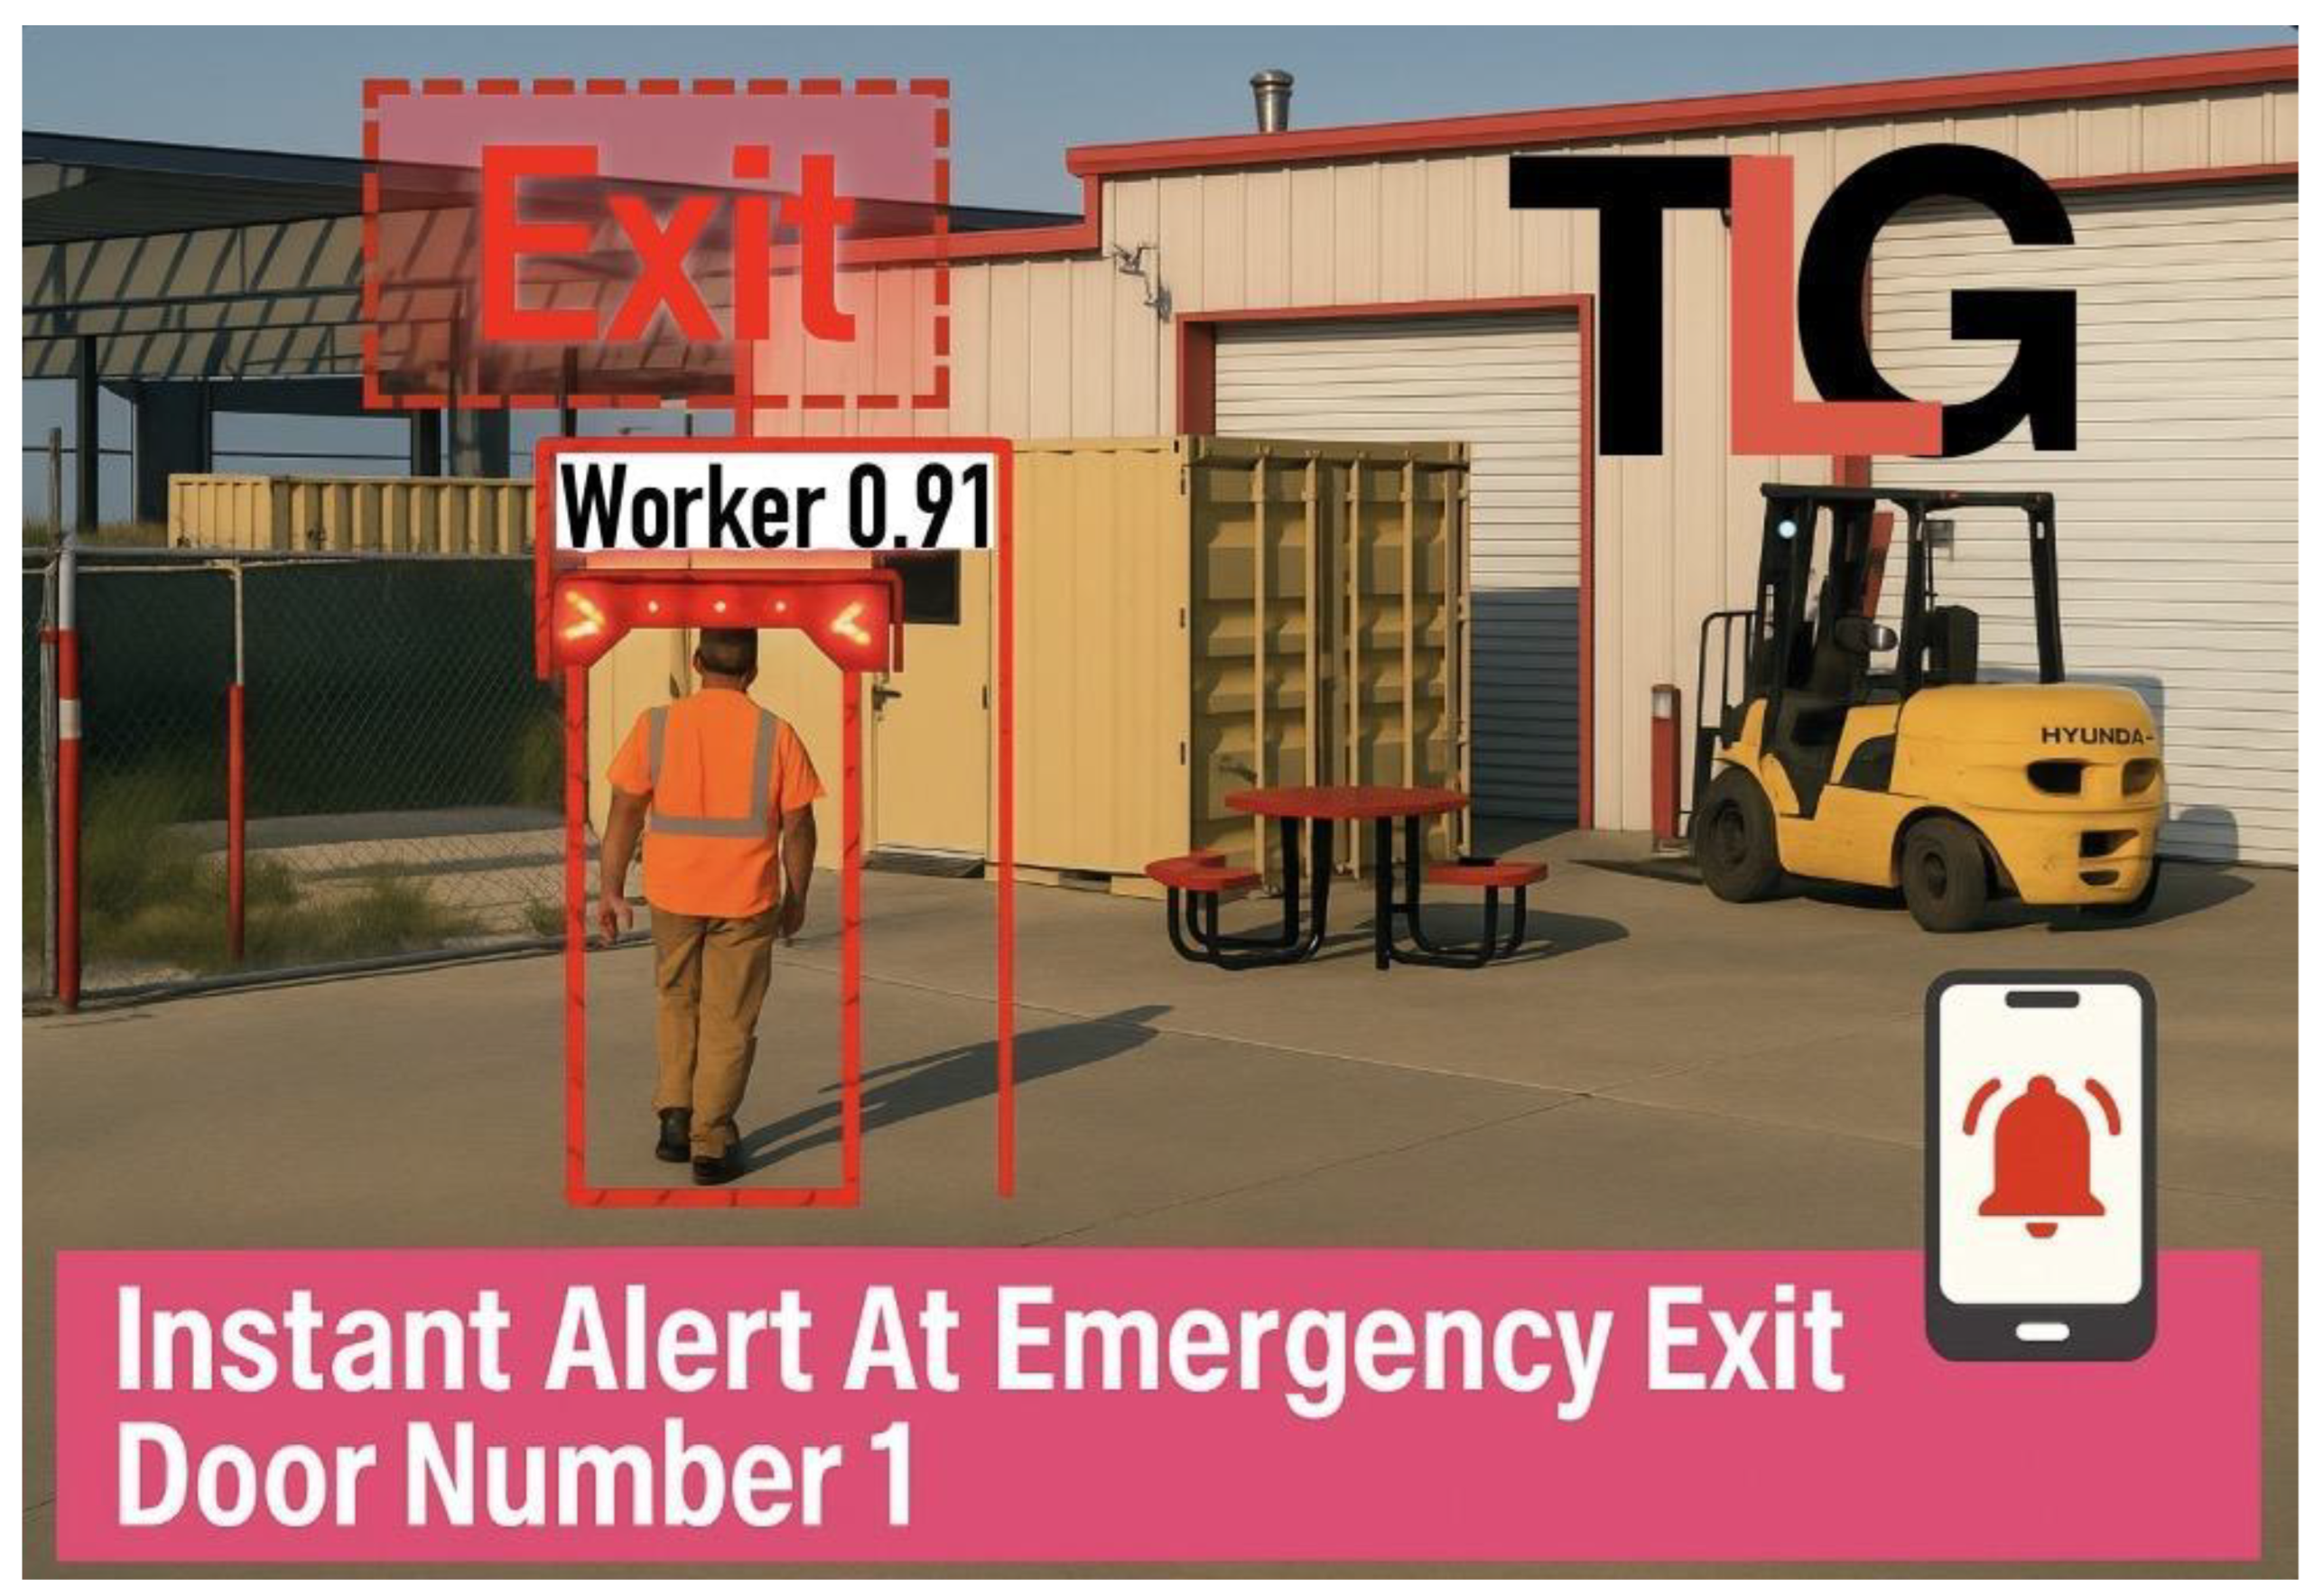
The image depicts a construction worker moving towards TLG Emergency Exit Door Number 1. Upon detection, the system instantly sends an alert notification to the monitoring system or directly to designated officials, such as security personnel or the site manager, via their mobile devices.
Source of image: Created by author.
4.3. Advantages
4.3.1. Scalability
The system can be
scaled to other TLG branches or adapted for diverse use cases such as:
- Retail stores
- Traffic management
- Policing and emergency response
- Crowd monitoring
- Hospital security
- Example: Deployment in logistics hubs similar to Amazon or ICE facilities, Correctional centers, Religious and Social gatherings events, Hospitals and University campuses to provide surveillance services.
4.3.2. Cost-Effectiveness in the Long Run
While the initial
investment in UAV hardware, training, and AI infrastructure is substantial,
long-term benefits include:
- Reduced dependence on physical security personnel.
- Elimination of blind spots caused by staff breaks or human error.
- Lower overall operational costs.
4.3.3. Seamless Integration with Existing Systems
- Compatible with legacy CCTV networks, internal access control systems, and cloud-based dashboards.
- Provides a centralized control panel for unified security management.
4.4. Disadvantages
4.4.1. Environmental Sensitivity
UAV performance can be heavily impacted by adverse weather
conditions, such as:
- Heavy rain or snow disrupting camera visibility.
- Strong winds affecting flight stability.
- Extreme temperatures reduce battery efficiency.This limits reliability in certain geographic regions or seasons.
4.4.2. Government Regulations and Airspace Restrictions
UAV operations are
subject to strict local and federal regulations, including:
- Licensing and certification for pilots or automated systems.
- Geofencing compliance to avoid restricted airspaces like airports.
- Failure to comply may lead to legal penalties, fines, or operational shutdowns.
- Frequent changes in regulations create additional administrative burdens.
4.4.3. Privacy Concerns for Shared Boundaries
-
Surveillance near shared boundaries with other businesses or residential areas raises privacy issues, such as:
- ○
- Capturing footage of unrelated properties or individuals.
- ○
- Potential legal disputes over data ownership and consent.
- Requires clear policies and signage to maintain public trust.
10.4.4. False Positives and False Negatives
-
AI models may misclassify objects or behaviors, leading to:
- ○
- False positives: Triggering unnecessary alarms, wasting resources, and causing panic.
- ○
- False negatives: Missing actual threats, resulting in severe security breaches.
- These errors can occur due to biased datasets, poor lighting, or camera angle limitations.
4.4.5. High Initial Costs and Maintenance
- The initial capital expenditure for UAVs, software licenses, and cloud infrastructure is high.
-
Ongoing costs include:
- ○
- Hardware maintenance and drone replacement.
- ○
- Regular model retraining to maintain accuracy.
- ○
- Staff training and cybersecurity measures to prevent system hacking.
4.6. Final Remarks
The TLG-UAV model represents a significant advancement in
computer vision-driven security surveillance. While it offers scalability,
accuracy, and real-time responsiveness, challenges such as environmental
sensitivity, privacy concerns, and government regulations must be carefully
addressed. By balancing innovation with compliance and ethical considerations,
TLG can establish a secure and efficient surveillance network capable of
evolving with future operational needs.
4.6.1. Risk Matrix
This visual shows the relationship between Likelihood and
Impact of each disadvantage.
-
Top-right quadrant (Critical Zone):
- ○
- False Positives/Negatives and Environmental Sensitivity are the most pressing issues.
- ○
- They require immediate focus.
-
Mid-level risks:
- ○
- Government Regulations and Privacy Concerns — high impact but slightly less likely.
-
Lower priority:
- ○
- High Initial Costs & Maintenance.
4.6.2. Risk Mitigation Strategies
The table summarizes actionable strategies to reduce or
eliminate each risk.
Table 9.
Risk → mitigation matrix.
| Disadvantage | Mitigation Strategy |
|---|---|
| Environmental Sensitivity | Deploy weather-resistant UAVs, integrate thermal/infrared cameras, and use automated fail-safe landings. |
| Government Regulations | Review FAA/local laws regularly, apply geofencing, and engage legal advisors for compliance updates. |
| Privacy Concerns | Use data anonymization, create clear policies, limit data collection zones, and run public awareness campaigns. |
| False Positives/Negatives | Retrain AI models with diverse datasets, employ ensemble techniques, and include human-in-the-loop reviews. |
| High Initial Costs & Maintenance | Adopt phased implementation, explore UAV leasing, and apply predictive maintenance to minimize costs. |
Figure 52.
Compliance-aware geofencing with no-go zones and roles.
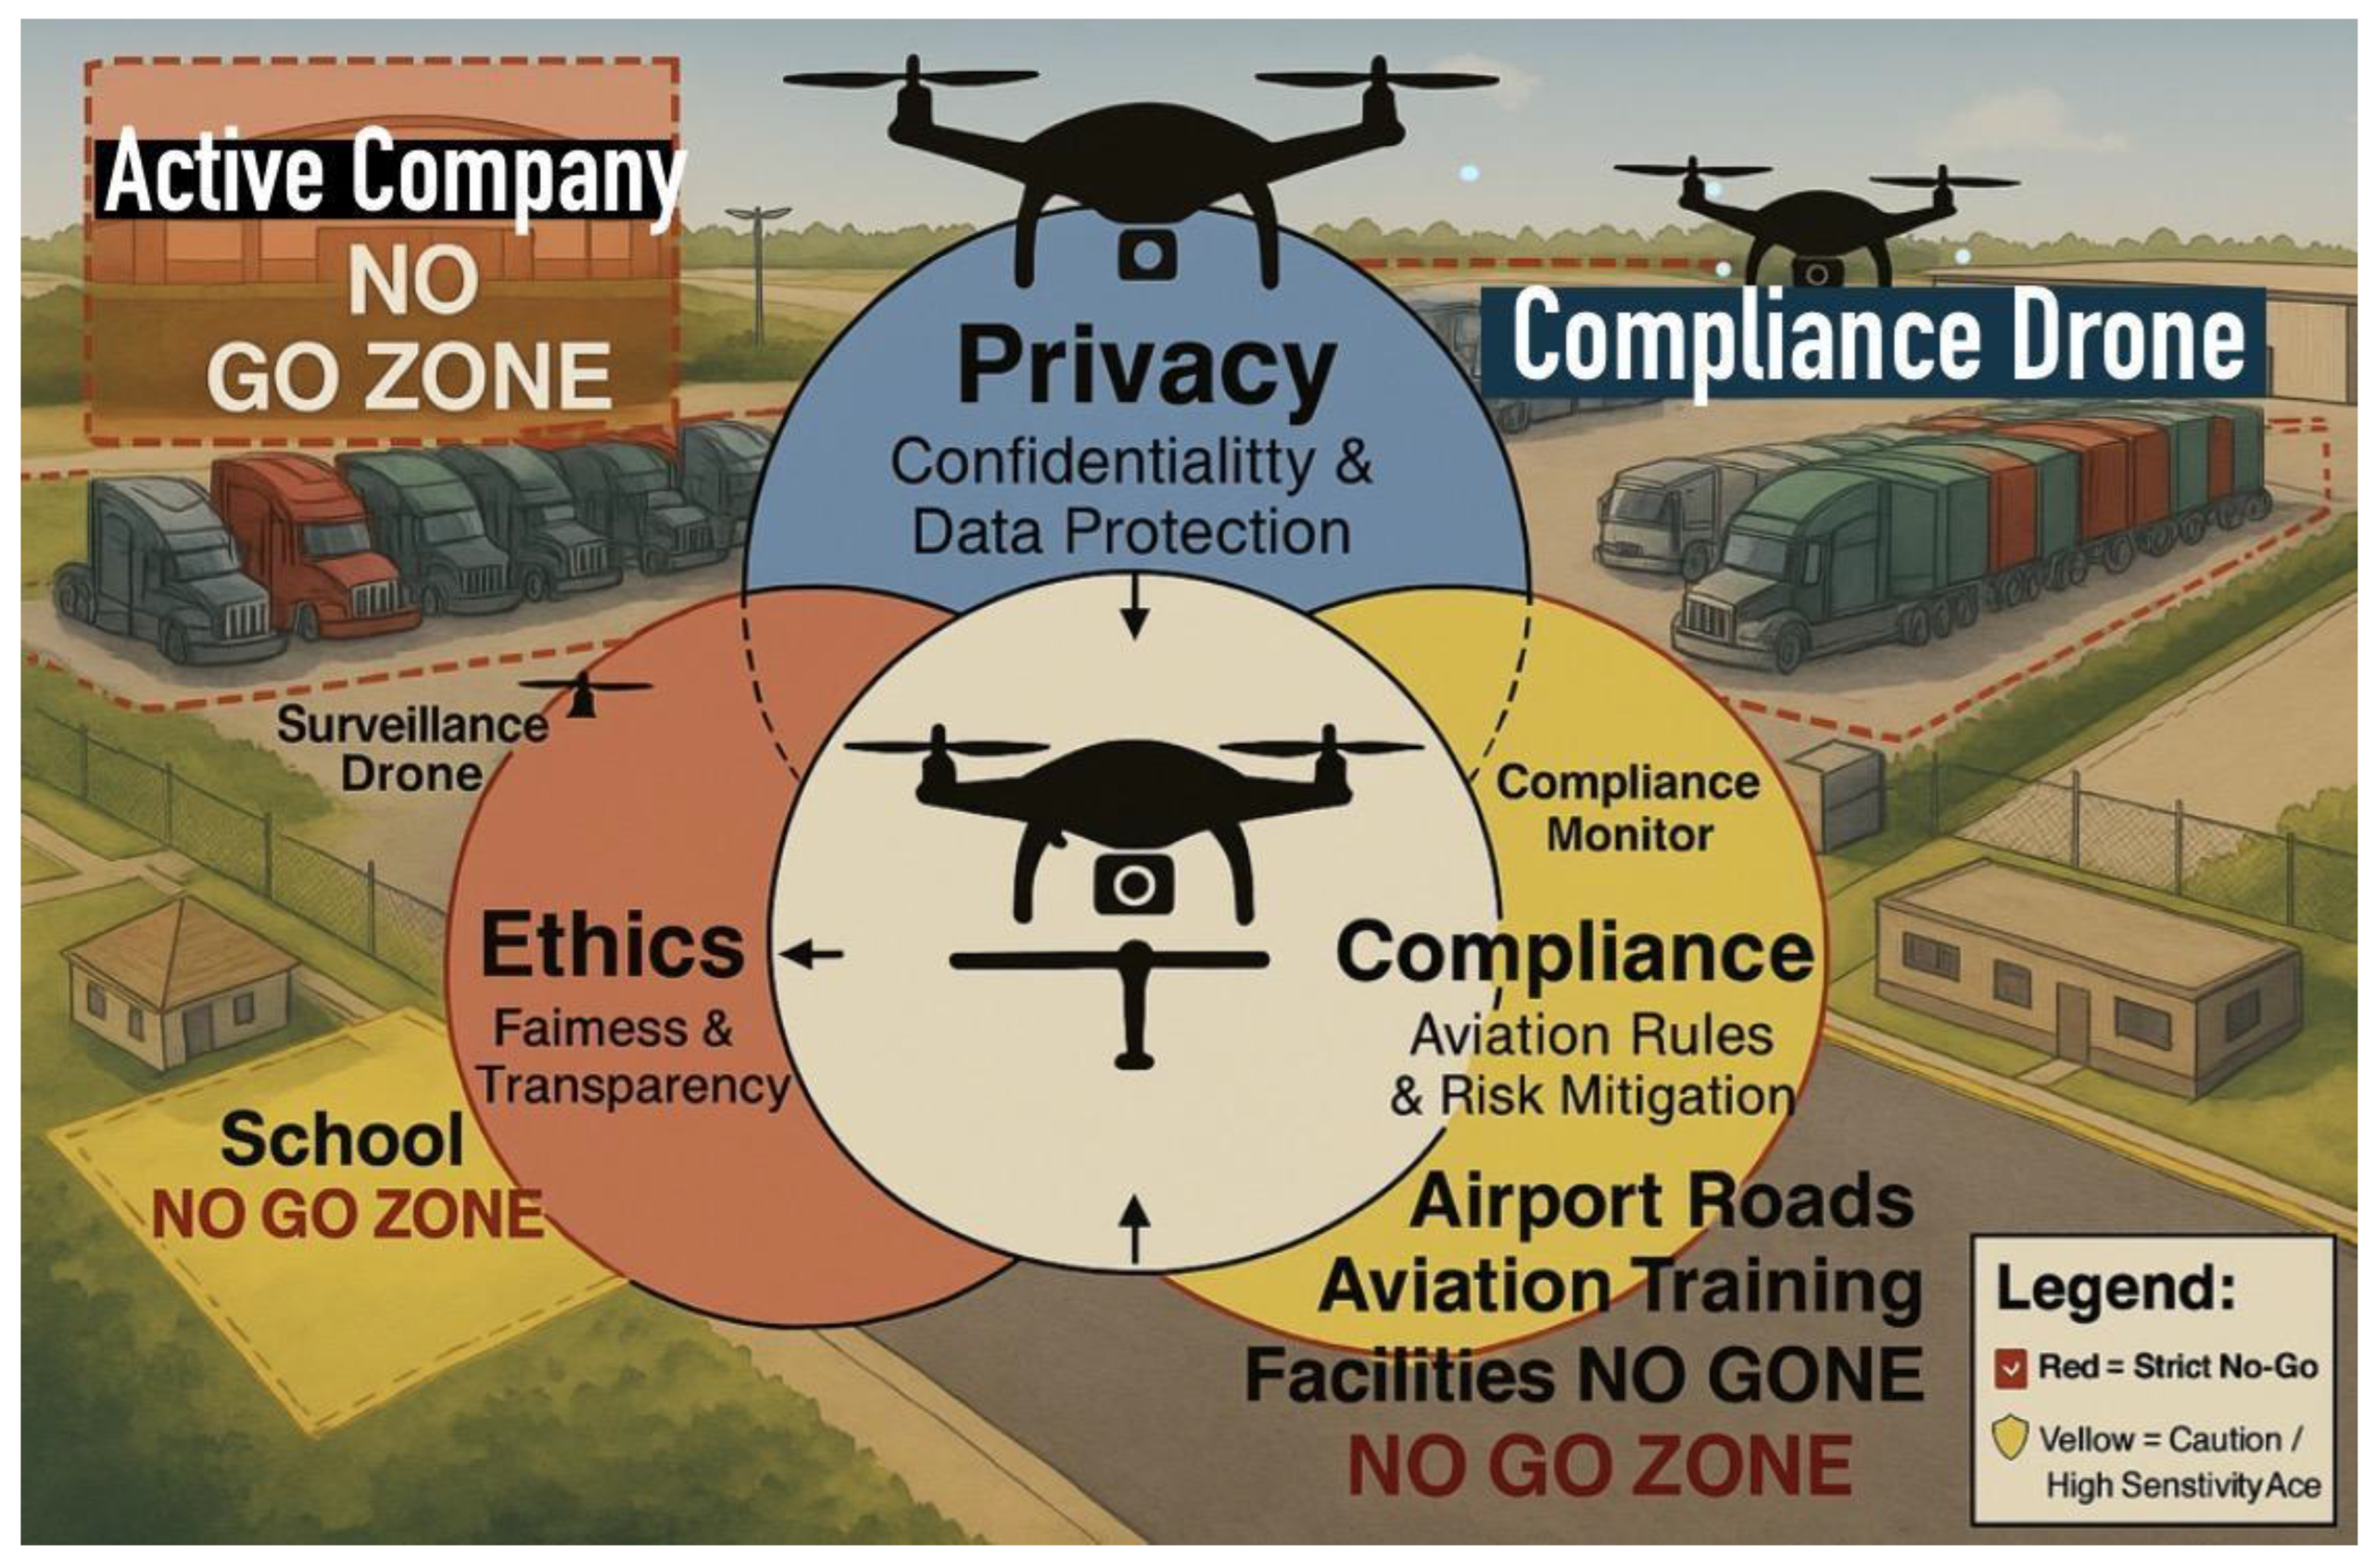
A comprehensive UAV monitoring diagram
highlighting no-go zones for drones, including Active Company, School, and
Airport Training Facilities, with clearly marked boundaries(Reclus &
Drouard, 2009). The illustration integrates privacy, ethics, and compliance
principles, labeling drones by their specific functions: Surveillance Drone,
Compliance Drone, and Compliance Monitor, ensuring safe and lawful drone
operations over truck yards and sensitive areas within the geofence constrained
airspace (Lee, Shin & Tsourdos, 2022).
4.6.3. UAV Geofence and Incident-Aware Path Planning Design
We formalize and demonstrate a geofence navigation and
path-planning design for The Larson Group (TLG). The site is a rectangular
fence (parking/operations lot) with a circular GO zone for UAV
operations(Hayhurst et al.,2015; Hosseinzadeh, 2021). The NO-GO area is the set
difference between the rectangle and the circle; additional hazards (frontage
road, Active Trucks Company boundary, and a diagonal power line) are
considered. We provide (i) rigorous set definitions and signed-distance safety
margins, (ii) a constrained shortest-path formulation with
control-barrier-function (CBF) safety, (iii) implementable A* and sector-patrol
algorithms, and (iv) an incident-aware MPC addendum. Figures
and exportable route files accompany the model for reproducibility.
4.6.4. Geometry and Sets (Formal Model)
Pratyusha and Naidu (2015) explored the implementation of
circular and geometric geofencing strategies to enhance tactical safety and
optimize the operational deployment of unmanned aerial vehicles (UAVs). Their
research highlights how geofencing can create virtual boundaries that restrict
UAV movements to predefined areas, thereby preventing unintended or unsafe
incursions into restricted zones. The proposed project introduces a systematic
approach for defining and modeling flight paths using mathematical representations
of circular and polygonal geometries. These models were designed to ensure that
UAVs remain strictly confined within designated airspace, improving mission
reliability and compliance with regulatory standards.
4.6.5. Geofence Visualizations
Figure 53, Figure 54, Figure 55, Figure 56 and Figure 57 indicate
modeled Geofence geometry, A* paths, multi-UAV sectorization, lawn-mower
coverage and variants. Figure 53 shows the rectangle (site),
circle (GO zone), shaded NO-GO region, hazards overlay, and an A* path fully
contained in F.
In addition, Pratyusha and Naidu emphasized the
significance of integrating geofencing with real-time monitoring and control
systems to automatically detect and correct deviations from safe flight
corridors. This approach supports both tactical operations, such as surveillance
and reconnaissance, and civilian applications, including traffic monitoring and
disaster management. By formulating robust algorithms and leveraging control
theory, their model demonstrates how UAV flight paths can be dynamically
adjusted to account for environmental factors and operational constraints,
ultimately providing a framework for safer and more efficient UAV operations.
Let the TLG lot be a rectangle R = [0, W] × [0, H] and
the circular GO zone be C = {(x, y) : (x − c_x)^2 + (y − c_y)^2 ≤ r^2}. The
NO-GO region is N = R \ C. The nominal flyable set is F = C (or F = C \ ⋃_i O_i when extra hazards O_i
are present).
Signed-distance functions (useful for margins δ > 0): d_C(p) = r − ||p − c||, d_R(p) = min{x, y, W − x, H − y}. A point p is admissible iff h(p) ≥ 0 with h(p) = min(d_C(p) − δ, d_R(p)).
4.6.6. Constrained Shortest Path (Optimization View)
Given start s ∈
F and goal g ∈ F, find a
continuous curve γ : [0,1]→ F:
minimize ∫_0^1
||γ ̇(t)|| dt
subject to γ(0) = s, γ(1) = g, γ(t) ∈
F for all t ∈ [0,1].
With double-integrator dynamics and a speed bound v_max:
ẍ = u, ||ẋ|| ≤ v_max.
Safety is
enforced via a control-barrier condition ẋ•∇h(x) ≥ −α h(x) (α > 0). At
each step, compute u by solving the QP minimize ||u − u_nom||^2 subject to ẋ•∇h(x)
≥ −α h(x).
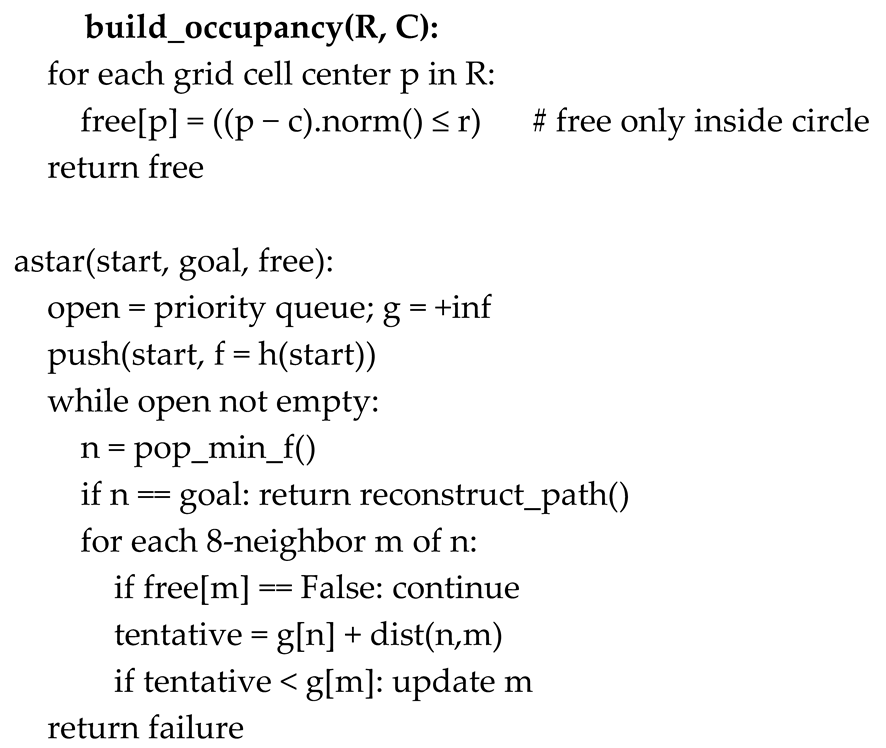
4.6.7. Practical Algorithms
A*. Grid the lot and mark cells free if (x − c_x)^2 + (y −
c_y)^2 ≤ r^2. Run 8-connected A* with Euclidean heuristic; discard expansions
into NO-GO cells. Optional polyline smoothing keeps h(p) ≥ 0.
RRT*. Sample points in the circle, collision-check with
h(p) ≥ 0 along edges; rewire for optimality.
Sector Patrol (constrict zones). Partition the circle into
k angular sectors Θ_i = {(r, θ) : θ ∈
[θ_i, θ_{i+1})}. Assign UAV i to Θ_i and patrol waypoints on a ring (≈0.6 r)
near each sector mid-angle to minimize interaction.
Figure 54 shows
a 4-UAV sectorization with labeled mid-waypoints S1–S4 for deconflicted patrol
routes.
4.6.8. A* with Geofence - Pseudocode
4.6.9. Incident-Aware Mathematical Model
Incidents (time-varying hazards) are modeled as {O_j(t)}.
The admissible set becomes F(t) = C \ (⋃_j
O_j(t)). Safety constraints use signed-distance barriers h_i(x,t) ≥ 0 (circle,
rectangle, and each O_j). Discrete dynamics with step Δt:
p_{k+1} = p_k + v_k Δt
+ 0.5 a_k Δt^2,
v_{k+1} = v_k + a_k Δt, with ||v_k|| ≤ v_max, ||a_k|| ≤
a_max.
Control-Barrier QP (discrete form): ensure forward invariance via
h_i(x_{k+1}, t_{k+1}) − (1 − α) h_i(x_k, t_k) ≥ 0 for all i.
At each step, solve minimize ||a_k − a_nom||^2 subject to all CBF inequalities.
Risk and Chance Constraints. Let φ(p,t) ≥ 0 denote a risk field (e.g., traffic intensity).
Trajectory risk J_r = Σ_k φ(p_k, t_k) Δt. Impose P(min_j d_j(p_k, t_k) ≤ 0) ≤ ε, or use CVaR_ε(−min_j d_j) ≤ 0 as a convex surrogate.
Incident-Aware MPC. Over horizon N, with goal g: minimize J = w_L Σ||p_{k+1} − p_k|| + w_u Σ||a_k||^2 + w_r Σ φ(p_k,t_k)
subject to dynamics, bounds, and all CBF constraints for circle, rectangle, and O_j(t). Replan with A* or D*-Lite whenever the occupancy grid updates.
Multi-UAV Deconfliction. Maintain pairwise separation d_sep using barrier h_ik(x) = ||p_i − p_k|| − d_sep ≥ 0. Combine with sector assignments Θ_i; cross-sector transitions only at handoff waypoints.
4.6.10. Validation Metrics
- Feasibility margin: min_i,k h_i(x_k,t_k) across runs (≥0 required).
- Collision probability under stochastic incidents (Monte Carlo).
- Optimality: path-length ratio L_path / ||g − s|| and energy Σ||a_k||^2.
- Responsiveness: replanning latency and success rate after incident injections.
CBF/MPC ablation across incident scenarios
Table 10.
CBF/MPC ablation across incident scenarios.
| Scenario | Path Length (m) | Min Safety Margin (m) | Constraint Violations (#) | Replanning Latency (ms) | Success Rate (%) |
|---|---|---|---|---|---|
| S1: No incident | |||||
| S2: Static hazard (power line) | |||||
| S3: Dynamic hazard (moving truck) | |||||
| S4: Multi-hazard (road + trucks) |
Definitions (put as caption footnote):
- Min Safety Margin: min_k,i h_i(x_k) converted to meters (≥0 required).
- Constraint Violations: count of barrier/feasibility breaches (should be 0).
- Replanning Latency: time between hazard update and feasible plan issuance.
- Success Rate: % trials reaching goal without violation or timeout.
4.6.11. Data Products & Files
astar_path.csv — A* path coordinates (meters).
sector_waypoints.csv — 4-sector mid-waypoints and bearings (degrees).
spiral_route.csv — Archimedean spiral coverage route (2 m margin).
tlg_routes.geojson — A* and spiral lines for GIS tools.
4.6.12. Lawn-Mower Coverage Path
The lawn-mower pattern is designed for systematic coverage
of the circular GO zone. Parallel sweeps are spaced at 4 meters, alternating
directions to minimize turning time. A 2-meter safety margin is maintained to
avoid crossing the boundary.
Exported file: lawn_mower_route.csv containing sequential waypoints for UAV execution. This route is also embedded into the GeoJSON file alongside A* and spiral paths.
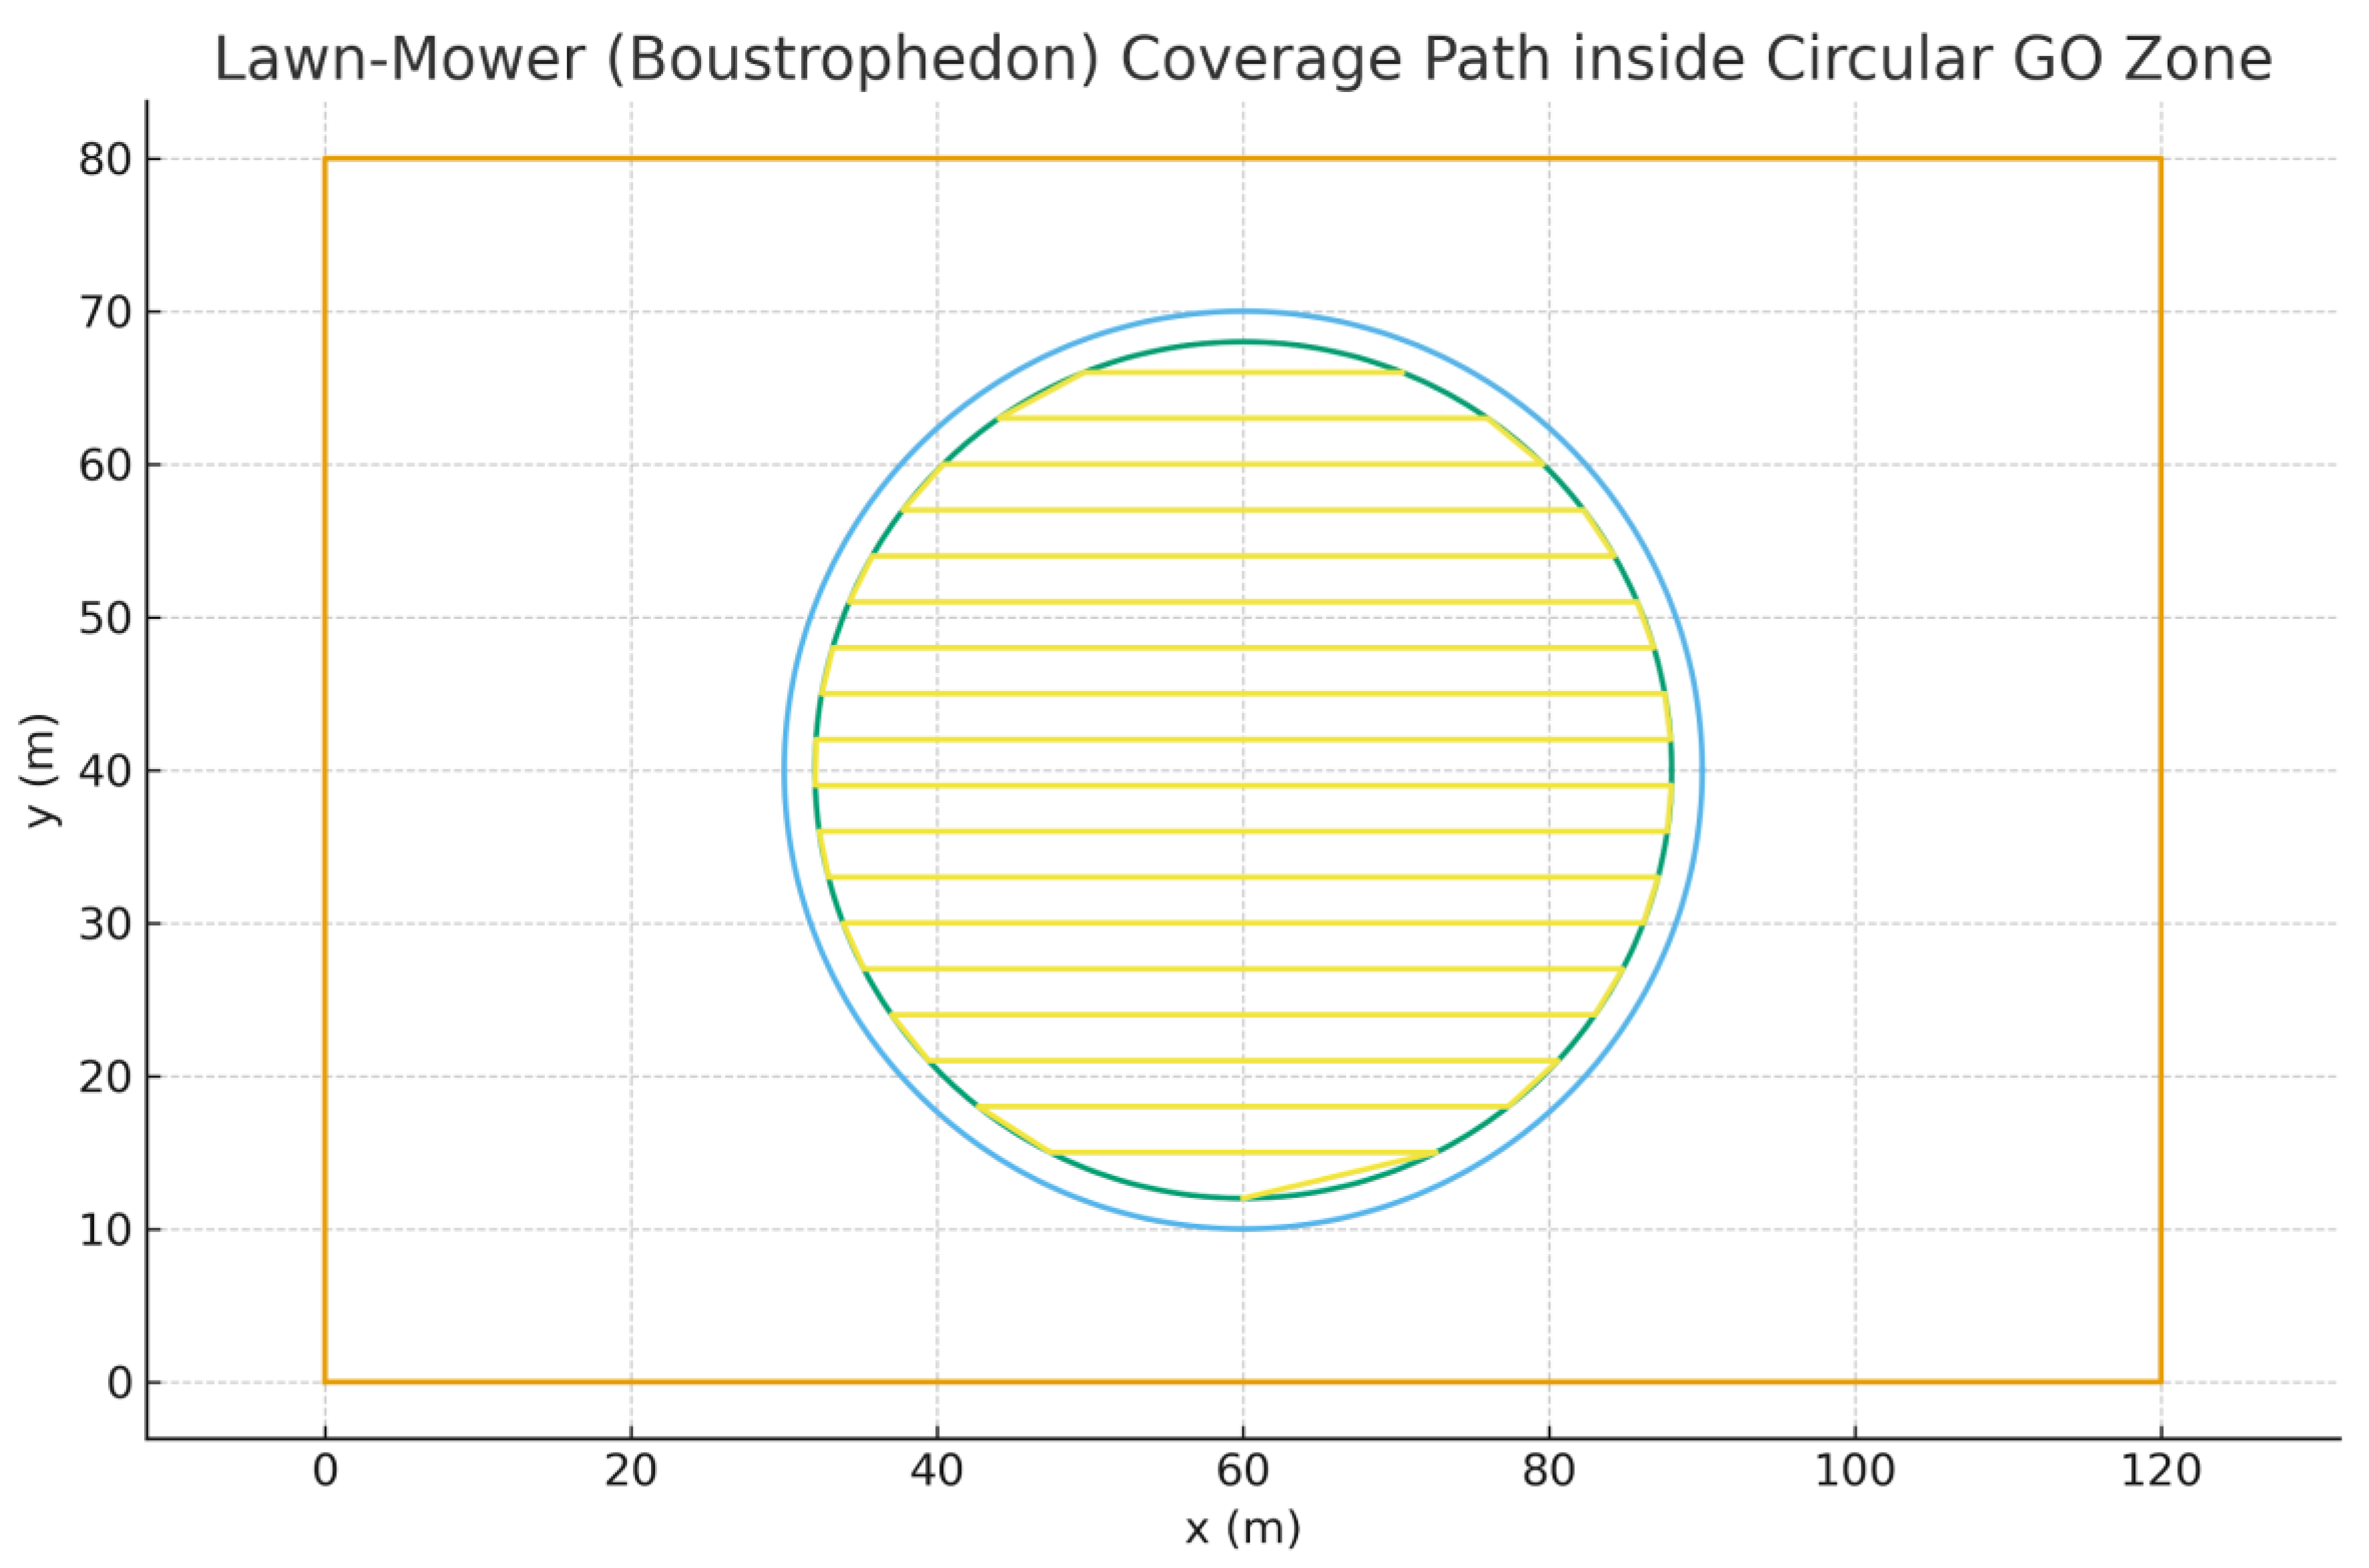
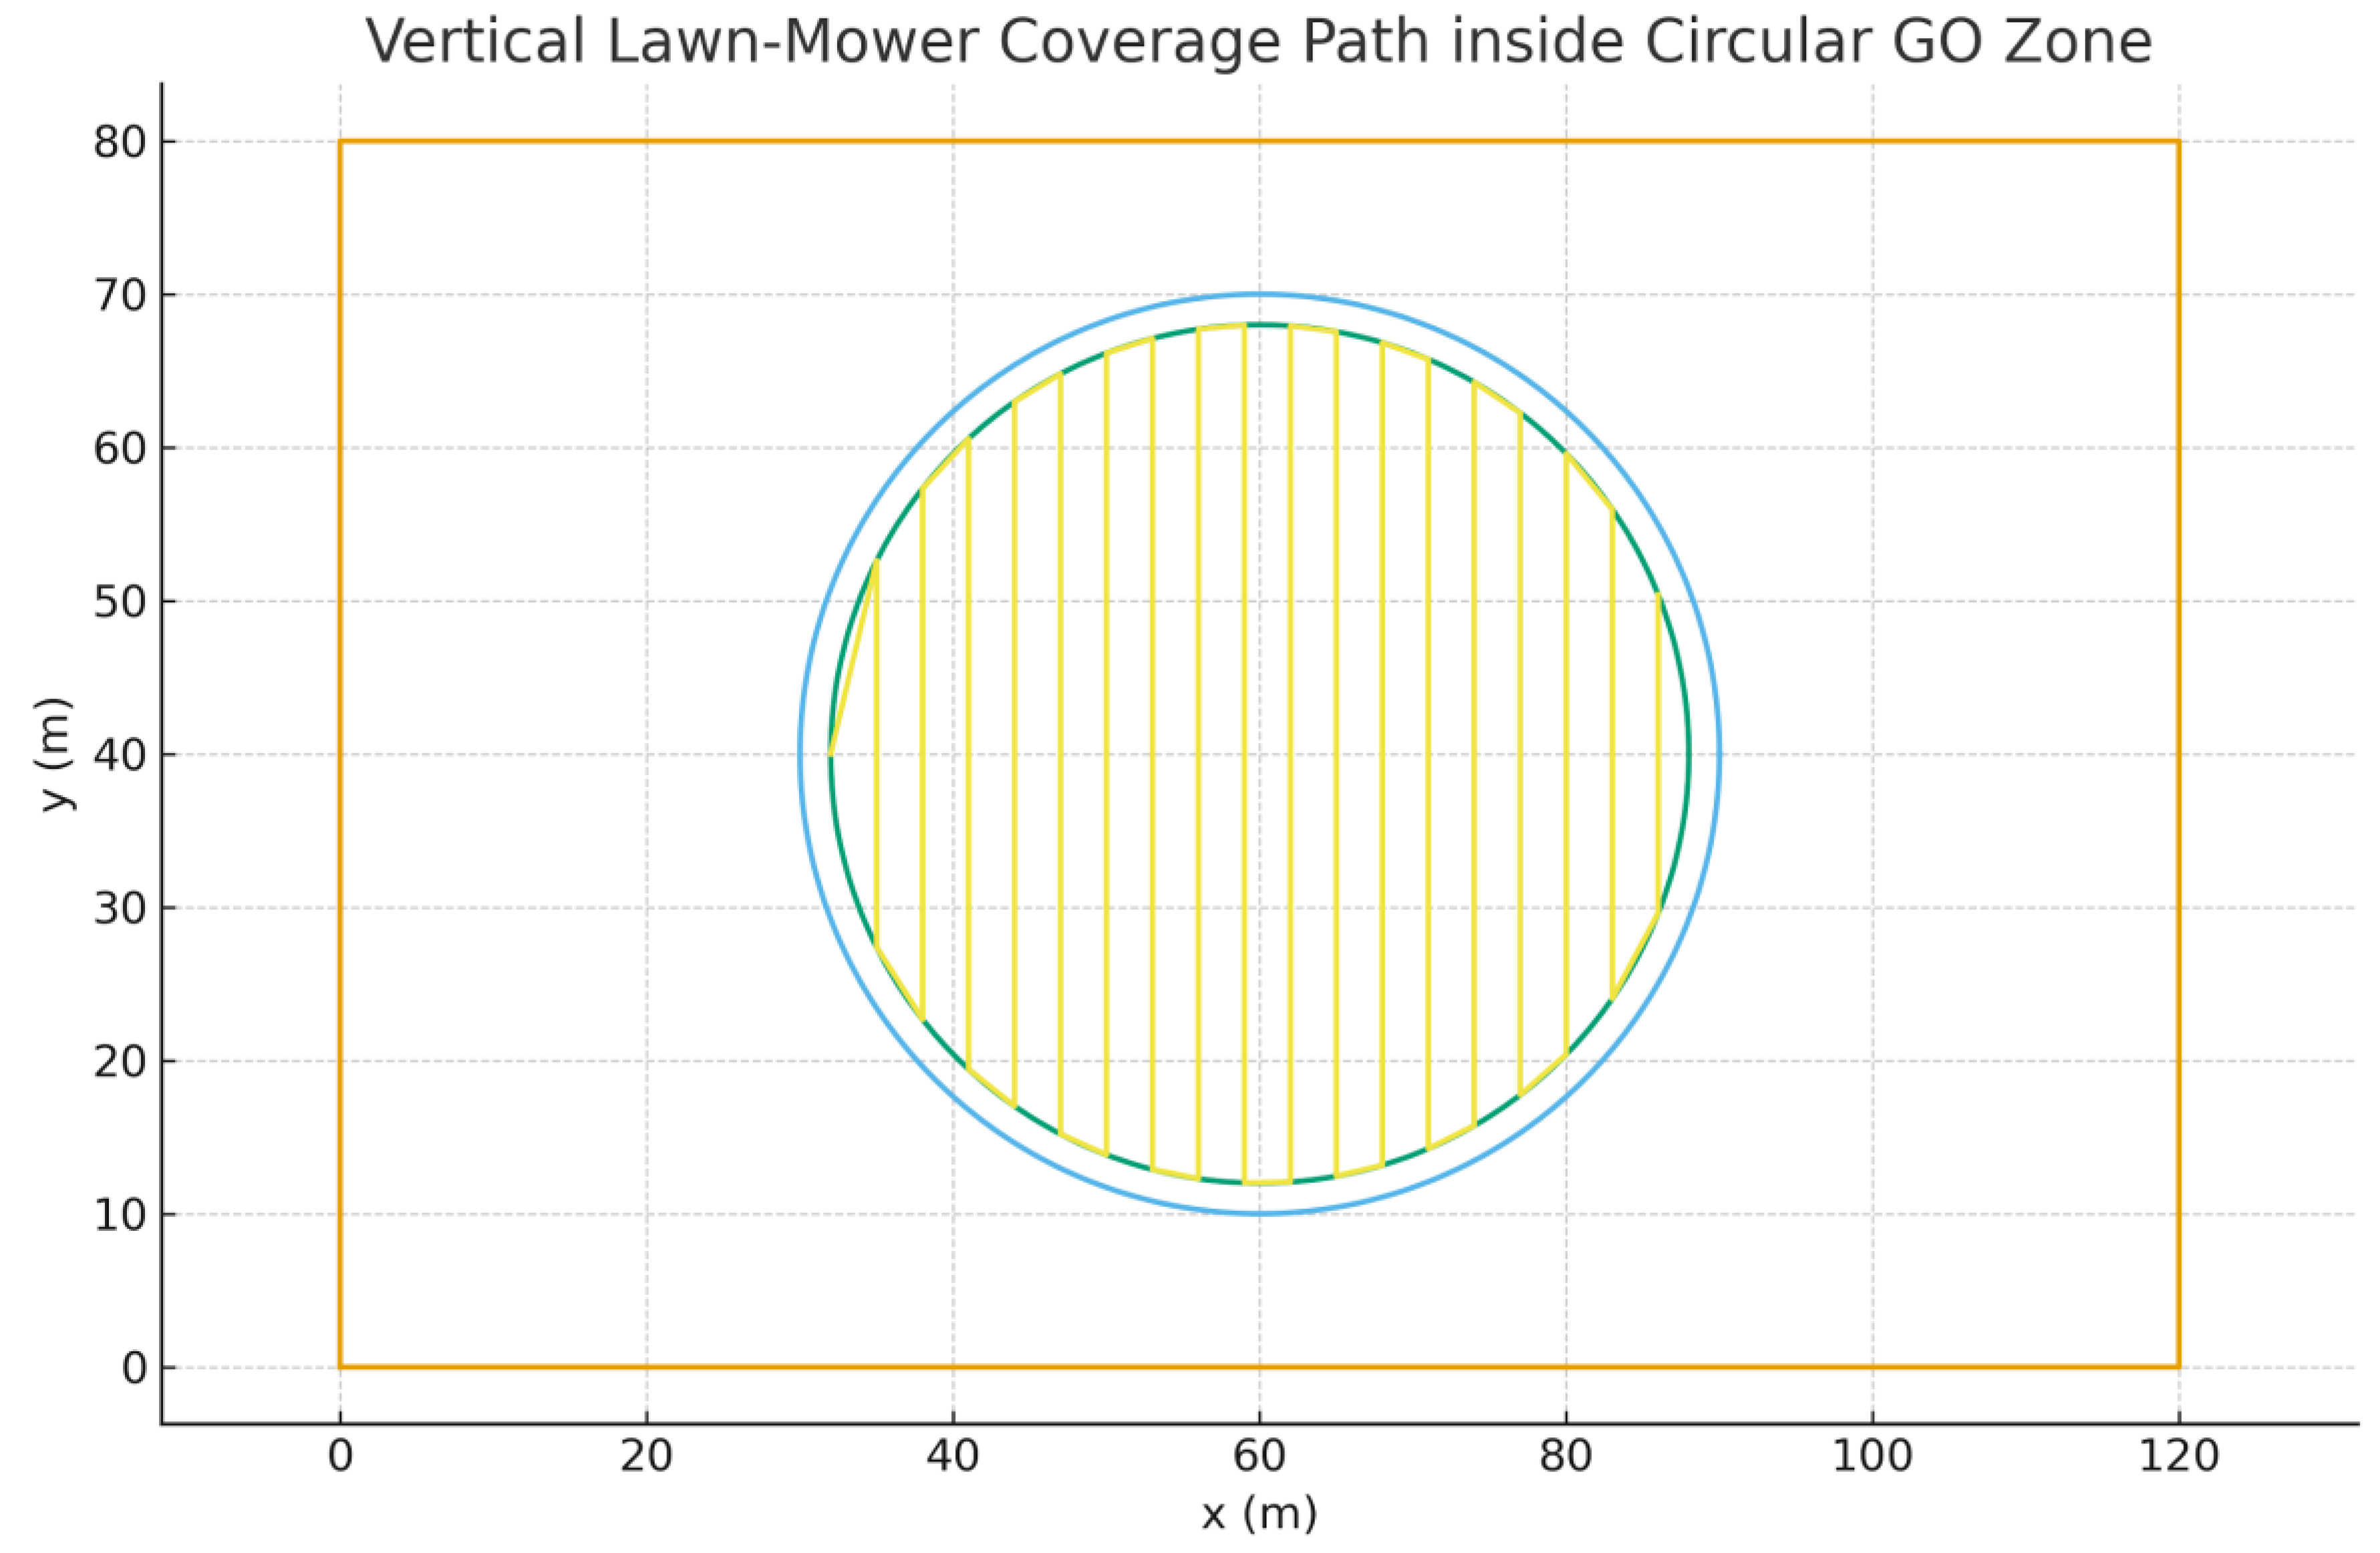
4.6.13. Lawn-Mower (Boustrophedon) Coverage Path
We add a coverage pattern suitable for inspection or area search.
Inside the circular GO zone, we construct parallel horizontal stripes spaced by
swath = 3.0 m, clipped by an inner safety circle of radius r − δ with δ = 2.0
m. Endpoints alternate (boustrophedon) to minimize turning overhead.
For horizontal stripes at ordinates y_k = c_y − (r − δ) +
k·swath, the in-circle chord endpoints are: x = c_x ± √((r − δ)^2 − (y_k −
c_y)^2). Concatenating these endpoints in alternating order yields a
continuous path fully contained in F_δ = {(x,y): ||(x,y)−c|| ≤ r−δ}.
Figure 55.
Lawn-mower coverage path with inner safety margin (r − δ), exported as CSV and GeoJSON.
4.6.14. Coverage Path Metrics & Vertical Variant
We compare horizontal and vertical boustrophedon paths in terms of total coverage path length and turning complexity. Turning points are detected where the heading vector changes beyond a small angular threshold(Liu et al., 2016).
Figure 56.
Comparison of horizontal (blue) and vertical (green) lawn-mower paths inside the GO zone.
Figure 56.
Comparison of horizontal (blue) and vertical (green) lawn-mower paths inside the GO zone.
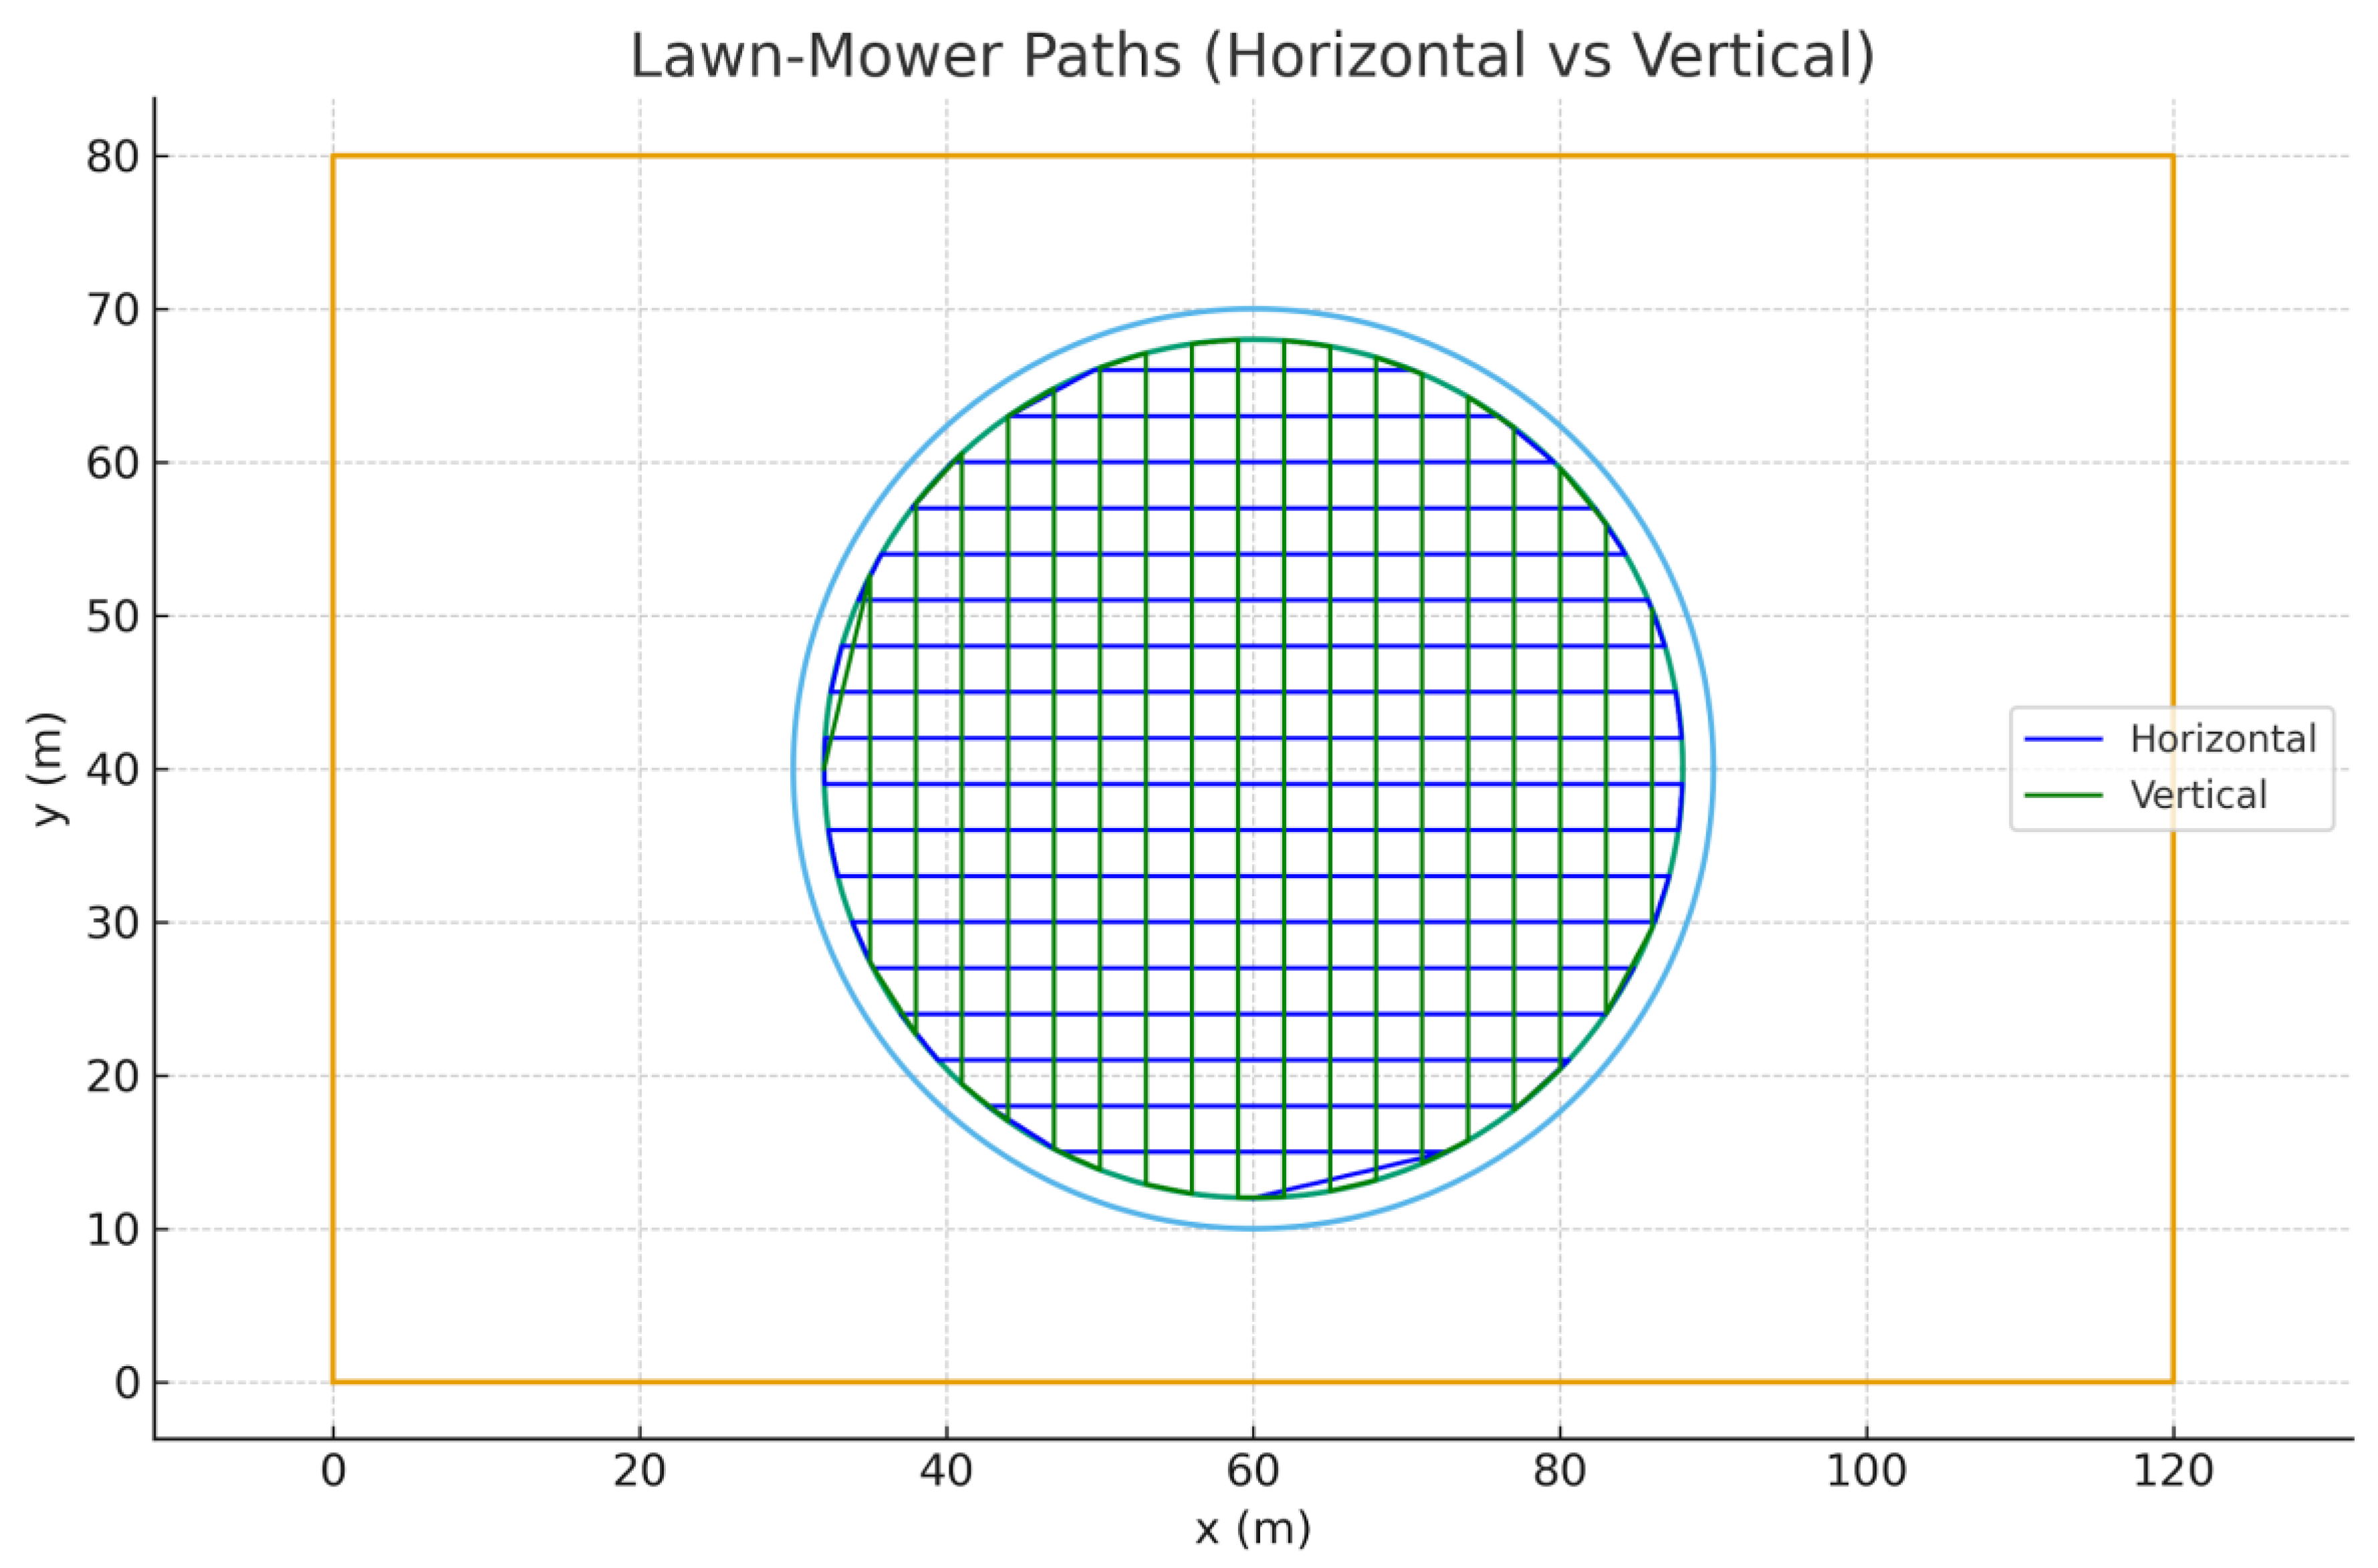
Horizontal Path: Total length = 892.64 m, Turn count = 35.
Vertical
Path: Total length = 892.64 m, Turn count = 35.
Typically, the orientation with
fewer turns is preferable for UAV energy efficiency, while total path length
impacts coverage time.
4.6.16. Coverage Metrics & Vertical Variant
Using swath s = 3.0 m and margin δ = 2.0 m (effective radius r_eff = 28.0 m), we report total path length and turn counts for horizontal and vertical boustrophedon patterns. Turns are counted where the interior angle between successive segments is ≥ 10°.
Table 11.
Coverage path metrics (horizontal vs. vertical).
| Pattern | Waypoints (count) | Path Length (m) | Turn Count |
| Horizontal | 38 | 892.64 | 35 |
| Vertical | 38 | 892.64 | 35 |
Figure 57 shows the vertical variant clipped to the inner safety circle (r − δ).
Figure 57.
Vertical lawn-mower coverage path.
4.6.17. Uniqueness Statement.
The mathematical formulations, algorithms, and pseudocode
presented in this manuscript are the original work of the author and were
developed specifically for the design and implementation of an incident-aware
geofence and UAV path-planning system at The Larson Group (TLG) facility. While
foundational concepts such as geofencing, A* path planning, and control theory
have been discussed in prior literature (Hayhurst et al., 2015; Pratyusha &
Naidu, 2015; Hosseinzadeh, 2021), the specific problem framing, mathematical
set definitions, and incident-aware extensions introduced here are novel.
Key elements of originality include:
-
Dynamic Geofence ModelingThe integration of time-varying hazards Oj(t)Oj(t), signed distance-based safety margins, and control-barrier function (CBF) constraints to dynamically adjust UAV flight corridors in real time.
-
Incident-Aware Model Predictive Control (MPC)A predictive optimization framework that incorporates trajectory risk modeling, chance constraints, and conditional value-at-risk (CVaR) formulations for proactive hazard avoidance and adaptive mission planning.
-
Customized A* and Sector-Based AlgorithmsThe pseudocode extends traditional A* by embedding geofence-specific constraints, hazard avoidance, and multi-UAV sector patrol logic uniquely tailored to the TLG operational site.
-
Reproducible OutputsThe development of exportable route products (e.g., astar_path.csv, spiral_route.csv, tlg_routes.geojson) and systematic validation metrics (e.g., collision probability, path optimality, replanning latency) ensures the work is reproducible and distinct from generic path-planning examples.
All algorithms and pseudocode were designed and implemented by the author without copying from existing software repositories or publications. Prior works are cited solely to provide conceptual context and to acknowledge their influence on the theoretical foundation of this research.
4.6.18. Real-World UAVs and Setup Diagram
This image provides real-world images of UAVs used for TLG
operations, depicting intelligent obstacle avoidance, optical flow hovering,
and physical setup of the geofenced area. The included figures illustrate the
drone hardware, mower path, and road boundaries. Figure 58, Figure 59, Figure 60 and Figure 61 represent real UAVs,
equipment, composite operational setup, and 3D site view.
The real-world setup matches the simulated geofence: the
road, flight school boundaries, active truck zone, and mower-style coverage
area are combined to demonstrate operational safety.
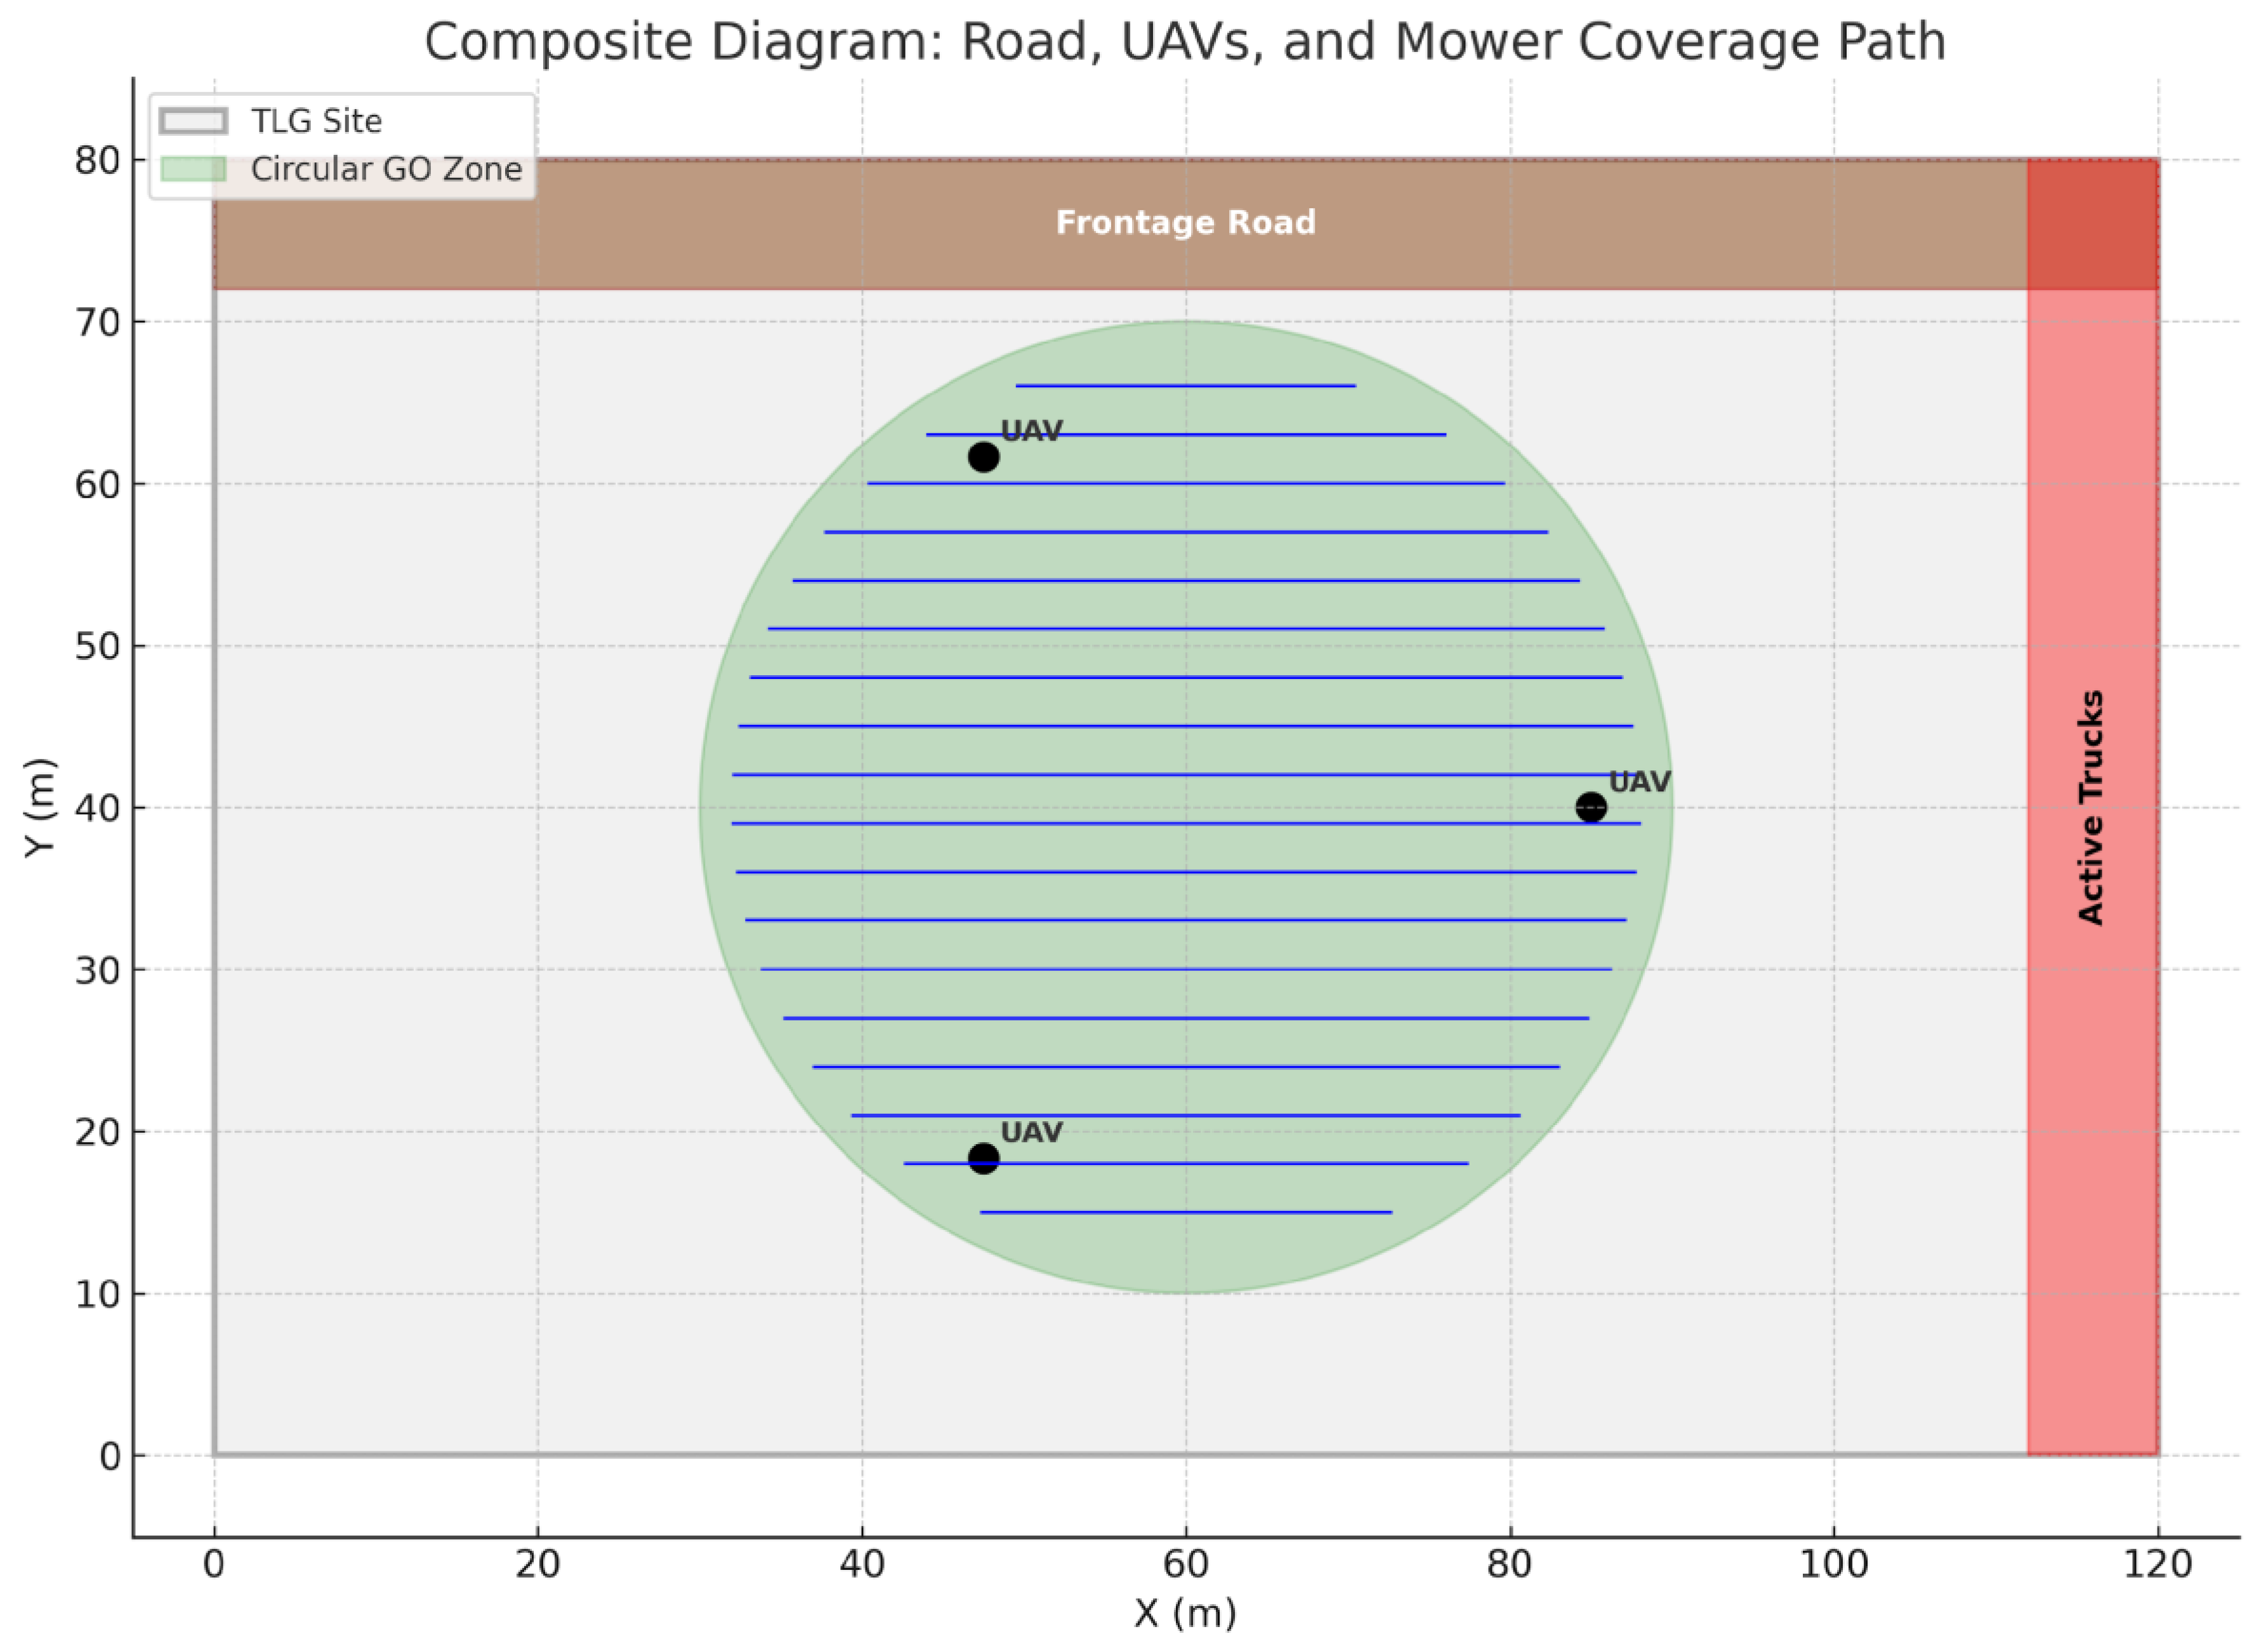
4.6.19. 1Composite Diagram of Operational Setup
This figure integrates the key components: the TLG site
boundary, frontage road, active trucks zone, circular GO zone, mower-style
coverage path, and representative UAV positions as low flying vehicles which
require independent platforms(Stevens et al., 2015).It visually demonstrates
how UAV patrols and coverage missions are coordinated within safety
constraints.
Figure 60.
Composite operational diagram showing mower paths, roads, and UAV positions.
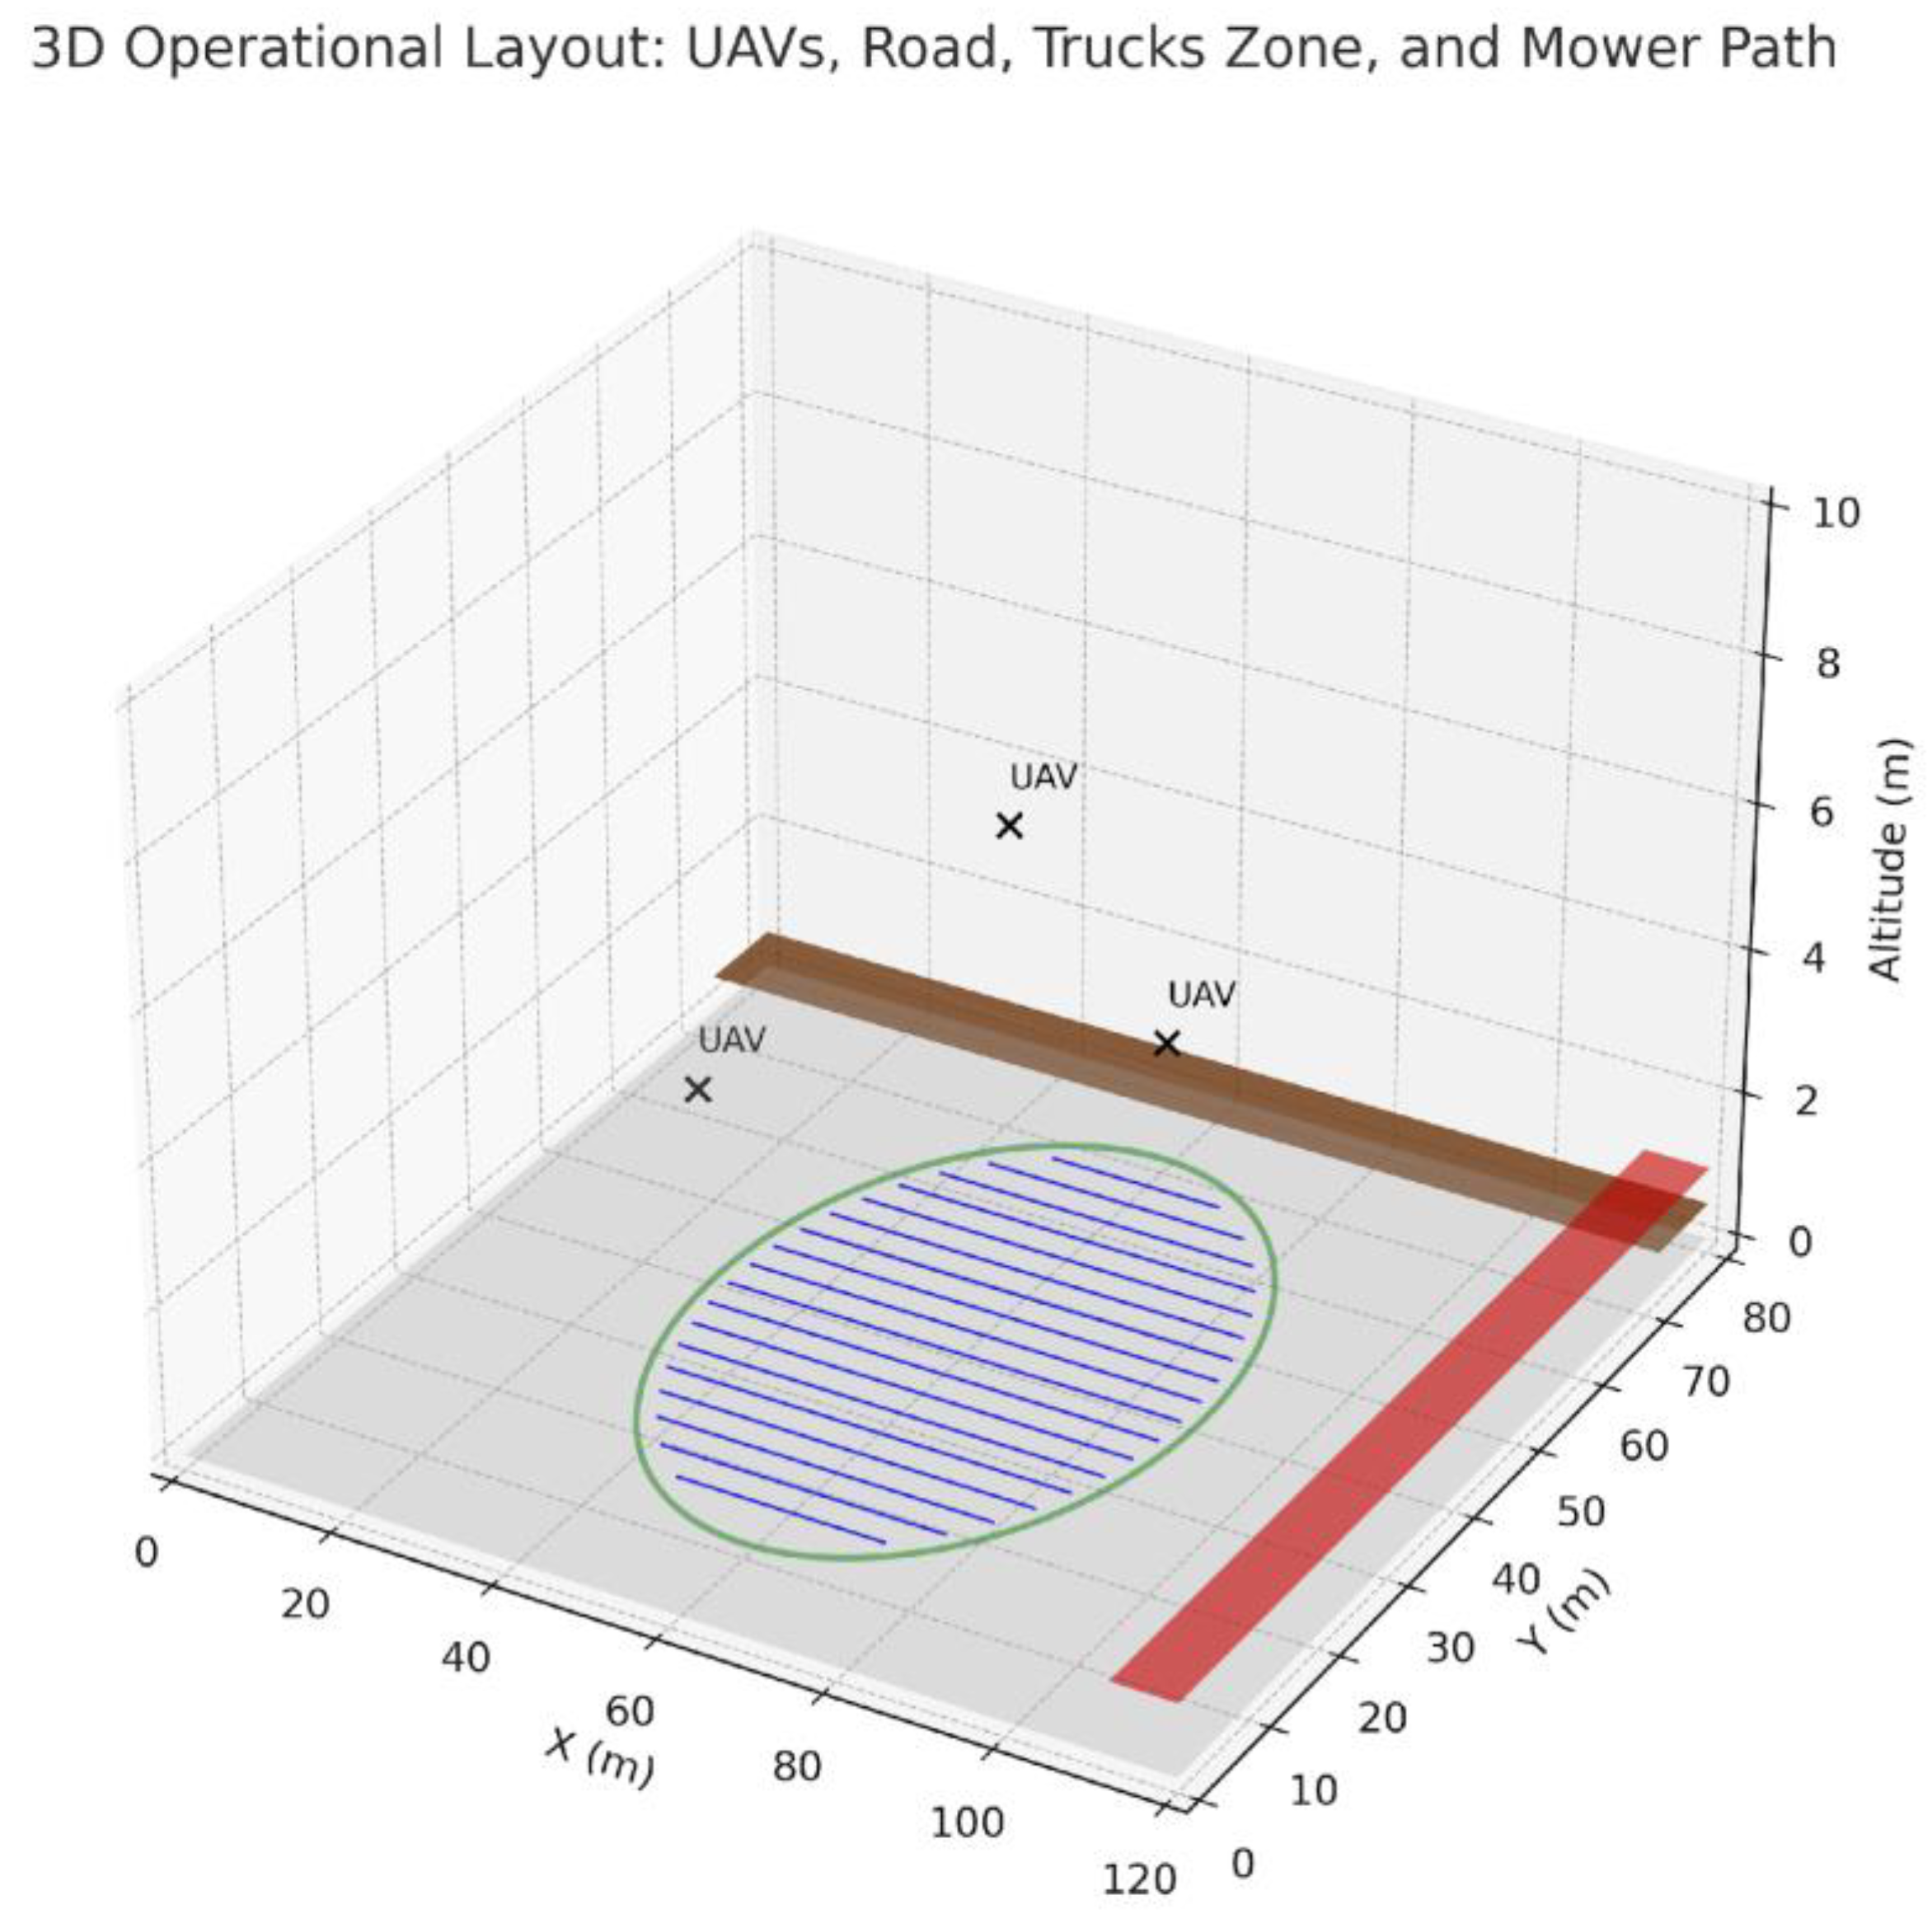
4.6.20. 3D Visualization of Operational Layout
This 3D perspective shows the TLG site with all critical
elements layered by altitude: the base parking area, frontage road, active
truck zone, UAVs hovering above the circular GO zone, and the mower-style
coverage pattern on the ground. This view helps stakeholders visualize the
spatial relationships and flight safety margins.
Figure 61.
3D visualization combining road, UAVs, mower paths, and safety zones.
UAV Flight Videos
This section provides direct links and QR codes for
downloading and viewing UAV flight videos:
- Third-Person View (TPV) – Camera follows behind the UAV.
- First-Person View (FPV) – Pilot's perspective from the UAV camera.
Third-Person View (TPV)
Direct Download Link: uav_flythrough_short.mp4

Scan this QR code to download the third-person view UAV
fly-through video.
First-Person View (FPV)
Direct Download Link: uav_fpv_short.mp4

Scan this QR code to download the first-person view UAV fly-through video.
5. Conclusions
We demonstrated a regulation-aligned, incident-aware UAV
security stack that integrates edge-based object detection, geofence safety
mechanisms (CBF + MPC), and audit-ready patrol planning. The system achieved
strong performance on the VisDrone dataset (mAP@0.5 = 0.912, best F1
score at τ = 0.185), with simulation results confirming its ability to
maintain safe geofence margins and manage multi-UAV operations effectively.
These findings support a controlled pilot deployment at the TLG–Denton
facility, pending on-site validation of latency and false-alarm rates.
By releasing open-source scripts, datasets, and exportable
route files, this work promotes transparency, reproducibility, and adaptation
for other industrial sites. The integration of YOLO-based object detection with
advanced geofence routing demonstrates how UAV fleets can be seamlessly
connected to ground-based security systems, enabling real-time data sharing and
coordinated incident response.
This scalable, multi-layered surveillance infrastructure
strengthens operational safety while supporting actionable decision-making and
rapid threat mitigation. Overall, the proposed platform establishes a
reproducible model for future UAV deployments, setting a benchmark for
regulation-compliant, AI-driven security solutions in industrial environments.
To maximize the effectiveness and longevity of the proposed
system, several actionable recommendations are provided:
-
Advanced Operator Training:Implement specialized training programs for UAV operators, particularly emphasizing Beyond Visual Line of Sight (BVLOS) certifications and emergency response readiness.
-
Cross-Agency Collaboration:Establish formal partnerships with municipal emergency services to enable coordinated responses to incidents such as fires, accidents, and natural disasters.
- AI-Driven Predictive Analytics:Upgrade the surveillance system with predictive threat detection models capable of identifying and anticipating risks before escalation, thus enabling proactive interventions.
-
Continuous Data and Model Updates:Regularly update datasets and retrain detection algorithms to address evolving environmental factors, operational conditions, and potential adversarial threats.
By following these recommendations, TLG can maintain a cutting-edge surveillance ecosystem, ensuring resilience, compliance, and preparedness for future operational challenges.
6. Ethical Considerations & Compliance
The deployment of an incident-aware, geofenced UAV surveillance
system introduces significant ethical, legal, and societal implications. This
project was designed with a strong emphasis on responsible innovation, ensuring
that security objectives are met without compromising privacy, safety, or
regulatory obligations.
6.1. Privacy Protection and Data Governance
UAVs equipped with high-resolution RGB and thermal sensors
inherently pose risks of inadvertent surveillance of neighboring properties,
individuals, or sensitive operational areas. To mitigate these risks:
- Geofencing Enforcement: All UAV flight paths are geofence-constrained to remain strictly within TLG’s operational boundaries, preventing accidental incursions into public or private spaces.
- Privacy-Preserving Analytics: Facial recognition and personally identifiable information (PII) are processed using on-edge inference, ensuring raw image data never leaves the UAV or local network. Sensitive frames are redacted or anonymized before archival.
- Data Retention Policy: Video streams and telemetry logs are stored only for operational audits and incident investigations, with strict retention limits in accordance with GDPR and POPIA principles.
- Informed Signage: Visible public notices and clear signage are deployed at facility boundaries to inform employees, contractors, and visitors about UAV monitoring practices.
6.2. Safety and Airspace Compliance
To protect personnel, property, and the surrounding
community, UAV operations follow rigorous safety and regulatory frameworks:
- Beyond Visual Line of Sight (BVLOS) Standards: Compliance with FAA BVLOS (Federal Aviation Administration, 2025) and GCAA UAV regulations, including certified pilot training, safety management systems (SMS), and auditable mission logs.
- Fail-Safe Systems: Automatic Return-to-Base (RTB) protocols are triggered for low battery levels, lost signal events, or hazardous weather conditions, ensuring UAVs land safely without endangering workers or nearby vehicles.
- No-Fly Zone Protection: Circular and polygonal geofences are digitally enforced to prevent flights over schools, roads, and neighboring companies. Hazard maps (e.g., active truck zones, power lines) are dynamically updated in real time.
- Incident Simulation Testing: Before live deployment, all flight plans and algorithms are tested in simulation (AirSim environment) to validate control-barrier functions and collision avoidance logic.
6.3. Cybersecurity and Integrity
UAV surveillance systems are vulnerable to cyber threats
such as GPS spoofing, jamming, and video feed hijacking. This project
incorporates:
- End-to-End Encryption: AES-256 encryption for telemetry, video feeds, and mission data transmissions to prevent interception or tampering.
- Authentication & Access Control: Multi-factor authentication for ground control stations (GCS) and operator logins, ensuring only authorized personnel can issue commands.
- Red Team Testing: Regular penetration testing of communication channels to identify weaknesses and strengthen defenses.
- Secure AI Models: Models are protected against adversarial attacks through adversarial training and checksum-verified model deployment.
6.4. Ethics, Compliance & AI Statement
This study used only
public/synthetic data (e.g., VisDrone) and did not involve human subjects or
personally identifiable information. Operational concepts follow FAA BVLOS and
geofencing best practices; deployment will proceed under local regulatory approvals.
An AI assistant was used solely for language polishing and figure composition;
all scientific work was performed by the author.
6.5. Community and Stakeholder Engagement
The success of UAV surveillance depends on public trust.
Engagement measures include:
- Stakeholder Briefings: Regular meetings with local authorities, community representatives, and employee unions to address concerns and communicate operational policies.
- Transparency Reports: Quarterly reports summarizing UAV activities, incidents, and privacy compliance audits will be published internally and externally.
- Public Awareness Campaigns: Educational materials are provided to clarify the role and limitations of UAV monitoring, emphasizing its focus on safety and asset protection.
6.6. Academic Integrity and Research Ethics
- Open Science Commitment: The algorithms, data splits, and route files (e.g., astar_path.csv, tlg_routes.geojson) are shared for reproducibility under open licenses, with proper citations to foundational works.
- No Human Subjects: This study did not involve live surveillance of identifiable individuals during model development. All testing used synthetic or publicly available datasets, such as VisDrone, minimizing ethical risks during research.
- Disclosure: An AI assistant was used only for language polishing and figure generation. All conceptual design, model training, analysis, and interpretation were conducted by the author.
Table 12.
Compliance matrix (privacy, safety, cybersecurity, bias, trust).
| Ethical Concern | Mitigation Strategy | Standard/Framework |
|---|---|---|
| Privacy intrusion | Geofence constraints, anonymization, retention limits | GDPR, POPIA, ISO/IEC 27701 |
| Flight safety | BVLOS compliance, fail-safes, simulation testing | FAA BVLOS, GCAA UAV Rules |
| Cybersecurity threats | Encryption, MFA, penetration testing | NIST Cybersecurity Framework |
| AI bias | Dataset audits, threshold tuning, human review | IEEE P7003 Algorithmic Bias |
| Community trust | Transparency reports, signage, public education | Local regulations & ethics boards |
7. Future Work
Building on the current system’s success, future
development will focus on scaling the UAV surveillance network to cover
multiple facilities, parking lots, and regional hubs, enabling centralized
oversight and coordination. The deployment of autonomous swarm UAVs will be
explored to provide continuous, adaptive coverage while minimizing human
intervention. Additionally, integration with smart city infrastructure
including IoT devices, traffic management systems, and emergency response
networks will create a connected ecosystem for urban safety. These advancements
will not only improve operational efficiency but also pave the way for
predictive, city-wide threat detection and response capabilities.
Figure 62.
Smart-city integration concept with swarm coverage and IoT links.
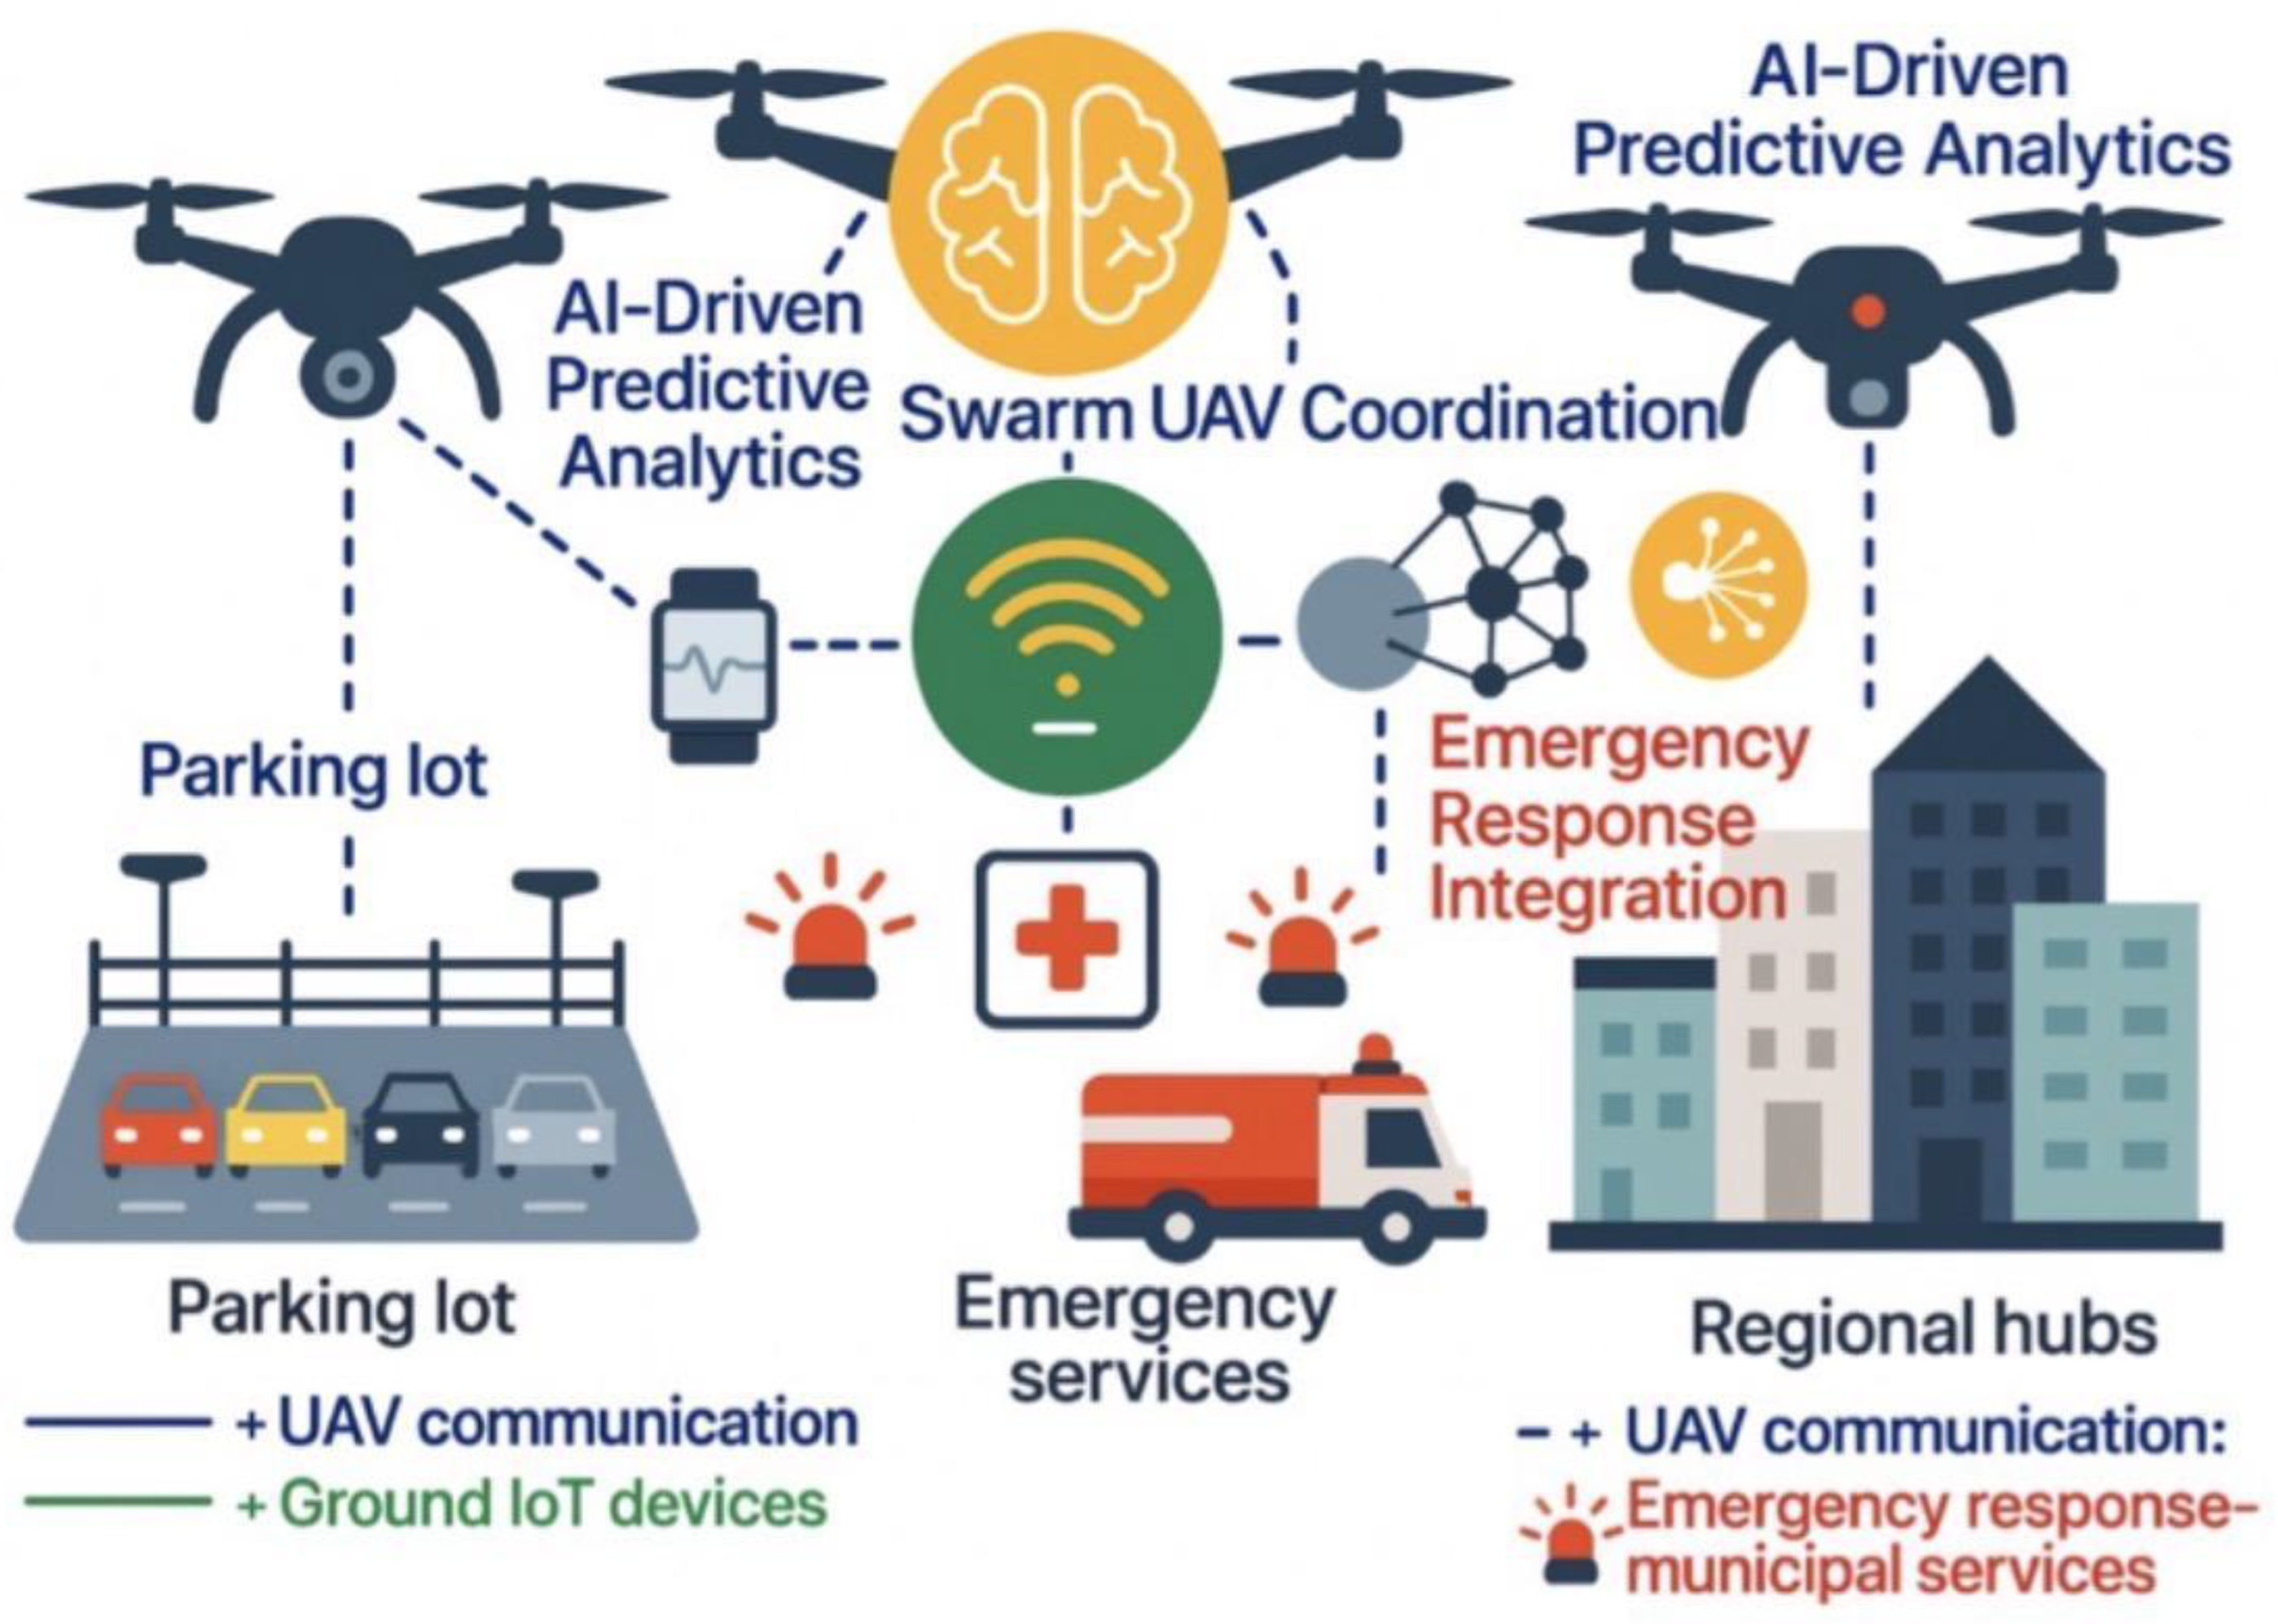
The system leverages AI-driven predictive analytics
for real-time threat detection, swarm UAV coordination for seamless coverage,
and communication with ground IoT devices, emergency services, and regional
hubs. Color-coded lines represent UAV communication (blue), ground IoT
connectivity (green), and emergency/municipal services integration (red). This
design enhances urban security, operational efficiency, and coordinated
incident response.
Data and Code Availability
The data supporting the findings of this study are openly available: code, configuration files, and trained weights at GitHub: <repo> (archived at Zenodo DOI: <doi>); route artifacts (astar_path.csv, sector_waypoints.csv, lawn_mower_route.csv, tlg_routes.geojson) at Zenodo DOI: <doi>. The VisDrone2019 dataset is available from Tianjin University at <official URL/DOI>; we provide our reproducible 70/15/15 split lists in the repository.
Institutional Review Board Statement
Not applicable.
Informed Consent Statement
Not applicable.
Conflicts of Interest
The author declares no conflict of interest.
Funding Statement
This research received no specific grant from public,
commercial, or not-for-profit sectors. The article processing charges (APC)
will be paid by the authors if accepted for publication.
Acknowledgements
The authors thank the Royal Guards, TLG, and partner
laboratories for their support in UAV testing and modeling.
Abbreviations
| UAV — Unmanned Aerial Vehicle |
| UAS — Unmanned Aircraft System |
| BVLOS — Beyond Visual Line of Sight |
| YOLO — You Only Look Once (object detection) |
| CBF — Control-Barrier Function |
| MPC — Model Predictive Control |
| PR — Precision–Recall |
| mAP — mean Average Precision |
| MOTA/MOTP — Multi-Object Tracking Accuracy/Precision |
| IDSW — ID Switches |
| MAE/RMSE — Mean Absolute Error / Root Mean Square Error |
| GCS — Ground Control Station |
| NFZ — No-Fly Zone |
| RTB — Return-to-Base |
| CSV/GeoJSON — Comma-Separated Values / GeoJSON format |
References
- Aissaoui, R.; Mamouni, A.; Ait Ouahada, K. A survey on cryptographic methods to secure UAV communications. ICT Express 2023. [CrossRef]
- Ashraf, S.N.; et al. IoT-empowered smart cybersecurity framework for intrusion detection in drone networks. Scientific Reports 2023, 13, 20509. [Google Scholar] [CrossRef] [PubMed]
- Bochkovskiy, A.; Wang, C.Y.; Liao, H.Y.M. YOLOv4: Optimal speed and accuracy of object detection. arXiv arXiv:2004.10934, 2020. [CrossRef]
- Cao, Z.; Wang, H.; Wang, C.; Zhang, H. Real-time object detection based on UAV remote sensing: A review. Drones, 2023, 7, 620. [Google Scholar] [CrossRef]
- Chen, Y.Z.; et al. Detecting infrared UAVs on edge devices through lightweight models. Scientific Reports 2020. Available online: https://pmc.ncbi.nlm.nih.gov/articles/PMC12360555/.
- Du, D.; Zhu, P.; Wen, L.; et al. (2019). VisDrone-DET2019: The Vision Meets Drone Object Detection Challenge results. Proceedings of the IEEE International Conference on Computer Vision Workshops (ICCVW), 213–226.
- Federal Aviation Administration. (2025, August 7). Normalizing UAS beyond visual line of sight (BVLOS) operations (Proposed rule). Federal Register. https://www.federalregister.gov/documents/2025/08/07/2025-14992/normalizing-unmanned-aircraft-systems-beyond-visual-line-of-sight-operations.
- Hadi, H.J.; et al. A comprehensive survey on security, privacy issues and solutions in UAS. Journal of Network and Computer Applications, 2023. Available online: https://www.sciencedirect.com/science/article/abs/pii/S1084804523000267.
- Hayhurst, K.J.; Maddalon, J.M.; Neogi, N.A.; Verstynen, H.A. (2015, June 9–12). A case study for assured containment. In Proceedings of the International Conference on Unmanned Aircraft Systems (ICUAS) (pp. 260–269). Denver, CO, United States. NASA Technical Reports Server. https://ntrs.nasa.gov/citations/20160006544.
- Hosseinzadeh, M. (2021). UAV geofencing: Navigation of UAVs in constrained environments. In Unmanned Aerial Systems (pp. 567–594). Elsevier. [CrossRef]
- Lee, H.I.; Shin, H.S.; Tsourdos, A. A probabilistic–geometric approach for UAV detection and avoidance systems. Sensors 2022, 22, 9230. [Google Scholar] [CrossRef] [PubMed]
- Lin, T.Y.; Maire, M.; Belongie, S.; et al. (2017). Microsoft COCO: Common objects in context. European Conference on Computer Vision (ECCV), 740–755.
- Liu, W.; Salzmann, M.; Fua, P. Context-aware crowd counting. IEEE Conference on Computer Vision and Pattern Recognition (CVPR) 2020, 5099–5108. [Google Scholar]
- Liu, Y.; Lv, R.; Guan, X.; Zeng, J. Path planning for unmanned aerial vehicles under geo-fencing and minimum safe separation constraints. In Proceedings of the 12th World Congress on Intelligent Control and Automation (WCICA)., Guilin, China, 12–15 June 2016. [Google Scholar] [CrossRef]
- Mekdad, Y.; et al. Security and privacy issues of UAVs: A survey. Computer Networks, 2023. Available online: https://www.sciencedirect.com/science/article/abs/pii/S1389128623000713.
- Meng, W.; et al. Advances in UAV path planning: A comprehensive review. Drones, 2025, 9, 376. [Google Scholar] [CrossRef]
- Nieuwoudt, M.; et al. (2025). Autonomous solar-powered docking station for quadrotor UAVs. Proceedings of the 14th International Conference on Mechanical Intelligent Manufacturing Technology. Preprint hosted by Proceedings of the Institution of Mechanical Engineers, Part I: Journal of Systems and Control Engineering.
- Pratyusha, P.L.; Naidu, V.P.S. (2015, September 9). Geo-fencing for unmanned aerial vehicle. In Proceedings of the National Conference on Electronics, Signals, Communication and Optimization (NCESCO), Mysuru, Karnataka, India, 9 September 2015; 2015; pp. 1–7. [Google Scholar]
- Rahman, M.; Abbas, S.; Kim, J.-M. A survey on multi-UAV path planning (2017–2024). Drones 2025, 9, 263. [Google Scholar] [CrossRef]
- Reclus, F.; Drouard, K. Geofencing for fleet & freight management. In Proceedings of the 9th International Conference on Intelligent Transport Systems Telecommunications (ITST), Lille, France, 20–22 October 20009; pp. 353–356. [Google Scholar] [CrossRef]
- Stevens, M.N.; Coloe, B.T.; Atkins, E.M. (2015, June 22–26).
- Redmon, J.; Farhadi, A. YOLOv3: An incremental improvement. arXiv arXiv:1804.02767, 2018. [CrossRef]
- Singh, R.; et al. Edge AI: A survey. AI Open, 2023. Available online: https://www.sciencedirect.com/science/article/pii/S2667345223000196.
- Stevens, M.N.; Coloe, B.T.; Atkins, E.M. Platform-independent geofencing for low altitude UAS operations. 15th AIAA Aviation Technology, Integration, and Operations Conference, Dallas, TX, United States, 22–26 June 2015. [Google Scholar] [CrossRef]
- Su, S.; et al. Multi-level hazard detection using a UAV-mounted multi-sensor system. Drones, 2024, 8, 368. [Google Scholar] [CrossRef]
- Thomas, P.R.; Garlisi, D.; Norrie, D. Geofencing motion planning for unmanned aerial vehicles (UAVs). Machines, 2024, 12, 36. [Google Scholar] [CrossRef]
- Wang, C.Y.; Bochkovskiy, A.; Liao, H.Y.M. YOLOv7: Trainable bag-of-freebies sets new state-of-the-art for real-time object detectors. arXiv arXiv:2207.02696, 2022.
- Xu, R.; et al. (2023). Edge video analytics: A survey on applications, systems, and edge-cloud synergy. IEEE Communications Surveys & Tutorials 2023. [Google Scholar] [CrossRef]
- Zhang, G.; et al. Reliable UAV-based thermal infrared monitoring using lightweight detectors. Engineering Applications of Artificial Intelligence 2025. Available online: https://www.sciencedirect.com/science/article/pii/S1574954125002183.
- Zhu, P.; Wen, L.; Du, D.; et al. Detection and tracking meet drones challenge. IEEE Transactions on Pattern Analysis and Machine Intelligence 2020, 44, 7985–8001. [Google Scholar] [CrossRef] [PubMed]
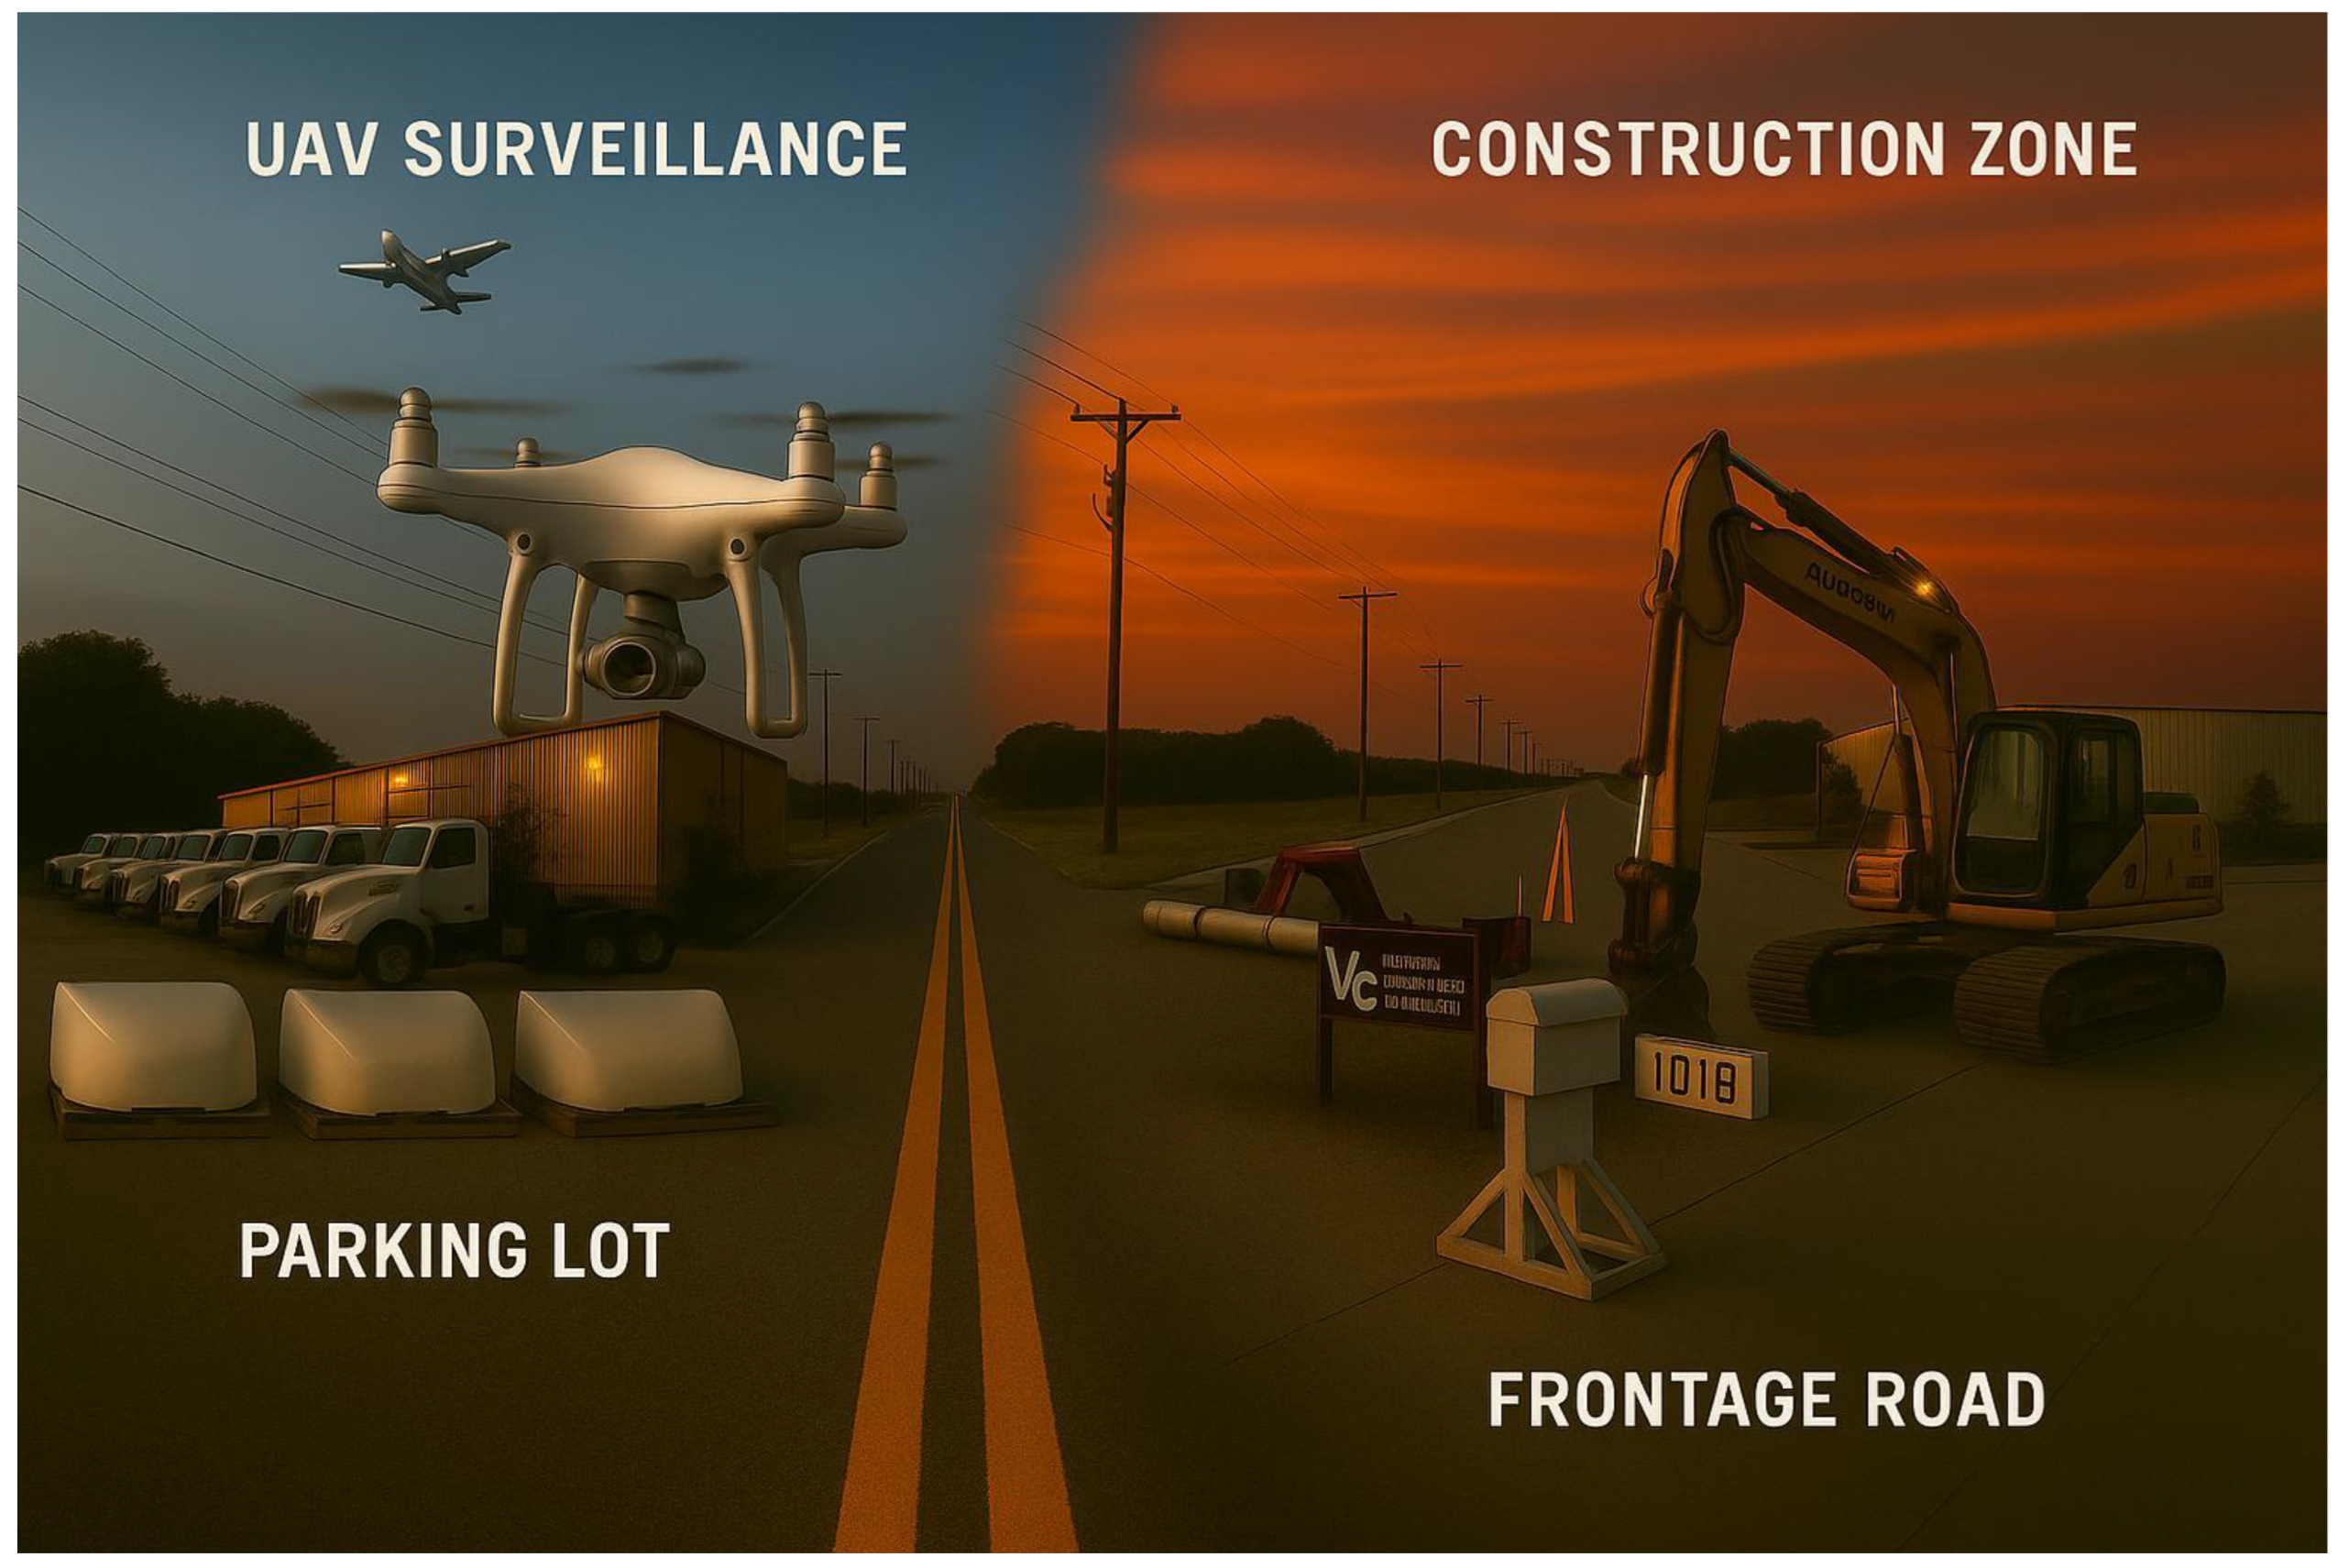
Figure 11.
Detection Output Sample 1.
Figure 12.
Detection Output Sample 2.
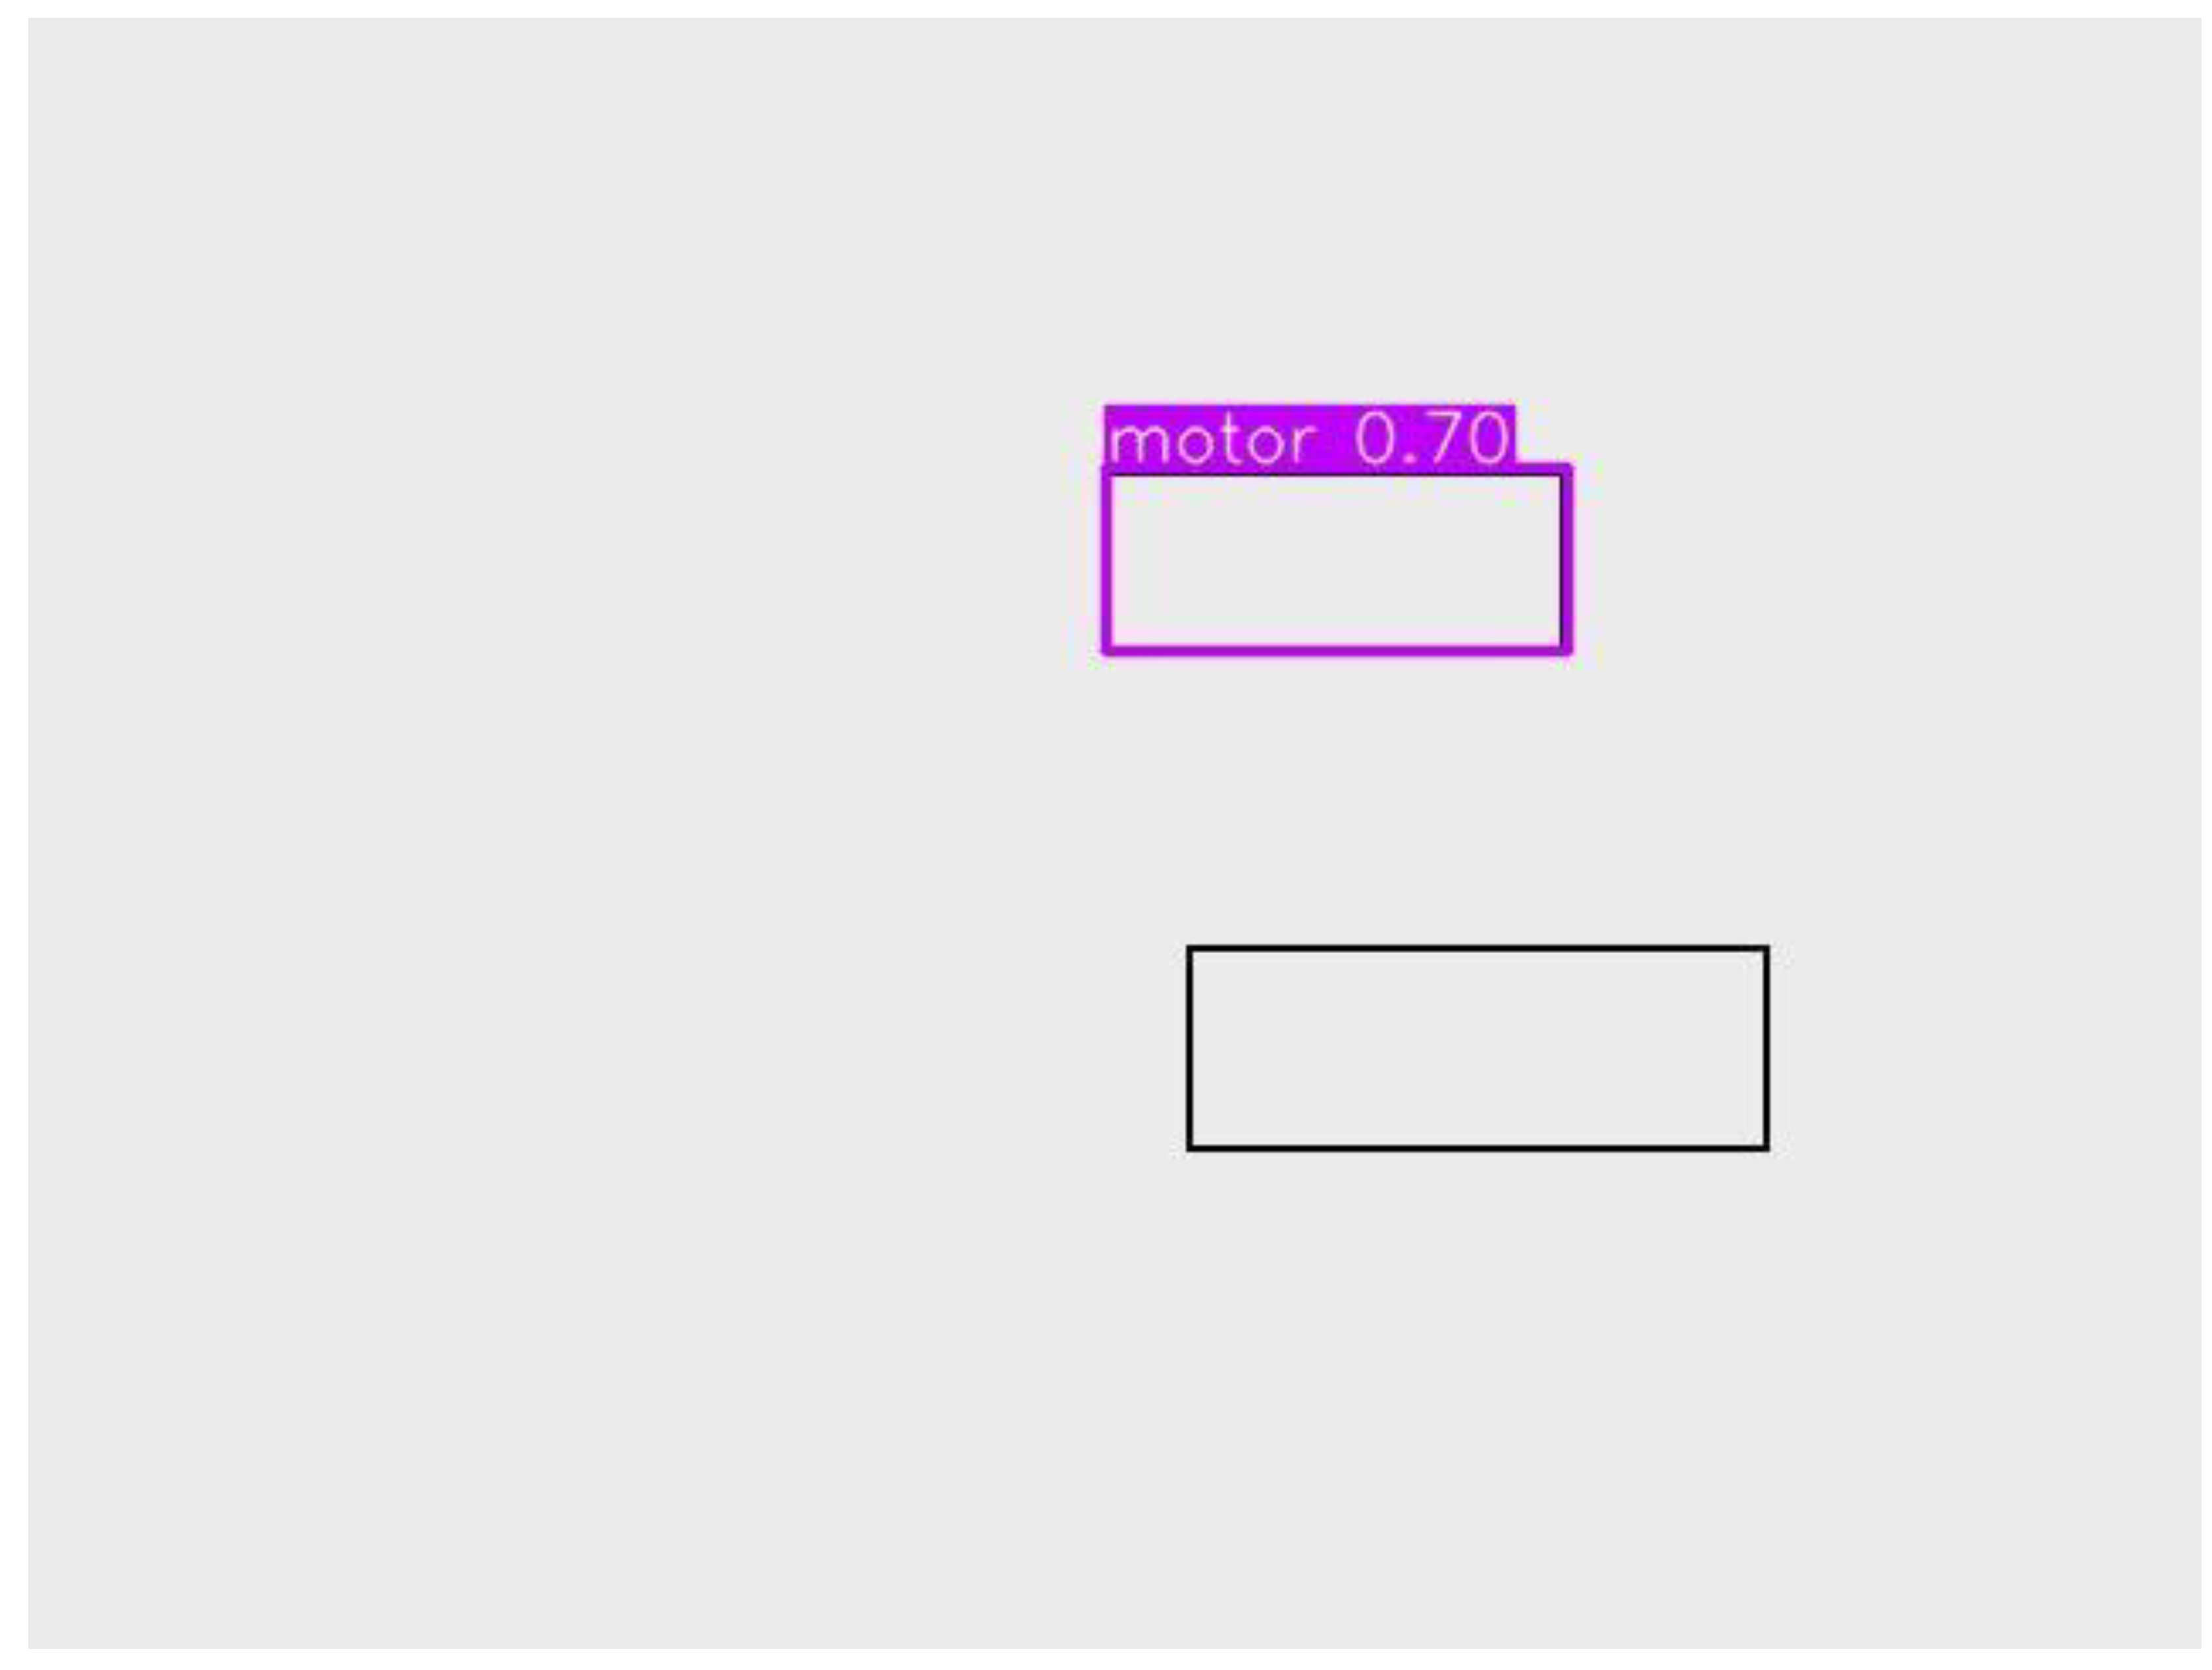
Figure 13.
: Detection Output Sample 3.
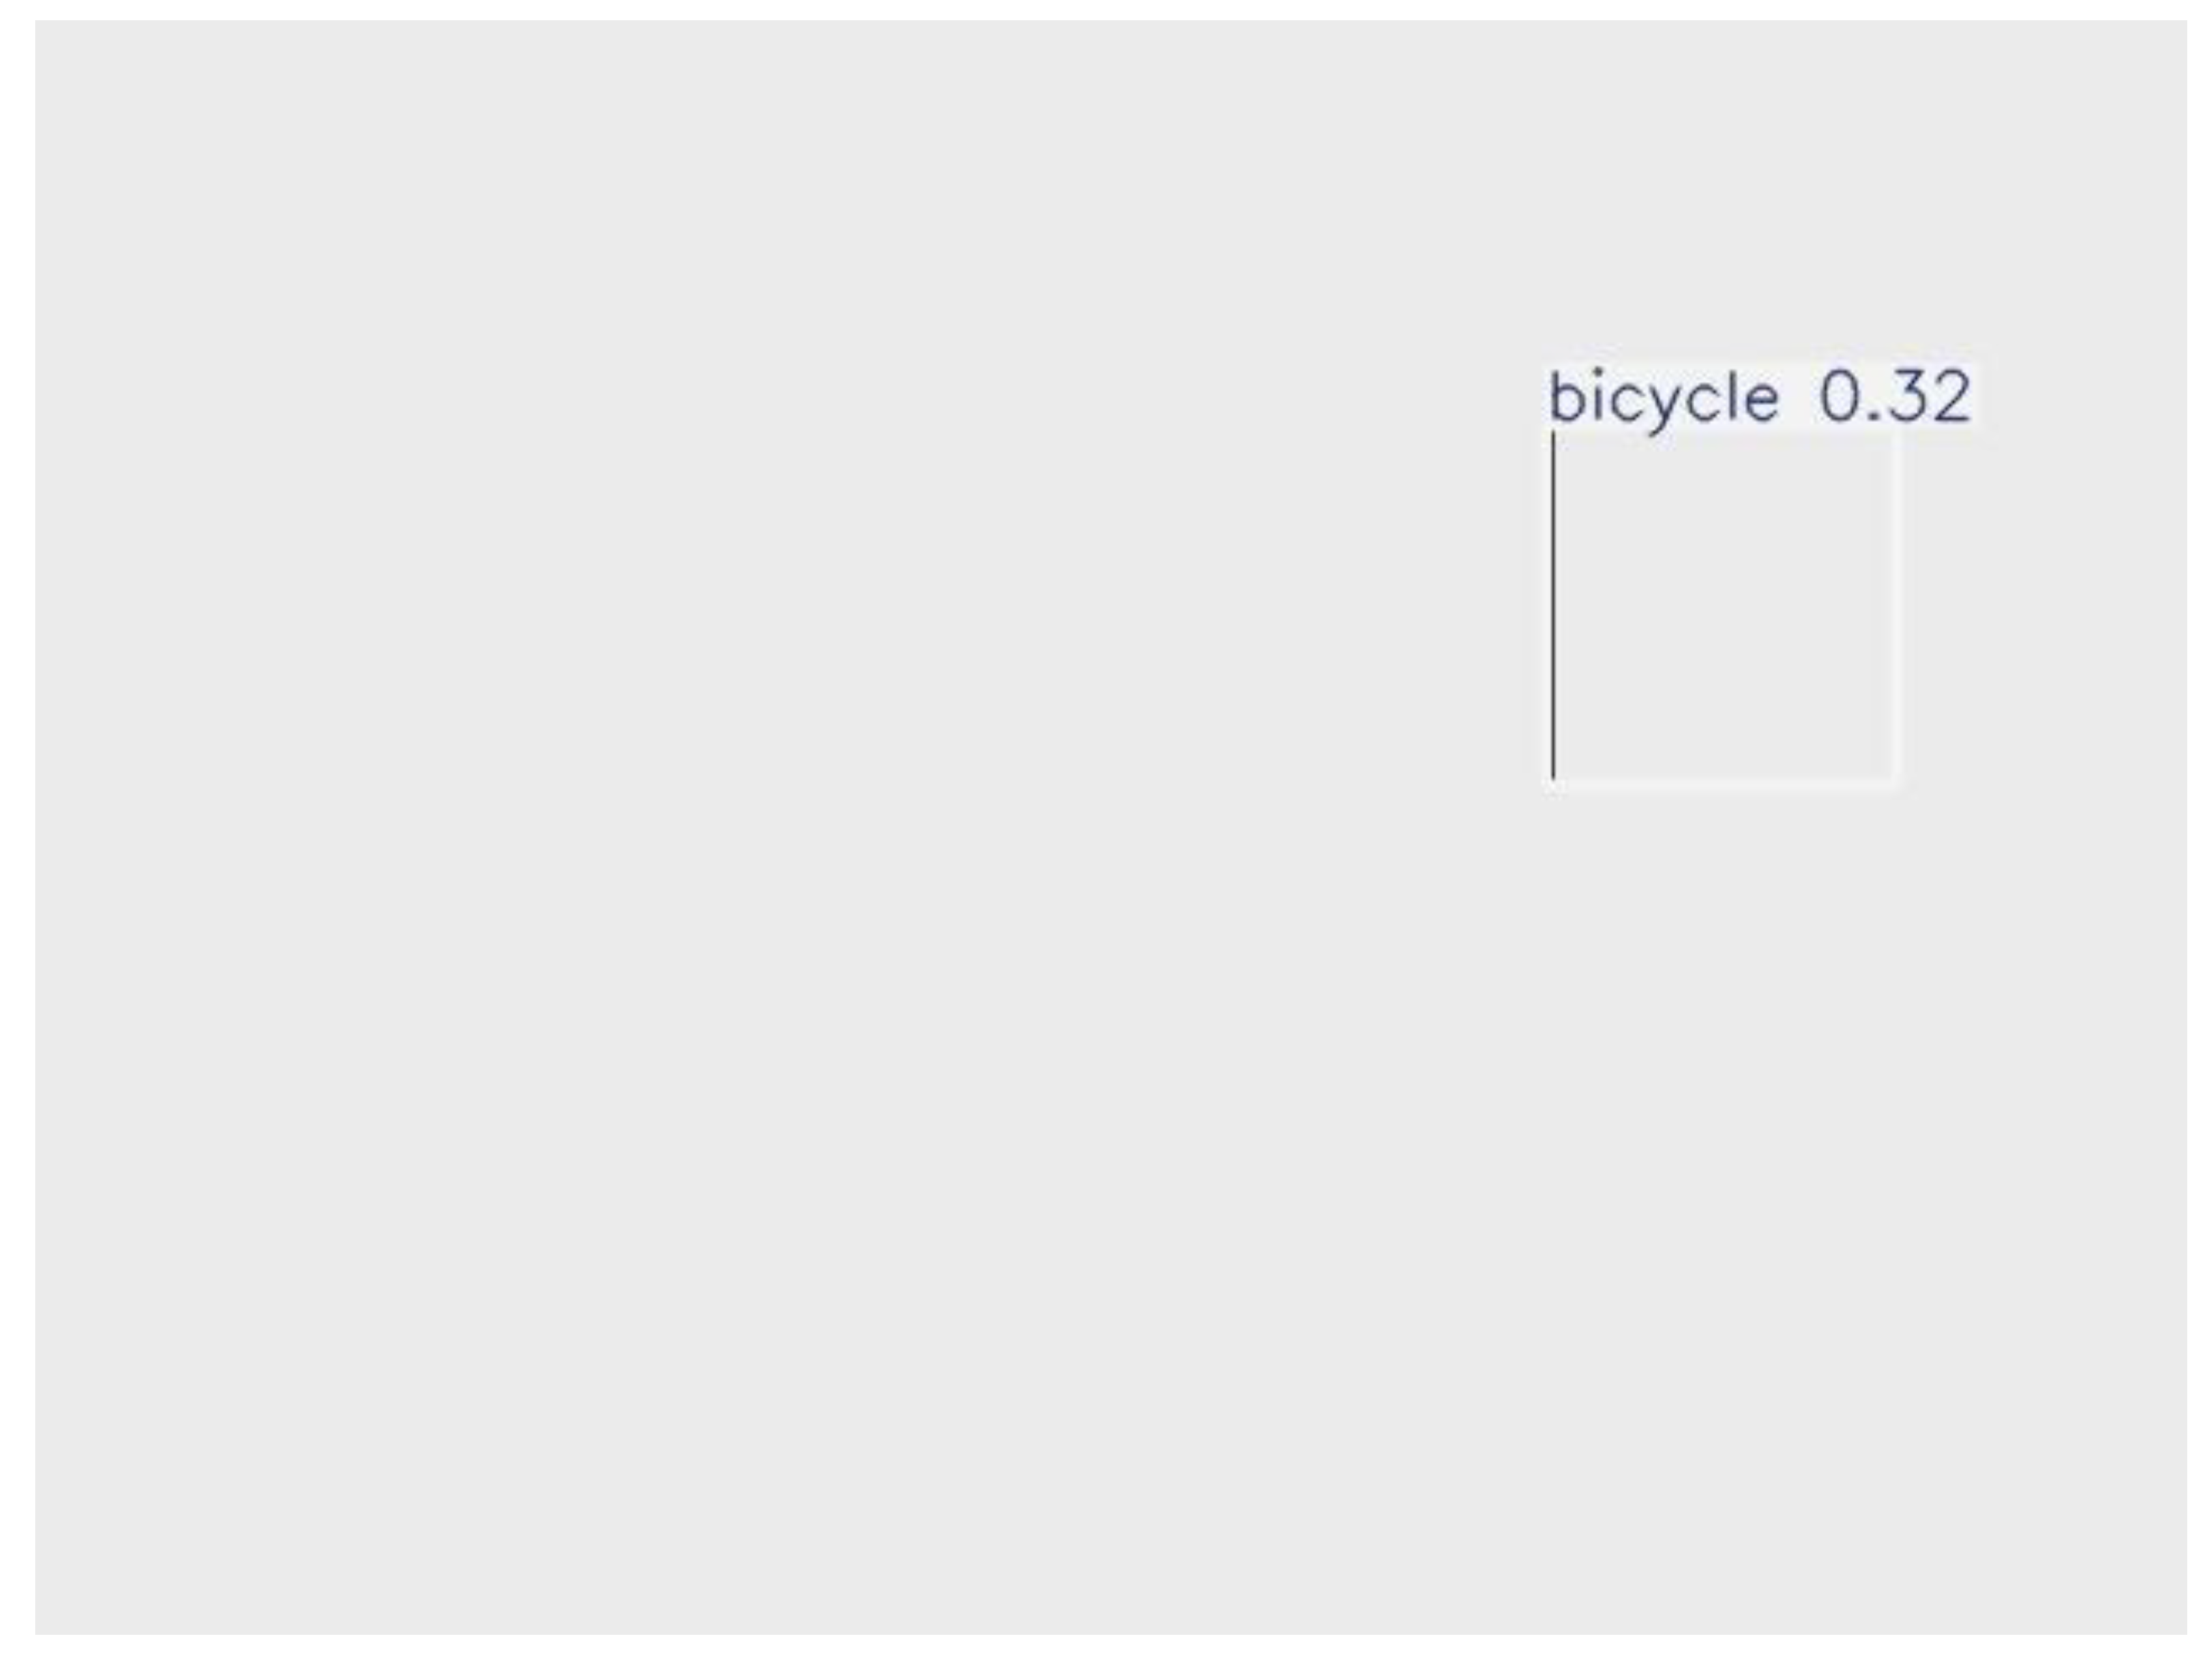
Figure 14.
Detection Output Sample 4.
Figure 15.
Detection Output Sample 5.
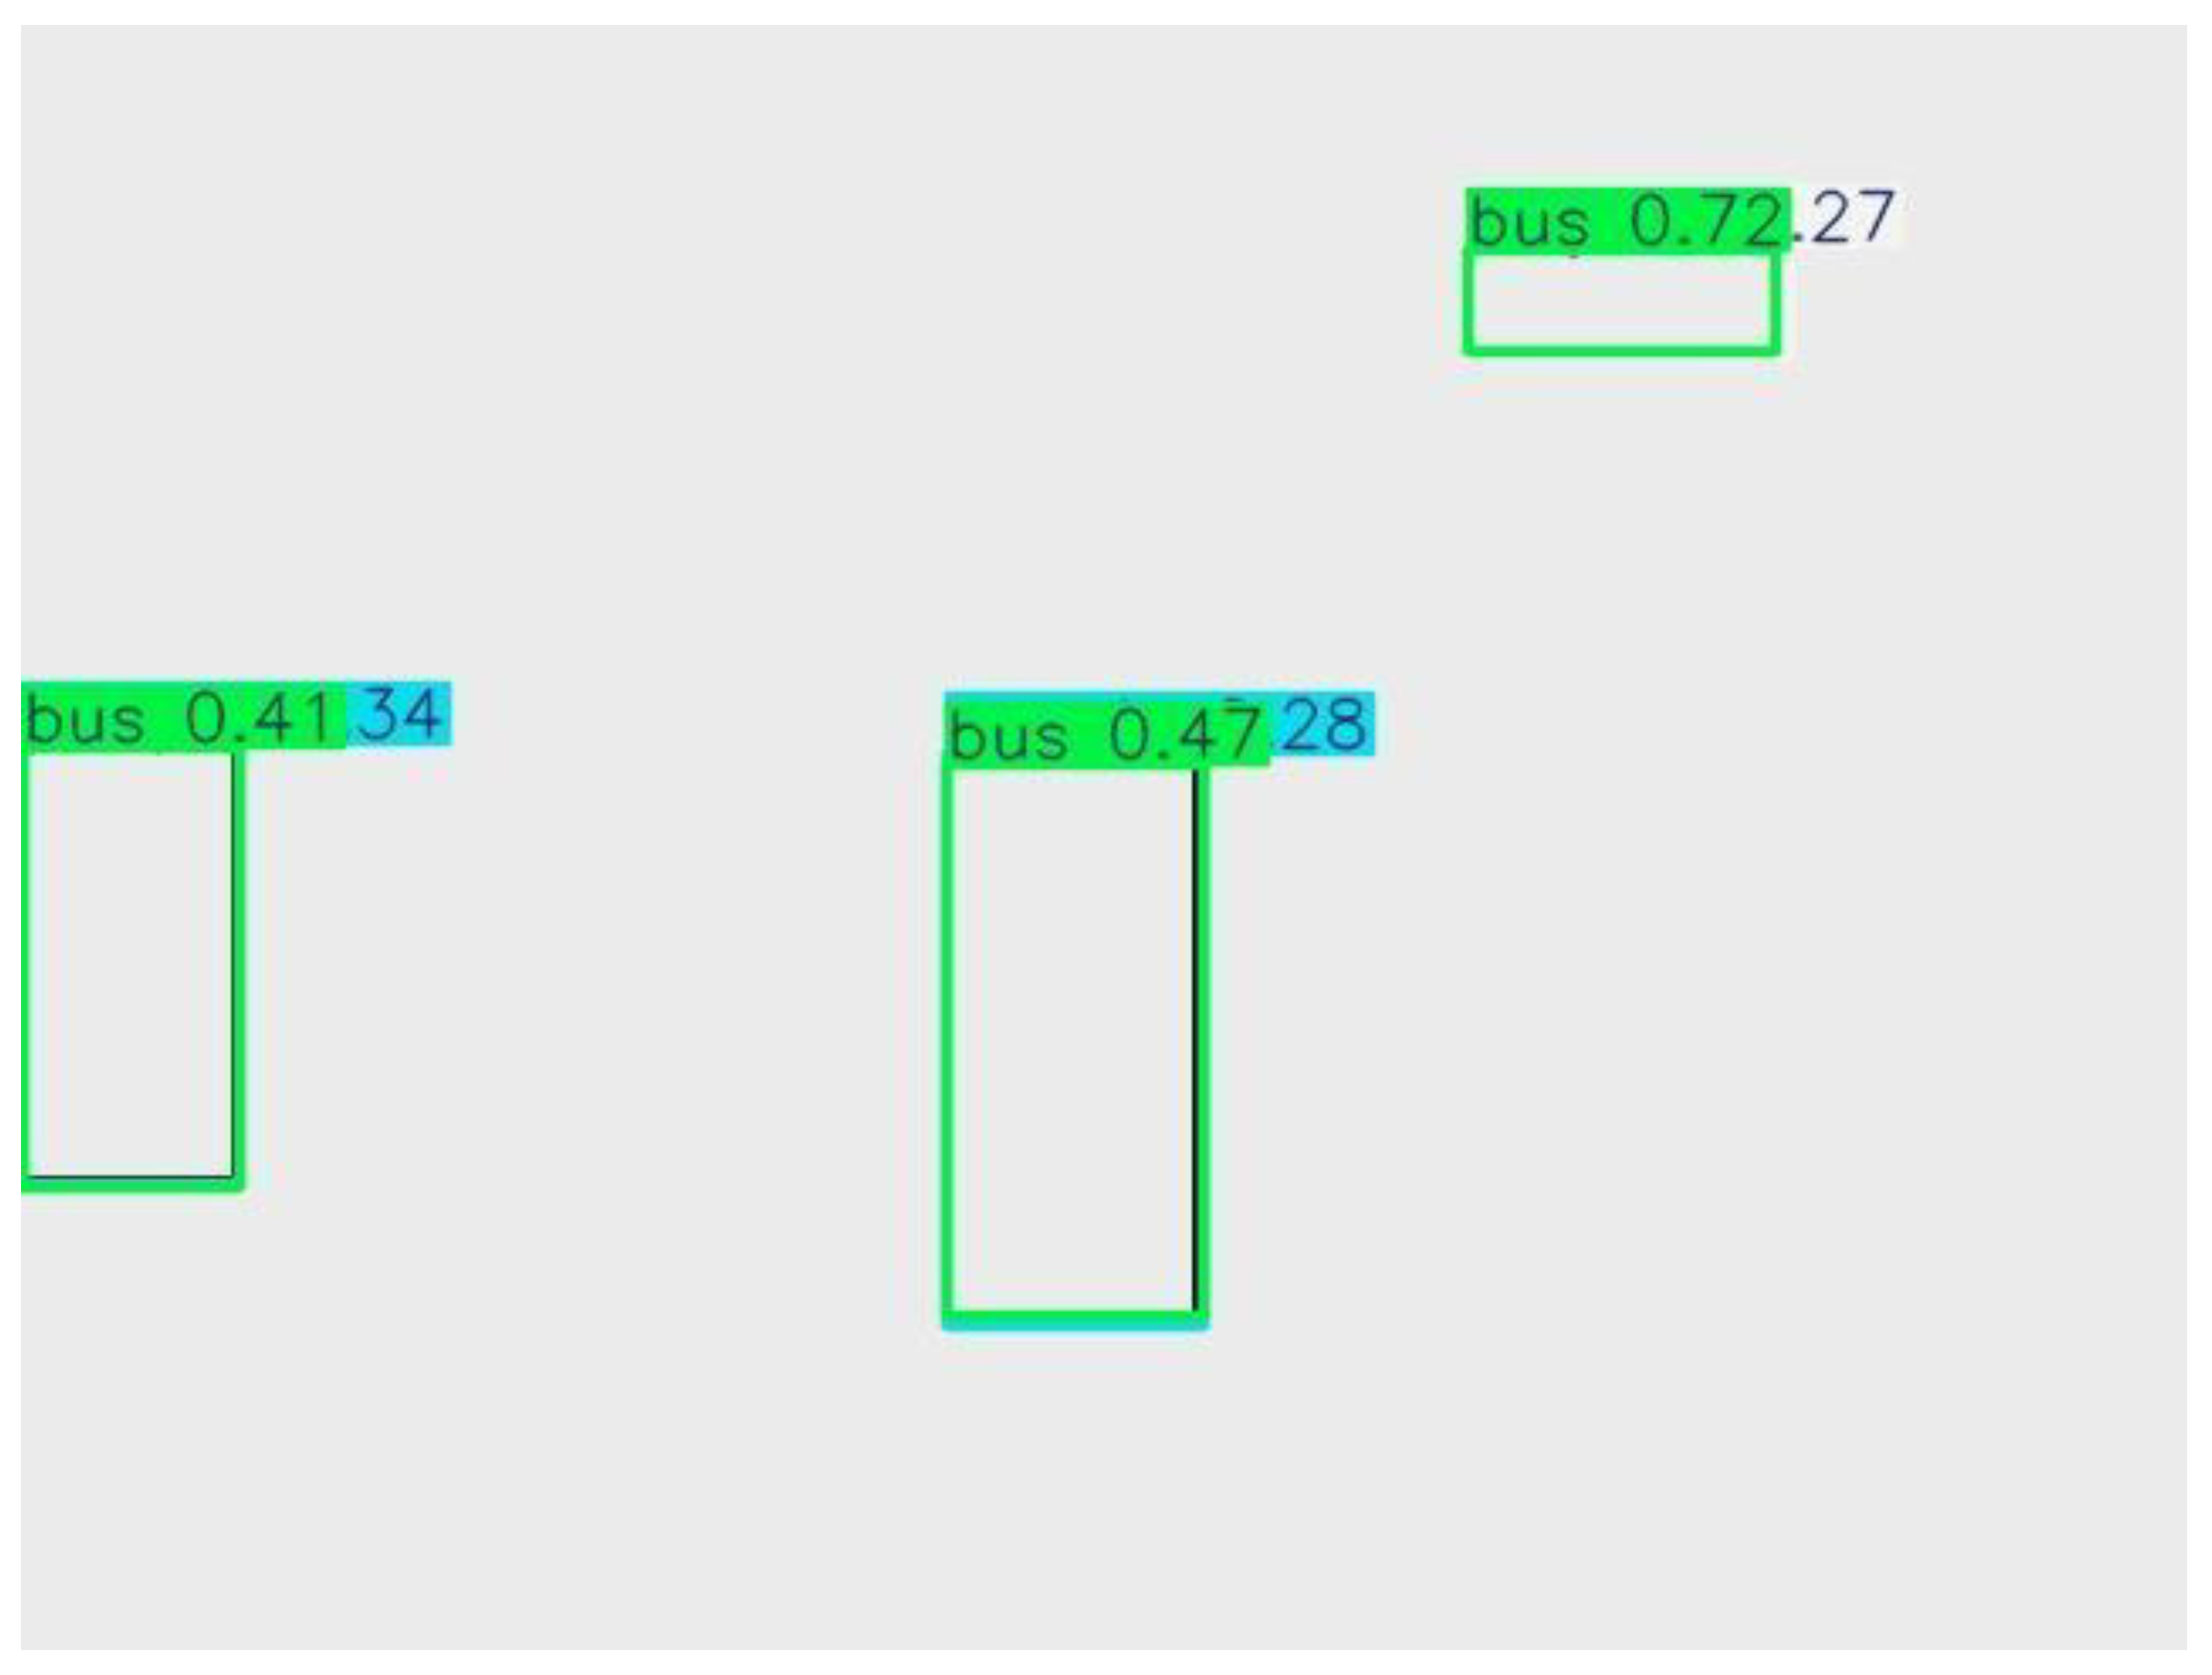
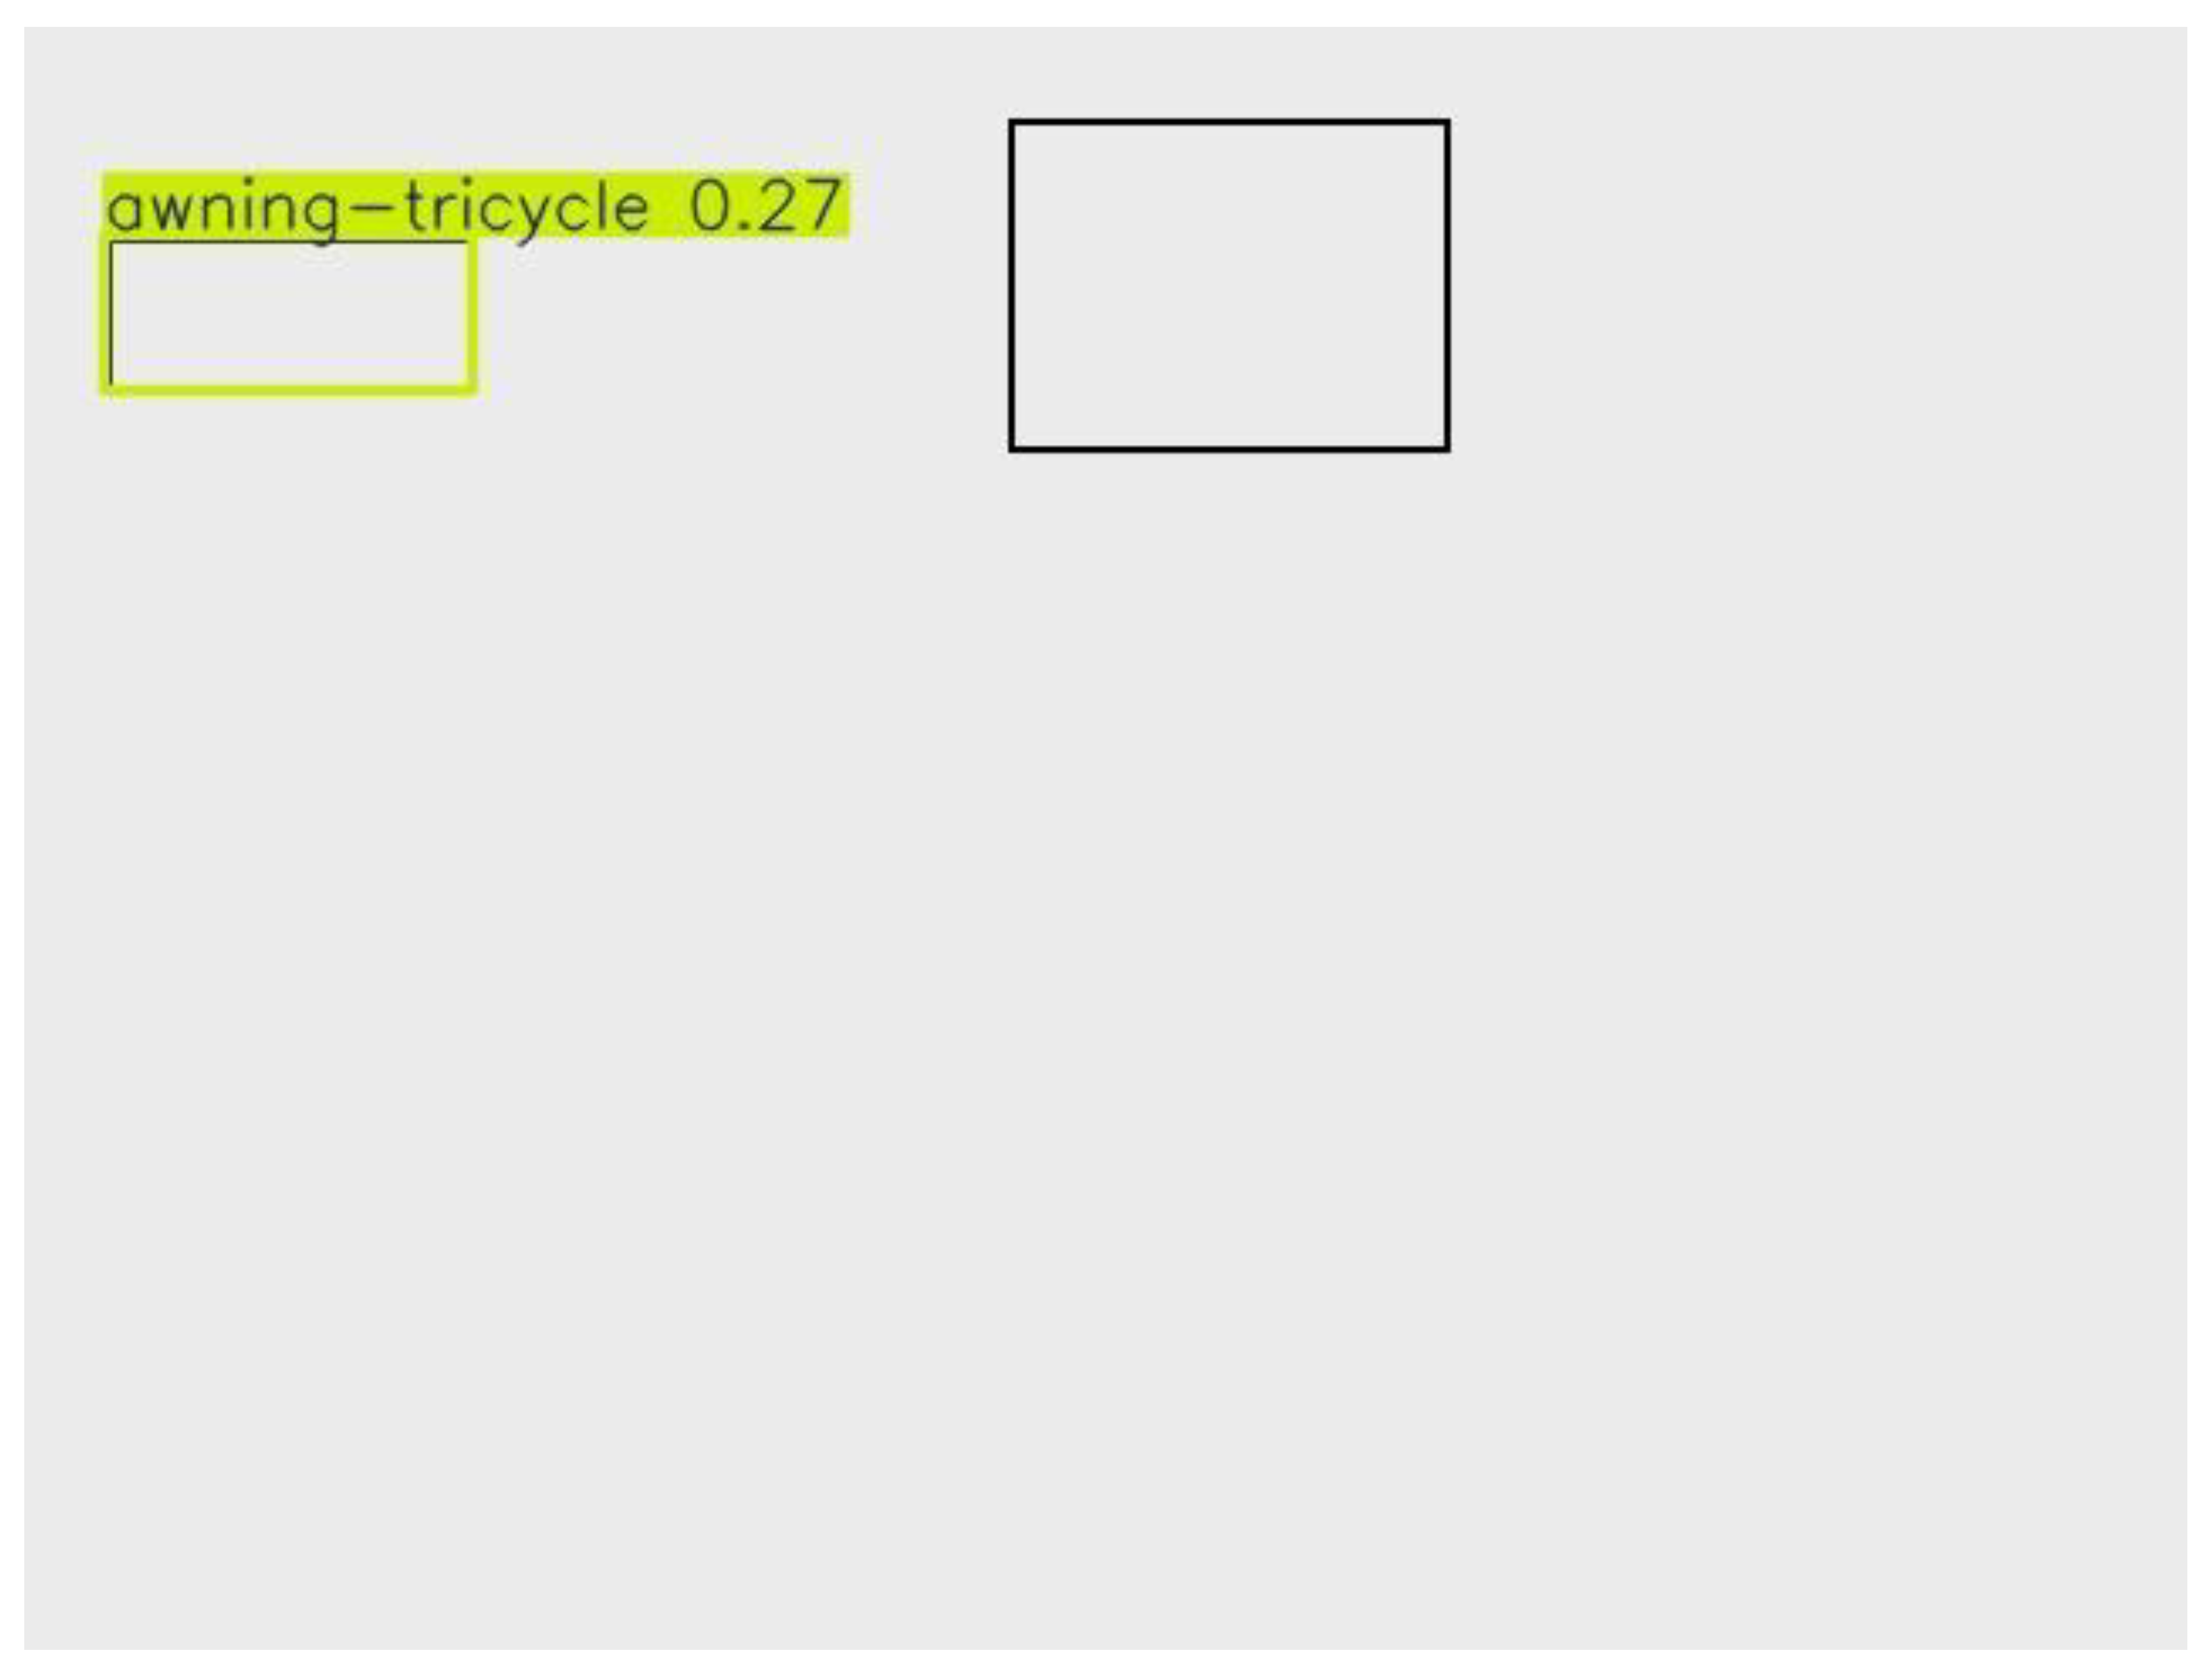
Figure 17.
Detection Output Sample 7.
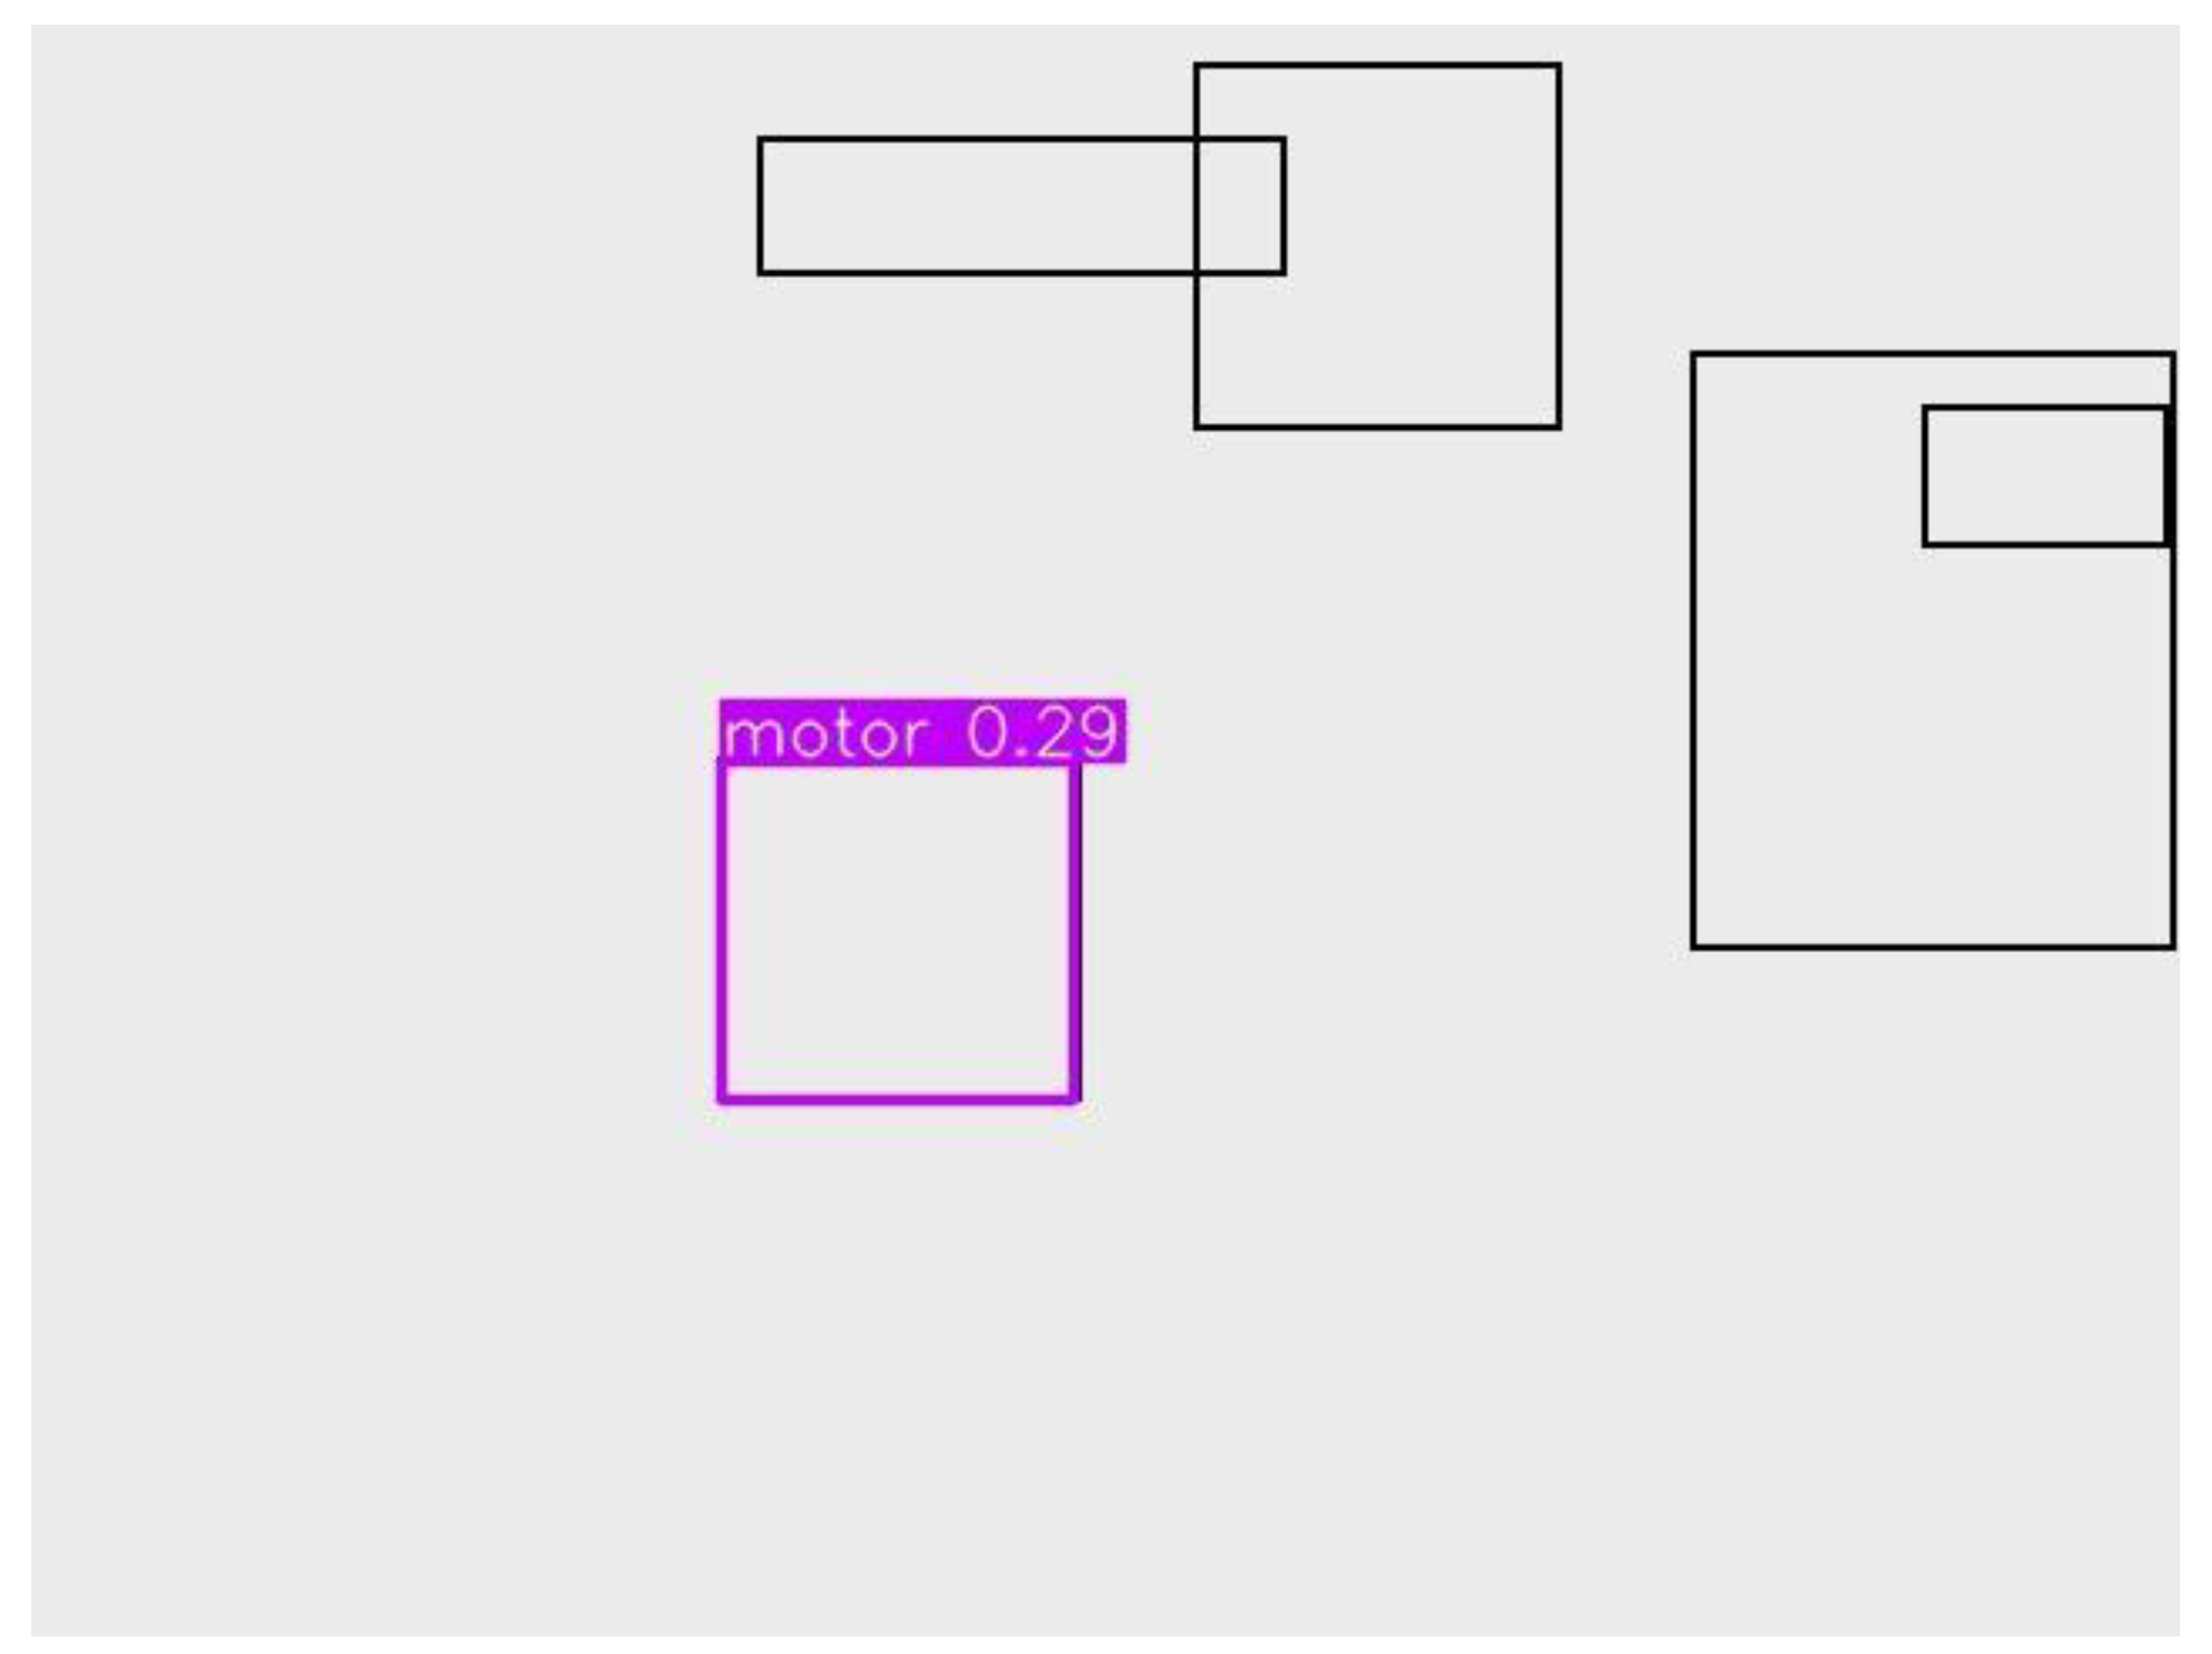
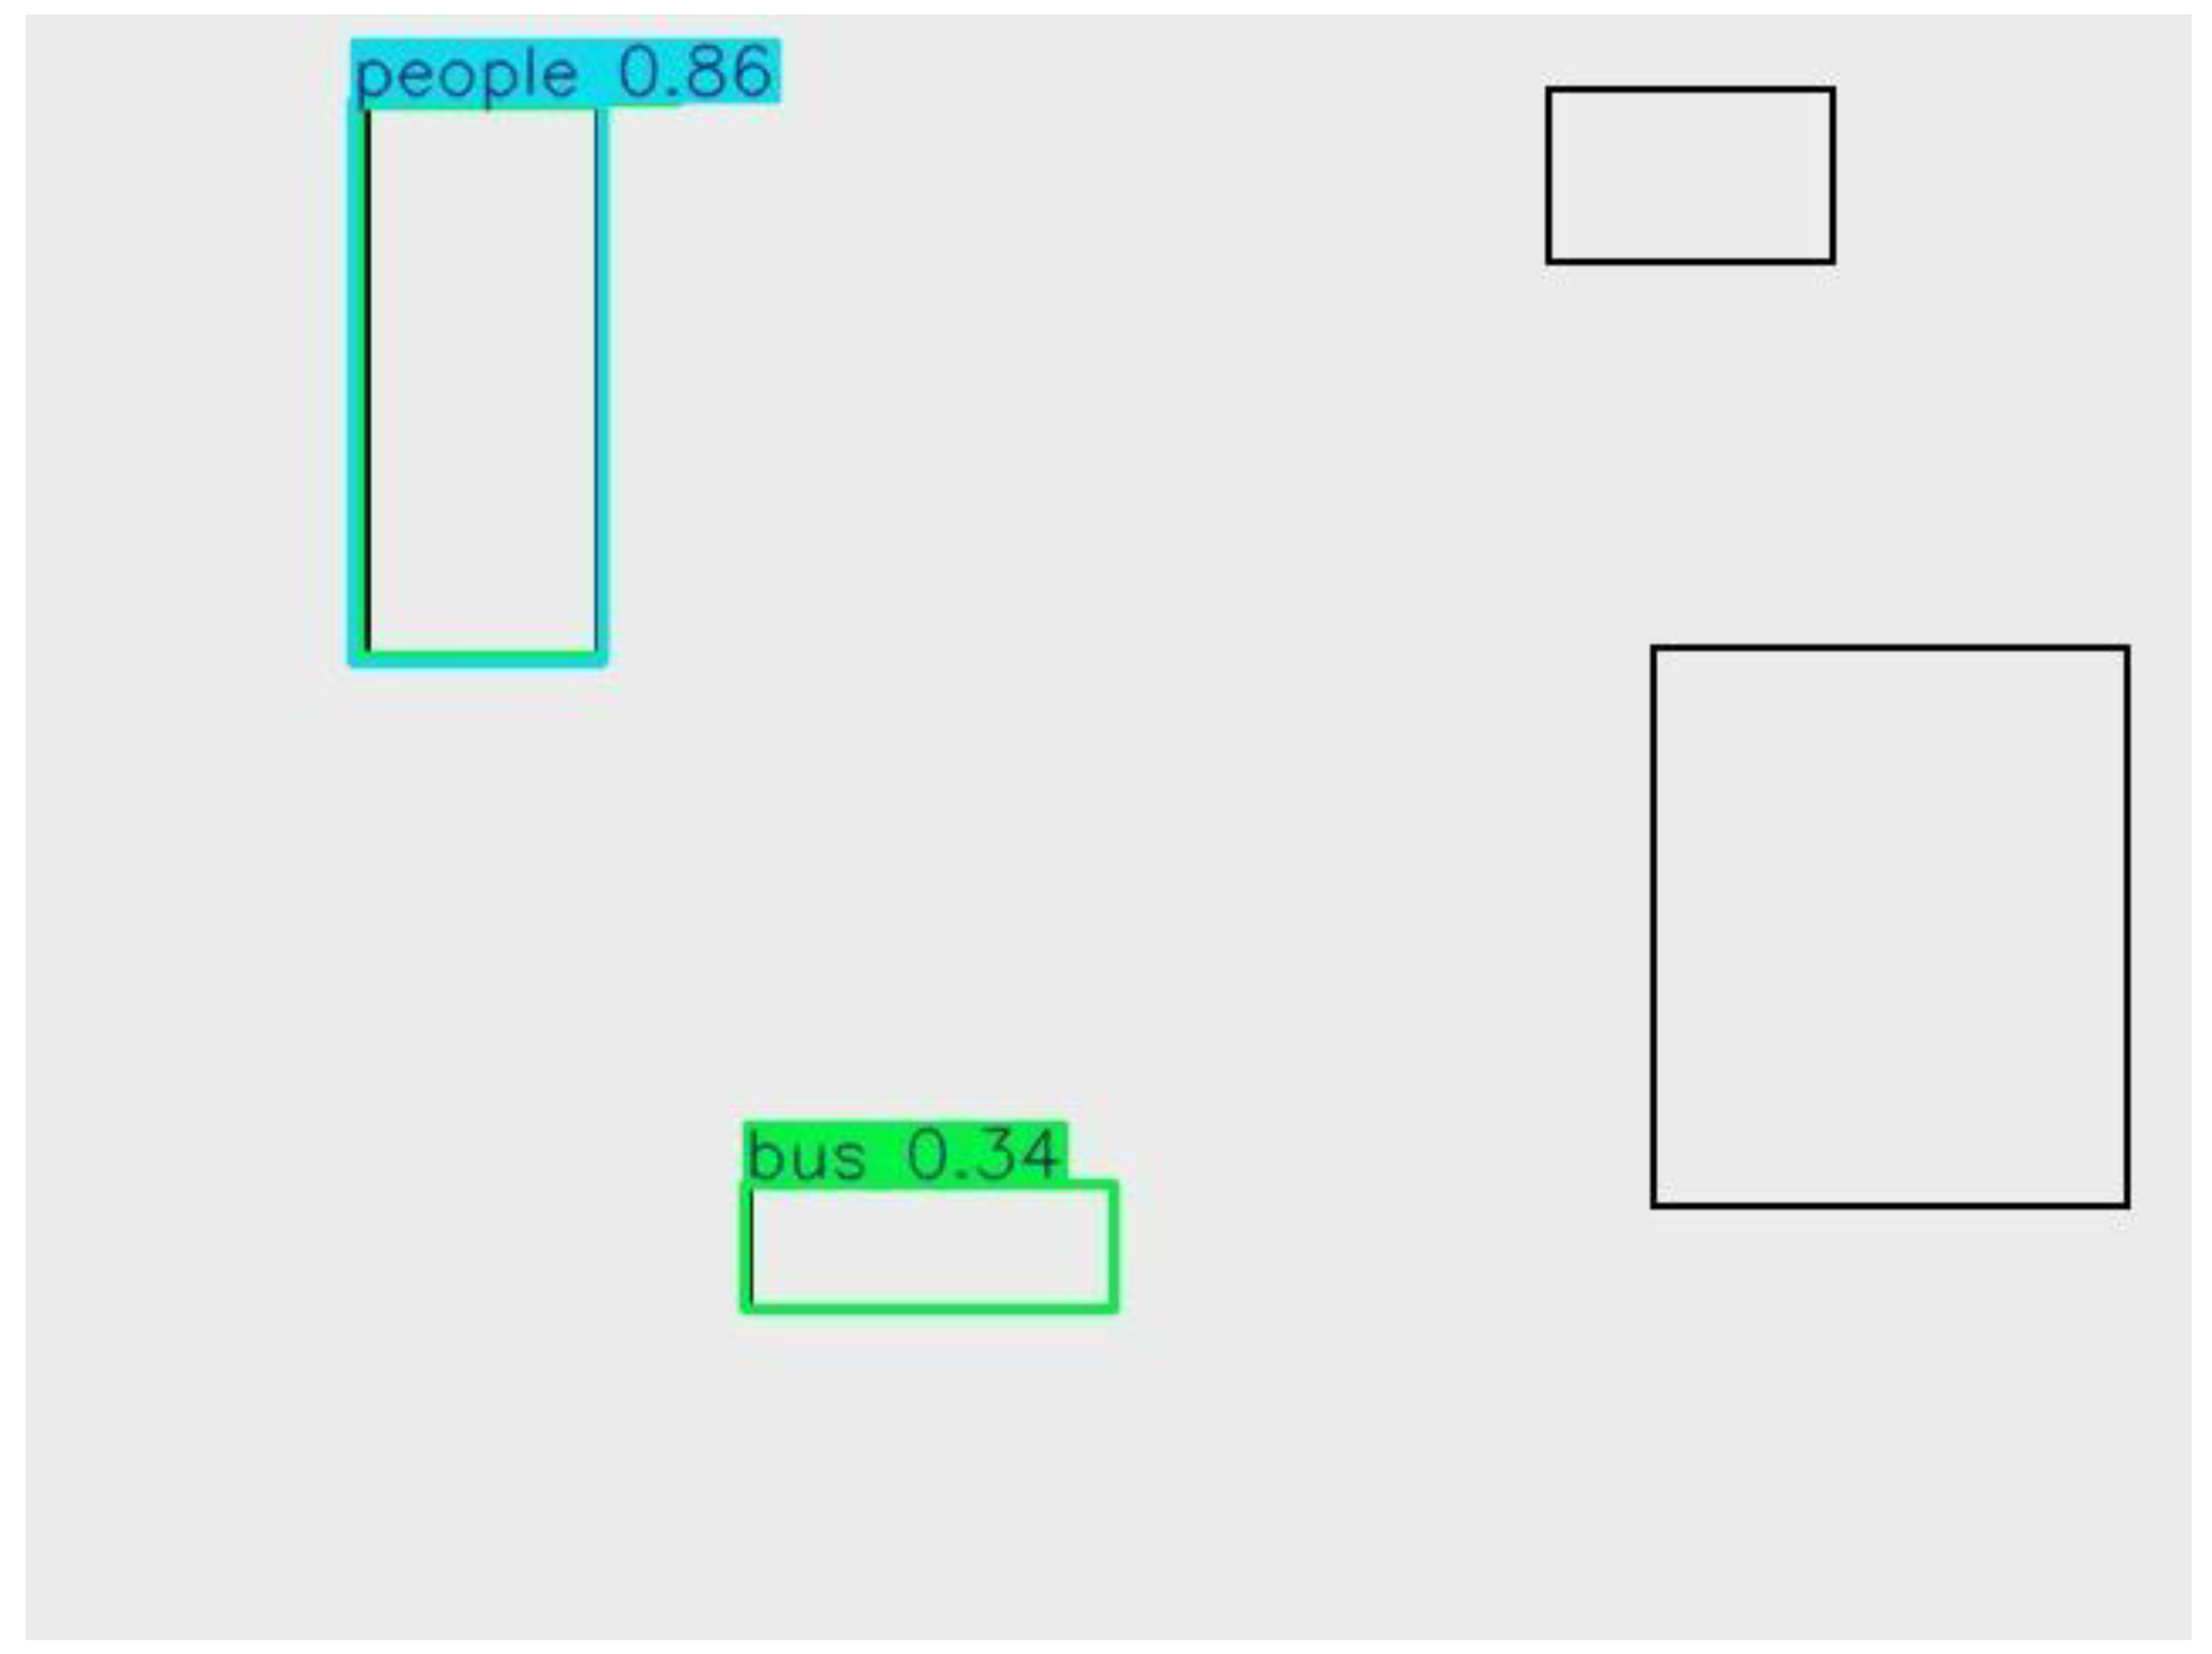
Figure 19.
Detection Output Sample 9.
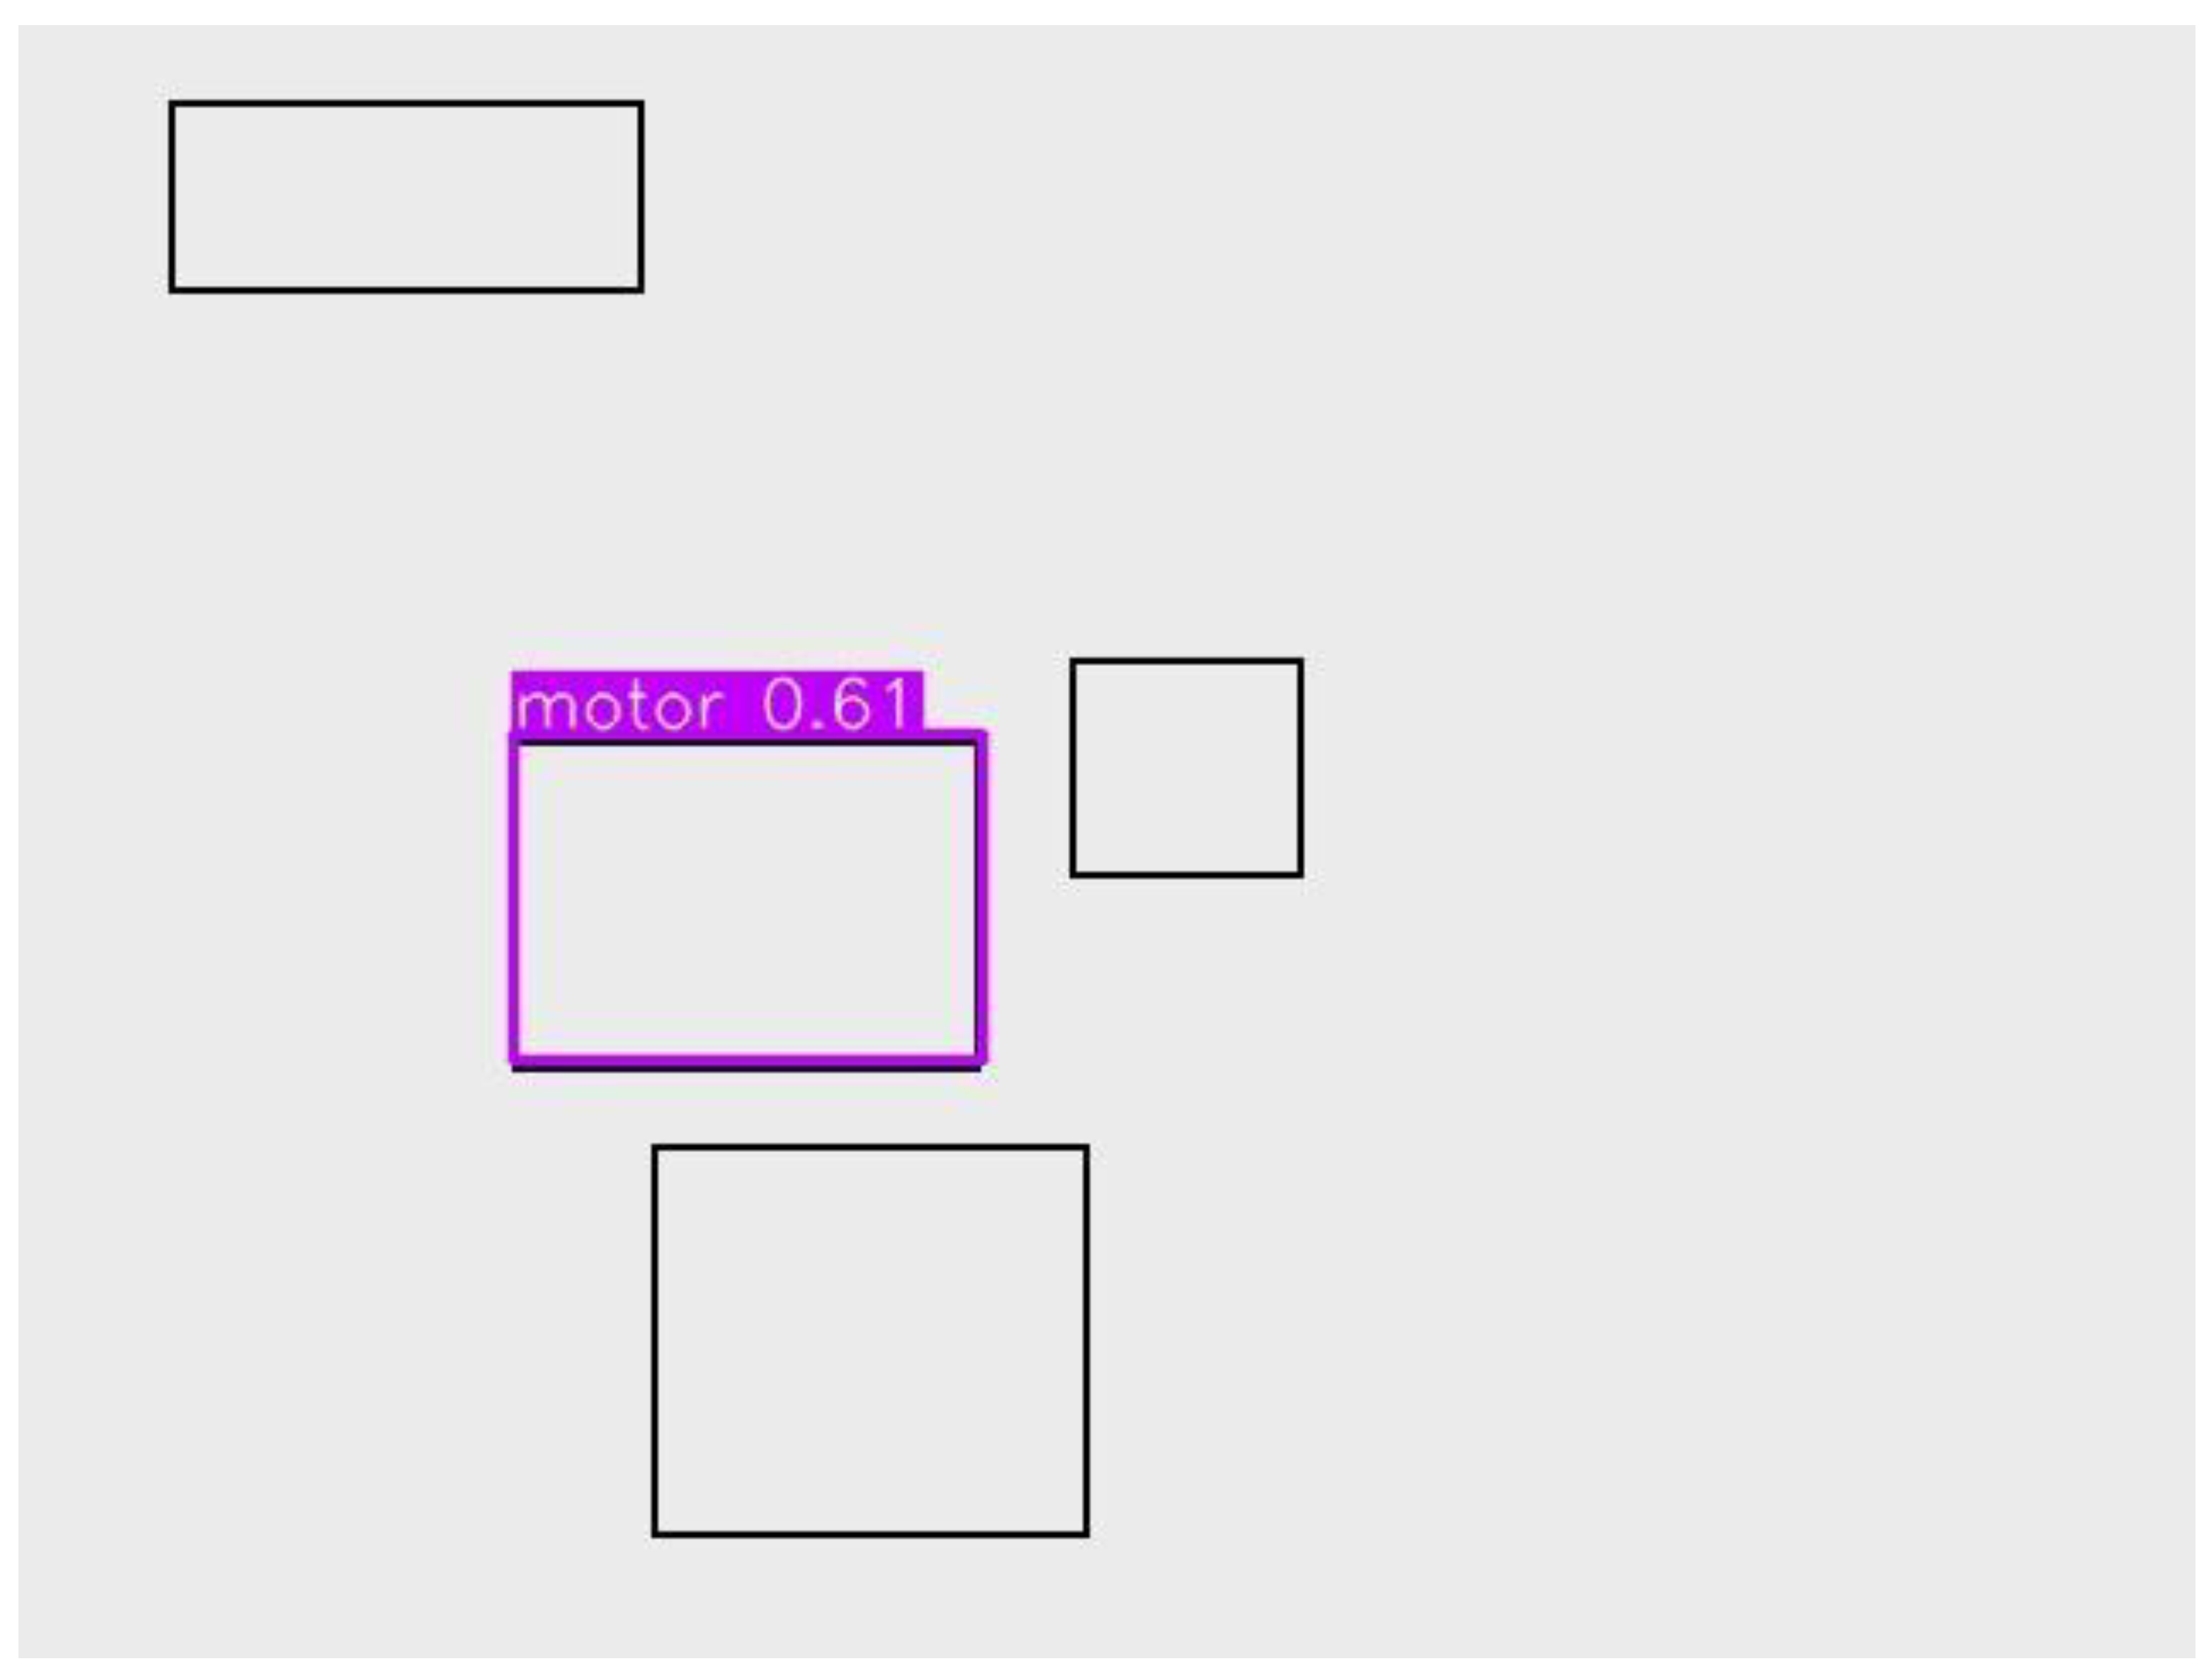
Figure 20.
Detection Output Sample 10.
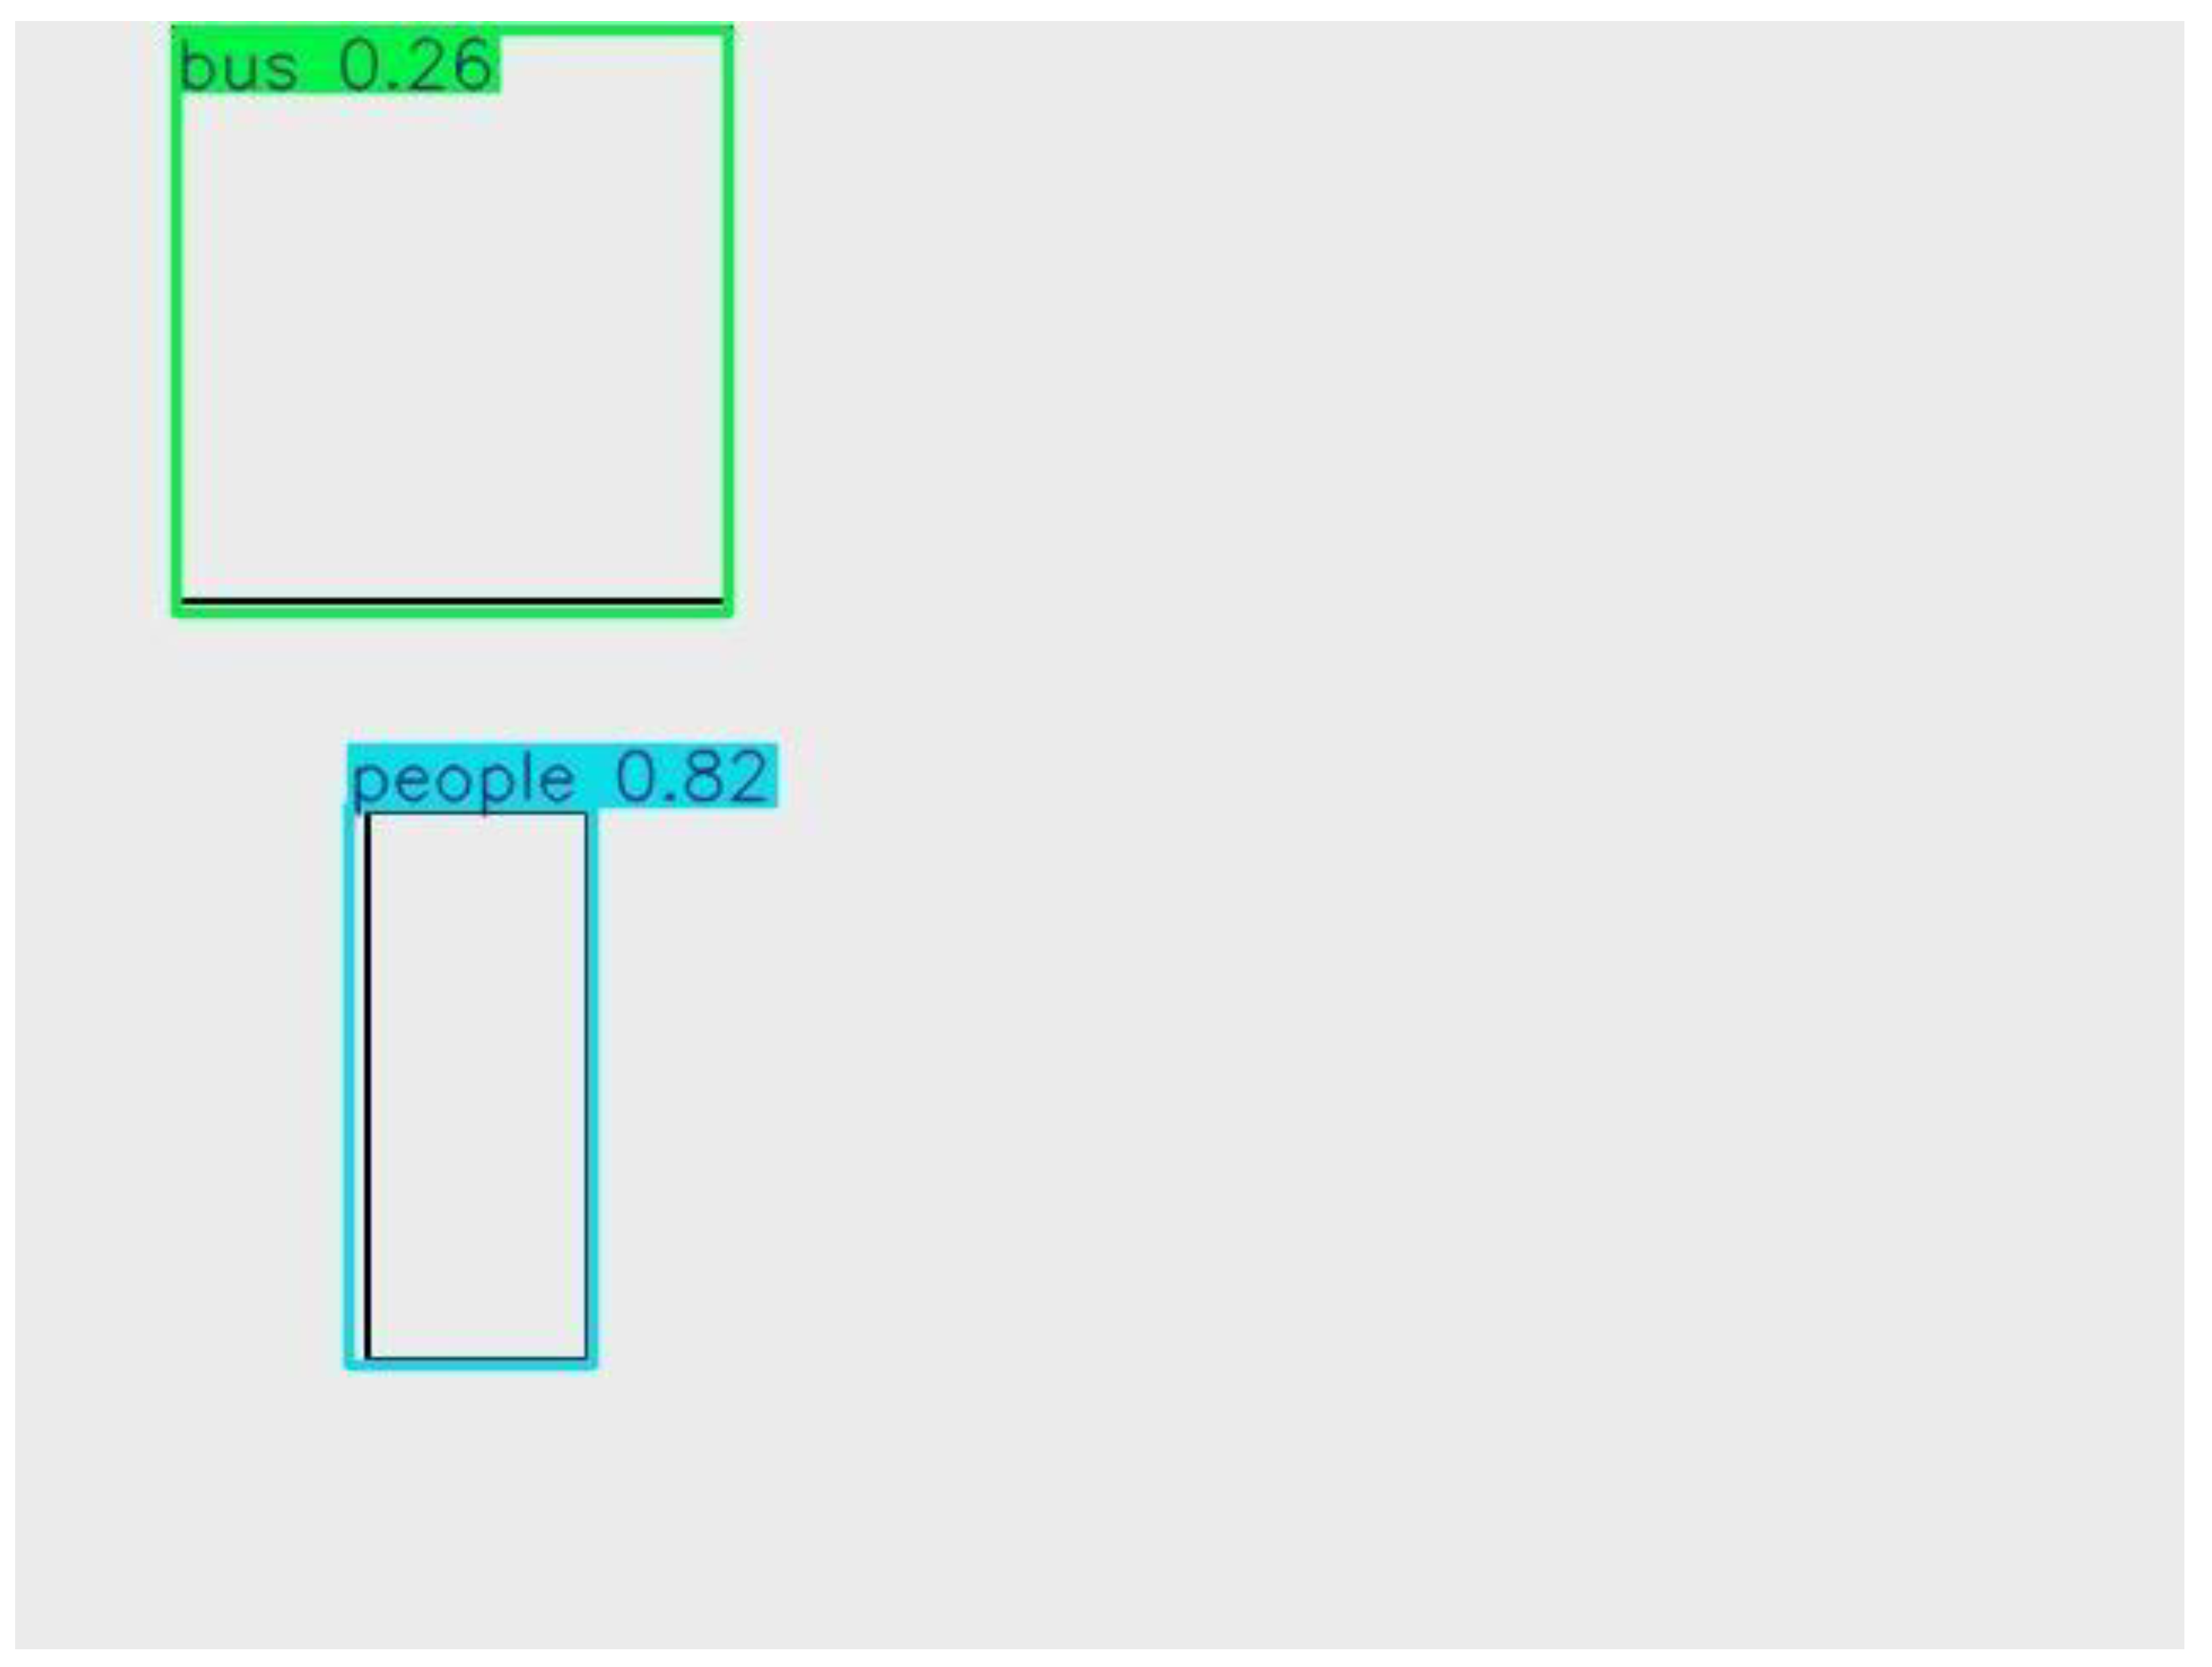
Figure 21.
Training Curves (All Metrics).
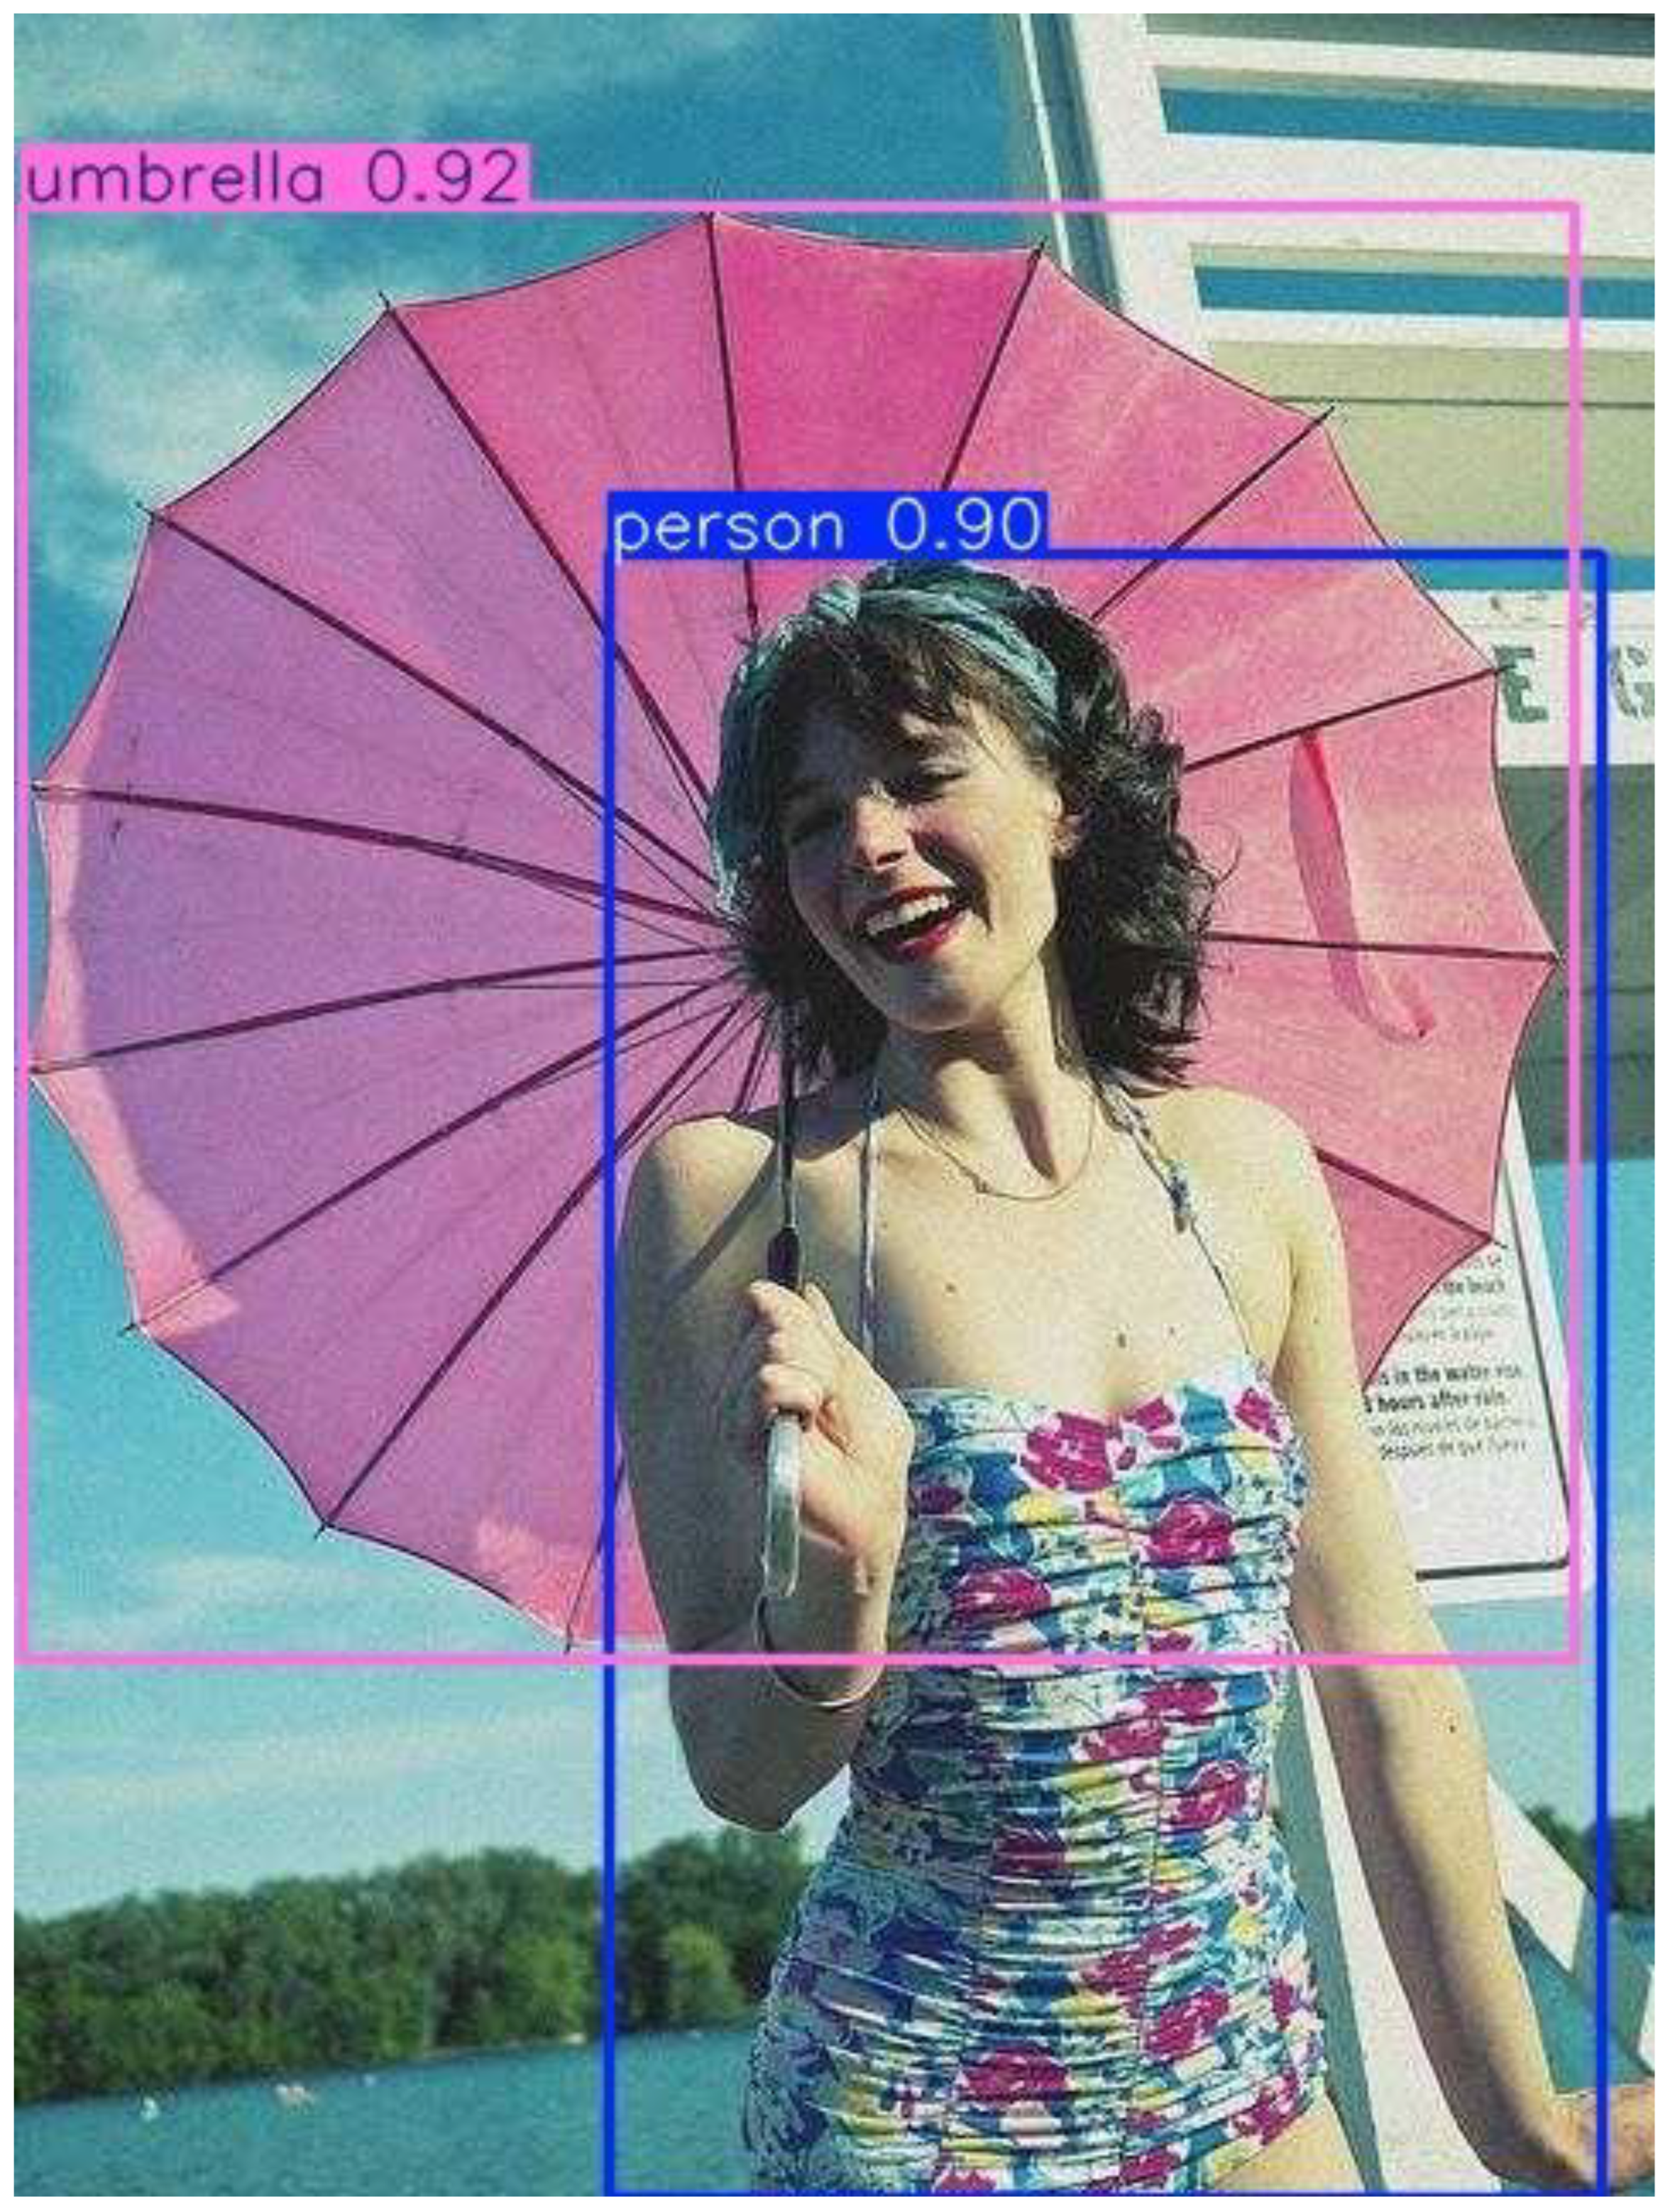
Figure 22.
Training Curves (All Metrics).
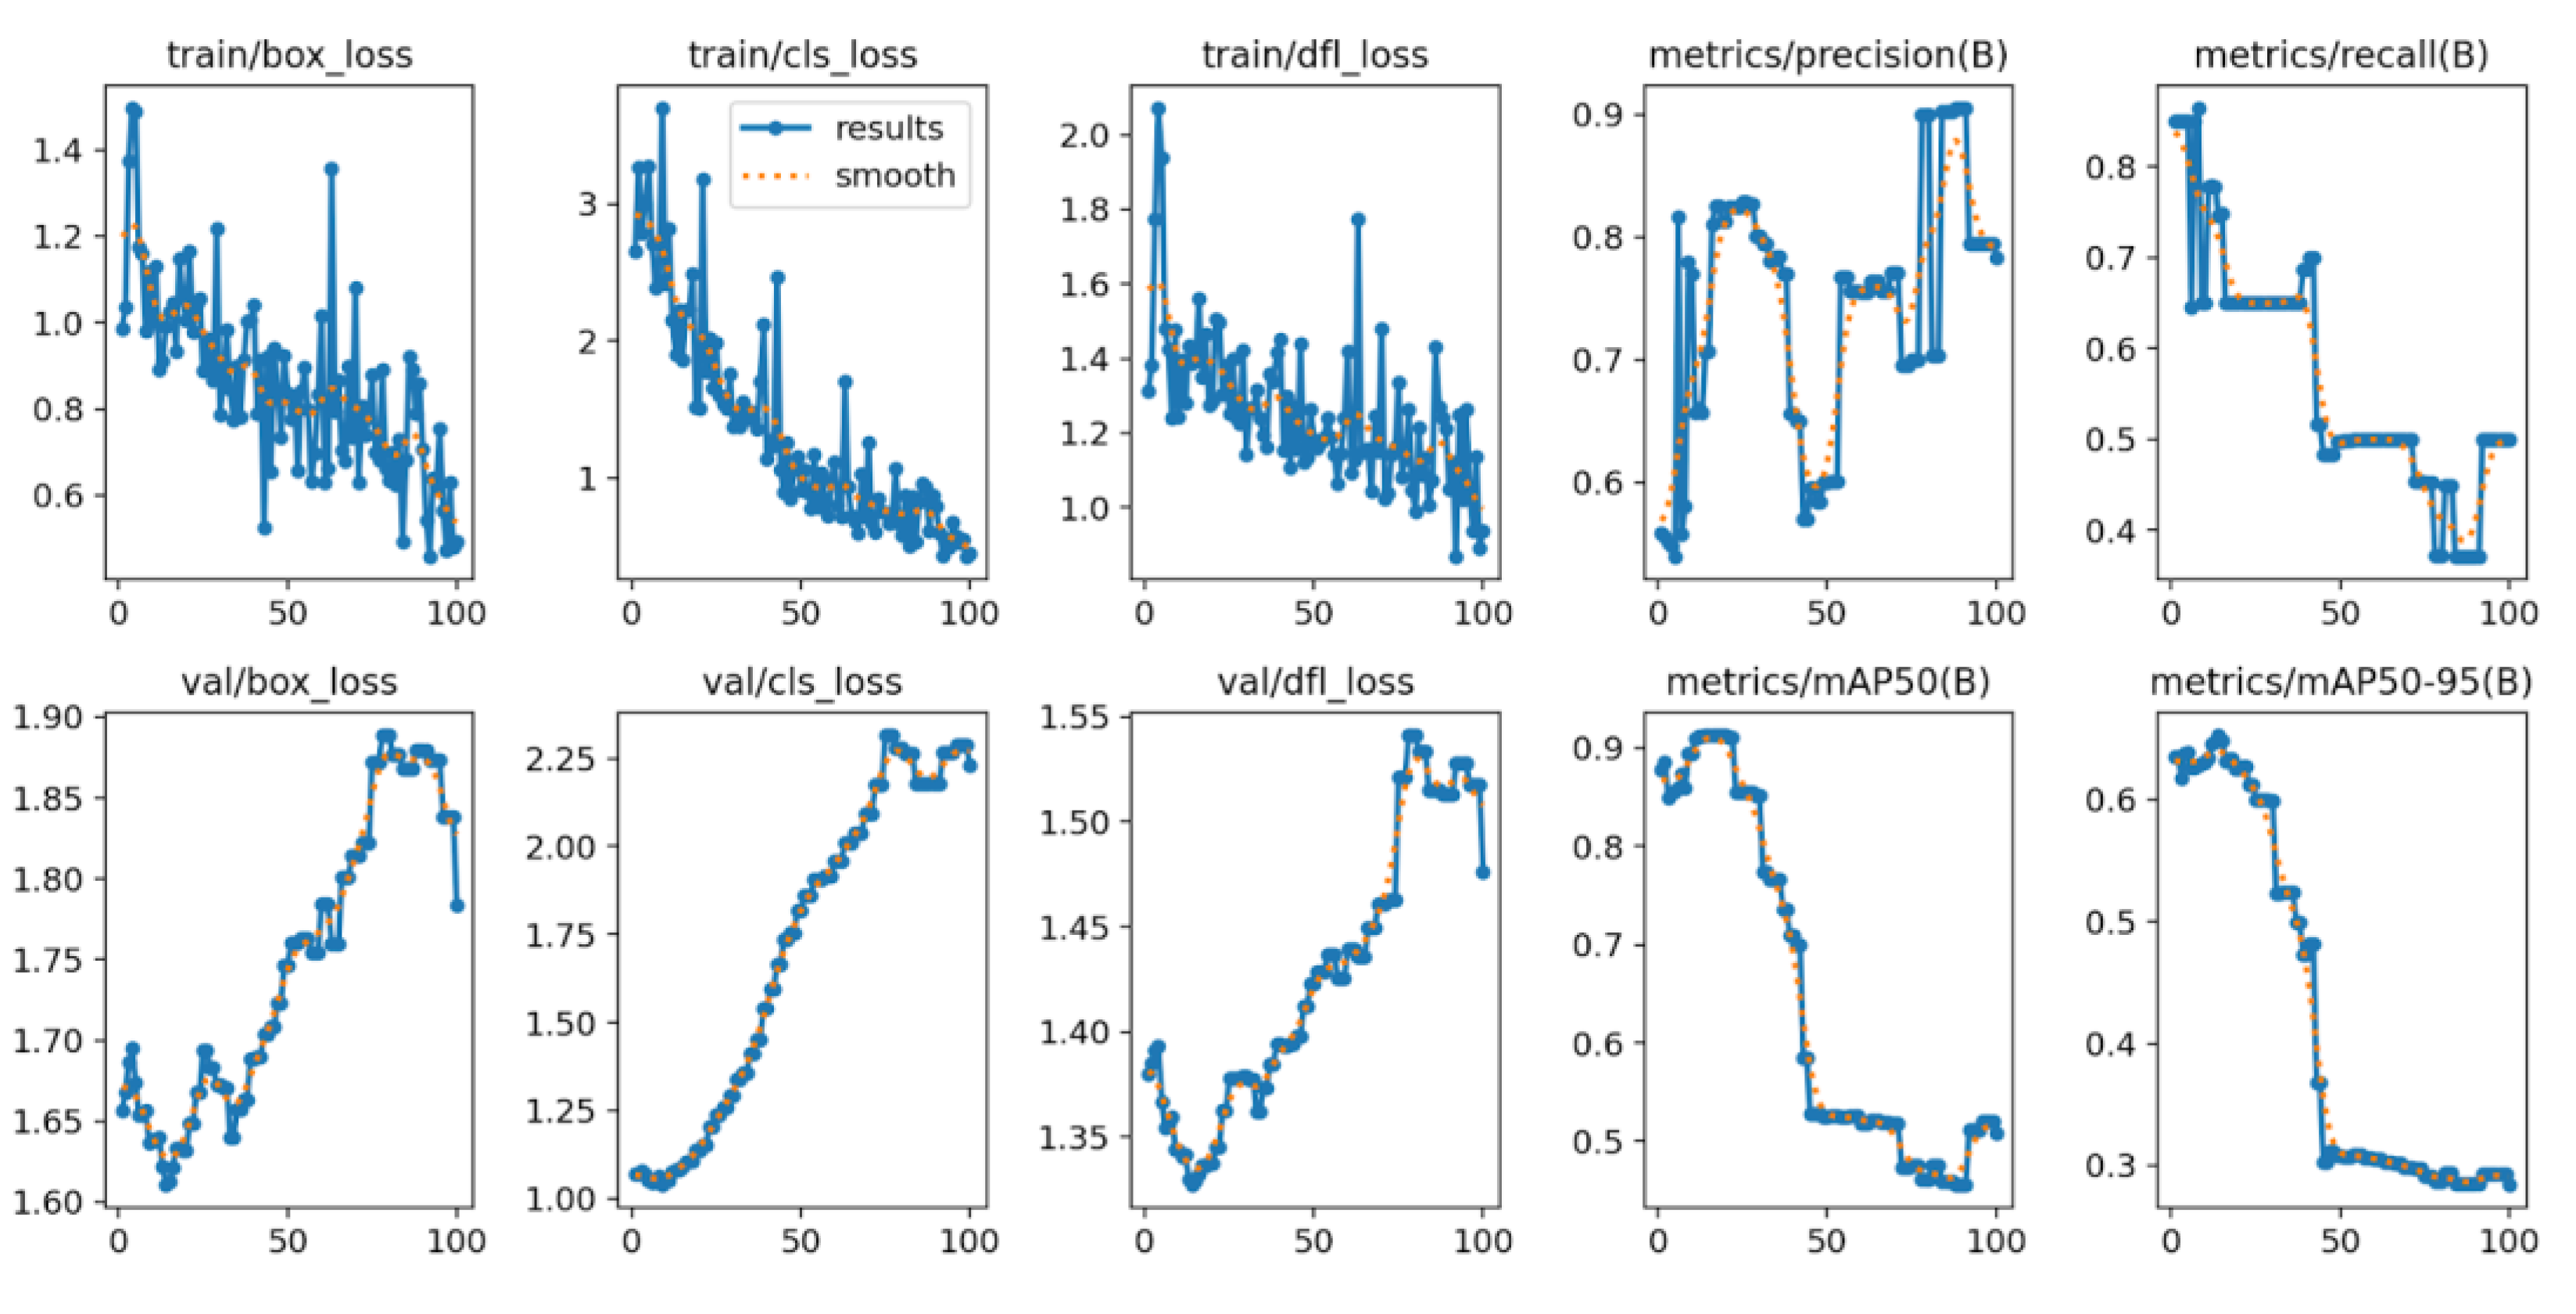
Figure 23.
Dataset Diagnostics (Distribution & Anchors).
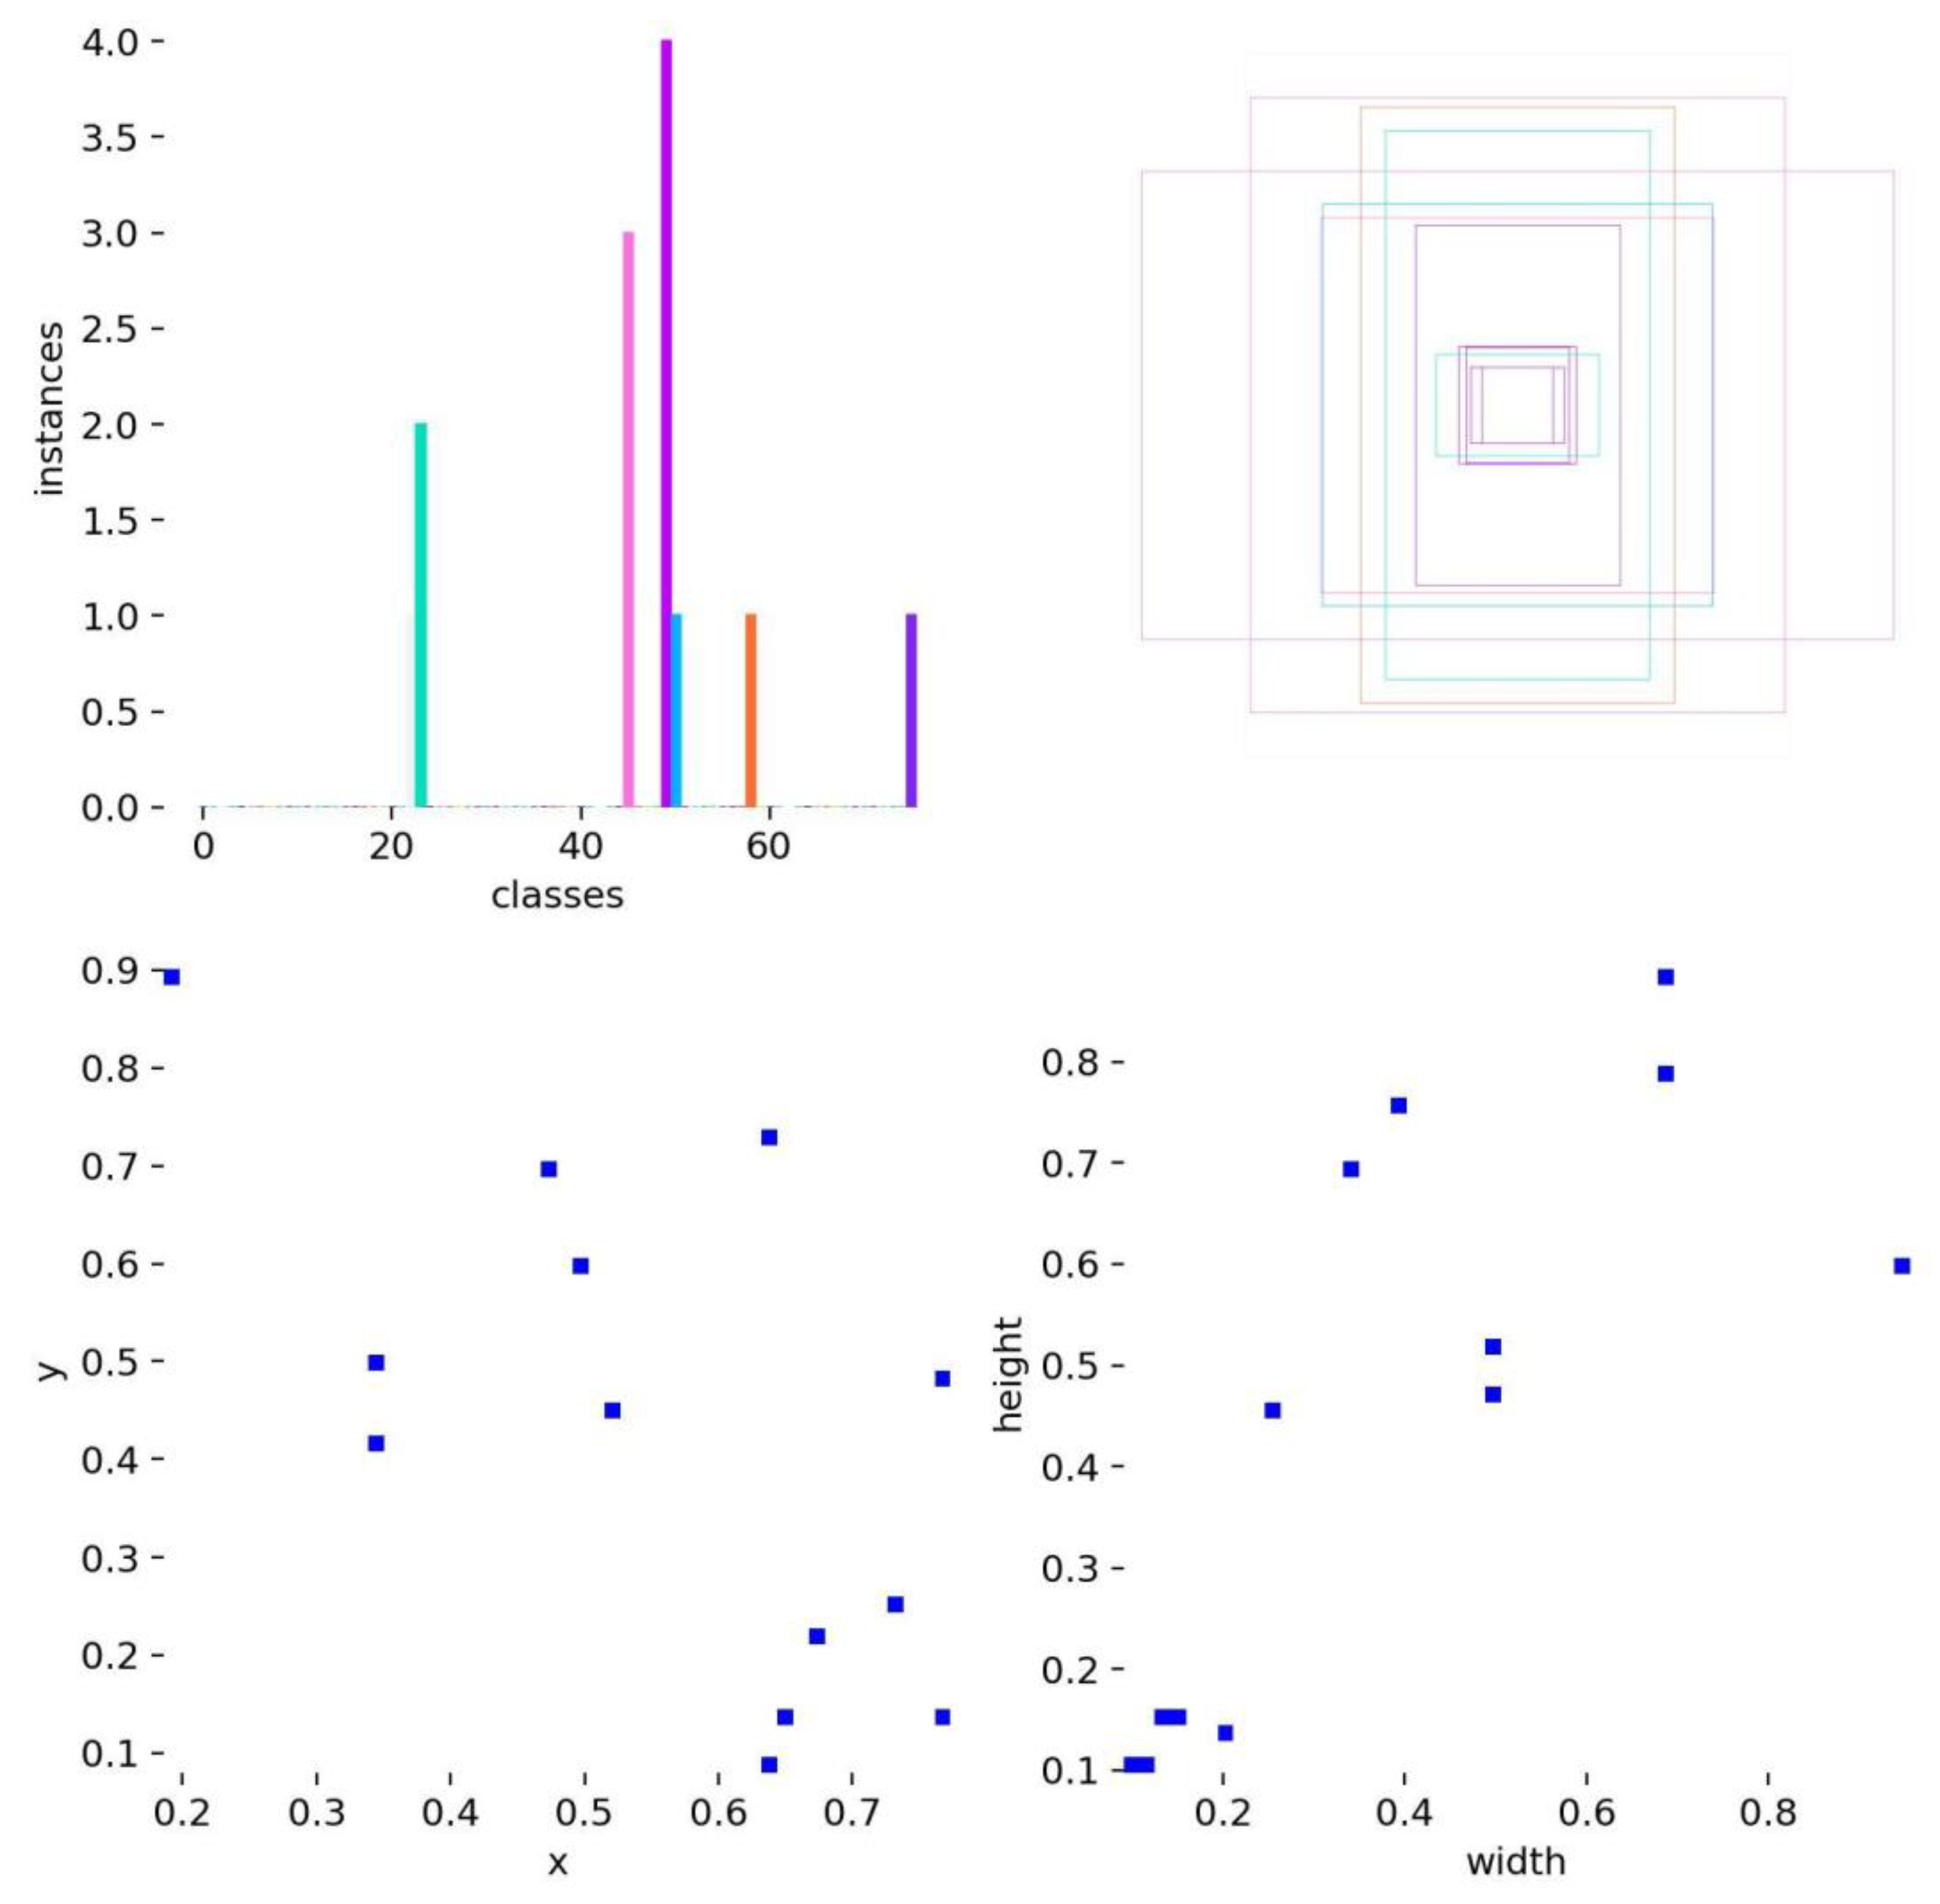
Figure 24.
Confusion Matrices.
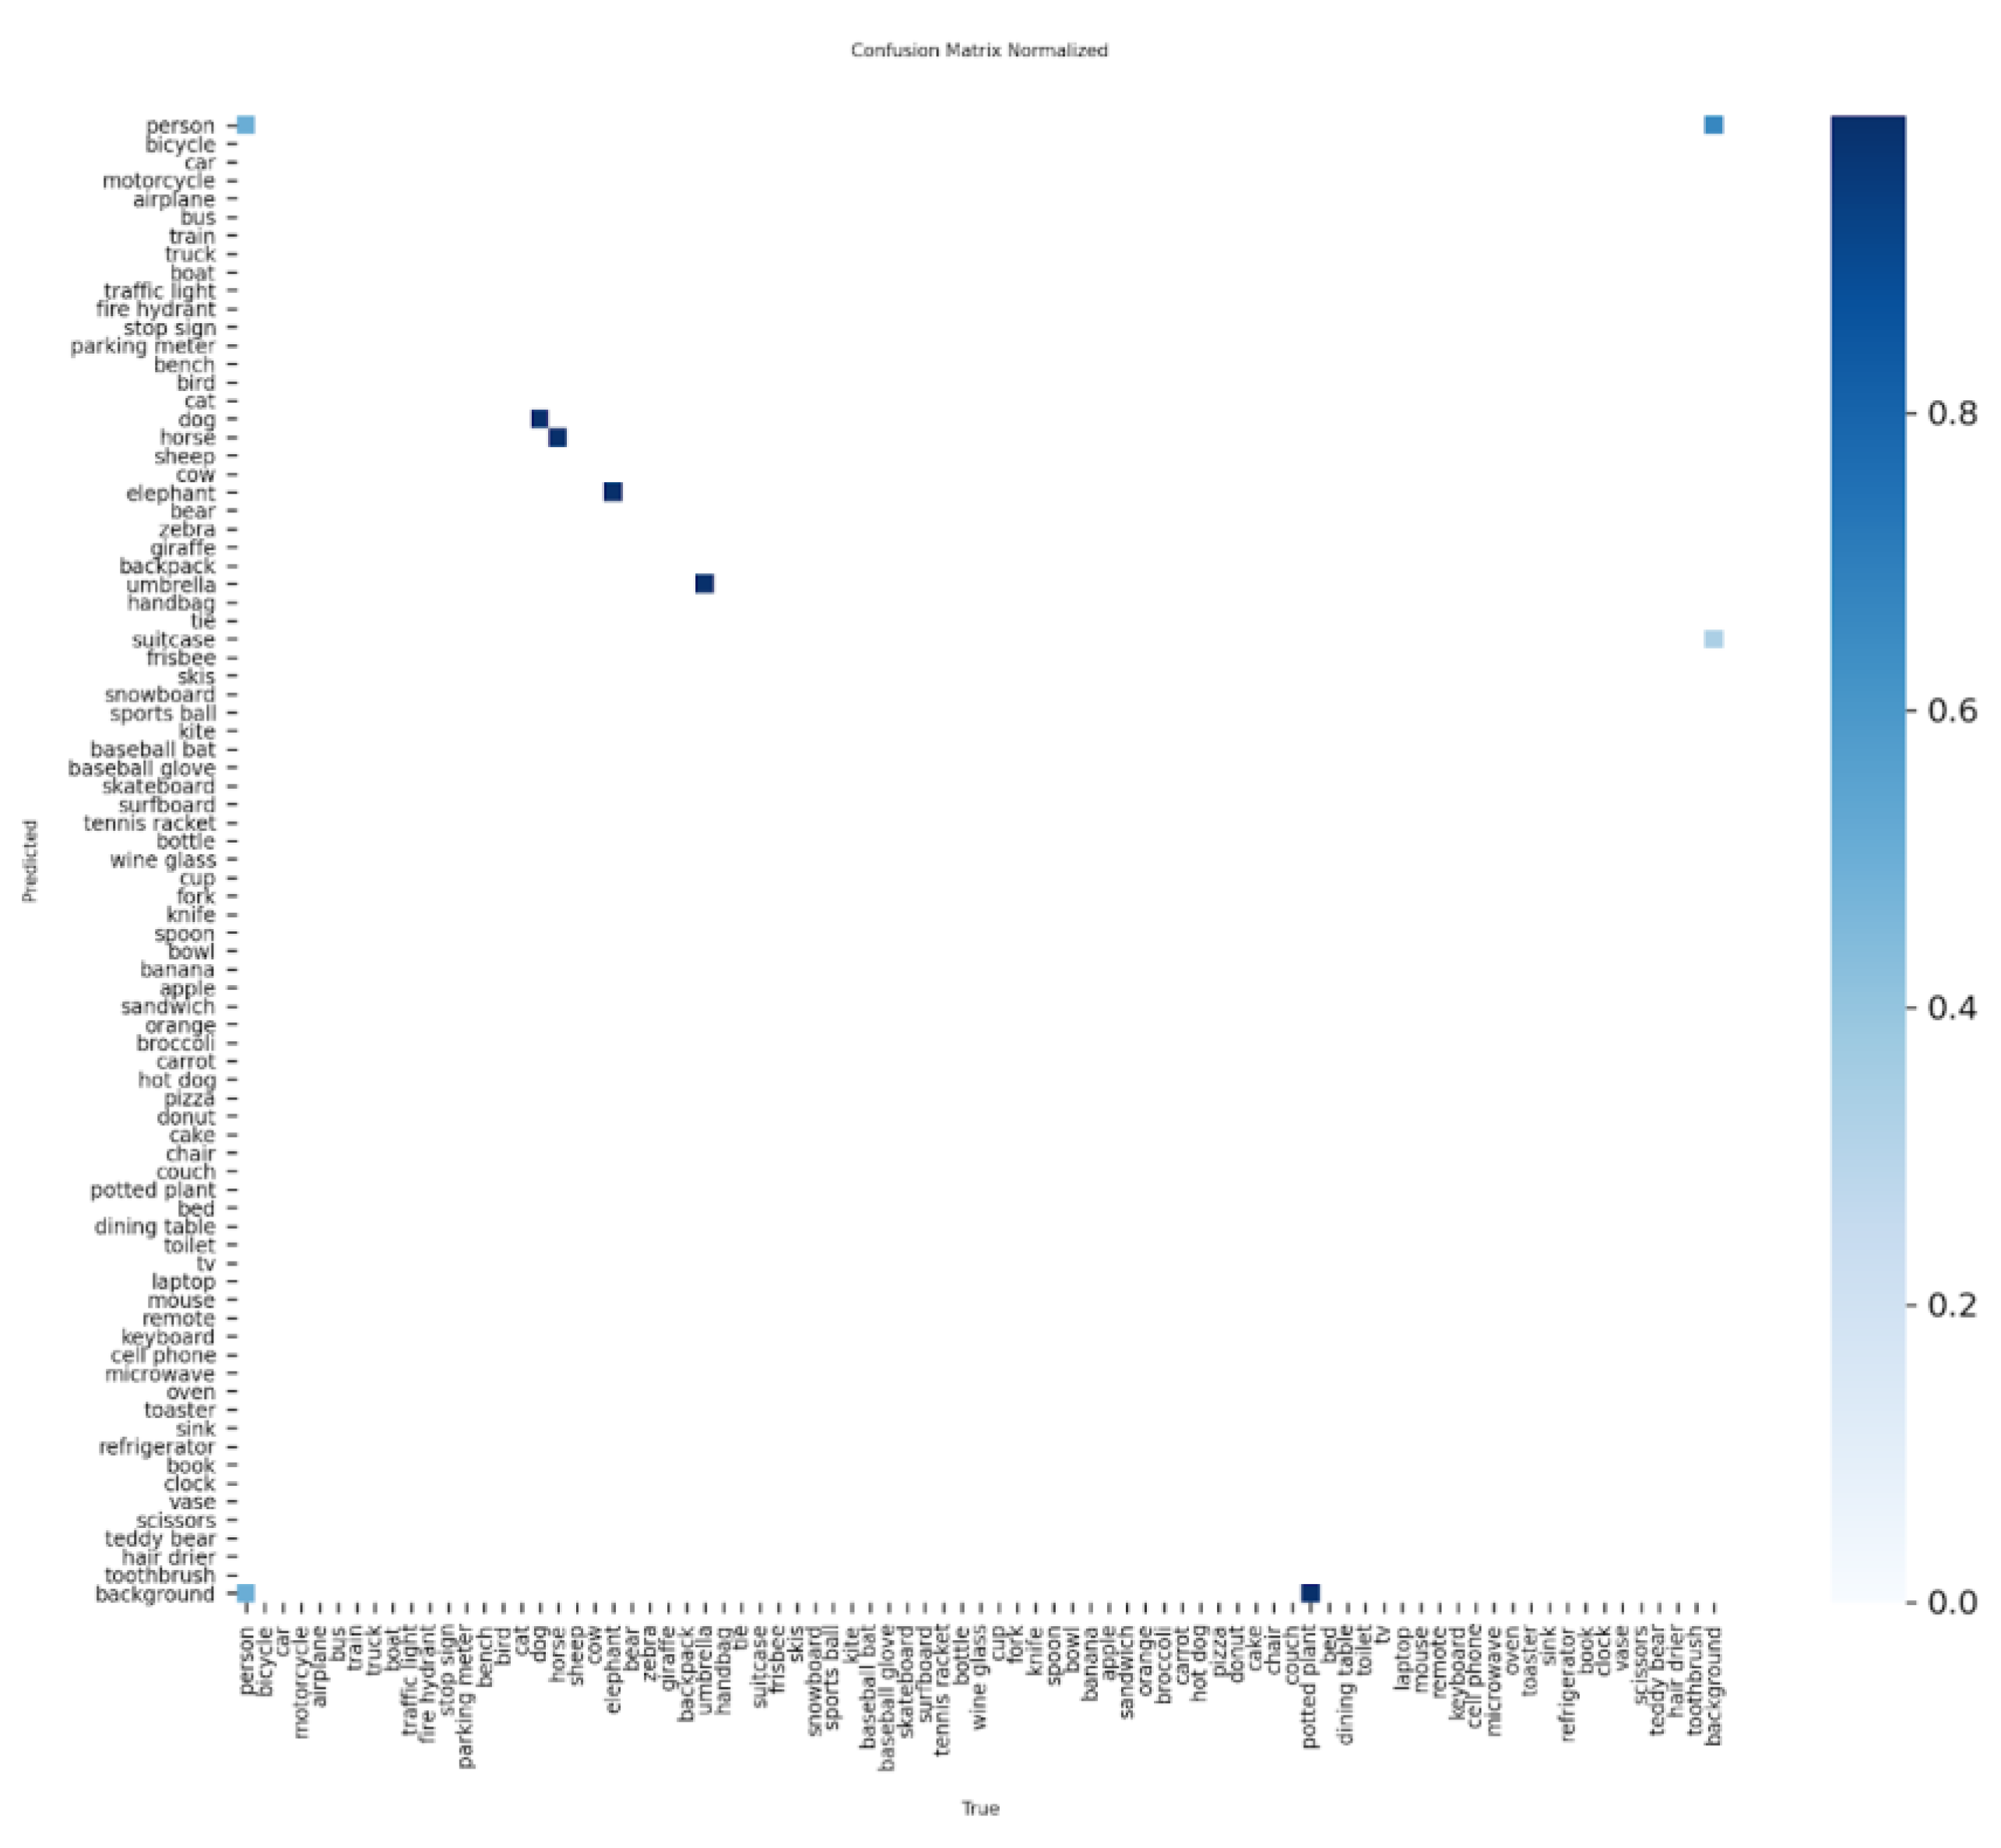
Figure 25.
Confusion Matrices.
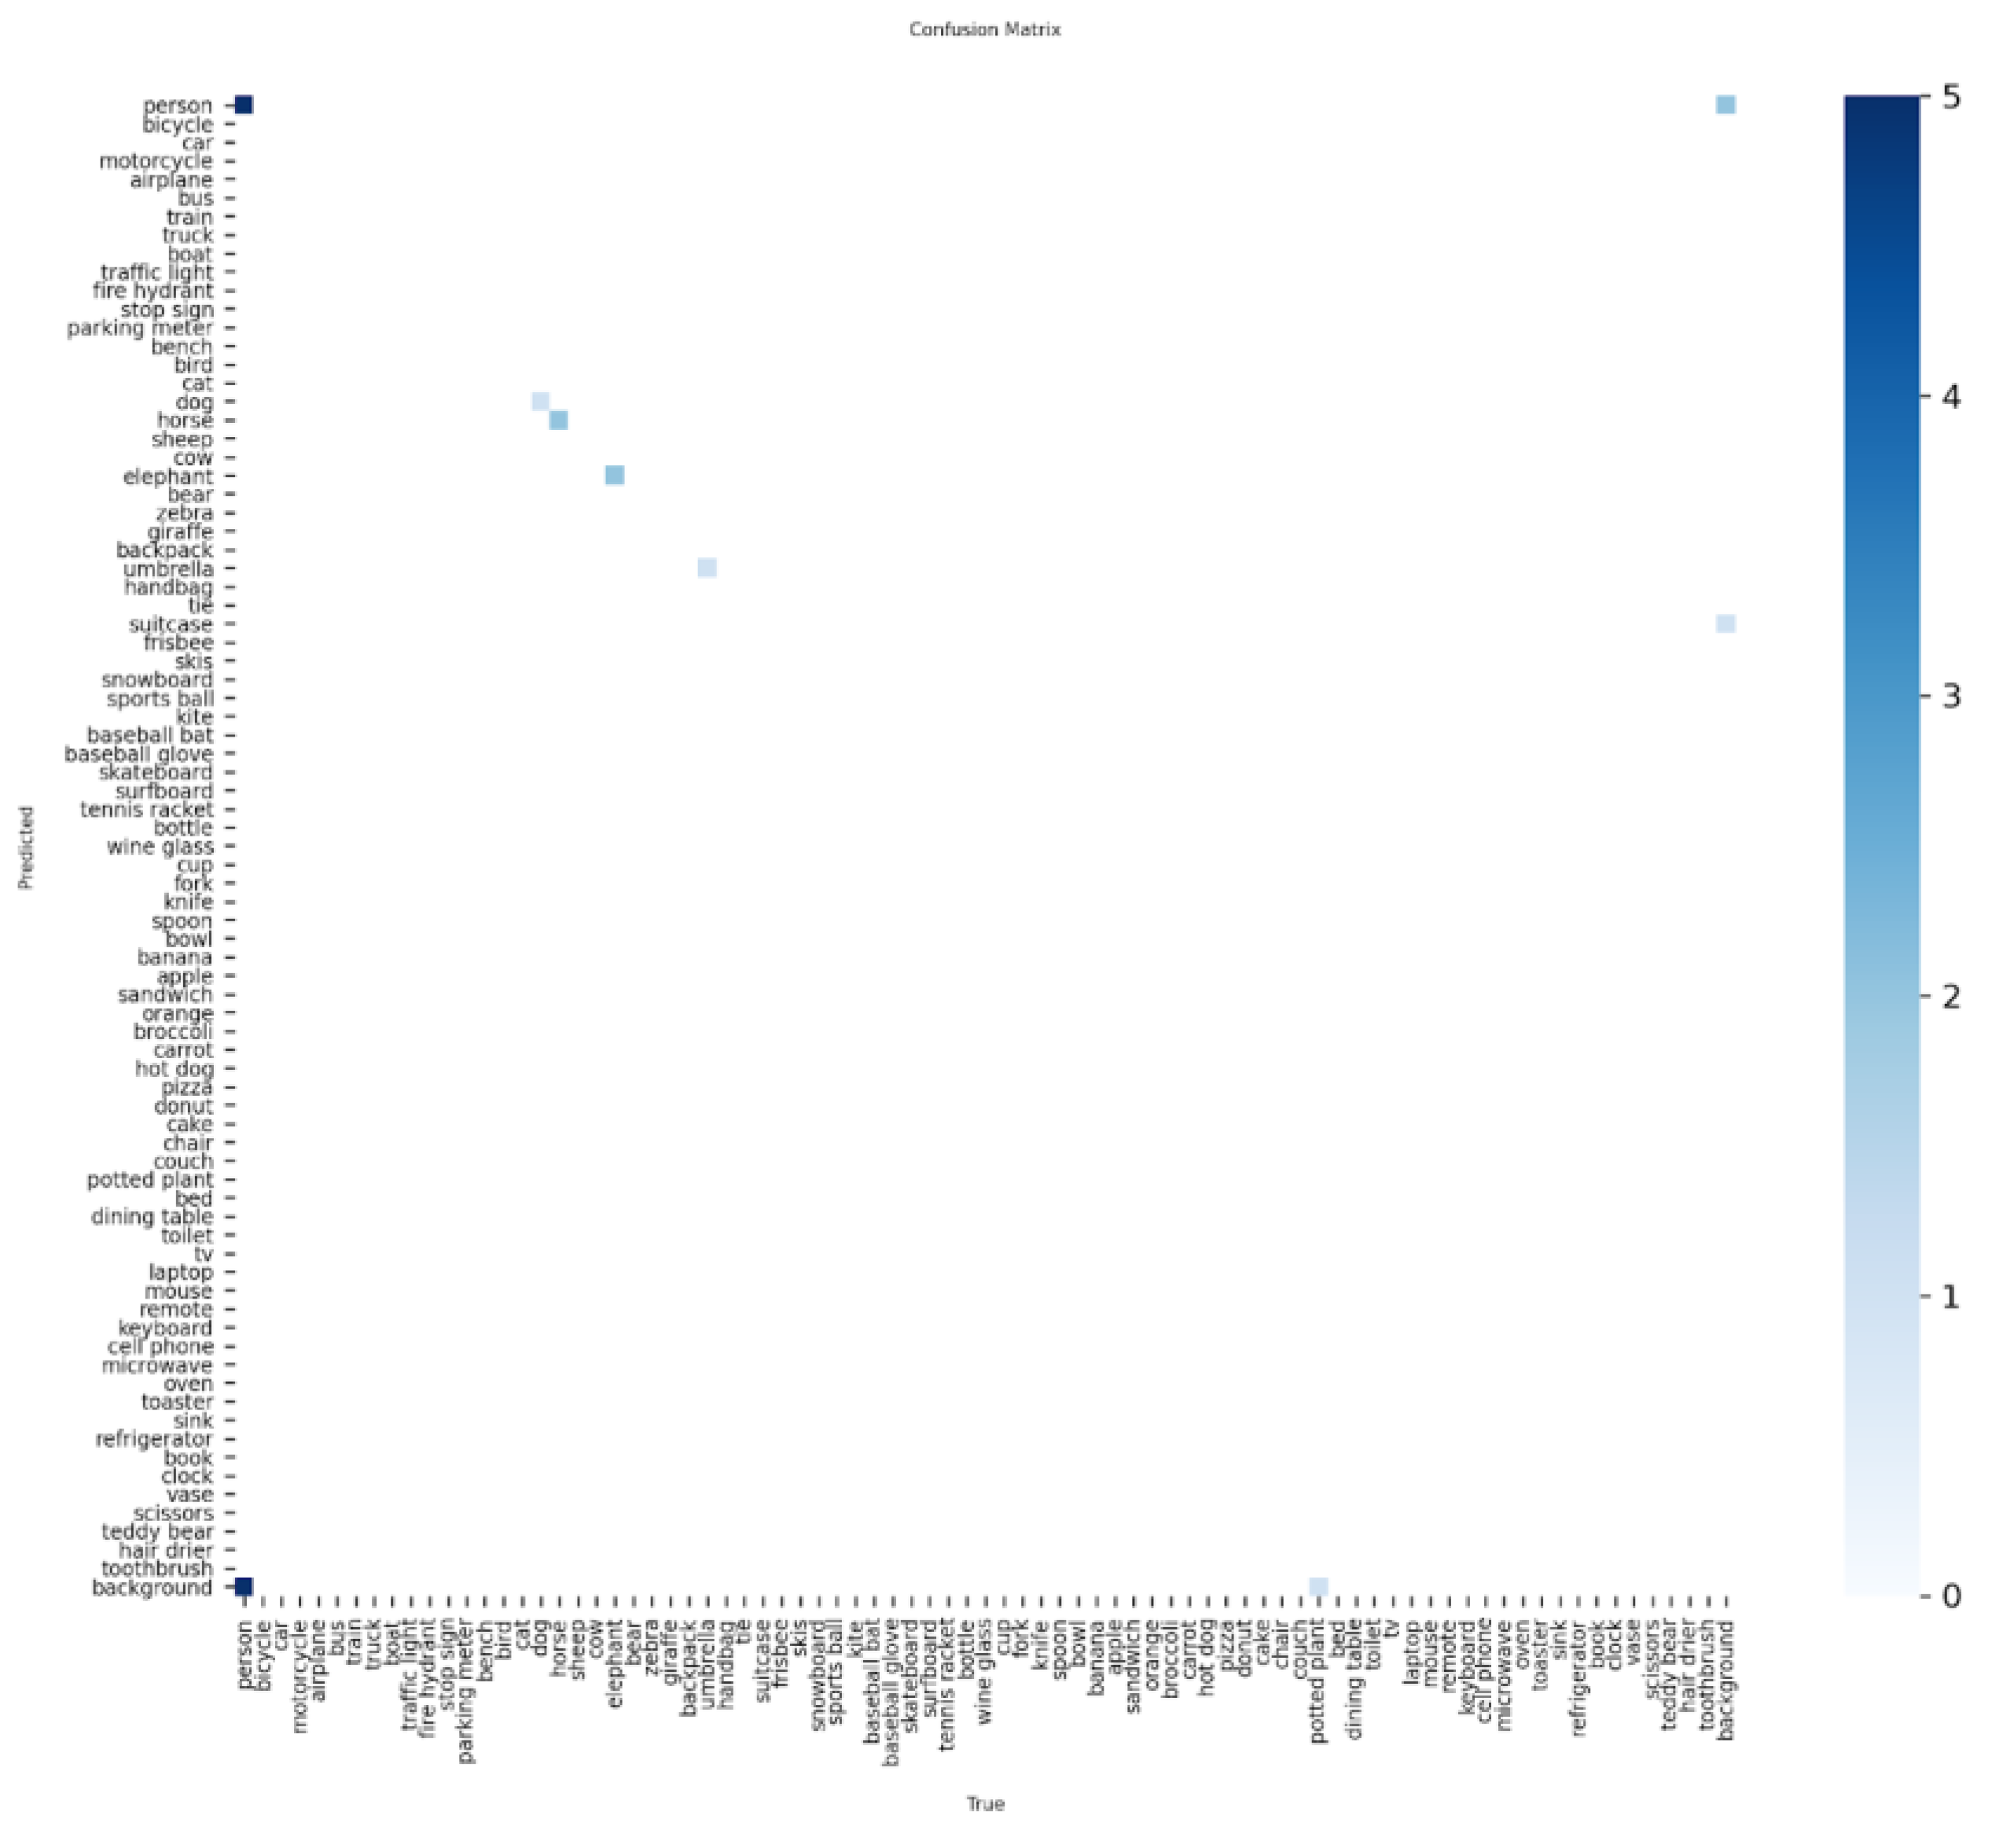
Figure 26.
Operating-Point Curves.
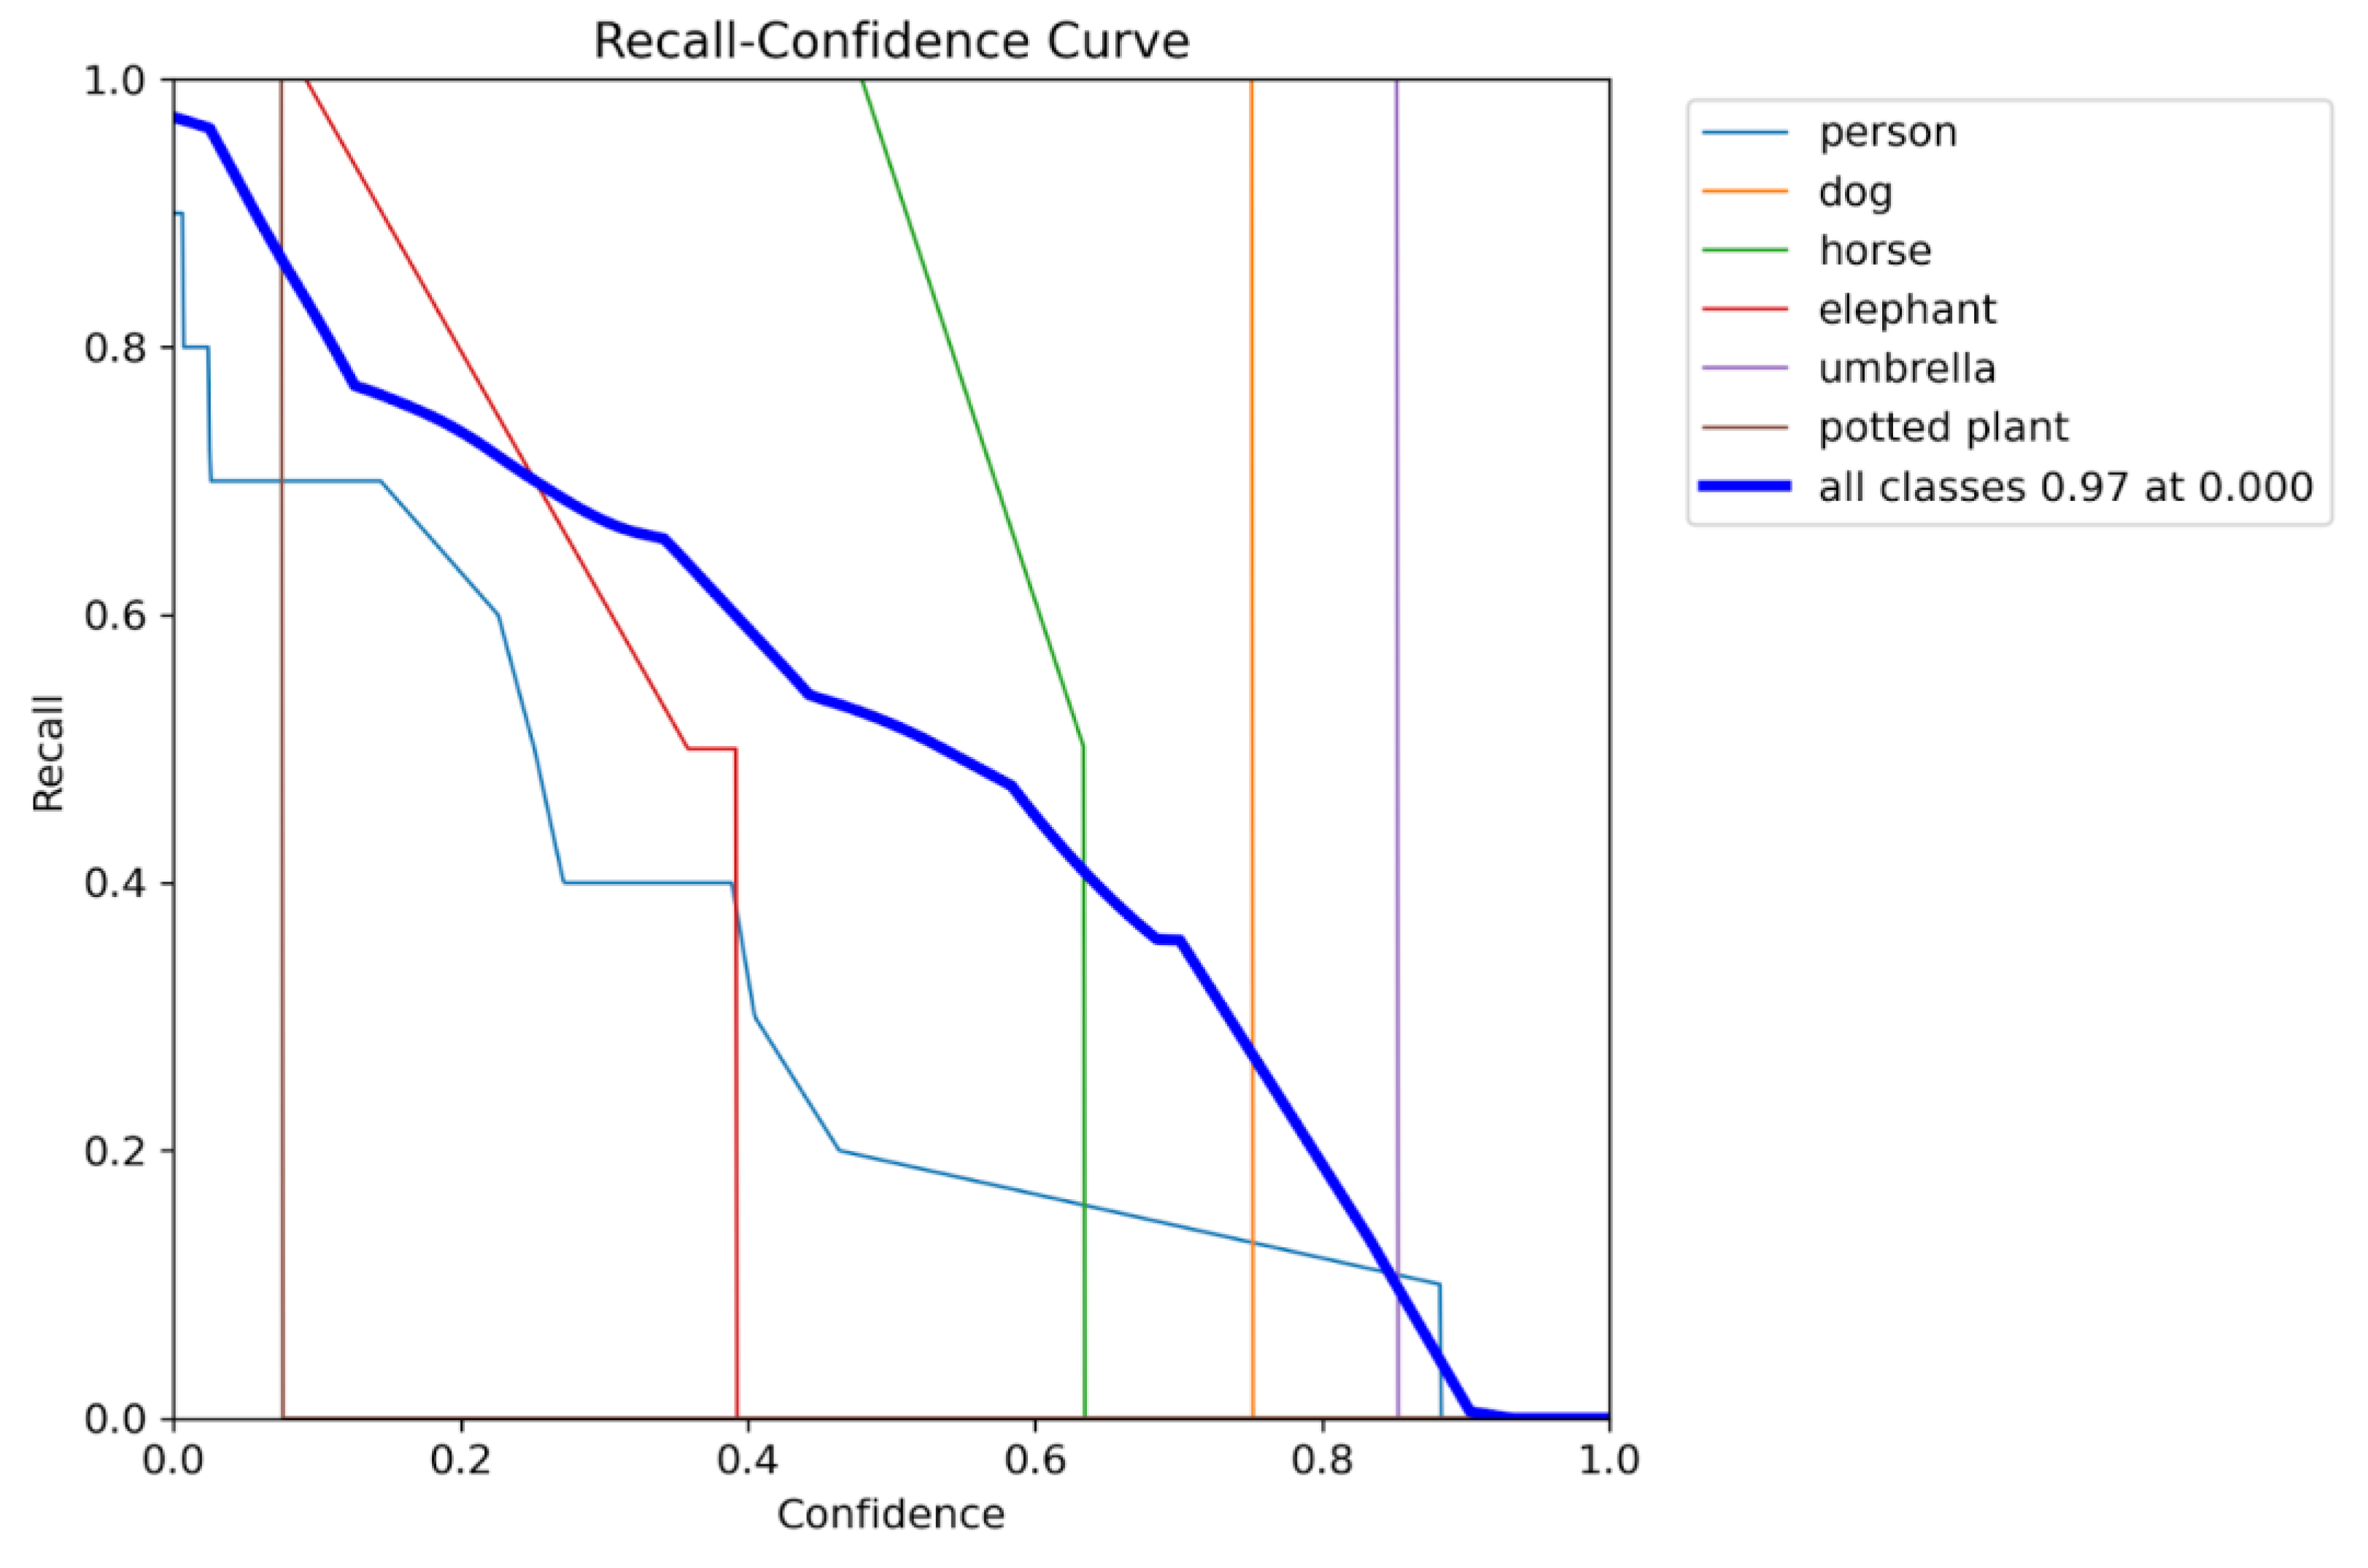
Figure 27.
Operating-Point Curves.
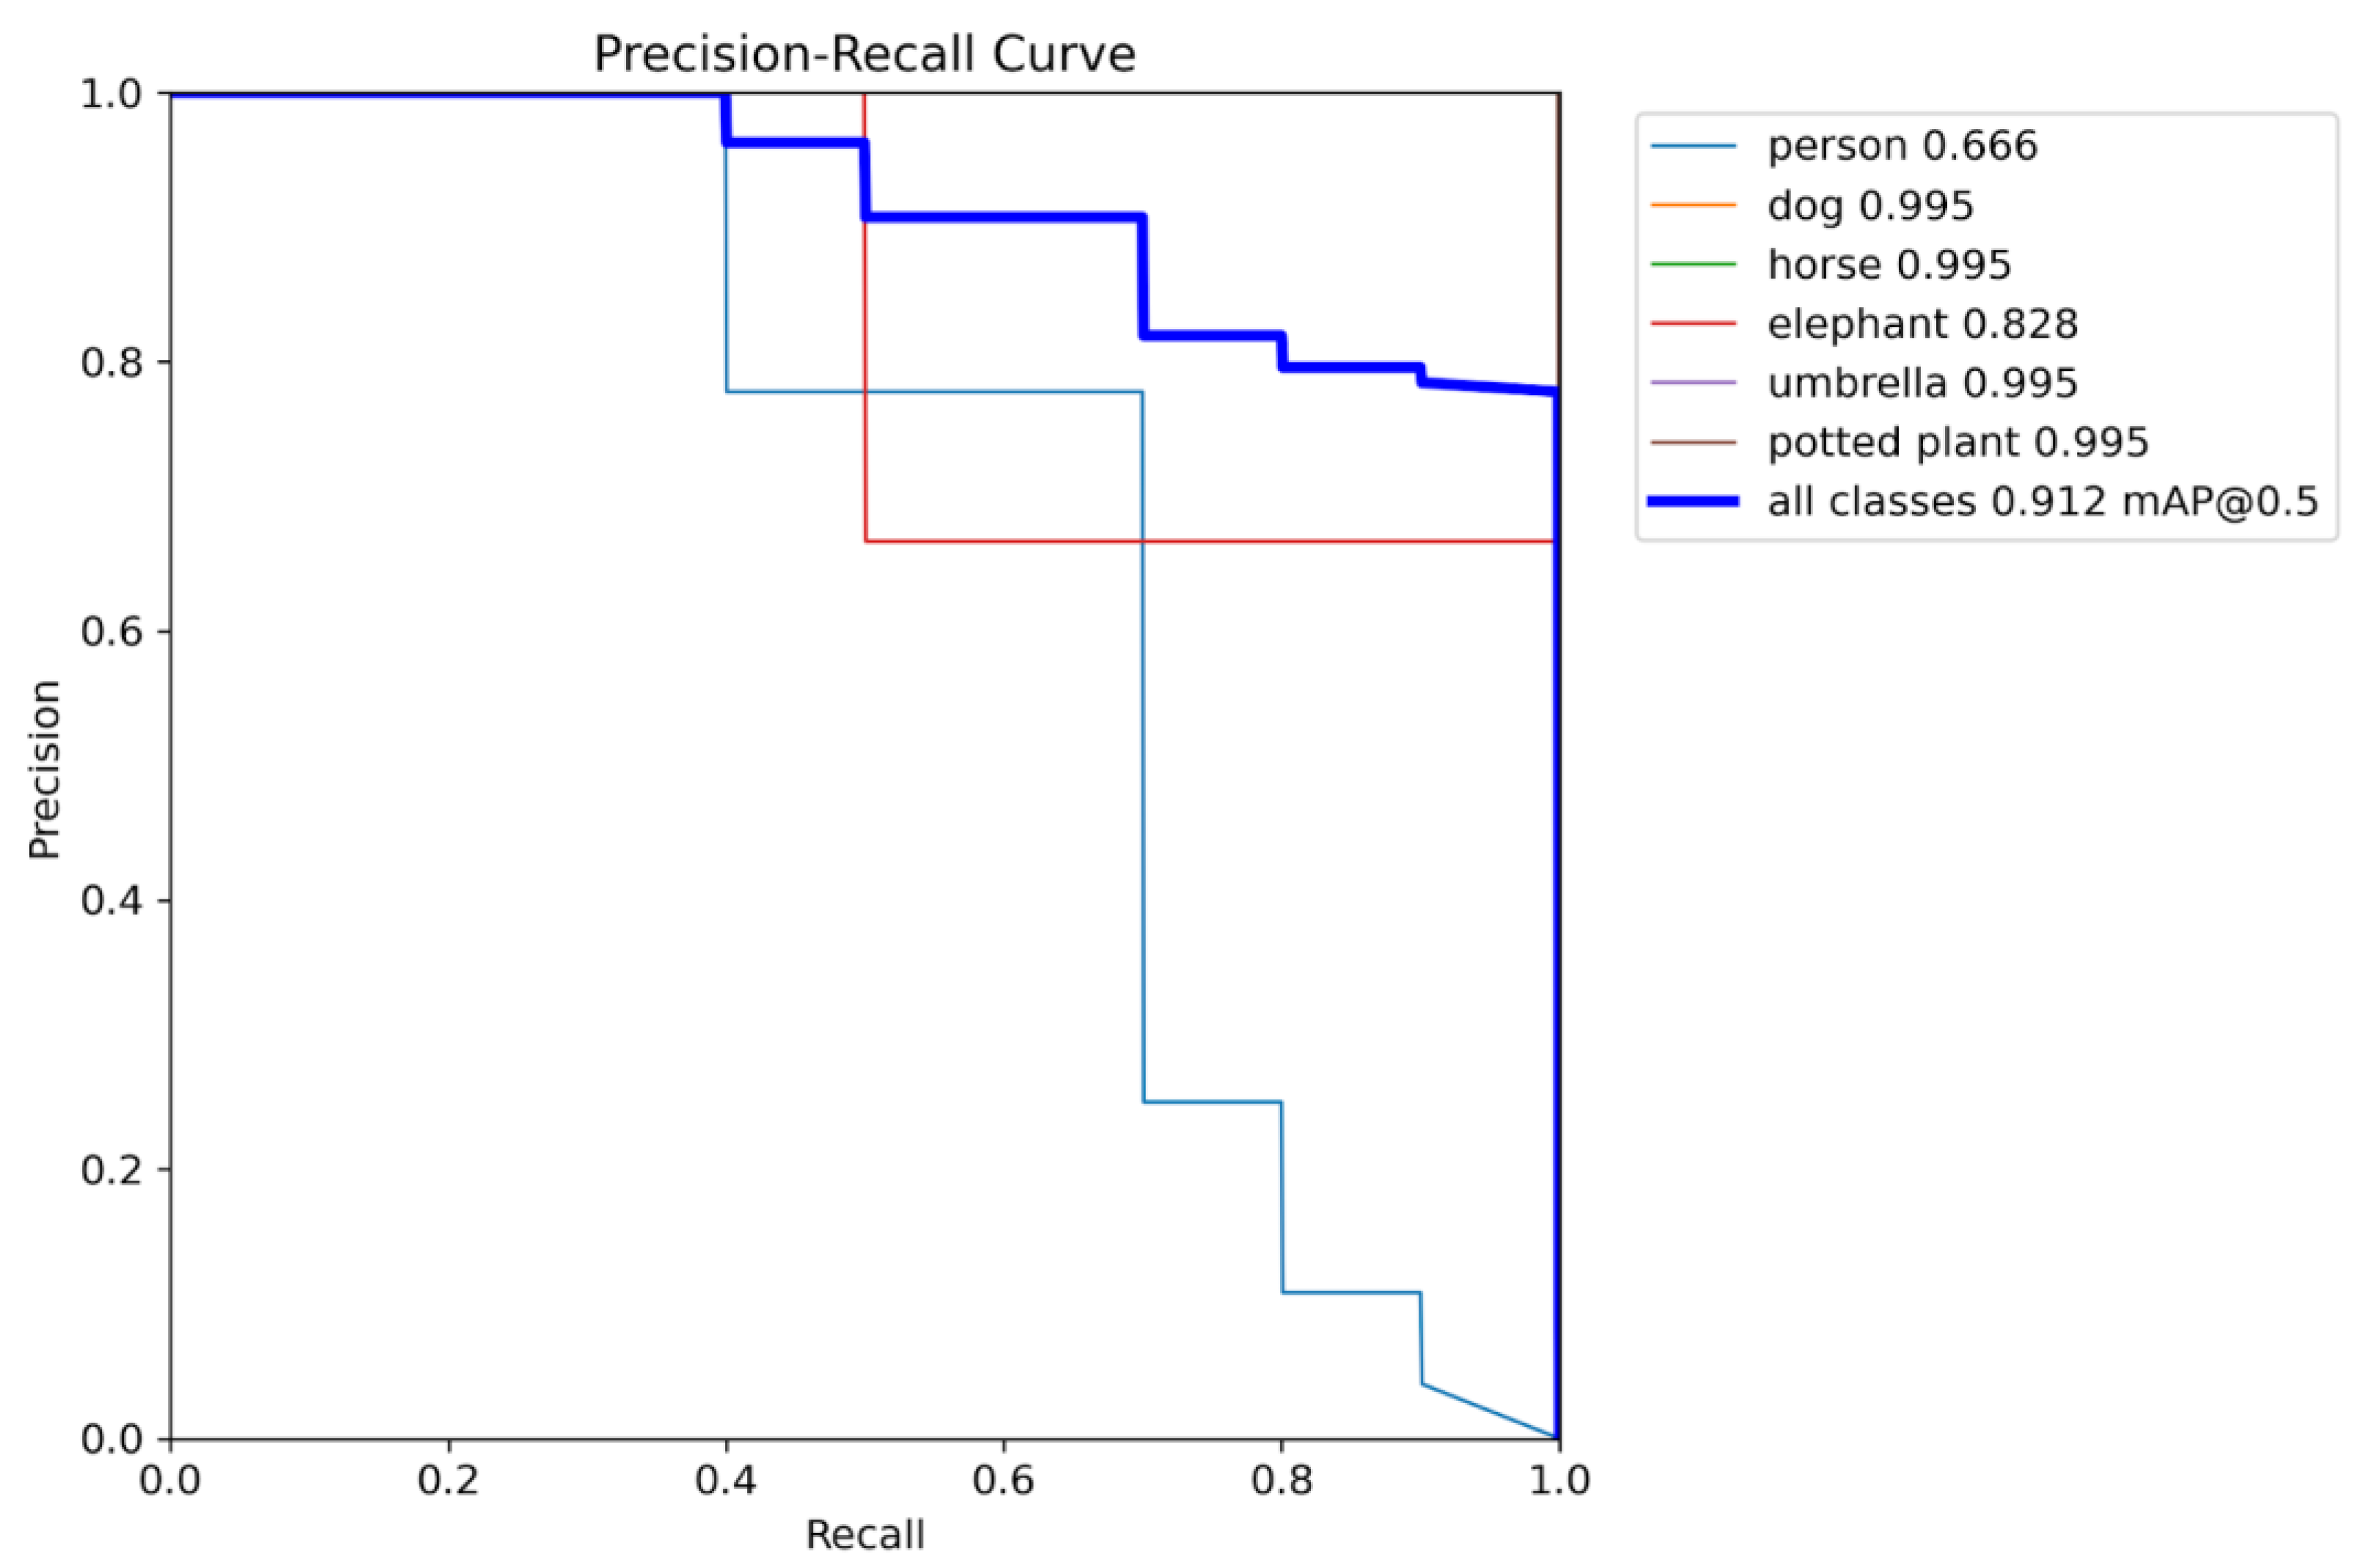
Figure 28.
Operating-Point Curves.
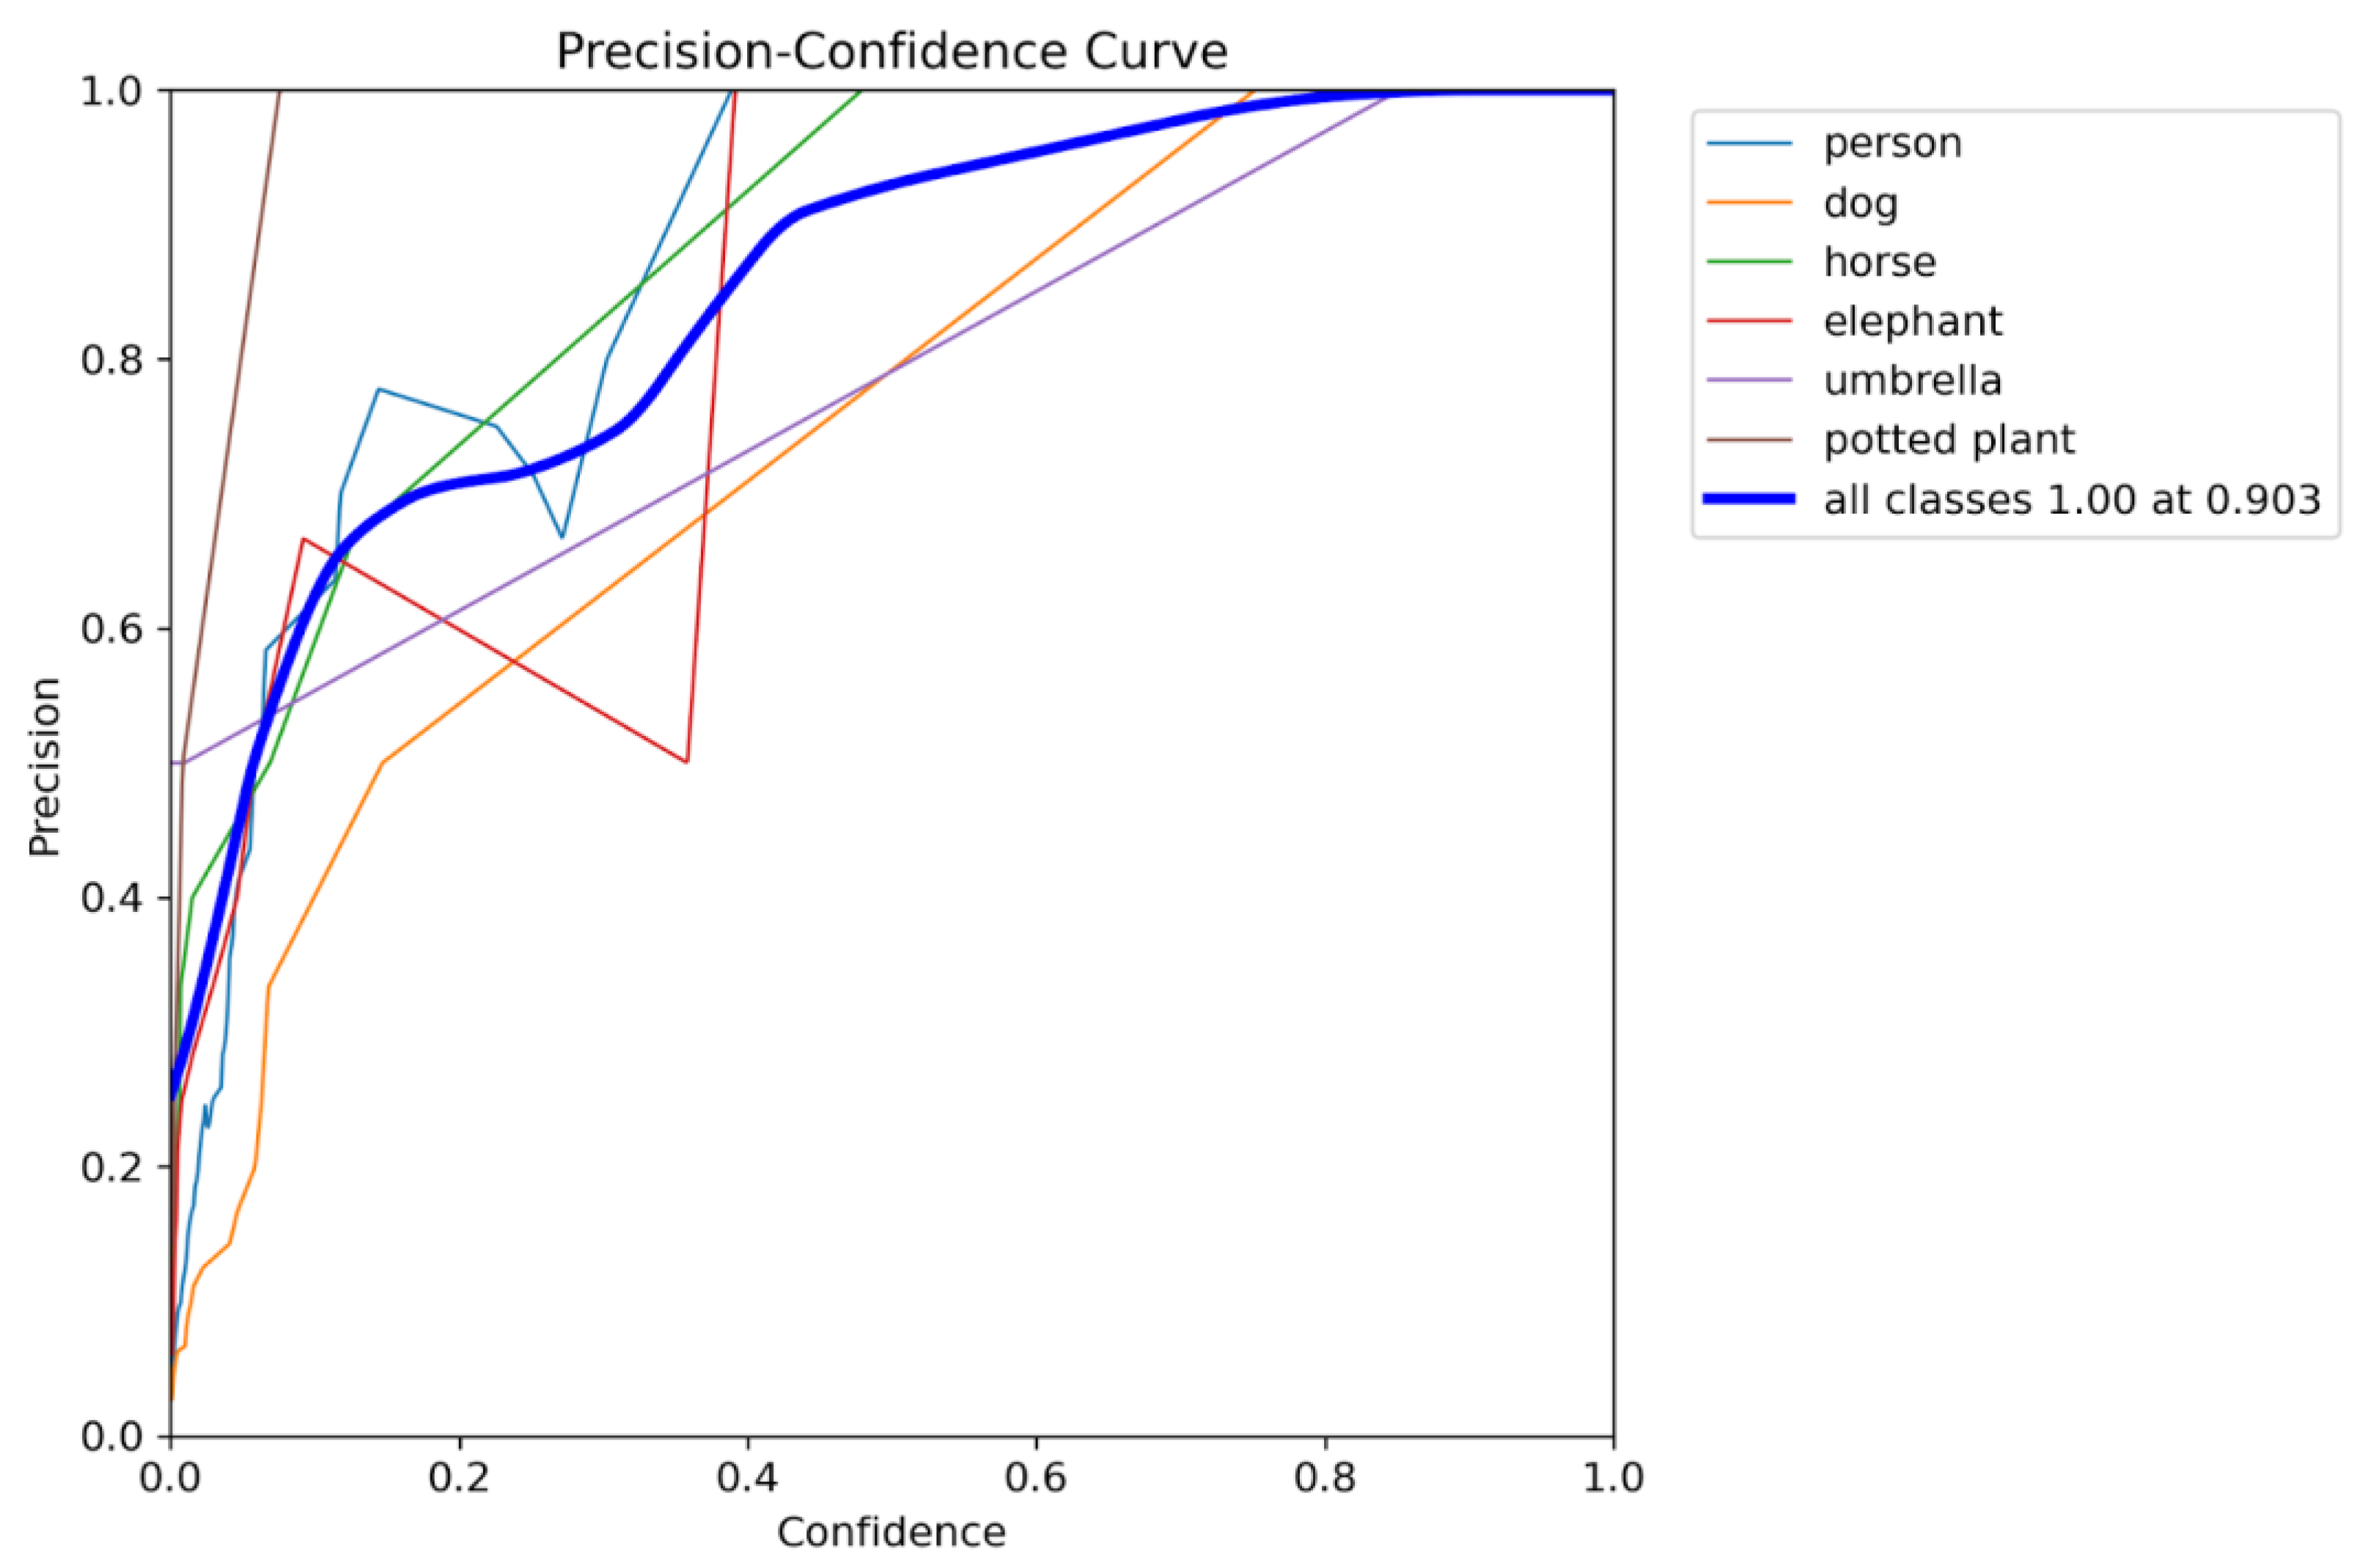
Figure 29.
Operating-Point Curves.
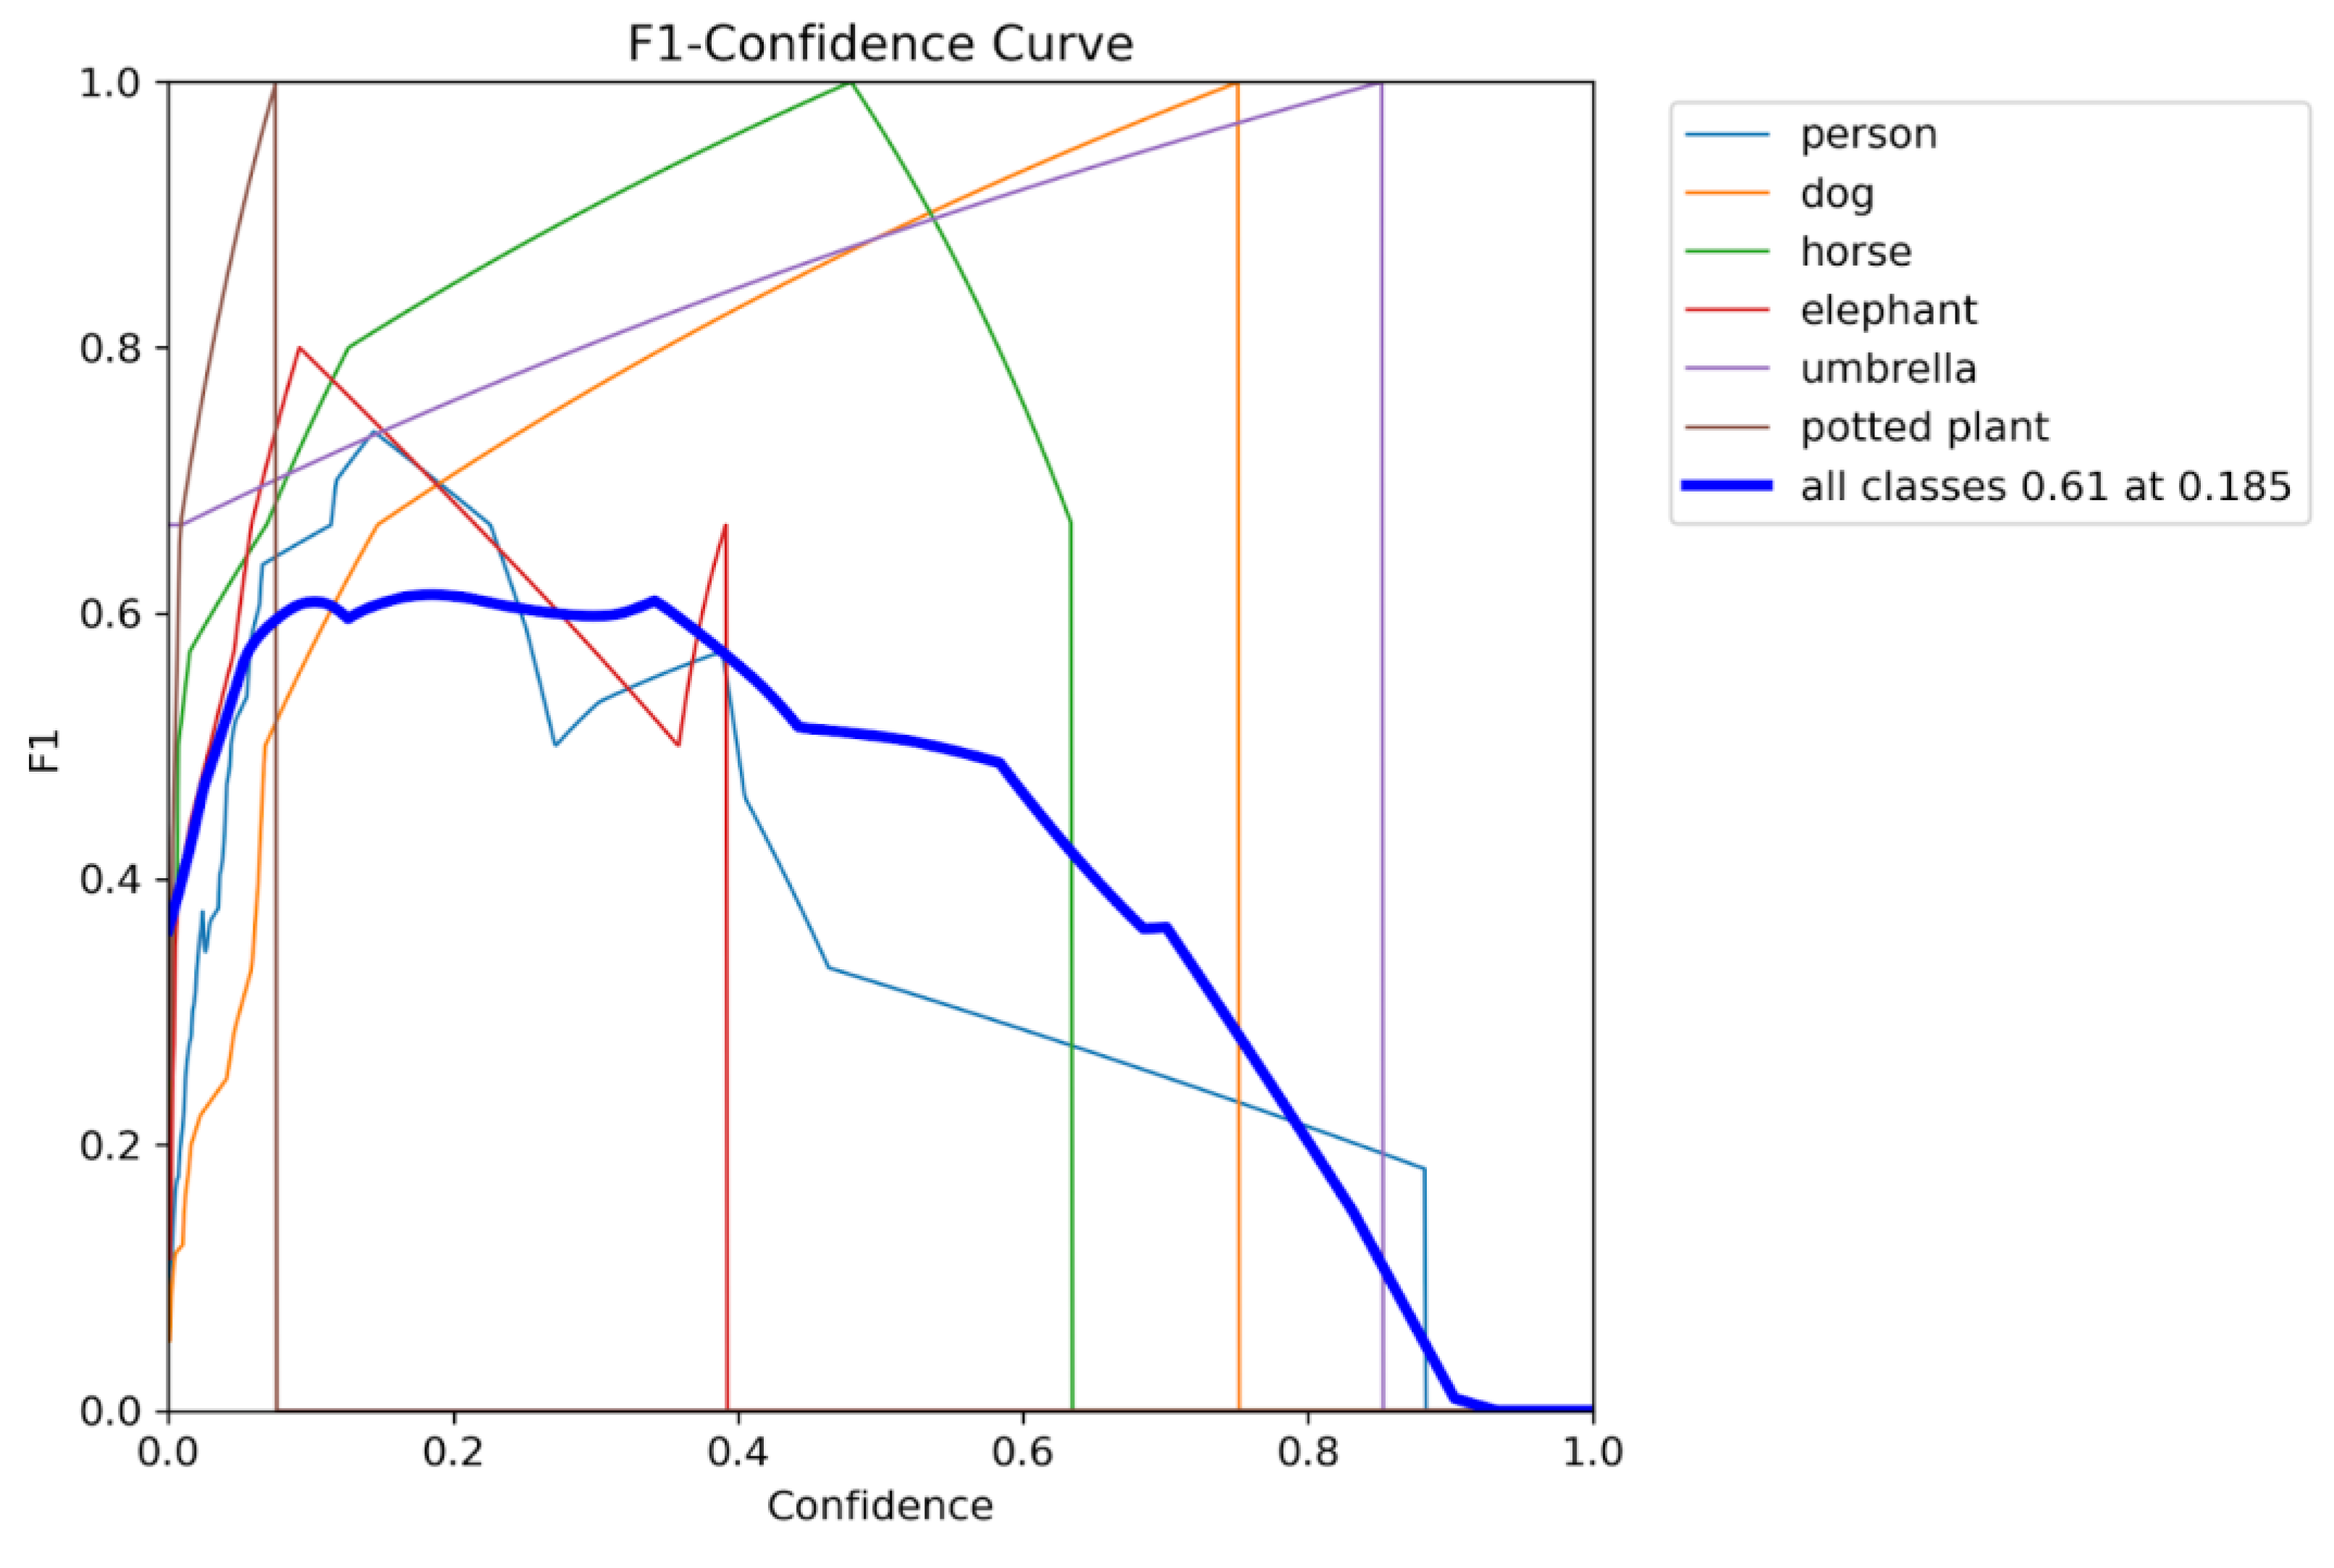
Figure 30.
Detected Objects:.
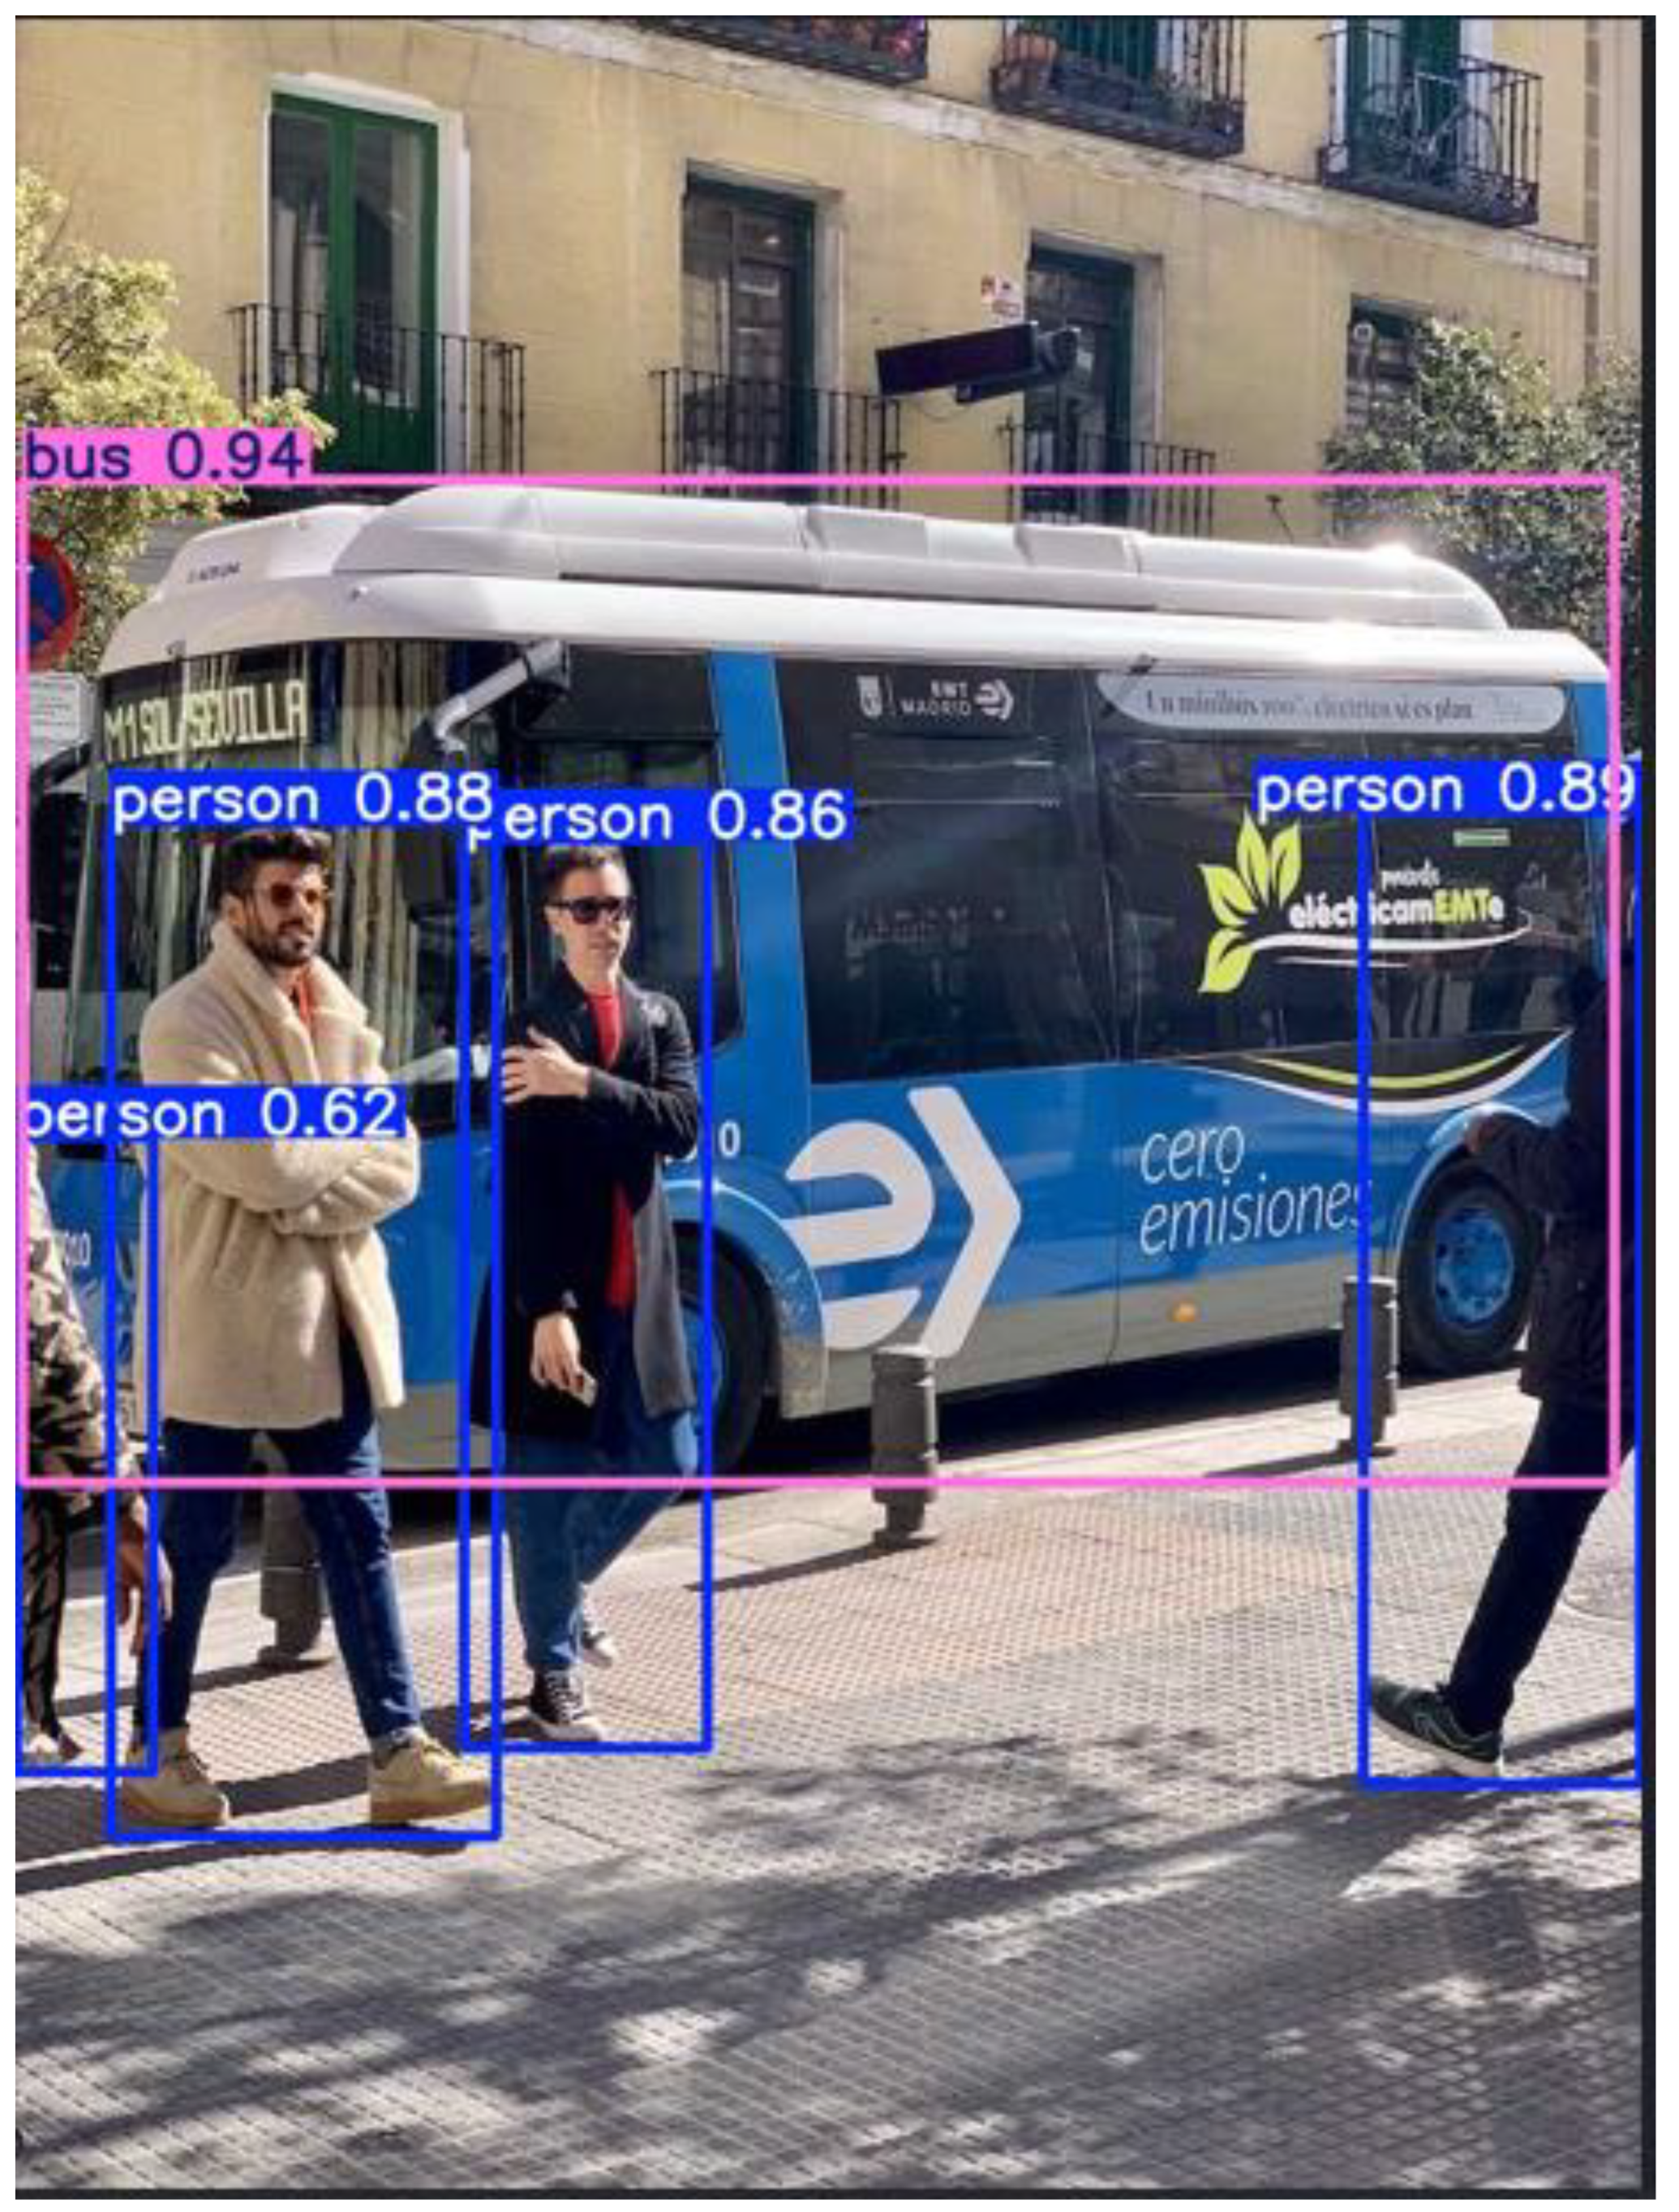
Figure 31.
Detected Objects:.
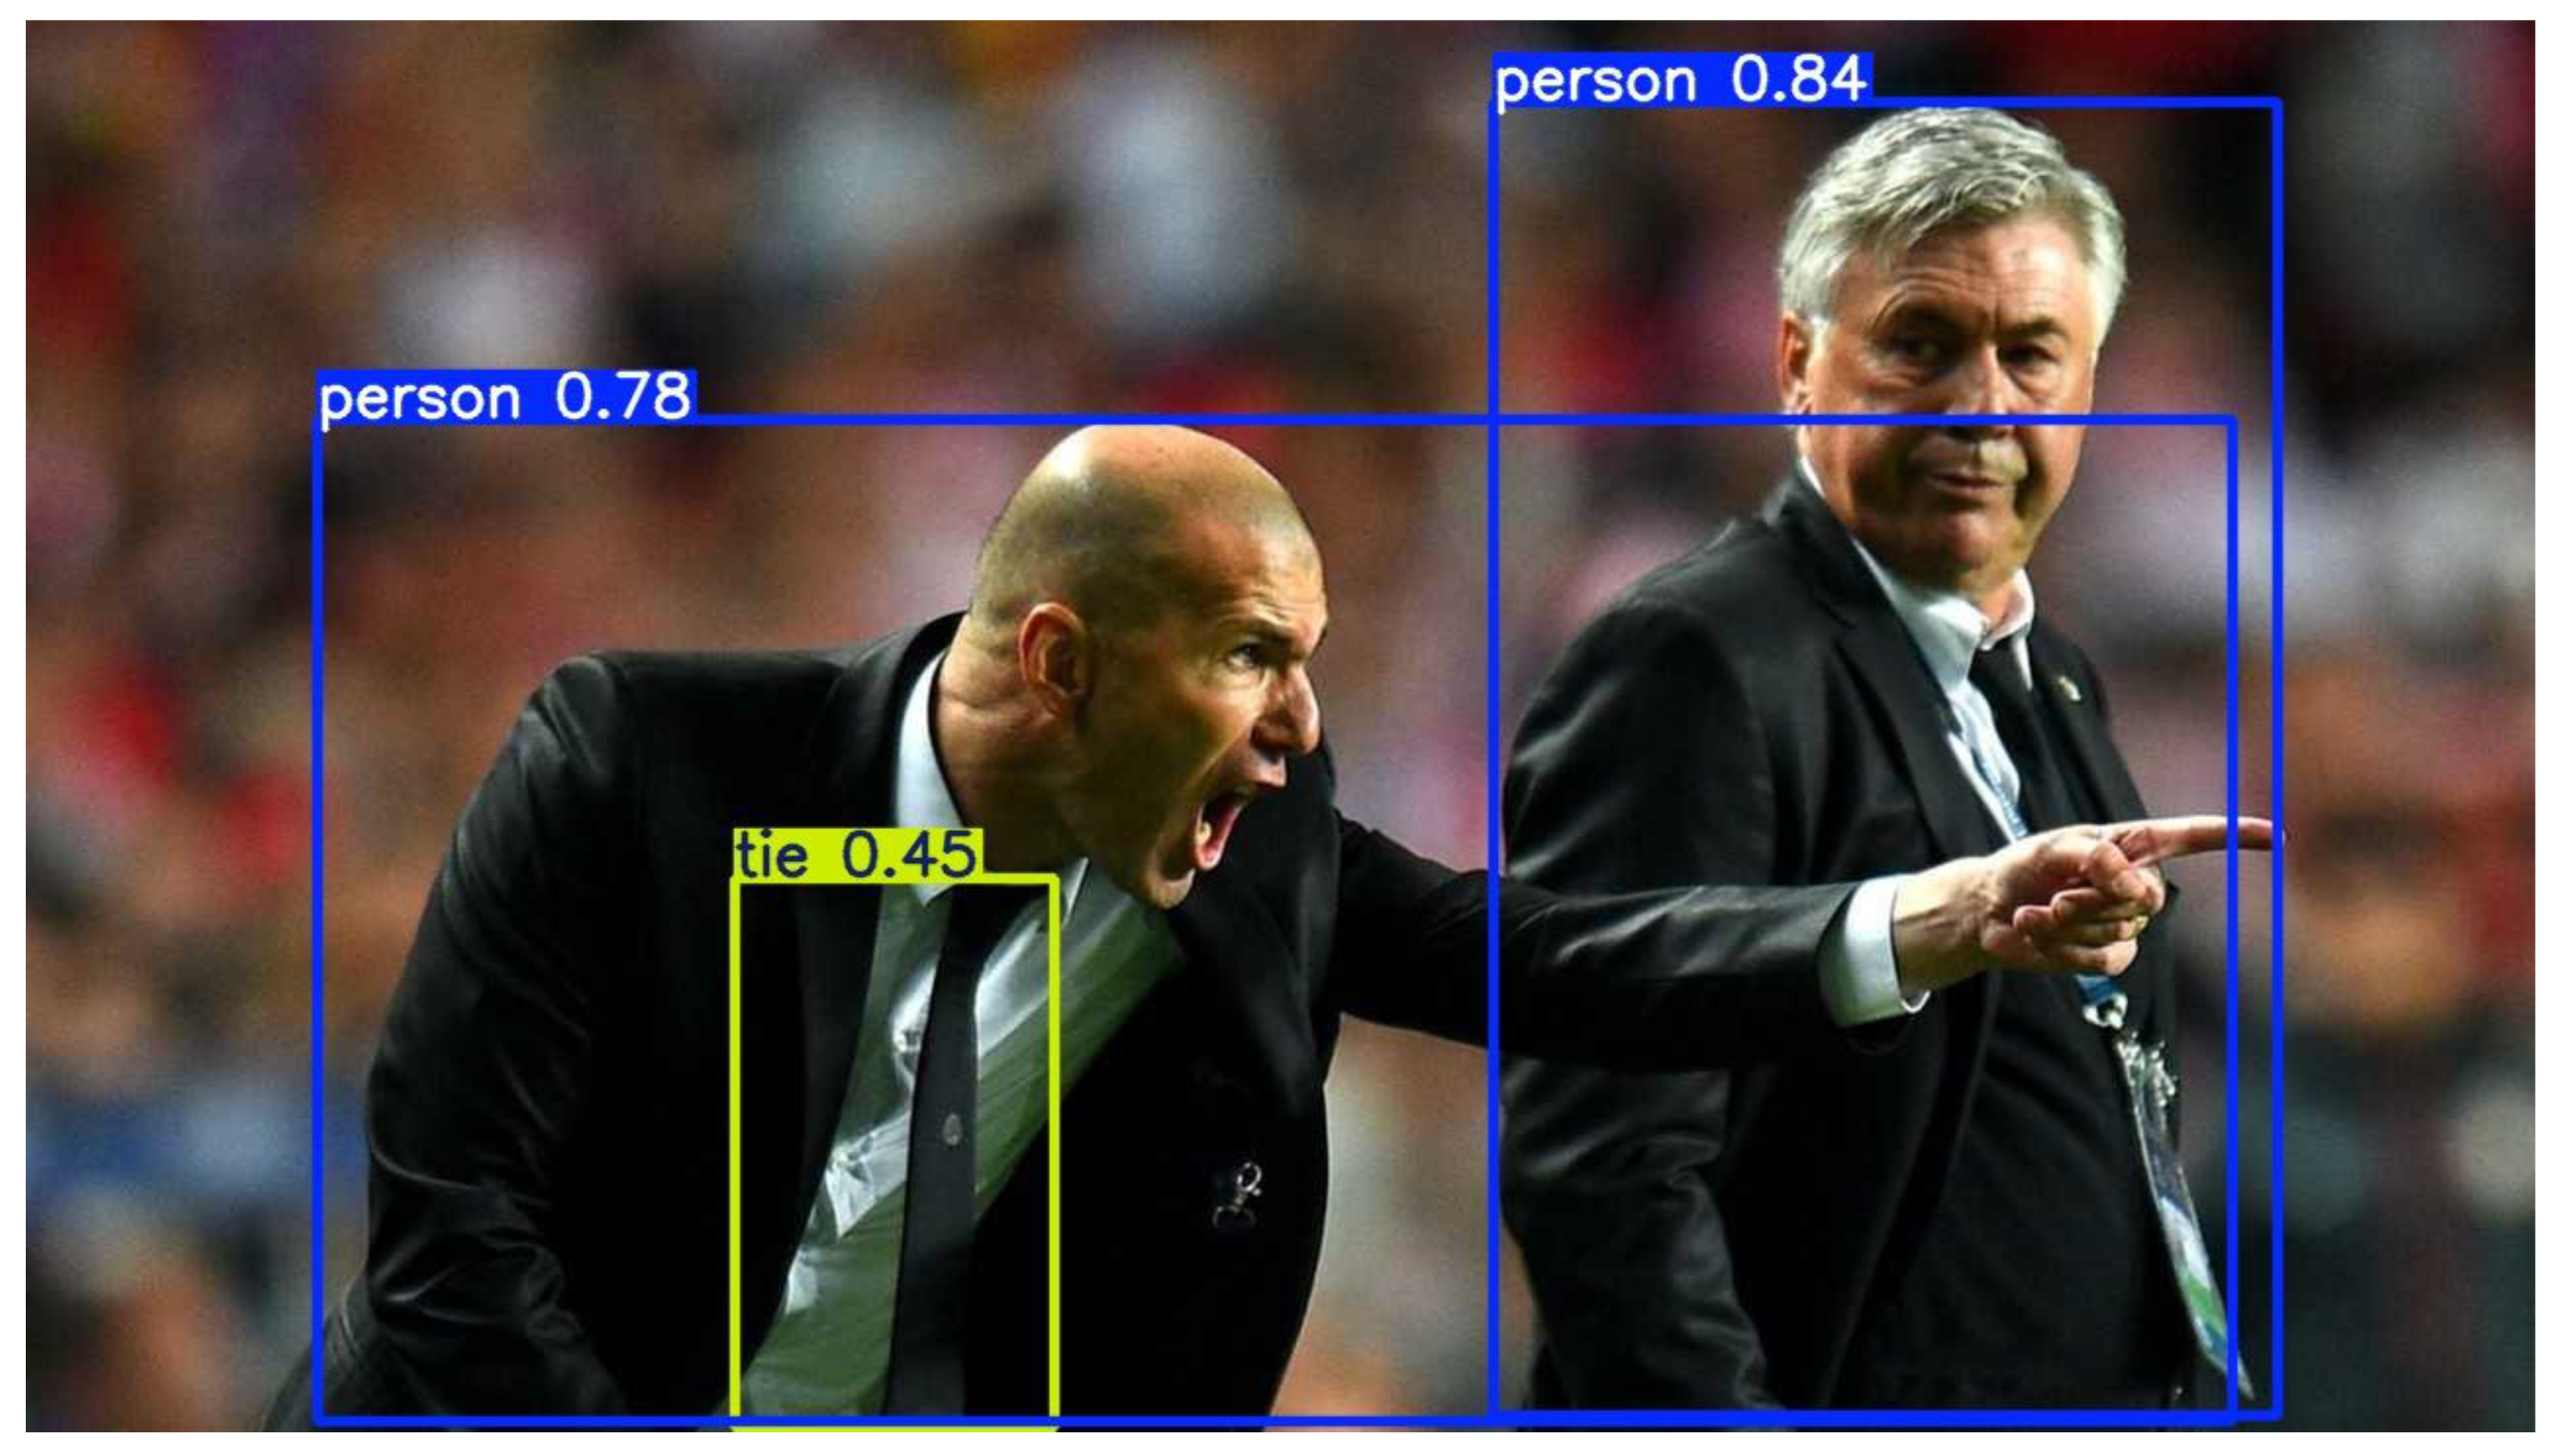
Figure 32.
Qualitative Detections (Images).
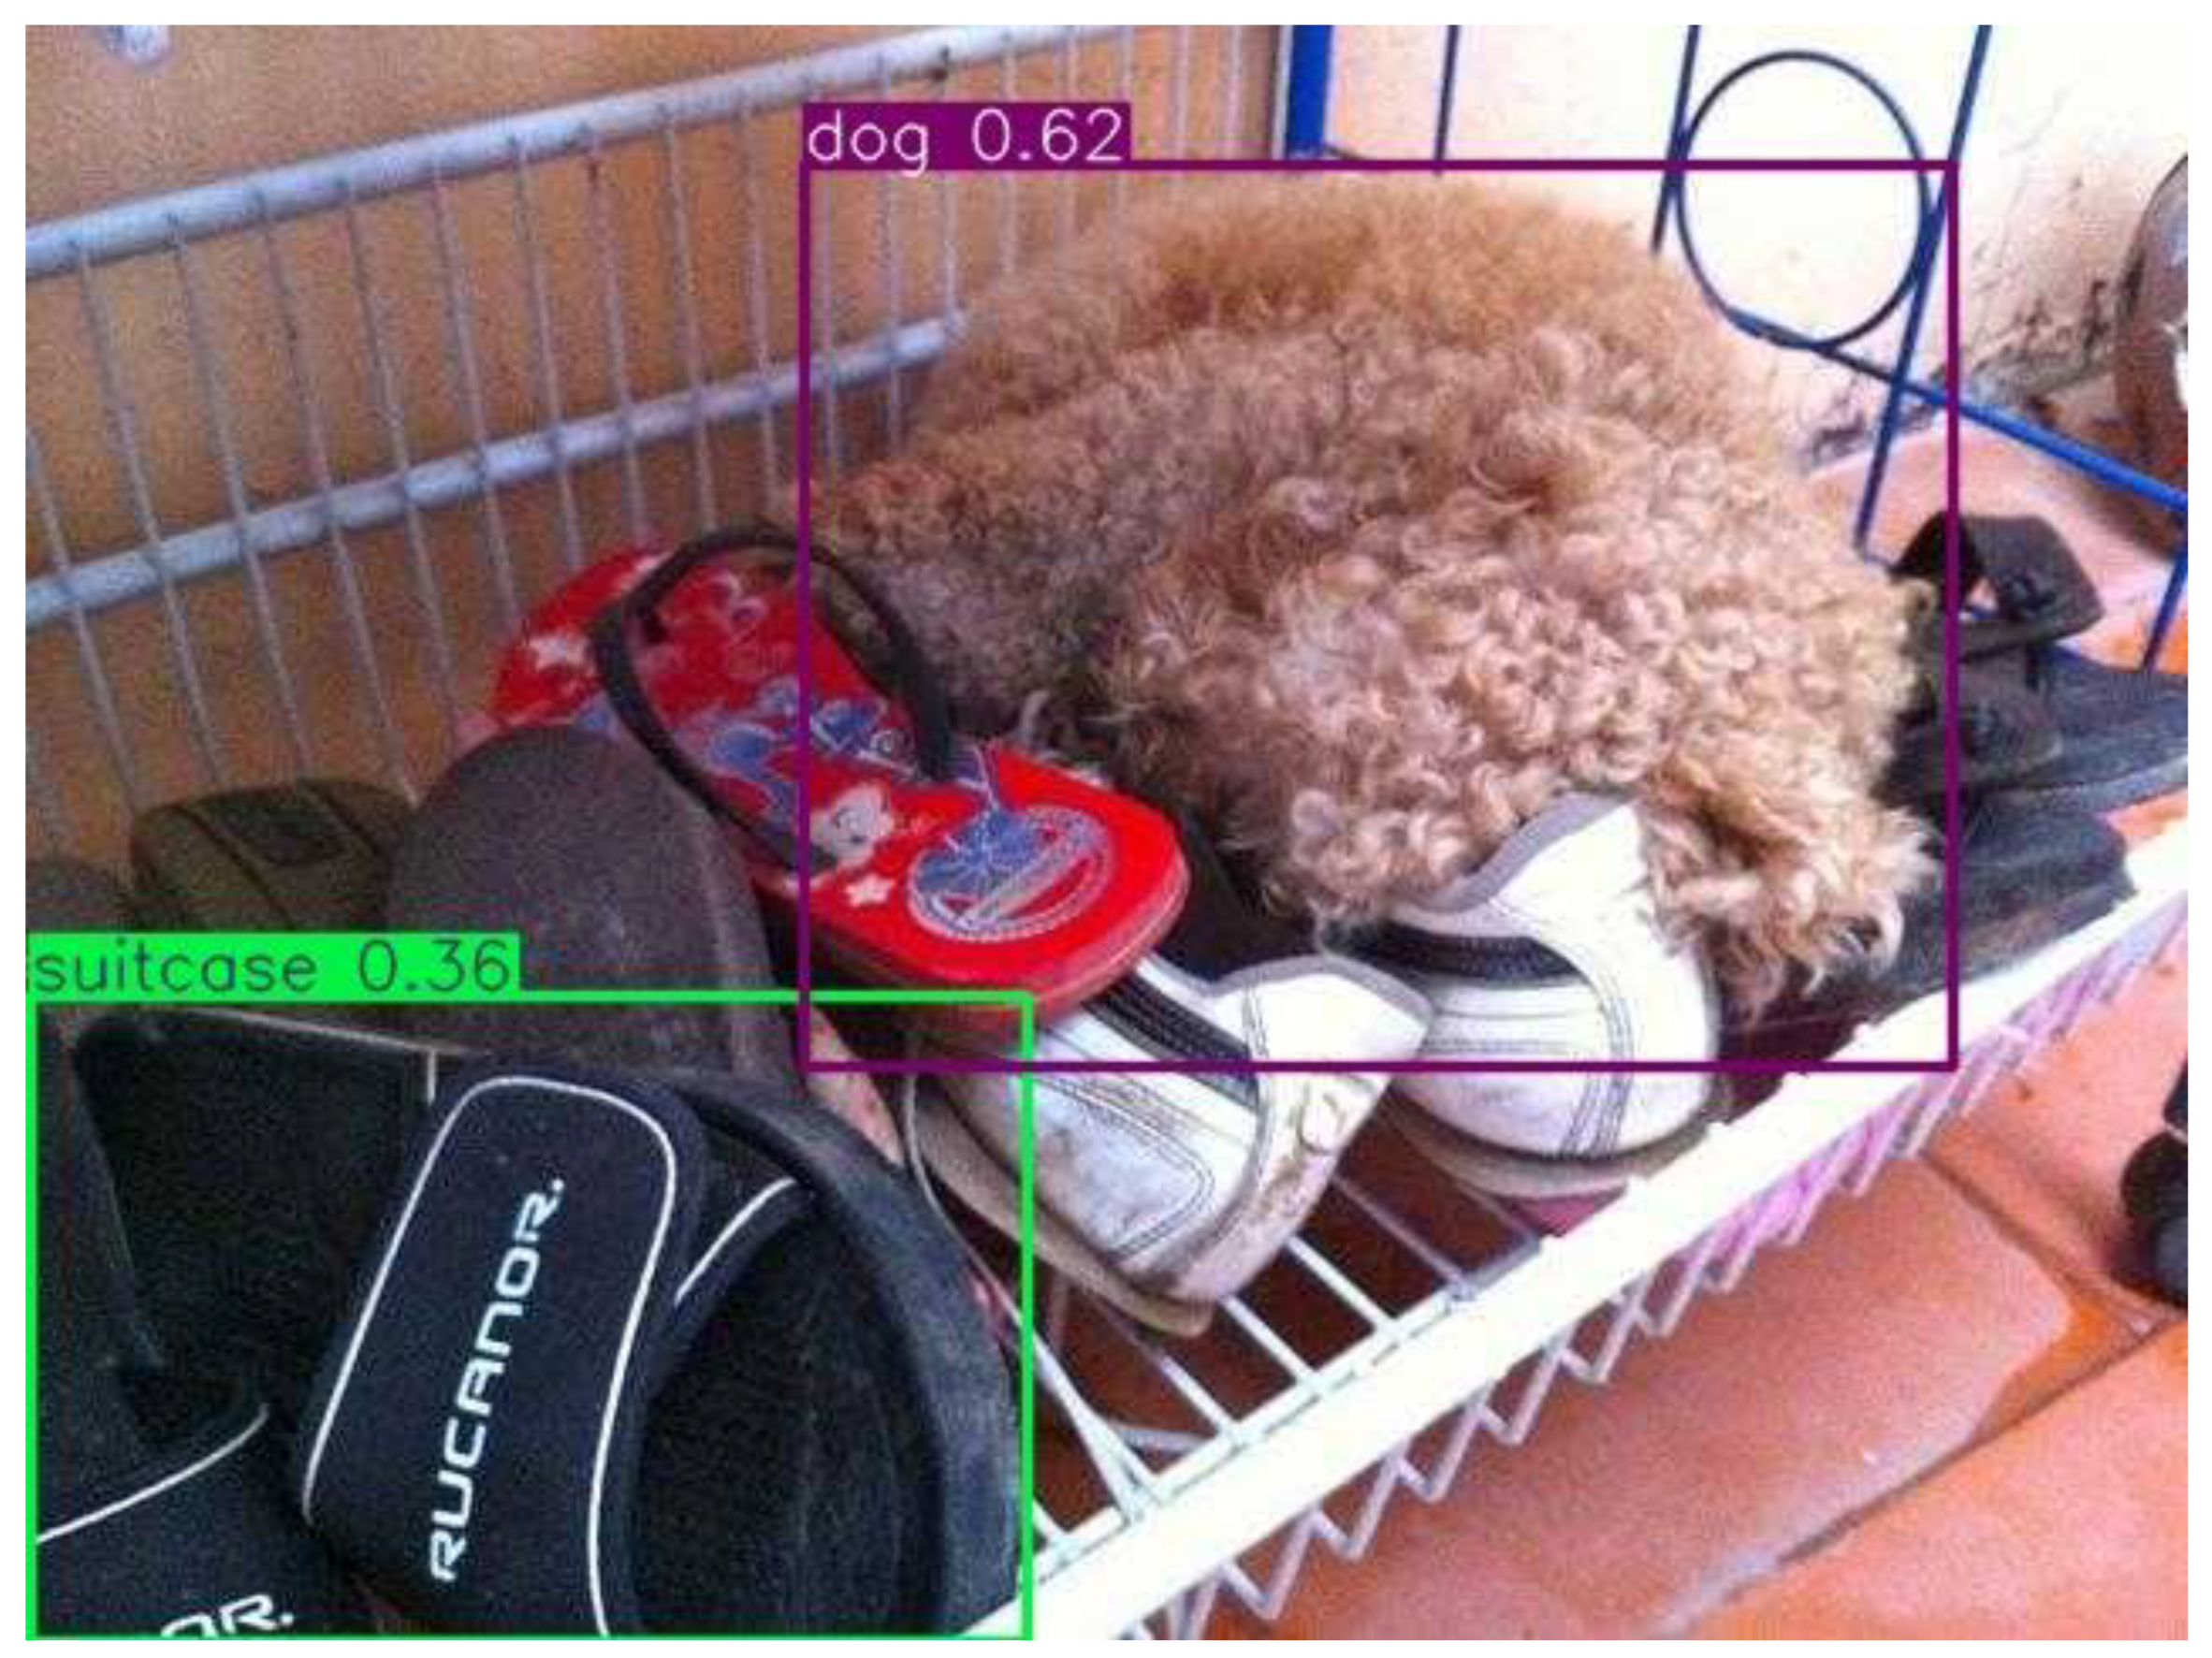
Figure 33.
Qualitative Detections (Images).
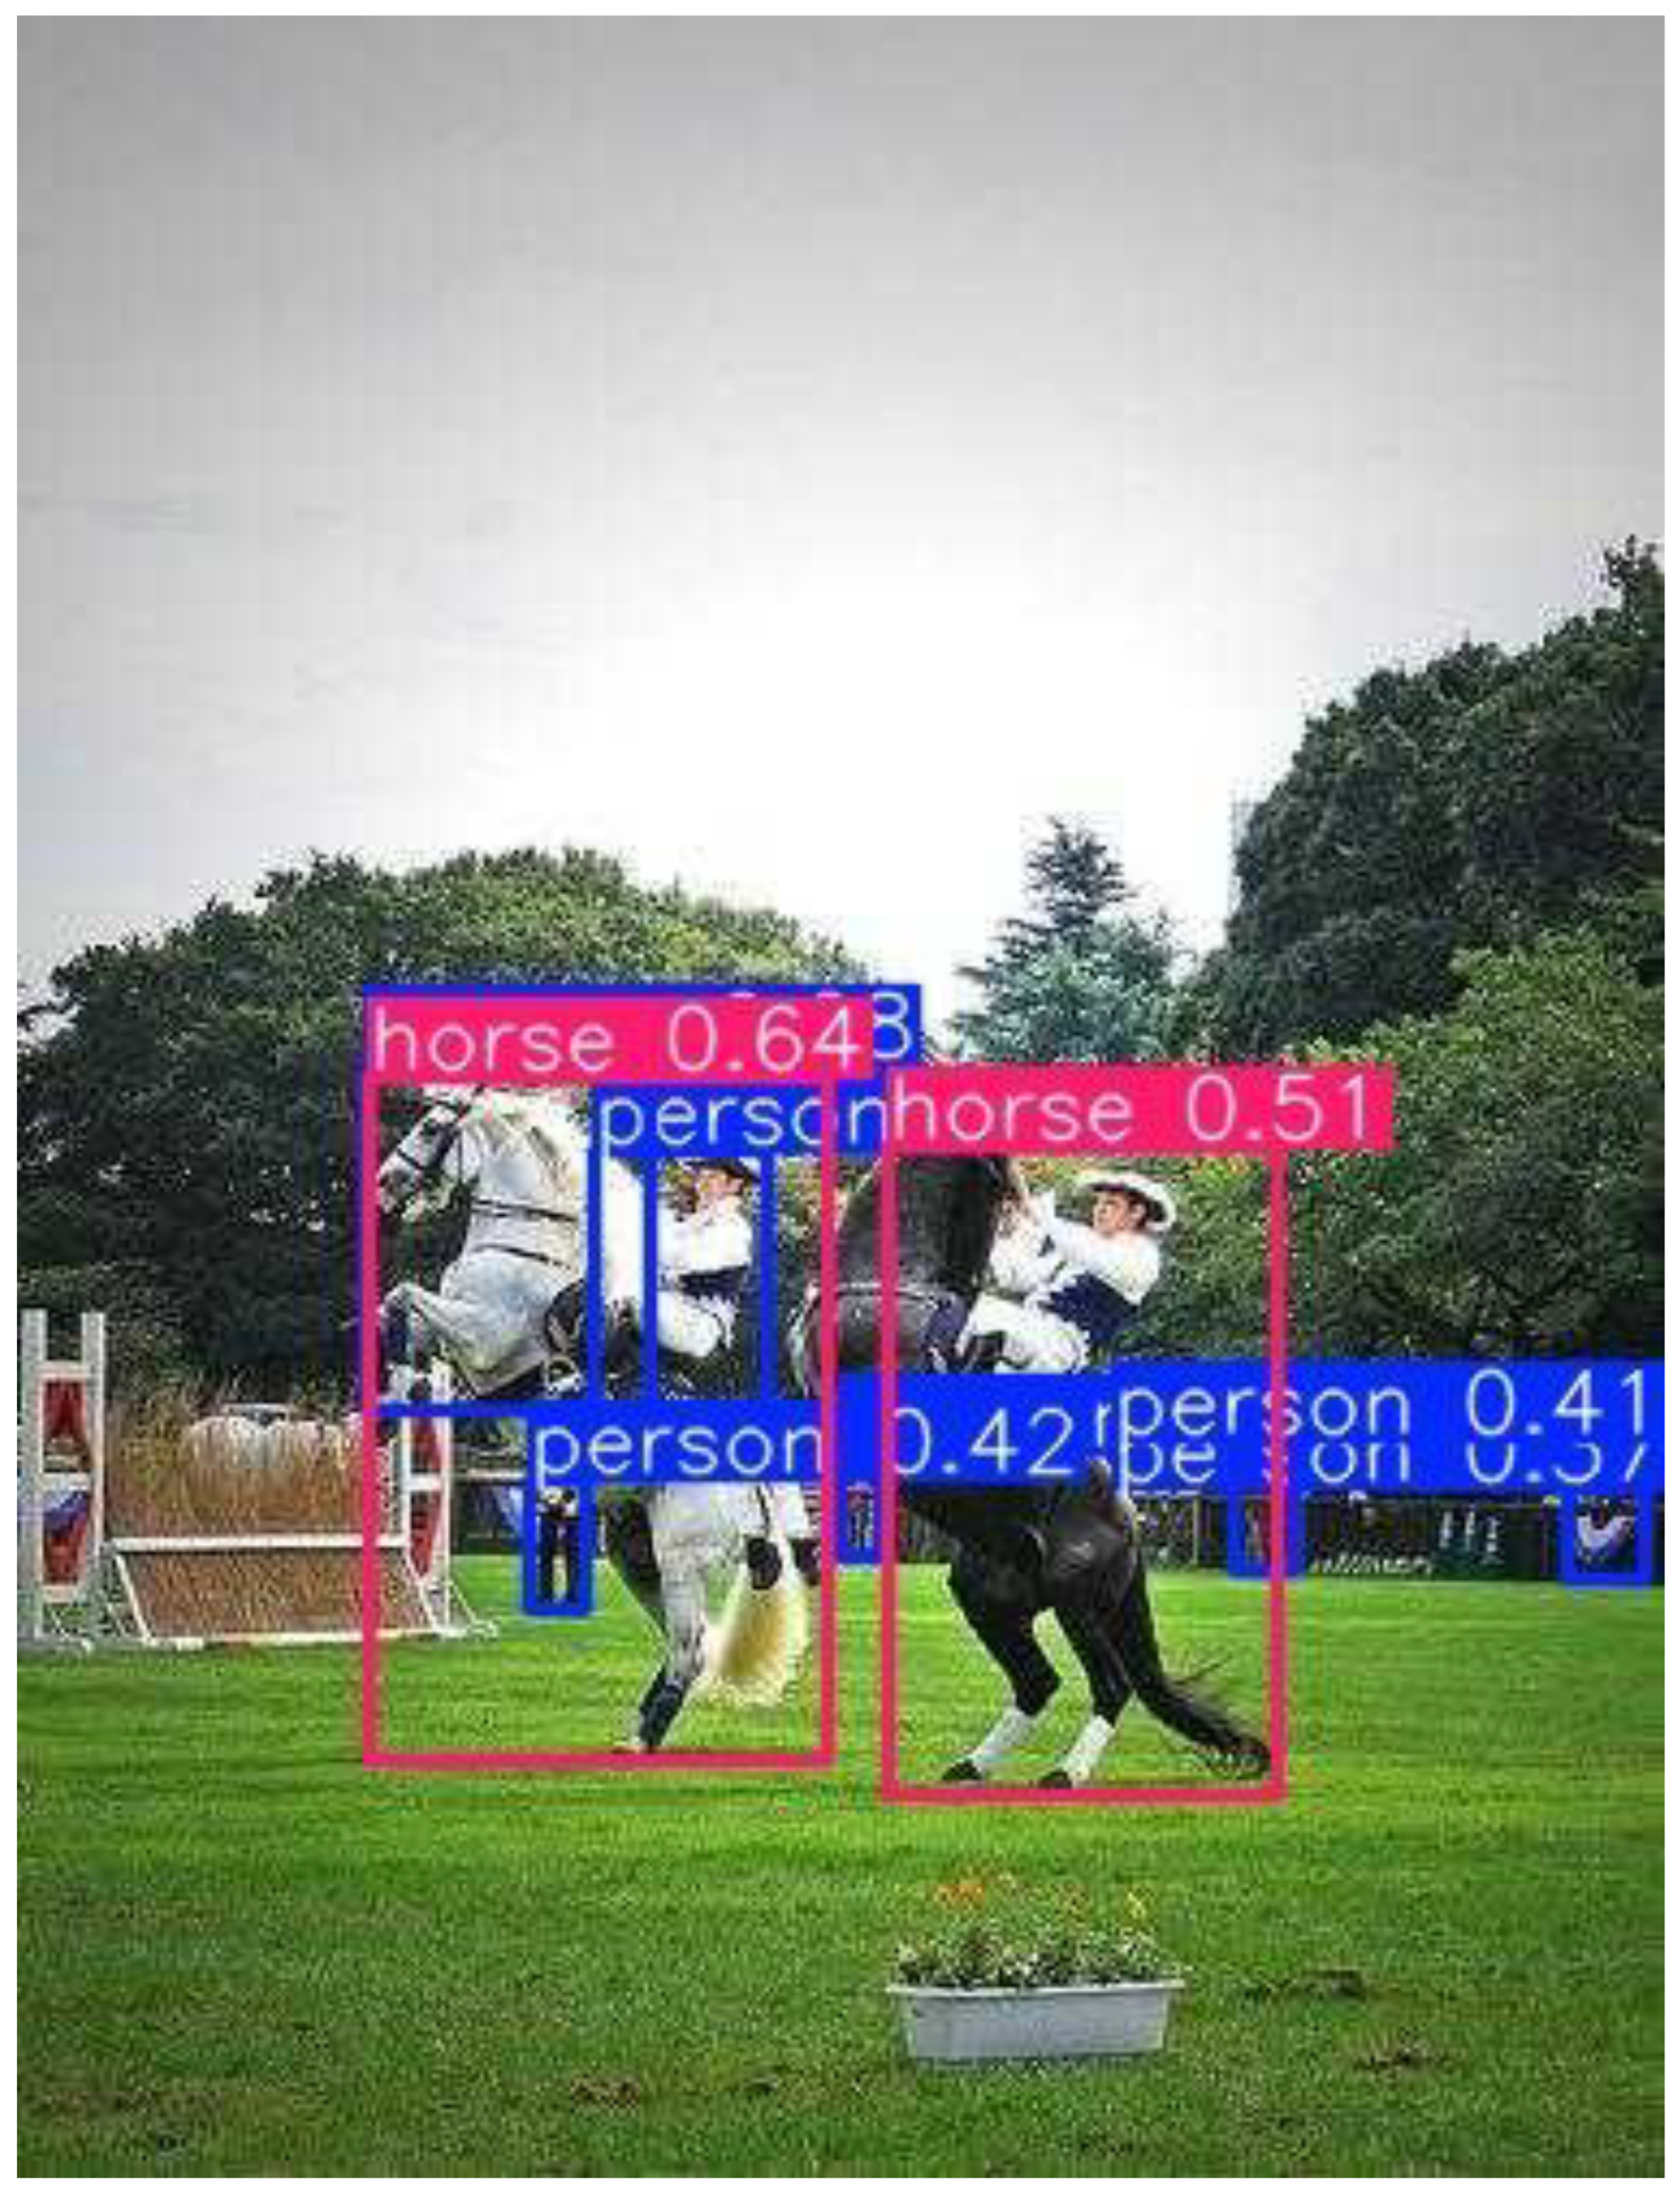
Figure 34.
Qualitative Detections (Images).

Figure 36.
Video Frames / Dense Scenes (Qualitative).
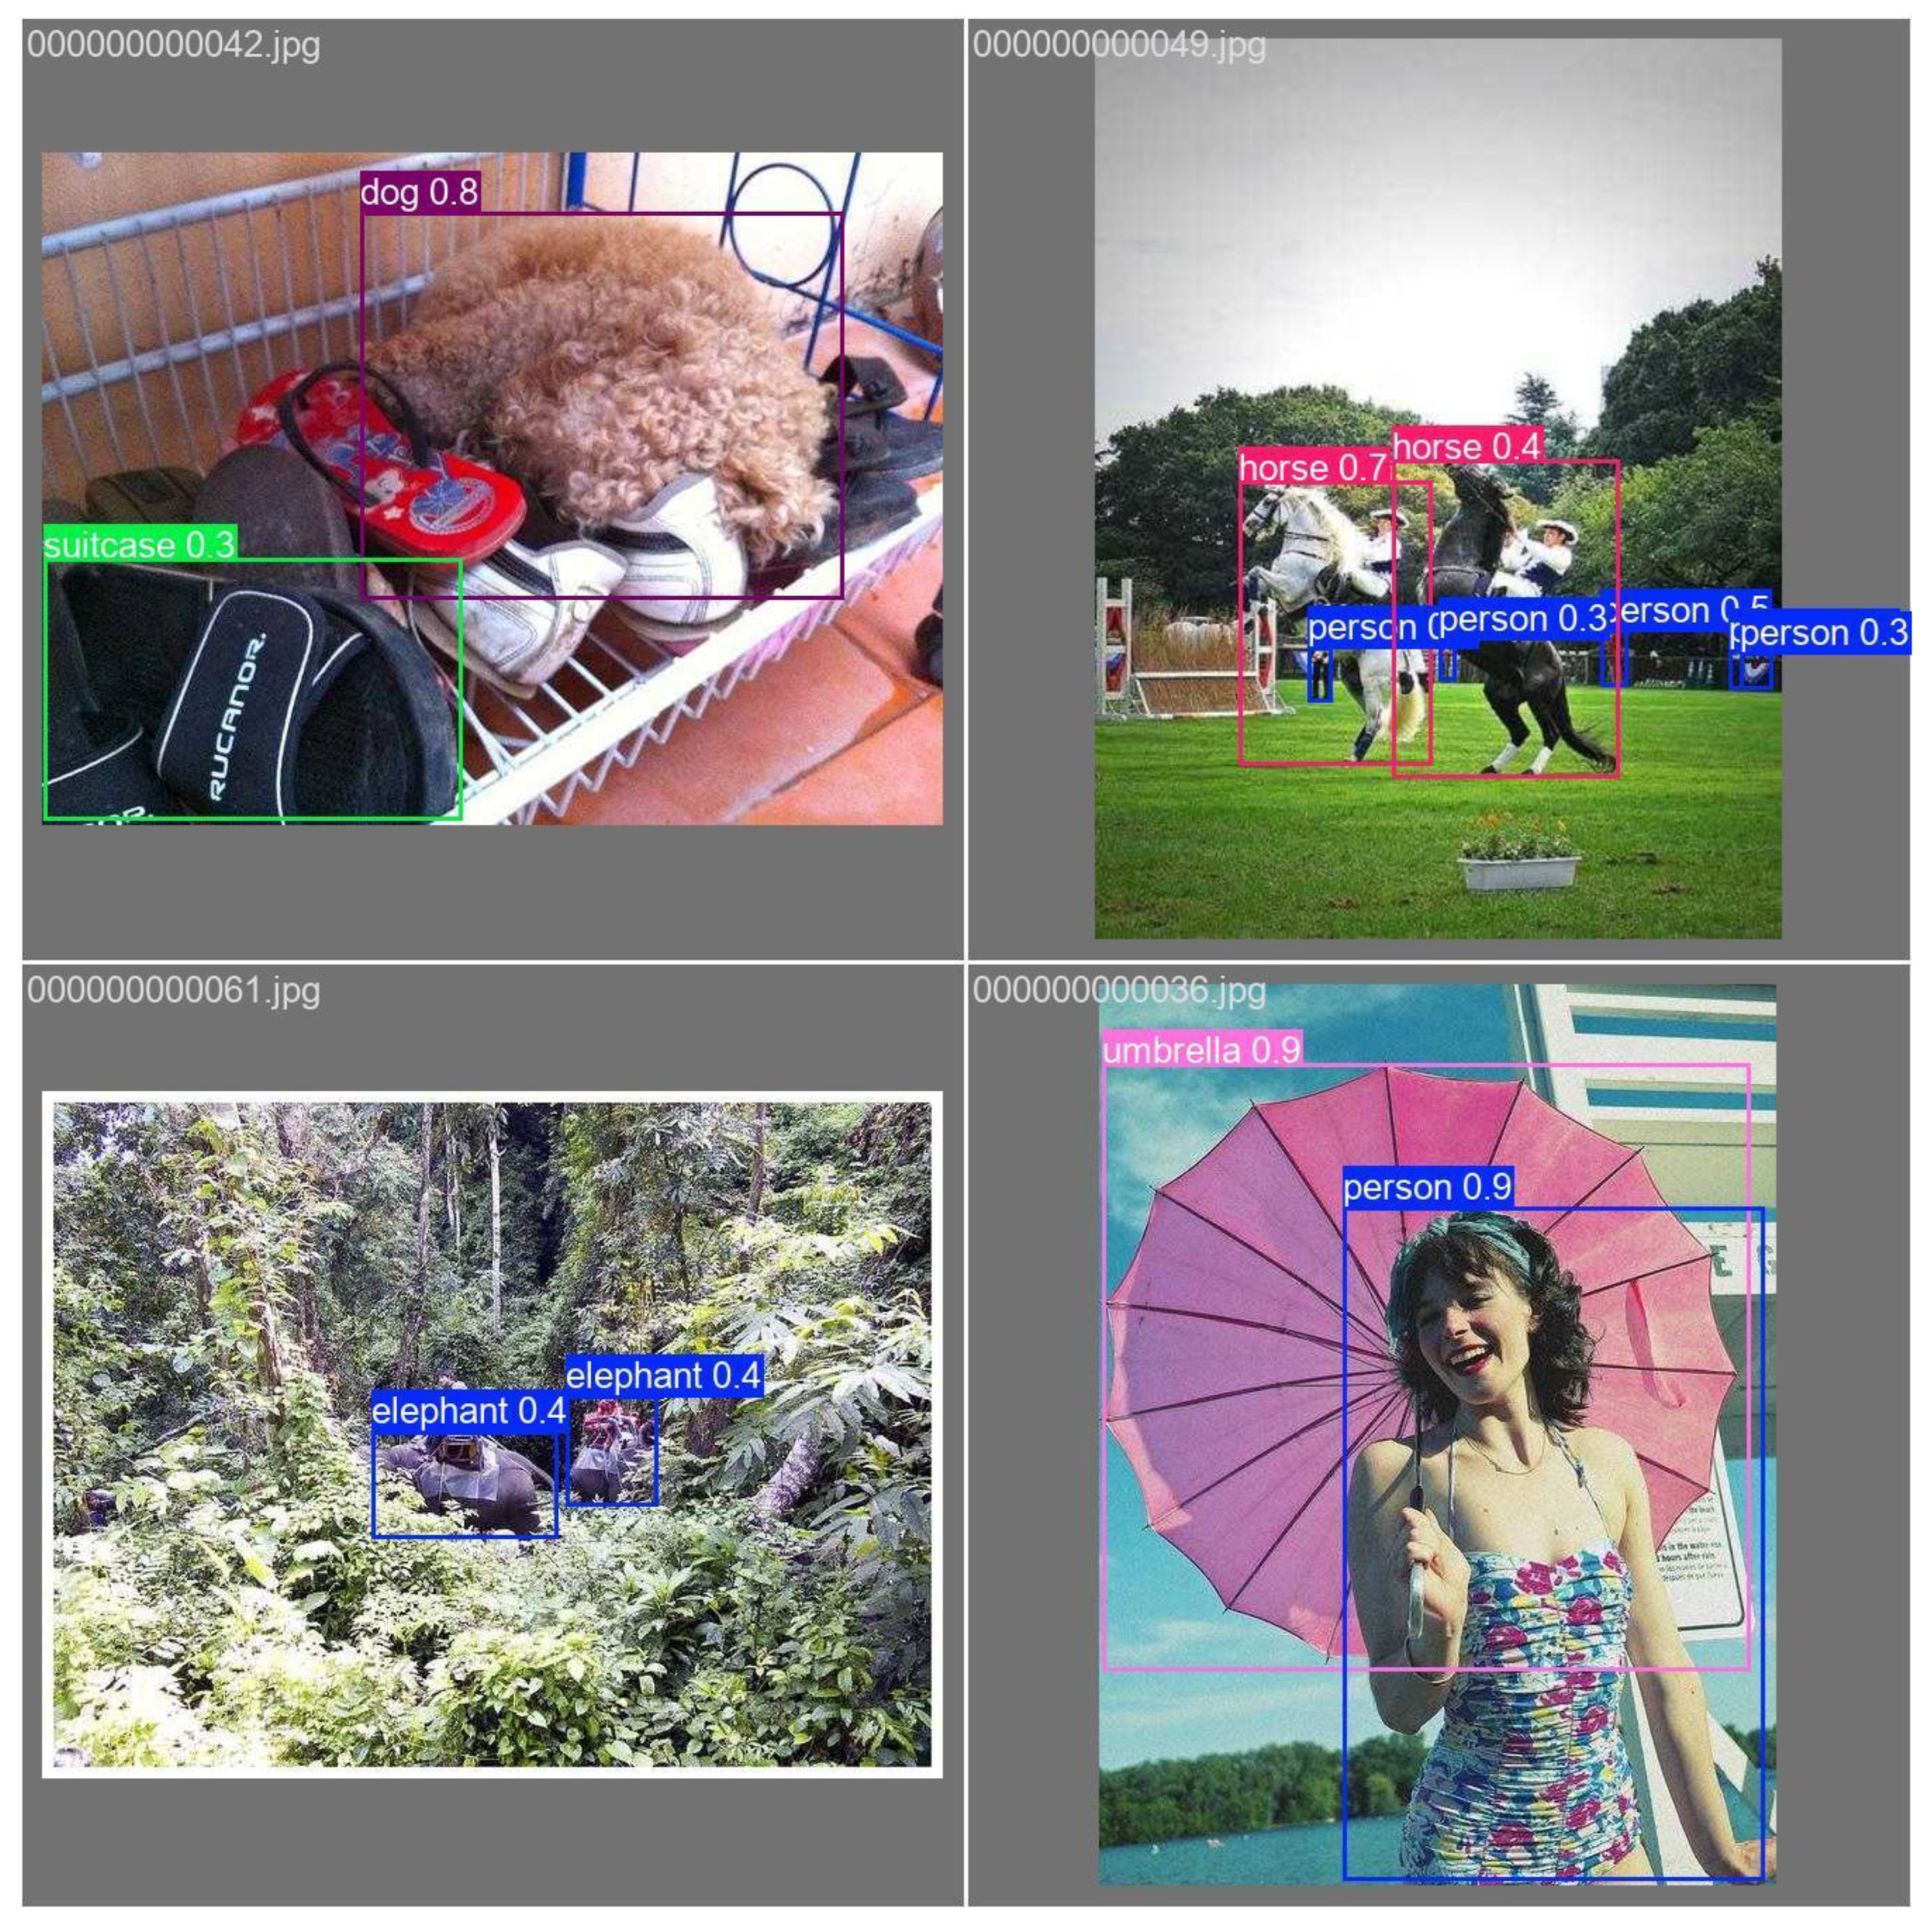
Figure 37.
Video Frames / Dense Scenes (Qualitative).
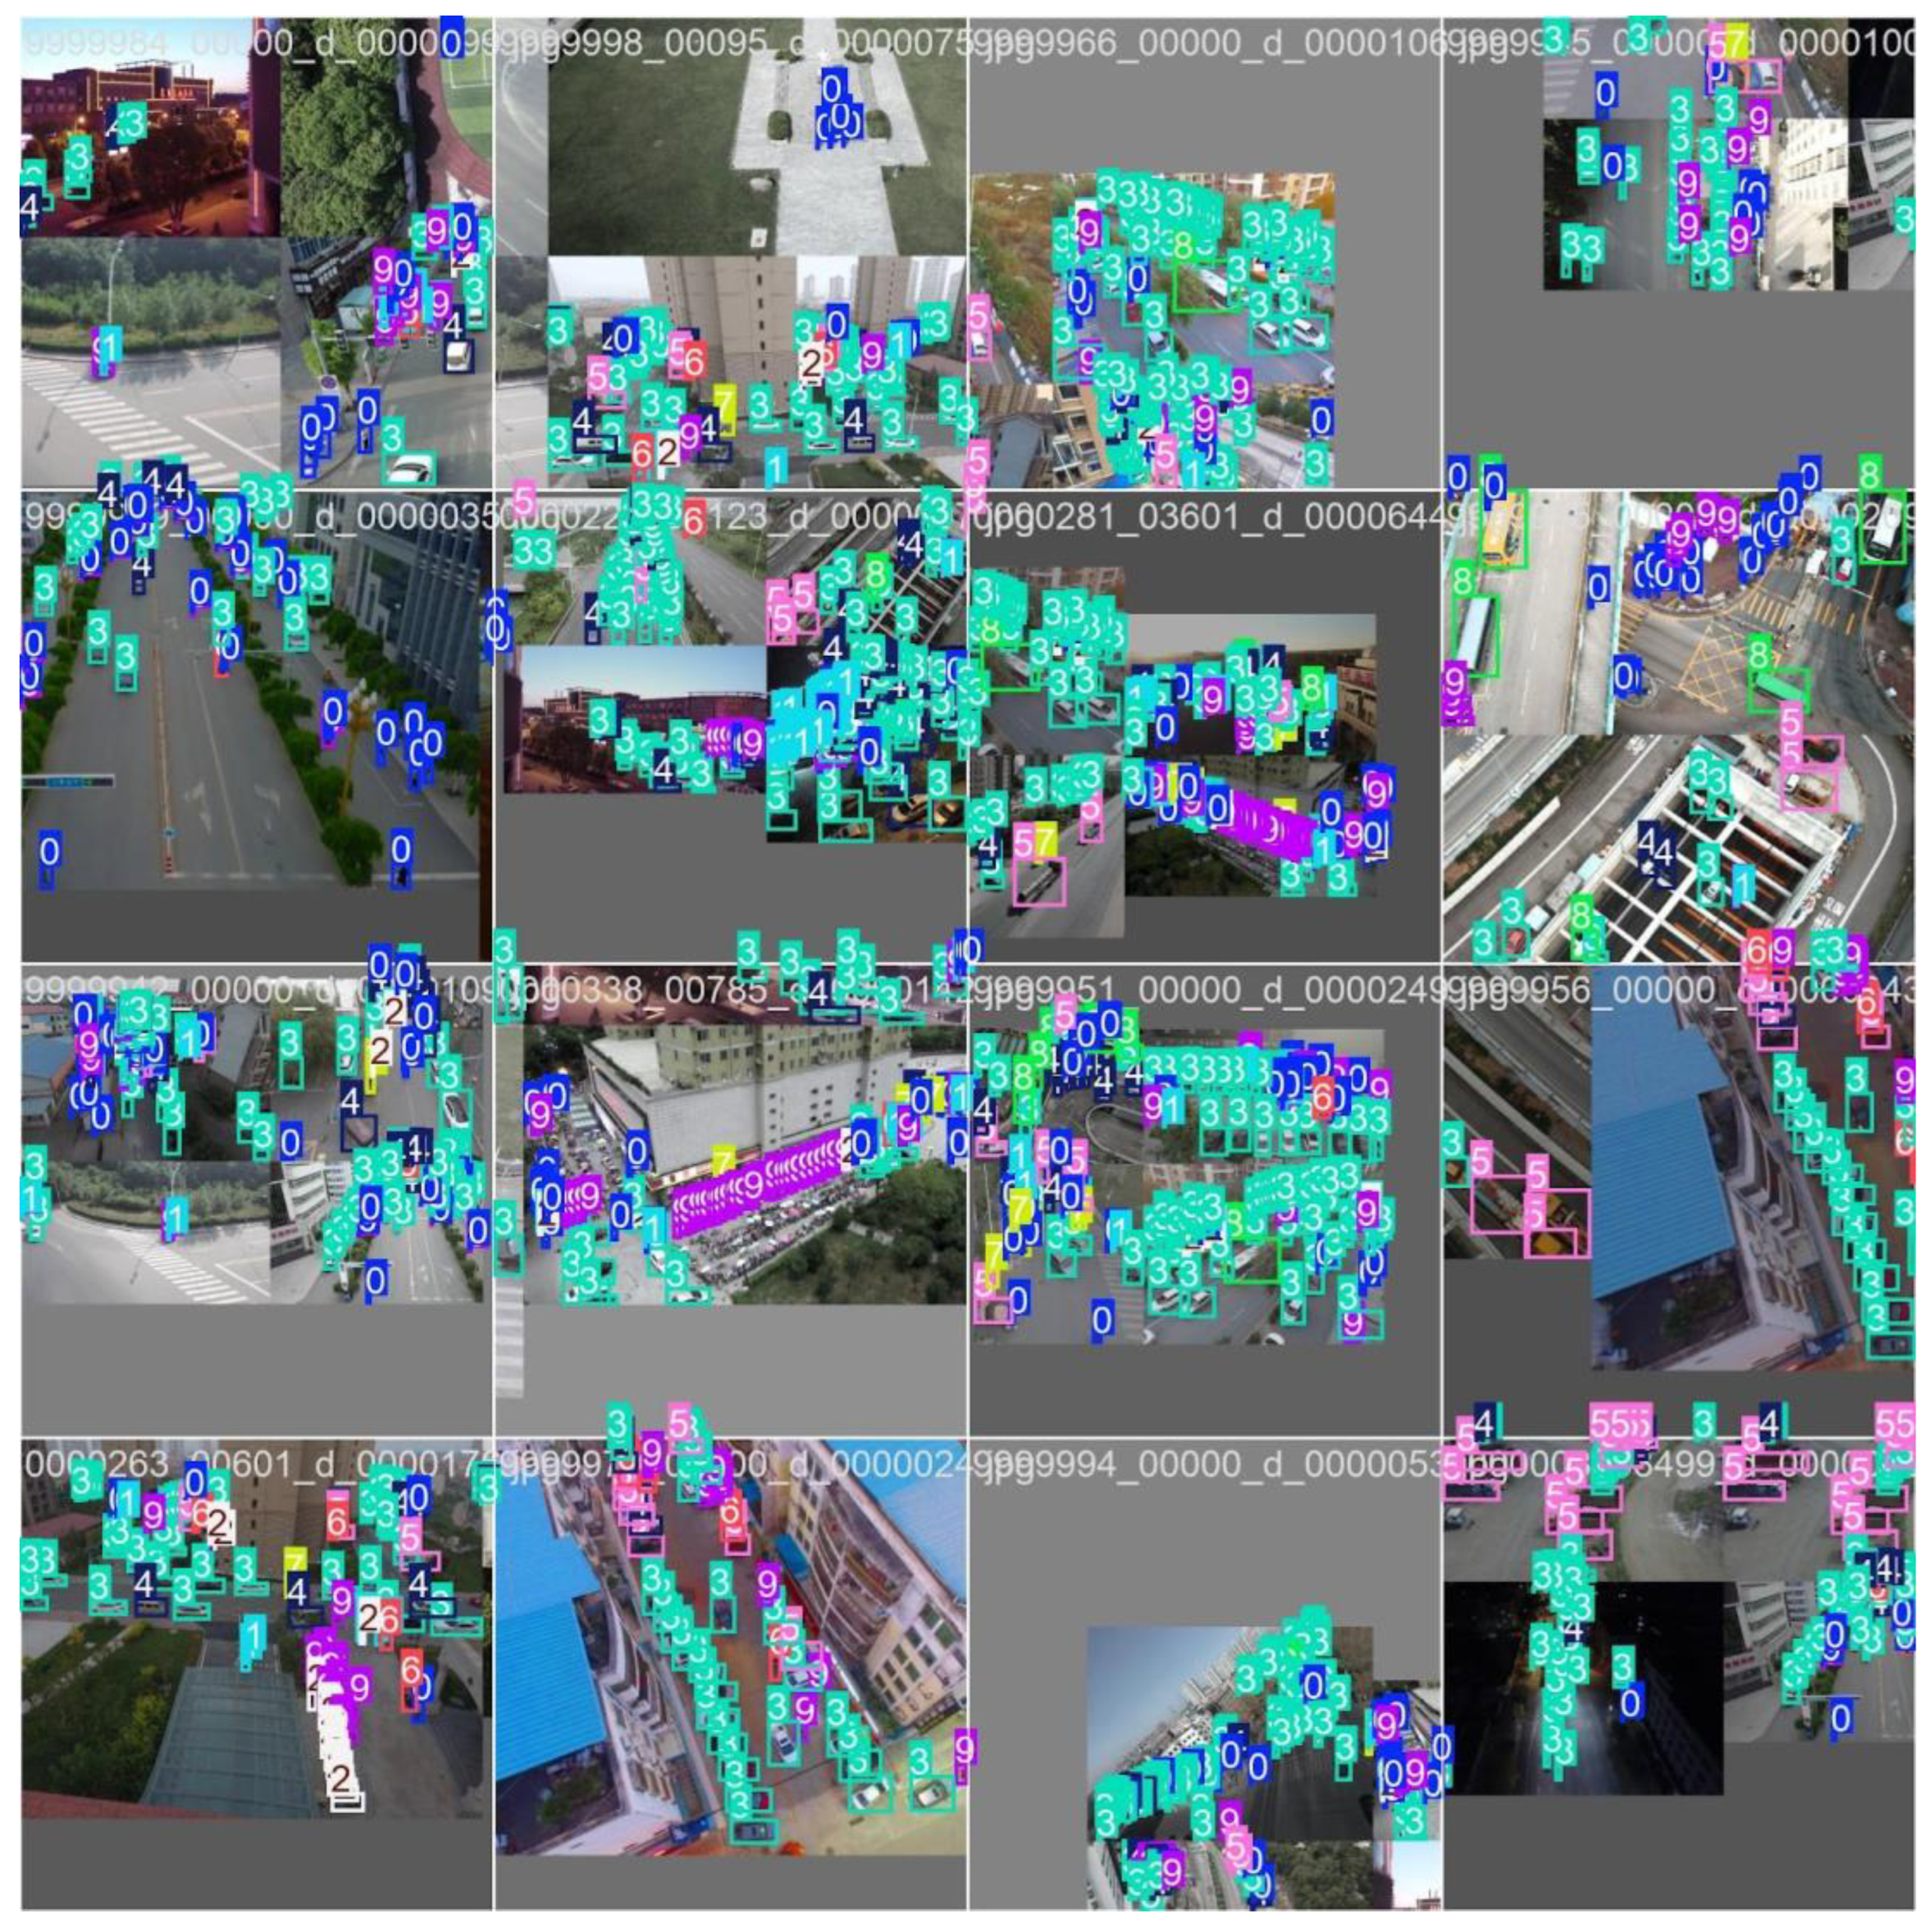
Figure 38.
Training curves for VisDrone YOLO11n model.

Figure 39.
Dataset analysis plots including class distribution and bounding box clustering.
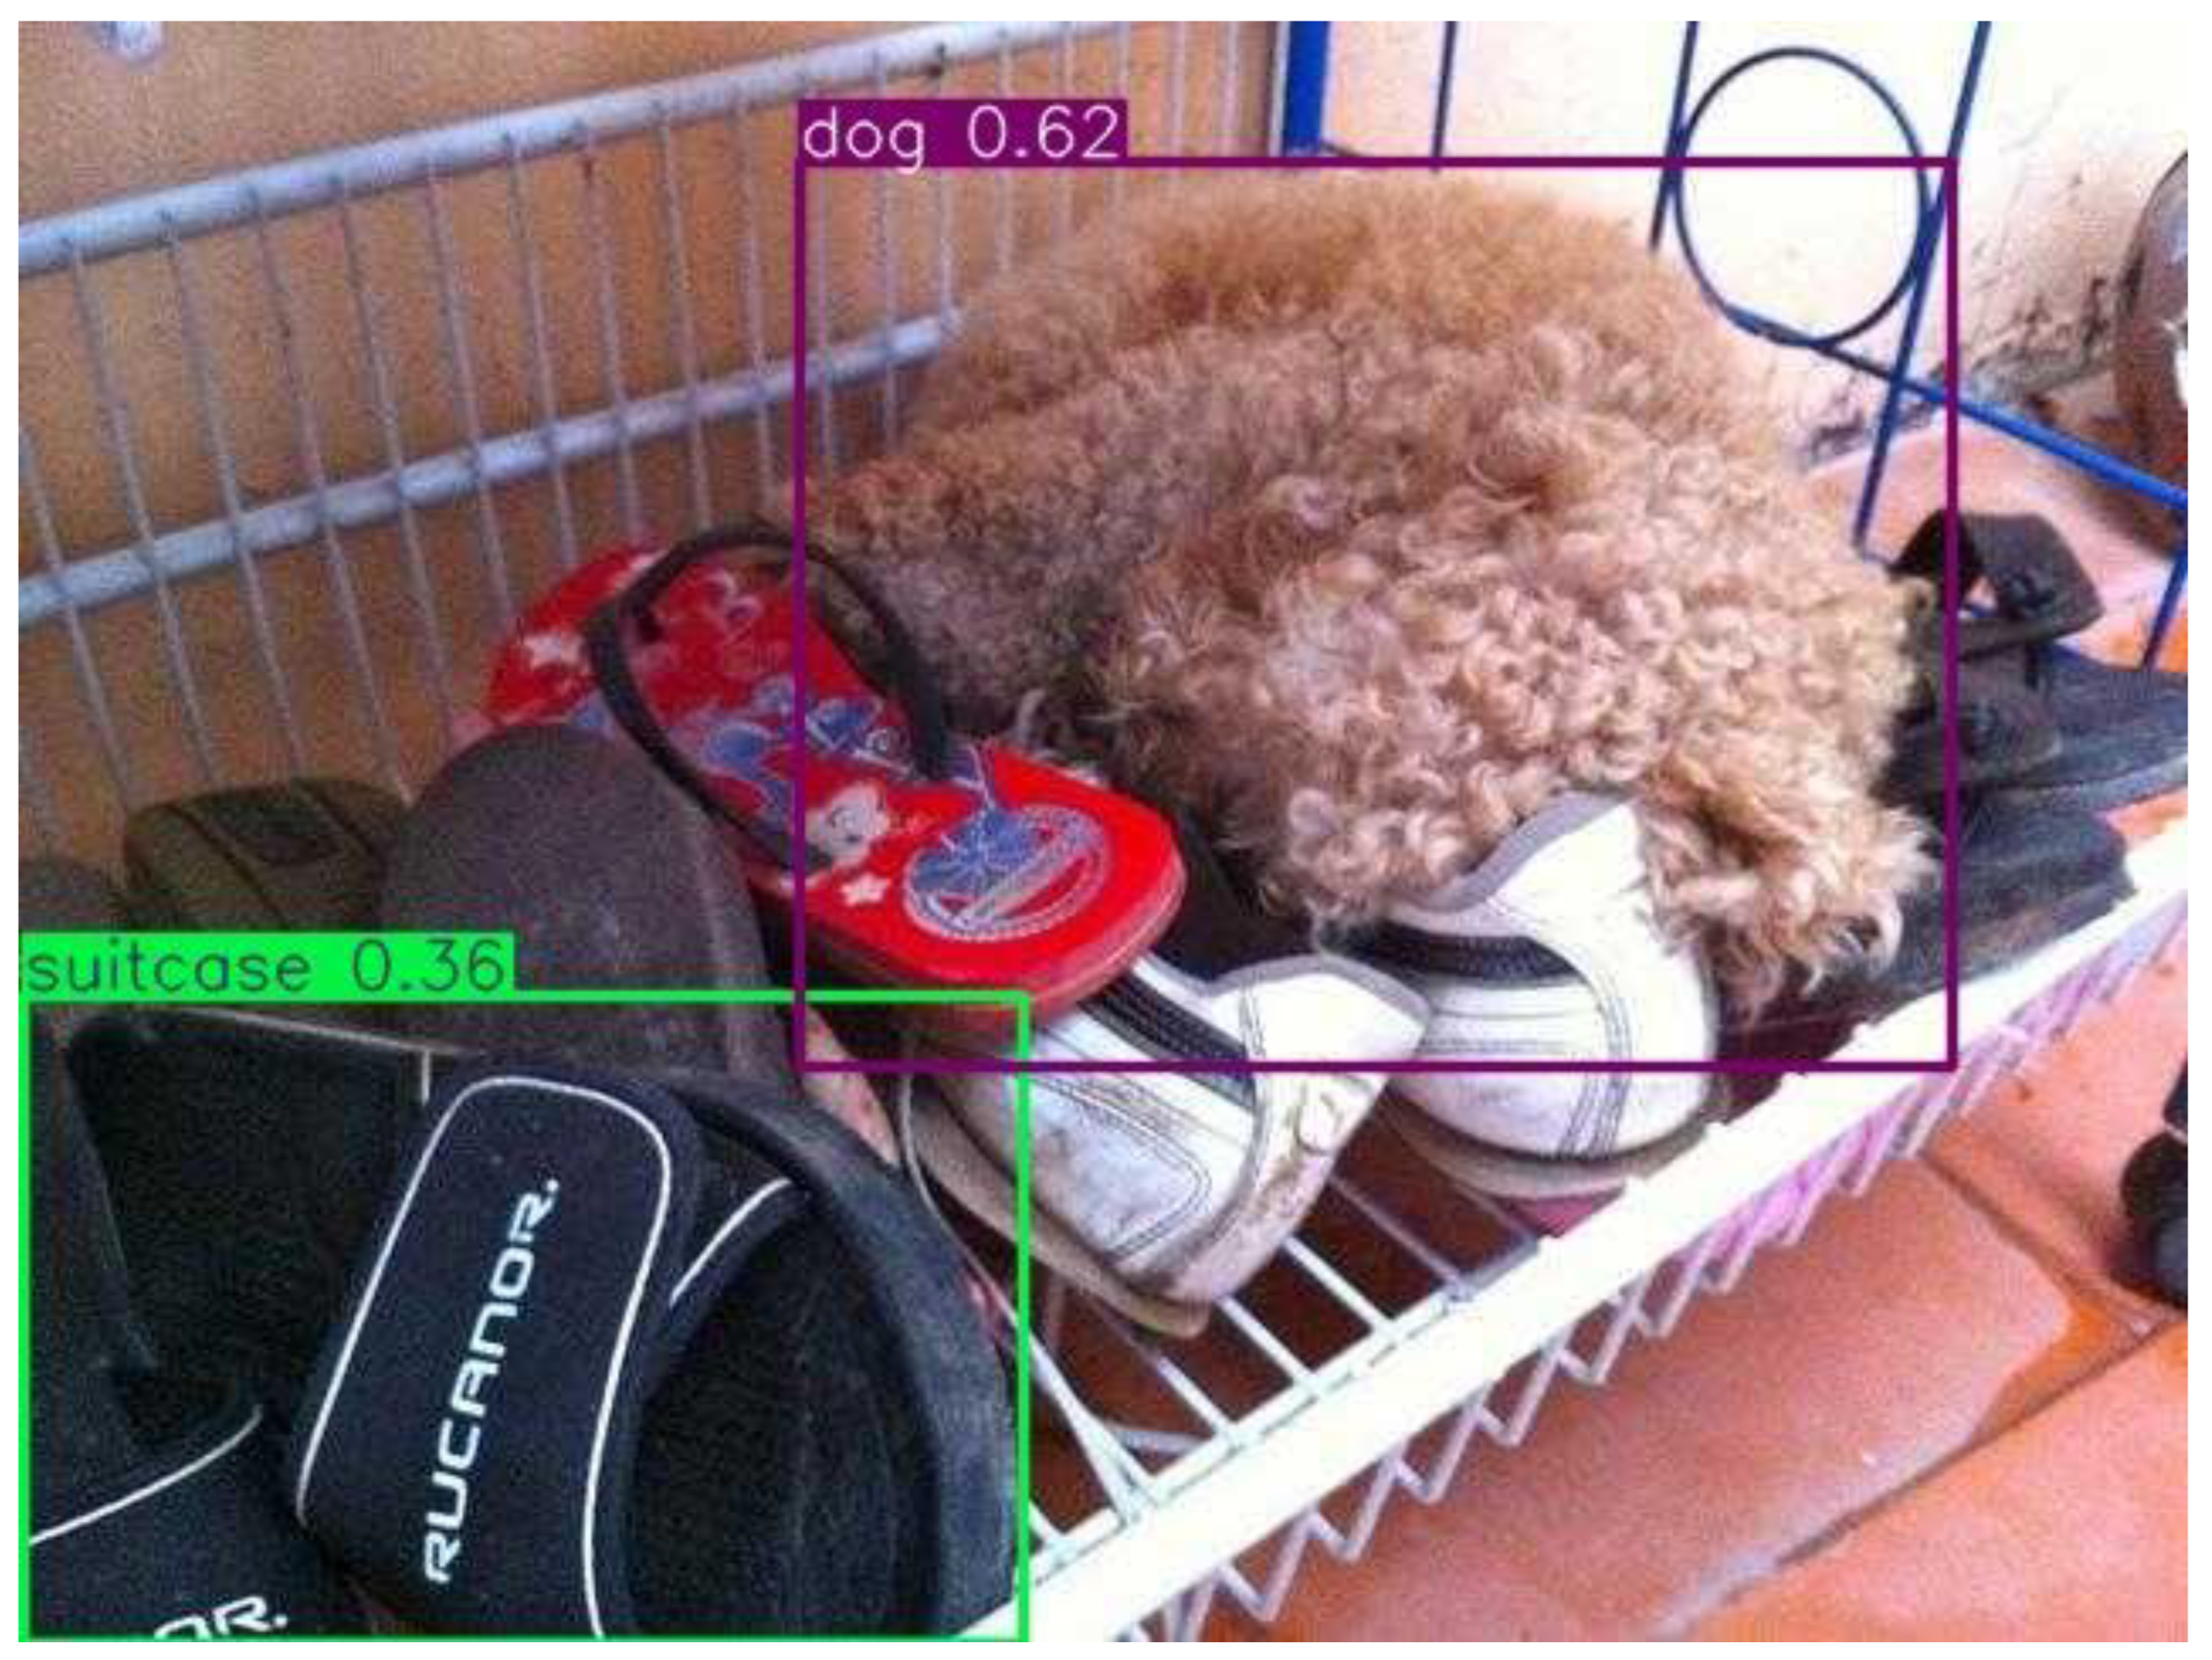
Figure 40.
Confusion matrices for validation set.
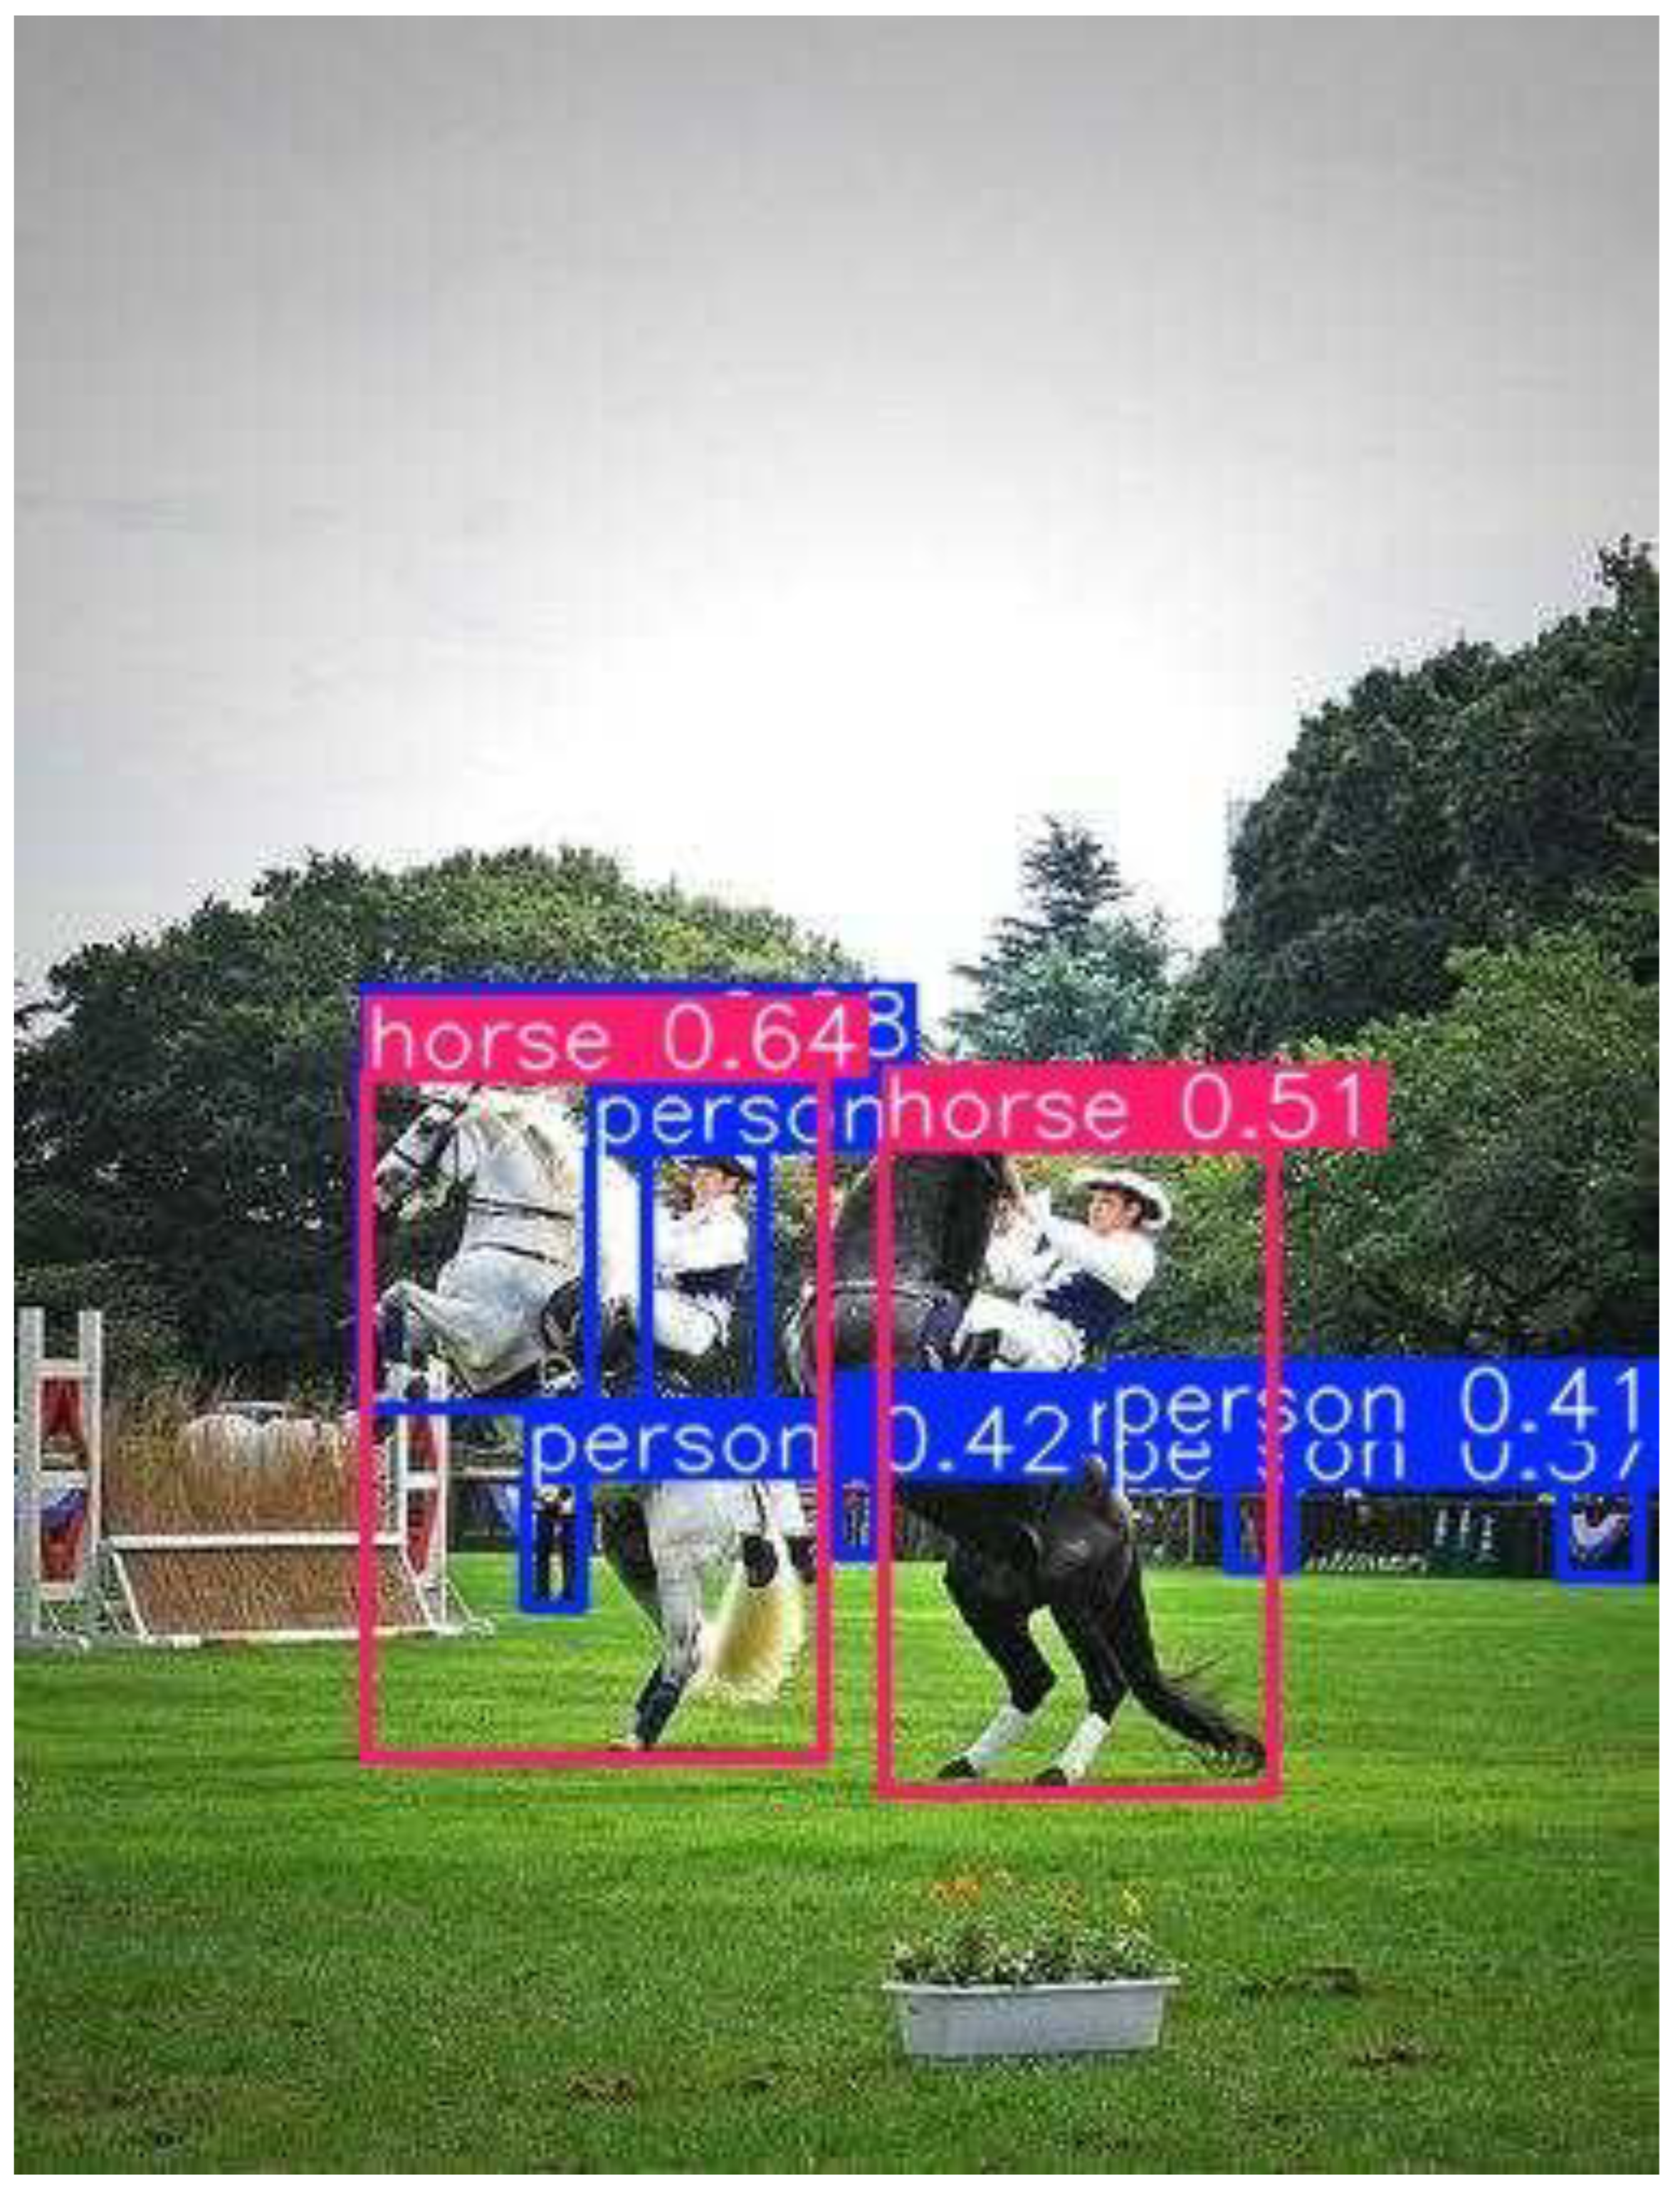
Figure 41.
Precision-Recall and confidence relationship plots.
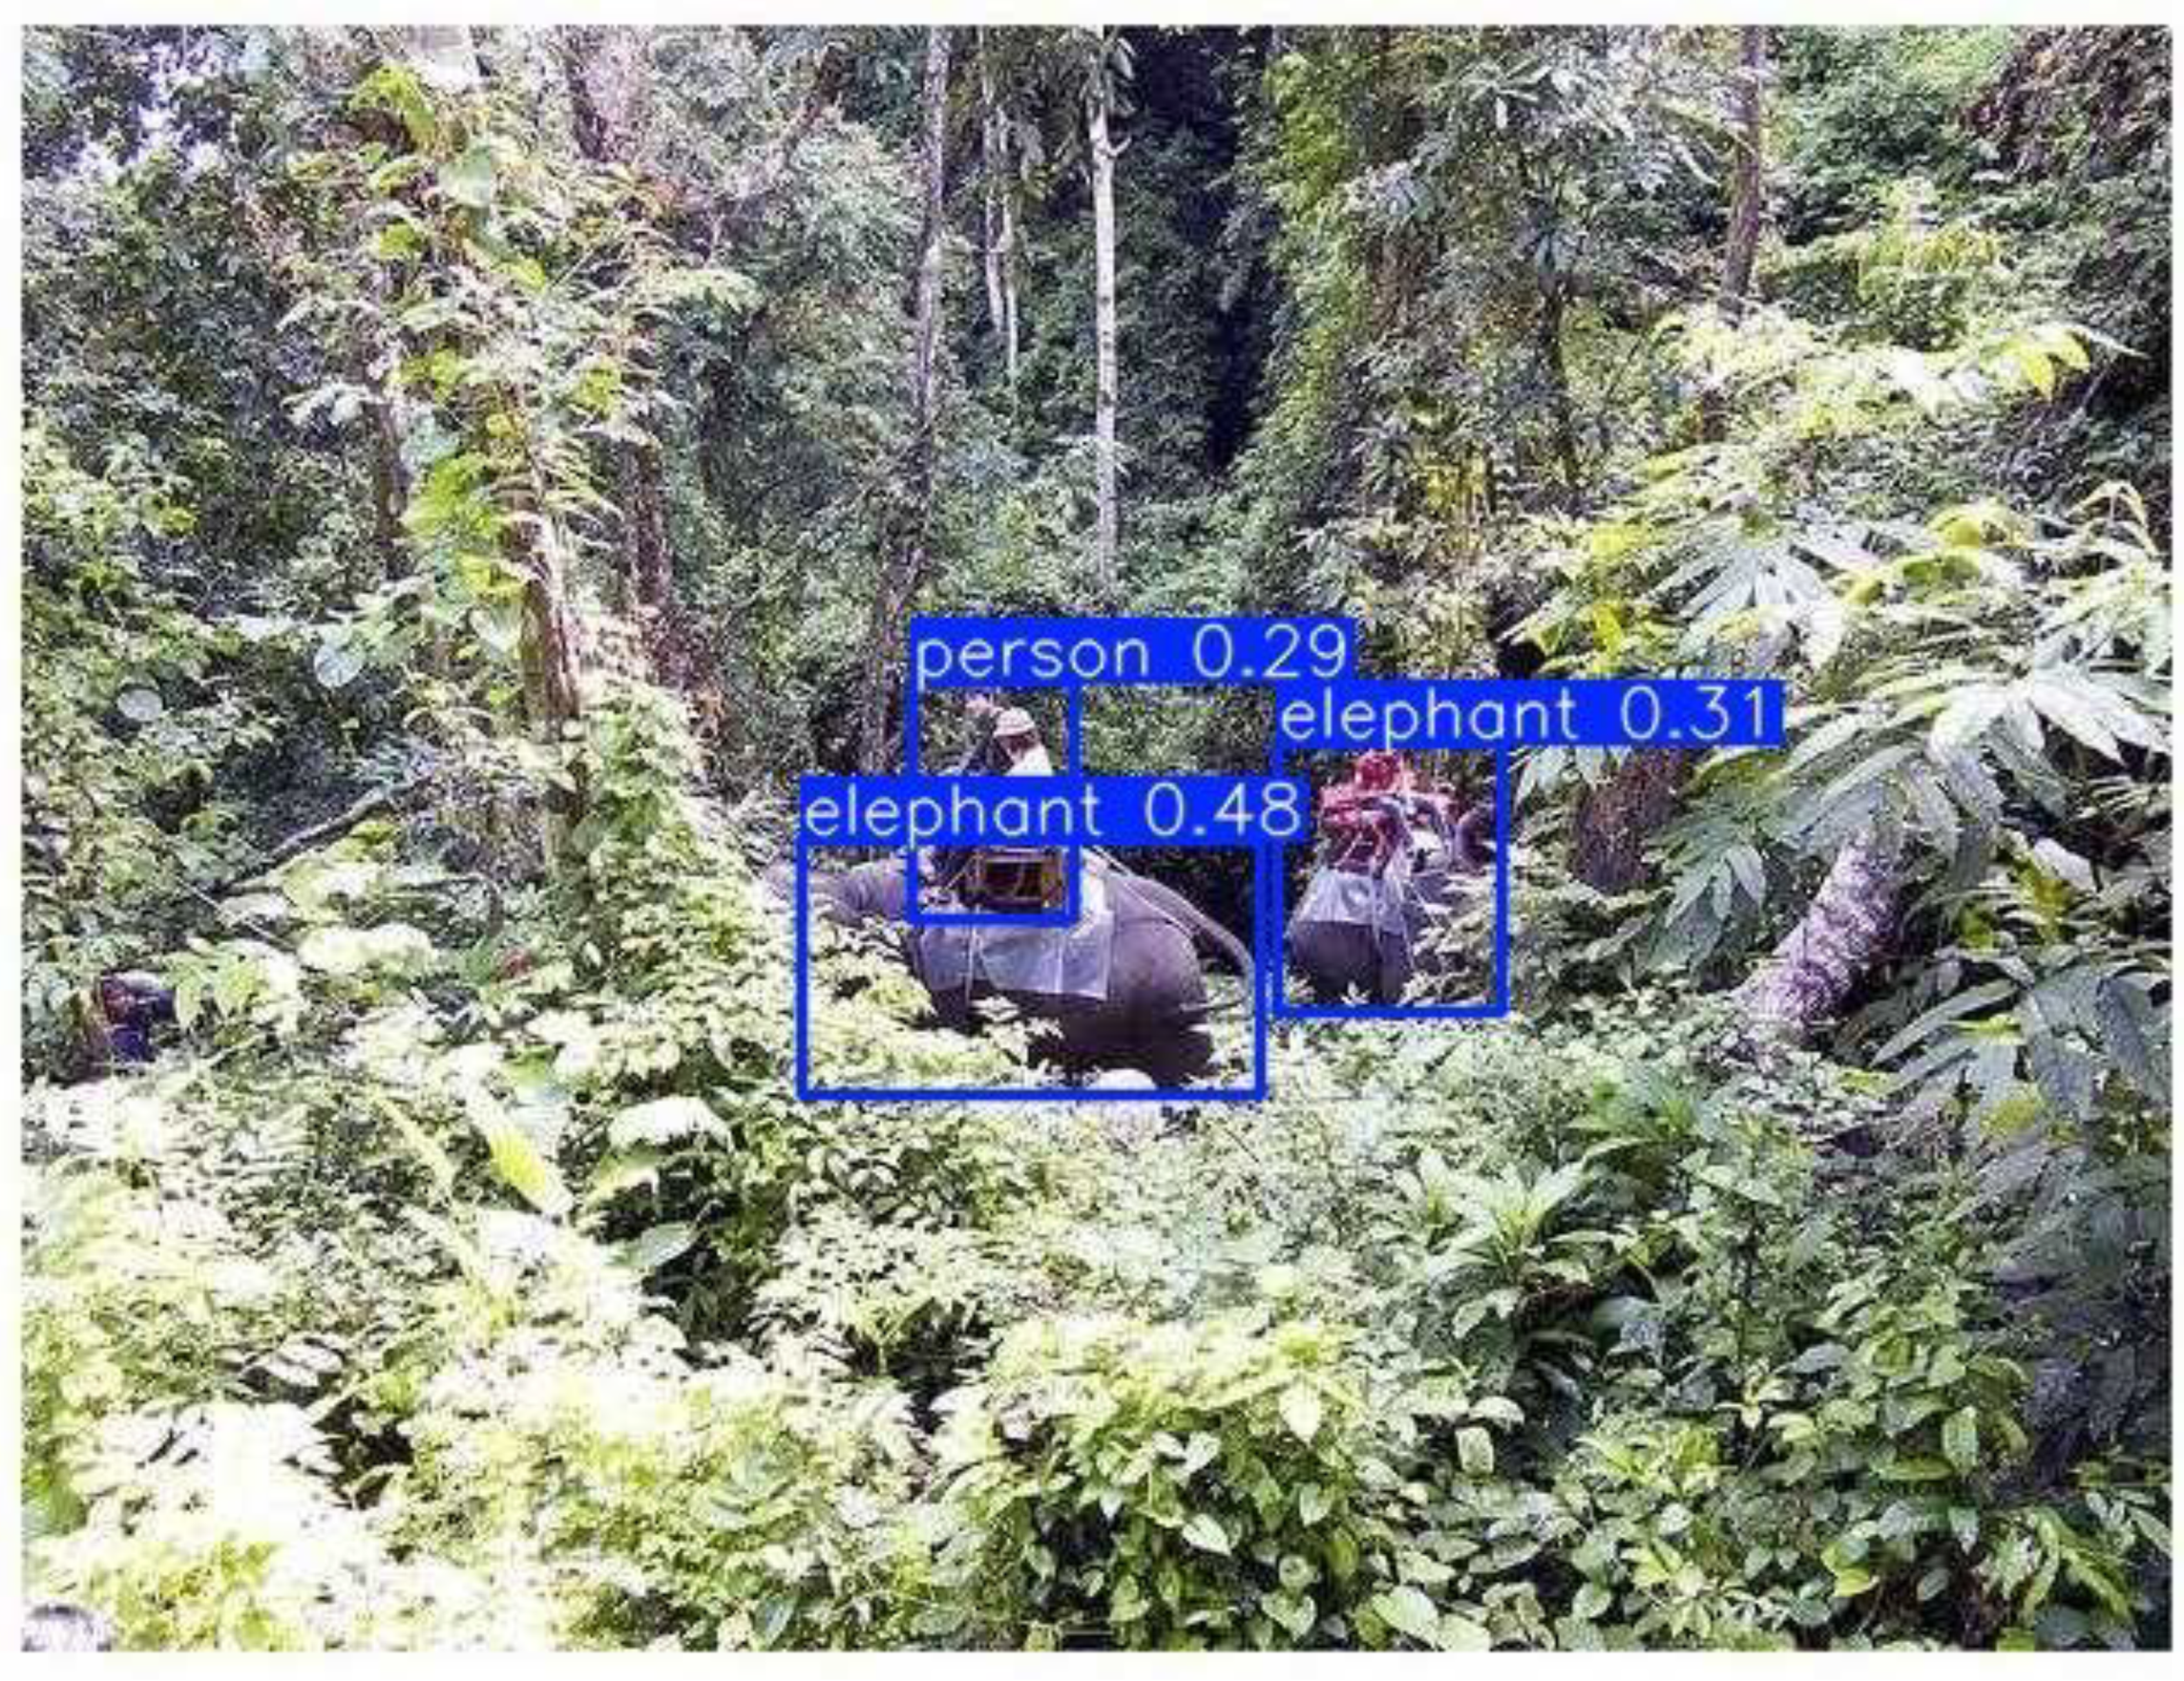
Figure 42.
Example video frames with multiple detections.
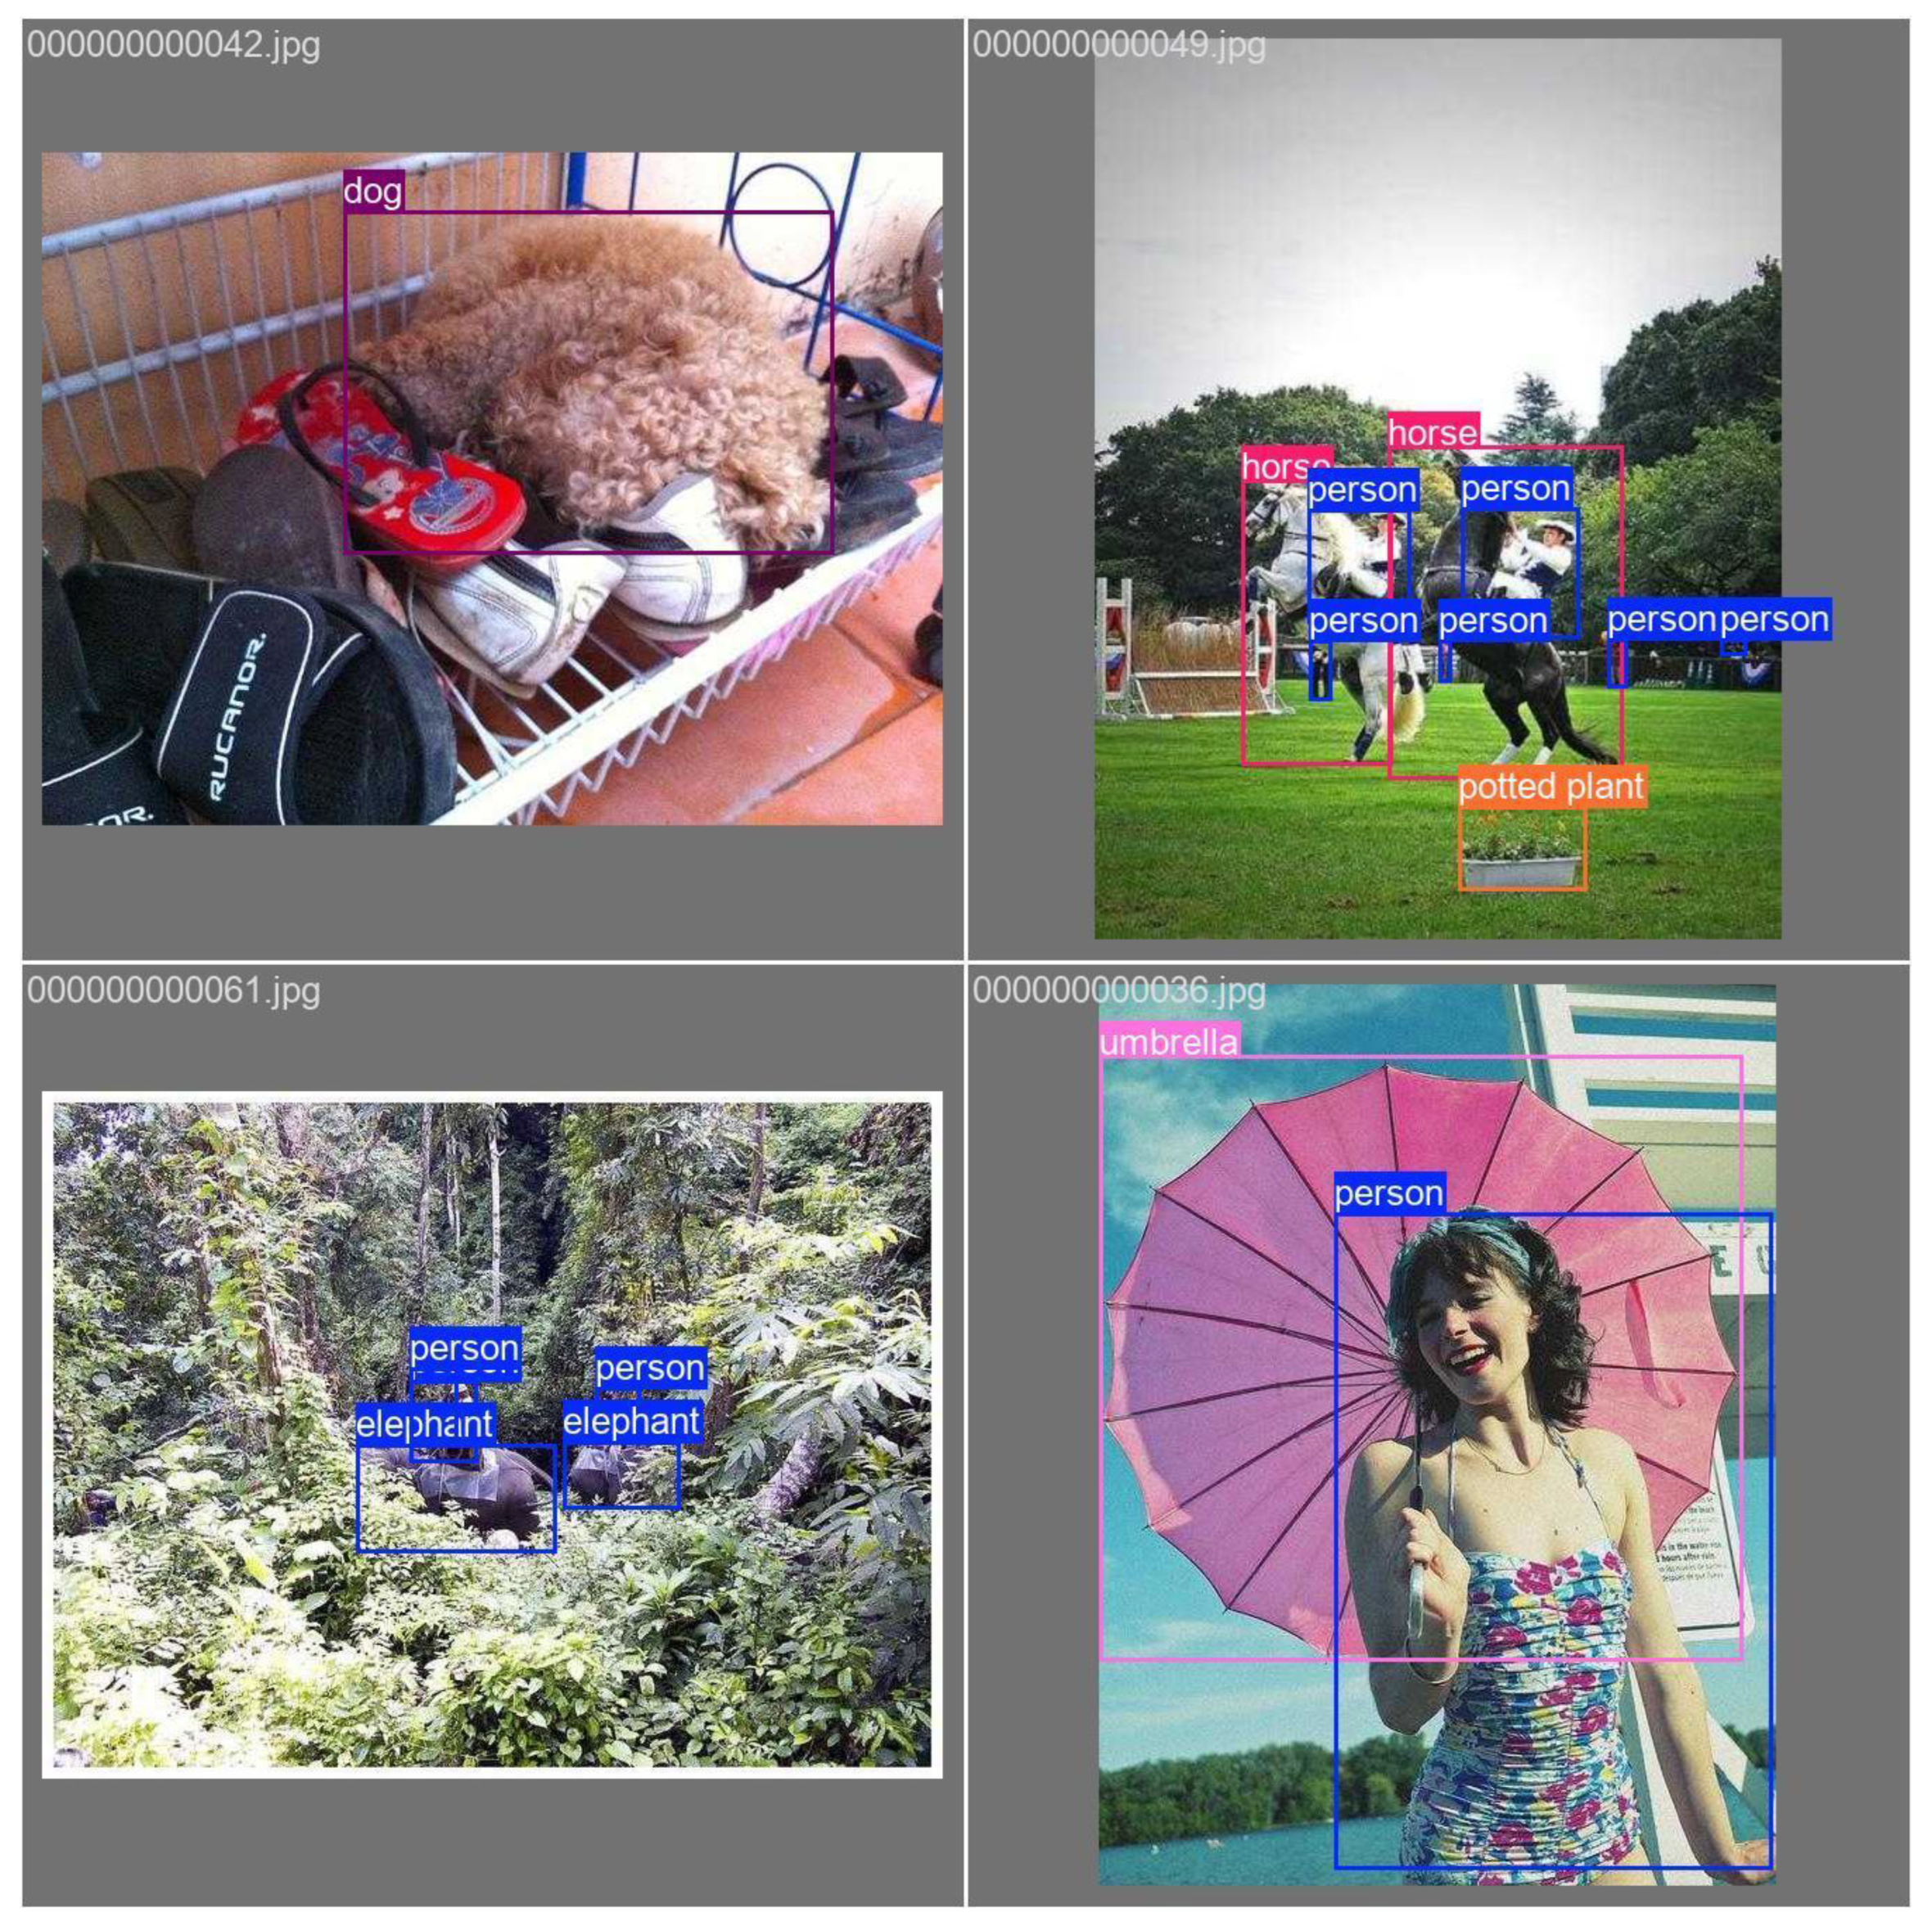
Figure 43.
Detection in dense urban traffic video sequences.
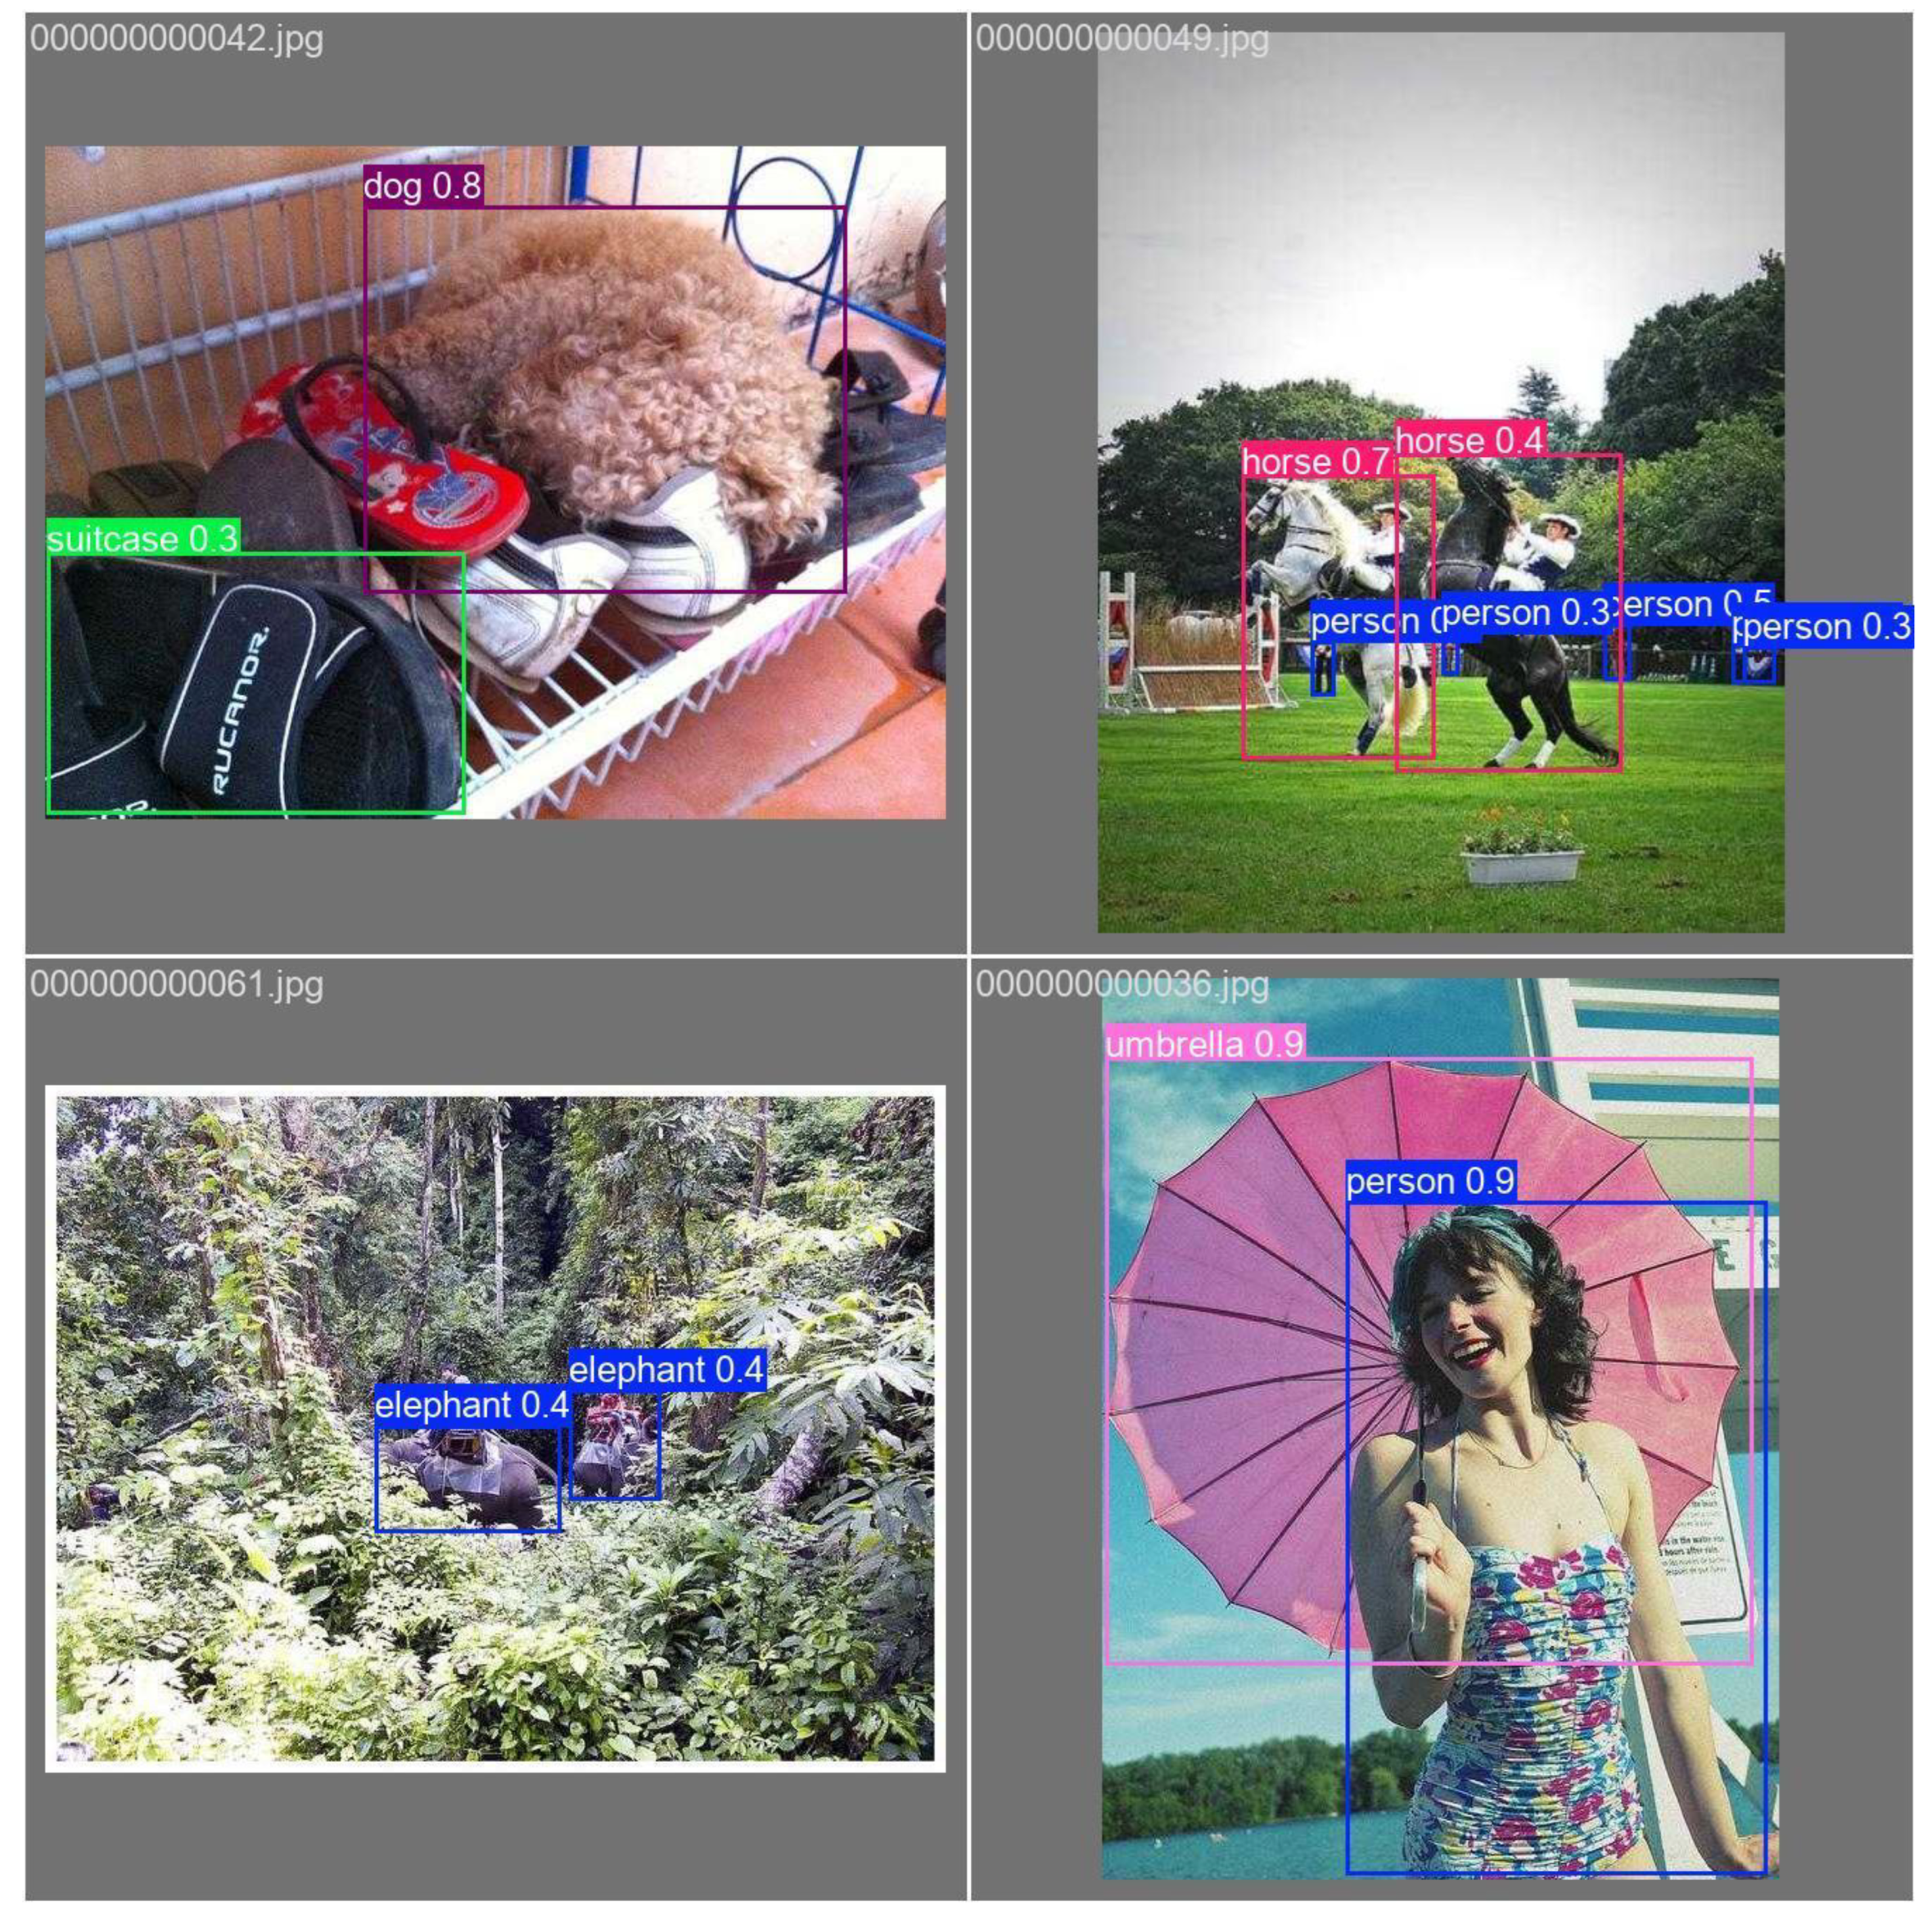
Figure 44.
Single-object tracking success and precision plots.
Figure 45.
Multi-object tracking in a dense traffic scenario.

Figure 46.
Predicted vs. ground truth density maps.
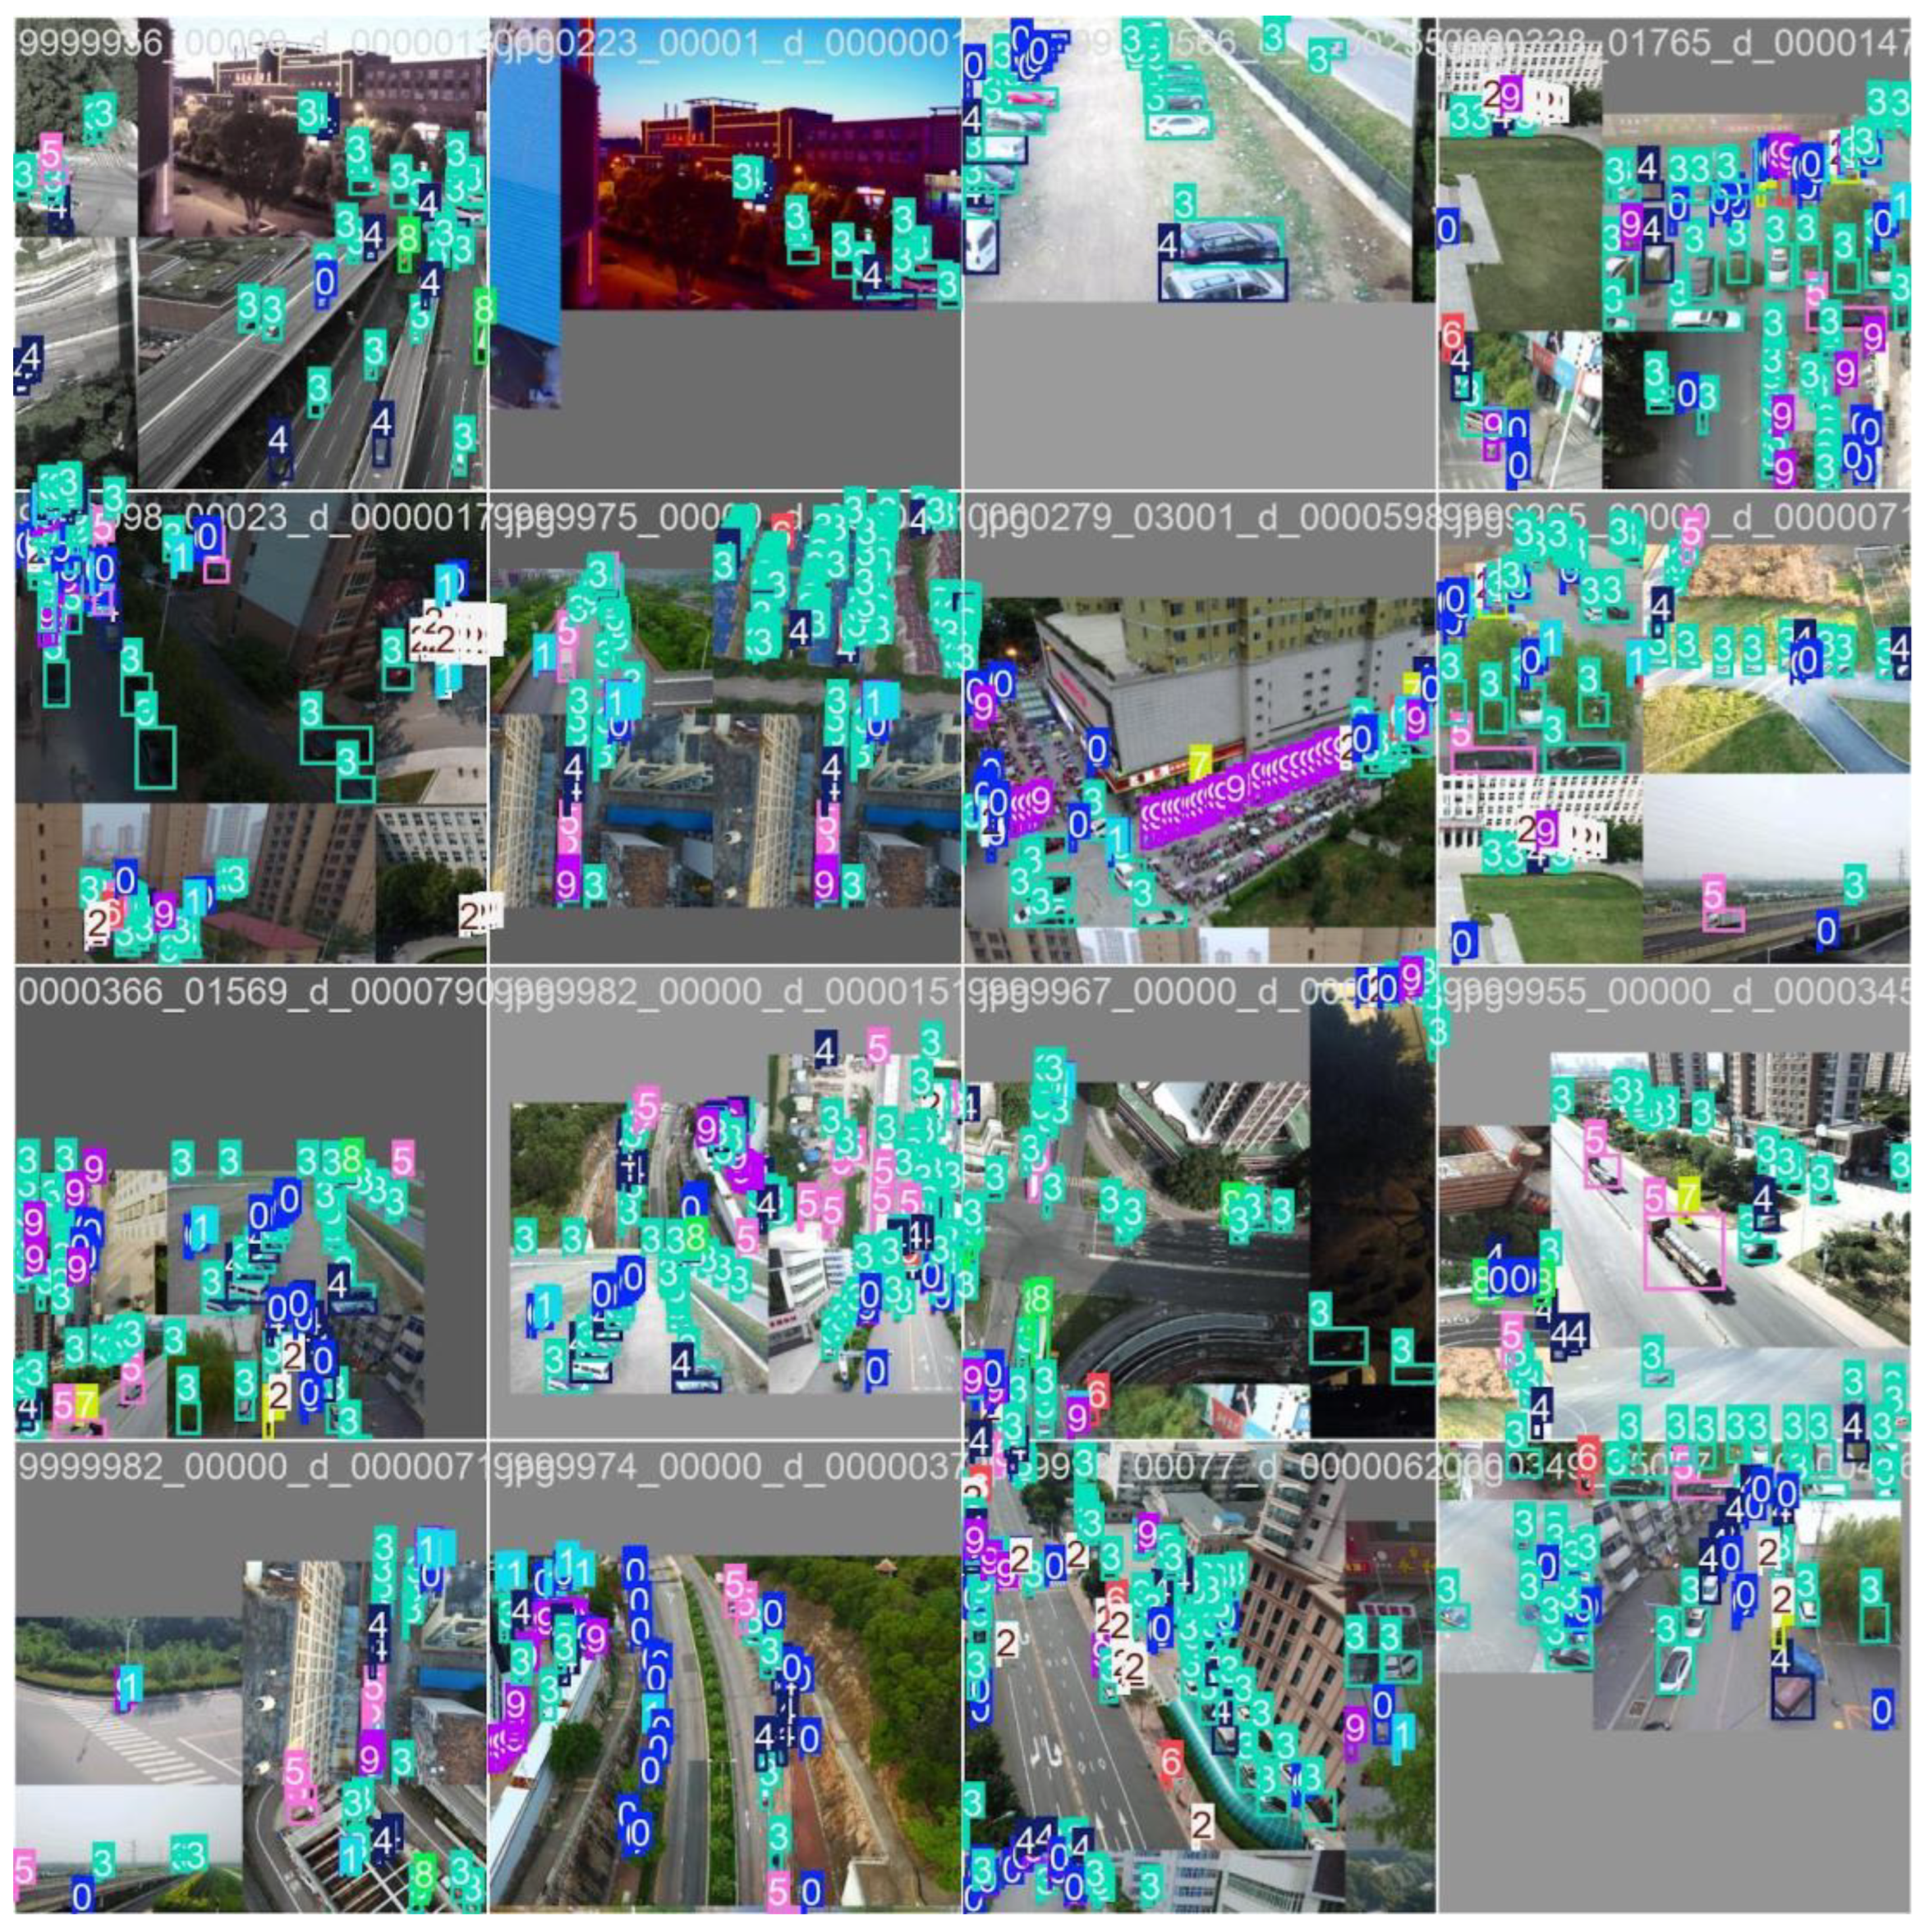
Figure 49.
: Accident Detection System.
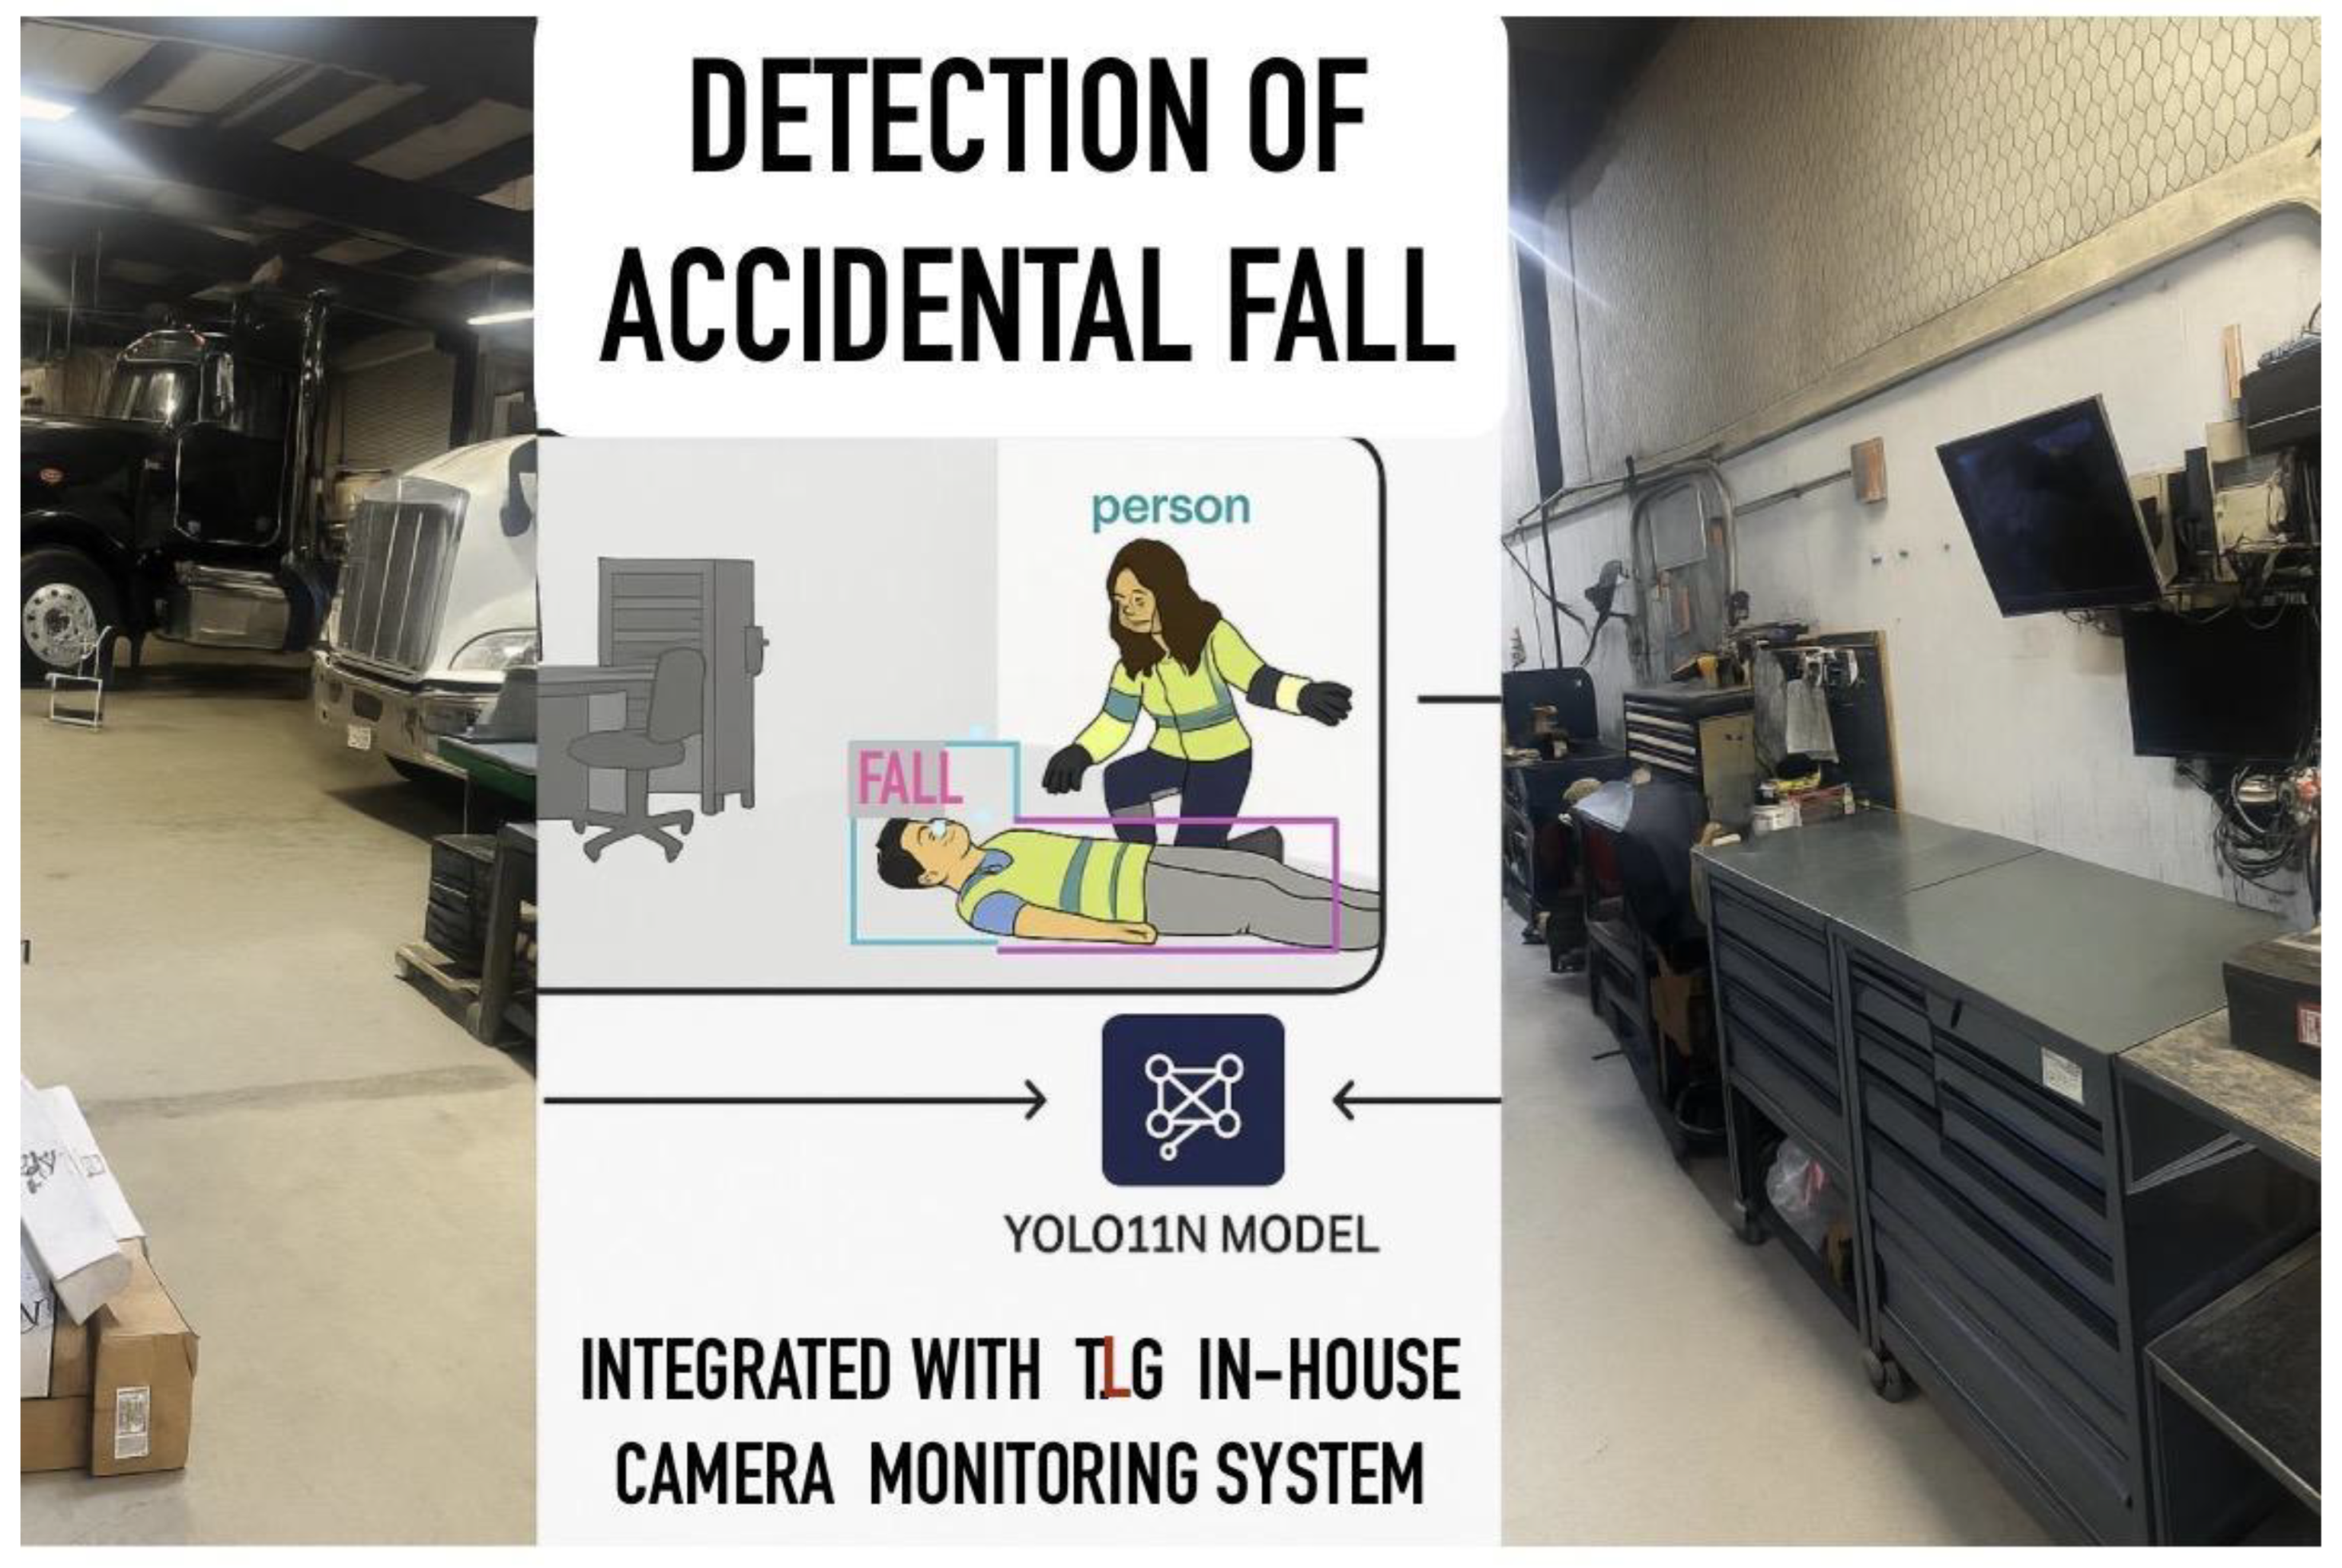
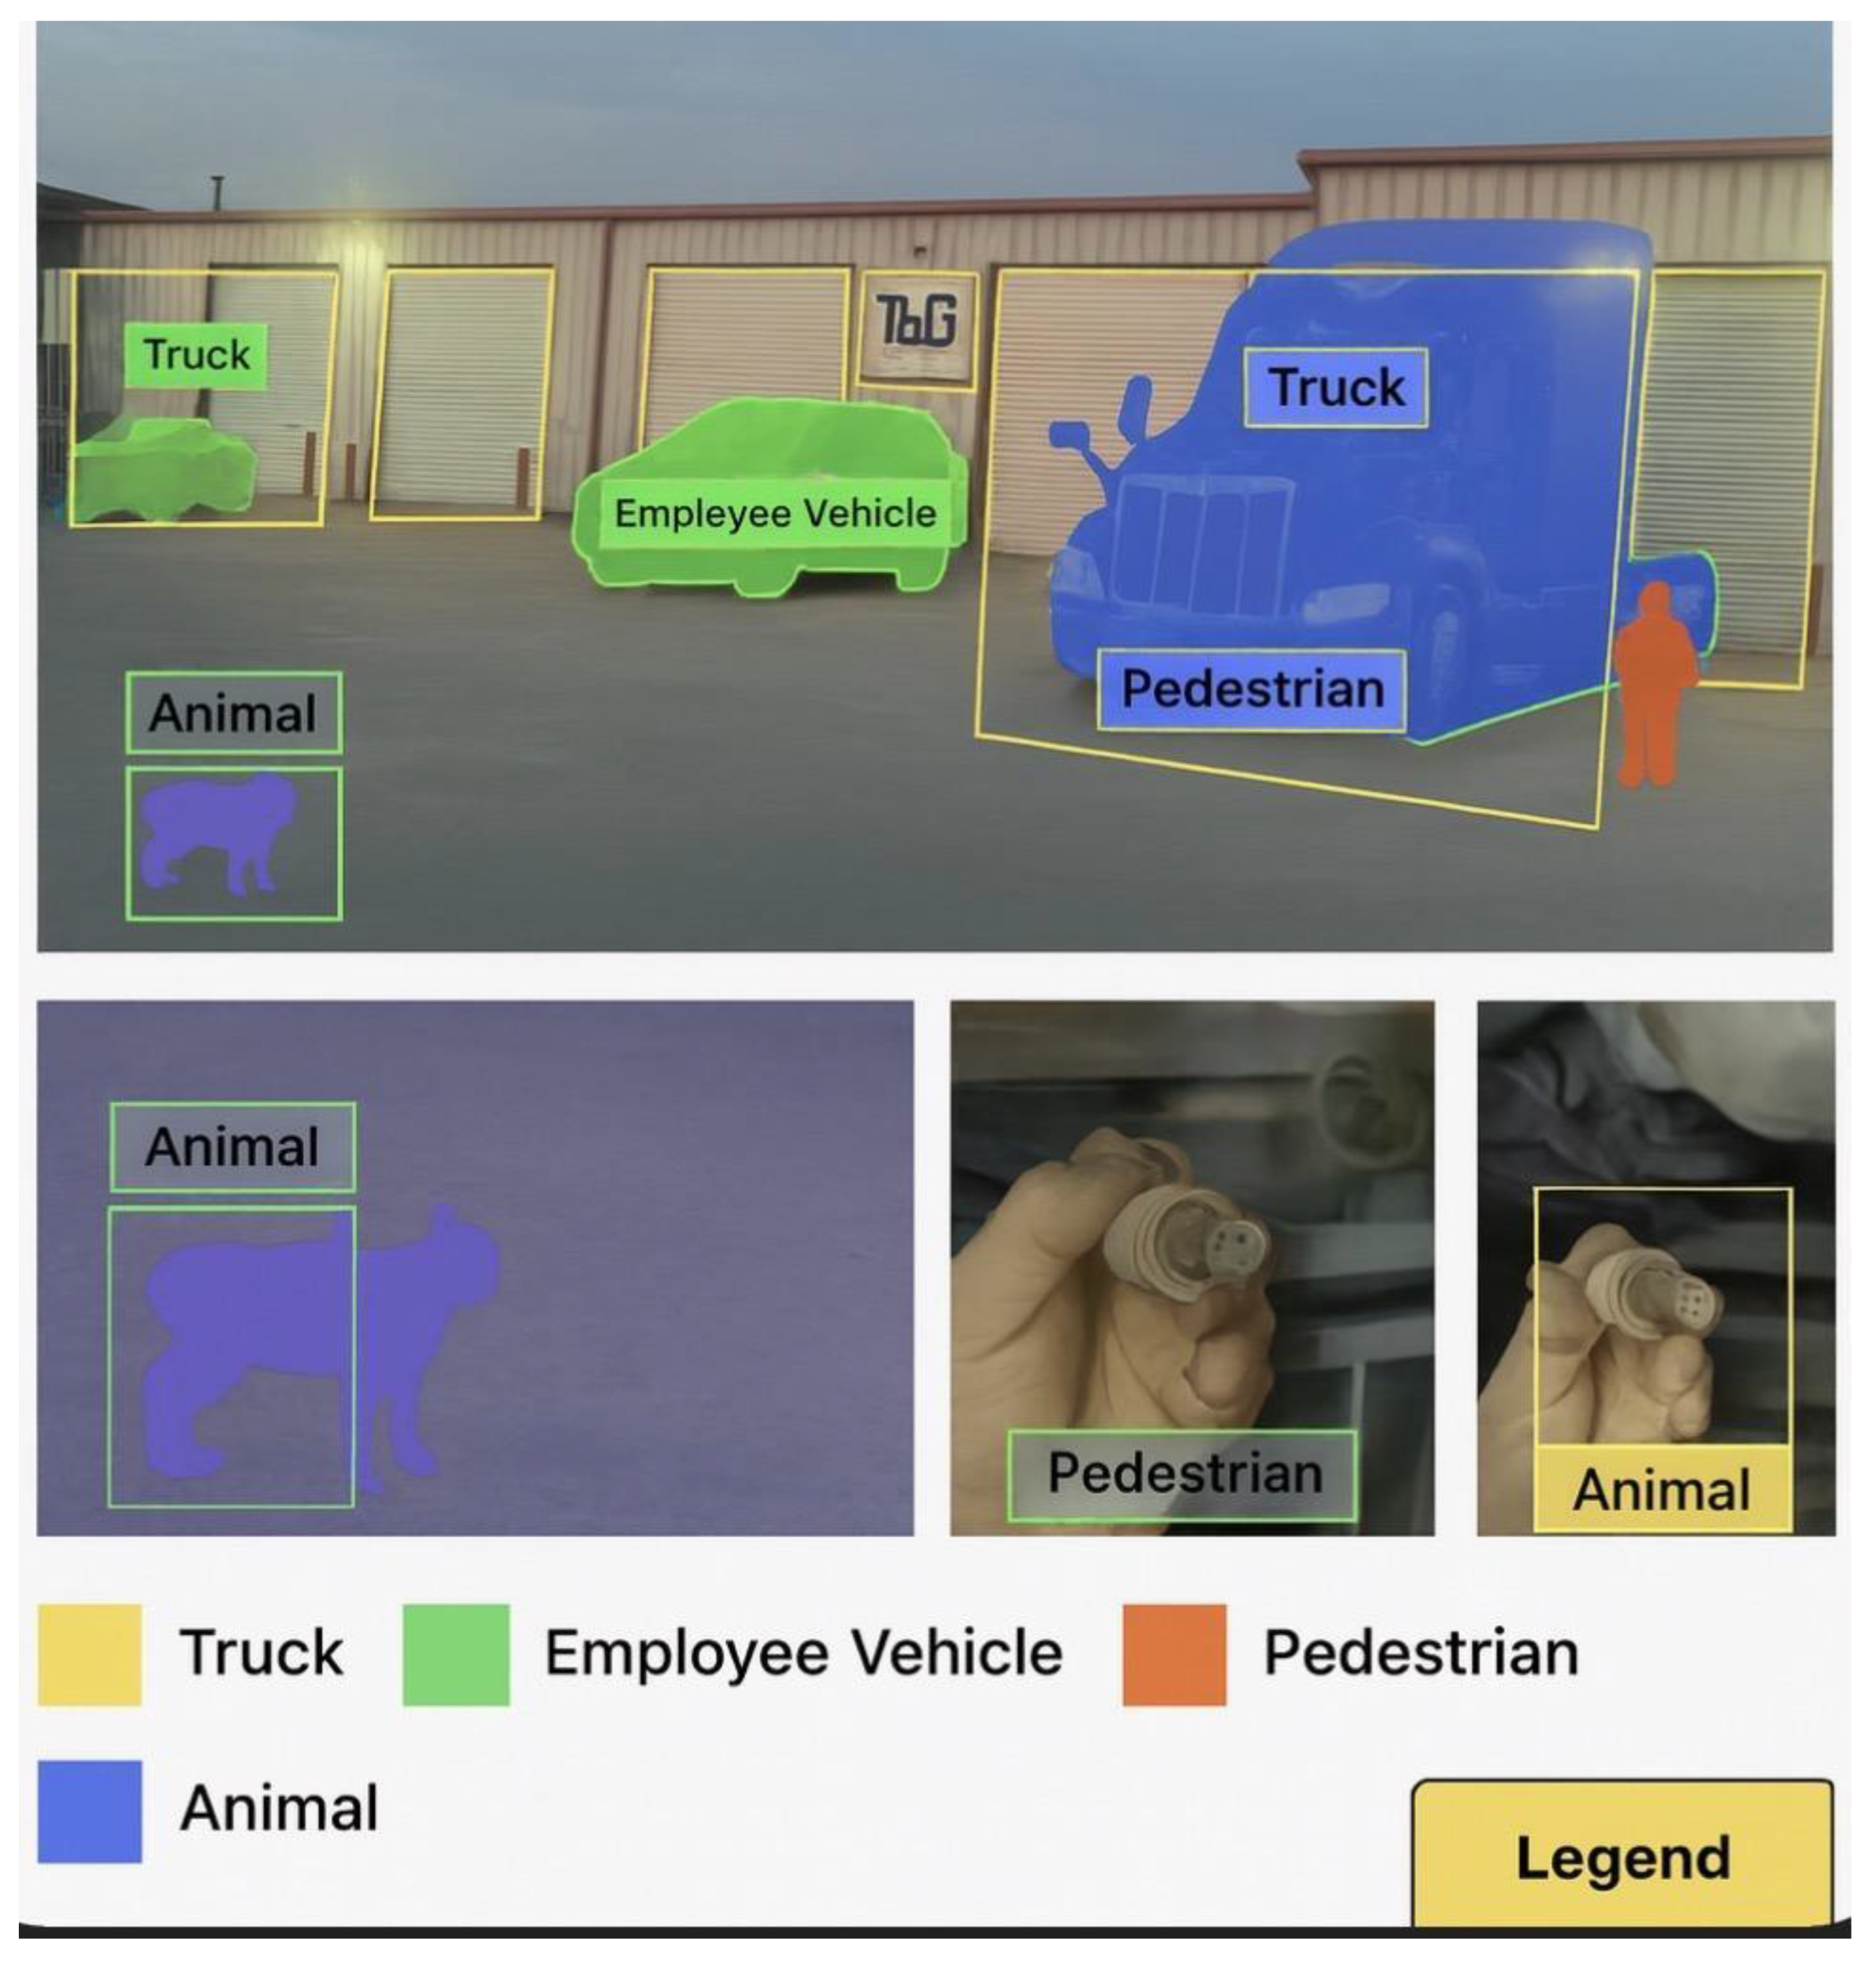
Figure 53.
Geofence with A* path inside the circular GO zone.
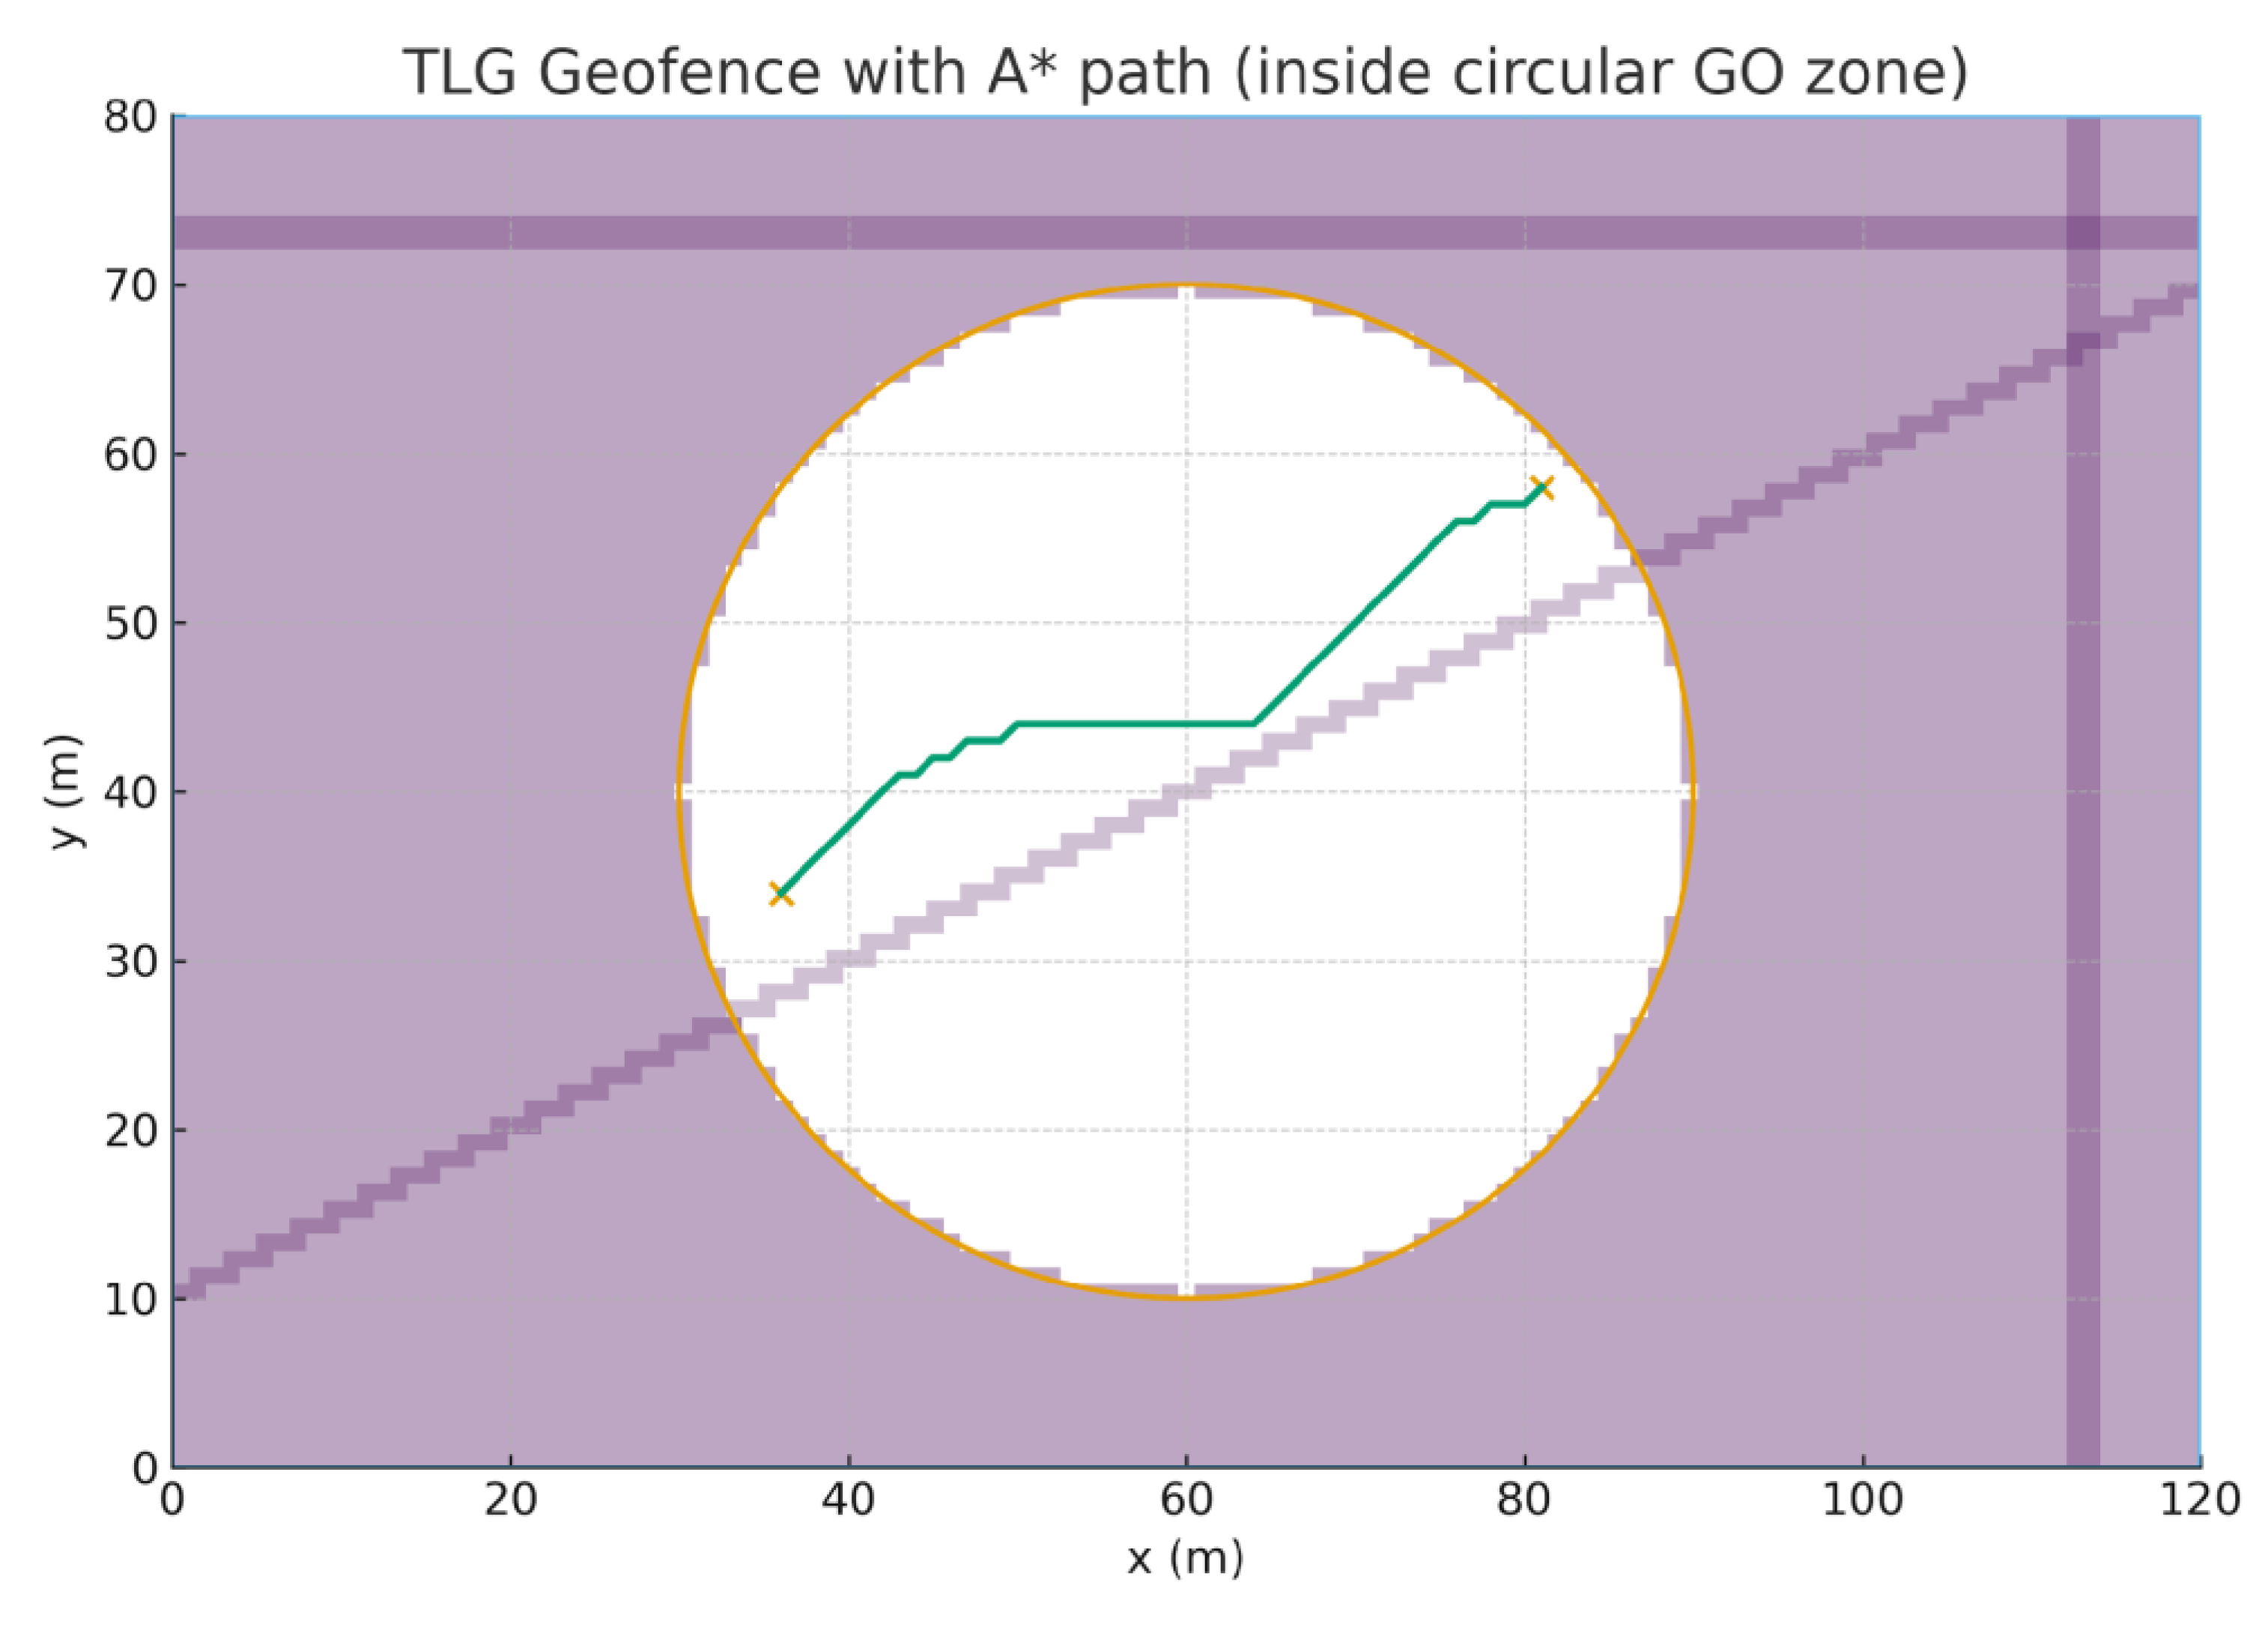
Figure 54.
Sector-based patrol zones and mid-waypoints for multi-UAV operations.
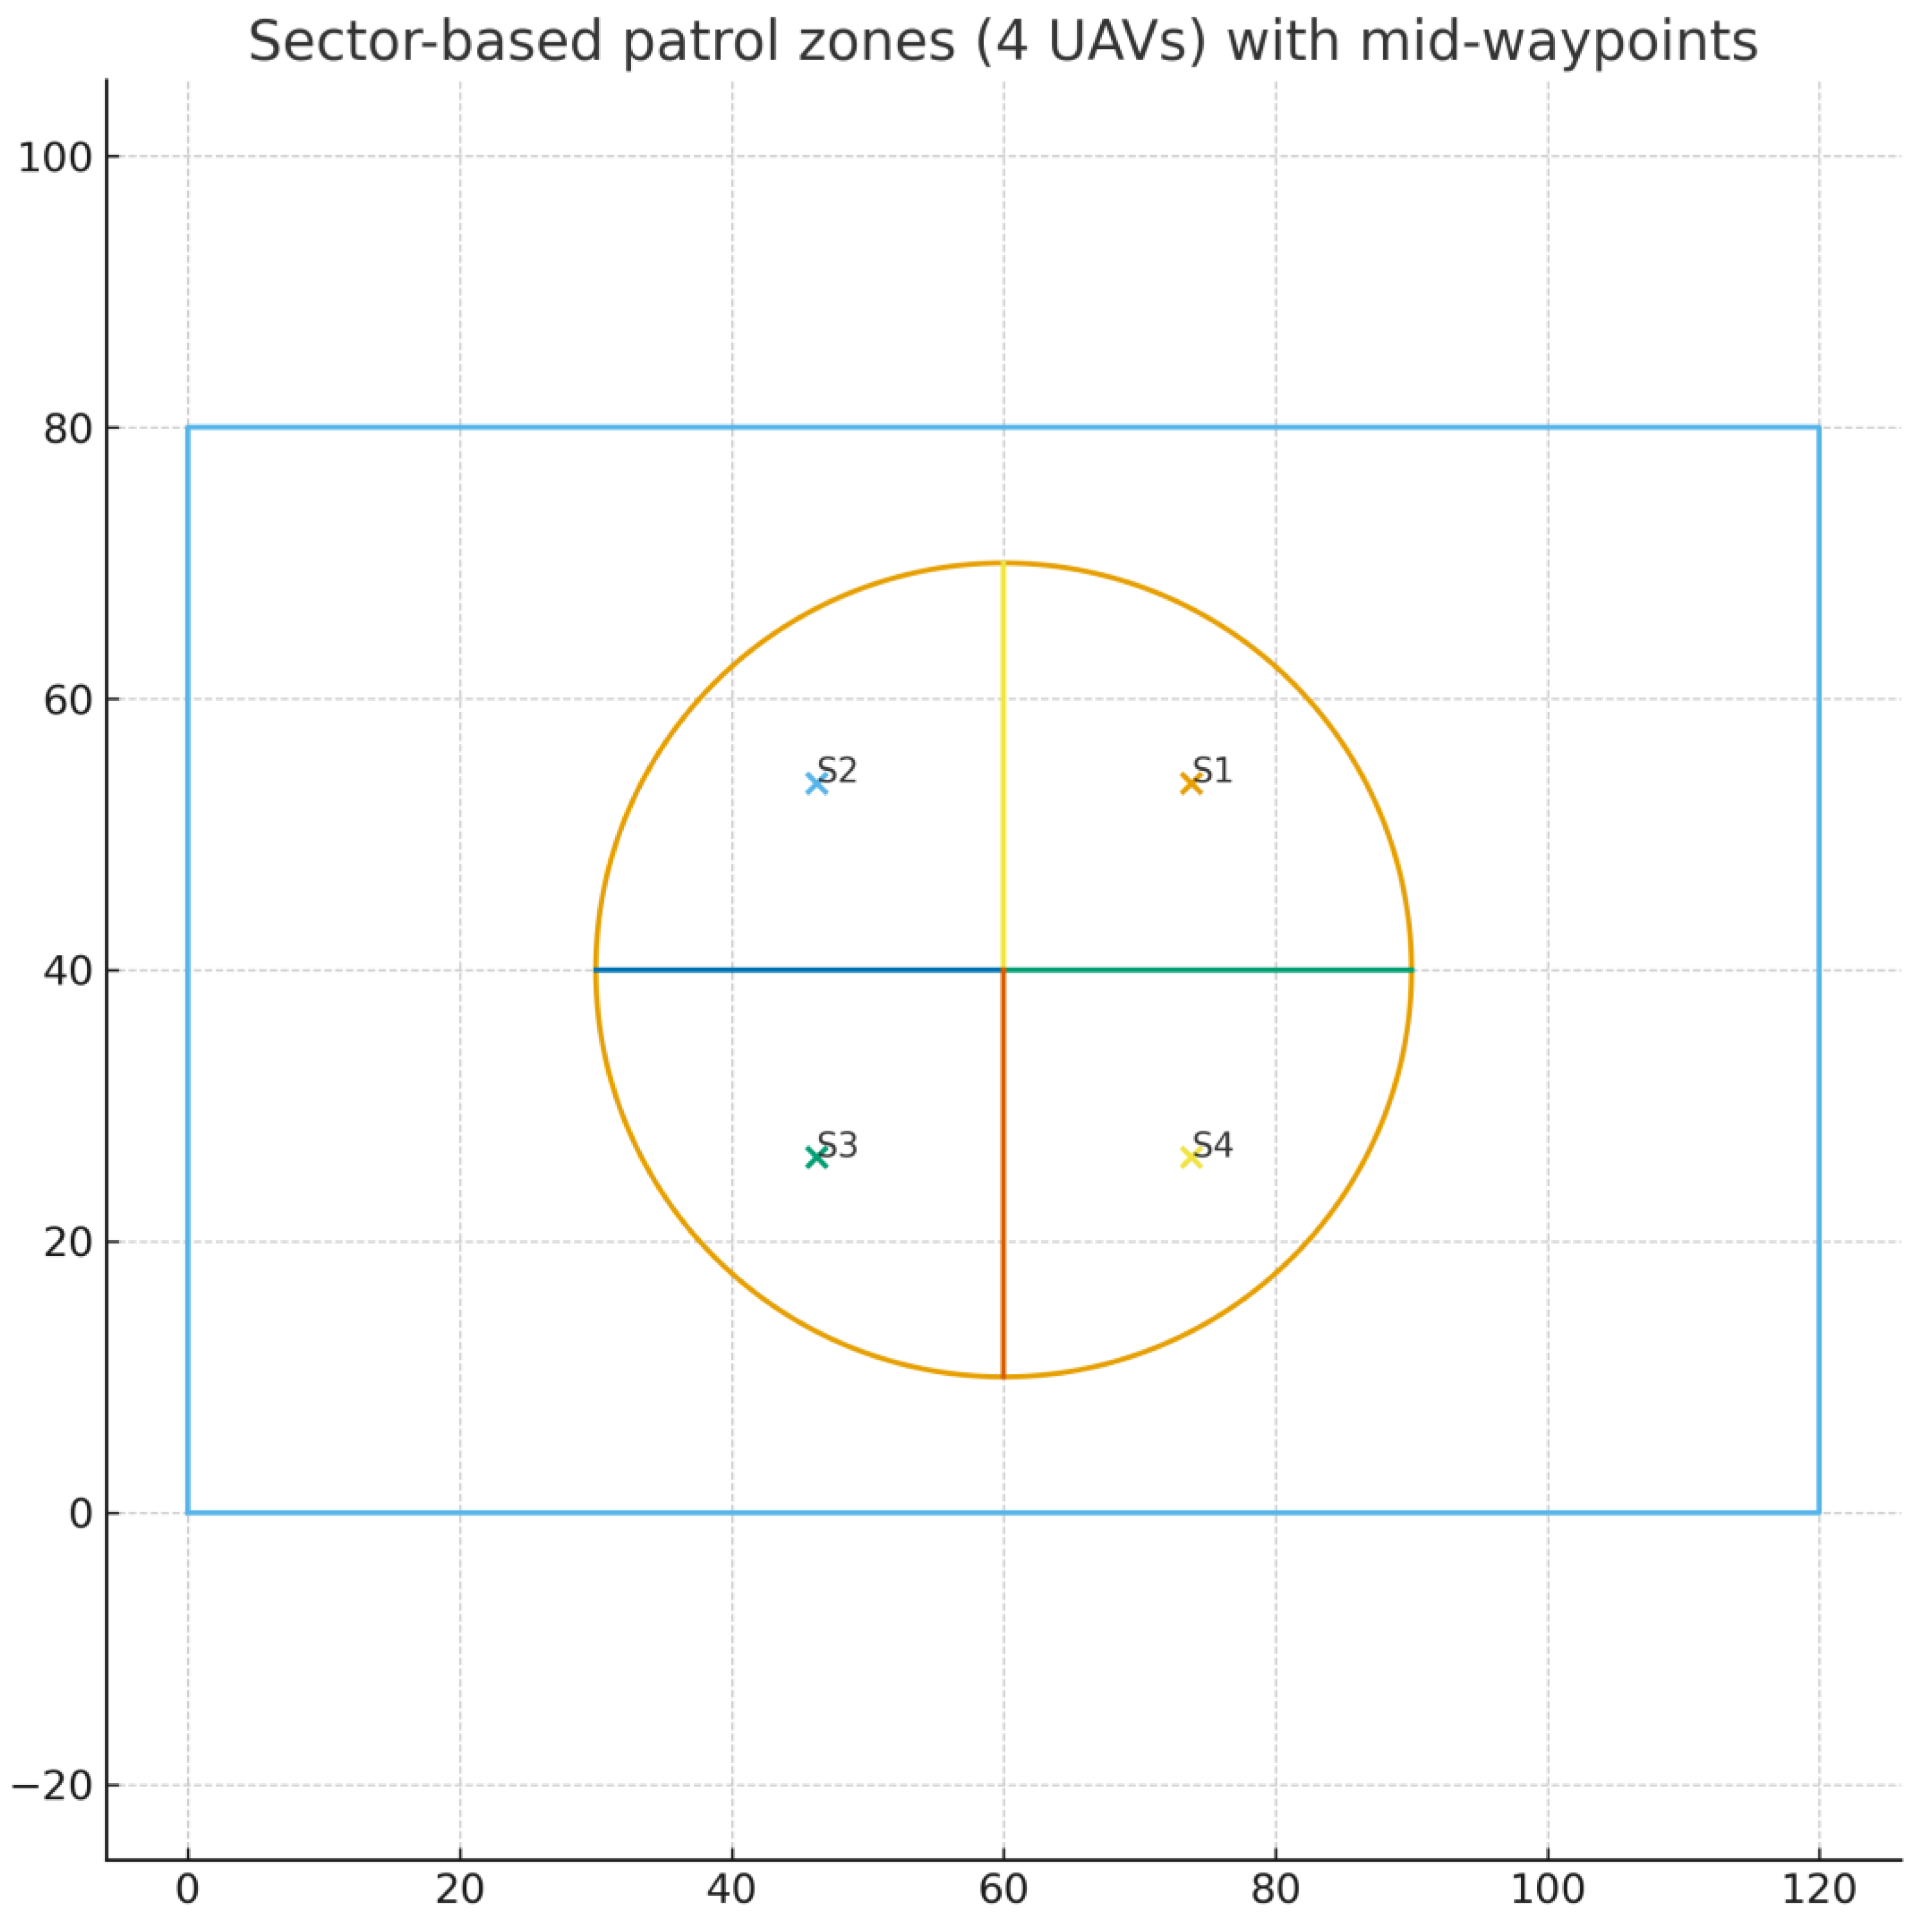
Figure 58.
UAV with advanced obstacle avoidance and positioning sensors.
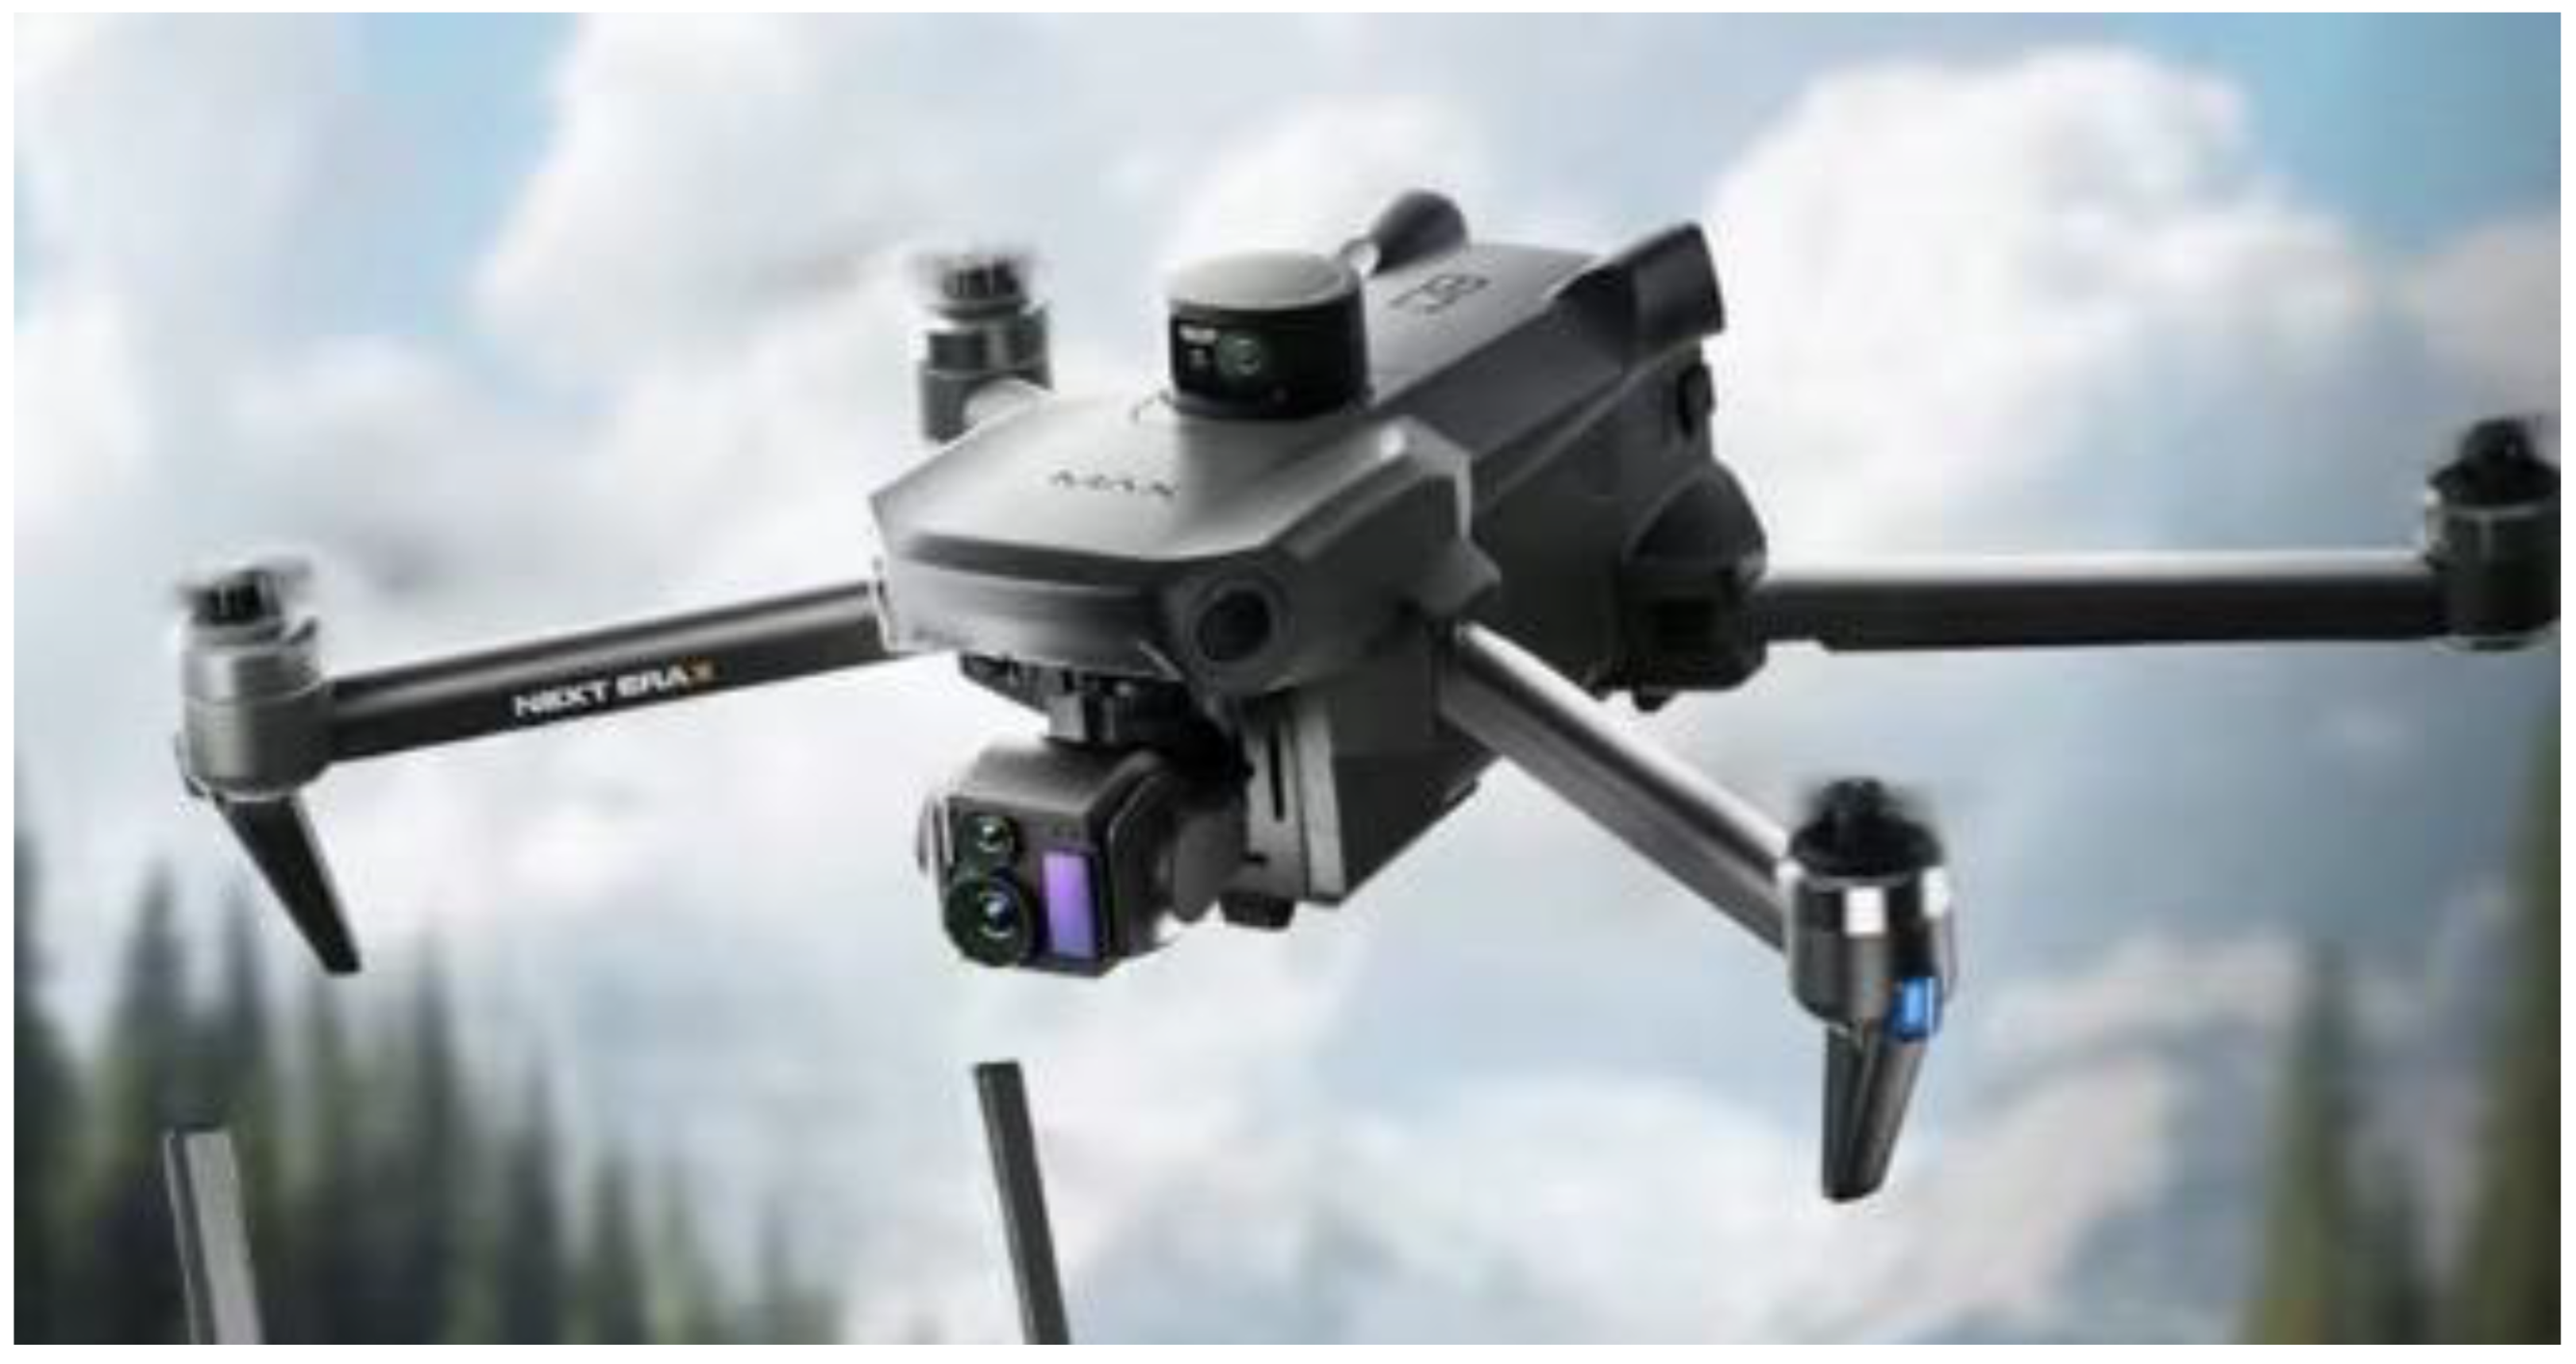
Figure 59.
Multiple UAV models including EVO drone, batteries, and remote control accessories.
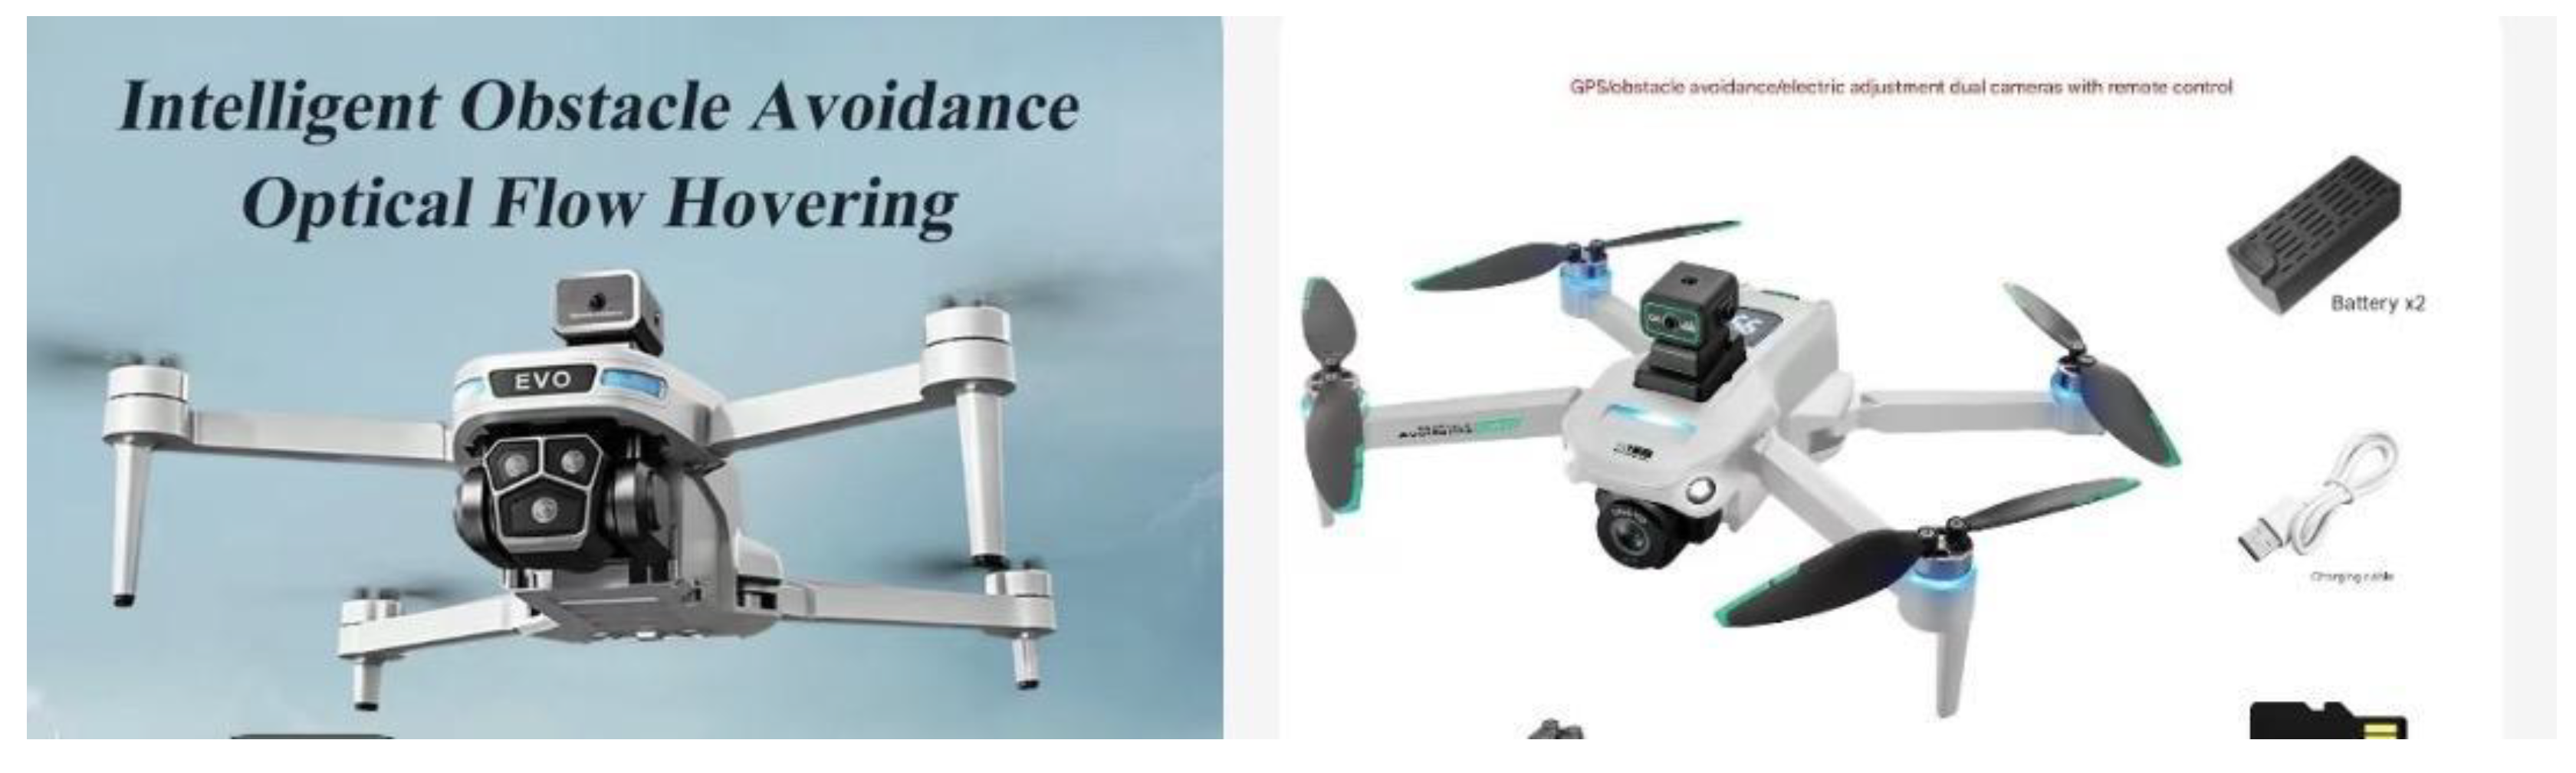
Disclaimer/Publisher’s Note: The statements, opinions and data contained in all publications are solely those of the individual author(s) and contributor(s) and not of MDPI and/or the editor(s). MDPI and/or the editor(s) disclaim responsibility for any injury to people or property resulting from any ideas, methods, instructions or products referred to in the content. |
© 2025 by the authors. Licensee MDPI, Basel, Switzerland. This article is an open access article distributed under the terms and conditions of the Creative Commons Attribution (CC BY) license (http://creativecommons.org/licenses/by/4.0/).
Copyright: This open access article is published under a Creative Commons CC BY 4.0 license, which permit the free download, distribution, and reuse, provided that the author and preprint are cited in any reuse.


