
Submitted:
22 September 2025
Posted:
23 September 2025
You are already at the latest version
Abstract
Background: Social inequalities and vulnerability associated with ethnic and social minority status are risk factors for health inequities. Objective: To assess associations be-tween psychosocial health, social discrimination, perceived social support, and resilience among people living in Portugal based on ethnic origin. Method: This is an observational investigation carried out with 756 individuals (M=39.3; SD=13.79), who responded to the Brief Symptom Inventory, Everyday Discrimination Scale, Multidimensional Scale of Perceived Social Support, Connor-Davidson Resilience Scale, along with a sociodemographic questionnaire. Participants were divided into two groups, the first consisting of white Portuguese of European origin (majority group, n=609, 80.56%) and the second consisting of black individuals, Afro-descendants, Roma, and Portuguese Roma (minority group, n=147, 19.44%). Results: Sociodemographic markers remained inferior in the minority group. This group also had elevated scores for both psychological distress and social discrimination (p’s< .001). Perceived social support (majority: 5.58; minority: 6.09; p< .001) and resilience (majority: 2.64; minority: 3.17; p< .001) were statistically significantly different. Regression analyses indicated that minority ethnicity was a predictor of psychological distress. Conclusions: In summary, discrimination linked to ethnic origin predicted poor health indicators. Consequently, further work is needed to clarify the social context of individuals who experience any form of discrimination and to assist the governments in addressing this situation through public policies grounded in informed data to reduce the risk factors and enhance the health of these communities.
Keywords:
Social discrimination
; psychological distress
; resilience
; social support
; ethnicity
; health inequities
1. Introduction
A combination of individual, systemic, and structural factors contributes to the emergence and maintenance of inequalities associated with ethnic risks in healthcare [1,2,3,4]. Equally, mental health is a central public health issue, yet it is well known that social inequalities and social injustice associated with ethnic minority status continue to generate strong inequities at all levels, with impacts on overall health [5,6,7]. Indeed, belonging to an ethnic minority constitutes a risk factor that increases the likelihood of having an undiagnosed and untreated mental illness [8,9,10] and greater difficulty or impediment in accessing health services or therapeutic resources [3,5]. Further, risks linked to minority status lower the chances of even having a mental disorder recognized when compared to majority ethnic groups [11]. This inequality has significant costs, both for the individual and for society.
In this study, we focus on the concept of “perceived discrimination,” which is defined as an individual’s perception of being treated unfairly based on their minority social status [12]. This concept encompasses not only the episode of discrimination itself, but also the interpretation that the individual exposed to discrimination attributes to violence, and the narrative developed from this perception [13]. Discrimination can be perceived as unidimensional or intersectional, meaning that a minority group may attribute discrimination to a single sociodemographic characteristic, such as ethnicity or gender, or, on the other hand, may recognize the overlap of several socially marginalized characteristics and their effects in terms of greater exposure to prejudice and stigma [14,15]. Researchers have studied the relationship between perceived discrimination and various risk factors, including economic factors such as unemployment and financial status [16] and social factors such as identity and social capital [13,17].
There is also abundant evidence linking perceived discrimination to health and well-being indicators [12,18]. For example, studies report correlations with various mental health problems, such as anxiety and depression [19,20,21], physical health, such as obesity and cardiovascular problems [22,23,24], oral health deficits [25,26,27], and the use of maladaptive coping strategies [28]. A systematic review with meta-analysis found that the perception of discrimination produces lasting and pervasive effects on both physical health (r = -0.15, 95% CI = -0.22, -0.07) and mental health (r = -0.20, 95% CI = -0.24, -0.16). In addition to producing chronic stress (r = 0.11, with a 95% CI from 0.18 to 0.05), it is also directly associated with reduced adherence to healthy behaviors and/or increased frequency of behaviors harmful to health (r = .18, with a 95% CI from .22 to .15), such as tobacco, alcohol, and other drug abuse [28].
Ethnic discrimination has been strongly associated with high levels of psychological distress [29], a concept that can be defined as a set of symptoms and difficulties such as anxiety, depression, social dysfunction, and difficulty managing daily activities [30,31]. It constitutes an important public health problem that affects quality of life [32,33]. Studies have identified some vulnerability factors that increase the likelihood of experiencing distress, such as being female, having low educational attainment, adverse economic situations, suffering from obesity and chronic diseases, and mental health problems [34,35,36]. On the other hand, looking at protective factors, resilience and social support seem to have a positive effect on mental health and well-being. Resilience was conceptualized as a process-oriented trait that arises from the complex interactions that people develop in the socioecological systems in which they are embedded, involving dimensions such as attachment to place, leadership, community cohesion, robust social networks, and adaptive learning [37]. Keeping in mind an intersectional definition of resilience allows us to analyze in greater depth the intersection of identities, such as ethnicity, gender, and socioeconomic conditions, that influence both the effectiveness and availability of community resources. This perspective offers a more comprehensive view of resilience, particularly relevant for research in underrepresented populations. For example, in the context of migration, resilience is presented as a fundamental quality in coping with and resolving challenges [38], being crucial for successful integration [39,40], and consequently promoting psychological and social well-being [41,42,43], as well as life satisfaction and higher levels of overall health [44,45,46].
A second mechanism that the literature has pointed out as protective of the health of ethnic minority groups is the perception of social support, a concept that can be characterized in five forms of support: emotional (care and empathy), instrumental (material support), informational (advice and guidance), companionship (social and leisure activities), and validation (feedback for self-assessment) [47]. As well as the different sources from which this support may originate, such as family, friends, and community [47]. Like resilience, it acts as a protective factor against psychological distress, influencing the individual’s assessment of stressors, increasing the perception of control, and promoting the use of adaptive coping strategies, as well as promoting well-being [48,49]. Several studies have analyzed the connection between feelings of belonging to a social group and mental health in individuals belonging to ethnic minorities, finding that greater identification with the ethnic group is associated with greater life satisfaction [50] and lower levels of psychological distress [51]. National identification and a sense of religious belonging have also been linked to increased satisfaction and decreased psychological distress [51,52,53].
Studies conducted with refugee populations have found that support from family, friends, groups, and the community in general, as well as a sense of belonging, are associated with higher levels of life satisfaction and psychological flourishing [18,54,55,56]. A study conducted with Brazilian and Cape Verdean immigrants in Portugal identified the perception of discrimination as a risk factor for psychological distress. On the other hand, the perception of social support and resilience were identified as protective factors. Another study showed that experiences of discrimination in Roma and non-Roma communities living in socioeconomic vulnerability in Portugal are a significant challenge, with the Roma community reporting a significantly higher perception of discrimination compared to the non-Roma community. Despite this, no significant differences were found in terms of positive affect between the groups.
The relevance of this study stems from the need to understand the relationship between ethnic origin and mental health in light of the psychosocial variables under analysis. Although there are studies that examine this association, to our knowledge, this work is pioneering in the Portuguese context by simultaneously integrating protective factors for psychosocial health (resilience and perceived social support) and risk factors (social discrimination). The literature has documented that belonging to ethnic minorities may be associated with higher levels of discrimination and psychological distress. Nevertheless, it remains urgent to elucidate the mechanisms underlying these relationships in order to guide the design of more effective interventions that are solidly anchored in the best available scientific knowledge in order to ameliorate the risks faced by individuals in terms of healthcare.
Therefore, the objectives of the present study are: (1) To analyze possible differences in sociodemographic variables (income, education, and unemployment rate) and psychosocial variables (social discrimination, psychological distress, social support, and resilience) between groups of adult individuals belonging to ethnic majorities and minorities; (2) To assess possible correlations between social discrimination, psychological distress, perceived social support, and resilience among people living in Portugal based on ethnic origin; and (3) To assess the predictive effect of sociodemographic and psychosocial variables on the psychological distress of participants belonging to ethnic majorities and minorities. The hypotheses of this study are: (H1) Participants from the ethnic minority group will have lower sociodemographic and mental health indicators compared to the ethnic majority group; (H2) Positive and significant correlation between social discrimination and psychological distress, and significant and negative correlation between psychological distress and social support and resilience. We believe that these correlations will be found in both ethnic groups, but will be more pronounced in the minority ethnic group; and (H3) Socioeconomic vulnerability, social discrimination, and reduced scores for social support and resilience will be predictors of poorer mental health in the minority group.
2. Materials and Methods
This study has a cross-sectional design and is quantitative in nature. We evaluated a sample of adults from different ethnic backgrounds living in Portugal. This study was funded by the Foundation for Science and Technology as part of the award of doctoral research grants in a non-academic environment to the first author (2023.01027.BDANA).
Participants and Procedures
This study involved participants aged 18 or over, residing in Portugal (n=756). It was a non-probability sample, selected according to convenience criteria. The inclusion criteria for participants were age (≥ 18), ability to read and write, and residential status in Portugal (least 6 months). The exclusion criteria included the fact that, even if residing in Portugal, their permanent residence was reported to be in another country. Data collection took place between February and May 2025. The research protocol was developed by the first author and disseminated by the other authors, both personally and institutionally. Data collection was carried out online during the first half of 2025 through the dissemination of a link throughout the country. The dissemination was supported by the University of Beira Interior and the Vila Real district branch of the EAPN (European Anti-Poverty Network), a part- ner in this study. Completing the protocol took approximately 20 minutes. Participants did not receive any form of financial compensation.
Instruments
Sociodemographic questionnaire. Questionnaire developed for this research to characterize participants in terms of their age, gender, sexual orientation, marital status, education, whether participants have children, number of children, household, professional situation, and income.
Brief Symptom Inventory (BSI-18). This instrument assesses psychological symptoms in adults and contains three subscales: somatization, depression, and anxiety [57]. It consists of 18 items (e.g., Item: “Pains in heart or chest”), rated on a 5-point Likert scale from 0 (“Not at all”) to 4 (“Extremely”). It is a self-report questionnaire designed for participants to indicate the intensity with which they felt each symptom in the previous two weeks. The original scale has good internal consistency (α = .89), as does the version adapted and validated for the Portuguese population [58] with a Chronbach’s alpha of .80. In the present study, Chronbach’s alpha was .95.
Multidimensional Scale of Perceived Social Support (MSPSS). This scale assesses perceived social support [59]. The scale consists of 12 items (e.g., Item: “My family is willing to help me make decisions”), divided into 3 subscales and rated on a 7-point Likert scale, from 1 (completely disagree) to 7 (completely agree). The Portuguese version of the scale, translated and validated [60], retains the 12 items and the same scales. Both have good psychometric properties, in the original version (α = .88) as in the Portuguese version, ranging from .87 to .95. In this study, Cronbach’s alpha was .95.
Everyday Discrimination Scale – Portuguese Version (EDS-PT). The EDS is a scale that assesses experiences of everyday discrimination [61]. The scale consists of 8 items and is divided into two subscales: unfair treatment, and personal rejection (e.g., Item: “People act as if they think you are not smart”). Scoring is done on a Likert scale from 0 (never) to 5 (almost always, almost every day). At the end of the 8 items, respondents who answer that these experiences happen at least “sometimes” should mention the type of discrimination they have suffered, based on a list of reasons. The Portuguese version of the scale was translated and validated [62], maintaining the number of items and subscales of the original scale. The original version has very good psychometric properties (α = .88), as does the Portuguese version, with a Cronbach’s alpha ranging from .83 to .95. In this study, Cronbach’s alpha was .95.
Connor-Davidson Resilience Scale-10 (CD-RISC-10). This scale is a self-assessment questionnaire for evaluating resilience in individuals, regardless of whether or not they have a disorder. The scale has 10 items (e.g., Item: “I am able to adapt when changes occur”), divided into five factors: Flexibility (items 1 and 5), sense of self-efficacy (items 2, 4, and 9), regulating emotions (item 10), optimism (items 3, 6, and 8), and maintaining attention under stress (item 7). The rating is made on a 5-point Likert scale ranging from “not true” (0) to “true almost all the time” (4). The original scale has very good internal consistency (α = 0.89) and the version adapted for the Portuguese population has a Cronbach’s alpha of .87 [63]. In the present study, Cronbach’s alpha was .91.
Data Analysis
For data analysis, we used the IBM SPSS 29 statistical program, setting the significance at 5% (p<0.05). The Shapiro- Wilk test was performed to assess the normality of the distribution of the variables analyzed. Since the distribution met the normality criterion, we used parametric tests. Based on self-reported ethnic origin, two distinct groups were defined: Ethnic Majority (n=609, 80.56%), which covers the majority of the Portuguese population (White/Portuguese white/Of European origin) and ethnic minorities (n=147, 19.44%), which includes other communities residing in Portugal (Black/Black, Portuguese/Afro-descendant/African origin, Roma/Portuguese Roma and other). The number of participants per ethnic group is quite uneven, which roughly reflects the distribution of the population in Portugal. According to the National Statistics Institute, 84.1% (majority) of people identify as White Portuguese and 15.9% as Non-white (minority) [64]. To outline the sociodemographic profile of the participants and the scores of the psychosocial variables investigated, we performed statistics such as simple frequency, percentage, mean, standard deviation, theoretical median, and minimum and maximum scores. To assess sociodemographic and psychosocial differences between majority and minority ethnic groups, we used Student’s t-test for independent samples. The effect size for group differences was calculated using Cohen’s d, interpreted as follows: values below 0.20 indicate a negligible effect; values between 0.20 and 0.49 represent a small effect; 0.50 to 0.79 indicate a medium effect; and values of 0.80 or above reflect a large effect [65]. To assess correlations between psychological distress, social discrimination, perceived social support, and resilience, we used Pearson’s correlation test. To analyze the predictive effect of independent variables on psychological distress, we performed linear regression with three models. We used G*Power software [56] to calculate the statistical power of the study. Cohen’s d values ranged from 0.447 to 1.798 in the total sample of 756. In this sense, the power achieved was approximately 99.9%.
Ethical Considerations
This research was approved by the Ethics Committee of the University of Beira Interior (Ref. no. CE-UBI-Pj-2023-051- ID1915). All authors of the scales used in this research were contacted and gave permission for their use. All participants were duly informed about the objectives of the study and signed the informed consent form. Anonymity and confidentiality were ensured, in accordance with the ethical principles established in the Declaration of Helsinki [66].
3. Results
This study had a sample of 756 participants (M= 39.3; SD= 13.79) residing in Portugal, of whom 276 (36.5%) identified as men, 476 (63%) as women, and 4 (0.5%) as another gender. The mean age of the majority ethnic group was 40.4 years (SD= 14.07) and that of the minority ethnic group was 34.5 years (SD= 11.42). Table 1 shows the general sociodemographic characteristics of the sample, separated by ethnic group (majority and minority).
As shown in Table 1, the groups are quite distinct in several sociodemographic characteristics, with participants belonging to the ethnic minority group having lower educational levels, a greater number of people living in the same household, a greater number of children, a higher percentage of unemployed people, and lower income, all of which differences are statistically significant with effect sizes (Cramer’s V) ranging from 0.12 to 0.52. In this case, for the variables gender and marital status, the effect is small; for the variables number of children, professional situation, and income, the effect is medium; and for the variables education and household, the effect is large. In an additional analysis using Student’s t-test, it was found that per capita income was significantly higher in the majority ethnic group (M = 1.70, SD = 0.46) compared to the minority group (M = 1.14, SD = 0.35), p < .001, d = 1.35.
Comparison Between Majority and Minority Ethnic Groups
Table 2 shows the results of the Student’s t-test for comparing independent samples between the majority and minority communities. The results indicate that the minority community has significantly higher levels (p<.001) of psychological distress, greater social discrimination, perceived social support, and resilience.
Correlations Between Psychological Distress, Social Discrimination, Perceived Social Support, and Resilience
As shown in Figure 1, psychological distress showed significant correlations with the variables social discrimination (.641), perceived social support (-.175), and resilience (-.231), with the correlation between psychological distress and perceived discrimination being positive, strong, and statistically significant, which means that as discrimination increases, so does psychological distress. In the case of perceived social support and resilience, the correlation is weak and negative, meaning that as perceived social support increases, psychological distress decreases. The results also show a significant, moderate, and positive correlation between resilience and perceived social support (.418).
Predictive Effect of Independent Variables on Psychological Distress
The results of the linear regression with the effect of sociodemographic variables and social discrimination, perceived social support, and resilience on the dependent variable psychological distress are depicted in Table 3. We created three predictive models: Model 1 with sociodemographic variables, Model 2 with the inclusion of the independent variables studied (social discrimination, perceived social support, and resilience), and Model 3 with the inclusion of the ethnicity variable. Model 1 explains 21.8% of the variance and shows that the higher the age, education, and income, the lower the psychological distress. It also shows that belonging to a sexual minority is a predictor of greater psychological distress. In Model 2, which explains 49.7% of the variance, with the inclusion of psychological variables and ethnicity, the total variance explained increases gradually, with significant results in all variables. In Model 2, only age and sexual orientation remain significant in the same sense, and the gender variable becomes significant, demonstrating that being male is a predictor of lower psychological distress. Social discrimination presents significant and negative results, that is, the higher the social discrimination, the higher the levels of psychological distress, with social discrimination acting here as a risk factor for mental health. In the case of perceived social support and resilience, which act as protective factors for psychosocial health, the higher their values, the lower the psychological distress. In Model 3, which explains 50.2% of the variance, we found that the significant variables remain unchanged and with the same sign, but the ethnicity variable is significant, showing that belonging to an ethnic minority is a predictor of greater psychological distress.
4. Discussion
The present study aimed to aid in improving care for at-risk populations. Particularly by exploring the correlates of social discrimination, perceived social support, and resilience among people living in Portugal based on majority or minority ethnic origin. We also sought to understand how sociodemographic and psychosocial variables predict psychological distress – a hallmark of vulnerability for overall incapacity and illness propension – while also comparing potential differences between those not at-risk (i.e., majority) and at-risk (i.e., minority ethnic).
The results confirm the proposed hypotheses, revealing relevant sociodemographic disparities between ethnic groups, with the at-risk, minority group displaying well-known signs of socioeconomic vulnerability. Hence, significant associations were found between psychosocial variables, highlighting the role of social discrimination as an important risk factor for psychological distress, while perceived social support and resilience emerge as protective factors. In addition, belonging to an ethnic minority was found to be a significant predictor of greater psychological distress, even after controlling for other variables. These findings reinforce the importance of considering ethnicity as a central dimension in the analysis of psychosocial health in contexts of risk factors and impediments for healthcare.
Results are consistent with the growing body of evidence pointing to ethnic discrimination as a critical social determinant of psychological distress in minority populations. For example, a study of Sami and Kven communities in Norway found that ethnic discrimination was strongly associated with high levels of psychological distress, even when sociodemographic variables were controlled for [29]. Similarly, among Palestinian adolescents living in Israel, exposure to racial microaggressions in low-ethnic-density environments was found to be directly related to increased psychological distress [67]. Our study confirms this trend in the Portuguese context, identifying social discrimination as the strongest predictor and the major risk factors underpinning psychological distress, even after controlling for age, gender, sexual orientation, income, and education. Furthermore, belonging to an ethnic minority proved to be an independent predictor of psychological distress, a pattern also observed in Latin American populations in the United States, where the context of ethnic minority amplified the negative effects of discrimination and social exclusion on mental health. An interesting finding in our study refers to the greater perception of social support and resilience among participants in the minority group, even in the face of greater psychosocial adversity. A similar pattern was observed in investigations conducted in the United States and China, countries where marginalized communities report more intense support in family and community networks as a strategy for coping with social exclusion [68,69]. However, even with these high protective resources, levels of psychological distress remain significantly higher in the minority group among our participants, suggesting that social support and resilience, while important, are not sufficient to counteract the cumulative impacts of the risks posit by racial and ethnic discrimination. Chronic exposure to discriminatory events can generate compounding effects of stress that exceeds an individual’s capacity for coping. Additionally, a study of British youth showed that personal and ethnic self-esteem acted as a partial mediator of the impact of discrimination on psychological distress, suggesting that strengthening collective identity may be an additional protective factor, although not fully compensatory [70].
In addition to psychosocial variables, the data from the present study might be important in implementing culturally sensitive healthcare practices by promoting social justice and awareness. The significant sociodemographic disparities between ethnic groups reveal power dynamics and help in explaining the higher levels of psychological distress among at- risk participants. Differences in education, employment, family composition, and income are significant: 44.9% of participants in the minority group were unemployed (vs. 12.2% in the majority group) and only 25.2% had a university education (vs. 71.8%).
These structural asymmetries are especially relevant, since poor socioeconomic conditions are widely recognized as central determinants of health. Low socioeconomic status is consistently associated with a higher occurrence and greater chronicity of mental health problems, as well as less seeking treatment and lower adherence to therapeutic regimens. The relationship between low socioeconomic status and poorer mental health indicators is mediated by chronic stressors, such as limited time, fewer leisure opportunities, greater exposure to violence, less access to health care, and experiences of stigma. Studies indicate that this association is likely bidirectional, in that poorer mental health indicators reduce the capacity to produce, generate income, and ascend socially, perpetuating inequalities. International evidence indicates that the protective effects of income and education are not distributed evenly across ethnic groups, especially in contexts marked by persistent structures of racial or ethnic discrimination. For example, it has been demonstrated that, among Latino subgroups in the United States, psychological distress remained high even at reasonable levels of education or income, particularly among Puerto Ricans and Dominicans [71]. This pattern stems from a complex interaction between socioeconomic status, ethnicity, and experiences of discrimination.
More broadly, social inequality does not operate in isolation but is intertwined with racial exclusion. Indeed, it has been observed that high-income black men in the United States had high levels of psychological distress, suggesting that structural racism is a risk factor regardless of socioeconomic status [72]. It is essential that public policies focus on providing these communities with higher incomes and improving their qualifications, as well as reducing discrimination, so that we can have a labor market without the disparities that currently exist and that are then reflected in all areas of these populations’ lives, particularly in their psychosocial health.
Limitations and Future Directions
The objectives set for this research were achieved, but it was not without limitations. The cross-sectional nature of the study does not allow us to infer causal relationships between the variables studied and their implications for psychosocial health. In this sense, longitudinal studies are needed to verify these causal relationships and see how the results vary over time. Furthermore, as this was a sample selected by convenience criteria, we did not control for the participants’ sociodemographic variables (gender, age, sexual orientation, and family relationships that may impact psychosocial health).
Furthermore, there are also relevant sociodemographic differences between groups in terms of education, with the majority community having higher levels of education, and this variable may impact how they perceive the items and generate bias in the results. Online data collection is also a limitation, as older participants or those with low digital literacy are excluded. For these reasons, it would be important to conduct a quantitative study using interviews to better understand how these variables influence the lives of these populations in their perception. The diagnosis of the implications of belonging to an ethnic minority with greater social discrimination, lower income, and lower education levels is essential in order to act with the best scientific information and develop public policies that combat inequalities and mitigate the effects that discrimination can have on psychosocial health. Further research on this topic is essential, using other psychological variables to corroborate the results presented or define new perspectives on the mental health of these communities, as inequality is not only a problem for the people who suffer from it, but for society as a whole.
5. Conclusions
Belonging to a minority social group was positively associated with social discrimination and psychological distress. In comparison with the majority social group, we found that people from ethnic minorities have higher levels of psychological distress and social discrimination and higher levels of perceived social support and resilience. These results suggest that psychological distress and social discrimination may be potential risk factors for the psychosocial health of these communities, and that perceived social support and resilience act as protective factors. The results show that although there is an effort to combat social inequalities, they are still very visible in Portugal, and in this sense, it is essential to contribute to reducing the adversities faced by ethnic minorities living in Portugal. It is essential that public policies focus on providing these communities with higher incomes and improving their qualifications, as well as reducing discrimination, so that we can have a labor market without the disparities that currently exist and that are then reflected in all areas of these populations’ lives, particularly in their psychosocial health.
Supplementary Materials
The following supporting information can be downloaded at the website of this paper posted on Preprints.org.
Author Contributions
Conceptualization, Jóni Ledo, Madalena Cruz, Henrique Pereira and Catarina Oliveira; Formal analysis, Jóni Ledo, Madalena Cruz and Guilherme Welter Wendt; Investigation, Jóni Ledo, Madalena Cruz, Henrique Pereira, Iara do Nascimento Teixeira, Guilherme Welter Wendt, Felipe Alckmin-Carvalho and Catarina Oliveira; Methodology, Jóni Ledo, Iara do Nascimento Teixeira, Felipe Alckmin-Carvalho and Catarina Oliveira; Project administration, Henrique Pereira and Catarina Oliveira; Software, Guilherme Welter Wendt; Supervision, Henrique Pereira and Felipe Alckmin-Carvalho; Writing – original draft, Jóni Ledo, Madalena Cruz, Iara do Nascimento Teixeira, Guilherme Welter Wendt and Felipe Alckmin-Carvalho; Writing – review & editing, Iara do Nascimento Teixeira and Guilherme Welter Wendt.
Funding
This research received no external funding.
Institutional Review Board Statement
This research was approved by the Ethics Committee of the University of Beira Interior (Ref. no. CE-UBI-Pj-2023-051-ID1915).
Informed Consent Statement
Informed consent was obtained from all subjects involved in the study.
Data Availability Statement
Data can be obtained from the authors upon reasonable request.
Conflicts of Interest
The authors declare no conflicts of interest.
References
- Gee, G.C.; Hing, A.; Mohammed, S.; Tabor, D.C.; Williams, D.R. Racism and the life course: Taking time seriously. Am J Public Health 2019, 109(S1), 43–47. [Google Scholar] [CrossRef]
- Williams, D.R.; Lawrence, J.A.; Davis, B.A. Racism and health: Evidence and needed research. Annu Rev Public Health. 2019, 40, 105–125. [Google Scholar] [CrossRef]
- Bansal, N.; Bhopal, R.; Netto, G.; Lyons, D.; Steiner, M.F.; Sashidharan, S.P. Disparate patterns of hospitalisation reflect unmet needs and persistent ethnic inequalities in mental health care: The Scottish Health and Ethnicity Linkage Study. Ethnicity Health. 2014, 19, 217–239. [Google Scholar] [CrossRef]
- Bansal, N.; Karlsen, S.; Sashidharan, S.P.; Cohen, R.; Chew-Graham, C.A.; Malpass, A. Understanding ethnic inequalities in mental healthcare in the UK: A meta-ethnography. PLoS Med. 2022, 19. [Google Scholar] [CrossRef]
- Barnett, P.; Mackay, E.; Matthews, H.; Gate, R.; Greenwood, H.; Ariyo, K. Ethnic variations in compulsory detention under the Mental Health Act: A systematic review and meta-analysis of international data. Lancet Psychiatry. 2019, 6, 30027–30033. [Google Scholar] [CrossRef]
- Bhui, K.; Halvorsrud, K.; Nazroo, J. Making a difference: Ethnic inequality and severe mental illness. Br J Psychiatry. 2018, 213, 574–578. [Google Scholar] [CrossRef]
- Chiu, M.; Amartey, A.; Wang, X.; Kurdyak, P. Ethnic differences in mental health status and service utilization: A population-based study in Ontario, Canada. Can J Psychiatry. 2018, 63, 481–491. [Google Scholar] [CrossRef]
- Halvorsrud, K.; Nazroo, J.; Otis, M.; Hajdukova, E.B.; Bhui, K. Ethnic inequalities in the incidence of diagnosis of severe mental illness in England: A systematic review and new meta-analyses for non-affective and affective psychoses. Soc Psychiatry Psychiatr Epidemiol. 2019, 54, 1311–1323. [Google Scholar] [CrossRef] [PubMed]
- Prady, S.L.; Pickett, K.E.; Gilbody, S.; Petherick, E.S.; Mason, D.; Sheldon, T.A. Variation and ethnic inequalities in treatment of common mental disorders before, during and after pregnancy: Combined analysis of routine and research data in the Born in Bradford cohort. BMC Psychiatry. 2016, 16, 1–13. [Google Scholar] [CrossRef] [PubMed]
- Moore, L.; Jayaweera, H.; Redshaw, M.; Quigley, M. Migration, ethnicity, and mental health: Evidence from mothers participating in the Millennium Cohort Study. Public Health 2019, 171, 66–75. [Google Scholar] [CrossRef] [PubMed]
- Ponizovsky, A.M.; Haklai, Z.; Goldberger, N. Association between psychological distress and mortality: The case of Israel. J Epidemiol Community Health. 2018, 72, 726–732. [Google Scholar] [CrossRef]
- Hashemi, N.; Marzban, M.; Sebar, B.; Harris, N. Perceived discrimination and subjective well-being among Middle Eastern migrants in Australia: The moderating role of perceived social support. Int J Soc Psychiatry. 2021, 67, 110–119. [Google Scholar] [CrossRef]
- Diehl, C.; Liebau, E.; Mühlau, P. How often have you felt disadvantaged? Explaining perceived discrimination. Kölner Zeitschrift für Soziologie und Sozialpsychologie 2021, 73, 1–24. [Google Scholar] [CrossRef]
- Harnois, C.E. Are perceptions of discrimination unidimensional, oppositional, or intersectional? Examining the relationship among perceived racial-ethnic, gender-, and age-based discrimination. Sociol Perspect. 2014, 57, 470–487. [Google Scholar]
- Semu, L.L. The intersectionality of race and trajectories of African women into the nursing career in the United States. Behav Sci 2020, 10. [Google Scholar] [CrossRef]
- Lauderdale, D.S.; Wen, M.; Jacobs, E.A.; Kandula, N.R. Immigrant perceptions of discrimination in health care: The California Health Interview Survey. Med Care. 2003, 44, 914–920. [Google Scholar] [CrossRef] [PubMed]
- Sheikh, M.A.; Abelsen, B.; Olsen, J.A. Clarifying associations between childhood adversity, social support, behavioral factors, and mental health, health, and well-being in adulthood: A population-based study. Front Psychol. 2016, 7. [Google Scholar] [CrossRef] [PubMed]
- Jasinskaja-Lahti, I.; Liebkind, K.; Perhoniemi, R. Perceived discrimination and well-being: A victim study of different immigrant groups. J Community Appl Soc Psychol. 2006, 16, 267–284. [Google Scholar] [CrossRef]
- Berg, A.O.; Melle, I.; Rossberg, J.I.; Romm, K.L.; Larsson, S.; Lagerberg, T.V. Perceived discrimination is associated with severity of positive and depression/anxiety symptoms in immigrants with psychosis: A cross-sectional study. BMC Psychiatry. 2011, 11, 1–8. [Google Scholar] [CrossRef]
- Davis, A.N.; Carlo, G.; Schwartz, S.J.; Unger, J.B.; Zamboanga, B.L.; Lorenzo-Blanco, E.I. The longitudinal associations between discrimination, depressive symptoms, and prosocial behaviors in U. S. Latino/a recent immigrant adolescents. J Youth Adolesc. 2016, 45, 457–470. [Google Scholar] [CrossRef]
- Giuliani, C.; Tagliabue, S.; Regalia, C. Psychological well-being, multiple identities, and discrimination among first- and second-generation immigrant Muslims. Eur J Psychol. 2018, 14, 66–87. [Google Scholar] [CrossRef]
- Dolezsar, C.M.; Mcgrath, J.J.; Herzig, A.J.M.; Miller, S.B. Perceived racial discrimination and hypertension: A comprehensive systematic review. Health Psychol. 2014, 33, 20–34. [Google Scholar] [CrossRef]
- Javed, Z.; Maqsood, M.H.; Yahya, T.; Amin, Z.; Acquah, I.; Valero-Elizondo, J. Race, racism, and cardiovascular health: Applying a social determinants of health framework to racial/ethnic disparities in cardio- vascular disease. Circulation Cardiovasc Qual Outcomes 2022, 15. [Google Scholar] [CrossRef]
- Johnson, P.; Risica, P.M.; Gans, K.M.; Kirtania, U.; Kumanyika, S.K. Association of perceived racial discrimination with eating behaviors and obesity among participants of the SisterTalk study. J Natl Black Nurses Assoc. 2012, 23, 34–40. [Google Scholar]
- Junior, O.L.; Do, A.; Menegazzo, G.R.; Fagundes, M.L.B.; Sousa, J.L.D.; Torres, L.H.; Do, N.; Giordani, J.M.; Do, A. Perceived discrimination in health services and preventive dental attendance in Brazilian adults. Community Dent Oral Epidemiol. 2020, 48, 533–539. [Google Scholar] [CrossRef] [PubMed]
- Pollock, G.; Newbold, K.B.; Lafrenière, G.; Edge, S. Discrimination in the doctor’s office: Immigrants and refugee experiences. Crit Soc Work. 2012, 13, 1–16. [Google Scholar]
- Zapolski, T.C.B.; Rowe, A.T.; Banks, D.E.; Faidley, M. Perceived discrimination and substance use among adolescents: Examining the moderating effect of distress tolerance and negative urgency. Subst Use Misuse. 2019, 54, 156–165. [Google Scholar] [CrossRef]
- Pascoe, E.A.; Richman, L.S. Perceived discrimination and health: A meta-analytic review. Psychol Bull. 2009, 135, 531–554. [Google Scholar] [CrossRef] [PubMed]
- Hansen, K.L.; Sørlie, T. Ethnic discrimination and psychological distress: A study of Sami and non-Sami populations in Norway. Transcult Psychiatry. 2012, 49, 26–50. [Google Scholar] [CrossRef]
- Smith, A.B.; Oluboyede, R.W.; Jewison, J.; House, A.O. The factor structure of the GHQ-12: The interaction between item phrasing, variance and levels of distress. Qual Life Res. 2013, 22, 145–152. [Google Scholar] [CrossRef]
- Romppel, M.; Braehler, E.; Roth, M.; Glaesmer, H. What is the general health questionnaire-12 assessing? Dimensionality and psychometric properties of the general health questionnaire-12 in a large-scale German population sample. Compr Psychiatry. 2013, 54, 406–413. [Google Scholar] [CrossRef] [PubMed]
- Deasy, C.; Coughlan, B.; Pironom, J.; Jourdan, D.; Mannix-Mcnamara, P. Psychological distress and coping amongst higher education students: A mixed method enquiry. PLoS One 2014, 9. [Google Scholar] [CrossRef] [PubMed]
- Phillips, M.R. [Title missing]. 2009. p. 91–92.
- Caron, J.; Fleury, M.J.; Perreault, M.; Crocker, A.; Tremblay, J.; Tousignant, M.; et al. Prevalence of psychological distress and mental disorders, and use of mental health services in the epidemiological catchment area of Montreal south-west. BMC Psychiatry. 2012, 12, 1–12. [Google Scholar] [CrossRef]
- Khatib, M.; Mansbach-Kleinfeld, I.; Abu-Kaf, S.; Ifrah, A.; Sheikh-Muhammad, A. Correlates of psychological distress and self-rated health among Palestinian citizens of Israel: Findings from the Health and Environment Survey (HESPI). Isr J Health Policy Res. 2021, 10. [Google Scholar] [CrossRef]
- Silva, M.; Loureiro, A.; Cardoso, G. Social determinants of mental health: A review of the evidence. Eur J Psychiatry. 2016, 30, 259–292. [Google Scholar]
- Faulkner, L.; Brown, K.; Quinn, T. Analyzing community resilience as an emergent property of dynamic social-ecological systems. Ecol Soc. 2018, 23, 1–11. [Google Scholar] [CrossRef]
- Ciaramella, M.; Monacelli, N.; Cocimano, L. Promotion of resilience in migrants: A systematic review of study and psychosocial interven- tion. J Immigr Minor Health. 2022, 24, 1328–1344. [Google Scholar] [CrossRef]
- Vázquez, G.; Ruiz, L.L.; Gracia, M. ; M Resilience and integration: Analysis of the influence of resilience on immigrant integration. J Immigr Refuge Stud. 2019, 17, 291–305. [Google Scholar]
- Gupta, V. Resilience in immigrant populations. StatPearls. StatPearls Publishing; 2021.
- Ramírez, M.G.; Castillo, J.D.D.; Estévez, A. Resilience in adult immigrants: Protective and risk factors. J Soc Psychol. 2018, 33, 421–453. [Google Scholar]
- Javdani, S.; Allen, J.G.; Elsayed, N. Resilience and psychological well-being among young immigrants: The role of risk and protective factors. Child Psychiatry Hum Dev. 2019, 50, 75–84. [Google Scholar]
- López, T.T.; Viladrich, C.; Cruz, J.; Carrasco, P. Identity and resilience in second-generation immigrants: The role of ethnic and cultural identity. J Community Psychol. 2020, 48, 1625–1641. [Google Scholar]
- Liu, X.; Xie, T.; Li, W.; Tao, Y.; Liang, P.; Zhao, Q. The relationship between perceived discrimination and wellbeing in impoverished college students: A moderated mediation model of self-esteem and belief in a just world. Curr Psychol. 2023, 42, 6711–6721. [Google Scholar] [CrossRef]
- Novara, C.; Abbate, C.S.; Garro, M.; Lavanco, G. The welfare of immigrants: Resilience and sense of community. J Prev Interv Community. 2021, 49, 1–15. [Google Scholar] [CrossRef]
- Wu, Y.; Sang, Z.; Zhang, X.-C.; Margraf, J. The relationship between resilience and mental health in Chinese college students: A longitudinal cross-lagged analysis. Front Psychol. 2020, 11. [Google Scholar] [CrossRef]
- Wills, T.A.; Shinar, O. Social support measurement and intervention: A guide for health and social scientists. Oxford University Press; 2000.
- Sharp, P.; Oliffe, J.L.; Kealy, D.; Rice, S.M.; Seidler, Z.E.; Ogrodniczuk, J.S. Social support buffers young men’s resilient coping to psychological distress. Early Interv Psychiatry. 2023, 17, 784–791. [Google Scholar] [CrossRef]
- Sheikh, M.A.; Abelsen, B.; Olsen, J.A. Clarifying associations between childhood adversity, social support, behavioral factors, and mental health, health, and well-being in adulthood: A population-based study. Front Psychol. 2016, 7. [Google Scholar] [CrossRef] [PubMed]
- Dimitrova, R.; Johnson, D.J.; De, V.; Vijver, F.J.R. Ethnic socialization, ethnic identity, life satisfaction, and school achievement of Roma ethnic minority youth. J Adolesc. 2018, 62, 175–183. [Google Scholar] [CrossRef] [PubMed]
- Huynh, Q.-L.; Devos, T.; Goldberg, R. The role of ethnic and national identifications in perceived discrimination for Asian Americans: Toward a better understanding of the buffering effect of group identifications on psychological distress. Asian Am J Psychol. 2014, 5, 161–171. [Google Scholar] [CrossRef] [PubMed]
- Jaspal, R.; Lopes, B. Discrimination and mental health outcomes in British Black and South Asian people during the COVID-19 outbreak in the UK. Ment Health Relig Cult. 2021, 24, 80–96. [Google Scholar] [CrossRef]
- Levin, J.S.; Chatters, L.M.; Taylor, R.J. Religious effects on health status and life satisfaction among Black Americans. J Gerontol B Psychol Sci Soc Sci. 1995, 50, 154–163. [Google Scholar] [CrossRef]
- Yıldırım, M.; Aziz, I.A.; Vostanis, P.; Hassan, M.N. Associations among resilience, hope, social support, feeling belongingness, satisfac- tion with life, and flourishing among Syrian minority refugees. J Ethn Subst Abuse. 2022, 22, 355–372. [Google Scholar]
- Newman, A.; Nielsen, I.; Smyth, R.; Hirst, G. Mediating role of psychological capital in the relationship between social support and wellbeing of refugees. Int Migr. 2018, 56, 117–132. [Google Scholar] [CrossRef]
- Jasinskaja-Lahti, I.; Liebkind, K.; Jaakkola, M.; Reuter, A. Perceived discrimination, social support networks, and psychological well-being among three immigrant groups. J Cross Cult Psychol. 2006, 37, 293–311. [Google Scholar] [CrossRef]
- Derogatis, L.R. Brief Symptom Inventory (BSI-18): Administration, scoring, and procedures manual. 2001.
- Canavarro, M.C.; Pereira, M. BSI - Psychopathological Symptom Inventory: Short version (BSI-18). In: S., Machado C, Gonçalves MM, Almeida LS, editors. Psychological assessment: Validated instruments for the Portuguese population. Vol. 3. Quarteto Editora; 2007. p. 109–130.
- Zimet, G.D.; Dahlem, N.W.; Zimet, S.G.; Farley, G.K. The Multi-dimensional Scale of Perceived Social Support. J Pers Assess. 1988, 52, 30–41. [Google Scholar] [CrossRef]
- Carvalho, S.; Pinto-Gouveia, J.; Pimentel, P.; Maia, D. Mota-Pereira J. Psychometric characteristics of the Portuguese version of the Multidimensional Scale of Perceived Social Support (MSPSS). Psychologica 2011, 54, 297–312. [Google Scholar]
- Williams, D.R.; Yu, Y.; Jackson, J.S.; Anderson, N.B. Racial differences in physical and mental health: Socioeconomic status, stress, and discrimination. J Health Psychol. 1997, 2, 335–351. [Google Scholar]
- Seabra, D.; Gato, J.; Petrocchi, N.; Carreiras, D.; Azevedo, J.; Martins, L.; Salvador, M.D. Everyday Discrimination Scale: Dimensionality in a Portuguese community sample and specific versions for sexual and gender minorities. Curr Psychol. 2023:1-12.
- Connor, K.M.; Davidson, J.R. Development of a new resilience scale: The Connor-Davidson Resilience Scale (CD-RISC). Depress Anxiety. 2003, 18, 76–82. [Google Scholar] [CrossRef] [PubMed]
- National Institute of Statistics. Survey on Living Conditions, Origins, and Trajectories of the Resident Population 2023. Available from: https://www.ine.pt/ngt_server/attachfileu.jsp?att_display=n&;att_download=y&;look_parentBoui=680073092.
- Cohen, J. Statistical power analysis for the behavioral sciences (2nd ed.) Lawrence Erlbaum Associates. 1988.
- World Medical Association. World Medical Association Declaration of Helsinki: Ethical principles for medical research involving human subjects. 2014.
- Berger, R.; Rahav, G.; Ronen, T.; Roziner, I.; Savaya, R. Ethnic density and psychological distress in Palestinian Israeli adolescents: Mediating and moderating factors. Child Adolesc Soc Work J. 2020, 37, 443–454. [Google Scholar] [CrossRef]
- Ahn, Y.J.; Kang, E. Informal and formal support as moderators between racial discrimination and mental distress among Black, Asian, and Latino Americans. Front Psychol. 2025, 13. [Google Scholar]
- Wang, J.; Shaheen, M. Impact of minority perceived discrimination on resistance to innovation and moderating role of psychological distress: Evidence from ethnic minority students of China. Front Psychol. 2022, 13. [Google Scholar] [CrossRef] [PubMed]
- Cassidy, C.; O’connor, R.C.; Howe, C.; Warden, D. Perceived discrimination and psychological distress: The role of personal and ethnic self-esteem. J Couns Psychol. 2004, 51, 329–339. [Google Scholar] [CrossRef]
- Mcsorley, K.; Bacong, A.M. Associations between socioeconomic status and psychological distress across Latinx subgroups: The unequal role of education and income. Int J Environ Res Public Health. 2023, 20, 4751–4751. [Google Scholar] [CrossRef] [PubMed]
- Nuru-Jeter, A.M.; Williams, C.T.; Laveist, T.A. A methodological note on modeling the effects of race: The case of psychological distress in low-income urban African Americans. Stress Health. 2008, 24, 111–119. [Google Scholar] [CrossRef]
Figure 1.
Correlations between the study variables. Notes. BSI: Brief Symptom Inventory; CD-RISC-10: Connor-Davidson Resilience Scale-10; EDS: Everyday Discrimination Scale – Portuguese Version; MSPSS: Multidimensional Scale of Perceived Social Support.
Figure 1.
Correlations between the study variables. Notes. BSI: Brief Symptom Inventory; CD-RISC-10: Connor-Davidson Resilience Scale-10; EDS: Everyday Discrimination Scale – Portuguese Version; MSPSS: Multidimensional Scale of Perceived Social Support.
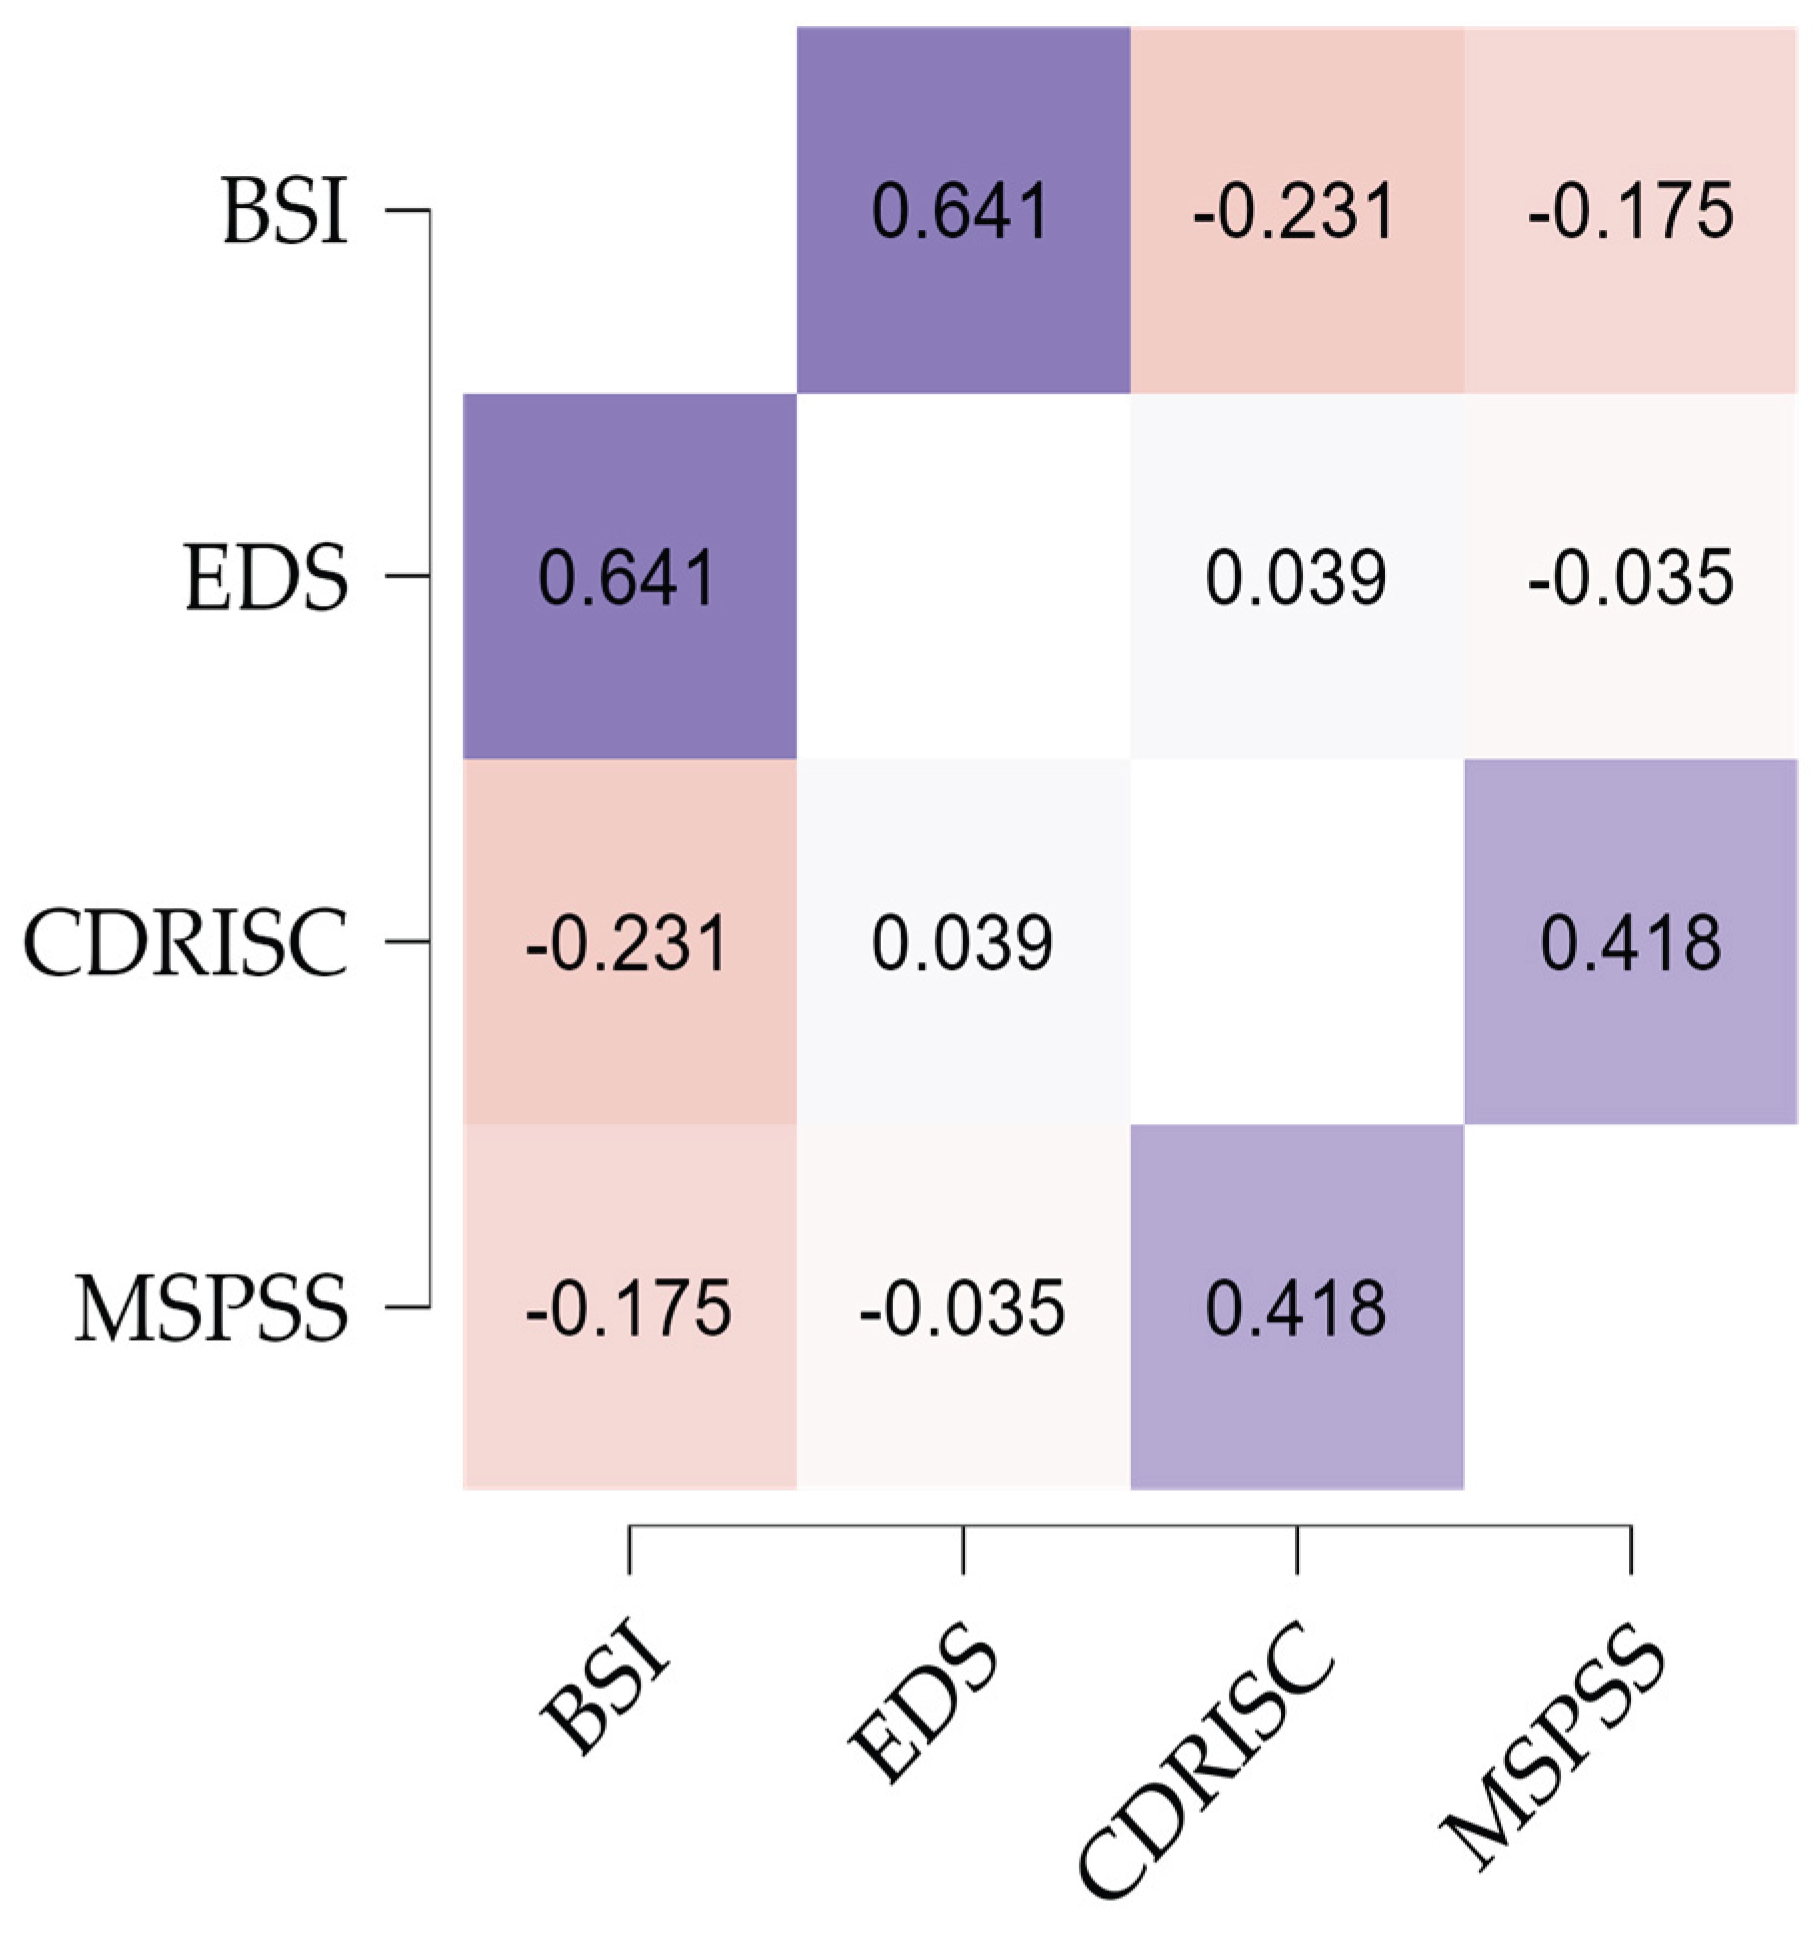

Table 1.
- Sociodemographic characteristics of participants.
|
Ethnic Majority (n=609, 80.56%) |
Ethnic Minority (n=147, 19.44%) |
Total sample(n=756, 100%) | ||||||||
| N | % | N | % | N | % | χ2 | p | Cramer’s V | ||
| Gender | Men | 183 | 30 | 93 | 63.3 | 276 | 36.5 | 56,690 | <.001 | .274 |
| Women | 422 | 66.3 | 54 | 36.7 | 476 | 63 | ||||
| Sexual orientation | Straight | 540 | 88.8 | 127 | 86.4 | 667 | 88.2 | .590 | .442 | .028 |
| LGBTQIA+ | 69 | 11.3 | 20 | 13.6 | 89 | 11.8 | ||||
| Marital Status |
Single/Not dating | 139 | 22.8 | 32 | 21.8 | 171 | 22.6 | 10.95 | .027 | .120 |
| Single/Dating | 140 | 23 | 34 | 23.1 | 174 | 23 | ||||
| Married / Cohabitation | 271 | 44.5 | 75 | 51 | 346 | 45.8 | ||||
| Divorced/Separated | 51 | 8.4 | 2 | 1.4 | 53 | 7 | ||||
| Widow | 8 | 1.3 | 4 | 2.7 | 12 | 1.6 | ||||
| Children | No | 312 | 51.2 | 68 | 46.3 | 380 | 50.3 | 1,171 | .279 | .039 |
| Yes | 297 | 48.8 | 79 | 53.7 | 376 | 49.7 | ||||
| Number of children | 1 | 125 | 41.8 | 5 | 6.4 | 130 | 34.6 | 78.64 | .001 | .459 |
| 2 | 130 | 43.5 | 30 | 38.5 | 160 | 42.6 | ||||
| 3 | 27 | 9 | 27 | 34.6 | 54 | 14.4 | ||||
| 4 | 8 | 2.7 | 12 | 15.4 | 20 | 5.3 | ||||
| 5 or more | 8 | 2.7 | 4 | 5.1 | 12 | 3.2 | ||||
| Education | Up to 4 years | 3 | 0.5 | 8 | 5.4 | 11 | 1.5 | 187.66 | .001 | .498 |
| Up to 6 years | 9 | 1.5 | 20 | 13.6 | 29 | 3.8 | ||||
| Up to 9 years | 25 | 4.1 | 42 | 28.6 | 67 | 8.9 | ||||
| Up to 12 years | 135 | 22.2 | 40 | 27.2 | 175 | 23.1 | ||||
| Degree | 235 | 38.6 | 20 | 13.6 | 255 | 33.7 | ||||
| Master’s Degree | 201 | 33 | 17 | 11.6 | 218 | 28.8 | ||||
| Other | 1 | 0.2 | 1 | 0.1 | ||||||
| Household | 1 | 84 | 13.8 | 9 | 6.1 | 93 | 12.3 | 203.34 | .001 | .519 |
| 2 | 176 | 28.9 | 20 | 13.6 | 196 | 25.9 | ||||
| 3 | 176 | 28.9 | 10 | 6.8 | 186 | 24.6 | ||||
| 4 | 138 | 22.7 | 35 | 23.8 | 173 | 22.9 | ||||
| 5 | 27 | 4.4 | 45 | 30.6 | 72 | 9.5 | ||||
| More than 5 people | 8 | 1.3 | 28 | 19 | 36 | 4.8 | ||||
| Professional situation | Unemployed | 74 | 12.2 | 66 | 44.9 | 140 | 18.5 | 118.28 | .001 | .396 |
| Employed | 330 | 54.2 | 25 | 17 | 355 | 47 | ||||
| Self-employed worker | 48 | 7.9 | 3 | 2 | 51 | 6.7 | ||||
| Worker/student | 28 | 4.6 | 11 | 7.5 | 39 | 5.2 | ||||
| Student | 106 | 17.4 | 30 | 20.4 | 136 | 18 | ||||
| Retired | 18 | 3 | 11 | 7.5 | 29 | 3.8 | ||||
| Other | 5 | 0.8 | 1 | 0.7 | 6 | 0.8 | ||||
| Income | Up to 522.50 euros | 46 | 7.6 | 38 | 25.9 | 84 | 11.1 | 175.19 | .001 | .481 |
| From 522.50 to 1045 euros | 74 | 12.2 | 66 | 44.9 | 140 | 18.5 | ||||
| From 1045 to 1567.5 euros | 101 | 16.6 | 31 | 21.1 | 132 | 17.5 | ||||
| From 1567.5 to 2090 euros | 115 | 18.9 | 3 | 2 | 118 | 15.6 | ||||
| From 2,090 to 2,612.5 euros | 98 | 16.1 | 2 | 1.4 | 100 | 13.2 | ||||
| From 2612.5 to 3135 euros | 61 | 10 | 4 | 2.7 | 65 | 8.6 | ||||
| From €3,135 to €3,657.5 | 37 | 6.1 | 1 | 0.7 | 38 | 5 | ||||
| More than 3657.5 euros | 77 | 12.6 | 2 | 1.4 | 79 | 10.4 | ||||
Table 2.
Comparison Between majority and minority ethnic groups.
| Variables |
Ethnicity |
Mean | SD | p | Cohen’s dd |
| Psychological distress | Majority | .82 | .69 | <.001 | 0.997 |
| Minority | 1.57 | .80 | |||
| Social discrimination | Majority | .81 | .81 | <.001 | 1.798 |
| Minority | 2.62 | 1.17 | |||
| Perceived social support | Majority | 5.58 | 1.17 | <.001 | 0.447 |
| Minority | 6.09 | 1.09 | |||
| Resilience | Majority | 2.64 | .73 | <.001 | 0.84 |
| Minority | 3.17 | .52 |
Table 3.
Analysis of linear regression as predictors of psychological distress.
| Model 1 | Model 2 | Model 3 | |||||||
| Psychological distress | B |
SEB |
Β | B |
SEB |
Β | B |
SEB |
Β |
| Gender | .041 | .935 | .001 | -1.504 | .766 | -.054* | -1,698 | .767 | -.061* |
| Sexual orientation | 6,178 | 1,474 | .144 | 2,628 | 1,203 | .061 | 2,651 | 1,198 | .062 |
| Age | -.203 | .036 | -.202** | -.091 | .030 | -.090 | -.087 | .030 | -.086 |
| Education | -2.205 | .472 | -.187 | -.342 | .398 | -.029 | -.257 | .398 | -.022 |
| Household | .672 | .377 | .065 | -.037 | .312 | -.004 | -.135 | .313 | -.013 |
| Per capita income | -4,906 | 1,146 | -.175 | -1,010 | .946 | -.036 | -.605 | .955 | -.022 |
| Social discrimination | 7.253 | .397 | .601 | 6,717 | .446 | .556** | |||
| Perceived social support | -.705 | .347 | -.060 | -.811 | .348 | -.069 | |||
| Resilience | -3,898 | .565 | -.204** | -4,295 | .583 | -.224** | |||
| Ethnicity | 3,412 | 1,312 | .098 | ||||||
| R 2 | 0.218 | 0.497 | 0.502 | ||||||
| Z | 34.73 | 81.99 | 75.04 | ||||||
*<0.05; **<0.01.
Disclaimer/Publisher’s Note: The statements, opinions and data contained in all publications are solely those of the individual author(s) and contributor(s) and not of MDPI and/or the editor(s). MDPI and/or the editor(s) disclaim responsibility for any injury to people or property resulting from any ideas, methods, instructions or products referred to in the content. |
© 2025 by the authors. Licensee MDPI, Basel, Switzerland. This article is an open access article distributed under the terms and conditions of the Creative Commons Attribution (CC BY) license (http://creativecommons.org/licenses/by/4.0/).
Copyright: This open access article is published under a Creative Commons CC BY 4.0 license, which permit the free download, distribution, and reuse, provided that the author and preprint are cited in any reuse.


