Introduction
A complex network of millions of neurons responsible for cognitive functions[
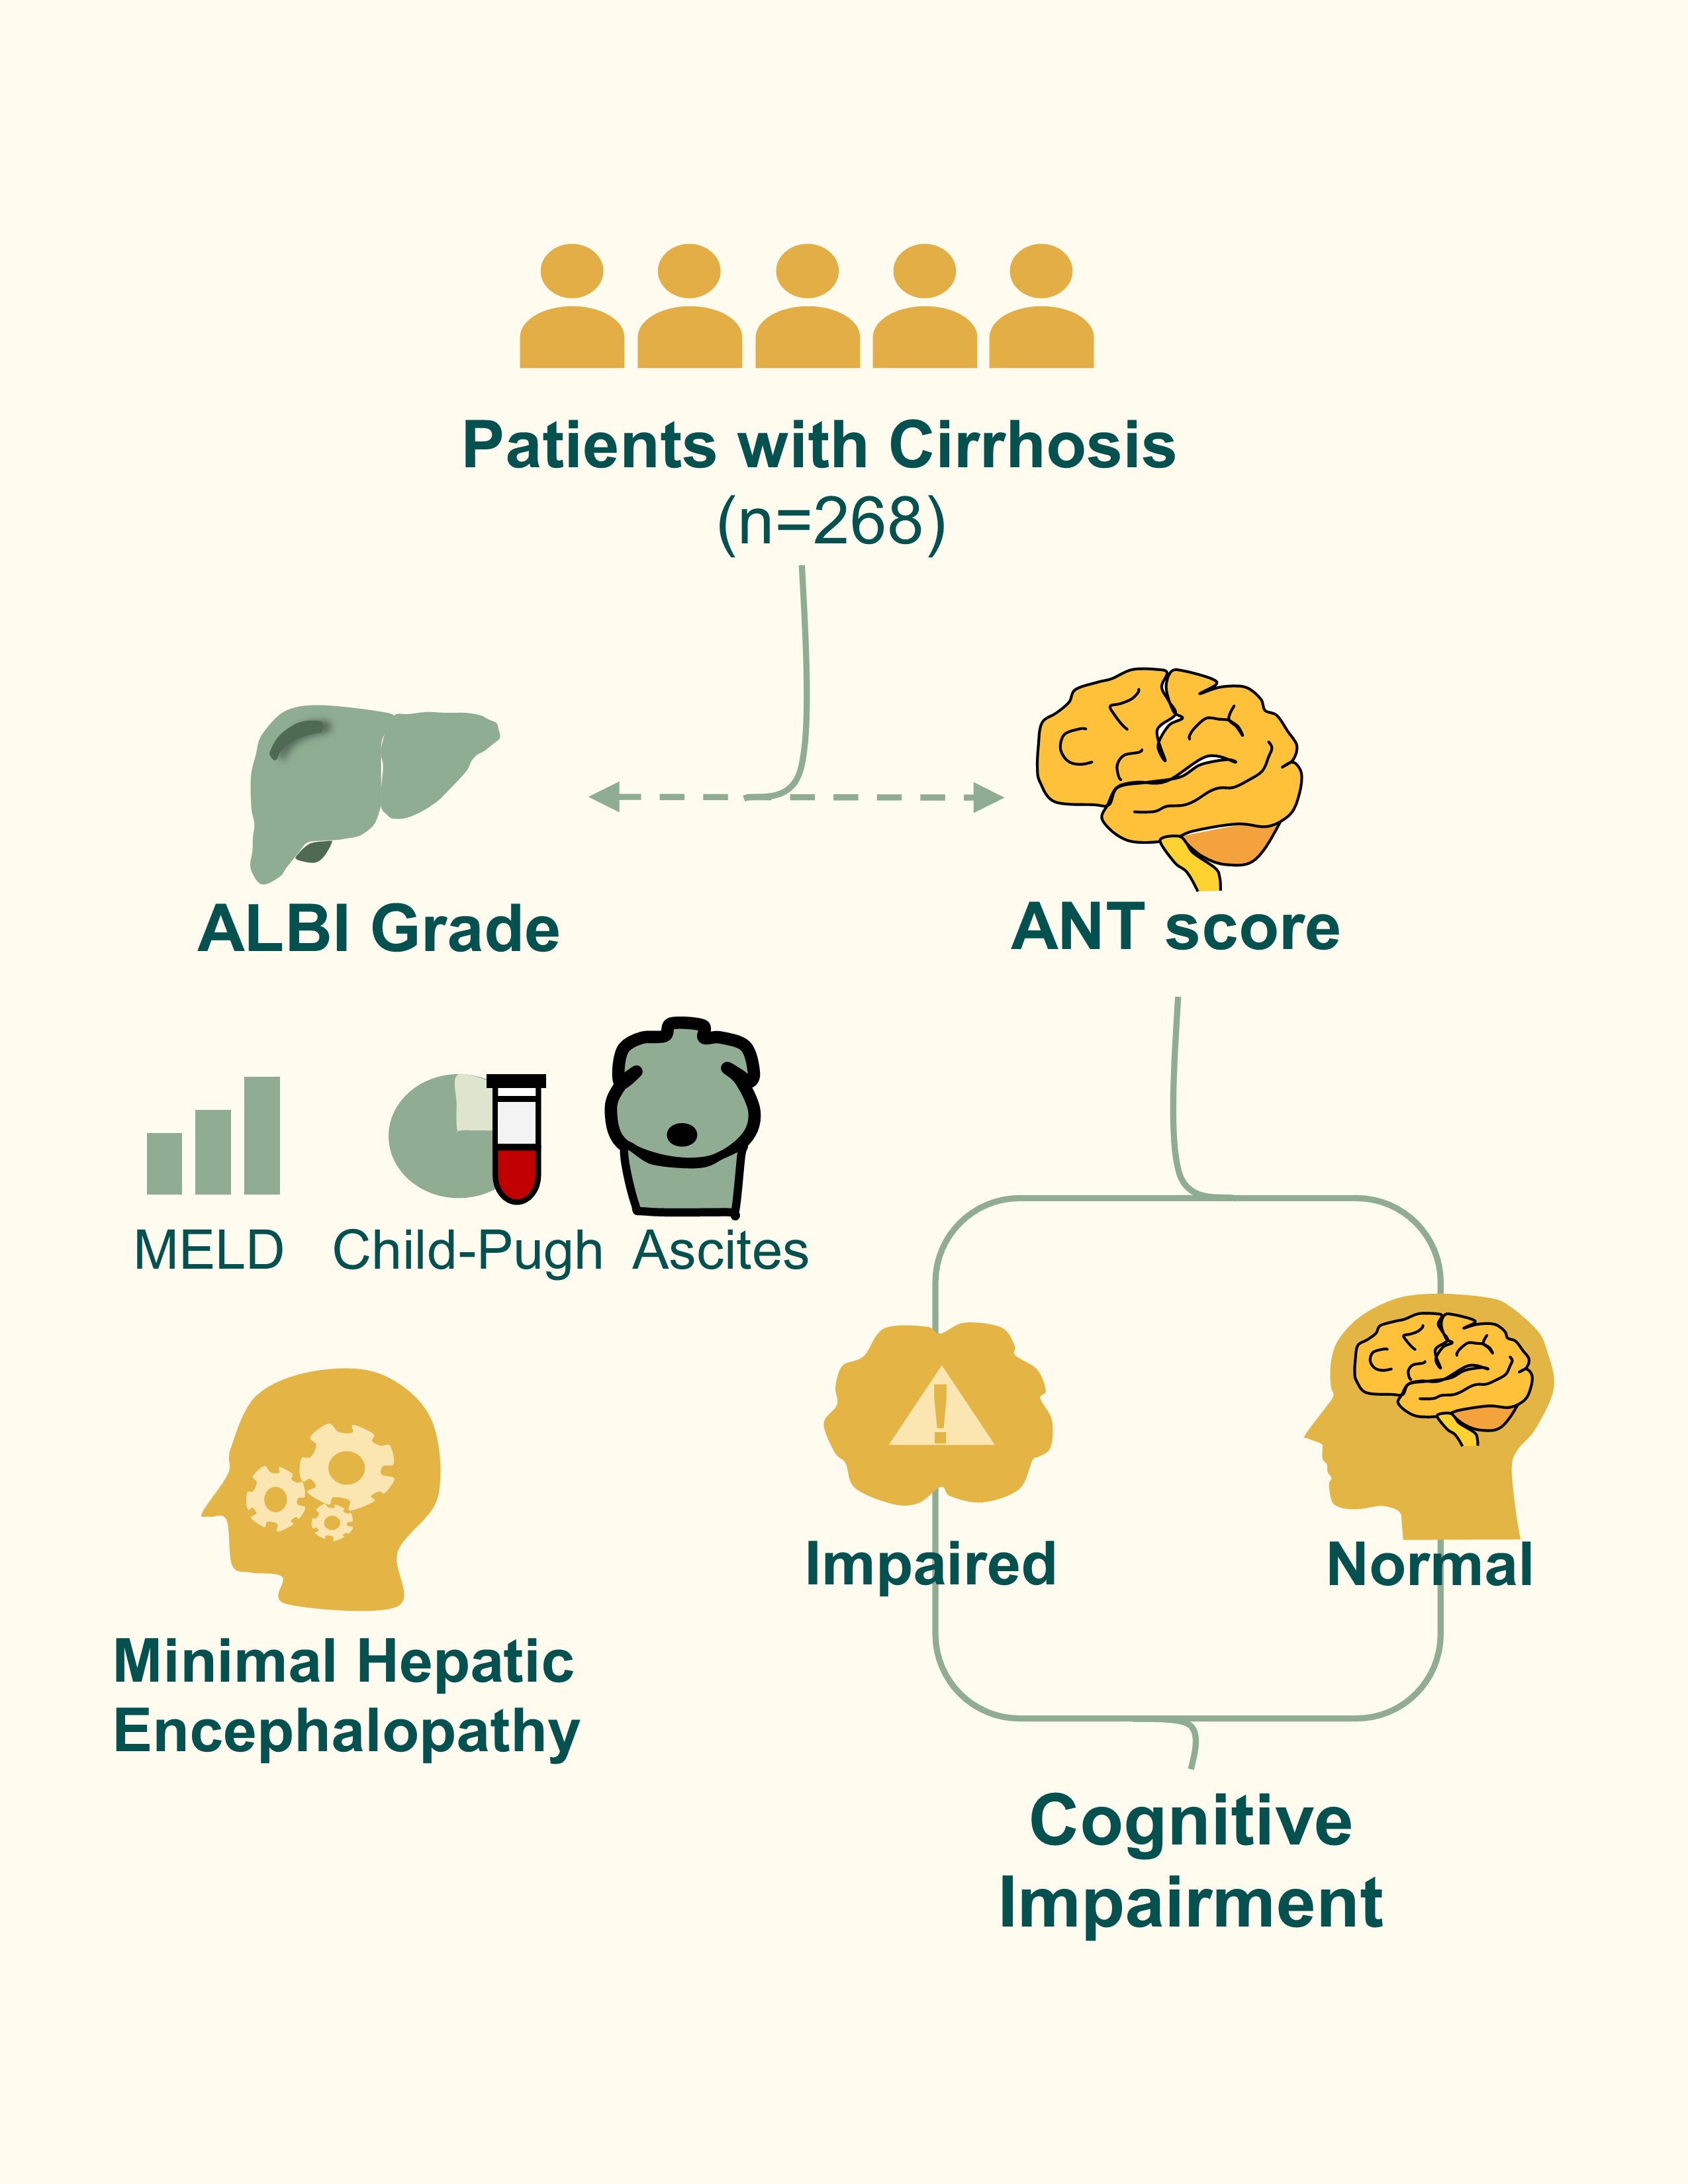
1]. Cognitive dysfunction in patients with liver cirrhosis, encompassing conditions such as minimal hepatic encephalopathy (MHE), has garnered increasing attention due to its impact on quality of life and clinical outcomes. The Animal Naming Test (ANT), a brief verbal fluency assessment, has emerged as a reliable tool for detecting MHE in cirrhotic patients[
2]. This test evaluates executive function and language abilities by requiring individuals to name as many animals as possible within a minute. A score below 20 is indicative of cognitive impairment, with lower scores correlating with more severe cognitive dysfunction[
3]. A recent meta-analysis showed that liver simple biomarkers could be used in predicting the risk of cognitive impairment[
4].
The Albumin-Bilirubin (ALBI) grade is a non-invasive scoring system that assesses liver function by incorporating serum albumin and bilirubin levels. It has been validated as a prognostic tool in hepatocellular carcinoma and cirrhosis, with higher ALBI scores correlating with poorer liver function and increased risk of decompensation[
5].
Studies showed that cognitive functions recovery, could not cause hepatic injury[
6]. Moreover, several molecular pathways involved in cognitive function overlap with those regulating hepatic function[
7]. Hepatic involvement in various virus-related neurological disorders may contribute to cognitive impairment[
8]. Furthermore, recent advances in recombinant vaccine design and the investigation of anti-apoptotic pathways may be of interest to patients with cirrhosis and immune disorders. For example, the in silico design of a multi-epitope vaccine against virus using immunoinformatics has provided novel approaches to the development of universal vaccines[
9].
Recent studies have explored the relationship between liver function, as indicated by the ALBI score, and cognitive performance in general population[
10]. Findings suggest that while ALBI scores are associated with liver disease severity, their direct correlation with cognitive impairment remains under investigation[
10].
Advancements in non-invasive biomarkers, including serum panels and imaging techniques, have facilitated the assessment of liver disease progression without the need for invasive procedures[
11]. These biomarkers offer valuable insights into liver function and may serve as adjuncts in evaluating cognitive impairment in cirrhotic patients. Understanding the interplay between liver function, cognitive performance, and non-invasive biomarkers is crucial for developing comprehensive management strategies for individuals with liver cirrhosis.
Materials and Methods
Study Design and Population
This was a retrospective secondary data analysis based on an openly available dataset entitled
Impact of diabetes mellitus on results in the animal naming test in patients with and without liver cirrhosis (Zenodo record:
https://zenodo.org/records/14274786, accessed on September 14, 2025)[
12]. The original cohort had been prospectively recruited at the Cirrhosis Center Mainz (CCM), Department of Internal Medicine I, University Medical Center Mainz, Germany, between July 2017 and December 2023. Details of patient enrollment, diagnostic procedures, and exclusion criteria have been extensively described elsewhere (doi:10.1371/journal.pone.0316490)[
13]. In brief, patients with cirrhosis were recruited either during outpatient visits or elective hospitalizations, with diagnosis of cirrhosis confirmed through histology, imaging, endoscopic features, and/or clinical history. Exclusion criteria included active infection, ongoing alcohol abuse within the last three months, hepatocellular carcinoma, psychotropic drug use, severe comorbidities, or insufficient German language skills. Stable patients with a history of overt hepatic encephalopathy (OHE) under consistent treatment with lactulose or rifaximin were not excluded. Additional control groups without cirrhosis had also been included in the primary cohort, but for the present analysis, only patients with liver cirrhosis were retained.
Ethical Considerations and Data Access
As this study constitutes a secondary analysis of a de-identified, publicly available dataset, it was deemed exempt from further ethical review by our institutional review board. The original study protocol was approved by the local ethics committee of the Landesärztekammer Rheinland-Pfalz and performed in accordance with the Declaration of Helsinki (1975, and its later amendments). Written informed consent had been obtained from all participants at the time of enrollment in the Mainz cohort. For the present analysis, no additional patient contact was required, as anonymized data were used under an open-access license. The dataset was retrieved from the Zenodo repository on September 14, 2025 (DOI: 10.5281/zenodo.14274786).
Study Population and Baseline Data Collection
From the available dataset, demographic parameters (age, sex, years of school education), clinical variables (etiology of cirrhosis, presence of diabetes mellitus, serum sodium, creatinine), and neurological assessments were extracted. Cognitive performance had been evaluated with the Animal Naming Test (ANT), in which patients enumerate as many distinct animals as possible within one minute. A score of <20 animals was considered indicative of cognitive impairment, in line with prior German validation studies. The presence of minimal hepatic encephalopathy (MHE) was assessed in the original dataset using the psychometric hepatic encephalopathy score (PHES), and recorded as a binary covariate for the adjusted models. Laboratory parameters including albumin and bilirubin were used to calculate the Albumin-Bilirubin (ALBI) grade for each subject.
Statistical Analysis
The primary aim was to evaluate the association between ALBI score and cognitive function measured by ANT. First, non-parametric correlations were assessed using Spearman’s rank correlation coefficient between dichotomous and categorical variables with continuous ALBI score. Subsequently, a univariable linear regression model was applied with ANT score as the dependent variable and ALBI score as the independent predictor.
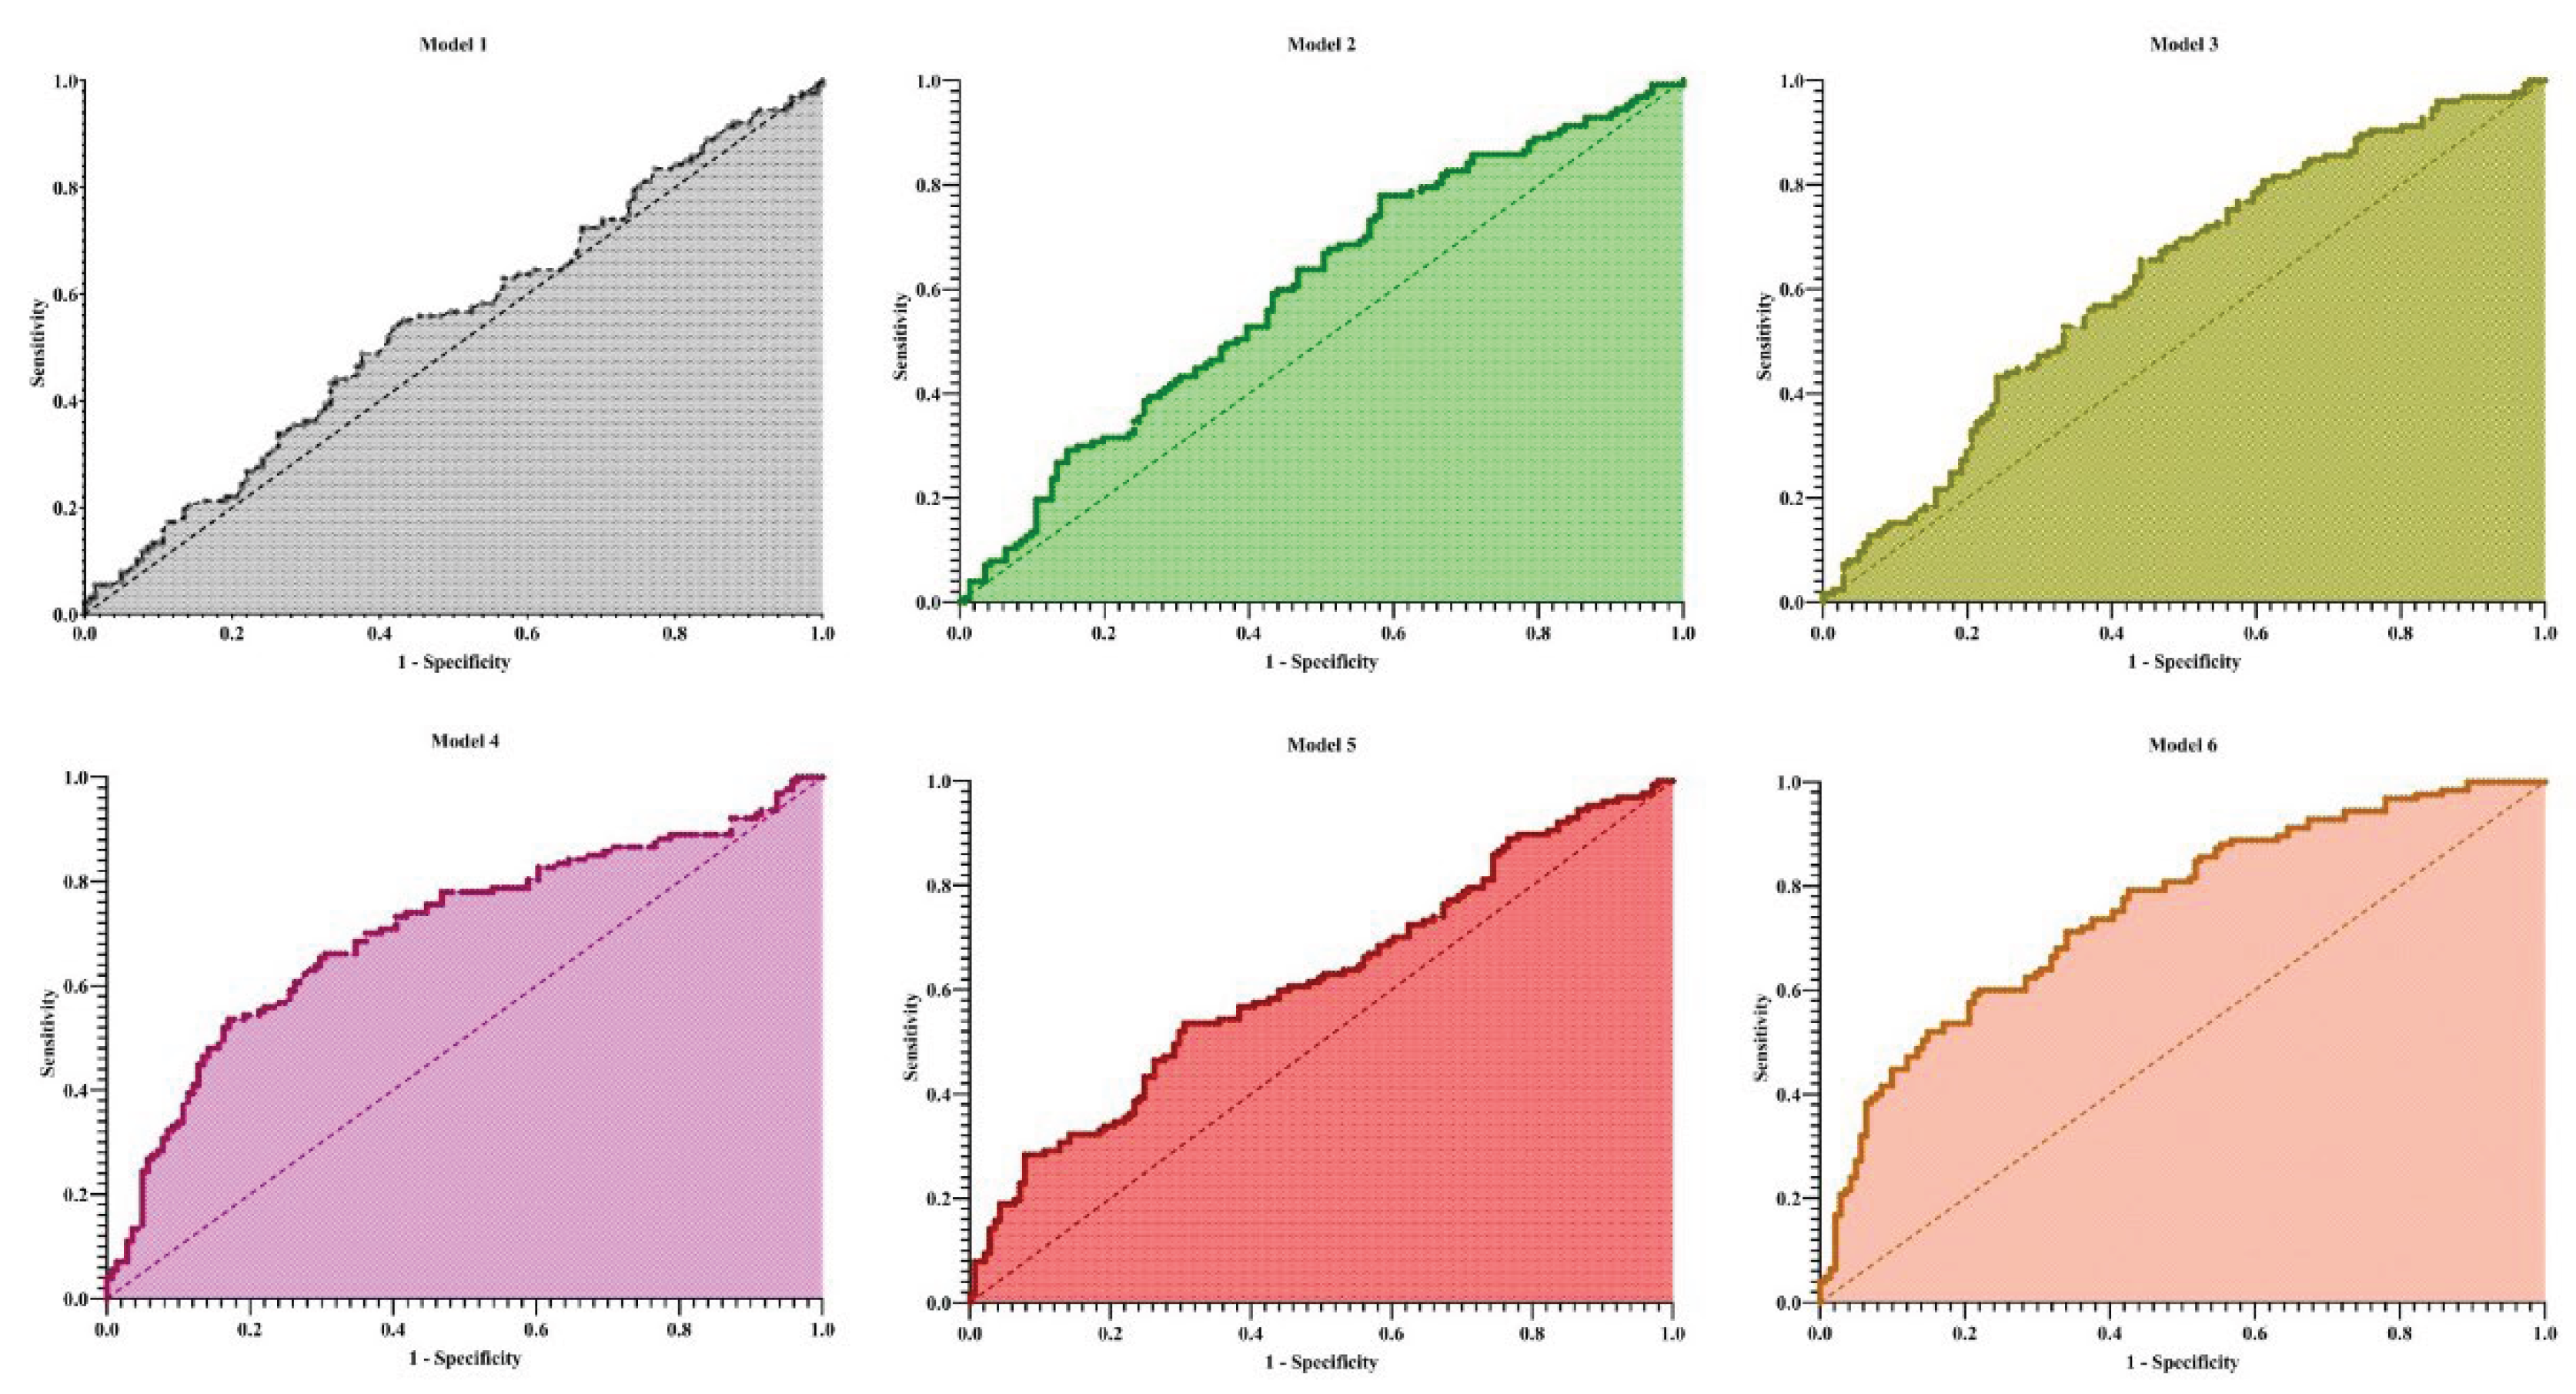
Cognitive impairment was defined solely based on the raw ANT score. A binary outcome variable was created where an ANT score of < 20 was classified as cognitive impairment (coded as 1) and a score of ≥ 20 was classified as no cognitive impairment (coded as 0). To further examine the risk of cognitive impairment (defined as ANT < 20), logistic regression analyses were conducted across six incremental models: (1) Model 1 (unadjusted): ALBI score as the sole predictor, (2) Model 2 (age- and sex-adjusted), (3) Model 3 (adjusted for years of school education), (4) Model 4 (further adjusted for diabetes mellitus, alcohol-related etiology of cirrhosis, and presence of MHE), (5) Model 5 (further adjusted for serum sodium and creatinine); and (6) Model 6 (fully adjusted model including all covariates). Odds ratios (ORs) with 95% confidence intervals (CIs) were reported. All analyses were performed using GraphPad Prism version 8 (GraphPad Software, San Diego, USA). Statistical significance was defined as a two-sided p-value < 0.05.
Results
Descriptive analysis
A total of 268 patients with liver cirrhosis were included in the present analysis. The mean age of the study population was 59.05 ± 10.61 years, and the majority were male (157 patients, 58.6%). The mean Albumin-Bilirubin (ALBI) score was −1.97 ± 0.64. With respect to clinical characteristics, 108 patients (40.3%) had an alcoholic etiology of cirrhosis, while 79 patients (29.5%) were diagnosed with diabetes mellitus. Cognitive assessment using the Animal Naming Test revealed that 127 patients (47.4%) demonstrated cognitive impairment, defined as a score of fewer than 20 animals.
Correlation Findings
Spearman’s correlation analysis demonstrated that the ALBI score was strongly associated with established markers of liver disease severity (
Table 1). ALBI showed a robust positive correlation with MELD score (ρ = 0.67, 95% CI: 0.60–0.73, p < 0.0001), Child-Pugh class (ρ = 0.60, 95% CI: 0.52–0.68, p < 0.0001), and a moderate correlation with history of ascites (ρ = 0.40, 95% CI: 0.29–0.50, p < 0.0001). Additional significant associations were observed between ALBI and the presence of MHE (ρ = 0.16, p = 0.007), alcoholic etiology of cirrhosis (ρ = 0.19, p = 0.0019), and history of overt hepatic encephalopathy (OHE) (ρ = 0.16, p = 0.009). In contrast, no significant correlations were found between ALBI and sex, diabetes, S-ANT1, or cognitive impairment defined as ANT < 20 (all p > 0.05).
Regression Findings
In the linear regression analysis, the ALBI score was not significantly associated with performance on the S-ANT1 (
Table 2). The regression model demonstrated a non-significant negative slope (β = −0.48, 95% CI: −1.54 to 0.58, p = 0.374), indicating no meaningful linear relationship between ALBI and S-ANT1 scores. The model explained only 0.3% of the variance in cognitive performance (R
2 = 0.003). Residual diagnostics confirmed normality of residuals (all tests p > 0.05), and variance inflation factor (VIF = 1.0) indicated absence of multicollinearity.
Table 2.
Linear regression analysis of the association between Albumin-Bilirubin (ALBI) score and simplified Animal Naming Test (S-ANT1) performance. Linear regression was performed using the least squares method with S-ANT1 score as the dependent variable and ALBI score as the independent variable. S-ANT1: Simplified Animal Naming Test; ALBI: Albumin-Bilirubin score; CI: Confidence interval; ns: not significant (p ≥ 0.05); Significance thresholds: p < 0.05 (*), p < 0.01 (**), p < 0.001 (*), p < 0.0001 (****).
| Parameter |
Estimate |
Standard Error |
95% CI |
t-value |
p-value |
Sig. |
| Intercept (β0) |
19.18 |
1.11 |
16.99 to 21.37 |
17.25 |
<0.0001 |
**** |
| ALBI (β1) |
−0.48 |
0.54 |
−1.54 to 0.58 |
0.89 |
0.3735 |
ns |
Model fit: R2 = 0.003, F(1, 266) = 0.79, p = 0.374
Residual diagnostics: Normality of residuals confirmed by Anderson-Darling, Shapiro-Wilk, and D’Agostino-Pearson tests (all p > 0.05). |
Table 3.
Logistic regression models for predictors of cognitive impairment in patients with liver cirrhosis. ALBI: Albumin-Bilirubin score; MHE: Minimal hepatic encephalopathy; OR: Odds ratio; CI: Confidence interval; AICc: corrected Akaike Information Criterion; AUC: area under ROC curve. ns: not significant (p ≥ 0.05); Significance thresholds: p < 0.05 (*), p < 0.01 (**), p < 0.001 (*), p < 0.0001 (****).
| Model |
Predictors |
OR (95% CI) |
p-value |
AICc |
Pseudo R2 (Tjur) |
AUC (95% CI) |
| 1 |
ALBI |
1.30 (0.89–1.91) |
0.176 (ns) |
373.0 |
0.007 |
0.55 (0.48–0.61), p=0.20 |
| 2 |
Age |
1.03 (1.00–1.05) |
0.024 (*) |
371.8 |
0.027 |
0.60 (0.53–0.67), p=0.0048 |
| |
Sex (male) |
1.01 (0.61–1.65) |
0.974 (ns) |
|
|
|
| |
ALBI |
1.35 (0.92–1.99) |
0.125 (ns) |
|
|
|
| 3 |
Education (School years) |
0.78 (0.67–0.91) |
0.0018 (**) |
361.5 |
0.046 |
0.62 (0.55–0.69), p=0.0006 |
| |
ALBI |
1.39 (0.94–2.07) |
0.099 (ns) |
|
|
|
| 4 |
MHE (yes) |
5.18 (2.87–9.69) |
<0.0001 (****) |
338.8 |
0.151 |
0.70 (0.64–0.77), p<0.0001 |
| |
Alcoholic etiology |
1.80 (1.04–3.12) |
0.035 (*) |
|
|
|
| |
Diabetes |
1.03 (0.56–1.86) |
0.931 (ns) |
|
|
|
| |
ALBI |
1.04 (0.68–1.59) |
0.842 (ns) |
|
|
|
| 5 |
Sodium |
0.93 (0.85–1.01) |
0.074 (ns) |
363.4 |
0.055 |
0.62 (0.55–0.68), p=0.0009 |
| |
Creatinine |
2.70 (1.31–6.18) |
0.012 (*) |
|
|
|
| |
ALBI |
1.15 (0.77–1.71) |
0.497 (ns) |
|
|
|
| 6 |
MHE (yes) |
4.46 (2.39–8.56) |
<0.0001 (****) |
332.6 |
0.196 |
0.75 (0.70–0.81), p<0.0001 |
| |
Education (School years) |
0.82 (0.69–0.97) |
0.022 (*) |
|
|
|
| |
Age |
1.02 (0.99–1.05) |
0.193 (ns) |
|
|
|
| |
Sex (male) |
0.80 (0.45–1.41) |
0.448 (ns) |
|
|
|
| |
Alcoholic etiology |
1.78 (0.98–3.24) |
0.058 (ns) |
|
|
|
| |
Diabetes |
0.72 (0.37–1.37) |
0.319 (ns) |
|
|
|
| |
Sodium |
0.93 (0.84–1.02) |
0.141 (ns) |
|
|
|
| |
Creatinine |
1.55 (0.67–3.90) |
0.322 (ns) |
|
|
|
| |
ALBI |
1.02 (0.64–1.60) |
0.934 (ns) |
|
|
|
In logistic regression analyses, the ALBI grade alone (Model 1) was not significantly associated with cognitive impairment (OR = 1.30, 95% CI: 0.89–1.91, p = 0.176). When age and sex were included (Model 2), older age emerged as an independent predictor (OR = 1.03 per year, 95% CI: 1.00–1.05, p = 0.024), while ALBI and sex remained nonsignificant. In contrast, lower educational attainment (Model 3) was strongly associated with higher risk of cognitive impairment (OR = 0.78, 95% CI: 0.67–0.91, p = 0.002). MHE was the strongest predictor across models. In Model 4, MHE was associated with a more than fivefold increased risk (OR = 5.18, 95% CI: 2.87–9.69, p < 0.0001), and alcoholic etiology also showed a significant effect (OR = 1.80, 95% CI: 1.04–3.12, p = 0.035), whereas diabetes and ALBI were not significant. In Model 5, higher creatinine levels independently predicted cognitive impairment (OR = 2.70, 95% CI: 1.31–6.18, p = 0.012), while sodium and ALBI were not significant. The fully adjusted Model 6 confirmed MHE (OR = 4.46, 95% CI: 2.39–8.56, p < 0.0001) and lower education (OR = 0.82, 95% CI: 0.69–0.97, p = 0.022) as independent predictors, while age, sex, alcoholic etiology, diabetes, sodium, creatinine, and ALBI did not retain significance.
Overall, model discrimination improved with the inclusion of clinical and laboratory covariates. The area under the ROC curve (AUC) increased from 0.55 in Model 1 to 0.75 in Model 6 (
Figure 1). Similarly, explanatory power improved across models, with Tjur’s R
2 increasing from 0.007 (Model 1) to 0.196 (Model 6).
Discussion
In the present study, we investigated the association between the Albumin-Bilirubin (ALBI) score and cognitive function in patients with liver cirrhosis using the Animal Naming Test (ANT). Our results demonstrated that while the ALBI score strongly correlated with established markers of liver disease severity, including MELD score and Child-Pugh class, it was not independently associated with cognitive impairment in fully adjusted models. Minimal hepatic encephalopathy (MHE) and lower educational attainment emerged as the most robust predictors of impaired cognitive performance in this population.
Serum albumin has been consistently highlighted as a critical factor influencing cognitive function in both hepatic and non-hepatic populations. Kaji et al. [
14] reported that lower serum albumin levels were predictive of early-stage HE in cirrhotic patients aged ≤65 years, demonstrating its utility as a screening biomarker for cognitive dysfunction. Similarly, Karako et al. [
15] found that serum albumin levels were positively correlated with cognitive performance in elderly populations and improved predictive accuracy when included in machine learning models. These findings suggest that albumin, as a surrogate for nutritional status and systemic health, is a meaningful indicator of cognitive vulnerability, even though in our cohort, ALBI, which integrates albumin and bilirubin, did not independently predict ANT performance after adjustment.
The role of albumin in cognitive health extends beyond hepatic populations. Lu Wang et al. [
16] observed that lower baseline serum albumin was independently associated with an increased risk of mild cognitive impairment (MCI) over a seven-year follow-up in older adults. This aligns with the concept that hypoalbuminemia may reflect systemic inflammation, malnutrition, or other comorbidities that contribute to cognitive decline. Although our study focused specifically on cirrhotic patients, the generalizable link between albumin and cognitive function underscores the importance of considering nutritional and systemic factors when interpreting cognitive assessments in liver disease.
While ALBI has been validated as a prognostic marker in liver diseases, its application to cognitive outcomes remains less clear. Xiufeng Wang et al. [
10] reported that higher ALBI scores were associated with increased risk of cognitive impairment in a general population cohort, in unadjusted model with Animal Naming Test and the Digit Symbol Substitution Test (DSST). Our findings diverged in that the ALBI score did not independently predict ANT-defined cognitive impairment, suggesting that the influence of liver synthetic function on cognitive performance may be test-specific or modulated by additional covariates such as MHE, education, and comorbidities. Additionally, Li et al. [
17] demonstrated that higher ALBI scores were associated with depression and worse outcomes in diverse populations, supporting the broader concept that liver dysfunction reflected by ALBI may influence neurocognitive and psychiatric health indirectly.
Overall, our results highlight that while ALBI captures liver disease severity effectively, cognitive function in cirrhosis is multifactorial and strongly driven by MHE and socio-demographic factors. Albumin, a component of ALBI, remains an important biomarker, consistent with prior studies, but the combined ALBI score may not provide additional predictive value for ANT performance in fully adjusted models. Future research should explore longitudinal relationships, incorporate multimodal cognitive assessments, and consider integrating liver function biomarkers with systemic and nutritional parameters to improve the identification of cirrhotic patients at risk of cognitive decline.
Author Contributions
MS: Reviewing the literature, Methodology, Investigation, Conceptualization, Formal analysis, Writing - the original draft, Writing - review & and editing; FS and RA: Conceptualization, Reviewing the literature, Methodology, Investigation, Writing - review & and editing; HPT: Supervision, Writing - the original draft, Writing - review & and editing.
Animal Studies
Not applicable
Research involving recombinant DNA
Not applicable
Acknowledgments
During the preparation of a part of this work, we used AI, such as ChatGPT and DeepSeek, for paraphrasing and grammar checking. Following the use of this tool, the author thoroughly reviewed and edited the content as needed and take full responsibility for the final version of the publication.
Conflict of Interest
The author declare that they have no conflict of interest.
References
- Arzaghi H, Adel B, Jafari H, Askarian-Amiri S, Shiralizadeh Dezfuli A, Akbarzadeh A, et al. Nanomaterial integration into the scaffolding materials for nerve tissue engineering: a review. Reviews in the Neurosciences. 2020, 31, 843–72. [CrossRef] [PubMed]
- Agarwal A, Taneja S, Chopra M, Duseja A, Dhiman R. Animal Naming Test–a simple and accurate test for diagnosis of minimal hepatic encephalopathy and prediction of overt hepatic encephalopathy. Clinical and experimental hepatology. 2020, 6, 116–24. [CrossRef] [PubMed]
- Miwa T, Hanai T, Hirata S, Nishimura K, Unome S, Nakahata Y, et al. Animal naming test stratifies the risk of falls and fall-related fractures in patients with cirrhosis. Scientific reports. 2024, 14, 4307. [CrossRef] [PubMed]
- Zhong Y, Li L. Association between liver biomarkers and risk of cognitive impairment and dementia: A systematic review and meta-analysis. Pakistan Journal of Medical Sciences. 2025, 41, 2122–32. [Google Scholar] [CrossRef] [PubMed]
- Navadurong H, Thanapirom K, Wejnaruemarn S, Prasoppokakorn T, Chaiteerakij R, Komolmit P, et al. Validation of the albumin-bilirubin score for identifying decompensation risk in patients with compensated cirrhosis. World Journal of Gastroenterology. 2023, 29, 4873. [CrossRef] [PubMed]
- Amani H, Habibey R, Shokri F, Hajmiresmail SJ, Akhavan O, Mashaghi A, et al. Selenium nanoparticles for targeted stroke therapy through modulation of inflammatory and metabolic signaling. Scientific reports. 2019, 9, 6044. [CrossRef] [PubMed]
- Ajami M, Pazoki-Toroudi H, Amani H, Nabavi SF, Braidy N, Vacca RA, et al. Therapeutic role of sirtuins in neurodegenerative disease and their modulation by polyphenols. Neuroscience & Biobehavioral Reviews. 2017, 73, 39–47.
- Sanami S, Shamsabadi S, Dayhimi A, Pirhayati M, Ahmad S, Pirhayati A, et al. Association between cytomegalovirus infection and neurological disorders: A systematic review. Reviews in Medical Virology. 2024, 34, e2532. [CrossRef] [PubMed]
- Sanami S, Nazarian S, Ahmad S, Raeisi E, Tahir ul Qamar M, Tahmasebian S, et al. In silico design and immunoinformatics analysis of a universal multi-epitope vaccine against monkeypox virus. Plos one. 2023, 18, e0286224.
- Wang X, Wang C, Sun S, Guo H, Zheng S, Shi X, et al. The association between the ALBI score and cognitive impairment as assessed by various diagnostic methods. 2025.
- Garg S, Varghese M, Shaik F, Jatin F, Sachdeva D, Eranhikkal FW, et al. Efficacy of Non-invasive Biomarkers in Diagnosing Non-alcoholic Fatty Liver Disease (NAFLD) and Predicting Disease Progression: A Systematic Review. Cureus. 2025, 17.
- Labenz C, Schleicher, E. Impact of diabetes mellitus on results in the animal naming test in patients with and without liver cirrhosis [Data set]. v1 ed. https://zenodo.org/: Zenodo; 2024.
- Schleicher EM, Tuchscher J, Weber M, Galle PR, Wörns M-A, Gairing SJ, et al. Impact of type 2 diabetes mellitus on results in the animal naming test in patients with and without liver cirrhosis. PloS one. 2025, 20, e0316490.
- Kaji K, Okita K, Suzuki K, Sato I, Fujisawa M, Yoshiji H. Association between serum albumin and cognitive dysfunction in hepatic encephalopathy: An exploratory data analysis. JGH Open. 2021, 5, 207–12. [CrossRef] [PubMed]
- Karako K, Hata T, Inoue A, Oyama K, Ueda E, Sakatani K. Importance of serum albumin in machine learning-based prediction of cognitive function in the elderly using a basic blood test. Frontiers in Neurology. 2024, 15, 1362560. [CrossRef] [PubMed]
- Wang L, Wang F, Liu J, Zhang Q, Lei P. Inverse relationship between baseline serum albumin levels and risk of mild cognitive impairment in elderly: a seven-year retrospective cohort study. The Tohoku journal of experimental medicine. 2018, 246, 51–7. [CrossRef] [PubMed]
- Li Q-Z, Tan J-X, Ruan G-T, Qin Q-Z, Deng T, Gong Y-Z. NHANES 2005–2018 data reveal high albumin-bilirubin scores are associated with depression. BMC psychiatry. 2025, 25, 660.
|
Disclaimer/Publisher’s Note: The statements, opinions and data contained in all publications are solely those of the individual author(s) and contributor(s) and not of MDPI and/or the editor(s). MDPI and/or the editor(s) disclaim responsibility for any injury to people or property resulting from any ideas, methods, instructions or products referred to in the content. |
© 2025 by the authors. Licensee MDPI, Basel, Switzerland. This article is an open access article distributed under the terms and conditions of the Creative Commons Attribution (CC BY) license (http://creativecommons.org/licenses/by/4.0/).