Submitted:
12 September 2025
Posted:
15 September 2025
You are already at the latest version
Abstract
During the 84th cruise of the R/V Akademik Mstislav Keldysh in August 2021, patterns of phytoplankton composition transformation were revealed along a northward gradient. The study involved three transects in the Fram Strait and adjacent Arctic waters: a southern transect (from the Barents Sea shelf to the Greenland shelf), a central transect across the Fram Strait, and a northern transect along the ice edge. Ten species of diatoms and eleven of dinoflagellates were identified, and their ecological preferences were characterized by determining the minimum, maximum, mean, and median values for abundance, biomass, depth of the biomass maximum, salinity, temperature, and the concentrations and ratios of nitrogen, phosphorus, and silicon. All identified species are of Atlantic origin. In summer, within the relatively warm Atlantic Waters, phytoplankton biomass was dominated by dinoflagellates of the genus Tripos and Protoperidinium depressum. Diatoms contributed insignificantly, with Stephanopyxis turris, Navicula planamembranacea, and Thalassiosira gravida being the most frequently observed. Northward, towards the Fram Strait, the dinoflagellate community shifted to include Protoperidinium breve, Protoperidinium brevipes, and Prorocentrum cordatum, while diatoms were increasingly represented by Thalassiosira rotula, Chaetoceros borealis, and Rhizosolenia styliformis. A further decline in temperature and salinity favored the dominance of the dinoflagellates Protoperidinium pellucidum and Gyrodinium lachryma, and the diatoms Eucampia groenlandica, Rhizosolenia hebetata f. semispina, and Rhizosolenia hebetata f. hebetata. The dinoflagellates Protoperidinium granii and Protoperidinium islandicum, along with the diatom Porosira glacialis, thrived at the lowest temperatures and salinities. Diatoms generally grew at silicon concentrations of 1–3 µM and nitrogen concentrations above 1 µM, except for R. hebetata f. semispina, R. hebetata f. hebetata, and Porosira glacialis. The dinoflagellates P. depressum, P. islandicum, P. brevipes, P. breve, and Gyrodinium lachryma were associated with lower nitrogen concentrations (< 2 µM), while others preferred higher levels. Diatom biomass was regulated by ambient nitrogen concentration, whereas dinoflagellate biomass was correlated with the biomass of small flagellates.
Keywords:
Arctic Ocean
; phytoplankton
; diatoms
; dinoflagellates
; temperature
; salinity
; nutrients
1. Introduction
Climate change is most pronounced in the Arctic, primarily driven by the rapid reduction of sea ice cover [1,2,3]. The expansion of open-water areas reduces albedo, leading to further warming of surface waters [4]. Furthermore, the structure of the remaining ice is changing, with multi-year ice being replaced by first-year ice [5]. Projections suggest that the entire Arctic Ocean (AO) will be largely ice-free in summer within the coming decades [6,7]. A key hypothesis explaining these profound climatic shifts is the increased advection of warm and saline Atlantic Waters (AW) [8,9,10]. This process alters the vertical structure of water masses, ultimately restructuring existing marine ecosystems. In the Eurasian Arctic, this phenomenon is termed Atlantification [8,9,11,12,13].
These changes affect both ice-associated and pelagic ecosystems. Shifts in ice age and physical structure lead to alterations in ice algal phytoplankton composition [14,15,16]. In the pelagic realm, boreal species are expanding northward, and the phenology and intensity of phytoplankton blooms are being modified [17,18,19,20,21,22,23,24]. These cascading effects impact the entire trophic web, from bacteria to fish [25,26,27,28,29,30]. Decreasing ice thickness enhances under-ice irradiance [31,32], which could potentially boost the productivity of Arctic pelagic ecosystems [33,34,35,36,37]. However, intense growth can also lead to more rapid nutrient depletion, potentially resulting in a significant decrease in overall ecosystem productivity [38].
The primary gateway for warm, saline Atlantic Water into the AO is the Fram Strait. Its eastern part is dominated by the northward-flowing West Spitsbergen Current (WSC) [39]. In contrast, the western part of the strait transports cold, freshened Arctic waters southward via the East Greenland Current. Both currents exhibit significant temporal and spatial variability [40,41,42].
Northward advection is accompanied by a decrease in a crucial ecological factor: temperature. The formation of community structures in response to changing temperatures involves complex processes that cannot be predicted solely from the physiological responses of individual species. An ecosystem’s response to warming involves the entire community, of which a species is only one part, and it cannot be considered in isolation [43,44,45]. Secondly, an individual species’ response to increasing temperature is contingent upon other environmental factors [46]. For autotrophic organisms, irradiance is paramount. As the ice edge retreats northward, key factors such as irradiance and photoperiod change [47]. Decreasing irradiance lowers the optimal growth temperature [48], which is also affected by nutrient limitation [49,50]. Consequently, studying a species’ response in monoculture (e.g., temperature growth curves) is insufficient for understanding the processes occurring during ocean warming. Obtaining such curves for all phytoplankton species is also impractical. Therefore, field observation data from the Arctic hold independent value. Logistical challenges often prevent the acquisition of long-term data series, making it difficult to disentangle climatic trends from interannual variability.
Another critical consideration is that phytoplankton community formation in the high Arctic occurs at temperatures far below the optimal growth temperatures for most species [45,51].
The aforementioned factors introduce significant uncertainty into our understanding of high Arctic phytoplankton community. In nature, species exist within a complex mosaic of physiological responses and ecosystem shifts, which must be accounted for when studying adaptation to changing environmental conditions [45,52]. Therefore, determining the ecological characteristics of the species that underpin the functioning of the high Arctic ecosystem is crucial. This information can serve as a basis for predicting the most probable ecosystem structure under a warming Arctic scenario.
This study aims to identify the ecological characteristics of the main phytoplankton species along the northward pathway of Atlantic Water through the Fram Strait. We simultaneously test the following hypothesis: adaptation to decreasing summer temperatures in high latitudes occurs through the formation of a community dominated by large diatoms and mixotrophic dinoflagellates. To achieve this goal, we addressed the following objectives during the R/V Akademik Mstislav Keldysh cruise in the summer of 2021: (1) analyze the phytoplankton community structure, (2) assess the abundance and biomass of dominant species, and (3) determine their key ecological characteristics.
2. Methods
2.1. Field Studies
Seawater sampling for nutrient and phytoplankton analysis was conducted in the first half of August 2021 during the 84th cruise of the R/V Akademik Mstislav Keldysh along three transects: southern, central, and northern (Figure 1, Table S1). The southern transect crossed the North Atlantic from the Barents Sea shelf in the east to the Greenland shelf in the west, around 74–76° N (Stations 7045–7052, Figure 1). The central transect began at the southern tip of Spitsbergen, traversed the Fram Strait from the western coast of Spitsbergen to the ice edge in the northern part of the strait (Stations 7063–7068 and 7084–7089). The northern transect ran from the shelf edge of the Yermak Plateau in the south to the ice edge in the north and further along the ice edge (Stations 7069–7083).
2.2. Species Identification
Species were identified based on morphological characteristics using the taxonomic guides of [53,54] and the WoRMS database. Identification and cell counting were performed using an Ergaval light microscope (Karl Zeiss, Jena, Germany) at magnifications of 16×20 and 16×40.
Cells with linear dimensions less than 20 µm were counted in a Najotte chamber (0.05 mL). Larger cells were counted in a Naumann chamber (1 mL). Unidentified species measuring 4–10 µm were classified as small flagellates. Cells smaller than 2 µm were excluded from the total phytoplankton biomass assessment. Cell biovolume and biomass were calculated according to [55]. For ecological characterization, we selected species with at least 5 occurrences.
2.3. Nutrient Analysis
The concentrations of phosphate phosphorus (P-PO₄), dissolved silicon (Si), nitrate (N-NO₃), nitrite (N-NO₂), and ammonium (N-NH₄) were determined using a Technicon II segmented flow autoanalyzer or by standard colorimetric methods [56,57]. Dissolved inorganic nitrogen (DIN) was calculated as the sum of nitrate, nitrite, and ammonium.
The euphotic depth was defined as the depth where photosynthetically active radiation (PAR) decreased to 1% and 0.1% of its surface value.
2.4. Ice Cover
Ice cover imagery for the period 16–18 August 2021 was provided by the State Scientific Center “Arctic and Antarctic Research Institute” (electronic atlas: http://www.aari.ru/odata/\_d0015.php, accessed on 16–18 August 2021).
2.5. Statistical Analysis
A significance level of α = 0.05 was used for all statistical tests. Student’s t-test was employed to determine significant differences between sample groups. For paired data, Pearson’s rank correlation coefficients between hydrological parameters and biological variables were calculated. All statistical analyses were performed using PAST software version 4.13.
3. Results
3.1. Hydrography
We adopted the water mass terminology proposed by [58], with boundaries defined according to [59,60]. We distinguished Atlantic Water (AW) and Polar Surface Water (PSW), using salinity as the primary descriptor (Table 1). Waters with salinity above 34.75 were classified as AW, and those below 34.0 as PSW. The intermediate salinity range (34.0 < S < 34.75) was defined as modified AW (mAW). Within PSW, we identified meltwater-influenced PSW (mPSW) with temperatures below 0 °C.
3.2. Phytoplankton Community Composition
The total phytoplankton biomass averaged below 100 mg m⁻³ (Table 2). Dinoflagellates were the main contributors to the total biomass. Diatom biomass was, on average, more than two times lower than dinoflagellate biomass; however, it was relatively high at stations on the northern transect, reaching a maximum of 617.1 mg m⁻³ at 34 m depth at Station 7082 (Table S3). At this station, diatoms dominated the phytoplankton community. Only three diatom and two dinoflagellate species exhibited intensive growth with biomass exceeding 100 mg m⁻³. The maximum dinoflagellate biomass was observed on the southern transect (Table 3).
The haptophyte Phaeocystis pouchetii reached high abundances and biomass on the northern transect; at Station 7081 (35 m depth), its contribution to the total phytoplankton biomass exceeded 50% (Table 2, Table 3, and Table S2).
3.3. Diatoms
Among the diatoms that showed significant biomass, we identified 10 species (Table S4). Only three species exceeded a biomass of 100 mg m⁻³ (Table 3), all located on the northern transect (Figure 1). The maximum diatom biomass was recorded at Station 7082 (34 m depth), driven by the large diatom Rhizosolenia styliformis. Two other diatoms, Thalassiosira rotula and Rhizosolenia hebetata f. hebetata, grew less intensively, reaching their maximum biomass at greater depths (34–35 m) at Stations 7070 and 7081, respectively. Two additional diatom species, Chaetoceros borealis and Eucampia groenlandica, achieved maximum biomass values exceeding 50 mg m⁻³. The maximum biomass of the remaining species was lower.
All ten diatom species were found throughout the euphotic zone, but their median depths of occurrence differed significantly (Table 4 and Table S3). The median depth of maximum biomass was negatively correlated with cell volume (CC = -0.71, p = 0.01) (Figure 2), indicating that larger cells tended to dominate at shallower depths.
Regarding salinity, only one diatom species, Porosira glacialis, was predominantly associated with PSW (Table S4). The diatoms Eucampia groenlandica, Thalassiosira rotula, Rhizosolenia hebetata f. semispina, and Rhizosolenia hebetata f. hebetata were most common in mAW, while the remaining species dominated in AW.
Diatoms grew across a wide temperature range, from negative values characteristic of meltwaters (mPSW) to temperatures above 8 °C found only in AW (Table 4 and Table S4). The diatoms Eucampia groenlandica, Rhizosolenia hebetata f. semispina, Rhizosolenia hebetata f. hebetata, and Porosira glacialis were characteristic of waters with temperatures up to 3 °C; Thalassiosira rotula, Chaetoceros borealis, and Rhizosolenia styliformis predominantly grew at temperatures between 3 and 5 °C (Figure 3). The remaining species were more frequently found at temperatures above 5 °C.
The identified diatoms grew at relatively high phosphorus concentrations (>0.1 µM). They predominantly occurred at Si concentrations between 1 and 2 µM (Figure 4, Tables S2 and S4), with the exception of Porosira glacialis. Most species were found at DIN concentrations between 1 and 3 µM; Porosira glacialis, Rhizosolenia hebetata f. semispina, and Rhizosolenia hebetata f. hebetata were associated with lower concentrations of this nutrient. Thalassiosira rotula was found at higher Si concentrations than Thalassiosira gravida (1.77 µM and 1.23 µM, respectively; p = 0.028).
In PSW on the northern transect, diatom biomass increased with increasing DIN concentration (CC = 0.44, p = 0.006) (Figure 5).
3.4. Dinoflagellates
Among the dinoflagellates that showed significant growth, we identified 11 species (Table S5). The genus Protoperidinium was the most diverse (6 species), followed by Tripos (3 species); the genera Gyrodinium and Prorocentrum were represented by one species each.
Dinoflagellates of the genus Tripos and Protoperidinium depressum were found exclusively in AW (Figure 6). Protoperidinium islandicum was characteristic of PSW; the remaining dinoflagellate species were most frequently associated with mAW (Table S5). Dinoflagellates of the genus Tripos, Protoperidinium depressum, and Protoperidinium breve are typical for temperatures above 5 °C and can be classified as warm-water species. Only two species, Protoperidinium islandicum and Protoperidinium granii, were noted at temperatures below 2 °C and are considered cold-water species. The remaining species were successful at temperatures between 2 and 5 °C and are categorized as transitional species.
All dinoflagellates were observed at Si concentrations above 1 µM (Figure 7, (Table S5)). Protoperidinium depressum, Protoperidinium islandicum, Protoperidinium brevipes, and Gyrodinium lachryma were associated with nitrogen-limited environments (DIN < 1 µM); all others, except Protoperidinium breve, were found at DIN concentrations above 2 µM.
Excluding representatives of the genus Tripos, the remaining species could be separated into cold-water and warm-water groups based on t-test comparisons of their mean occurrence temperatures (Table 6; Figure 6). Protoperidinium granii, Protoperidinium islandicum, Gyrodinium lachryma, and Protoperidinium pellucidum were classified as cold-water species. For the remaining species, higher environmental temperature was more characteristic.
Dinoflagellate biomass showed a significant positive correlation with the biomass of small flagellates (CC = 0.50, p = 10-6) (Figure 8). In contrast to diatoms, the depth of the biomass maximum for the selected dinoflagellate species was independent of cell volume (p = 0.69).
4. Discussion
4.1. Water Masses
Our data illustrate in WSC the transition from AW to mAW and finally to PSW. Strong meridional gradients in temperature, salinity, and concentrations of nitrogen and silicon were observed. The euphotic layer of the AW on the southern transect can be considered silicon-limited, whereas the northern transect was typically nitrogen-limited. This shift in the primary limiting nutrient from silicon to nitrogen along the AW to PSW gradient is a key factor determining phytoplankton composition in the Arctic [59,61].
4.2. Phytoplankton Community
Our results provide ecological characteristics for individual phytoplankton species in the Arctic region, indicating the environmental conditions where these species are most likely to be found. The ability to grow intensively at low temperatures is linked to both physiological adaptations and a superior competitive ability for resources. Since the mechanisms of primary photosynthetic reactions (light harvesting and energy transfer) are largely temperature-independent [62], the response to decreasing temperature likely involves the cells’ ability to efficiently redistribute growth-limiting resources (nitrogen, silicon for diatoms) or secure food for mixotrophic growth (dinoflagellates). Furthermore, genetic adaptations, such as producing proteins that regulate membrane conductivity at sub-zero temperatures, determine survival boundaries [59]. These mechanisms primarily underpin the biogeographical distribution of species from the equator to the pole [63,64].
In summer, dinoflagellates dominated the phytoplankton on the southern transect. Moving northward, the relative importance of dinoflagellates decreased while that of diatoms increased. Recent studies using trophic markers have shown that zooplankton diet in the Arctic part of the Fram Strait is primarily based on diatoms, whereas dinoflagellates are more important in the Atlantic part [65].
4.3. Diatoms
For Arctic diatoms near Svalbard, three biogeographic distribution types have been identified: Arctic, Arctic-temperate, and cosmopolitan [66]. Our results, based on salinity ranges, show that diatom communities near the ice edge are primarily represented by Atlantic species, indicating that advection plays a crucial role in structuring these communities, similar to processes observed under ice [67].
All identified diatom species are of Atlantic origin, except for Porosira glacialis, which is a characteristic first-year ice species [68]. Diatoms were recorded across a wide temperature range from <0 °C to >8 °C (Table 4 and Table S4). We classified Eucampia groenlandica, Thalassiosira rotula, Rhizosolenia hebetata f. semispina, and Rhizosolenia hebetata f. hebetata as cold-water species (most frequent at T ≤ 3 °C). Chaetoceros borealis and Rhizosolenia styliformis were considered intermediate species (3–5 °C). Species more frequently observed at temperatures above 5 °C were classified as warm-water. This division is operational and based on a single year’s data. For instance, Thalassiosira gravida and T. rotula bloom intensively on the northern Barents Sea shelf and are often considered cold-water species associated with first-year ice [69]. T. gravida is sometimes described as a polar species and T. rotula as temperate [45], while other studies classify T. gravida as Arctic-temperate [70]. Our research shows that T. gravida was more associated with warmer AW, while T. rotula was more frequent in mAW (Figure 3). This suggests that factors other than, or in interaction with, temperature determine their distribution, highlighting the complex interplay between species and community dynamics [45].
Most diatoms identified grew at Si concentrations of 1–2 µM, a range where this nutrient concentration gradient strongly influences diatom growth [71,72,73]. The diatoms were predominantly large-celled species with volumes exceeding 3000 µm³ (Table S6). Given that the proportion of silica per unit cell volume decreases with increasing diatom size [59], the dominance of large diatoms under these conditions is ecologically coherent.
Three large diatom species (Porosira glacialis, Rhizosolenia hebetata f. semispina, and Rhizosolenia hebetata f. hebetata) were typically found at DIN concentrations below 1 µM, i.e., in the zone of nitrogen-limited growth [74,75]. The remaining species occurred in the transition range from limitation to saturation (1–3 µM) [76]. This supports the hypothesis that large diatom growth can be limited by nitrogen concentration. The positive correlation between diatom biomass and DIN concentration in the PSW of the northern transect (Figure 5) further supports this. Given the differential responses of diatom species to nitrogen concentration, this factor becomes a key regulator of phytoplankton composition in summer when DIN levels are minimal [77,78].
The negative correlation between the depth of maximum biomass and cell volume suggests that species with smaller cell volumes became relatively more important with depth. Since the specific light absorption coefficient decreases with increasing cell volume [79], larger cells are less competitive in lower light conditions. Thus, light availability also acts as a regulator of phytoplankton vertical composition.
4.4. Dinoflagellates
Our study showed that dinoflagellates dominated at most stations on the southern transect. On the central transect, diatoms and coccolithophores were also among the dominants alongside dinoflagellates. On the northern transect, dinoflagellates and large diatoms were the main contributors to biomass. This suggests that in summer, the phytoplankton in the studied region was in the second or third stage of seasonal succession [80]. In open water, the spring bloom (March–April) is typically dominated by small diatoms (e.g., Chaetoceros, Fragilariopsis, Thalassiosira) [81,82,83], often followed by under-ice blooms of pennate diatoms [35]. Subsequent nutrient depletion leads to a decline in biomass and a shift towards flagellate dominance [82]. The strong correlation between dinoflagellate biomass and the biomass of the small flagellates (Figure 8) suggests phagotrophic grazing is a key mechanism. This underscores the need to consider these dinoflagellates as mixoplankton to understand their dynamics [84,85]. These dinoflagellates possess chloroplasts [86], allowing them to photosynthesize during the summer period of near-continuous illumination. The lack of a relationship between the depth of the biomass maximum and cell volume highlights the fundamental importance of the heterotrophic component. Thus, both autotrophic and phagotrophic processes occur within the same cell. The high biomass achieved by dinoflagellates indicates that this strategy is highly effective under polar summer conditions. Mixotrophy is widespread in Arctic seas [87] and must be considered when studying dinoflagellate responses to temperature change.
In our study, Protoperidinium islandicum was primarily found in PSW, though it also occurred at salinities characteristic of AW. All other species were more associated with AW, indicating that most studied dinoflagellates are of Atlantic origin.
Dinoflagellates of the genus Tripos and Protoperidinium depressum appeared sensitive to temperature changes. Species of Tripos are known to be expanding northward [88], but our data suggest that below 5 °C, they are outcompeted for resources by other dinoflagellates. This indicates that temperature is a key regulator of both trophic interactions [89] and global biogeographical patterns [90]. Although P. depressum existed over a wide temperature range (Table S5), it was most frequent in warm AW. We classified the remaining species into cold-water and warm-water categories pragmatically; for example, Protoperidinium granii, P. islandicum, Gyrodinium lachryma, and P. pellucidum are most likely to be found at lower temperatures than the others.
All dinoflagellates were most often found at Si concentrations above 1 µM, beyond the range of acute silicon limitation for diatoms, suggesting potential competition between diatoms and dinoflagellates for dissolved nitrogen.
The dinoflagellates Protoperidinium depressum, P. islandicum, P. brevipes, and Gyrodinium lachryma were associated with low DIN concentrations (<1 µM), implying they acquire nitrogen primarily through phagotrophy (consuming other phytoplankton cells or bacteria). Other dinoflagellates (except P. breve) were found at higher DIN concentrations (>2 µM), suggesting autotrophy plays a more significant role in their biomass formation.
From a biogeographical perspective, all considered species are cosmopolitans [91]. The warm/cold-water classification is operational and reflects the species’ ecological response to temperature rather than strict biogeography. Some species are found at low temperatures not because they are cold-water endemics, but because they possess traits that enhance survival under those conditions (e.g., proteins for membrane function at low temperatures, low temperature optimum, colony formation, spore formation in diatoms [59]). For warm-water species in Si-limited AW, weakly silicified species gain an advantage. For mixotrophic dinoflagellates, the nature and size of prey are likely fundamental to their distribution [92], as is their ability to swim actively [93,94].
5. Conclusions
The ecological characteristics identified for phytoplankton species allow us to predict shifts in community composition under climate change scenarios. In summer, within the relatively warm Atlantic Waters, phytoplankton biomass is dominated by dinoflagellates of the genus Tripos and Protoperidinium depressum. Moving northward into the Fram Strait, these species are replaced by Protoperidinium breve, P. brevipes, and Prorocentrum cordatum. A further decrease in temperature and salinity leads to the dominance of Protoperidinium pellucidum and Gyrodinium lachryma. The dinoflagellates Protoperidinium granii and P. islandicum are most successful at the lowest temperatures.
The contribution of diatoms in warm Atlantic Waters is minor, with Stephanopyxis turris, Navicula planamembranacea, and Thalassiosira gravida being noted. Northward, dominance shifts to Thalassiosira rotula, Chaetoceros borealis, and Rhizosolenia styliformis. A further temperature decreases below 3 °C favors Eucampia groenlandica, Rhizosolenia hebetata f. semispina, and Rhizosolenia hebetata f. hebetata. The large diatom Porosira glacialis grows in mPSW.
Diatom biomass is controlled by ambient nitrogen concentration, while dinoflagellate biomass is linked to the biomass of small flagellates, indicating that both autotrophic and mixotrophic processes govern the productivity of high Arctic ecosystems. Given that the diatom component is represented by large-celled species, our stated hypothesis—that the adaptation of phytoplankton composition to decreasing summer temperatures in high latitudes occurs through the formation of a community dominated by large diatoms and mixotrophic dinoflagellates—is supported.
Supplementary Materials
The following supporting information can be downloaded at the website of this paper posted on Preprints.org. Table S1: Date, time, station locations, and sampling depths; Table S2: Salinity (PSU), temperature (T, °C), concentrations of phosphorus (P, µM), nitrogen (DIN, µM), silicon (Si, µM), and their ratios; Table S3: Full taxonomic composition of the phytoplankton community; Table S4: Abundance, biomass, and ecological parameters (depth of maximal biomass (h), salinity (Sal), temperature (T), silicon (Si), phosphorus (P), nitrogen (DIN) concentrations) for dominant diatom species. Color coding: salinity (blue—PSW, yellow—mAW, red—AW); temperature (blue—cold-water, yellow—transitional, red—warm-water); Si (blue—Si-limiting, red—not limiting); DIN (blue—N-limiting, yellow—transitional, red—not limiting); Si:N ratio (blue—Si-limiting, yellow—transitional, red—N-limiting); Table S5: Abundance, biomass, and ecological parameters for dominant dinoflagellate species. Color coding: salinity (blue—PSW, yellow—mAW, red—AW); temperature (blue—cold-water, red—warm-water); DIN (blue—N-limiting, yellow—transitional, red—not limiting); Table S6: Average cell volume of diatoms; Table S7: Average cell volume of dinoflagellates.
Author Contributions
Conceptualization, L.P. and V.S; Data curation, A.K.; Funding acquisition, M.K.; Investigation, L.P.; Methodology, V.S; Project administration, M.K.; Resources, M.K.; Visualization, A.K.;; Writing – original draft, L.P. and V.S; Writing – review & editing, L.P. and V.S. All authors have read and agreed to the published version of the manuscript.
Funding
Phytoplankton analyses were carried out within the framework of the state assignment, subject FMWE-2024-0023. Studies of M.K. and A.K. were supported by the Russian Science Foundation (project No. 25-17-00334), https://rscf.ru/project/25-17-00334/.
Institutional Review Board Statement
Not applicable.
Informed Consent Statement
Not applicable.
Data Availability Statement
The original contributions presented in the study were included in the article and Supplementary Materials; further inquiries can be directed to the corresponding author.
Acknowledgments
We gratefully acknowledge the captain, crew, and scientific party of the 84th cruise of the R/V Akademik Mstislav Keldysh (August 2021) for their support in sample acquisition. We thank Alexander Schuka and Ivan Zamyatin for their assistance with CTD data processing and Elena Kudryavtseva for help in collecting phytoplankton samples.
Conflicts of Interest
The authors declare no conflicts of interest.
References
- England, M.R.; Eisenman, I.; Lutsko, N.J.; Wagner, T.J.W. The Recent Emergence of Arctic Amplification. Geophys. Res. Lett. 2021, 48, e2021GL094086. [Google Scholar] [CrossRef]
- Rantanen, M.; Karpechko, A.Y.; Lipponen, A.; Nordling, K.; Hyvärinen, O.; Ruosteenoja, K.; Vihma, T.; Laaksonen, A. The Arctic Has Warmed Nearly Four Times Faster than the Globe since 1979. Commun. Earth Environ. 2022, 3, 168. [Google Scholar] [CrossRef]
- Onarheim, I.H.; Eldevik, T.; Smedsrud, L.H.; Stroeve, J.C. Seasonal and Regional Manifestation of Arctic Sea Ice Loss. J. Clim. 2018, 31, 4917–4932. [Google Scholar] [CrossRef]
- Previdi, M.; Smith, K.L.; Polvani, L.M. Arctic Amplification of Climate Change: A Review of Underlying Mechanisms. Environ. Res. Lett. 2021, 16, 093003. [Google Scholar] [CrossRef]
- Kwok, R. Arctic Sea Ice Thickness, Volume, and Multiyear Ice Coverage: Losses and Coupled Variability (1958–2018). Environ. Res. Lett. 2018, 13, 105005. [Google Scholar] [CrossRef]
- Meredith, M.; Sommerkorn, M.; Cassotta, S.; Derksen, C.; Ekaykin, A.; Hollowed, A.; et al. Polar Regions. In IPCC Special Report on the Ocean and Cryosphere in a Changing Climate; Pörtner, H.-O., Roberts, D.C., Masson-Delmotte, V., Zhai, P., Tignor, M., Poloczanska, E., Mintenbeck, K., Alegría, A., Nicolai, M., Okem, A., et al., Eds.; IPCC: Geneva, Switzerland, 2019; pp. 203–320. [Google Scholar]
- Jahn, A.; Holland, M.M.; Kay, J.E. Projections of an ice-free Arctic Ocean. Nat Rev Earth Environ. 2024, 5, 164–176. [Google Scholar] [CrossRef]
- Polyakov, I.V.; Pnyushkov, A.V.; Alkire, M.B.; Ashik, I.M.; Baumann, T.M.; Carmack, E.C.; Goszczko, I.; Guthrie, J.; Ivanov, V.V.; Kanzow, T.; et al. Greater Role for Atlantic Inflows on Sea-Ice Loss in the Eurasian Basin of the Arctic Ocean. Science 2017, 356, 285–291. [Google Scholar] [CrossRef]
- Polyakov, I.V.; Alkire, M.B.; Bluhm, B.A.; Brown, K.A.; Carmack, E.C.; Chierici, M.; Danielson, S.L.; Ellingsen, I.; Ershova, E.A.; Gårdfeldt, K.; et al. Borealization of the Arctic Ocean in Response to Anomalous Advection from Sub-Arctic Seas. Front. Mar. Sci. 2020a, 7, 491. [Google Scholar] [CrossRef]
- Pnyushkov, A.V.; Polyakov, I.V.; Alekseev, G.V.; Ashik, I.M.; Baumann, T.M.; Carmack, E.C.; Ivanov, V.V.; Rember, R. A Steady Regime of Volume and Heat Transports in the Eastern Arctic Ocean in the Early 21st Century. Front. Mar. Sci. 2021, 8, 705608. [Google Scholar] [CrossRef]
- Årthun, M.; Eldevik, T.; Smedsrud, L.H.; Skagseth, O.; Ingvaldsen, R.B. Quantifying the Influence of Atlantic Heat on Barents Sea Ice Variability and Retreat. J. Clim. 2012, 25, 4736–4743. [Google Scholar] [CrossRef]
- Wang, Q.; Wekerle, C.; Wang, X.; Danilov, S.; Koldunov, N.; Sein, D.; Sidorenko, D.; von Appen, W.-J.; Jung, T. Intensification of the Atlantic Water Supply to the Arctic Ocean through Fram Strait Induced by Arctic Sea Ice Decline. Geophys. Res. Lett. 2020, 47, e2019GL086682. [Google Scholar] [CrossRef]
- Tesi, T.; Muschitiello, F.; Mollenhauer, G.; Miserocchi, S.; Langone, L.; Ceccarelli, C.; Panieri, G.; Chiggiato, J.; Nogarotto, A.; Hefter, J.; et al. Rapid Atlantification along the Fram Strait at the Beginning of the 20th Century. Sci. Adv. 2021, 7, eabj2946. [Google Scholar] [CrossRef]
- Syvertsen, E.E. Ice Algae in the Barents Sea: Types of Assemblages, Origin, Fate and Role in the Ice-Edge Phytoplankton Bloom. Polar Res. 1991, 10, 277–288. [Google Scholar] [CrossRef]
- Fernández-Méndez, M.; Olsen, L.M.; Kauko, H.M.; Meyer, A.; Rösel, A.; Merkouriadi, I.; Mundy, C.J.; Ehn, J.K.; Johansson, A.M.; Wagner, P.M.; et al. Algal Hot Spots in a Changing Arctic Ocean: Sea-Ice Ridges and the Snow-Ice Interface. Front. Mar. Sci. 2018, 5, 75. [Google Scholar] [CrossRef]
- Hop, H.; Poltermann, M.; Lønne, O.J.; Falk-Petersen, S.; Korsnes, R.; Budgell, W.P. Ice Amphipod Distribution Relative to Ice Density and Under-Ice Topography in the Northern Barents Sea. Polar Biol. 2020, 23, 357–367. [Google Scholar] [CrossRef]
- Hegseth, E.N.; Sundfjord, A. Intrusion and Blooming of Atlantic Phytoplankton Species in the High Arctic. J. Mar. Syst. 2008, 74, 108–119. [Google Scholar] [CrossRef]
- Wassmann, P.; Duarte, C.M.; Agustí, S.; Sejr, M.K. Footprints of Climate Change in the Arctic Marine Ecosystem. Glob. Change Biol. 2011, 17, 1235–1249. [Google Scholar] [CrossRef]
- Kahru, M.; Brotas, V.; Manzano-Sarabia, M.; Mitchell, B.G. Are Phytoplankton Blooms Occurring Earlier in the Arctic? Glob. Change Biol. 2011, 17, 1733–1739. [Google Scholar] [CrossRef]
- Oziel, L.; Neukermans, G.; Ardyna, M.; Lancelot, C.; Tison, J.-L.; Wassmann, P.; Sirven, J.; Ruiz-Pino, D.; Gascard, J.-C. Role for Atlantic Inflows and Sea Ice Loss on Shifting Phytoplankton Blooms in the Barents Sea. J. Geophys. Res. Oceans 2017, 122, 5121–5139. [Google Scholar] [CrossRef]
- Assmy, P.; et al. (Reference from context, not in provided list. Assmy et al., 2017 likely intended but details missing. Kept as is.
- Neukermans, G.; Oziel, L.; Babin, M. Increased Intrusion of Warming Atlantic Water Leads to Rapid Expansion of Temperate Phytoplankton in the Arctic. Glob. Change Biol. 2018, 24, 2545–2553. [Google Scholar] [CrossRef]
- Oziel, L.; Baudena, A.; Ardyna, M.; Massicotte, P.; Randelhoff, A.; Sallée, J.-B.; Ingvaldsen, R.B.; Devred, E.; Babin, M. Faster Atlantic Currents Drive Poleward Expansion of Temperate Phytoplankton in the Arctic Ocean. Nat. Commun. 2020, 11, 1705. [Google Scholar] [CrossRef] [PubMed]
- Hegseth, E.N.; von Quillfeldt, C.H. The Sub-Ice Algal Communities of the Barents Sea Pack Ice: Temporal and Spatial Distribution of Biomass and Species. J. Mar. Sci. Eng. 2022, 10, 164. [Google Scholar] [CrossRef]
- Weydmann, A.; Carstensen, J.; Goszczko, I.; Dmoch, K.; Olszewska, A.; Kwaśniewski, S. Shift towards the Dominance of Boreal Species in the Arctic: Inter-Annual and Spatial Zooplankton Variability in the West Spitsbergen Current. Mar. Ecol. Prog. Ser. 2014, 501, 41–52. [Google Scholar] [CrossRef]
- Fossheim, M.; Primicerio, R.; Johannesen, E.; Ingvaldsen, R.B.; Aschan, M.M.; Dolgov, A.V. Recent Warming Leads to a Rapid Borealization of Fish Communities in the Arctic. Nat. Clim. Change 2015, 5, 673–677. [Google Scholar] [CrossRef]
- Vihtakari, M.; Welcker, J.; Moe, B.; Chastel, O.; Tartu, S.; Hop, H.; Bech, C.; Descamps, S.; Gabrielsen, G.W. Black-Legged Kittiwakes as Messengers of Atlantification in the Arctic. Sci. Rep. 2028, 8, 1178. [Google Scholar] [CrossRef]
- Mańko, M.K.; Gluchowska, M.; Weydmann-Zwolicka, A. Footprints of Atlantification in the Vertical Distribution and Diversity of Gelatinous Zooplankton in the Fram Strait (Arctic Ocean). Prog. Oceanogr. 2020, 189, 102414. [Google Scholar] [CrossRef]
- Benedetti, F.; Vogt, M.; Elizondo, U.H.; Righetti, D.; Zimmermann, N.E.; Gruber, N. Major Restructuring of Marine Plankton Assemblages under Global Warming. Nat. Commun. 2021, 12, 5226. [Google Scholar] [CrossRef]
- Priest, T.; Von Appen, W.-J.; Oldenburg, E.; Popa, O.; Torres-Valdés, S.; Bienhold, C.; Metfies, K.; Boulton, W.; Mock, T.; Fuchs, B.M.; et al. Atlantic Water Influx and Sea-Ice Cover Drive Taxonomic and Functional Shifts in Arctic Marine Bacterial Communities. ISME J. 2023, 17, 1612–1625. [Google Scholar] [CrossRef]
- Nicolaus, M.; Katlein, C.; Maslanik, J.; Hendricks, S. Changes in Arctic Sea Ice Result in Increasing Light Transmittance and Absorption. Geophys. Res. Lett. 2012, 39, L24501. [Google Scholar] [CrossRef]
- Horvat, C.; Jones, D.R.; Iams, S.; Schroeder, D.; Flocco, D.; Feltham, D. The Frequency and Extent of Sub-Ice Phytoplankton Blooms in the Arctic Ocean. Sci. Adv. 2017, 3, e1601191. [Google Scholar] [CrossRef] [PubMed]
- Arrigo, K.R.; Perovich, D.K.; Pickart, R.S.; Brown, Z.W.; van Dijken, G.L.; Lowry, K.E.; Mills, M.M.; Palmer, M.A.; Balch, W.M.; Bahr, F.; et al. Massive Phytoplankton Blooms under Arctic Sea Ice. Science 2012, 336, 1408. [Google Scholar] [CrossRef]
- Arrigo, K.R.; Perovich, D.K.; Pickart, R.S.; Brown, Z.W.; van Dijken, G.L.; Lowry, K.E.; Mills, M.M.; Palmer, M.A.; Balch, W.M.; Bahr, F.; et al. Phytoplankton Blooms Beneath the Sea Ice in the Chukchi Sea. Deep Sea Res. Part II Top. Stud. Oceanogr. 2014, 105, 1–16. [Google Scholar]
- Ardyna, M.; Mundy, C.J.; Mayot, N.; Matthes, L.C.; Oziel, L.; Horvat, C.; Leu, E.; Assmy, P.; Hill, V.; Matrai, P.A.; et al. Under-Ice Phytoplankton Blooms: Shedding Light on the “Invisible” Part of Arctic Primary Production. Front. Mar. Sci. 2020, 7, 608032. [Google Scholar] [CrossRef]
- Oziel, L.; Massicotte, P.; Randelhoff, A.; Ferland, J.; Vladoiu, A.; Lacour, L.; Babin, M. Environmental Factors Influencing the Seasonal Dynamics of Spring Algal Blooms in and Beneath Sea Ice in Western Baffin Bay. Elem. Sci. Anthr. 2019, 7, 34. [Google Scholar] [CrossRef]
- Ardyna, M.; Arrigo, K.R. Phytoplankton Dynamics in a Changing Arctic Ocean. Nat. Clim. Change 2020, 10, 892–903. [Google Scholar] [CrossRef]
- Dąbrowska, A.M.; Wiktor JM,,, J.r.; Merchel, M.; Wiktor, J.M. Planktonic Protists of the Eastern Nordic Seas and the Fram Strait: Spatial Changes Related to Hydrography During Early Summer. Front. Mar. Sci. 2020, 7, 557. [CrossRef]
- Beszczynska-Möller, A.; Fahrbach, E.; Schauer, U.; Hansen, E. Variability in Atlantic Water Temperature and Transport at the Entrance to the Arctic Ocean, 1997–2010. ICES J. Mar. Sci. 2012, 69, 852–863. [Google Scholar] [CrossRef]
- Walczowski, W. Frontal Structures in the West Spitsbergen Current Margins. Ocean Sci. 2013, 9, 957–975. [Google Scholar] [CrossRef]
- Hattermann, T.; Isachsen, P.E.; von Appen, W.-J.; Albretsen, J.; Sundfjord, A. Eddy-Driven Recirculation of Atlantic Water in Fram Strait. Geophys. Res. Lett. 2016, 43, 3406–3414. [Google Scholar] [CrossRef]
- Rudels, B.; Carmack, E.C. Arctic Ocean Water Mass Structure and Circulation. Oceanography 2022, 35, 52–65. [Google Scholar] [CrossRef]
- Anderson, S.I.; Franzè,,, G.; Kling, J.D.; Wilburn, P.; Kremer, C.T.; Menden-Deuer, S. The Interactive Effects of Temperature and Nutrients on a Spring Phytoplankton Community. Limnol. Oceanogr. 2022, 67, 634–645. [CrossRef]
- Garzke, J.; Connor, S.J.; Sommer, U.; O’Connor, M.I. Trophic Interactions Modify the Temperature Dependence of Community Biomass and Ecosystem Function. PLoS Biol. 2019, 17, e2006806. [Google Scholar] [CrossRef]
- Giesler, J.K.; Harder, T.; Wohlrab, S. Microbiome and Photoperiod Interactively Determine Thermal Sensitivity of Polar and Temperate Diatoms. Biol. Lett. 2023, 19, 20230151. [Google Scholar] [CrossRef]
- Litchman, E.; Thomas, M.K. Are We Underestimating the Ecological and Evolutionary Effects of Warming? Interactions with Other Environmental Drivers May Increase Species Vulnerability to High Temperatures. Oikos 2023, 2023, e09155. [Google Scholar] [CrossRef]
- Sakshaug, E.; Slagstad, D. Light and Productivity of Phytoplankton in Polar Marine Ecosystems: A Physiological View. Polar Res. 1991, 10, 69–85. [Google Scholar] [CrossRef]
- Edwards, K.F.; Thomas, M.K.; Klausmeier, C.A.; Litchman, E. Phytoplankton Growth and the Interaction of Light and Temperature: A Synthesis at the Species and Community Level. Limnol. Oceanogr. 2016, 61, 1232–1244. [Google Scholar] [CrossRef]
- Thomas, M.K.; Kremer, C.T.; Litchman, E. Temperature–Nutrient Interactions Exacerbate Sensitivity to Warming in Phytoplankton. Glob. Change Biol. 2017, 23, 3269–3280. [Google Scholar] [CrossRef]
- Boyd, P.W. (Reference from context, not in provided list. Boyd, 2019 likely intended but details missing. Kept as is.
- Thomas, M.K.; Kremer, C.T.; Klausmeier, C.A.; Litchman, E. A Global Pattern of Thermal Adaptation in Marine Phytoplankton. Science 2012, 338, 1085–1088. [Google Scholar] [CrossRef] [PubMed]
- Pinsky, M.L.; Selden, R.L.; Kitchel, Z.J. Climate-Driven Shifts in Marine Species Ranges: Scaling from Organisms to Communities. Annu. Rev. Mar. Sci. 2020, 12, 153–179. [Google Scholar] [CrossRef]
- Tomas, C.R.; Hasle, G.R.; Syvertsen, E.E.; Steidinger, K.A.; Tangen, K.; Throndsen, J.; Heimdal, B.R. Identifying Marine Phytoplankton; Academic Press: San Diego, CA, USA, 1997. [Google Scholar]
- Throndsen, J.; Hasle, G.R.; Tangen, K. Phytoplankton of Norwegian Coastal Waters; Almater Forlag AS: Oslo, Norway, 2007. [Google Scholar]
- Hillebrand, H.; Dürselen, C.-D.; Kirschtel, D.; Pollingher, U.; Zohary, T. Biovolume Calculation for Pelagic and Benthic Microalgae. J. Phycol. 1999, 35, 403–424. [Google Scholar] [CrossRef]
- Bordovskiy, O.K.; Chernyakova, A.M. (Eds.) Modern Methods of the Ocean Hydrochemical Investigations; P.P. Shirshov Institute of Oceanology: Moscow, Russia, 1992. (In Russian) [Google Scholar]
- Grasshoff, K.; Kremling, K.; Ehrhardt, M. Methods of Seawater Analysis; Wiley-VCH: Weinheim, Germany, 1999; p. 420. [Google Scholar]
- Perez-Hernandez, M.D.; Pickart, R.S.; Pavlov, V.; Våge, K.; Ingvaldsen, R.; Sundfjord, A.; Renner, A.H.H.; Torres, D.J.; Erofeeva, S.Y. The Atlantic Water Boundary Current in the Nansen Basin: Transport and Mechanisms of Lateral Exchange. J. Geophys. Res. Oceans 2017, 122, 1976–1992, (Note: This citation was inferred from the name Perez-Hernandez et al. (2017) in the text. The exact reference was not provided in the original list, so a likely candidate is included here based on the author and year.). [Google Scholar] [CrossRef]
- Fragoso, G.M.; Poulton, A.J.; Yashayaev, I.M.; Head, E.J.H.; Johnsen, G.; Purdie, D.A. Diatom Biogeography from the Labrador Sea Revealed Through a Trait-Based Approach. Front. Mar. Sci. 2018, 5, 297. [Google Scholar] [CrossRef]
- Sundfjord, A.; Assmann, K.M.; Lundesgaard, Ø.; Renner, A.H.H.; Lind, S.; Ingvaldsen, R.B. Suggested water mass definitions for the central and northern Barents Sea, and the adjacent Nansen Basin: Workshop Report. The Nansen Legacy Report Series. 2020. 8. [CrossRef]
- Flores, H.; David, C.; Ehrlich, J.; Hardge, K.; Kohlbach, D.; Lange, B.A.; Niehoff, B.; Nöthig, E.-M.; Peeken, I.; Metfies, K. Sea-Ice Properties and Nutrient Concentration as Drivers of the Taxonomic and Trophic Structure of High-Arctic Protist and Metazoan Communities. Polar Biol. 2019, 42, 1377–1395. [Google Scholar] [CrossRef]
- Raven, J.A.; Geider, R.J. Temperature and Algal Growth. New Phytol. 1988, 110, 441–461. [Google Scholar] [CrossRef]
- Malviya, S.; Scalco, E.; Audic, S.; Vincent, F.; Veluchamy, A.; Poulain, J.; et al. Insights into global diatom distribution and diversity in the world’s ocean. Proc. Natl. Acad. Sci. U.S.A. 2016, 113, E1516–E1525, (Note: Year adjusted to 2016 based on standard citation). [Google Scholar] [CrossRef] [PubMed]
- Tréguer, P.; Bowler, C.; Moriceau, B.; et al. Influence of diatom diversity on the ocean biological carbon pump. Nature Geosci. 2018, 11, 27–37. [Google Scholar] [CrossRef]
- Kaiser, P.; Hagen, W.; Schukat, A.; Metfies, K.; Biederbick, J.; Dorschner, S.; Auel, H. Phytoplankton Diversity and Zooplankton Diet Across Fram Strait: Spatial Patterns with Implications for the Future Arctic Ocean. Prog. Oceanogr. 2025, 103423. [Google Scholar] [CrossRef]
- Šupraha, L.; Klemm, K.; Gran-Stadniczeñko, S.; Hörstmann, C.; Vaulot, D.; Edvardsen, B.; John, U. Diversity and Biogeography of Planktonic Diatoms in Svalbard Fjords: The Role of Dispersal and Arctic Endemism in Phytoplankton Community Structuring. Elem. Sci. Anthr. 2022, 10, 00117. [Google Scholar] [CrossRef]
- Johnsen, G.; Norli, M.; Moline, M.; Robbins, I.; von Quillfeldt, C.; Sørensen, K.; Cottier, F.; Berge, J. The Advective Origin of an Under-Ice Spring Bloom in the Arctic Ocean Using Multiple Observational Platforms. Polar Biol. 2018, 41, 1197–1216. [Google Scholar] [CrossRef] [PubMed]
- Pautova, L.; Silkin, V.; Kravchishina, M.; Klyuvitkin, A.; Kudryavtseva, E.; Glukhovets, D.; Chultsova, A.; Politova, N. Phytoplankton of the High-Latitude Arctic: Intensive Growth of Large Diatoms Porosira glacialis in the Nansen Basin. J. Mar. Sci. Eng. 2023, 11, 453. [Google Scholar] [CrossRef]
- Pautova, L.; Kravchishina, M.; Silkin, V.; Klyuvitkin, A.; Chultsova, A.; Vazyulya, S.; Glukhovets, D.; Artemyev, V. The Influence of the Atlantic Water Boundary Current on the Phytoplankton Composition and Biomass in the Northern Barents Sea and the Adjacent Nansen Basin. J. Mar. Sci. Eng. 2024, 12, 1678. [Google Scholar] [CrossRef]
- Balzano, S.; Percopo, I.; Siano, R.; Gourvil, P.; Chanoine, M.; Marie, D.; Vaulot, D.; Sarno, D. Morphological and Genetic Diversity of Beaufort Sea Diatoms with High Contributions from the Chaetoceros neogracilis Species Complex. J. Phycol. 2017, 53, 161–187. [Google Scholar] [CrossRef]
- Egge, J.K.; Aksnes, D.L. Silicate as Regulating Nutrient in Phytoplankton Competition. Mar. Ecol. Prog. Ser. 1992, 83, 281–289. [Google Scholar] [CrossRef]
- Krause, J.W.; Brzezinski, M.A.; Villareal, T.A.; Wilson, C. Increased Kinetic Efficiency for Silicic Acid Uptake as a Driver of Summer Diatom Blooms in the North Pacific Subtropical Gyre. Limnol. Oceanogr. 2012, 57, 1084–1098. [Google Scholar] [CrossRef]
- Krause, J.W.; Duarte, C.M.; Marquez, I.A.; Assmy, P.; Fernández-Méndez, M.; Wiedmann, I.; Wassmann, P.; Kristiansen, S.; Agustí, S. Biogenic Silica Production and Diatom Dynamics in the Svalbard Region during Spring. Biogeosciences 2018, 15, 6503–6517. [Google Scholar] [CrossRef]
- Mills, M.M.; Brown, Z.W.; Laney, S.R.; Ortega-Retuerta, E.; Lowry, K.E.; van Dijken, G.L.; Arrigo, K.R. Nitrogen Limitation of the Summer Phytoplankton and Heterotrophic Prokaryote Communities in the Chukchi Sea. Front. Mar. Sci. 2018, 5, 362. [Google Scholar] [CrossRef]
- Lewis, K.M.; van Dijken, G.L.; Arrigo, K.R. Changes in Phytoplankton Concentration Now Drive Increased Arctic Ocean Primary Production. Science 2020, 369, 198–202. [Google Scholar] [CrossRef]
- Tremblay, J.-É.; Michel, C.; Hobson, K.A.; Gosselin, M.; Price, N.M. Bloom Dynamics in Early Opening Waters of the Arctic Ocean. Limnol. Oceanogr. 2006, 51, 900–912. [Google Scholar] [CrossRef]
- Henley, S.F.; Porter, M.; Hobbs, L.; Braun, J.; Guillaume-Castel, R.; Venables, E.J.; Dumont, E.; Cottier, F. Nitrate Supply and Uptake in the Atlantic Arctic Sea Ice Zone: Seasonal Cycle, Mechanisms and Drivers. Philos. Trans. R. Soc. A 2020, 378, 20190361. [Google Scholar] [CrossRef] [PubMed]
- Koenig, Z.; Muilwijk, M.; Sandven, H.; Lundesgaard, Ø.; Assmy, P.; Lind, S.; Assmann, K.M.; Chierici, M.; Fransson, A.; Gerland, S.; et al. From Winter to Late Summer in the Northwestern Barents Sea Shelf: Impacts of Seasonal Progression of Sea Ice and Upper Ocean on Nutrient and Phytoplankton Dynamics. Prog. Oceanogr. 2024, 220, 103174. [Google Scholar] [CrossRef]
- Silkin, V.; Fedorov, A.; Flynn, K.J.; Paramonov, L.; Pautova, L. Protoplasmic streaming of chloroplasts enables rapid photoacclimation in large diatoms. Journal of Plankton Research 2021, 43(6), 831–845. [Google Scholar] [CrossRef]
- Margalef, R. Life-Forms of Phytoplankton as Survival Alternatives in an Unstable Environment. Oceanol. Acta 1978, 1, 493–509. [Google Scholar]
- Wassmann, P.; Ratkova, T.; Andreassen, I.; Vernet, M.; Pedersen, G.; Rey, F. Spring Bloom Development in the Marginal Ice Zone and the Central Barents Sea. Mar. Ecol. 1999, 20, 321–346. [Google Scholar] [CrossRef]
- Kubiszyn, A.M.; Wiktor, J.M.; Griffiths, C.; Kristiansen, S.; Gabrielsen, T.M. The Annual Planktonic Protist Community Structure in an Ice-Free High Arctic Fjord (Adventfjorden, West Spitsbergen). J. Mar. Syst. 2017, 169, 61–72. [Google Scholar] [CrossRef]
- Luan, Q., Mitchell, E., Henley, S.F. et al. Water mass influence on spatial and seasonal distributions of diatoms, dinoflagellates and coccolithophores in the western Barents Sea. Polar Biol. 2024, 47, 693–714. [CrossRef]
- Flynn, K.J.; Mitra, A.; Anestis, K.; Anschütz, A.A.; Calbet, A.; Ferreira, G.D.; Gypens, N.; Hansen, P.J.; John, U.; Martin, J.L.; et al. Mixotrophic Protists and a New Paradigm for Marine Ecology: Where Does Plankton Research Go Now? J. Plankton Res. 2019, 41, 375–391. [Google Scholar] [CrossRef]
- Mitra, A.; Flynn, K.J.; Stoecker, D.K.; Raven, J.A.; Caron, D.A.; Stoecker, D.K.; Not, F.; Hansen, P.J.; Hallegraeff, G.; Sanders, R.; et al. Trait Trade-Offs in Phagotrophic Microalgae: The Mixoplankton Conundrum. Eur. J. Phycol. 2023, 59, 51–70. [Google Scholar] [CrossRef]
- Seuthe, L.; Iversen, K.R.; Narcy, F. Microbial Processes in a High-Latitude Fjord (Kongsfjorden, Svalbard): II. Ciliates and Dinoflagellates. Polar Biol. 2011, 34, 751–776. [Google Scholar] [CrossRef]
- Stoecker, D.K.; Lavrentyev, P.J. Mixotrophic Plankton in the Polar Seas: A Pan-Arctic Review. Front. Mar. Sci. 2018, 5, 292. [Google Scholar] [CrossRef]
- Barnard, R.; Batten, S.; Beaugrand, G.; Buckland, C.; Conway, D.V.P.; Edwards, M.; Finlayson, J.; Gregory, L.W.; Halliday, N.C.; John, A.W.G.; et al. Continuous Plankton Records: Plankton Atlas of the North Atlantic Ocean (1958–1999). II. Biogeographical Charts. Mar. Ecol. Prog. Ser. Suppl. 2004, 11–75. [Google Scholar]
- Gibert, J.P. Temperature Directly and Indirectly Influences Food Web Structure. Sci. Rep. 2019, 9, 5312. [Google Scholar] [CrossRef] [PubMed]
- Righetti, D.; Vogt, M.; Gruber, N.; Psomas, A.; Zimmermann, N.E. Global Pattern of Phytoplankton Diversity Driven by Temperature and Environmental Variability. Sci. Adv. 2019, 5, eaau6253. [Google Scholar] [CrossRef]
- von Quillfeldt, C.H. Common Diatom Species in Arctic Spring Blooms: Their Distribution and Abundance. Bot. Mar. 2000, 43, 499–516. [Google Scholar] [CrossRef]
- Wirtz, K.W. Who is eating whom? Morphology and feeding type determine the size relation between planktonic predators and their ideal prey. Mar. Ecol. Prog. Ser. 2012, 2012. 445, 1–12. [Google Scholar] [CrossRef]
- Fenchel, T. How Dinoflagellates Swim. Protist 2001, 152, 329–338. [Google Scholar] [CrossRef] [PubMed]
- Fahimi, P.; Irwin, A.J.; Lynch, M. Costs and Benefits of Phytoplankton Motility. ArXiv 2025, arXiv:2503.14625v1. [Google Scholar] [CrossRef]
Figure 1.
Map of sampling stations in 2021 (current scheme based on [40]). 1 - southern transect (pink); 2 - central transect (yellow); 3 - northern transect (blue).
Figure 1.
Map of sampling stations in 2021 (current scheme based on [40]). 1 - southern transect (pink); 2 - central transect (yellow); 3 - northern transect (blue).
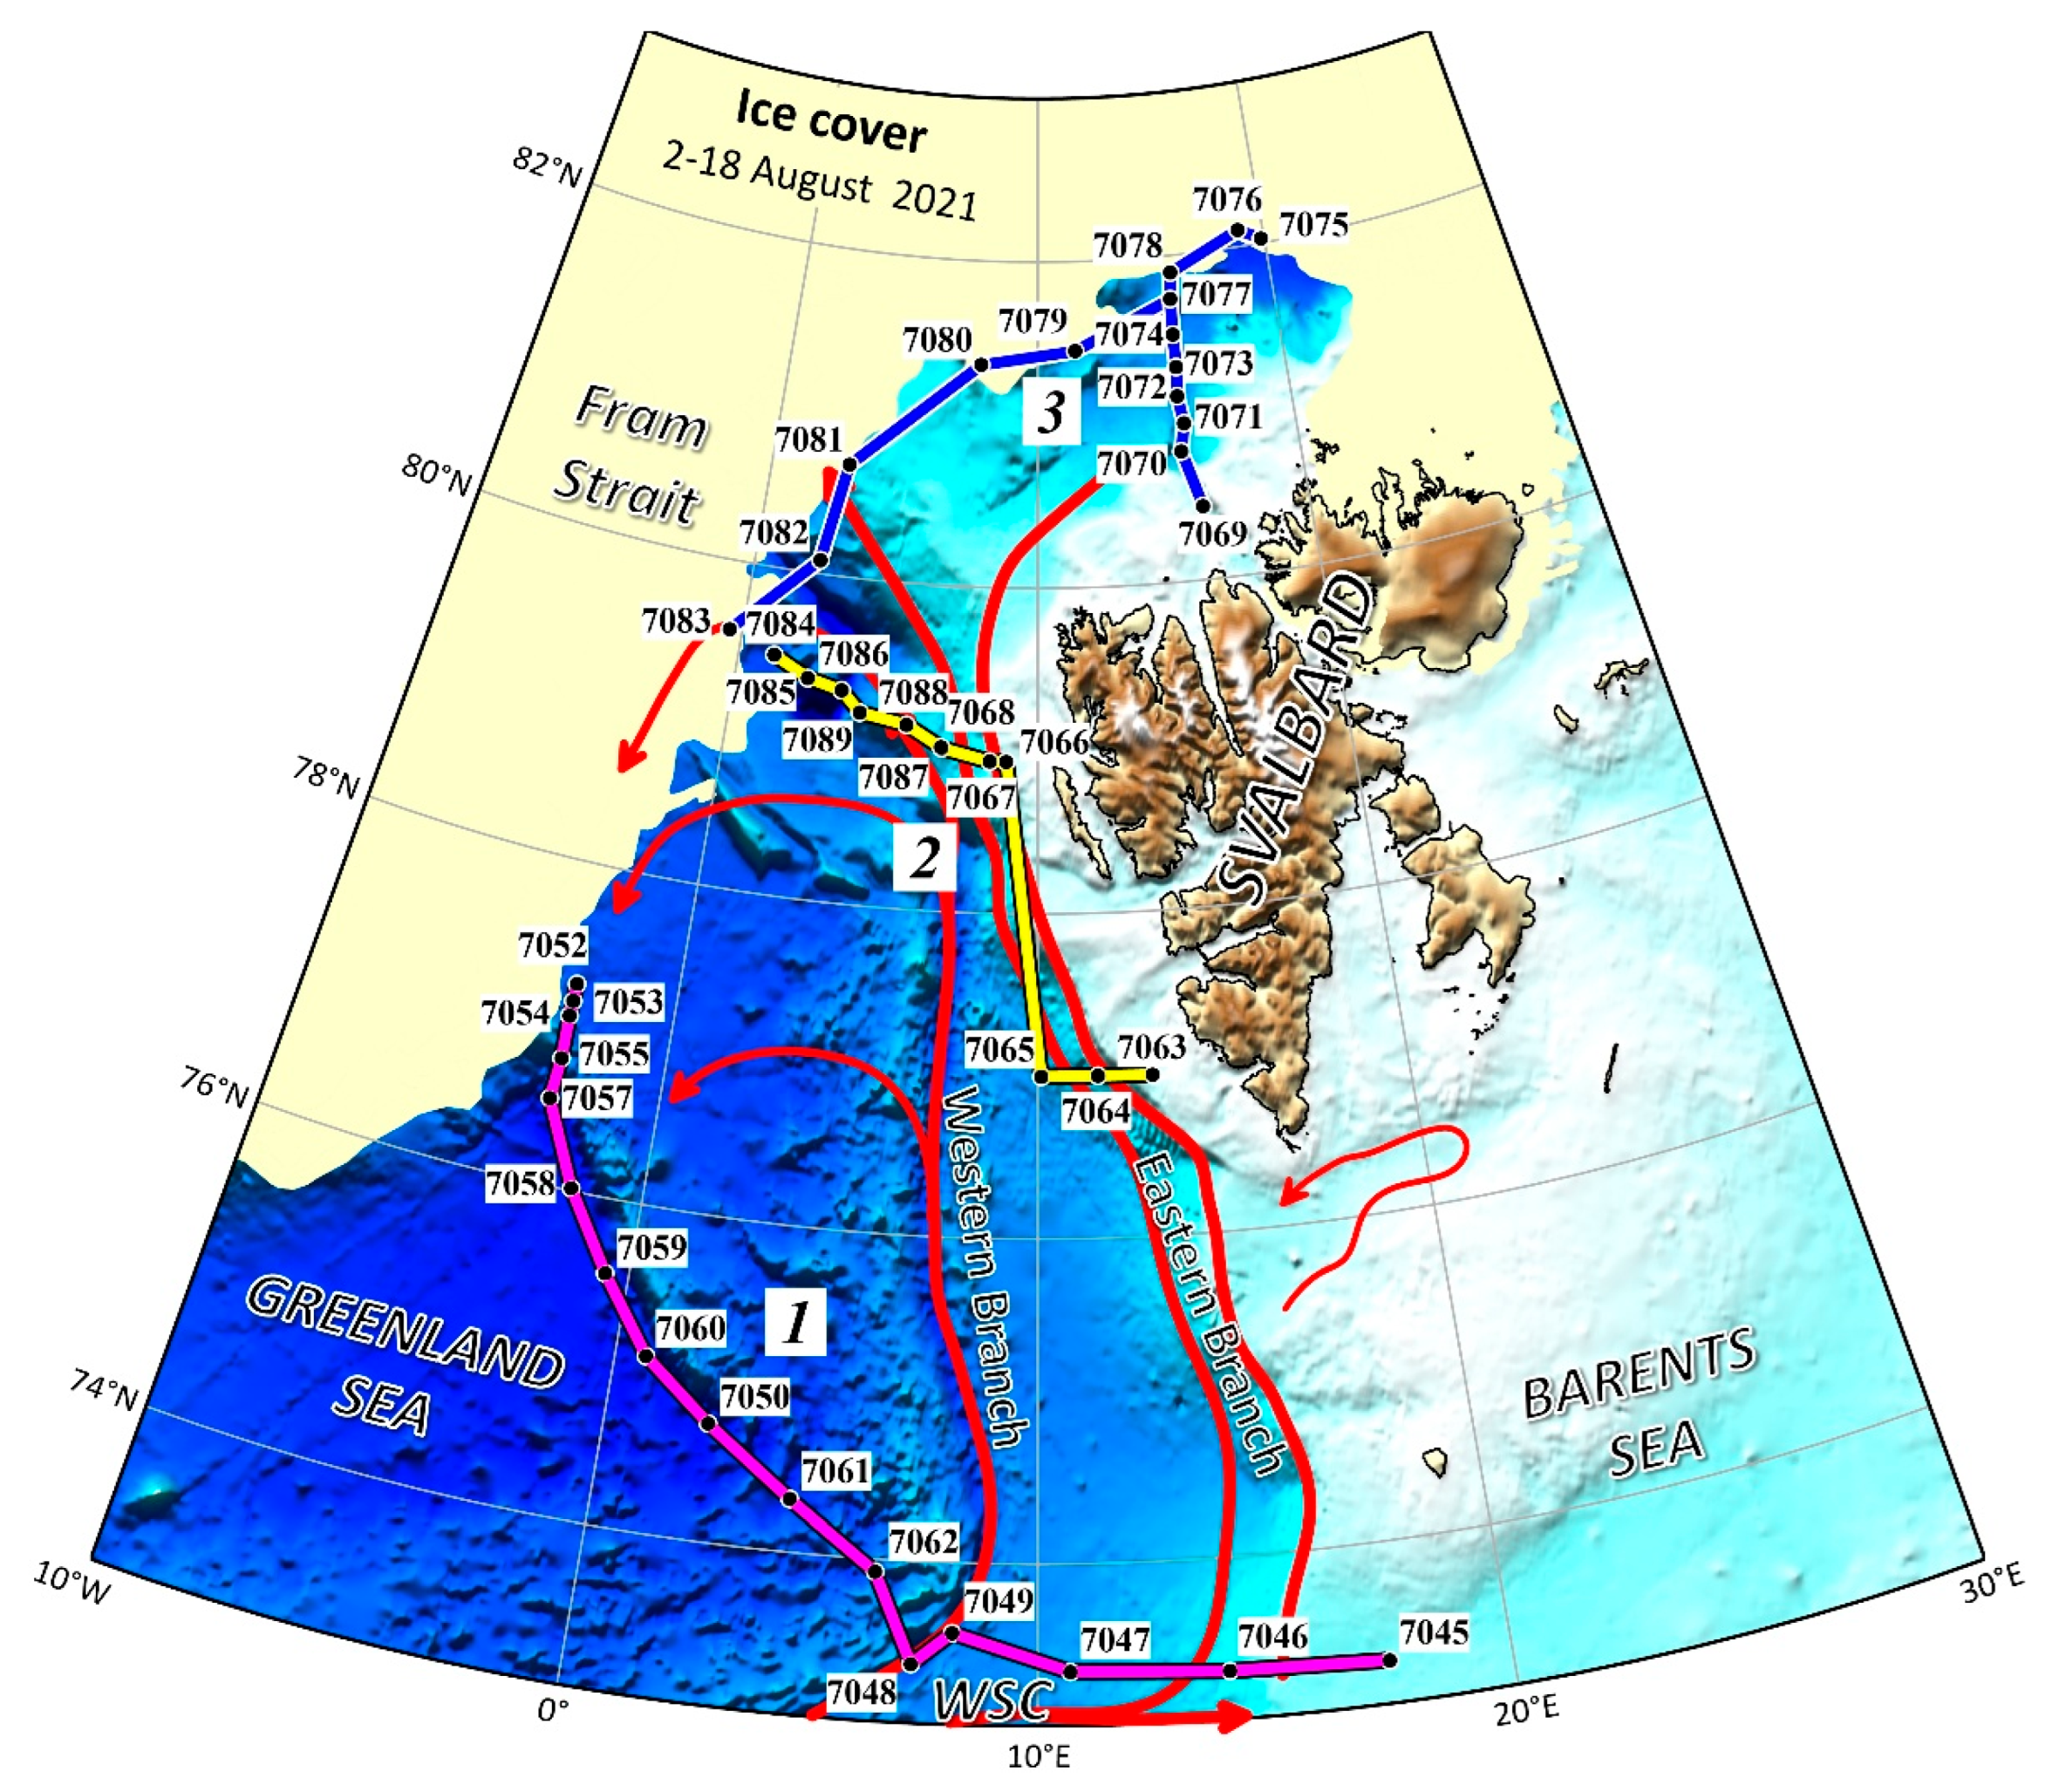
Figure 2.
The dependence of the depth of occurrence of the maximum biomass of diatom species on their cell volume.
Figure 2.
The dependence of the depth of occurrence of the maximum biomass of diatom species on their cell volume.
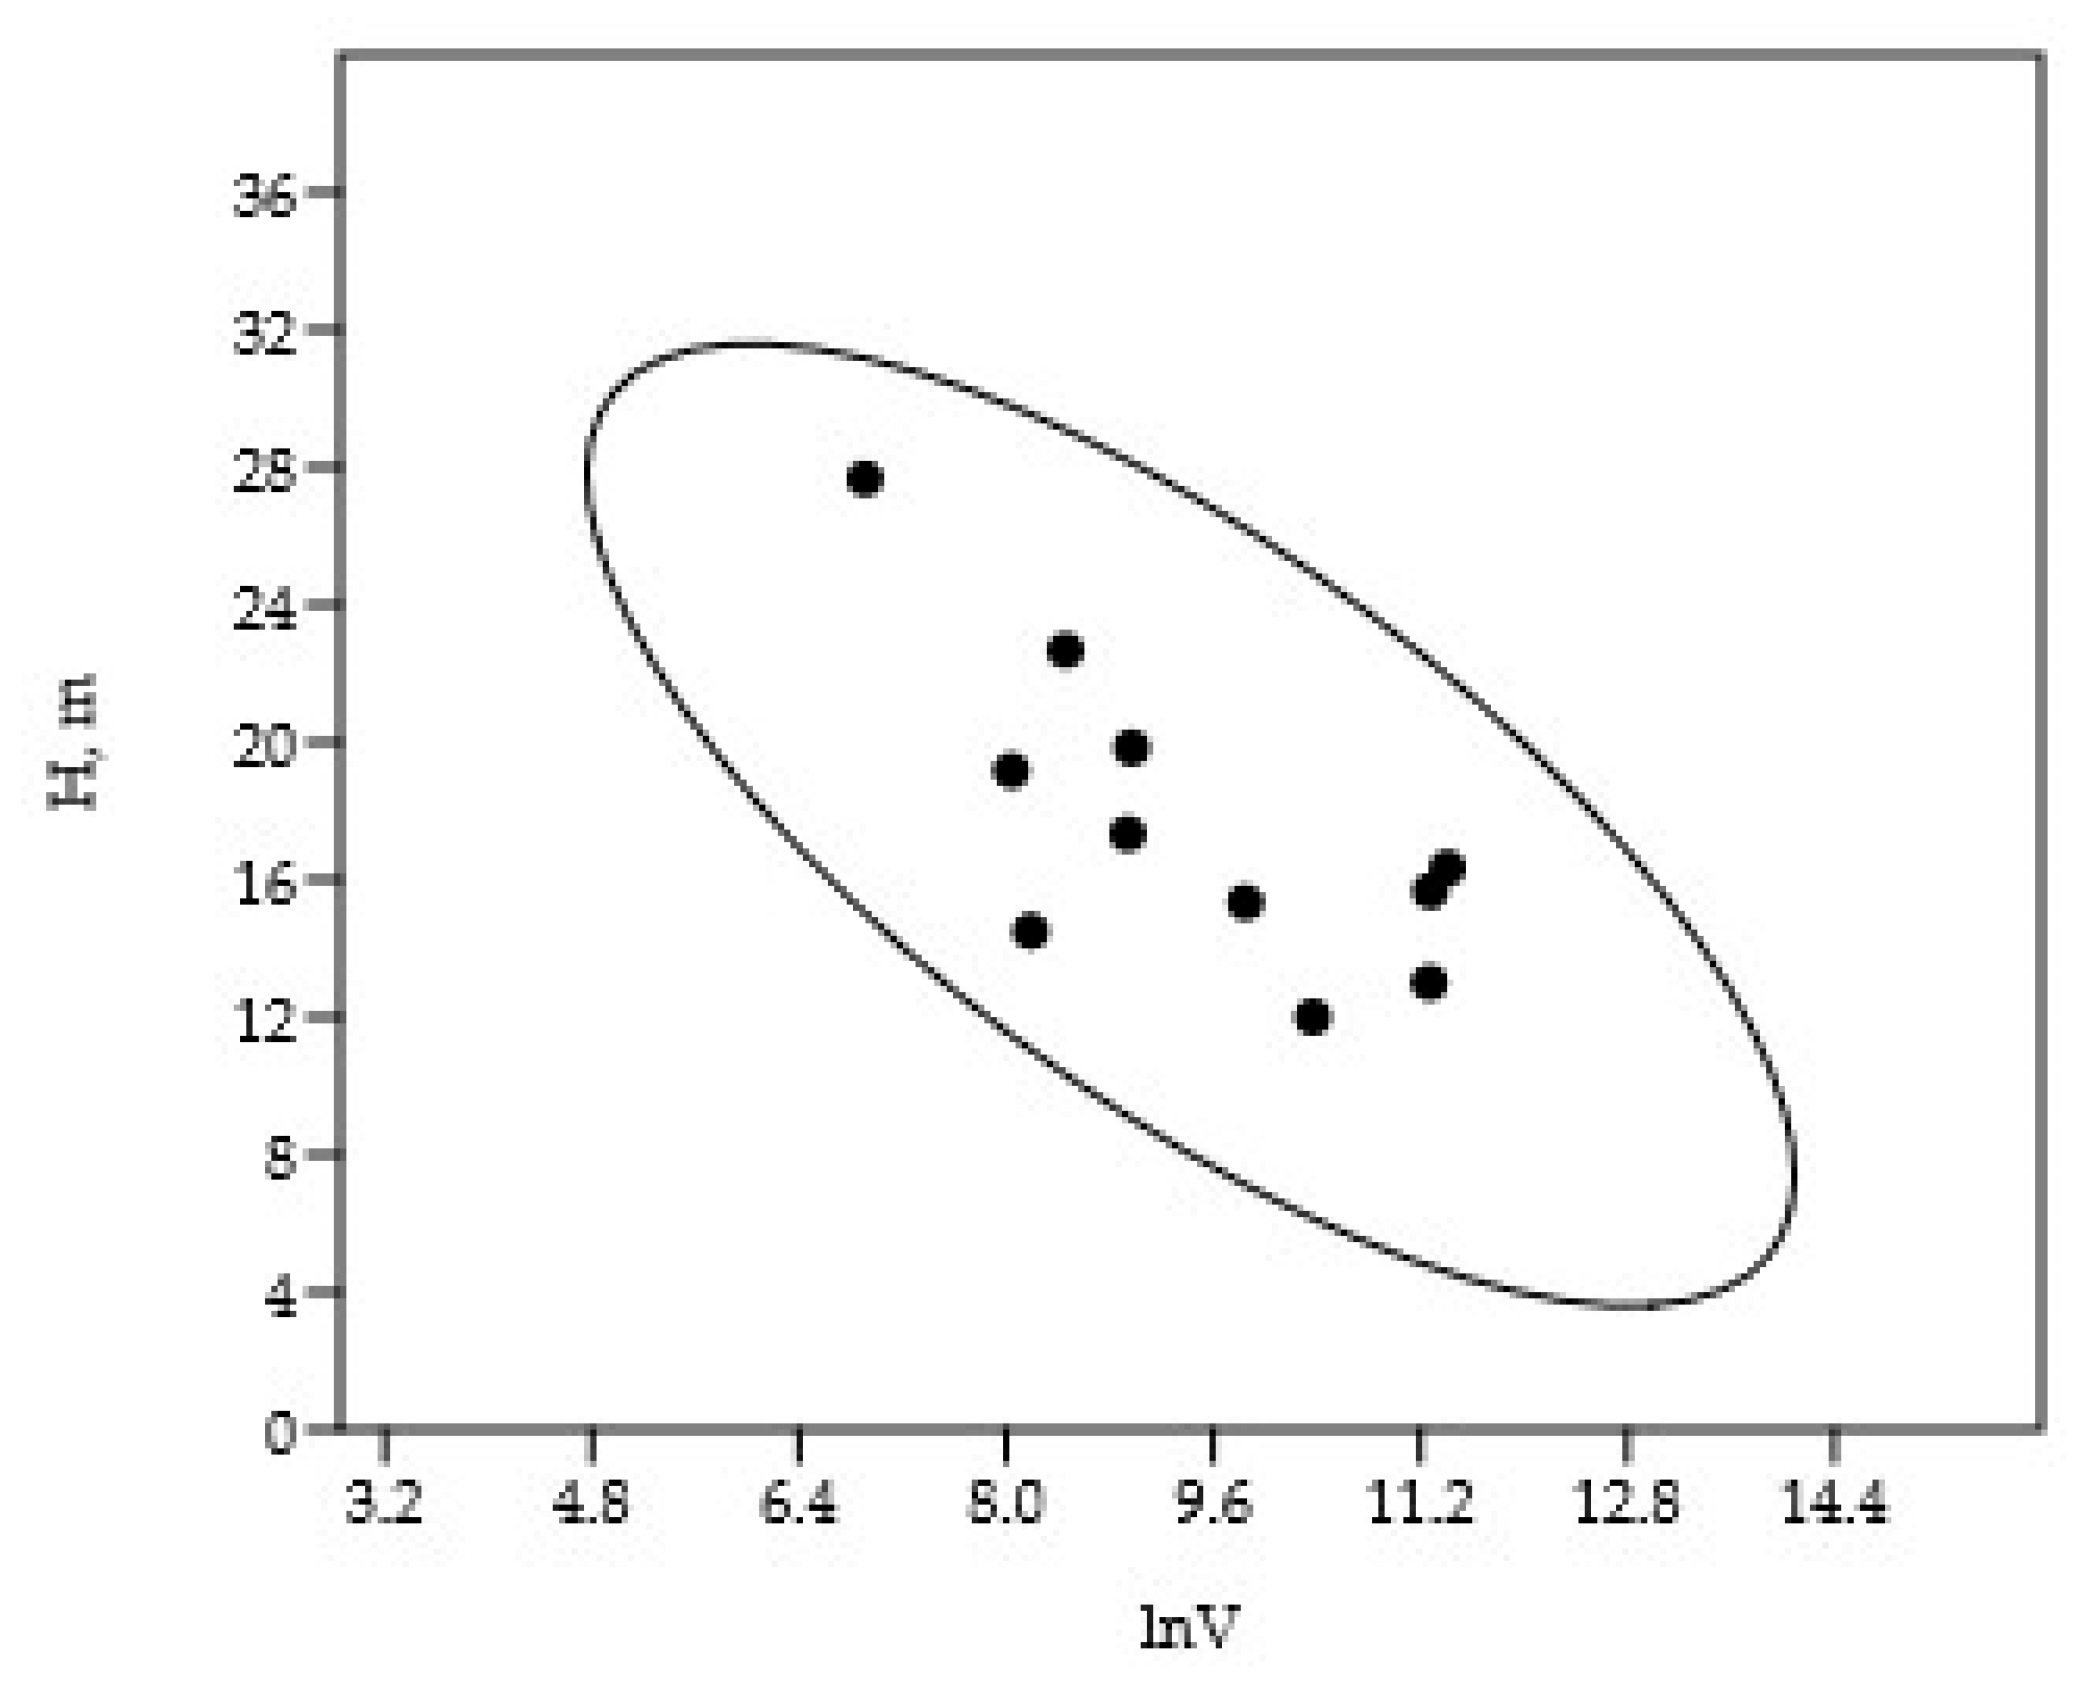
Figure 3.
Distribution of the identified diatom species in salinity-temperature coordinates.
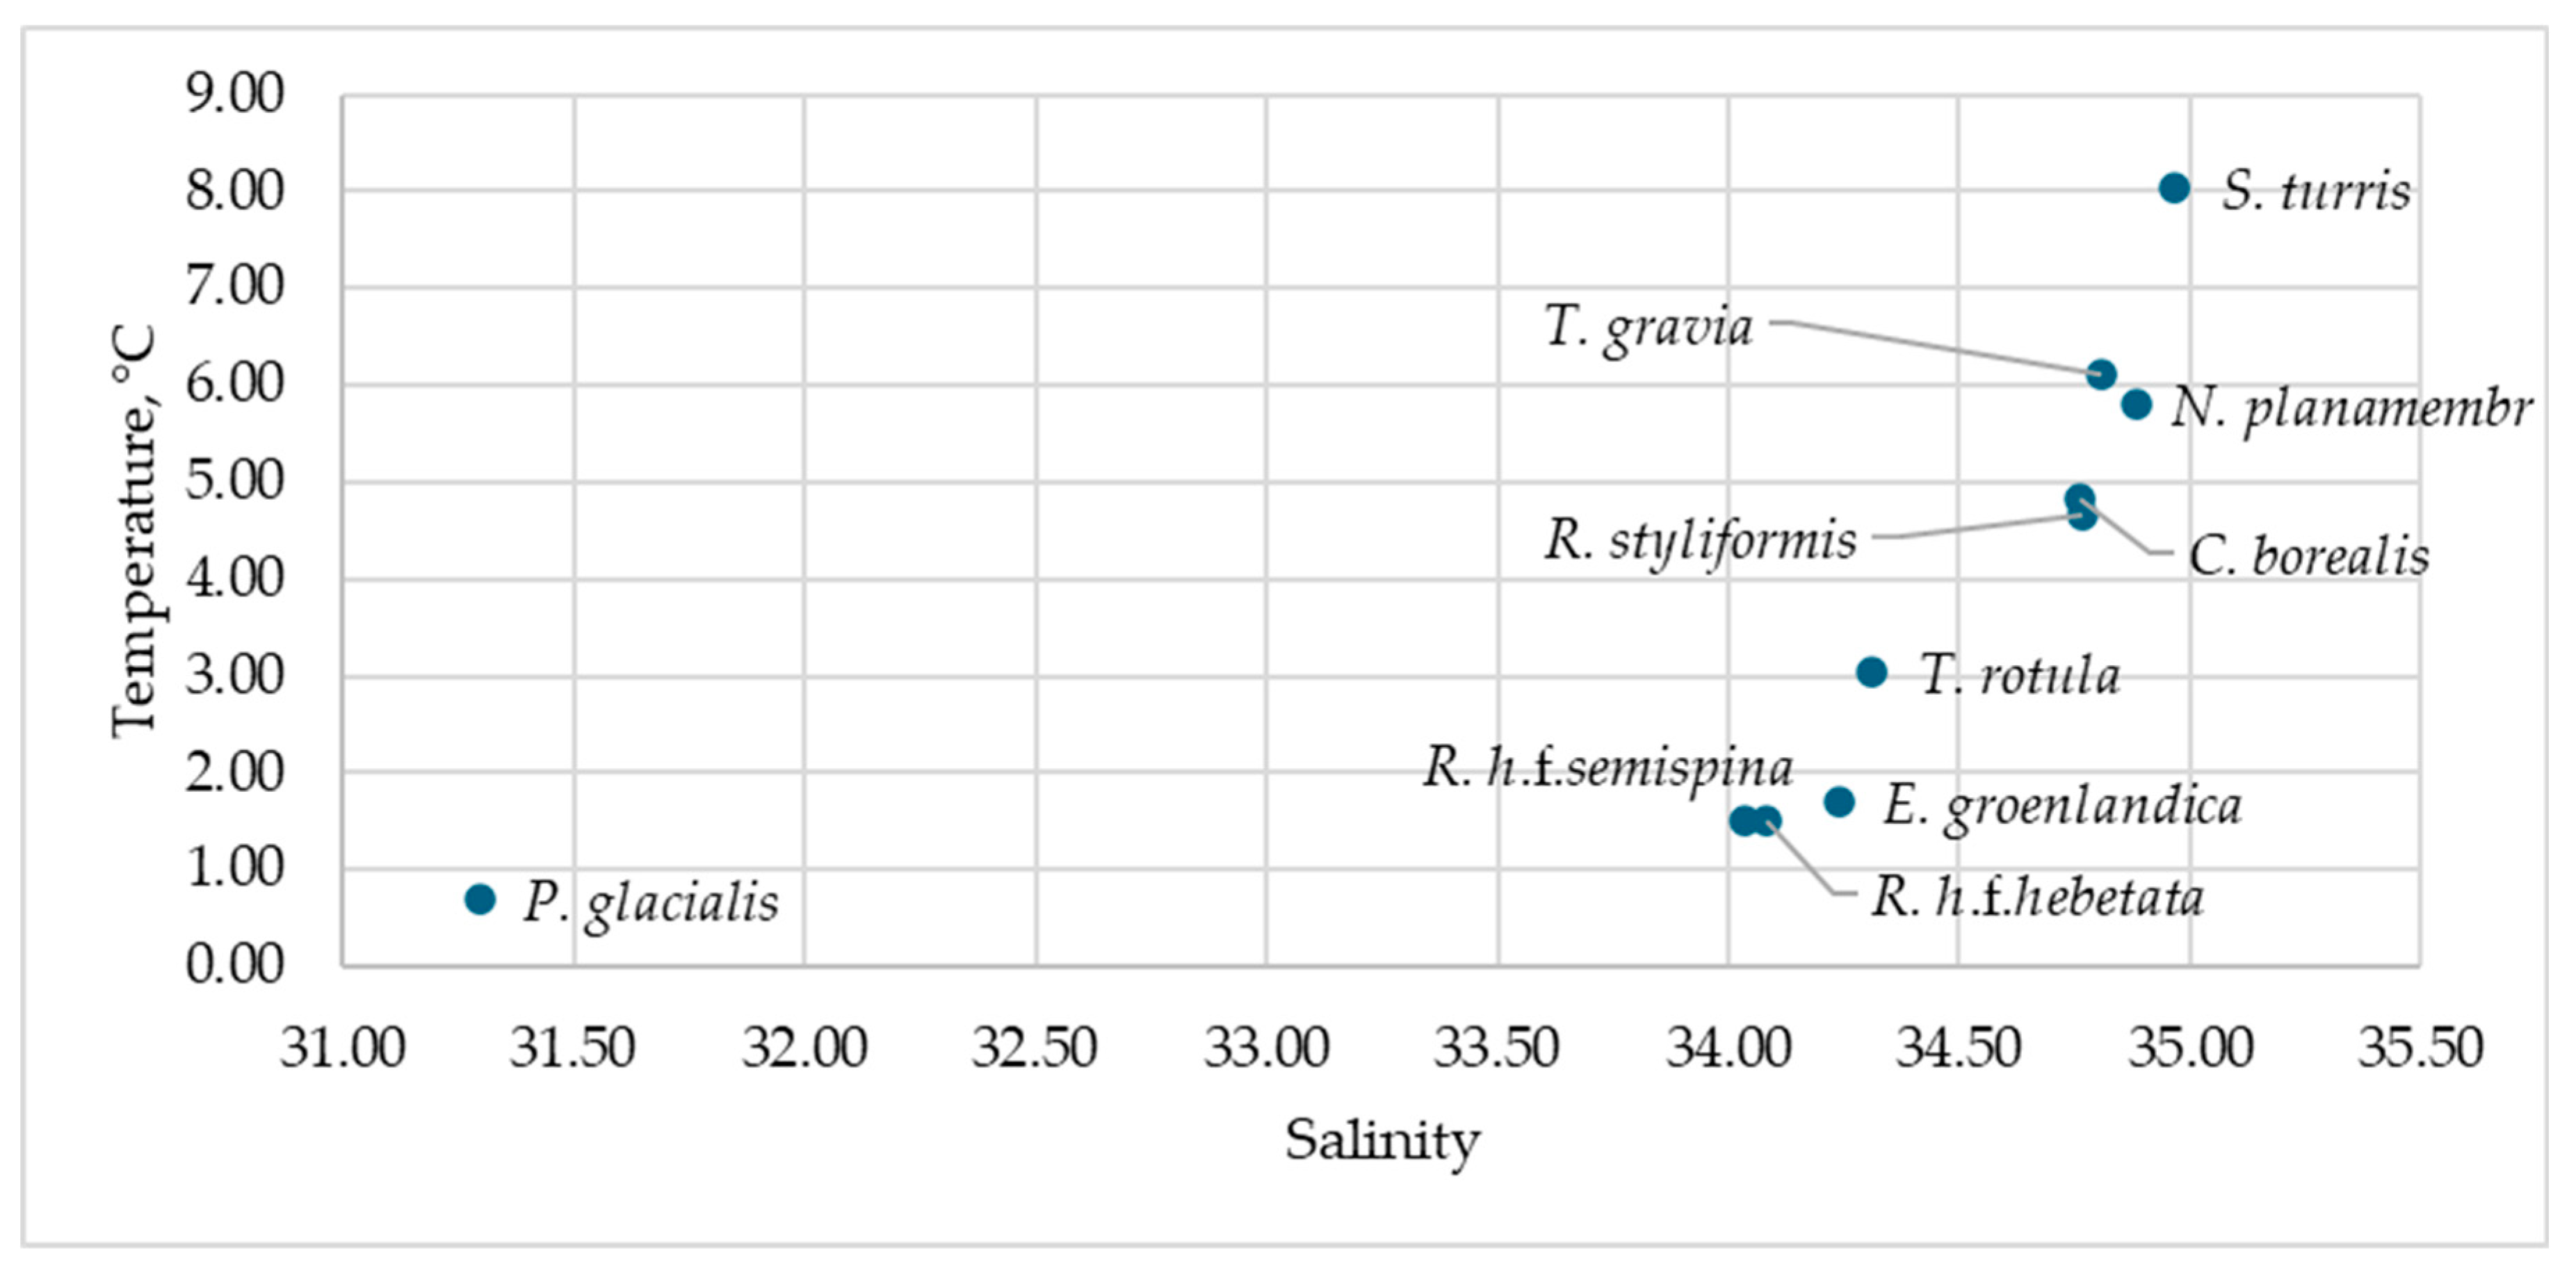
Figure 4.
Distribution of the identified diatom species in silicon-nitrogen (DIN) coordinates.
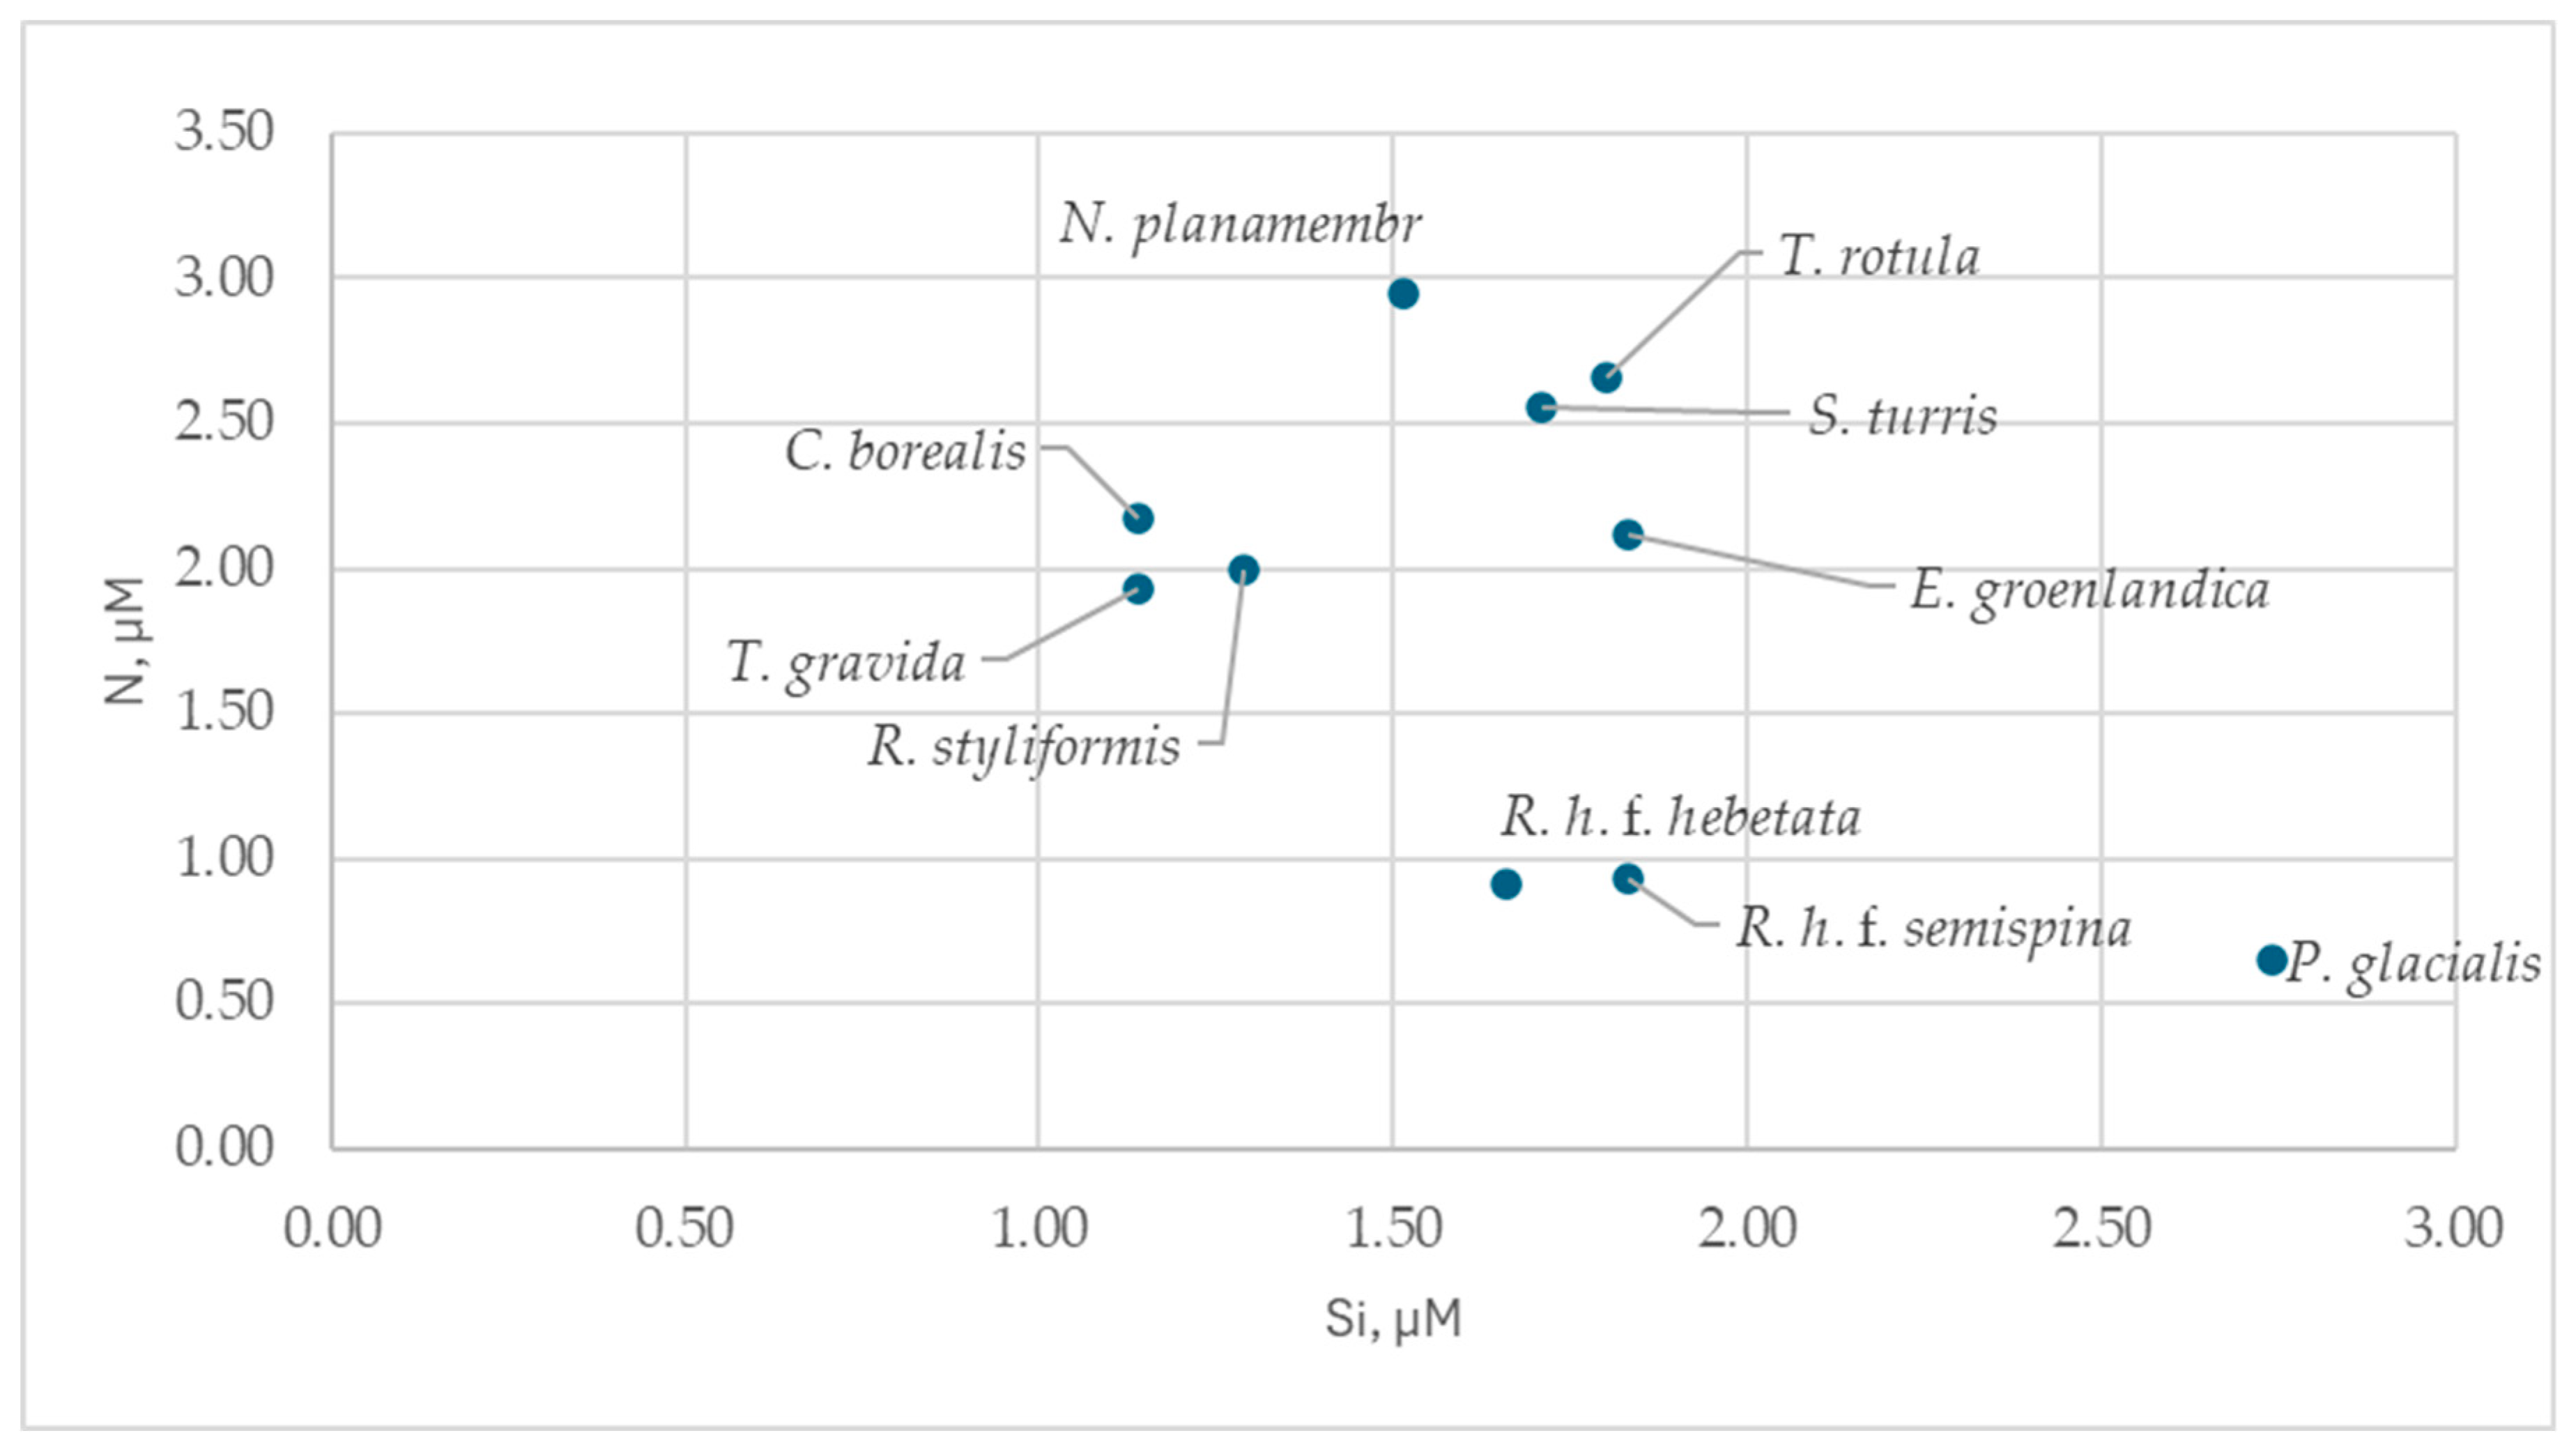
Figure 5.
Relationship between diatom biomass and DIN concentration in PSW on the northern transect.
Figure 5.
Relationship between diatom biomass and DIN concentration in PSW on the northern transect.
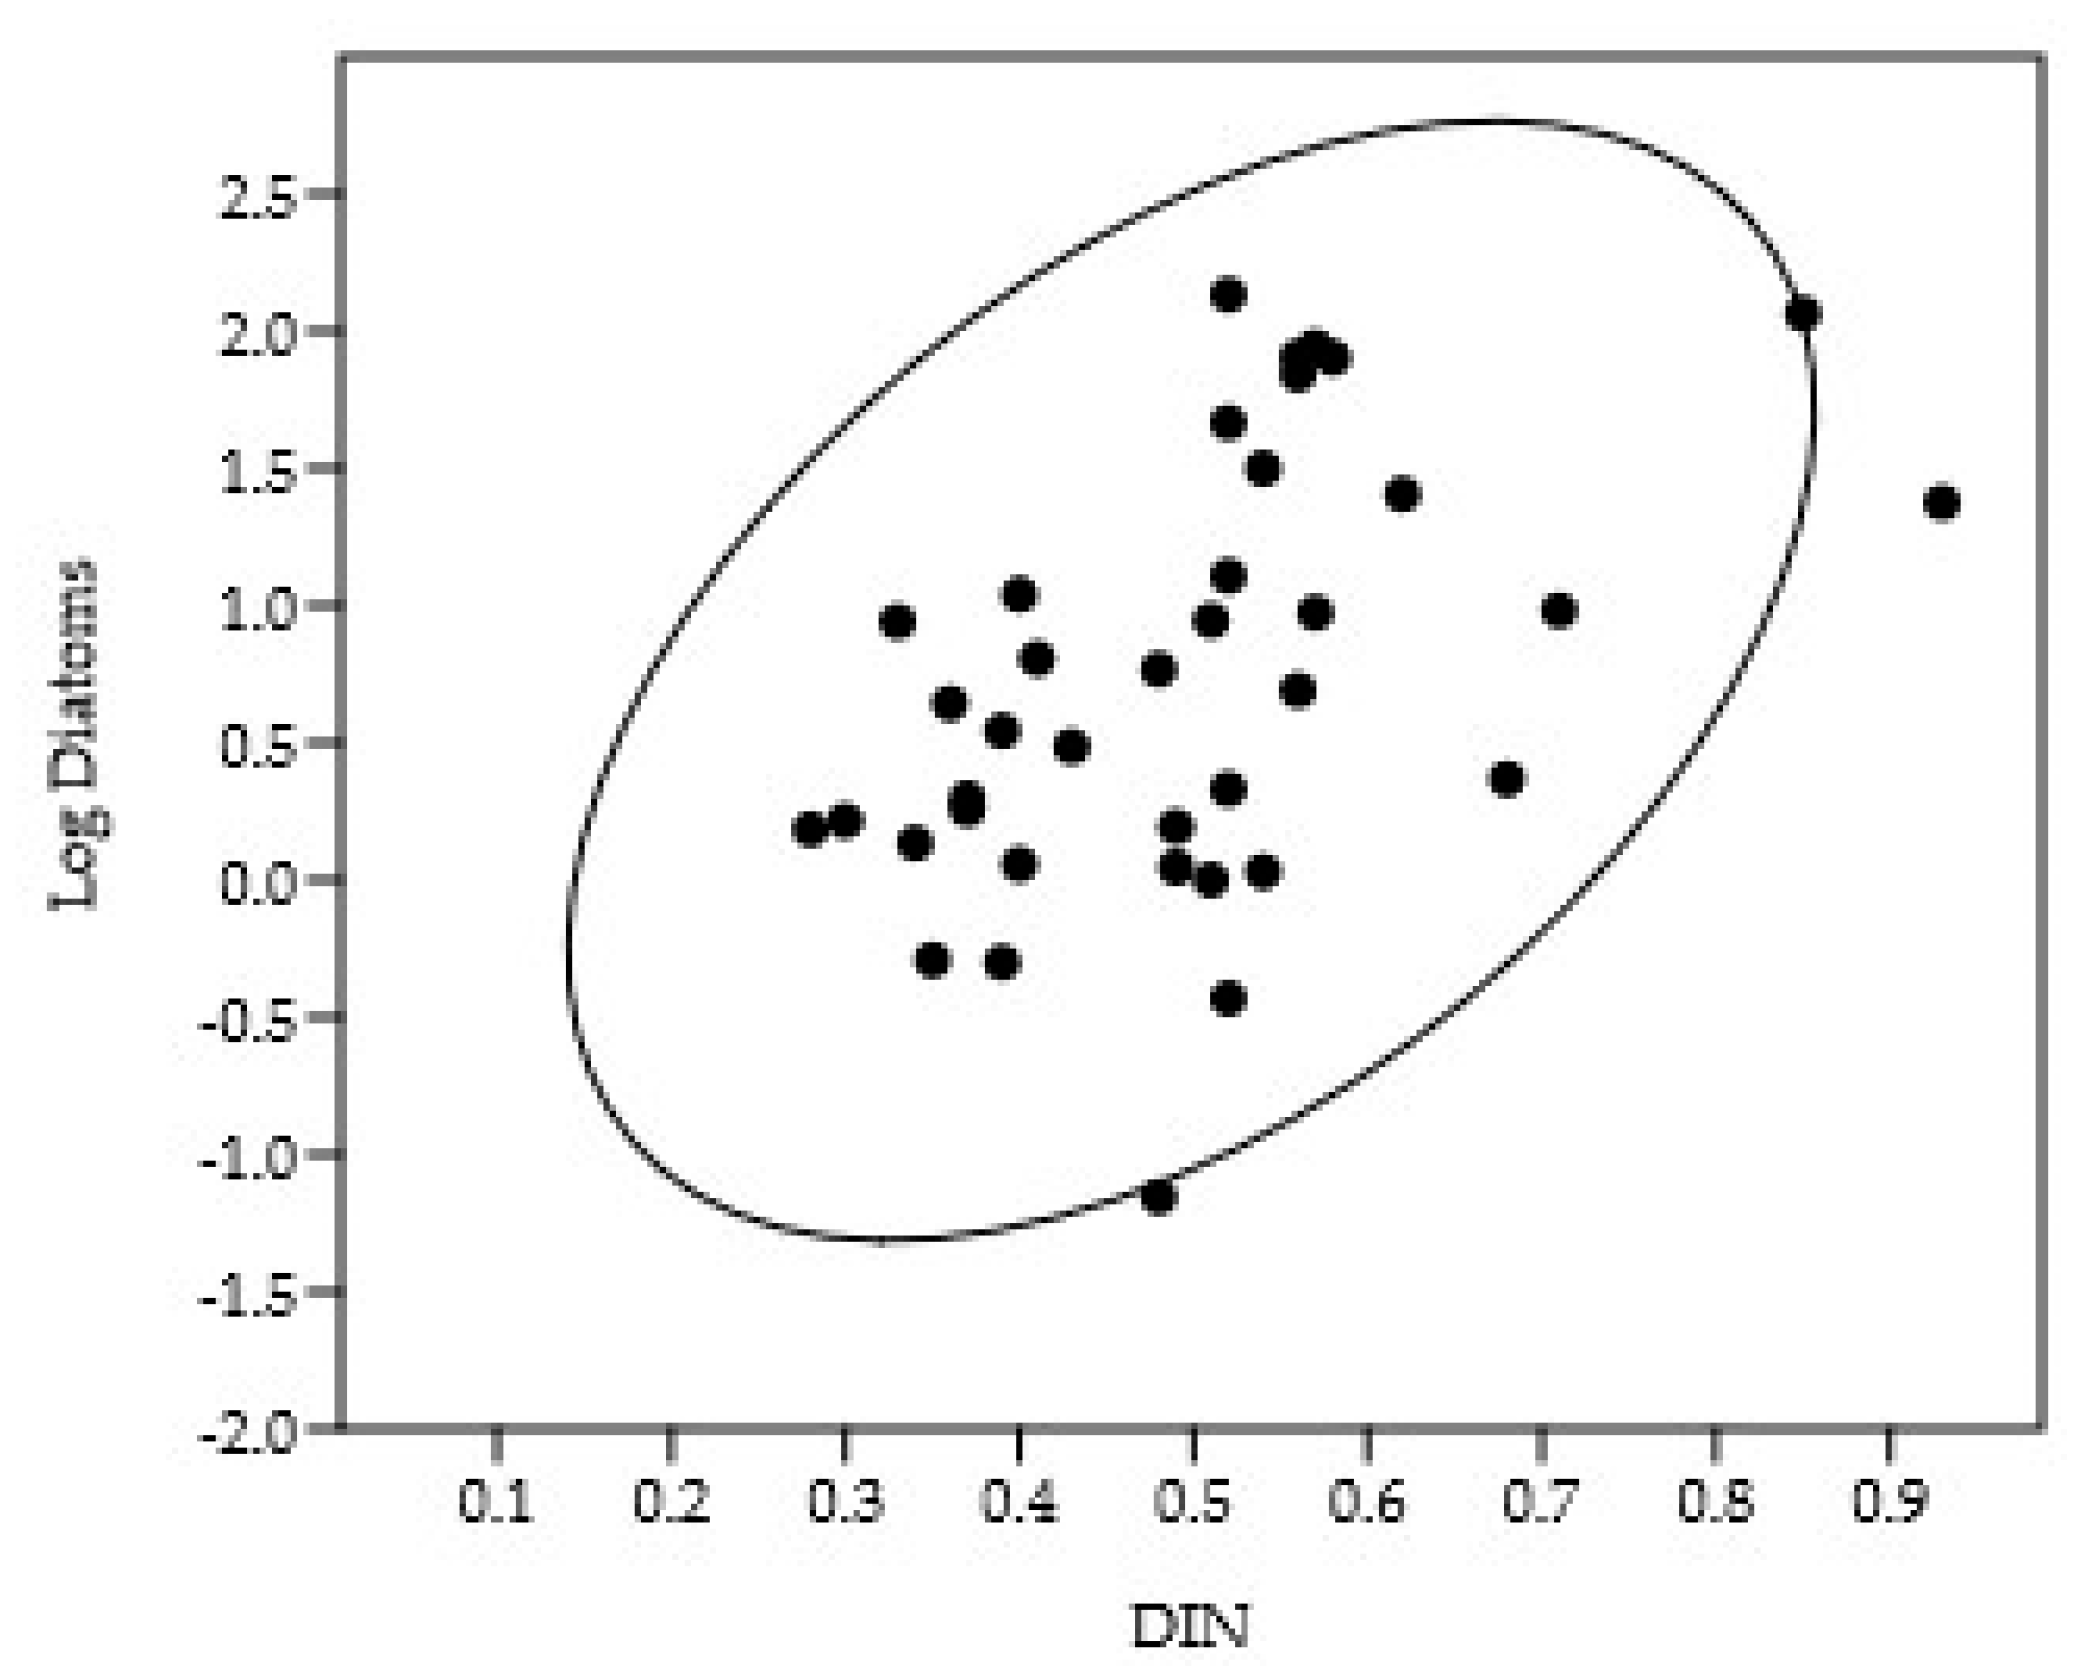
Figure 6.
Distribution of the identified dinoflagellate species in salinity-temperature coordinates.
Figure 6.
Distribution of the identified dinoflagellate species in salinity-temperature coordinates.
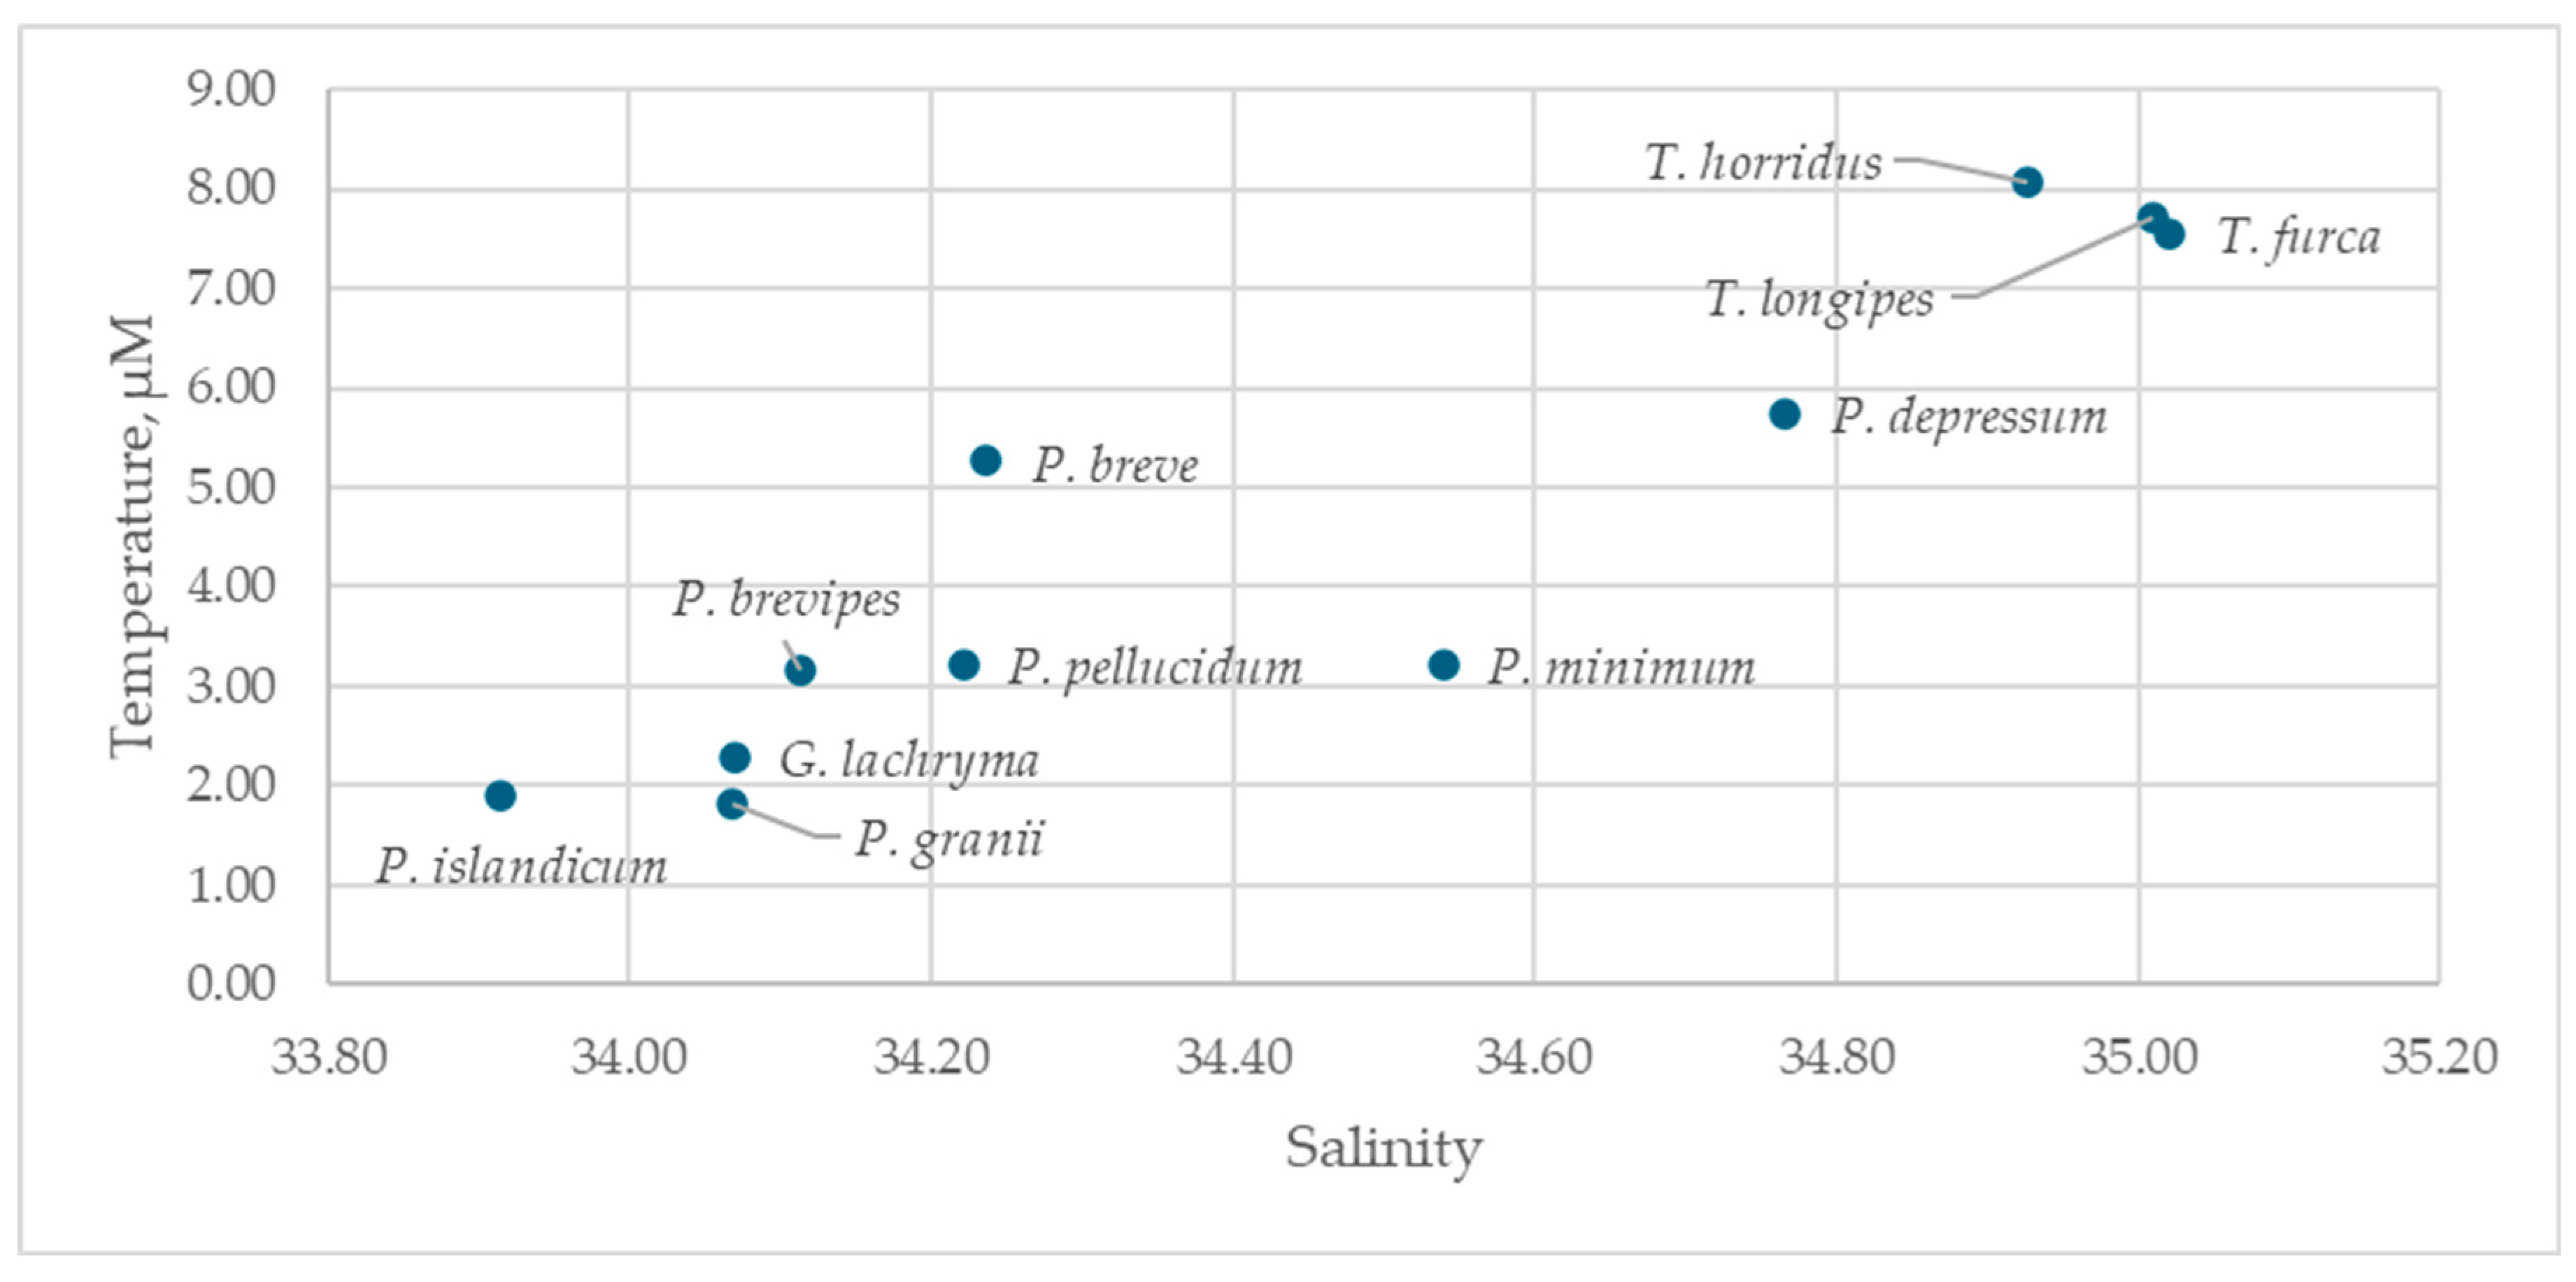
Figure 7.
Distribution of the identified dinoflagellate species in silicon-nitrogen (DIN) coordinates.
Figure 7.
Distribution of the identified dinoflagellate species in silicon-nitrogen (DIN) coordinates.
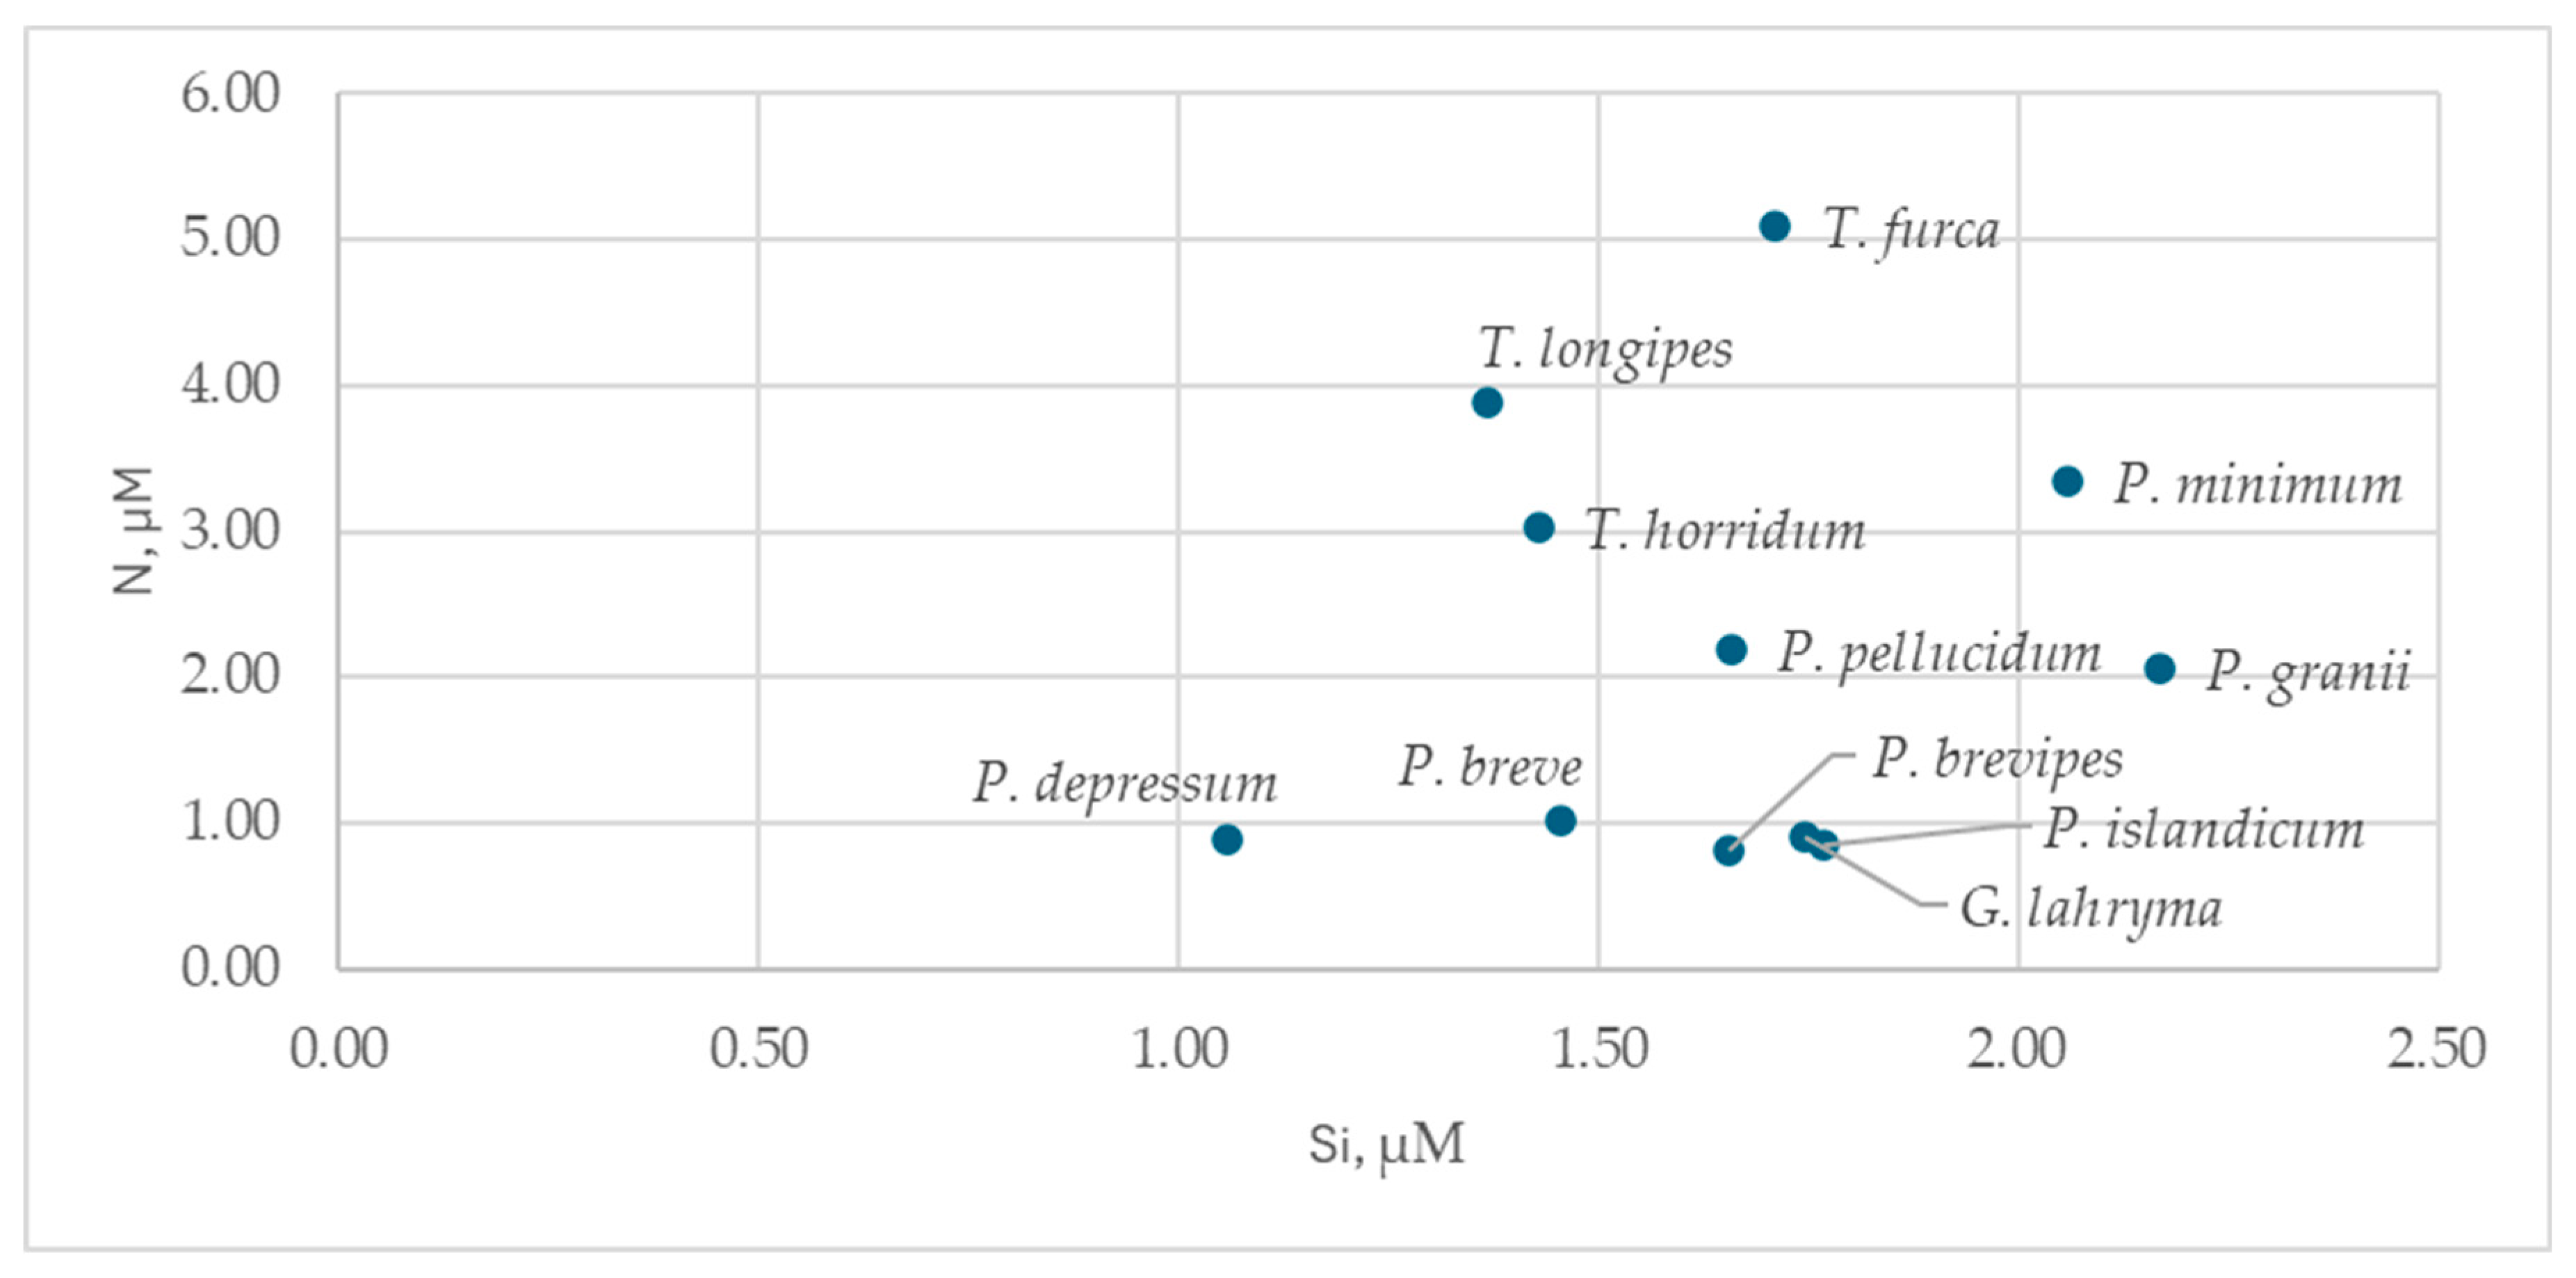
Figure 8.
Relationship between the logarithm of dinoflagellate biomass and the logarithm of small flagellate biomass.
Figure 8.
Relationship between the logarithm of dinoflagellate biomass and the logarithm of small flagellate biomass.
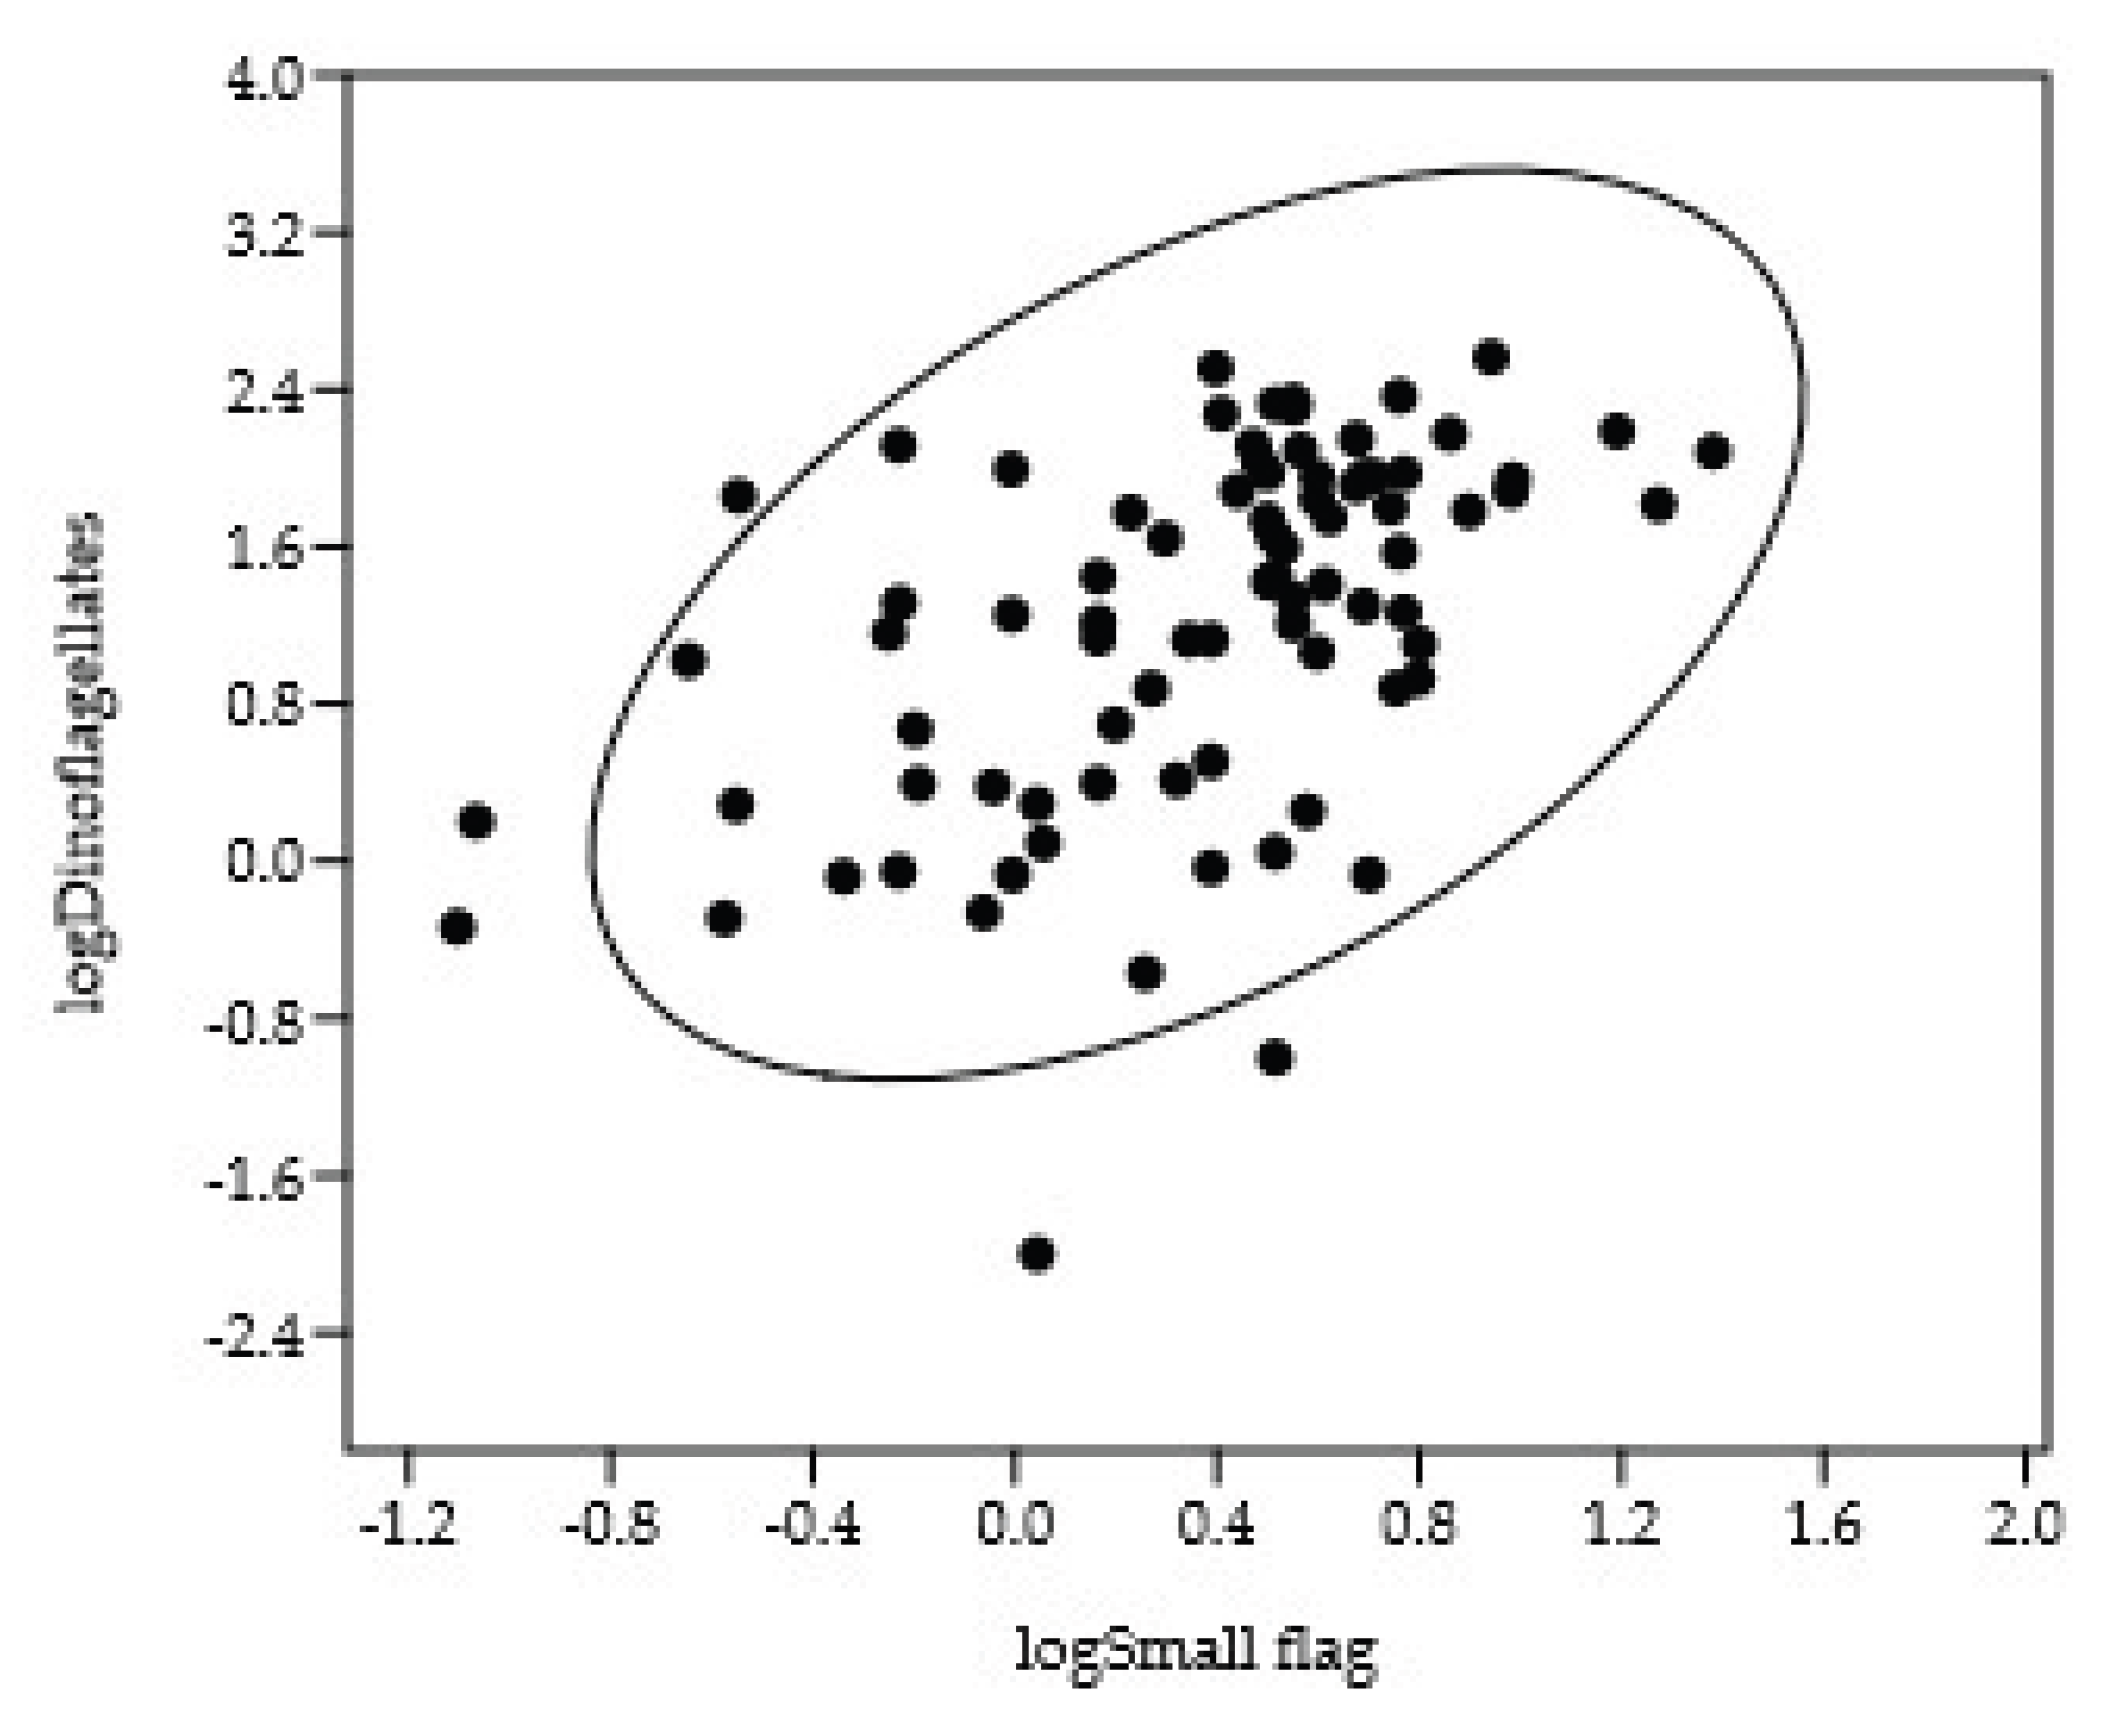

Table 1.
Characteristics (median values) of potential temperature (θ, °C), salinity (S, PSU), dissolved silicon (Si, µM), and dissolved inorganic nitrogen (DIN, µM) in the core of defined water masses in the study area. The p-value indicates the significance of the difference between AW and PSW (Mann-Whitney U test).
| Water Mass | Potential Temperature (θ, °C) | Salinity (S, PSU) | Si (µM) | DIN (µM) |
|---|---|---|---|---|
| AW | θ > 1.544 | 34.75 < S < 35.03 | 0.69 | 1.58 |
| mAW | θ <4.1 | 34.0 <S <34.75 | - | - |
| PSW | −1.659<θ <3.0 | 31.30 <S <34.0 | 1.83 | 0.52 |
| mPSW | -1.6 <θ<0 | 30.85 <S <31.28 | - | - |
| p (AW vs. PSW) | 7.3×10⁻⁹ | 9×10⁻⁶ |
Table 2.
Statistical indicators of biomass (mg m⁻³) for the main taxonomic and size groups of phytoplankton and their percentage contribution to the total biomass.
Table 2.
Statistical indicators of biomass (mg m⁻³) for the main taxonomic and size groups of phytoplankton and their percentage contribution to the total biomass.
| Group | Biomass (mg m⁻³) | Contribution (%) | ||||
|---|---|---|---|---|---|---|
| Max | Mean | Median | Max | Mean | Median | |
| Diatoms | 617.1 | 19.9 | 1.65 | 96.0 | 21.0 | 1.0 |
| Dinoflagellates | 366.0 | 47.5 | 10.6 | 98.0 | 50.0 | 49.0 |
| Coccolithophores | 47.1 | 2.1 | 0.01 | 92.0 | 9.0 | 0.01 |
| Haptophyta (Phaeocystis) | 206.2 | 2.7 | 0.01 | 80.0 | 0.3 | 0.01 |
| Small flagellates | 56.9 | 3.9 | 2.3 | 77.0 | 13.0 | 7.0 |
| Total Phytoplankton | 670.8 | 66.8 | 25.6 | |||
| N (number of samples) | 205 | 205 | 205 | 205 | 205 | 205 |
Table 3.
Dominant species with cell volume (Vcell, µm³), maximum abundance (cells L⁻¹), maximum biomass (mg m⁻³), and its maximum contribution to total phytoplankton biomass.
Table 3.
Dominant species with cell volume (Vcell, µm³), maximum abundance (cells L⁻¹), maximum biomass (mg m⁻³), and its maximum contribution to total phytoplankton biomass.
| Station | Depth (m) | Dominant Species | Abundance (cells L⁻¹) | Biomass (mg m⁻³) | Vcell (µm³) | Contribution (%) |
|---|---|---|---|---|---|---|
| Diatoms | ||||||
| 7082 | 34 | Rhizosolenia styliformis | 2,300 | 535.3 | 247,400 | 89.3 |
| 7081 | 35 | Rhizosolenia hebetata f. hebetata | 14,500 | 145.5 | 10,000 | 83.0 |
| 7070 | 35 | Thalassiosira rotula | 36,400 | 170.9 | 4,700 | 86.7 |
| Ciliates | ||||||
| 7075 | 4 | Mesodinium rubrum | 58,200 | 324.7 | 5,580 | 99.3 |
| Dinoflagellates | ||||||
| 7069 | 1 | Gyrodinium lachryma | 380 | 304.0 | 795,800 | 87.1 |
| 7045 | 6 | Protoperidinium depressum | 80 | 114.5 | 1,437,000 | 67.0 |
| Haptophyta | ||||||
| 7081 | 35 | Phaeocystis pouchetii | 727,300 | 196.4 | 270 | 52.2 |
Table 4.
Statistical indicators of abundance (N, cells L⁻¹), biomass (B, mg m⁻³), depth of occurrence (H, m), salinity (PSU), temperature (T, °C), concentrations of phosphorus (P, µM), nitrogen (DIN, µM), silicon (Si, µM), and their ratios for the 10 diatom species (n = number of measurements).
Table 4.
Statistical indicators of abundance (N, cells L⁻¹), biomass (B, mg m⁻³), depth of occurrence (H, m), salinity (PSU), temperature (T, °C), concentrations of phosphorus (P, µM), nitrogen (DIN, µM), silicon (Si, µM), and their ratios for the 10 diatom species (n = number of measurements).
| Parameter | n | Min | Max | Mean | Median |
|---|---|---|---|---|---|
| Abundance (cells L⁻¹) | 282 | 5 | 112,500 | 1629 | 112 |
| Biomass (mg m⁻³) | 282 | 0.04 | 535.28 | 13.29 | 2.48 |
| Depth (m) | 275 | 1 | 50 | 18.5 | 16 |
| Salinity (PSU) | 273 | 30.97 | 35.04 | 34.22 | 34.65 |
| Temperature (°C) | 273 | -1.63 | 8.82 | 3.78 | 4.38 |
| Phosphorus (P, µM) | 252 | 0.13 | 1.98 | 0.36 | 0.3 |
| Silicon (Si, µM) | 252 | 0.51 | 4.56 | 1.73 | 1.48 |
| Nitrogen (DIN, µM) | 232 | 0.28 | 9.65 | 2.61 | 2 |
| N:P ratio | 242 | 0.85 | 17.81 | 6.8 | 5.88 |
| Si:N ratio | 242 | 0.1 | 7.8 | 1.4 | 0.6 |
| Si:P ratio | 246 | 1.2 | 16 | 5.7 | 5.1 |
Table 6.
Statistical separation of dinoflagellate species into cold-water and warm-water groups based on pairwise comparisons of mean occurrence temperatures (t-test). The table shows p-values; values below 0.05 (in bold) indicate a significant difference between species.
Table 6.
Statistical separation of dinoflagellate species into cold-water and warm-water groups based on pairwise comparisons of mean occurrence temperatures (t-test). The table shows p-values; values below 0.05 (in bold) indicate a significant difference between species.
| Species | P. granii | P. islandicum | G. lachryma | P. pellucidum | P. cordatum | P. brevipes | P. breve | P. depressum |
|---|---|---|---|---|---|---|---|---|
| P. islandicum | 0.71 | |||||||
| G. lachryma | 0.32 | 0.36 | ||||||
| P. pellucidum | 0.49 | 0.39 | 0.72 | |||||
| P. cordatum | 0.015 | 0.01 | 0.08 | 0.49 | ||||
| P. brevipes | 0.04 | 0.03 | 0.17 | 0.62 | 0.84 | |||
| P. breve | 0.02 | 0.02 | 0.016 | 0.11 | 0.19 | 0.18 | ||
| P. depressum | 10⁻⁶ | 10⁻⁶ | 4.1x10⁻⁵ | 0.007 | 0.06 | 0.08 | 0.41 |
Disclaimer/Publisher’s Note: The statements, opinions and data contained in all publications are solely those of the individual author(s) and contributor(s) and not of MDPI and/or the editor(s). MDPI and/or the editor(s) disclaim responsibility for any injury to people or property resulting from any ideas, methods, instructions or products referred to in the content. |
© 2025 by the authors. Licensee MDPI, Basel, Switzerland. This article is an open access article distributed under the terms and conditions of the Creative Commons Attribution (CC BY) license (http://creativecommons.org/licenses/by/4.0/).
Copyright: This open access article is published under a Creative Commons CC BY 4.0 license, which permit the free download, distribution, and reuse, provided that the author and preprint are cited in any reuse.


