Submitted:
08 September 2025
Posted:
09 September 2025
You are already at the latest version
Abstract
Background: Ovarian cancer is a leading gynecological malignancy with high global mortality. Early and accurate diagnosis is essential for effective management, yet many ovarian masses remain indeterminate after initial assessment. Transvaginal ultrasound is the first-line imaging tool, but up to 20% of cases yield inconclusive results, complicating treatment decisions. Methods: This review summarizes current diagnostic approaches for ovarian masses, with a focus on advanced imaging and emerging technologies. Key areas include the role of contrast-enhanced MRI, the O-RADS MRI scoring system, and the integration of Artificial Intelligence (AI) into imaging workflows. Results: Contrast-enhanced MRI offers high diagnostic accuracy (83–93%) for indeterminate ovarian masses. The O-RADS MRI Score shows a sensitivity of 93% and specificity of 91% in malignancy risk assessment. New classification systems have been proposed to further improve diagnostic performance. AI methods, particularly machine learning and deep learning applied to imaging data, show promise in enhancing diagnostic precision, though most require further clinical validation. Conclusions: Advanced imaging techniques and AI are reshaping the diagnostic landscape of ovarian cancer. While current tools like MRI and O-RADS improve accuracy, ongoing research into novel models and AI applications suggests further gains are possible. Clinical validation and expert oversight remain essential for their integration into routine practice.
Keywords:
Ovarian cancer
; US
; CT
; Magnetic Resonance Imaging (MRI)
; O-RADS MRI Score
; Artificial Intelligence (AI)
; Radiomics
1. Introduction
In 2020, ovarian cancer (OC) ranked eighth on the list of the most diagnosed malignant diseases in the world involving approximately 314000 women, moreover being eighth in the overall ranking of cancers most associated with mortality with more than 207000 deaths [1]. According to some studies there is a trend related to an increase in the incidence of gynecological cancers [2]. The most common malignant subtype of OC is high-grade serous carcinoma (≈70%). The prognosis of ovarian cancer tends to be unfavorable, and it is related to the inherent malignancy of the neoplasm itself, the absence of specific signs and symptoms that allow early diagnosis, and the lack of valid mass screening. Since ovarian cancer has the tendency to present clinically at an advanced stage (stage III and IV according to FIGO staging 2021 in 70-80% of cases), overall 5-year survival is estimated to be around 46%, effectively making ovarian cancer one of the most lethal cancers [1]. Staging is surgical and based on the FIGO system. Standard treatment includes cytoreductive surgery and platinum-taxane chemotherapy. Neoadjuvant chemotherapy is used when primary surgery is not feasible. Targeted therapies such as PARP inhibitors (for BRCA-mutated tumors) and bevacizumab (anti-angiogenic) have improved outcomes. HIPEC and immunotherapy are under evaluation. Radiotherapy has a limited role, mainly in palliative settings [3,4,5].
2. Imaging in Ovarian Carcinoma
2.1. Ultrasonographic Imaging
Ultrasound is the first-line imaging modality in the evaluation and characterization of adnexal masses in both healthy and high-risk patients. The sensitivity and specificity of ultrasonography for the characterization of adnexal masses are influenced by several factors, including the operator’s experience, the facility where the ultrasound is performed, the quality of the equipment, and the type of patient and the mass itself. Clinical studies and researches have suggested average values of sensitivity and specificity that may vary, with sensitivity typically ranging from 70% to 90% and specificity from 70% to 95% [6,7].
Ultrasonography relies on the morphologic features of ovarian lesions, which, when assessed in conjunction with menopausal status and CA-125 levels, allow an estimate of the risk of malignancy. The proficiency of the operator, along with the reputation and resources of the investigative centre, plays a critical role in determining the accuracy of diagnosis and the effectiveness of prognosis for the patient. For this reason, the goal over the years has been to develop models for stratifying the risk of malignancy of ovarian lesions that would be simple to apply, reproducible, and effective. Over the years various attempts have been made to address this issue, including the Risk of Malignancy Index (RMI), Risk of Ovarian Malignancy Algorithm (ROMA) and Logistic Regressions 1 and 2 (LR1 and LR2). The most recent risk stratification models are the ADNEX model and the ORADS-US model.
2.1.1. IOTA ADNEX Model
The IOTA-ADNEX (International Ovarian Tumor Analysis-Assessment of Different Neoplasias in the Adnexa) model was published in 2014 with the aim of classifying ovarian lesions on ultrasound, and it proved to be more effective than previously used models. The ADNEX model aims not only to predict the type of lesion (benign or malignant) but also to describe the “stage” of disease (borderline, stage I, stage II-IV, metastatic), leading to the early detection of suspicious lesions and, consequently, the reduction of mortality and morbidity [8]. This model takes into account nine factors: age (in years), serum CA-125 levels (U/ml), type of center (reference/non-reference in oncology), maximum diameter of the lesion (mm), number of papillary projections (0, 1, 2, 3 or >3), maximum diameter of the major solid portion (mm), more or less than 10 cystic loculi (yes/no) and ascitic effusion (yes/no). The various results are then translated both graphically and numerically into risk of lesion malignancy (%), in which the ADNEX model was found to have high specificity.
2.1.2. O-RADS US
The Ovarian-Adnexal Reporting and Data System (O-RADS) US is a risk stratification and management system for ovarian and adnexal lesions based on ultrasound characteristics of lesions. Published in 2018, its aim is to create a common language to minimize ambiguity and improving the interpretation of ovarian masses [6,9].
The O-RADS US system is based on a standardized lexicon, which allows ovarian lesions to be placed into six different categories (0-5), each of which is associated with different risk of malignancy of the lesion:
- O-RADS 0: incomplete evaluation
- O-RADS 1: physiological findings
- O-RADS 2: lesions almost certainly benign (<1% risk of malignancy)
- O-RADS 3: lesions with low risk of malignancy (1-10%)
- O-RADS 4: lesions with intermediate risk of malignancy (10-50%)
- O-RADS 5: lesions with high risk of malignancy (>50%)
2.2. CT Imaging
The role of CT imaging is limited in the characterization of adnexal masses; however, it is critical in loco-regional and especially in distant staging of disease. This imaging method boasts of wide availability, relatively low cost and short acquisition time. The CT acquisition protocol involves obtaining scans of 1–2 mm thickness of the neck, thorax, abdomen, and pelvis after the injection of iodinated contrast medium. Venous phase images should be acquired 70-80 seconds after contrast injection, followed by MPR in both the coronal and sagittal planes (Figure 2). There is still no consensus on the use of oral contrast medium administered with the goal of better evaluation of bowel loops and peritoneal carcinosis implants. Oral contrast medium can be positive (iodinated mdc) or negative (water).
CT examination allows us to describe the relationships of the mass to surrounding structures (although with less specificity than with MRI), to identify peritoneal localizations of disease and any lymph node and parenchymal metastases in the abdominal and extra-abdominal locations. Contrast-enhanced CT (CE-CT) has a reported staging accuracy for ovarian cancer of up to 94%, allowing a better prediction of successful surgical cytoreduction. It is important to emphasize the importance of identifying and describing all peritoneal localizations, firstly to assess the operability (or not) of the patient, and then for proper surgical planning. The most recent ESUR guidelines 2025 [10] highlight the importance of a structured report to describe disease locations not only at diagnosis but also in follow-up. In this way, the radiologist not only identifies and describes areas where disease is present, but also includes in the report the potential resectability or unresectability of disease sites that may limit successful R=0 after surgery, particularly in cases of mesentery root involvement, diffuse carcinomatosis on the surface of the small intestine (resection of which would result in short bowel syndrome), diffuse involvement/infiltration of the stomach, duodenum, head of the pancreas, and finally involvement of the celiac axis and its branches (celiac lymph nodes may be removed) [11,12,13].
2.3. MRI Imagingg
Although several US diagnostic scores that effectively stratify the risk of malignancy in ovarian lesions with high sensitivity and specificity have been reported in the literature (see Chapter 2.1), up to 30% of adnexal masses remain indeterminate on US, thereby posing significant challenges for treatment planning [14,15]. In this context, Magnetic Resonance Imaging (MRI) with contrast medium represents the imaging method of choice for the characterization of “indeterminate” ovarian lesions. In fact, MRI provides more accurate diagnoses of lesions that cannot be characterized on US, thereby reducing the level of suspicion and consequently the number of unnecessary surgeries on benign lesions in asymptomatic patients, achieving a PPV of 71% and a NPV of 98% and diagnostic accuracy values ranging from 83% to 93% for the diagnosis of malignancy [14,16,17,18,19]. In addition, the inherent high contrast resolution and the possibility to characterize tissues allows the better characterization of the lesion; this is compounded by the possibility, due to the method’s multiparametricity and multiplanarity, to investigate all portions of the lesion, some of which may not be ultrasound-investigable trans-vaginally and/or trans-abdominally [20]. MRI also plays a key role in the characterization of voluminous lesions of doubtful adnexal origin at US evaluation alone, which up to 10% of cases ultimately being of non-annexal relevance, and therefore reclassified [14].
As in ultrasound diagnosis, a common language has been sought in MRI characterization of adnexal masses that is reproducible, easily understandable, and comprehensive for describing adnexal masses and estimating their risk of malignancy. The first in this regard was the ADNEX-MR model proposed by Thomassin-Naggara et al in 2013 [21].
2.3.1. ADNEX-MR Scoring System
The aim of the “ADNEX-MR” Scoring System model is to build a reproducible preliminary validation method dedicated to the use of pelvic MR in the characterization of adnexal masses which resulted “indeterminate” at ultrasound evaluation. In this study, the Auhors made use of 1.5T MRI scanner with “phased-array” coils, after treatment of the patients with intravenous spasmolytic drug for better image resolution (in particular, glucagon), using the following protocol: axial and sagittal non-“fat-sat” T2 - TSE sequences, T1 gradient-echo sequences with and without fat saturation, DWI in the axial plane with b levels up to 1000 sec/mm2. Sequential T1 GRE perfusion sequences were acquired during IV administration of the contrast medium with a temporal resolution interval of 2.4 seconds for a total of 320 seconds, starting 10 seconds before contrast medium pier injection (2 ml/sec); finally a late axial or sagittal T1 gradient sequence. The purpose of the perfusion study was the comparison of myometrial enhancement with that of the solid tissue in the adnexal lesion. In this context, solid tissue is defined as the presence of vegetations, solid areas, or irregular thickening of the septa or walls [22]. Specifically, two ROIs (region of interest) were placed, one in the outer myometrium and the other in the portion of solid tissue with more enhancement, with the purpose of making a comparison between two time-signal curves. A gradual increase in the signal (enhancement) of solid tissue in the absence of a well-defined peak corresponds to a type 1 curve. A moderate initial increase in the solid tissue signal relative to that of the myometrium followed by a plateau is considered a type 2 curve. Finally, a type 3 curve is defined as such when the peak of solid tissue enhancement in the lesion is earlier and steeper than that of the myometrium.
Despite the many features analyzed during the evaluation of ovarian lesions, the criteria taken into consideration to classify ovarian lesions are as follows: presence or absence of solid tissue, solid tissue signal in T2w sequences and in diffusion (DWI) sequences, type of enhancement curve, and presence of peritoneal implants (Table 2).
According to the above-described ADNEX model, ovarian lesions can be classified with the following scores:
- Absence of ovarian lesions
- Benign lesions: lesions with homogeneous content (serous, blood, fat) and the absence of wall enhancement and/or with hypointense solid tissue signal in T2 sequences and at high b values
- Probably benign lesions: absence of solid tissue or solid tissue with type 1 enhancement curve
- Indeterminate lesions: presence of solid tissue with type 2 curve
- Likely malignant lesions: type 3 enhancement curve and presence of peritoneal implants
The ADNEX model was found to predict the risk of malignancy with more than 90% accuracy. According to the results obtained, the type 3 curve is the most predictive criterion for malignancy, along with the presence of irregular septa and peritoneal implants. Conversely, in Score 2, the risk of malignancy is extremely low (<2%) [21].
2.3.2. O-RADS MRI Score
The O-RADS (Ovarian-Adnexal Reporting and Data System) MRI score represents the most recent and widely accepted system for stratifying the risk of malignancy in ovarian lesions, developed by an international group of experts from various disciplines. By estimating the probability of malignancy in ovarian lesions, it aims to increase accuracy in the characterization of adnexal lesions, enhance interdisciplinary communication, and consequently promote optimal management in these patients [16]. The O-RADS MRI system represents an evolution of the ADNEX MR model [21] described in the previous paragraph, and it benefits from an overall diagnostic accuracy of 92%, associated with a sensitivity of 93% and specificity of 91%, PPV of 71% and NPV of 98% [14,15,23]. The first part of the O-RADS model building process involves the use of correct and standardized terminology. In this context, firstly a lesion is defined as a non-physiologic relief; then the features and definitions of iconographic findings are well distinguished, for instance the type of signal (homogeneous/inhomogeneous and hypointense/intermediate/hyperintense), the type of lesion (cystic/solid), the type of fluid (simple/hemorrhagic/proteinaceous/fat), solid components (papillary projections/mural nodules/irregular patches/solid portions) with solid tissue being defined as tissue exhibiting enhancement, non-solid tissue (clots/debris/fibrin/etc.), and so on. For a more comprehensive evaluation of terminology, please refer to the following articles [16,24].
Acquisition protocol
The examination protocol involves the acquisition of non-FS sagittal T2w sequences (≤ 4 mm), axial T2w sequences (≤ 3 mm), in-phase and out-phase T1-weighted sequences (≤ 4 mm), DWI in the axial plane (≤ 4 mm; b value > 1000 sec/mm2), and finally post-contrast T1-weighted sequences. In this regard, along the lines of the ADNEX model, a dynamic study (DCE) T1-weighted sequences characterized by a resolution time of 15 seconds and a slice thickness of 3 mm is proposed, with acquisition beginning 30 seconds after contrast medium injection and lasting for 4 minutes. This study allows calculation of signal/time curves by placing ROIs on the solid tissue of the lesion and on the myometrium, being careful not to place the latter on the vessels. Specifically, the signal/time curve can be of three types when compared with the myometrial curve (Figure 3):
- Type1(low risk): slower increase in signal intensity (enhancement) of solid tissue than that of the myometrium, without a peak or plateau
- Type 2 (intermediate risk): moderate initial increase in solid tissue signal with a slower or equal slope to that of the myometrial, followed by a plateau
- Type 3 (high risk): pronounced signal increase with an early peak compared with that of myometrium
In case a perfusion study (DCE with resolution < 15 sec) cannot be acquired, this can be replaced by acquiring an ultrafast grandient-eco at 30-40 sec after contrast injection (thickness ≤ 3 mm), thus allowing a different type of comparison with myometrium. Additionally, in patients who have undergone a hysterectomy, the radiologist can evaluate the morphology of the signal/intensity curve concerning the solid portions with contrast enhancement, taking into account the curve morphology (with or without a plateau).
CLASSIFICATION
O-RADS MRI Score 0
Lesions that cannot be properly evaluated on MRI examination fall into this category; for example, when some portions of the lesion are not included in the study volume, when all sequences could not be acquired, or when artifacts compromise the quality of the examination.
O-RADS MRI Score 1
Findings of normality. In premenopausal women, follicles, corpora lutea, and hemorrhagic cysts up to a maximum size of 3 cm are classified as O-RADS 1; therefore, these findings are not considered pathological. In postmenopausal women, some follicles may still be present in the ovarian parenchyma, and if the radiologist defines these findings in the “normal range”, they will also receive a score of 1, thus not considering them lesions.
O-RADS MRI Score 2 (risk of malignancy < 0.5%)
In both pre- and postmenopausal women, it is important to apply this score only in those formations considered to be lesions, as follows:
Unilocular cystic lesions with homogeneous fluid content, without wall enhancement and without solid tissue
- Unilocular cysts with uncomplicated fluid or endometrioid content, with mild wall enhancement but without intracystic solid portions (e.g., endometrioma)
- Adipose-content lesions without intralesional solid tissue; in this case, the adipose tissue shows hyperintense signal in T2- and T1-weighted sequences, with signal drop in fat-sat sequences. It is necessary to distinguish Rokitansky nodule, which may show enhancement, from solid tissue (e.g., mature teratoma).
- Solid lesions with homogeneously hypointense signal both in T2w and DWI sequences at high b-values, regardless of the type of enhancement after mdc (e.g., ovarian fibroma)
- Fallopian tubes dilated by simple fluid, with mild and subtle wall enhancement in the absence of solid tissue
- Para-ovarian cysts at any type of fluid content, which may or may not show wall enhancement, without intralesional solid tissue.
O-RADS MRI Score 3 (risk of malignancy ≈ 5%)
- Unilocular cysts (proteinaceous/hemorrhagic/mucinous fluid content) with wall enhancement but without solid tissue
- Multilocular cysts at any type of fluid content, with thin septa that may show enhancement and absence of solid tissue
- Lesions with solid tissue (excluding solid lesions described in score 2) that show low-risk enhancement curve (type1).
- Fallopian tubes with non-simple fluid content, thickened walls, no solid tissue.
O-RADS MRI Score 4 (risk of malignancy ≈ 50%)
- Lesions with solid tissue (excluding solid lesions described in score 2) showing type 2 enhancement curve (intermediate risk; Figure 4)
- Solid lesions showing enhancement < myometrial at 30-40 seconds, if perfusion study is not available
- Lesions with lipid components and solid tissue with enhancement
O-RADS MRI Score 5 (risk of malignancy ≈ 90%)
- Lesions showing a type 3 enhancement curve (high risk)
- Solid lesions showing enhancement > myometrium at 30-40 seconds, if perfusion study is not available
- Lesions associated with the presence of peritoneal implants and/or secondary disease localization (Figure 5)
The primary advantage of the O-RADS MRI Score is the high NPV for malignancy (about 98%) in lesions classified as Score 2 or 3, thus allowing the radiologist to express himself or herself in those terms with a high degree of confidence [14]. Other strengths are the easily applicable and reproducible method, the lexicon, and the extensive validation in the clinical setting [23,25]. These improvements result in a reduction of unnecessary surgeries and improvement of therapeutic planning for suspected ovarian lesions, particularly in young premenopausal women who may benefit from conservative treatment. According to Thomassin-Nagarra et al. the majority of errors in O-RADS MRI grading are attributable to misinterpretation of solid tissue and incorrect determination of the mass’s origin [23].
3. New Perspectives and AI in Ovarian Cancer
3.1. O-RADS MRI/ADC Score
Several studies have attempted to implement the O-RADS MRI Score, particularly category 4, where the PPV range for malignancy is particularly wide (5-90%), highlighting the potential usefulness of the apparent diffusion coefficient (ADC) map of both cystic and solid components [26,27,28]. These studies have shown how the signal intensity in diffusion sequences, along with the corresponding values in ADC maps, can change the radiological classification according to the traditional O-RADS model. This adjustment allows the upgrading or downgrading of lesions between scores 3-4 and 4-5, thereby reducing the large variability inherent in category 4, as described in the “O-RADS MRI/ADC Score” proposed by Manganaro et al. [28]. This investigation also demonstrated a significant correlation between the values in the ADC map and the histologic variant of the tumor, in particular how the mean ADC values of borderline tumors are higher than in low-grade and high-grade serous carcinomas.
3.2. NON- CONTRAST- MRI Score
A retrospective study by Sahin et al [29] evaluated the possibility of characterizing and stratifying the malignancy risk of adnexal lesions without the aid of contrast medium perfusion. This was achieved by constructing a 5-point score based on morphologic and qualitative characteristics (DWI), redefining the term “solid tissue” as “tissue component showing intermediate signal in T2w sequences, low signal in T1w and diffusion restriction in DWI(ADC) sequences” (Table 3; Figure 6). The “Non-contrast MRI Score” model has proven to be a reliable and reproducible tool with high diagnostic accuracy (94.2 %), excellent levels of sensitivity (84.9 %) and specificity (95.9 %), and significant inter-reader agreement. It, therefore, potentially represents a viable alternative to the O-RADS MRI score in cases where contrast medium administration is not recommended, such as in cases of severe allergic reactions to gadolinium-based contrast medium, pregnancy status and severe nephropathy. The main limitation is the lack of external validation by a prospective, multicenter study; however, the latter is in an active phase and shows promising preliminary results.
3.3. PET-MRI
Although PET-MRI has been clinically available from a decade, its adoption remains limited compared to the widespread use of [18F] FDG PET-CT. This is due to a lack of standardised imaging protocols and workflow harmonisation, as well as costs, which hinder broader clinical use [10]. In ovarian cancer, PET-MRI has demonstrated a better diagnostic performance over PET-CT and diffusion-weighted MRI (DWI-MRI) in peritoneal staging at initial diagnosis (p = 0.001), though no significant difference was found after chemotherapy [30,31]. Preliminary evidence also supports PET-MRI’s utility in detecting recurrence of gynecologic malignancies; however improving diagnostic randomized studies are needed to fully define its added value in routine clinical practice [32].

Table 4.
Comparison of different imaging modalities in ovarian cancer.
| Modality | Main Uses | Sensitivity / Specificity | Strengths | Limitations |
|---|---|---|---|---|
| Transvaginal Ultrasound (TVUS) | First-line evaluation of adnexal masses. Assessment of morphology and vascularization. | Sensitivity: ~85% / Specificity: ~90% (for mass characterization) | Widely available, non-invasive, no radiation. High-resolution for pelvic organs. | Operator-dependent. Limited for staging and evaluation of peritoneal spread. |
| Computed Tomography (CT) | Staging (especially peritoneal, nodal, and distant metastases). Preoperative planning. | Sensitivity: ~70–85% / Specificity: ~90% (for staging) | Good overview of abdomen and pelvis. Useful for surgical planning and monitoring recurrence. | Limited soft tissue contrast. Poor detection of small peritoneal implants (<1 cm). |
| Magnetic Resonance Imaging (MRI) | Characterization of indeterminate masses. Local staging. Evaluation of complex cystic lesions. | Sensitivity: ~93% / Specificity: ~88–98% | Excellent soft tissue contrast. No radiation. Functional imaging (DWI) adds value in lesion analysis. | More expensive, time-consuming. Contraindicated in patients with certain implants. |
| FDG-PET/CT | Detection of recurrence, metastases. Useful in equivocal cases. | Sensitivity: ~80–95% / Specificity: ~90–95% (in recurrence) | Functional and anatomical data. High sensitivity in detecting active disease and distant spread. | Limited role in primary diagnosis. False positives in inflammation/endometriosis. Costly. |
| PET/MRI (emerging) | Research setting. Combines metabolic and high-resolution anatomic data. | Under investigation | Potentially best of both PET and MRI. Promising for advanced imaging and radiomic studies. | Limited availability. High cost. Not yet widely implemented in clinical practice. |
3.4. Artificial Intelligence (AI)
Artificial intelligence (AI) is taking an increasingly important role in medical diagnostics, including the imaging of ovarian cancer. This technology is used to improve the accuracy, speed, and efficiency of diagnostic processes, particularly in the analysis of medical images obtained by computed tomography (CT), magnetic resonance imaging (MRI), or ultrasound (US) [33]. It is now well known that high-grade serous carcinoma exhibit wide inter- and intra-tumoral heterogeneity from a genomic and molecular point of view, resulting from different spatial distribution of “subclones” and their different mutations and gene expression over time [34]. This statement is equally true in residual lesions after treatment, in relation to chemoresistance acquired after therapy [35]. Radiomics with machine-learning (ML) and deep-learning (DL) algorithms makes possible the assessment of different tissue microarchitectures, processing quantitative data on small tissue volumes and distinguishing different “microenvironments” and different molecular profiles in the lesion itself and in the different disease localizations [36,37,38,39]. Non-invasive analysis of tumour heterogeneity opens the door to the so-called “virtual biopsy”, which, in association with genomic, pathologic, clinical and laboratory variables, has the potential to improve the study of neoplasm evolution and identify the best therapeutic approach for patients.
The main areas in which AI is influencing ovarian cancer imaging include:
- Classification of lesions: although histopathological examination after biopsy is still considered the gold standard for discriminating benign from malignant lesions, deep learning algorithms (a subcategory of machine learning) can classify ovarian lesions as either benign or malignant with greater accuracy than traditional techniques used by radiologists. Li et al [40] described a radiomics model capable of differentiating malignant and benign ovarian lesions in CT images of about 143 patients. Good diagnostic accuracy has also been found in radiomics applied to MRI imaging, as described by Saida et al [41] and Wang et al [38]. In the latter study, DL algorithms were able to differentiate borderline ovarian lesions from malignant ones with higher accuracy than radiologists. Also in the field of ultrasonography recent studies have demonstrated levels of diagnostic accuracy by DL algorithms comparable to O-RADS-US and experienced sonographers [42,43].
- Prediction of genetic alterations: as already well known, in patients diagnosed with ovarian cancer it is critical to establish whether the BRCA-1 and BRCA-2 genes are mutated, since BRCA-mutated tumors are associated with increased chemosensitivity to platinum-based drugs resulting in increased PFS. [44] Despite Meier et al. found no significant correlation between radiomic features and BRCA mutational status [45], other authors were able to predict Ki-67 status by analyzing radiomic features derived from PET-CT images [46].
- Prediction of disease spread at diagnosis: AI can automate the process of image segmentation, i.e. the isolation and analysis of suspicious areas in medical images. This segmentation allows radiologists to focus more accurately and quickly on potentially pathological areas. In fact, although CE-CT is the gold standard for staging ovarian cancer, it has accuracy limitations in identifying small peritoneal implants (< 1 cm) and localizations in specific areas such as the small bowel and mesentery. In addition, lesions are often “unmeasurable” according to RECIST 1.1 criteria [47]. Several studies describe how AI can predict the presence of peritoneal carcinosis and lymph node metastasis in HGSOCs on both CT and MR imaging by integrating radiomics with both clinical and laboratory factors such as age and CA-125 blood-levels [48,49,50].
- Prediction of treatment response: the prediction of treatment response according to radiomics models deeply traces the analysis of the previously described intrinsic heterogeneity of the tumor and various microenvironments. It is evident that different “subclones” of tumor tissue exhibit varied responses to different drugs in relation to their histological and molecular features. Indeed, it has been shown that while the number of disease localizations at diagnosis correlates significantly with treatment response, there is no correlation between disease volume and therapy response [51]. Conversely, when combined with clinical and laboratory data, radiomic biomarkers have been found to accurately predict response to neoadjuvant chemotherapy (NACT) [51,52]. Similarly, some studies based on ML and DL algorithms seem to be able to predict the probability of platinum-resistance of high-grade serous carcinoma [36,53]. Consequently, even in post-NACT imaging re-evaluations, any residual tumor and/or new disease localization can be accurately characterized by describing the microarchitecture and estimating the “subclone” of origin. The same applies to patients who are candidates for immunotherapy, in whom reduced intratumoral heterogeneity seems to be associated with better response [54].
- Prediction of Risk of Recurrence: Several studies have focused on estimating progression-free survival (PFS) and overall survival (OS) in order to identify patients at higher risk of recurrence [55]. Some studies have demonstrated a significant relationship between radiomic features in CT imaging and OS, specifically showing that lower tumor heterogeneity values are associated with higher OS [45,56]. Similarly, other studies have examined the relationship between CT radiomic features of ovarian masses [57,58] and peritoneal implants [56] and PFS, which has also been found to correlate with tissue heterogeneity. Rizzo et al. [57] demonstrated that three radiomic variables—specifically, the gray level run length matrix (GLRLM), 3D morphological features, and the gray level co-occurrence matrix (GLCM)—are significantly associated with disease progression at 12 months. According to Zagari et al., among the variables considered in their study that significantly correlated with PFS, shape and density appeared to have the strongest correlation [59]. Furthermore, high tumor tissue heterogeneity values have been associated with a higher risk of incomplete surgical resection (R≠0) in non-BRCA-mutated patients [45]. Conversely, Vargas et al. reported that lower heterogeneity values were associated with greater surgical resectability [56] and, consequently, with higher OS and PFS values [5]. The integration of PET radiomic features with CT features, in addition to clinical variables, further improves prognostic accuracy compared to models based solely on CT imaging [60]. Even in the context of MRI imaging, a nomogram based on radiomic features derived from MRI images, combined with clinical variables, has shown a good ability to identify patients at risk of disease recurrence [61].
- Integration with Other Data Sources: AI can combine information from different diagnostic modalities (e.g., imaging, clinical history and laboratory results) to provide a more comprehensive and precise overview of the patient’s condition. As previously mentioned, most of the studies cited have incorporated alongside imaging features clinical variables such as age, FIGO stage, serum CA-125 levels, and the presence of residual tumor. The integration of such data into ML and DL algorithms is essential for obtaining more accurate information and achieving higher levels of diagnostic precision (Figure 7).
The primary limitation of AI-based assessments is the lack of standardization and reproducibility [33]. Currently, different AI models are being used with various software and without standardized acquisition protocols. Radiomic variables vary significantly due to factors such as imaging quality, tumor location, and the technology employed; therefore, AI must be capable of handling this variability to be effective in diverse clinical settings.
Additionally, the "black box" nature of certain neural networks can make it challenging to interpret how the algorithm arrives at a specific conclusion. Other limiting factors include costs, processing time, and the current need for manual adjustments, which hinder the AI integration into clinical practice. Consequently, despite advancements, the adoption of AI in ovarian cancer imaging still requires clinical validation and close supervision by healthcare professionals. AI should be used as a decision-support tool rather than a replacement for human clinical judgment.
4. Conclusions
Ovarian cancer is one of the most common and severe gynecologic malignancies, with high global prevalence and mortality rates. Imaging in ovarian cancer is rapidly evolving with the integration of advanced technologies such as artificial intelligence. The potential of AI in medical image analysis provides significant advantages in improving early diagnosis, staging, and treatment personalization. However, further research and development are needed to overcome current challenges and ensure the safe and effective adoption of AI in clinical practice.
Conflicts of Interest
The authors declare no conflicts of interest.
Abbreviations
| OC | Ovarian cancer |
| US | Ultrasound |
| CT | Computed Tomography |
| MRI | Magnetic Resonance Imaging |
| ROI | Region Of Interest |
| PPV | Positive Predictive Value |
| NPV | Negative Predictive Value |
| PET | Positron Emission Tomography |
| AI | Artificial Intelligence |
| ML | Machine Learning |
| DL | Deep Learning |
| PFS | Progression-Free Survival |
| OS | Overall Survival |
References
- Tavares, V.; Marques, I.S.; Melo, I.G.D.; Assis, J.; Pereira, D.; Medeiros, R. Paradigm Shift: A Comprehensive Review of Ovarian Cancer Management in an Era of Advancements. Int. J. Mol. Sci. 2024, 25, 1845. [Google Scholar] [CrossRef]
- Zhu, B.; Gu, H.; Mao, Z.; Beeraka, N.M.; Zhao, X.; Anand, M.P.; et al. Global burden of gynaecological cancers in 2022 and projections to 2050. J. Glob. Health 2024, 14, 04155. [Google Scholar] [CrossRef]
- Armstrong, D.K.; Alvarez, R.D.; Bakkum-Gamez, J.N.; Barroilhet, L.; Behbakht, K.; Berchuck, A.; et al. NCCN Guidelines Insights: Ovarian Cancer, Version 1.2019. J. Natl. Compr. Canc Netw. 2019, 17, 896–909. [Google Scholar] [CrossRef] [PubMed]
- González-Martín, A.; Harter, P.; Leary, A.; Lorusso, D.; Miller, R.E.; Pothuri, B.; et al. Newly diagnosed and relapsed epithelial ovarian cancer: ESMO Clinical Practice Guideline for diagnosis, treatment and follow-up. Ann. Oncol. 2023, 34, 833–848. [Google Scholar] [CrossRef] [PubMed]
- Fagotti, A.; Ferrandina, M.G.; Vizzielli, G.; Pasciuto, T.; Fanfani, F.; Gallotta, V.; et al. Randomized trial of primary debulking surgery versus neoadjuvant chemotherapy for advanced epithelial ovarian cancer (SCORPION-NCT01461850). Int. J. Gynecol. Cancer 2020, 30, 1657–1664. [Google Scholar] [CrossRef]
- Andreotti, R.F.; Timmerman, D.; Strachowski, L.M.; Froyman, W.; Benacerraf, B.R.; Bennett, G.L.; et al. O-RADS US Risk Stratification and Management System: A Consensus Guideline from the ACR Ovarian-Adnexal Reporting and Data System Committee. Radiology 2020, 294, 168–185. [Google Scholar] [CrossRef]
- Timmerman, D.; Van Calster, B.; Testa, A.; Savelli, L.; Fischerova, D.; Froyman, W.; et al. Predicting the risk of malignancy in adnexal masses based on the Simple Rules from the International Ovarian Tumor Analysis group. Am. J. Obstet. Gynecol. 2016, 214, 424–437. [Google Scholar] [CrossRef]
- Cherukuri, S.; Jajoo, S.; Dewani, D. The International Ovarian Tumor Analysis-Assessment of Different Neoplasias in the Adnexa (IOTA-ADNEX) Model Assessment for Risk of Ovarian Malignancy in Adnexal Masses. Cureus, 2022. [Google Scholar] [CrossRef]
- Andreotti, R.F.; Timmerman, D.; Benacerraf, B.R.; Bennett, G.L.; Bourne, T.; Brown, D.L.; et al. Ovarian-Adnexal Reporting Lexicon for Ultrasound: A White Paper of the ACR Ovarian-Adnexal Reporting and Data System Committee. J. Am. Coll. Radiol. 2018, 15, 1415–1429. [Google Scholar] [CrossRef] [PubMed]
- Rizzo, S.; Avesani, G.; Panico, C.; Manganaro, L.; Gui, B.; Lakhman, Y.; et al. Ovarian cancer staging and follow-up: Updated guidelines from the European Society of Urogenital Radiology female pelvic imaging working group. Eur. Radiol. 2025. [Google Scholar] [CrossRef]
- Shinagare, A.B.; Sadowski, E.A.; Park, H.; Brook, O.R.; Forstner, R.; Wallace, S.K.; et al. Ovarian cancer reporting lexicon for computed tomography (CT) and magnetic resonance (MR) imaging developed by the SAR Uterine and Ovarian Cancer Disease-Focused Panel and the ESUR Female Pelvic Imaging Working Group. Eur. Radiol. 2022, 32, 3220–3235. [Google Scholar] [CrossRef] [PubMed]
- Avesani, G.; Panico, C.; Nougaret, S.; Woitek, R.; Gui, B.; Sala, E. ESR Essentials: Characterisation and staging of adnexal masses with MRI and CT—Practice recommendations by ESUR. Eur. Radiol. 2024. [Google Scholar] [CrossRef]
- Fischerova, D.; Pinto, P.; Burgetova, A.; Masek, M.; Slama, J.; Kocian, R.; et al. Preoperative staging of ovarian cancer: Comparison between ultrasound, CT and whole-body diffusion-weighted MRI ( ISAAC study). Ultrasound Obstet. Gynecol. 2022, 59, 248–262. [Google Scholar] [CrossRef]
- Thomassin-Naggara, I.; Poncelet, E.; Jalaguier-Coudray, A.; Guerra, A.; Fournier, L.S.; Stojanovic, S.; et al. Ovarian-Adnexal Reporting Data System Magnetic Resonance Imaging (O-RADS MRI) Score for Risk Stratification of Sonographically Indeterminate Adnexal Masses. JAMA Netw. Open 2020, 3, e1919896. [Google Scholar] [CrossRef]
- Rizzo, S.; Cozzi, A.; Dolciami, M.; Del Grande, F.; Scarano, A.L.; Papadia, A.; et al. O-RADS MRI: A Systematic Review and Meta-Analysis of Diagnostic Performance and Category-wise Malignancy Rates. Radiology 2023, 307, e220795. [Google Scholar] [CrossRef]
- Sadowski, E.A.; Thomassin-Naggara, I.; Rockall, A.; Maturen, K.E.; Forstner, R.; Jha, P.; et al. O-RADS MRI Risk Stratification System: Guide for Assessing Adnexal Lesions from the ACR O-RADS Committee. Radiology 2022, 303, 35–47. [Google Scholar] [CrossRef] [PubMed]
- Allen, B.C.; Hosseinzadeh, K.; Qasem, S.A.; Varner, A.; Leyendecker, J.R. Practical Approach to MRI of Female Pelvic Masses. Am. J. Roentgenol. 2014, 202, 1366–1375. [Google Scholar] [CrossRef] [PubMed]
- Medeiros, L.R.; Freitas, L.B.; Rosa, D.D.; Silva, F.R.; Silva, L.S.; Birtencourt, L.T.; et al. Accuracy of magnetic resonance imaging in ovarian tumor: A systematic quantitative review. Am. J. Obstet. Gynecol. 2011, 204, e1–e67. [Google Scholar] [CrossRef]
- Bazot, M.; Daraï, E.; Nassar-Slaba, J.; Lafont, C.; Thomassin-Naggara, I. Value of Magnetic Resonance Imaging for the Diagnosis of Ovarian Tumors: A Review. J. Comput. Assist. Tomogr. 2008, 32, 712–723. [Google Scholar] [CrossRef]
- Forstner, R.; Thomassin-Naggara, I.; Cunha, T.M.; Kinkel, K.; Masselli, G.; Kubik-Huch, R.; et al. ESUR recommendations for MR imaging of the sonographically indeterminate adnexal mass: An update. Eur. Radiol. 2017, 27, 2248–2257. [Google Scholar] [CrossRef]
- Thomassin-Naggara, I.; Aubert, E.; Rockall, A.; Jalaguier-Coudray, A.; Rouzier, R.; Daraï, E.; et al. Adnexal Masses: Development and Preliminary Validation of an MR Imaging Scoring System. Radiology 2013, 267, 432–443. [Google Scholar] [CrossRef]
- Timmerman, D.; Valentin, L.; Bourne, T.H.; Collins, W.P.; Verrelst, H.; Vergote, I. Terms, definitions and measurements to describe the sonographic features of adnexal tumors: A consensus opinion from the International Ovarian Tumor Analysis (IOTA) group. Ultrasound Obstet. Gynecol. 2000, 16, 500–505. [Google Scholar] [CrossRef] [PubMed]
- Thomassin-Naggara, I.; Belghitti, M.; Milon, A.; Abdel Wahab, C.; Sadowski, E.; Rockall, A.G.; et al. O-RADS MRI score: Analysis of misclassified cases in a prospective multicentric European cohort. Eur. Radiol. 2021, 31, 9588–9599. [Google Scholar] [CrossRef]
- Reinhold, C.; Rockall, A.; Sadowski, E.A.; Siegelman, E.S.; Maturen, K.E.; Vargas, H.A.; et al. Ovarian-Adnexal Reporting Lexicon for MRI: A White Paper of the ACR Ovarian-Adnexal Reporting and Data Systems MRI Committee. J. Am. Coll. Radiol. 2021, 18, 713–729. [Google Scholar] [CrossRef]
- Thomassin-Naggara, I.; Dabi, Y.; Florin, M.; Saltel-Fulero, A.; Manganaro, L.; Bazot, M.; et al. O-RADS MRI SCORE: An Essential First-Step Tool for the Characterization of Adnexal Masses. J. Magn. Reson. Imaging 2024, 59, 720–736. [Google Scholar] [CrossRef]
- Assouline, V.; Dabi, Y.; Jalaguier-Coudray, A.; Stojanovic, S.; Millet, I.; Reinhold, C.; et al. How to improve O-RADS MRI score for rating adnexal masses with cystic component? Eur. Radiol. 2022, 32, 5943–5953. [Google Scholar] [CrossRef]
- Hottat, N.A.; Van Pachterbeke, C.; Vanden Houte, K.; Denolin, V.; Jani, J.C.; Cannie, M.M. Magnetic resonance scoring system for assessment of adnexal masses: Added value of diffusion-weighted imaging including apparent diffusion coefficient map. Ultrasound Obstet. Gynecol. 2021, 57, 478–487. [Google Scholar] [CrossRef] [PubMed]
- Manganaro, L.; Ciulla, S.; Celli, V.; Ercolani, G.; Ninkova, R.; Miceli, V.; et al. Impact of DWI and ADC values in Ovarian-Adnexal Reporting and Data System (O-RADS) MRI score. Radiol Med (Torino) 2023, 128, 565–577. [Google Scholar] [CrossRef]
- Sahin, H.; Panico, C.; Ursprung, S.; Simeon, V.; Chiodini, P.; Frary, A.; et al. Non-contrast MRI can accurately characterize adnexal masses: A retrospective study. Eur. Radiol. 2021, 31, 6962–6973. [Google Scholar] [CrossRef]
- Tsuyoshi, H.; Tsujikawa, T.; Yamada, S.; Okazawa, H.; Yoshida, Y. Diagnostic value of [18F]FDG PET/MRI for staging in patients with ovarian cancer. EJNMMI Res. 2020, 10, 117. [Google Scholar] [CrossRef] [PubMed]
- Schwenzer, N.F.; Schmidt, H.; Gatidis, S.; Brendle, C.; Müller, M.; Königsrainer, I.; et al. Measurement of apparent diffusion coefficient with simultaneous MR/positron emission tomography in patients with peritoneal carcinomatosis: Comparison with 18F-FDG-PET. J. Magn. Reson. Imaging 2014, 40, 1121–1128. [Google Scholar] [CrossRef] [PubMed]
- Larson, M.; Lovrec, P.; Sadowski, E.A.; Pirasteh, A. PET/MRI in Gynecologic Malignancy. Radiol. Clin. North. Am. 2023, 61, 713–723. [Google Scholar] [CrossRef]
- Panico, C.; Avesani, G.; Zormpas-Petridis, K.; Rundo, L.; Nero, C.; Sala, E. Radiomics and Radiogenomics of Ovarian Cancer. Radiol. Clin. North. Am. 2023, 61, 749–760. [Google Scholar] [CrossRef]
- Wang, Y.; Xie, H.; Chang, X.; Hu, W.; Li, M.; Li, Y.; et al. Single-Cell Dissection of the Multiomic Landscape of High-Grade Serous Ovarian Cancer. Cancer Res. 2022, 82, 3903–3916. [Google Scholar] [CrossRef]
- Nath, A.; Cosgrove, P.A.; Mirsafian, H.; Christie, E.L.; Pflieger, L.; Copeland, B.; et al. Evolution of core archetypal phenotypes in progressive high grade serous ovarian cancer. Nat. Commun. 2021, 12, 3039. [Google Scholar] [CrossRef]
- Veeraraghavan, H.; Vargas, H.; Jimenez-Sanchez, A.; Micco, M.; Mema, E.; Lakhman, Y.; et al. Integrated Multi-Tumor Radio-Genomic Marker of Outcomes in Patients with High Serous Ovarian Carcinoma. Cancers 2020, 12, 3403. [Google Scholar] [CrossRef]
- Weigelt, B.; Vargas, H.A.; Selenica, P.; Geyer, F.C.; Mazaheri, Y.; Blecua, P.; et al. Radiogenomics Analysis of Intratumor Heterogeneity in a Patient With High-Grade Serous Ovarian Cancer. JCO Precis Oncol 2019, 1–9. [Google Scholar] [CrossRef]
- Wang, Y.; Lin, W.; Zhuang, X.; Wang, X.; He, Y.; Li, L.; et al. Advances in artificial intelligence for the diagnosis and treatment of ovarian cancer (Review). Oncol. Rep. 2024, 51, 46. [Google Scholar] [CrossRef]
- Hatamikia, S.; Nougaret, S.; Panico, C.; Avesani, G.; Nero, C.; Boldrini, L.; et al. Ovarian cancer beyond imaging: Integration of AI and multiomics biomarkers. Eur. Radiol. Exp. 2023, 7, 50. [Google Scholar] [CrossRef] [PubMed]
- Li, S.; Liu, J.; Xiong, Y.; Pang, P.; Lei, P.; Zou, H.; et al. A radiomics approach for automated diagnosis of ovarian neoplasm malignancy in computed tomography. Sci. Rep. 2021, 11, 8730. [Google Scholar] [CrossRef] [PubMed]
- Saida, T.; Mori, K.; Hoshiai, S.; Sakai, M.; Urushibara, A.; Ishiguro, T.; et al. Diagnosing Ovarian Cancer on MRI: A Preliminary Study Comparing Deep Learning and Radiologist Assessments. Cancers 2022, 14, 987. [Google Scholar] [CrossRef]
- Gao, Y.; Zeng, S.; Xu, X.; Li, H.; Yao, S.; Song, K.; et al. Deep learning-enabled pelvic ultrasound images for accurate diagnosis of ovarian cancer in China: A retrospective, multicentre, diagnostic study. Lancet Digit. Health 2022, 4, e179–87. [Google Scholar] [CrossRef]
- Chen, H.; Yang, B.-W.; Qian, L.; Meng, Y.-S.; Bai, X.-H.; Hong, X.-W.; et al. Deep Learning Prediction of Ovarian Malignancy at US Compared with O-RADS and Expert Assessment. Radiology 2022, 304, 106–113. [Google Scholar] [CrossRef]
- Buys, S.S. Effect of Screening on Ovarian Cancer Mortality: The Prostate, Lung, Colorectal and Ovarian (PLCO) Cancer Screening Randomized Controlled Trial. JAMA 2011, 305, 2295. [Google Scholar] [CrossRef]
- Meier, A.; Veeraraghavan, H.; Nougaret, S.; Lakhman, Y.; Sosa, R.; Soslow, R.A.; et al. Association between CT-texture-derived tumor heterogeneity, outcomes, and BRCA mutation status in patients with high-grade serous ovarian cancer. Abdom. Radiol. 2019, 44, 2040–2047. [Google Scholar] [CrossRef]
- Wang, X.; Xu, C.; Grzegorzek, M.; Sun, H. Habitat radiomics analysis of pet/ct imaging in high-grade serous ovarian cancer: Application to Ki-67 status and progression-free survival. Front. Physiol. 2022, 13, 948767. [Google Scholar] [CrossRef] [PubMed]
- Coakley, F.V.; Choi, P.H.; Gougoutas, C.A.; Pothuri, B.; Venkatraman, E.; Chi, D.; et al. Peritoneal Metastases: Detection with Spiral CT in Patients with Ovarian Cancer. Radiology 2002, 223, 495–499. [Google Scholar] [CrossRef] [PubMed]
- Song, X.-L.; Ren, J.-L.; Yao, T.-Y.; Zhao, D.; Niu, J. Radiomics based on multisequence magnetic resonance imaging for the preoperative prediction of peritoneal metastasis in ovarian cancer. Eur. Radiol. 2021, 31, 8438–8446. [Google Scholar] [CrossRef]
- Yu, X.Y.; Ren, J.; Jia, Y.; Wu, H.; Niu, G.; Liu, A.; et al. Multiparameter MRI Radiomics Model Predicts Preoperative Peritoneal Carcinomatosis in Ovarian Cancer. Front. Oncol. 2021, 11, 765652. [Google Scholar] [CrossRef]
- Ai, Y.; Zhang, J.; Jin, J.; Zhang, J.; Zhu, H.; Jin, X. Preoperative Prediction of Metastasis for Ovarian Cancer Based on Computed Tomography Radiomics Features and Clinical Factors. Front. Oncol. 2021, 11, 610742. [Google Scholar] [CrossRef] [PubMed]
- Crispin-Ortuzar, M.; Woitek, R.; Reinius, M.A.V.; Moore, E.; Beer, L.; Bura, V.; et al. Integrated radiogenomics models predict response to neoadjuvant chemotherapy in high grade serous ovarian cancer. Nat. Commun. 2023, 14, 6756. [Google Scholar] [CrossRef] [PubMed]
- Rundo, L.; Beer, L.; Escudero Sanchez, L.; Crispin-Ortuzar, M.; Reinius, M.; McCague, C.; et al. Clinically Interpretable Radiomics-Based Prediction of Histopathologic Response to Neoadjuvant Chemotherapy in High-Grade Serous Ovarian Carcinoma. Front. Oncol. 2022, 12, 868265. [Google Scholar] [CrossRef]
- Yi, X.; Liu, Y.; Zhou, B.; Xiang, W.; Deng, A.; Fu, Y.; et al. Incorporating SULF1 polymorphisms in a pretreatment CT-based radiomic model for predicting platinum resistance in ovarian cancer treatment. Biomed. Pharmacother. 2021, 133, 111013. [Google Scholar] [CrossRef]
- Himoto, Y.; Veeraraghavan, H.; Zheng, J.; Zamarin, D.; Snyder, A.; Capanu, M.; et al. Computed Tomography–Derived Radiomic Metrics Can Identify Responders to Immunotherapy in Ovarian Cancer. JCO Precis Oncol 2019, 1–13. [Google Scholar] [CrossRef]
- Rizzo, S.; Manganaro, L.; Dolciami, M.; Gasparri, M.L.; Papadia, A.; Del Grande, F. Computed Tomography Based Radiomics as a Predictor of Survival in Ovarian Cancer Patients: A Systematic Review. Cancers 2021, 13, 573. [Google Scholar] [CrossRef] [PubMed]
- Vargas, H.A.; Veeraraghavan, H.; Micco, M.; Nougaret, S.; Lakhman, Y.; Meier, A.A.; et al. A novel representation of inter-site tumour heterogeneity from pre-treatment computed tomography textures classifies ovarian cancers by clinical outcome. Eur. Radiol. 2017, 27, 3991–4001. [Google Scholar] [CrossRef]
- Rizzo, S.; Botta, F.; Raimondi, S.; Origgi, D.; Buscarino, V.; Colarieti, A.; et al. Radiomics of high-grade serous ovarian cancer: Association between quantitative CT features, residual tumour and disease progression within 12 months. Eur. Radiol. 2018, 28, 4849–4859. [Google Scholar] [CrossRef]
- Wei, W.; Liu, Z.; Rong, Y.; Zhou, B.; Bai, Y.; Wei, W.; et al. A Computed Tomography-Based Radiomic Prognostic Marker of Advanced High-Grade Serous Ovarian Cancer Recurrence: A Multicenter Study. Front. Oncol. 2019, 9, 255. [Google Scholar] [CrossRef]
- Zargari, A.; Du, Y.; Heidari, M.; Thai, T.C.; Gunderson, C.C.; Moore, K.; et al. Prediction of chemotherapy response in ovarian cancer patients using a new clustered quantitative image marker. Phys. Med. Biol. 2018, 63, 155020. [Google Scholar] [CrossRef] [PubMed]
- Wang, X.; Lu, Z. Radiomics Analysis of PET and CT Components of 18F-FDG PET/CT Imaging for Prediction of Progression-Free Survival in Advanced High-Grade Serous Ovarian Cancer. Front. Oncol. 2021, 11, 638124. [Google Scholar] [CrossRef]
- Li, C.; Wang, H.; Chen, Y.; Fang, M.; Zhu, C.; Gao, Y.; et al. A Nomogram Combining MRI Multisequence Radiomics and Clinical Factors for Predicting Recurrence of High-Grade Serous Ovarian Carcinoma. J. Oncol. 2022, 2022, 1–13. [Google Scholar] [CrossRef] [PubMed]
Figure 1.
Ultrasound demonstrates a unilocular cyst with a “ground-glass” appearance, consistent with an endometrioma (a), and a lesion containing intralesional fat, typical of a dermoid (b); both representing classic benign ovarian lesions: O-RADS US score 2 (Courtesy of Dr. Gilda Di Paolo).
Figure 1.
Ultrasound demonstrates a unilocular cyst with a “ground-glass” appearance, consistent with an endometrioma (a), and a lesion containing intralesional fat, typical of a dermoid (b); both representing classic benign ovarian lesions: O-RADS US score 2 (Courtesy of Dr. Gilda Di Paolo).
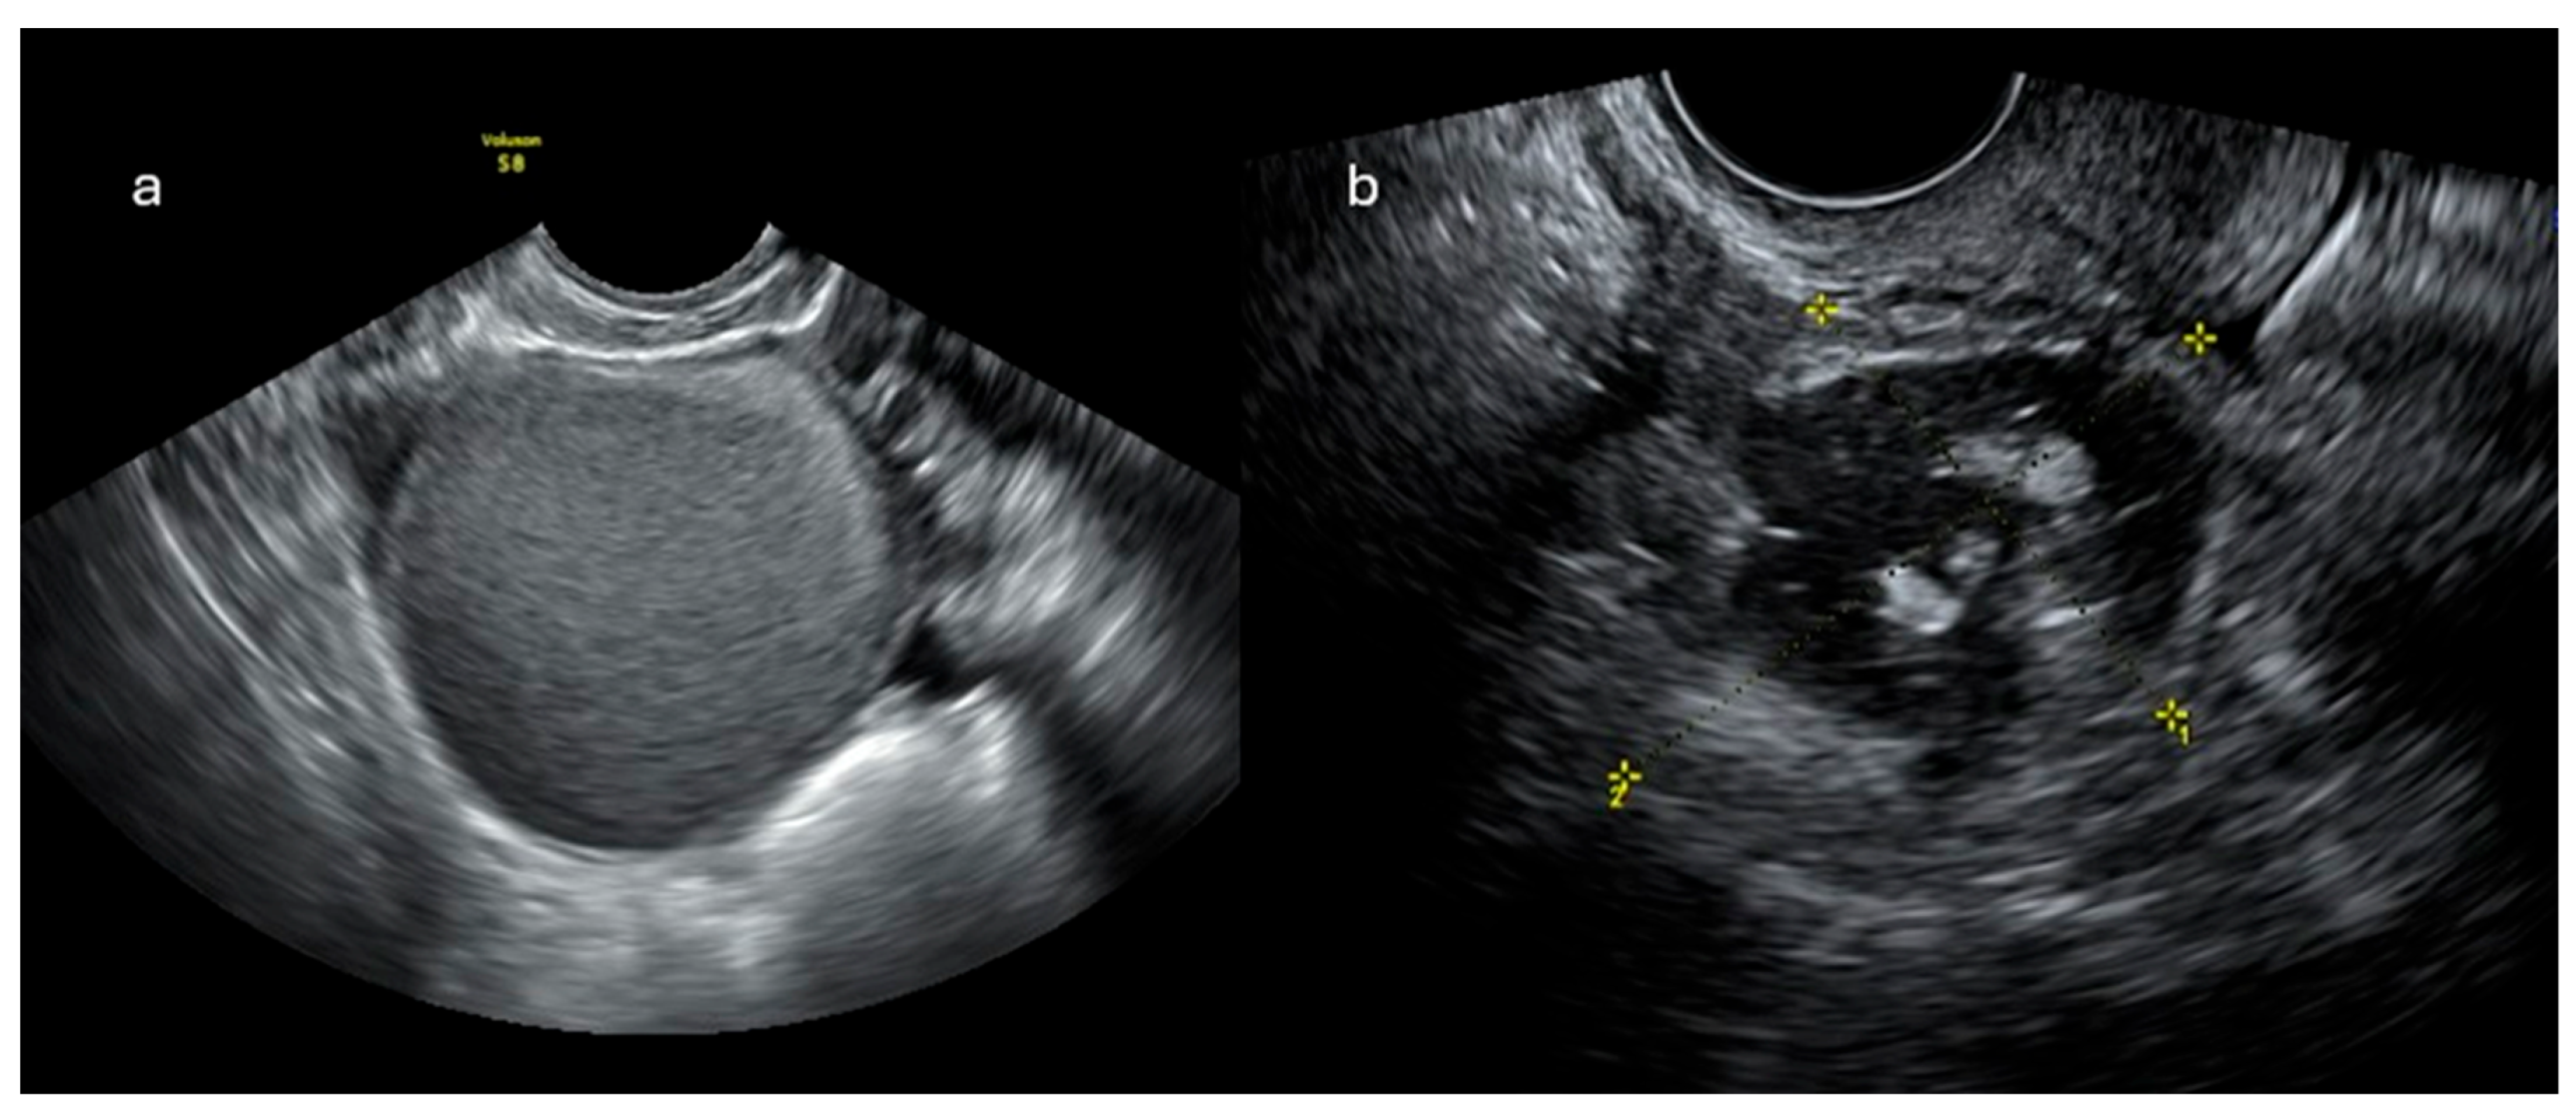
Figure 2.
Venous-phase CT staging of ovarian cancer (OC): multiplanar reconstructions (MPR) are mandatory for detecting peritoneal disease in the pelvis (a, c), the subphrenic space (d), and along the paracolic gutter (b, lower narrow). CT is also necessary for detection of suspicious lymph nodes (b, upper narrow).
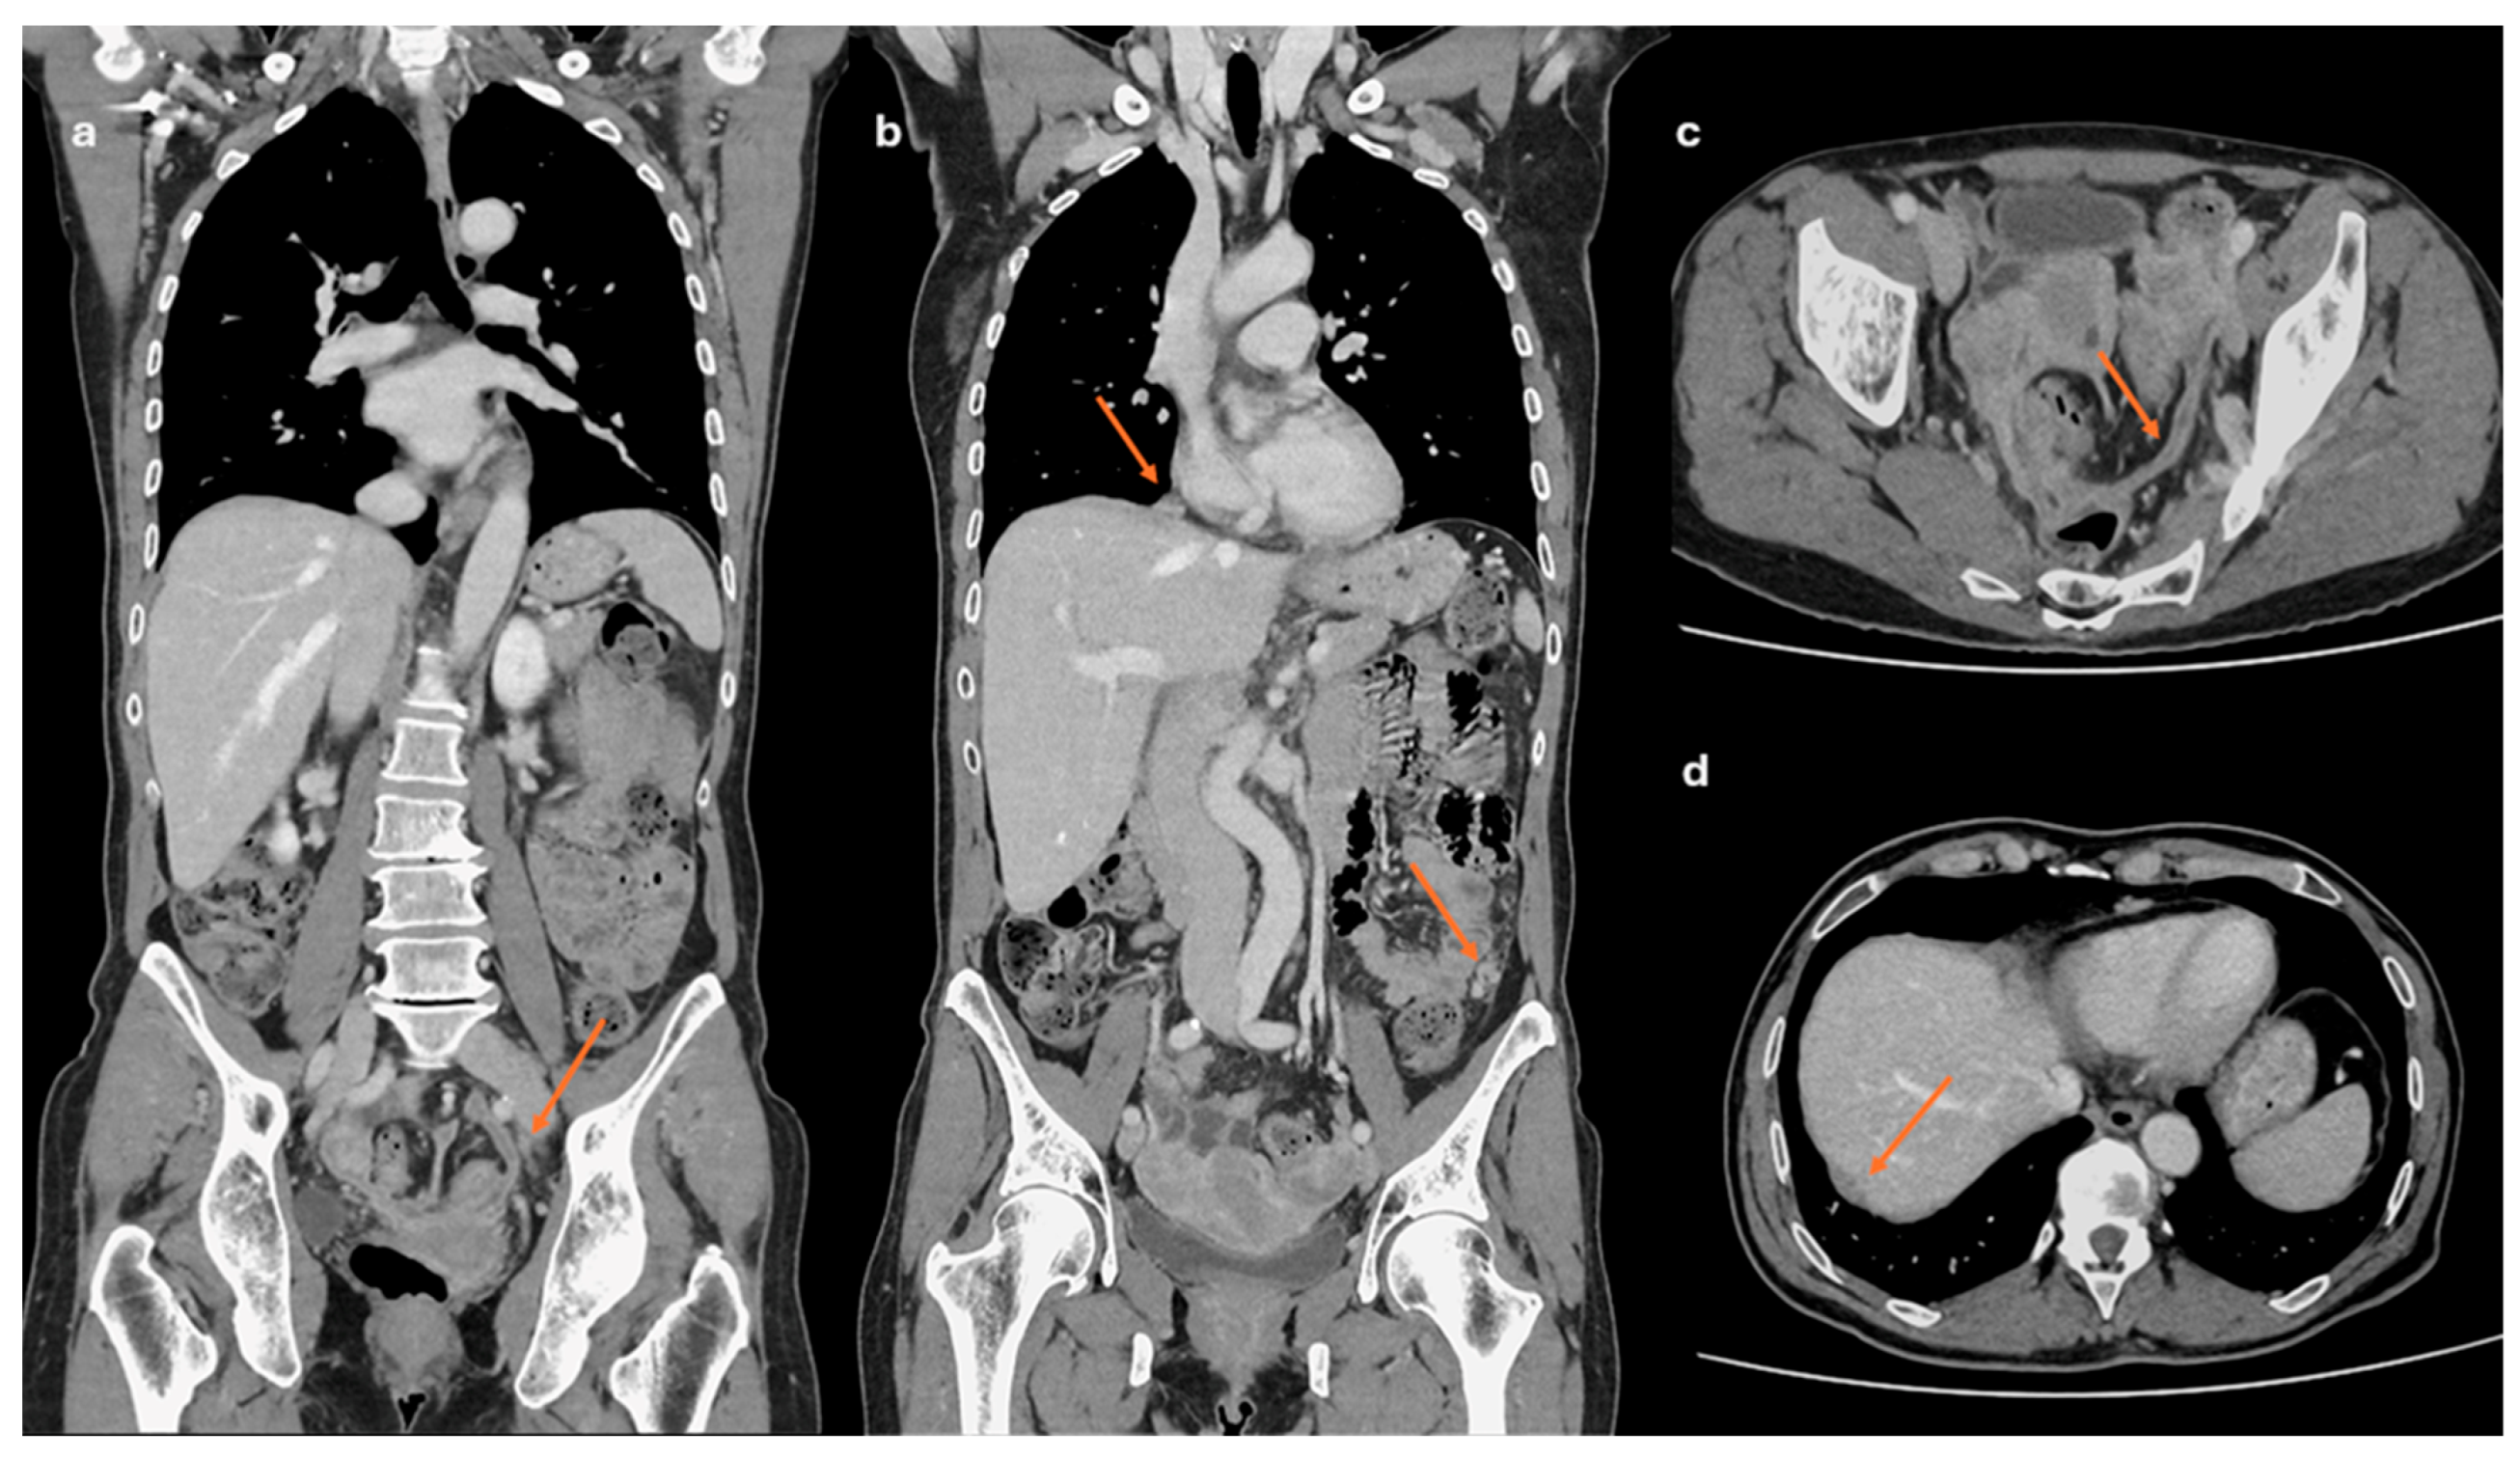
Figure 3.
Time-signal curves in the O-RADS model.
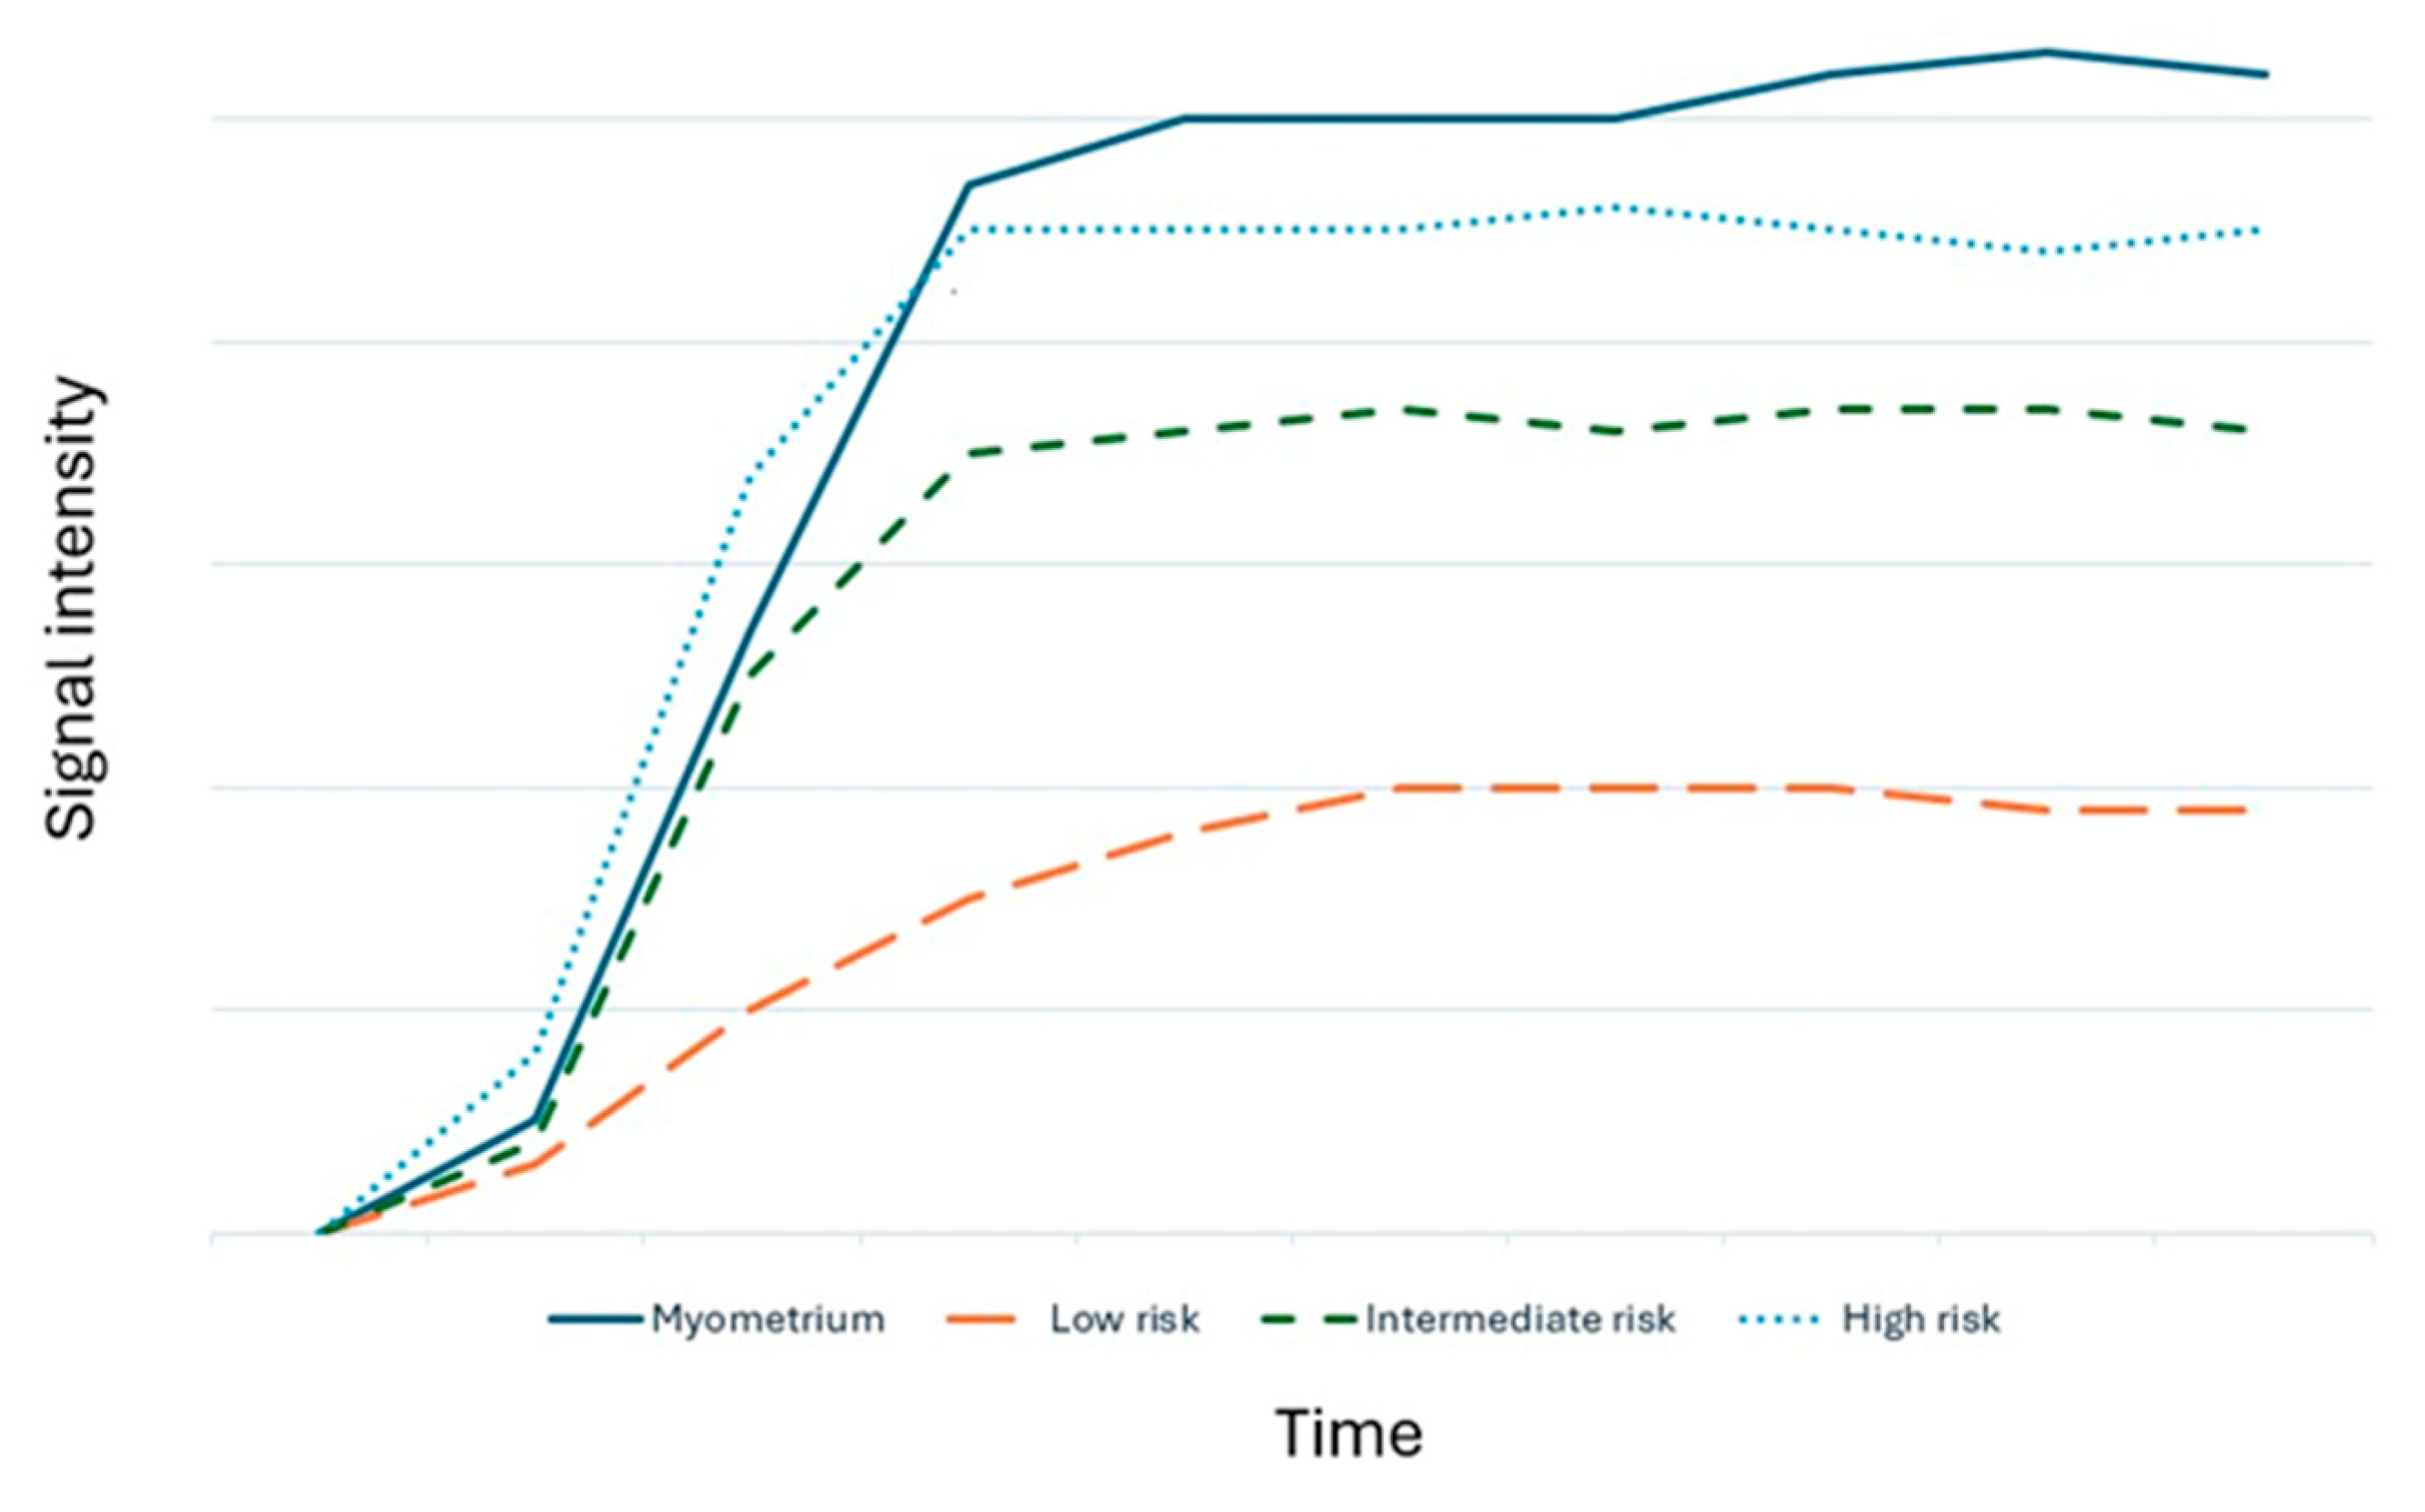
Figure 4.
Left adnexal multiloculated cystic mass (a-d), with different signal intensity of the fluid in the loculi, especially in T1w sequences. In DCE-perfusion ROI were placed in thickened septa and wall (e, orange and blue curves) and in the myometrium (e, pink curve). The lesion was classified as O-RADS MRI Score 4 and resulted in mucinous cystoadenofibroma.
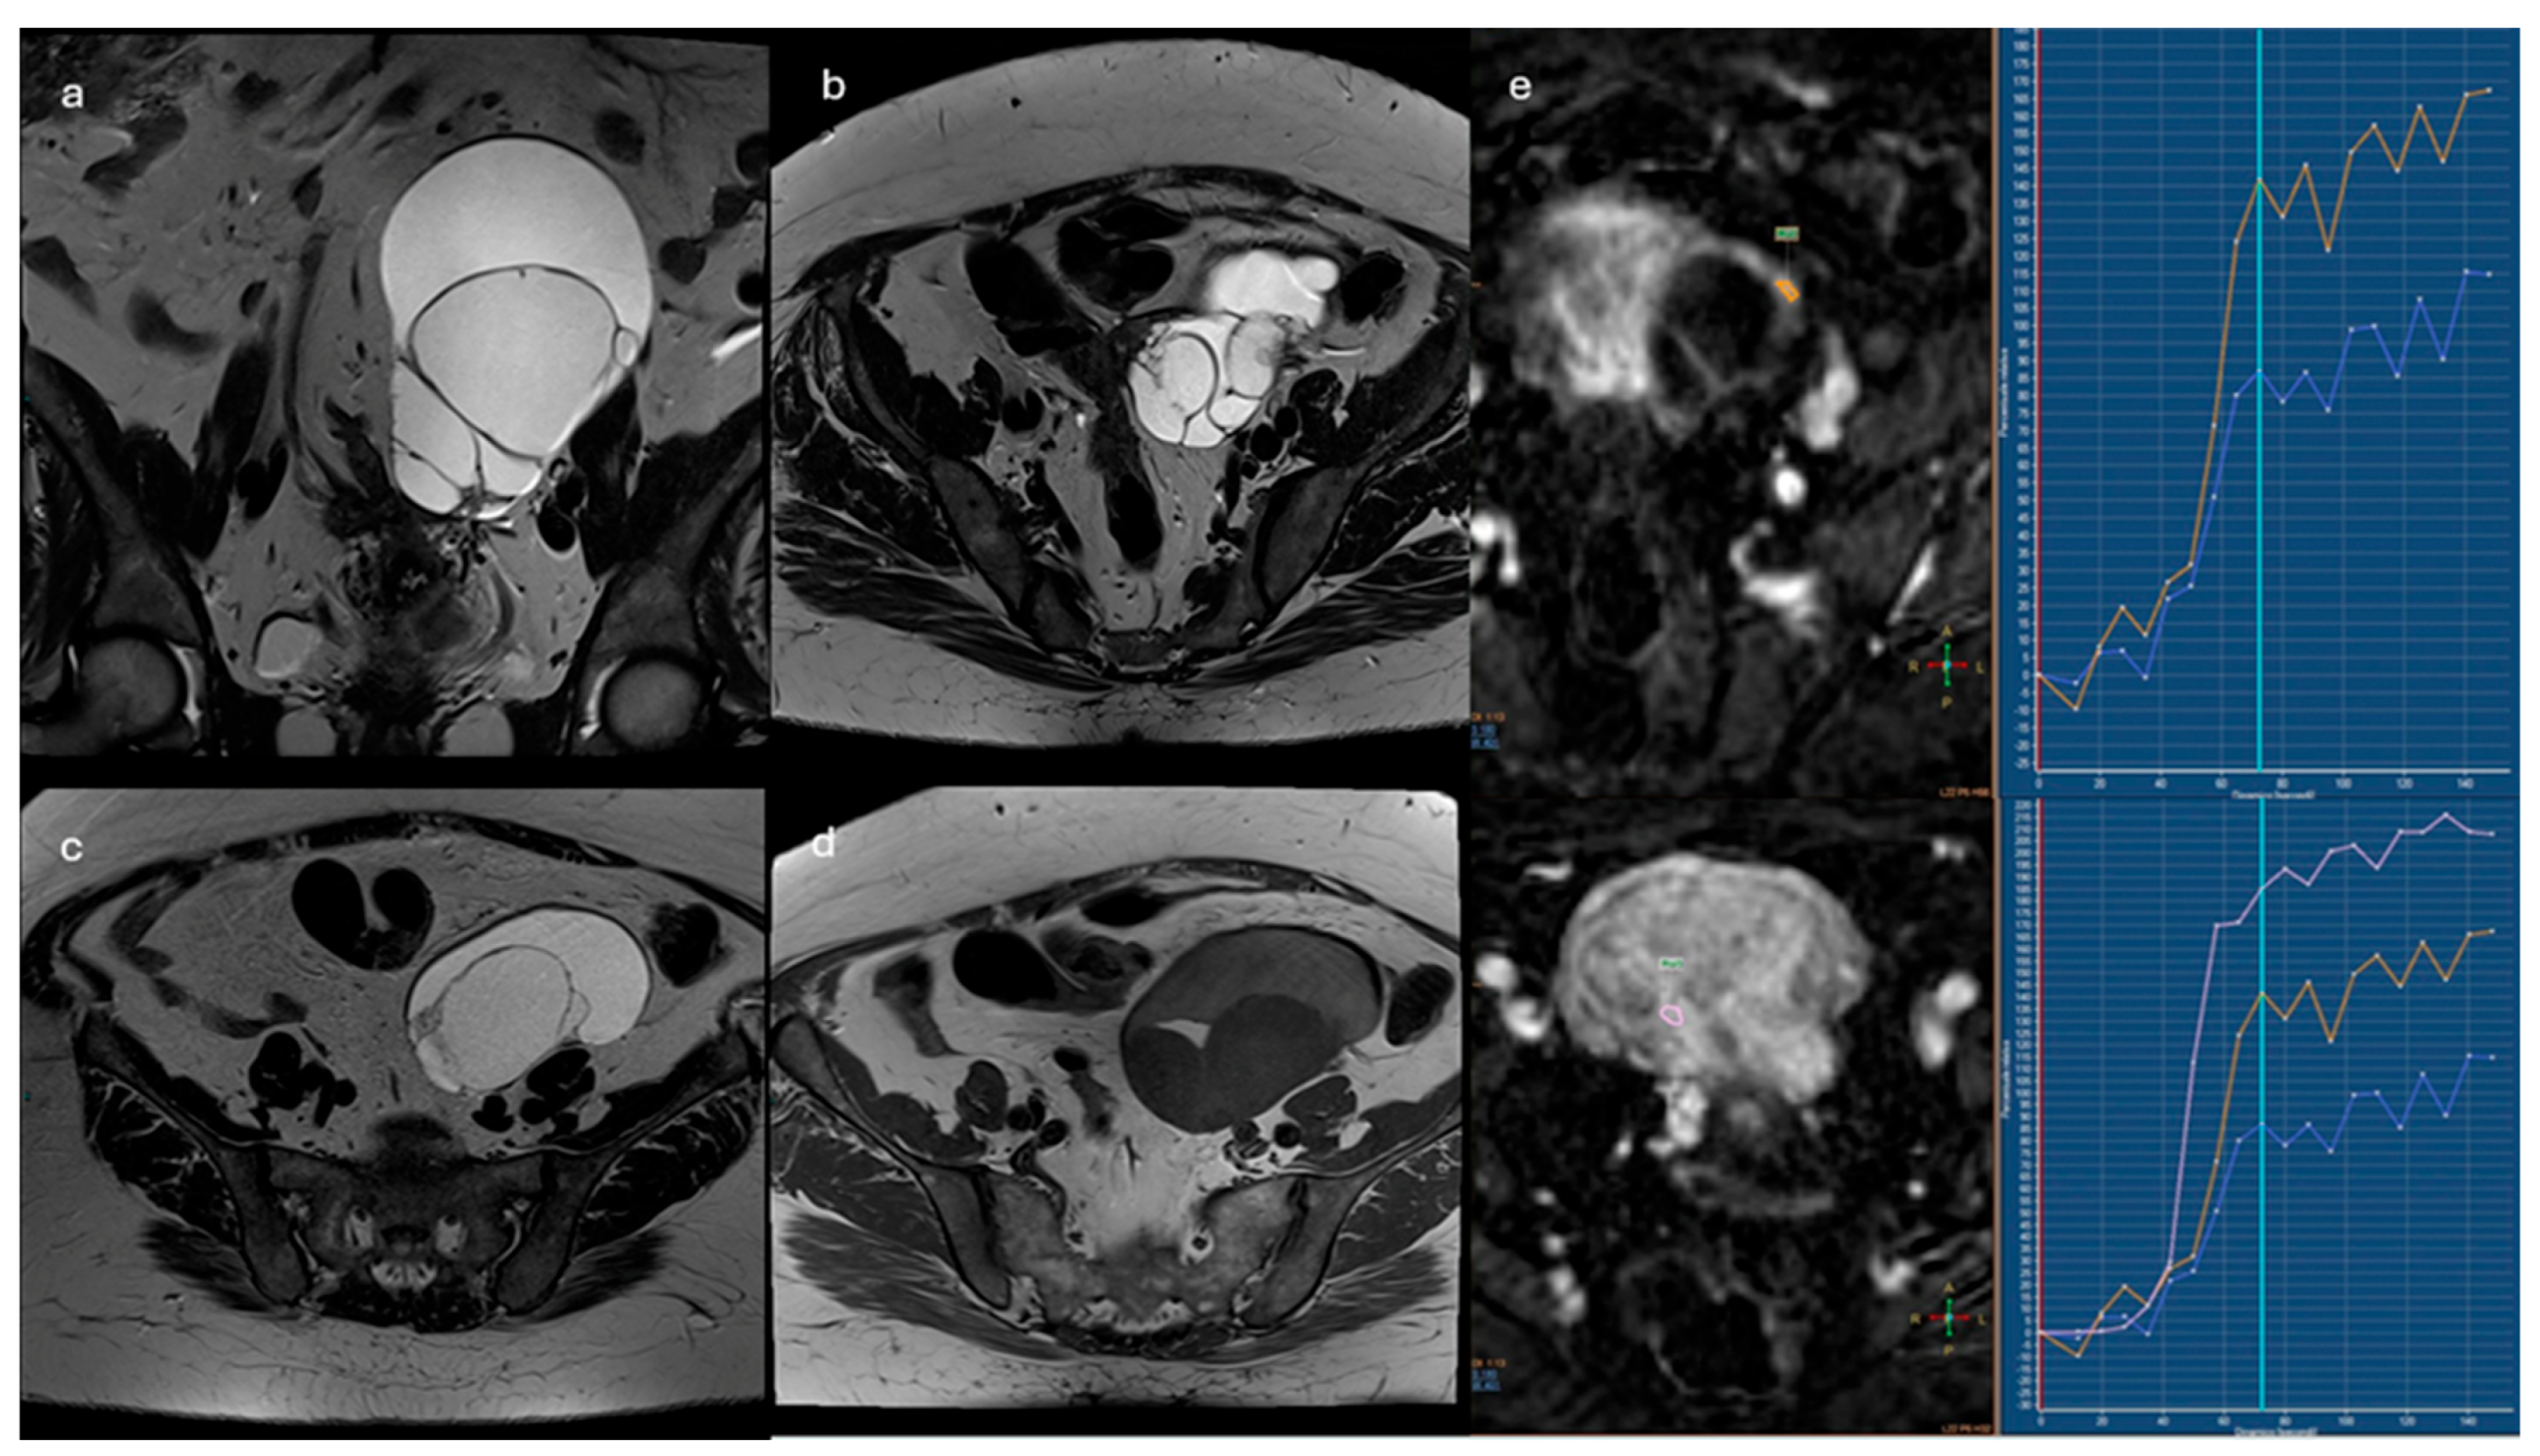
Figure 5.
Bilateral adnexal masses with solid and cystic components (a, b). In DCE-perfusion ROI were placed in two different sites of the solid tissue (c, orange and blue curves); the orange curve resulted “high risk curve” if compared to the curve of the myometrium (c, pink curve): O-RADS 5. The study was extended at the upper abdomen with DWI sequences, where peritoneal implants in subphrenic space were also detected (d, narrow).
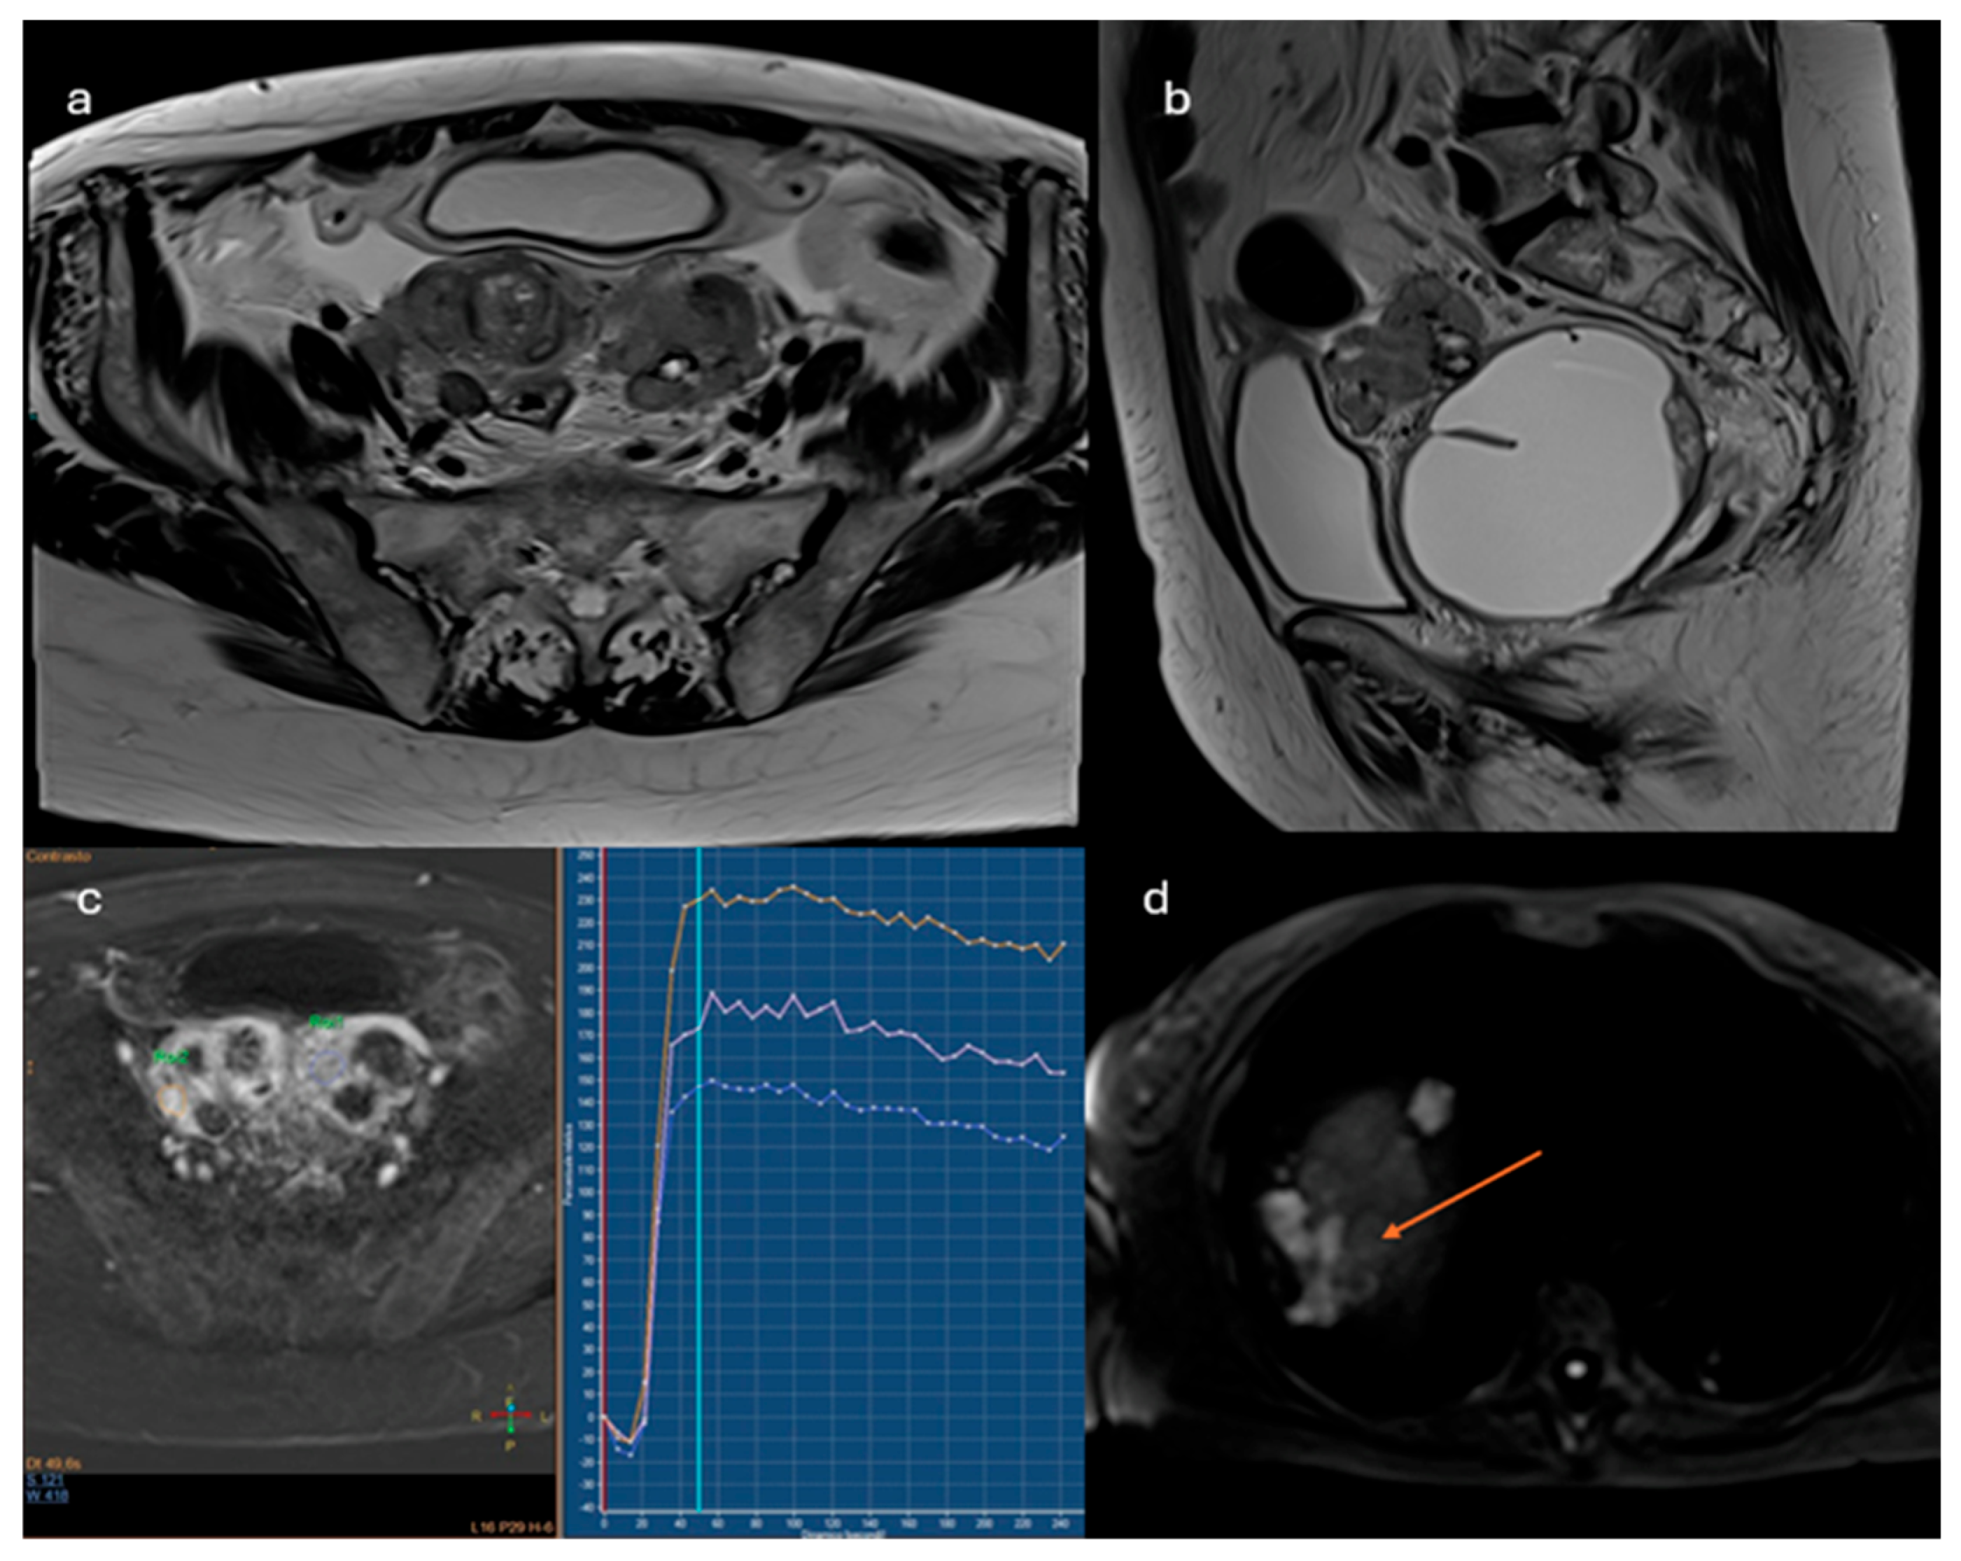
Figure 6.
MRI scan of the pelvis of Patient of IMG. 1. The solid tissue in adnexal region shows intermediate signal intensity on T2-weighted sequences (a) and signal restriction on diffusion imaging (b,c), such as the solid implants along the peritoneum and the pelvic wall. See also the ascites in T2 sequences (a). Non-contrast MRI score: 5.
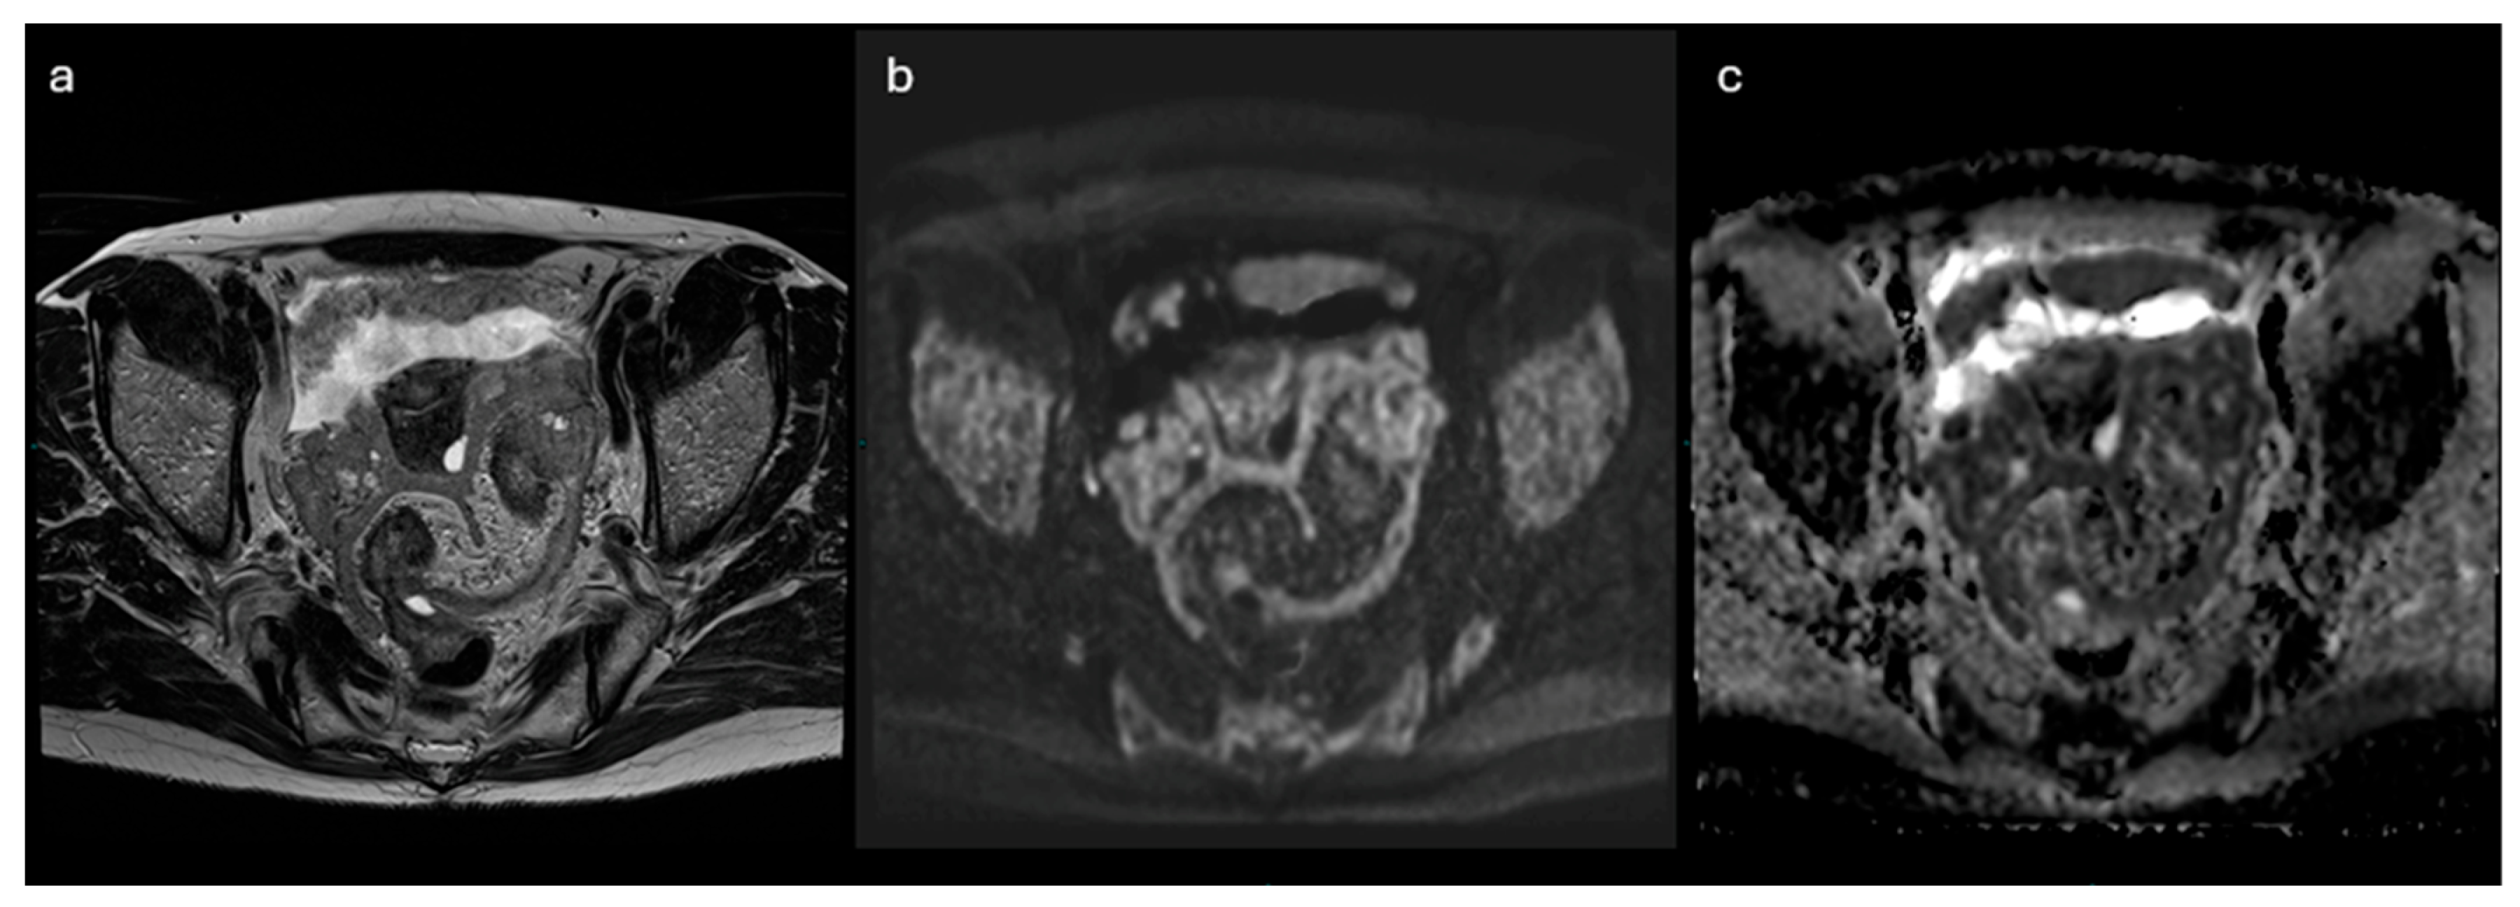
Figure 7.
AI can combine information from different data sources, achieving higher levels of accuracy to optimize the care of patients with ovarian cancer.
Figure 7.
AI can combine information from different data sources, achieving higher levels of accuracy to optimize the care of patients with ovarian cancer.
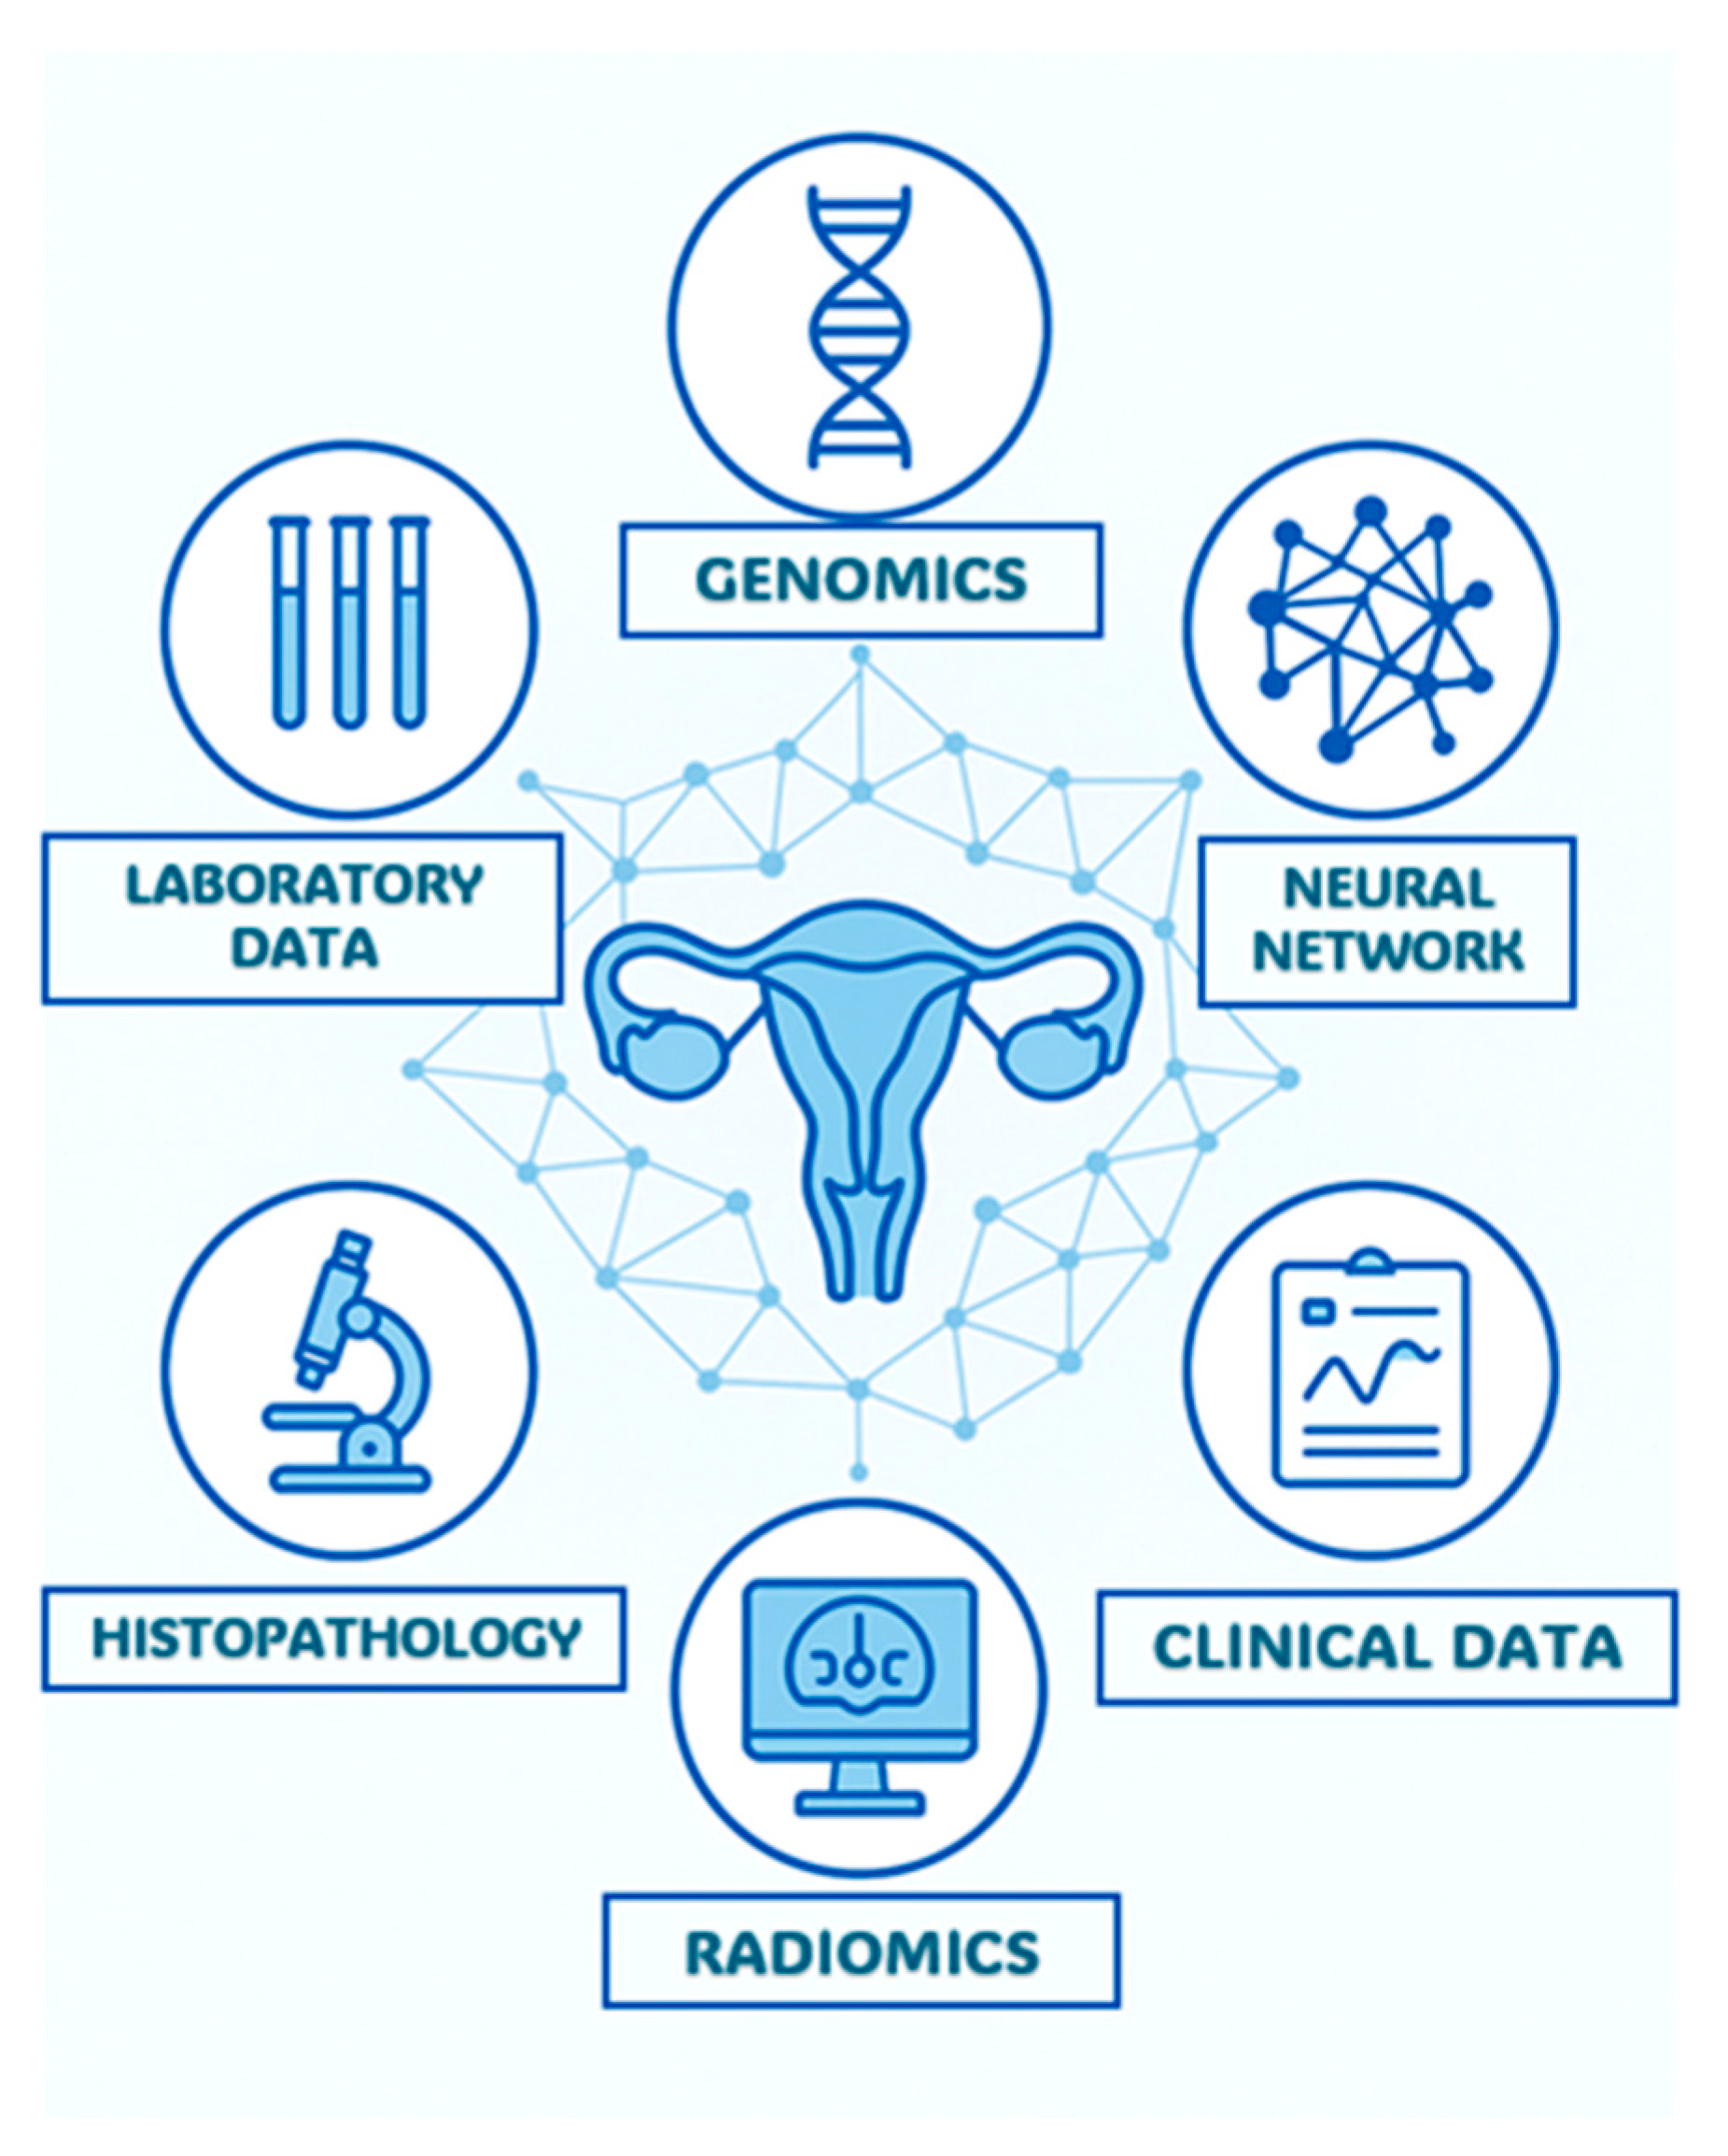
Table 1.
O-RADS US model.
| 0 | Incomplete Evaluation [N/A] | N/A |
|---|---|---|
| 1 | Normal Ovary [N/A] | Follicle defined as a simple cyst ≤ 3 cm; Corpus Luteum ≤ 3 cm |
| 2 | Almost Certainly Benign [<1%] | Simple cyst ≤ 3 cm |
| Simple cyst > 3 cm to 5 cm | ||
| Simple cyst > 5 cm but < 10 cm | ||
| Classic Benign Lesions (dermoid, endometrioma, etc…) | ||
| Non-simple unilocular cyst, smooth inner margin ≤ 3 cm | ||
| Non-simple unilocular cyst, smooth inner margin > 3 cm but < 10 cm | ||
| 3 | Low Risk Malignancy [1–<10%] | Unilocular cyst ≥ 10 cm (simple or non-simple) |
| Typical dermoid cysts, endometriomas, hemorrhagic cysts ≥ 10 cm | ||
| Unilocular cyst (any size) with irregular inner wall < 3 mm height | ||
| Multilocular cyst < 10 cm, smooth inner wall, CS = 1–3 | ||
| Solid smooth, any size, CS = 1 | ||
| 4 | Intermediate Risk [10–<50%] | Multilocular cyst, no solid component, ≥ 10 cm, smooth inner wall, CS = 1–3 |
| Multilocular cyst, no solid component, any size, smooth inner wall, CS = 4 | ||
| Multilocular cyst, no solid component, any size, irregular inner wall and/or irregular septation, any color score | ||
| Unilocular cyst with solid component, any size, 0–3 papillary projections, CS = any | ||
| Multilocular cyst with solid component, any size, CS = 1–2 | ||
| Solid smooth, any size, CS = 2–3 | ||
| 5 | High Risk [≥ 50%] | Unilocular cyst, any size, ≥ 4 papillary projections, CS = any |
| Multilocular cyst with solid component, any size, CS = 3–4 | ||
| Solid smooth, any size, CS = 4 | ||
| Solid irregular, any size, CS = any | ||
| Ascites and/or peritoneal nodules |
Table 2.
ADNEX-MR Scoring System model.
| ADNEX MR SCORE | Criteria |
|---|---|
| 1. No mass | No mass |
| 2. Benign mass | Purely cystic mass Purely endometriotic mass Purely fatty mass Absence of wall enhancement Low b = 1000 sec/mm2 – weighted and low T2-weighted signal intensity within solid tissue |
| 3. Probably benign mass | Absence of solid tissue Curve type 1 within solid tissue |
| 4. Indeterminate MR mass | Curve type 2 within solid tissue |
| 5. Probably malignant mass | Curve type 3 within solid tissue Peritoneal implants |
Table 3.
Non-Contrast MRI Score.
| Non-contrast MRI score | Definition | MRI features |
|---|---|---|
| Score 1 | No mass | No adnexal mass is demonstrated in pelvic MRI study |
| Score 2 | Benign/likely benign | Radiologically characterized with radiological diagnosis (e.g. endometrioma, dermoid, fibroma) |
| Score 3 | Indeterminate | Not classified in other scores; it may have a solid appearing component without reaching criteria for “solid tissue” |
| Score 4 | Suspicious for malignancy | Solid tissue criteria reached |
| Score 5 | Highly suspicious for malignancy | Solid tissue criteria reached and presence of - Peritoneal implants - Lymphadenopathy and/or - Ascites in the presence of solid tissue, after benign diagnoses are excluded |
Disclaimer/Publisher’s Note: The statements, opinions and data contained in all publications are solely those of the individual author(s) and contributor(s) and not of MDPI and/or the editor(s). MDPI and/or the editor(s) disclaim responsibility for any injury to people or property resulting from any ideas, methods, instructions or products referred to in the content. |
© 2025 by the authors. Licensee MDPI, Basel, Switzerland. This article is an open access article distributed under the terms and conditions of the Creative Commons Attribution (CC BY) license (http://creativecommons.org/licenses/by/4.0/).
Copyright: This open access article is published under a Creative Commons CC BY 4.0 license, which permit the free download, distribution, and reuse, provided that the author and preprint are cited in any reuse.


