Submitted:
08 September 2025
Posted:
09 September 2025
You are already at the latest version
Abstract
This article presents the architecture and functionality of a decision support system module designed for assessing climate risks of a region, based on a Large Language Model (LLM) enhanced with Retrieval-Augmented Generation (RAG) technology. In particular, the following are discussed: the RAG-based architecture, which serves as the system's primary component, the database required to store the information utilized by the language model and the user-friendly web interface. The functional capabilities of the system are illustrated and described via a use case diagram. The article also includes a quantitative and qualitative evaluation of the system's performance to generate accurate and relevant responses based on the content of the documents.
Keywords:
decision support system
; large language model
; retrieval-augmented generation
; information system
; database
; NLP evaluation metrics
; climate risks
; climate change adaptation
1. Introduction
In the context of climate change, there is an increase in the number of natural disasters and extreme natural events, which emphasizes the need to implement effective methodologies for climate risk assessment [1]. Software focused on analyzing and forecasting these risks is becoming more and more in demand. It helps to monitor changes in the environment and plan necessary adaptation measures. Such platforms usually include interactive maps that display current indicators used to assess different types of risks and are also capable of providing predictive information. One of the leading developers in the field of climate monitoring is the National Aeronautics and Space Administration (NASA), which has proposed tools such as the web application SOTO (State Of The Ocean) [2]. It allows users to explore satellite oceanographic data, updated daily, and to download data for use in their own research activities. Another example is the Sea Level Projection Tool [3], which visualizes sea level rise projections based on data from the Intergovernmental Panel on Climate Change until 2150. The U.S. National Oceanic and Atmospheric Administration offers similar tools [4]. Private companies are also developing software for climate risk monitoring and forecasting. These include IQAir, which provides air quality maps and forecasts for the coming week for cities around the world [5]. In addition, there are private organizations that develop specialized information systems for climate risk assessment aimed at use in specific client companies. This provides an opportunity for businesses to analyze the potential impact of climate change on economic activity [6].
However, there is a lack of such platforms providing up-to-date and reliable information in open access in Russia. This limits the ability to analyze climate risks at the level of individual regions and economic sectors. The creation of an information system for automated climate risk assessment could be an important step towards solving this problem.
2. Materials and Methods
The purpose of the research, the results of which are presented below, is to develop a decision support system module for climate risk assessment. The scientific and practical significance of the research results lies in the use of large language models (LLMs), enhanced with the technology of retrieval-augmented generation (RAG), to create a knowledge base of climate risks. This approach will significantly improve the quality of analyzing the consequences of climate risks, assess the potential damage and vulnerability of various objects and activities of economic entities, and develop strategies for adaptation to climate change.
A decision support system (DSS) is a tool designed to help the government make a decision under conditions of uncertainty and incomplete information due to complexity or large amounts of data [7]. The approach of functional augmentation of a large language model with RAG technology has been used to create the DSS module for climate risk assessment [8]. This architecture allows extending the model’s knowledge base by instantiating the generation of its answer in a narrow subject area [9].
The Python framework LlamaIndex, which provides convenient functionality for building RAG systems, was chosen as the basis for the system architecture [10]. It is distinguished from competitors in this area, such as LangChain and Haystack, by its ease of use, fast response time, high throughput and low cost efficiency [11]. The generation of responses in the RAG system is performed using a large language model, which is accessed through the Groq API [12]. The Groq service was chosen because of its high performance and low latency achieved through the LPU (Language Processing Unit) architecture [13].
To determine the best architecture of the RAG-system, a quantitative assessment of the semantic closeness of the answers generated by the models to 10 queries about the content of the order to the reference answers compiled by the authors was carried out. As an example, the following question can be asked: «What methodological recommendations are approved by the order of the Ministry of Economic Development of Russia dated 13.05.2021 N 267?». Example of a reference answer: «Order of the Ministry of Economic Development of Russia dated 13.05.2021 N 267 approved the following methodological recommendations: on assessing climate risks, on ranking adaptation measures by their priority, on forming sectoral, regional and corporate plans for adaptation to climate change».
To automate the generation quality assessment of the developing climate risk assessment module, a generative evaluation approach based on the use of NLP (Natural Language Processing) metrics is used [14]. These metrics involve evaluating the model by comparing responses with references previously compiled by an expert. Their use enables the automation of the process of comparing model responses independently and sequentially, reducing the time spent on selecting the optimal RAG system. This paper examines the BERTScore metric (Bidirectional Encoder Representations from Transformers Score), which pertains to metrics for evaluating generation quality. This metric is the most effective for the evaluation of the quality of a large language model, as it not only compares two responses but also assesses their semantic similarity, which is more representative in the case of generative models [15]. Within the framework of BERSTcore, contextual vector representations of words from pre-trained transformer models are used. The metric value is calculated by evaluating the semantic similarity between the generated response and the reference. BERTScore differs from other metrics that calculate overlapping n-grams by being more robust to paraphrasing and sensitive to semantic equivalence. This calculation allows for the computation of similarity at the token level, resulting in three criteria: precision (the proportion of relevant instances among the found ones), recall (the proportion of relevant instances that were found relative to the total number of relevant instances, considering only the top N search results), and F1 (the harmonic mean of precision and recall) [14]. Their values range from 0 to 1, where a value close to 0 indicates poor answer generation quality, while a value close to 1 indicates good quality. However, it is worth noting that values close to 1 may indicate model overfitting; therefore, such results are considered unsatisfactory [15].
Based on the available models presented by Groq, three of the largest language models were selected for comparison: Llama3-8b-8192 [16], Llama3-70b-8192 [17], Deepseek-r1-distill-llama-70b [18]. To determine the best word embedding model, BAAI/bge-m3 [19], intfloat-e5-large-v2 [20], and intfloat/multilingual-e5-large-instruct [21] were reviewed, as these models are the most commonly used for the creation of RAG systems and support the Russian language. The results of the experiments are presented in Figure 1.
Comparing responses for semantic similarity using BERTScore helped identify the high generative capabilities of the Llama3-70b-8192 model in combination with intfloat/multilingual-e5-large-instruct. This build has the highest values of all metrics: precision, recall, and f-score of 0.82, 0.83, and 0.82, respectively. However, the response generation by this language model is one of the longest in terms of time—on average 15.6 seconds. Llama3-8b-8192 with intfloat/multilingual-e5-large-instruct also shows good results: the metrics are slightly lower than the previous version (precision—0.78, recall—0.83, and f-score—0.81), and the average generation time is quite fast at 7.12 seconds.
These metrics suggest that using the large language model Llama3-8b-8192 ensures high-quality text generation and low response time to queries, making it the preferred choice for the given task.
Storing vectorized texts and performing semantic searches among them is provided by the FAISS library [22]. Unlike competitors such as ChromaDB and Qdrant, it provides faster semantic search, easily scales and utilizes a graphics processing unit (GPU) for computations, enhancing query execution efficiency [23].
The user interface was created using the Gradio library [24], which allows the quick launch of a web application for user access to the DSS. Its advantages include the convenience of the created interface, quick setup and launch, as well as free usage.
The knowledge base of the DSS module is supplemented by the file of the Order of the Ministry of Economic Development of Russia No. 267, dated 13 May 2021, On Approval of the Methodological Recommendations and Indicators on Adaptation to Climate Change [25]. This Order regulates the classification and assessment of natural phenomena and the actual damage resulting from the impact of such phenomena.
The reference materials in this document provide sufficient information to build a logical model of the climate risk database, which is the basis for systematizing information about natural disasters. The logical data model was created using the Erwin Data Modeler software in the IDEF1X notation. The resulting logical model is shown in Figure 2.
Seven entities have been identified: Territory, Actual Damage, Climate Factor, Threshold Value, Climate Risk, Type of Activity, and Risk Indicator. The relationships between entities are established using identifiers: for example, one climate factor contains several threshold values, and one threshold value contains only one factor. This approach allows for a reduction in the number of records and simplifies navigation between them [26].
The “Territory” table is designed to store information about administrative-territorial formations, containing fields for the territory identifier, territory name, susceptibility to climate risks (expressed as a percentage), and climate change forecast.
Information about the actual damage to the territory is stored as follows: damage identifier, foreign key—territory identifier, allowing reference to the “Territory” table and establishing a one-to-many relationship, year, intensity indicator and duration indicator, damage description, direct and indirect damage, liquidation costs, and non-economic losses.
The “Climate Factor” table reflects the hazardous climate factors related to the territory. The table contains fields for the climate factor identifier, a foreign key—territory identifier linking the “Territory” table with this one in a one-to-many relationship, the name of the climate factor, a description of vulnerability, and a description of risks associated with the climate factor.
For climate factors, threshold values are set according to the Order, contained in a separate table with fields for threshold value ID, duration, minimum value, and maximum value, as well as a foreign key—climate factor ID.
Climate risks, which describe specific consequences resulting from the impact of climate factors on a territory, are also included among climate factors. The “Climate Risk” table contains fields for the climate risk identifier, a foreign key for the climate factor identifier, the name of the climate risk, the consequences for economic activities, the level of danger, which is a categorical attribute, as well as a foreign key for the type of activity identifier.
The “Type of Activity” table contains information about economic activities that are affected by climate risks. The fields are the identifier and the name of the type of activity.
Climate risks are also characterized by specific numerical risk indicators. The information about them is stored as follows: risk indicator ID, foreign key—climate risk ID, risk indicator name, and its numerical value.
The built model allows for the systematization of data to assess the impact of climate risks on the territory, which is important for making management decisions in the field of climate policy.
3. Results
A use-case diagram provides detailed visualisation of the options for using the climate risk assessment system—this tool builds a schematic representation of the scenario of interaction with the system, showing the main users and their functions [27] (Figure 3).
The only user of the developed decision support system is an employee of the Department of subsoil use and ecology of the Tyumen region. This user may interact with the system in various ways, ranging from downloading weather data to obtaining recommendations for climate risk adaptation. The user has the ability to integrate data from external sources, as well as to change and manage data, which supports the maintenance of data relevance and completeness. Based on the uploaded data, the system analyses climate phenomena, assesses and classifies them by degree of impact, according to the Order, from dangerous to catastrophically dangerous. Based on the analysis, the decision support module produces adaptation measures to the identified risks, ranks them and proposes measures to reduce the impact of the existing risk. To save the results of the analysis, the user can download a report with all the characteristics obtained by the system, compiled according to the Order standard.
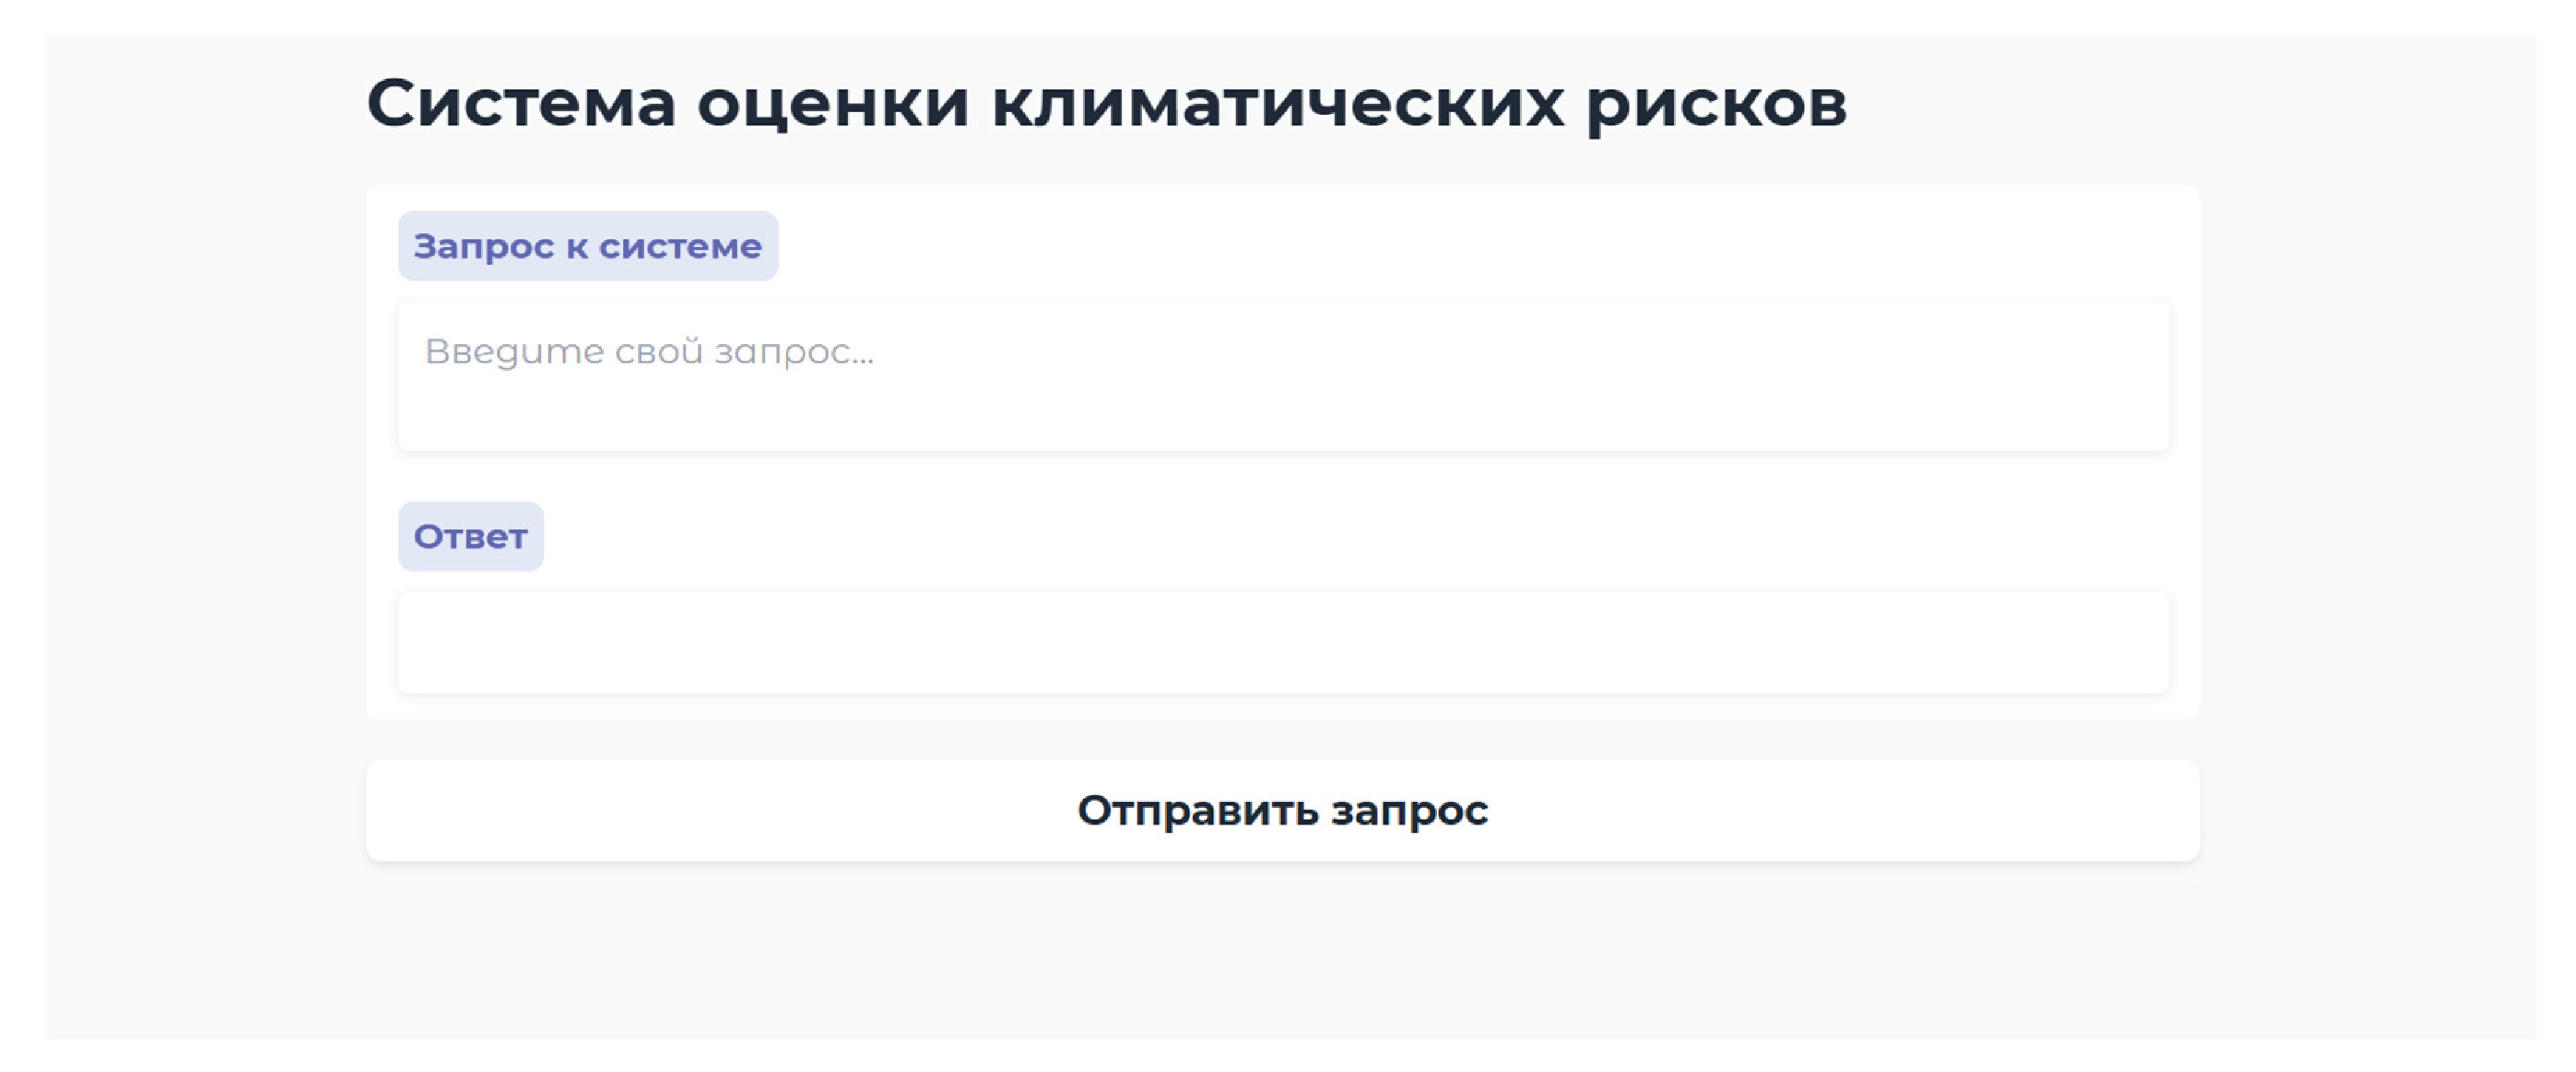
User interaction with the system is facilitated through a graphical user interface. Gradio, a Python-based framework, [28] is used for development, which enables customizing and distributing demo versions of web applications. The interface includes three main components: a field for entering a request, a window for displaying the system’s response, and a button for submitting the request. The main page of the web application is shown in Figure 4.
Given the current state of climate change, the accuracy of the model’s predictions related to monitoring and analyzing weather events is particularly important. In addition to providing access to up-to-date data, this system for automated climate risk assessment is a powerful tool for developing adaptation strategies. The introduction of neural network technologies permits a more accurate analysis of the effects of climate change.
4. Conclusions
This research has defined the architecture of the module of the decision support system for climate risk assessment of the subjects of the Russian Federation. It is based on a large language model that enables the generation of responses to user questions expressed in various formats. The retrieval augmented generation technology is used to add pre-selected information to the model’s knowledge base in order to expand the scope of its answers and avoid generating inaccurate or non-existent facts. The module vectorizes and indexes the document of the Order of the Ministry of Economic Development of Russia N 267, dated 13 May 2021, ‘On Approval of the Methodological Recommendations and Indicators on Adaptation to Climate Change’, after which the large language model can generate a response to the user’s query based on the most relevant vectors. The Order is also systematized using a relational database. The developed module allows user data to be integrated into the system, which is subsequently used for specialized analysis, assessment and the formulation of adaptation measures. The user interaction with the system is performed through a web application interface. In addition, the responses of the module are evaluated using the BERT group of NLP metrics, whose values indicate the high ability of the large language model to generate responses appropriate to the content of the Order. Thus, the developed module of the decision support system for climate risk assessment in Russia effectively combines modern natural language processing technologies and the use of a specialised knowledge base to ensure high quality and accuracy of the provided answers.
The research was supported by the Ministry of Science and Higher Education of the Russian Federation under the Tyumen Carbon Polygon Project (FEWZ-2024-0016).
References
- N. P. Simpson et al., “A framework for complex climate change risk assessment,” One Earth, vol. 4, no. 4, pp. 489–501, Apr. 2021. [CrossRef]
- NASA, “SOTO by Worldview,” nasa.gov. Accessed: Mar. 20, 2025. [Online]. Available online: https://soto.podaac.earthdatacloud.nasa.gov/.
- NASA, “Sea Level Projection Tool,” nasa.gov. Accessed: Mar. 19, 2025. [Online]. Available online: https://sealevel.nasa.gov/ipcc-ar6-sea-level-projection-tool#.
- NOAA, “Sea Level Rise Viewer,” coast.noaa.gov. Accessed: Mar. 19, 2025. [Online]. Available online: https://coast.noaa.gov/slr/#.
- IQAir, “Animated real-time air quality map,” iqair.com. Accessed: Mar. 22, 2025. [Online]. Available online: https://www.iqair.com/ru/air-quality-map.
- J. Ni et al., “CHATREPORT: Democratizing Sustainability Disclosure Analysis through LLM-based Tools,” 2023. arXiv:2307.15770.
- I.N. Glukhikh, T. Y. Chernysheva, and Y. A. Shentsov, “Decision support in a smart greenhouse using large language model with retrieval augmented generation,” in Proc. Third Int. Conf. Digital Technologies, Optics, and Materials Science (DTIEE 2024), Bukhara, Jul. 2024. [CrossRef]
- B. Ramdurai, “Large Language Models (LLMs), Retrieval-Augmented Generation (RAG) systems, and Convolutional Neural Networks (CNNs) in Application systems,” Int. J. Marketing and Technology, vol. 15, no. 01, Jan. 2025. [Online]. Available online: https://www.ijmra.us/project%20doc/2025/IJMT_JANUARY2025/IJMT1Jan2025.pdf.
- K. S. Izosimova, A. Y. Solovyeva, V. V. Popov, and T. Y. Chernysheva, “Using retrieval-augmented generation in book recommendation systems,” Informacionnye technologiy v obrazovaniy, vol. 7, pp. 120–125, Nov. 2024. [Online]. Available online: https://www.elibrary.ru/item.asp?id=80287737.
- LlamaIndex, “LlamaIndex,” lamaindex.ai. Accessed: Apr. 19, 2025. [Online]. Available online: https://www.llamaindex.ai.
- R. K. Malviya, V. Javalkar, and R. Malviya, “Scalability and Performance Benchmarking of LangChain, LlamaIndex, and Haystack for Enterprise AI Customer Support Systems,” JGIS Fall of 2024 Conf., Sep. 2024. [CrossRef]
- Groq, “Groq,” groq.com. Accessed: Apr. 19, 2025. [Online]. Available: https://groq.com.
- Groq, “ArtificialAnalysis.ai LLM Benchmark Doubles Axis To Fit New Groq LPU Inference Engine Performance Results,” groq.com. Accessed: Mar. 29, 2025. [Online]. Available online: https://groq.com/blog/artificialanalysis-ai-llm-benchmark-doubles-axis-to-fit-new-groq-lpu-inference-engine-performance-results.
- H. Yu, A. Gan, K. Zhang, S. Tong, Q. Liu, and Z. Liu, “Evaluation of Retrieval-Augmented Generation: A Survey,” 2024. arXiv:2405.07437.
- T. Zhang, V. Kishore, F. Wu, K. Q. Weinberger, and Y. Artzi, “BERTScore: Evaluating Text Generation with BERT,” 2019. arXiv:1904.09675.
- Hugging Face, “meta-llama/Meta-Llama-3-8B,” huggingface.co. Accessed: Jul. 16, 2025. [Online]. Available online: https://huggingface.co/meta-llama/Meta-Llama-3-8B.
- Hugging Face, “meta-llama/Meta-Llama-3-70B,” huggingface.co. Accessed: Jul. 16, 2025. [Online]. Available online: https://huggingface.co/meta-llama/Meta-Llama-3-70B (accessed on 16 July 2025).
- Hugging Face, “deepseek-ai/DeepSeek-R1-Distill-Llama-70B,” huggingface.co. Accessed: Jul. 26, 2025. [Online]. Available online: https://huggingface.co/deepseek-ai/DeepSeek-R1-Distill-Llama-70B.
- Hugging Face, “BAAI/bge-m3,” huggingface.co. Accessed: Jul. 27, 2025. [Online]. Available online: https://huggingface.co/BAAI/bge-m3.
- Hugging Face, “intfloat/e5-large-v2,” huggingface.co. Accessed: Jul. 26, 2025. [Online]. Available online: https://huggingface.co/intfloat/e5-large-v2.
- Hugging Face, “intfloat/multilingual-e5-large-instruct,” huggingface.co. Accessed: Jul. 27, 2025. [Online]. Available online: https://huggingface.co/intfloat/multilingual-e5-large-instruct.
- Meta Research, “A library for efficient similarity search and clustering of dense vectors,” github.com. Accessed: Jul. 27, 2025. [Online]. Available online: https://github.com/facebookresearch/faiss.
- R. Rabata, “FAISS vs Chroma? Let’s Settle the Vector Database Debate!” capellasolutions.com. Accessed: Jul. 26, 2025. [Online]. Available online: https://www.capellasolutions.com/blog/faiss-vs-chroma-lets-settle-the-vector-database-debate.
- Gradio, “Gradio,” gradio.app. Accessed: Jul. 26, 2025. [Online]. Available online: https://gradio.app/.
- Ministry of Economic Development of Russia, “Order No. 267, dated 13 May 2021, ‘On Approval of the Methodological Recommendations and Indicators on Adaptation to Climate Change’.”.
- M. L. Gillenson, Fundamentals of Database Management Systems, 3rd ed. Hoboken, NJ, USA: John Wiley & Sons, 2023.
- Bates, R. Vavricka, S. Carleton, R. Shao, and C. Pan, “Unified Modeling Language Code Generation from Diagram Images Using Multimodal Large Language Models,” 2025, arxiv:2503.12293.
- Abid, A. Abdalla, A. Abid, D. Khan, A. Alfozan, and J. Zou, “Gradio: Hassle-Free Sharing and Testing of ML Models in the Wild,” 2019, arxiv:1906.02569.
Figure 1.
Comparison of models based on generation quality.
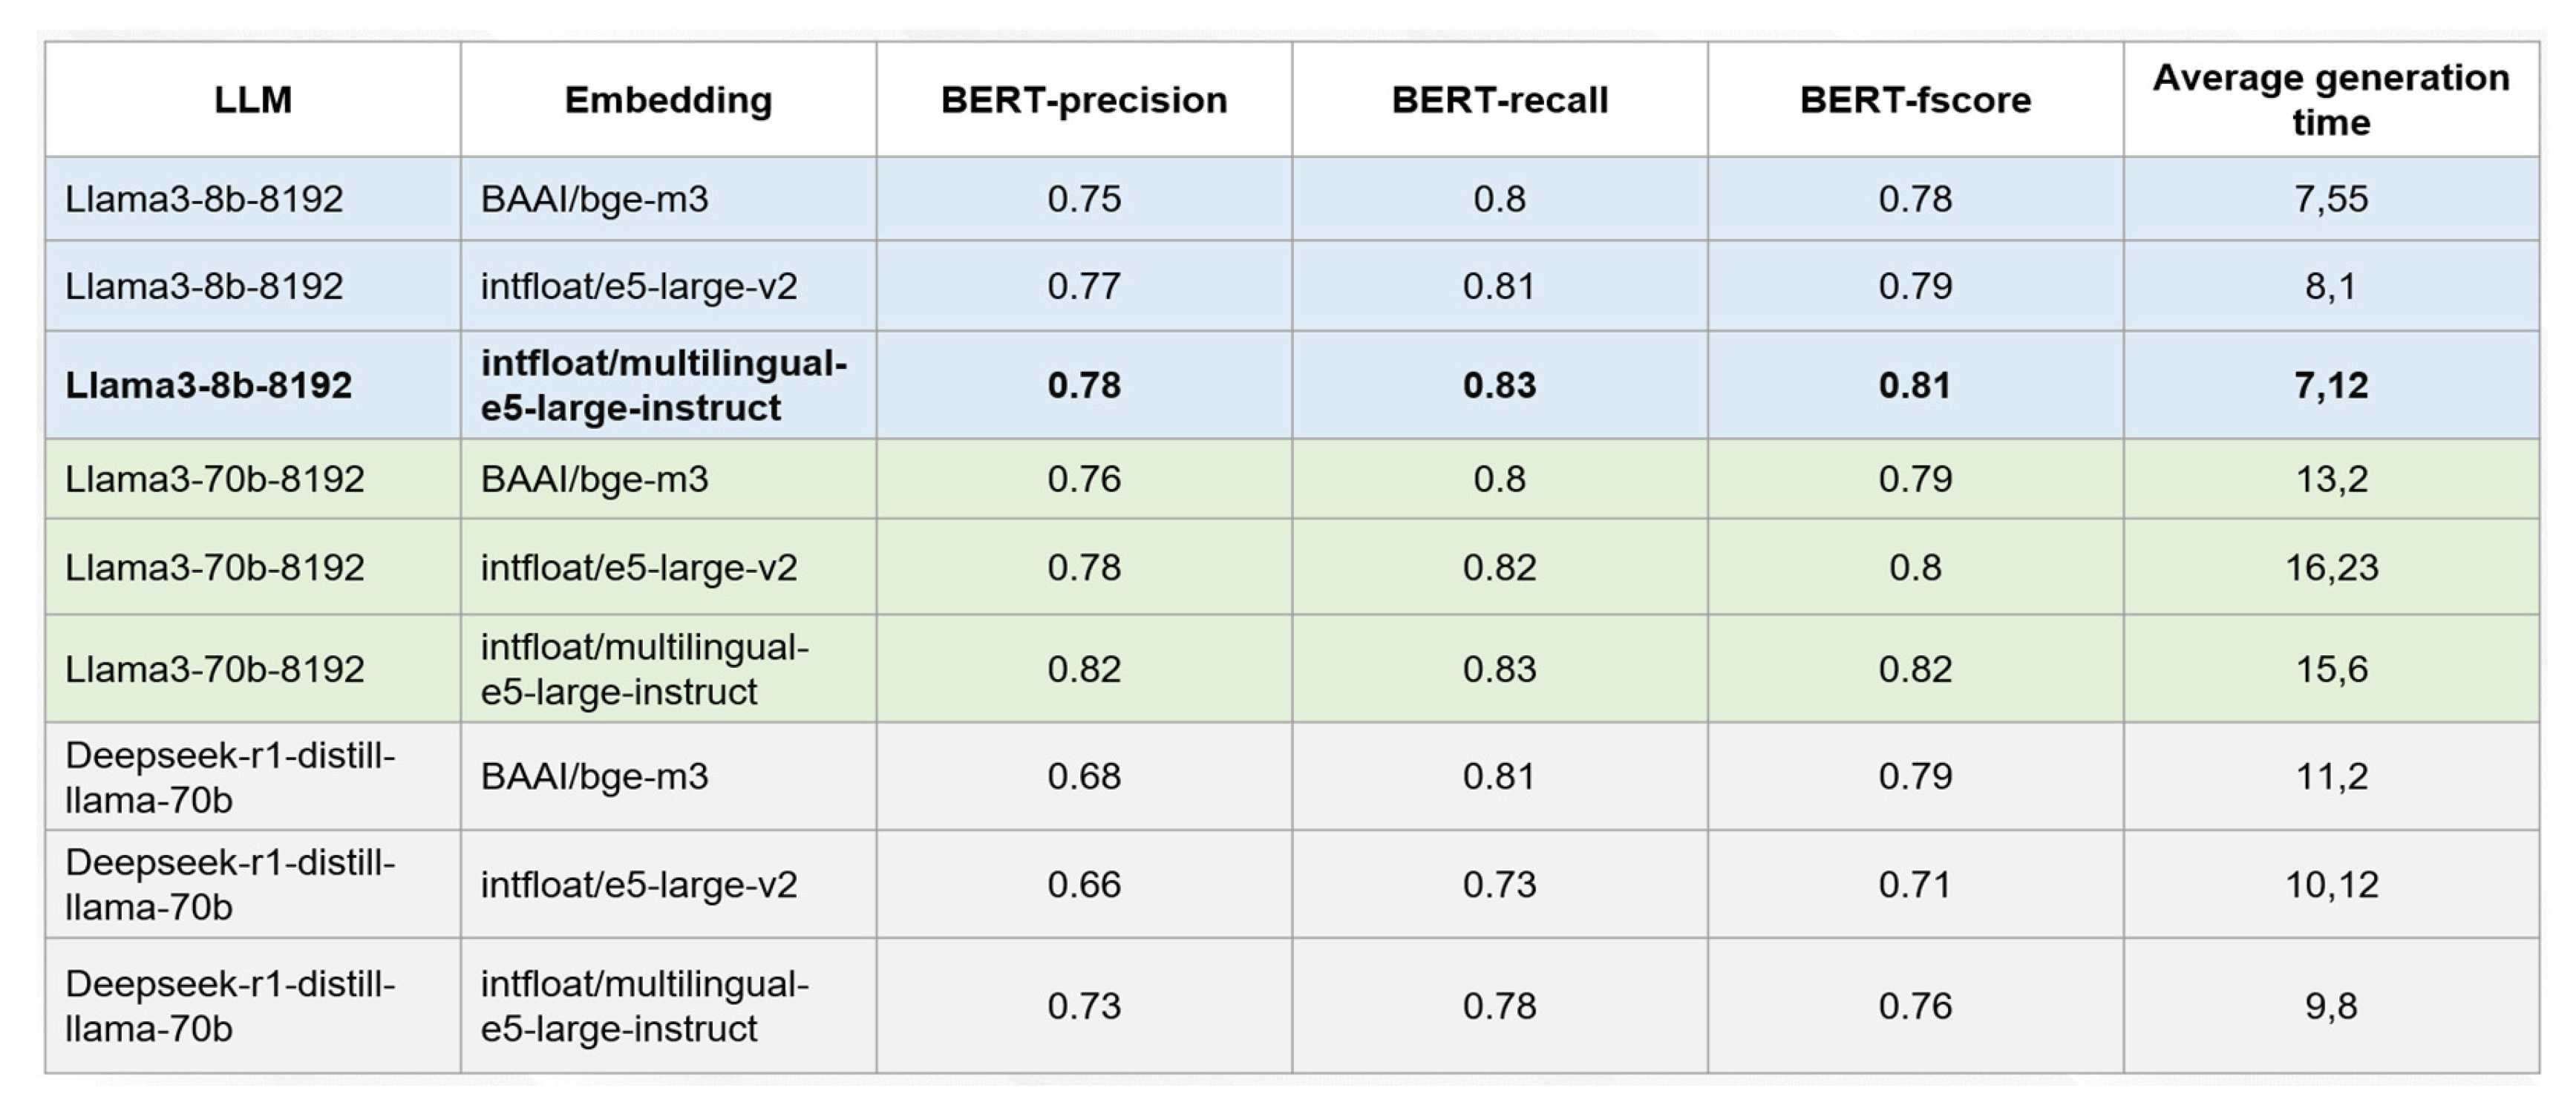
Figure 2.
Logical model of the climate risk database.
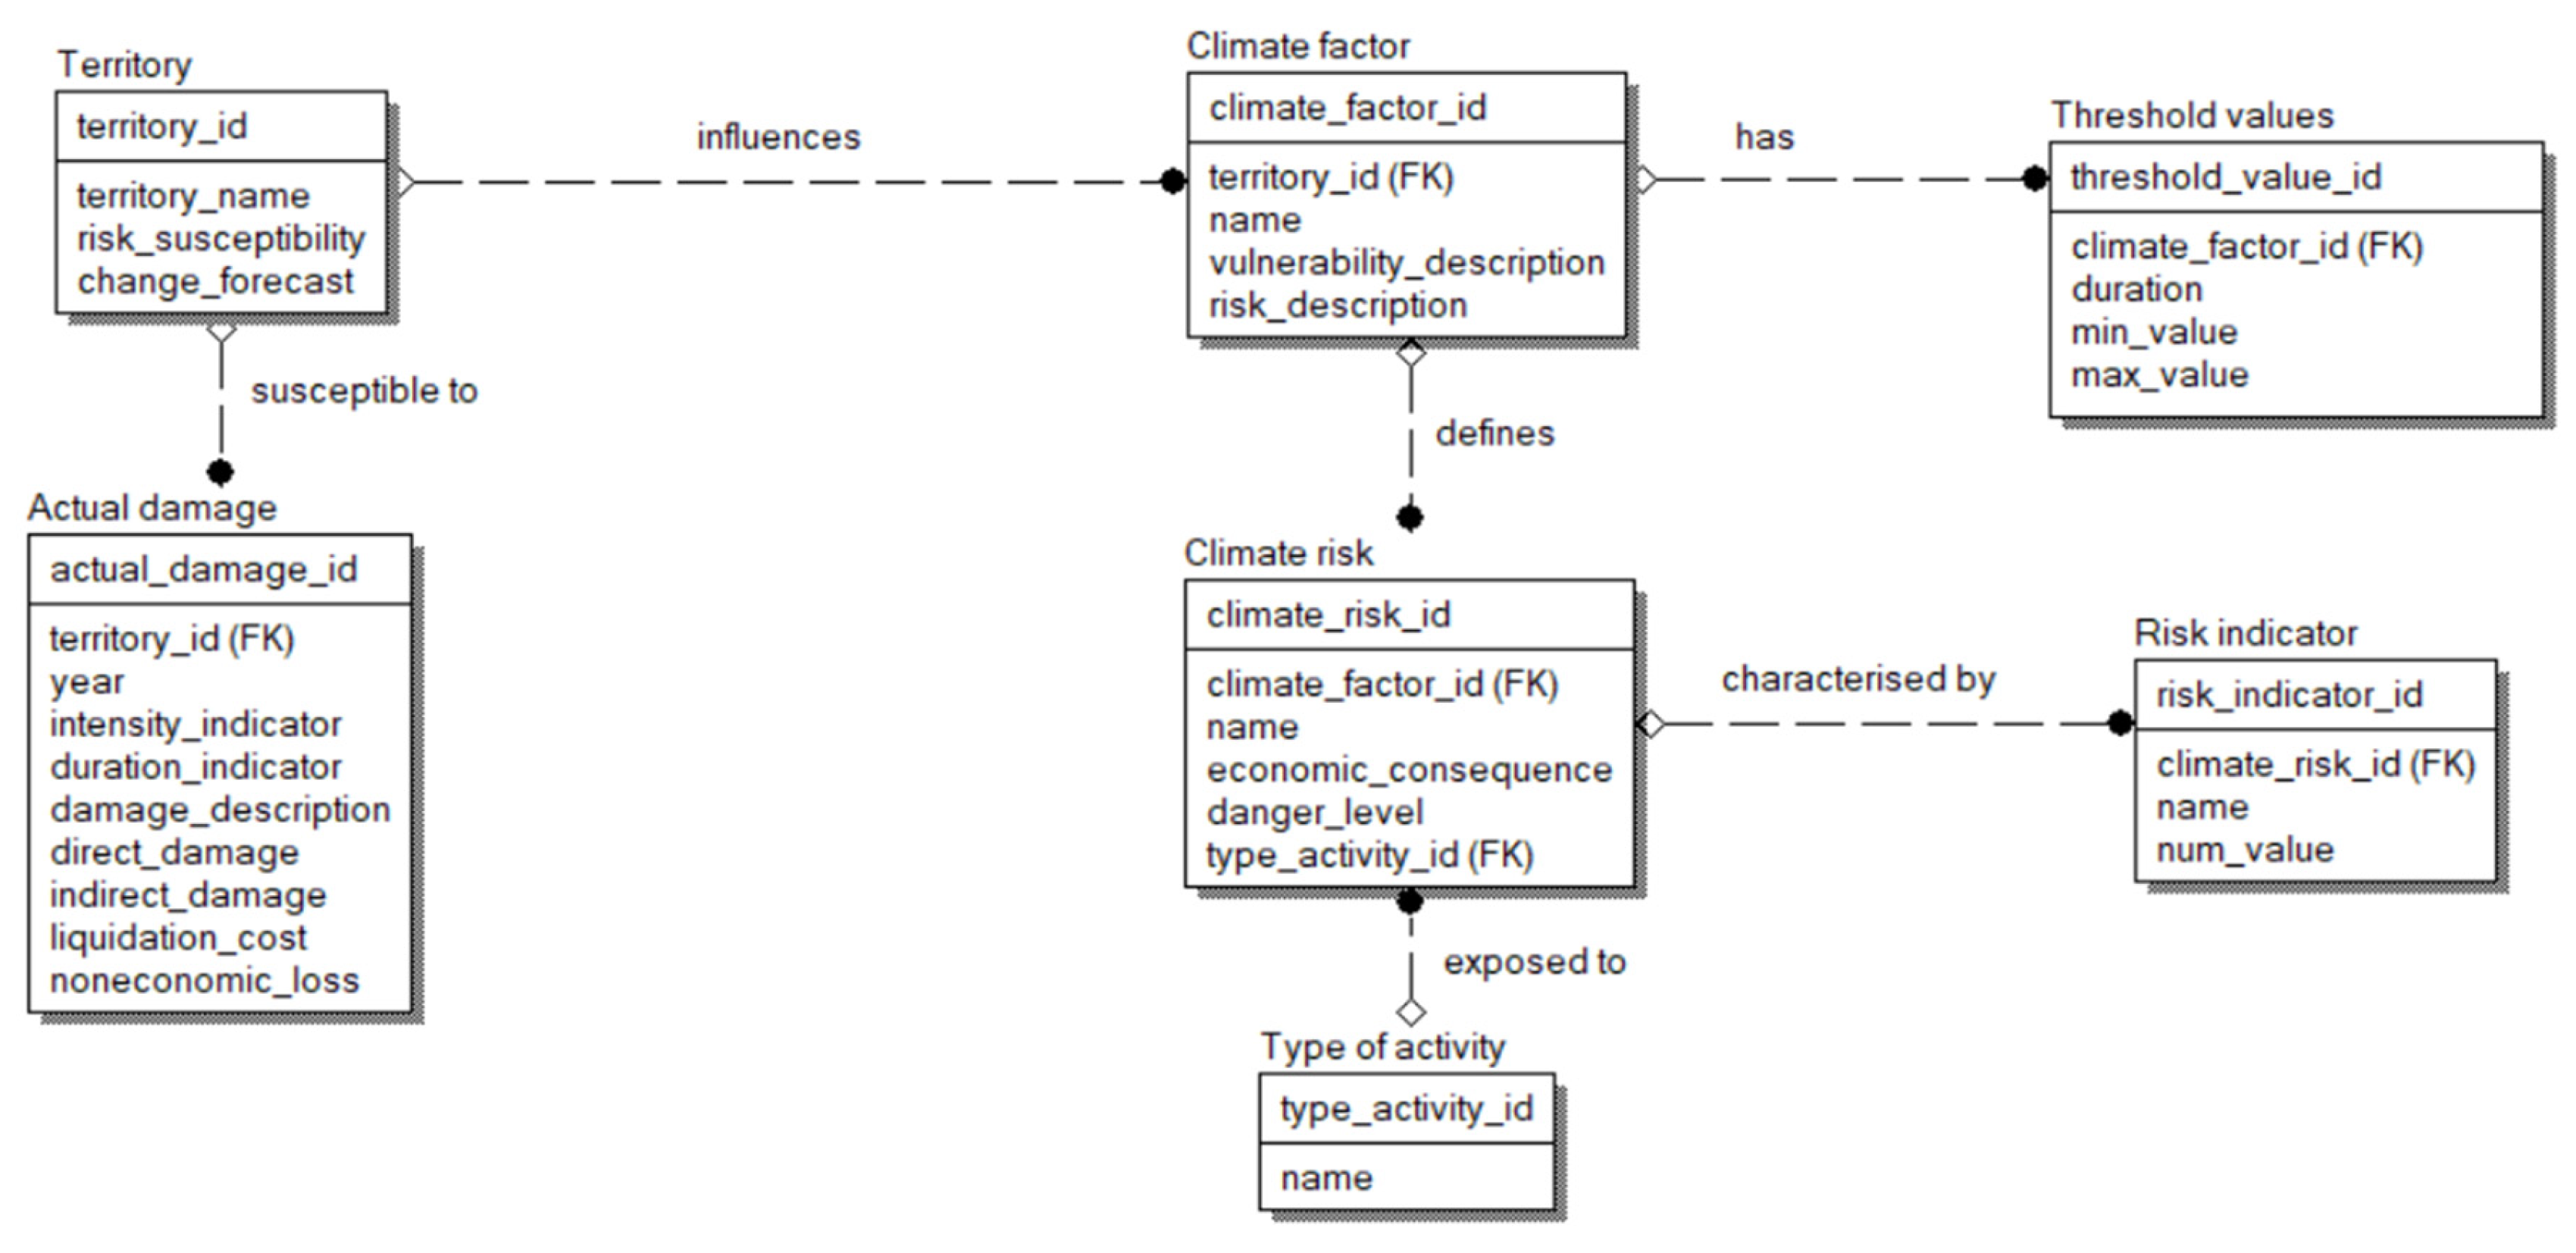
Figure 3.
Use-case diagram of the climate risk assessment system.
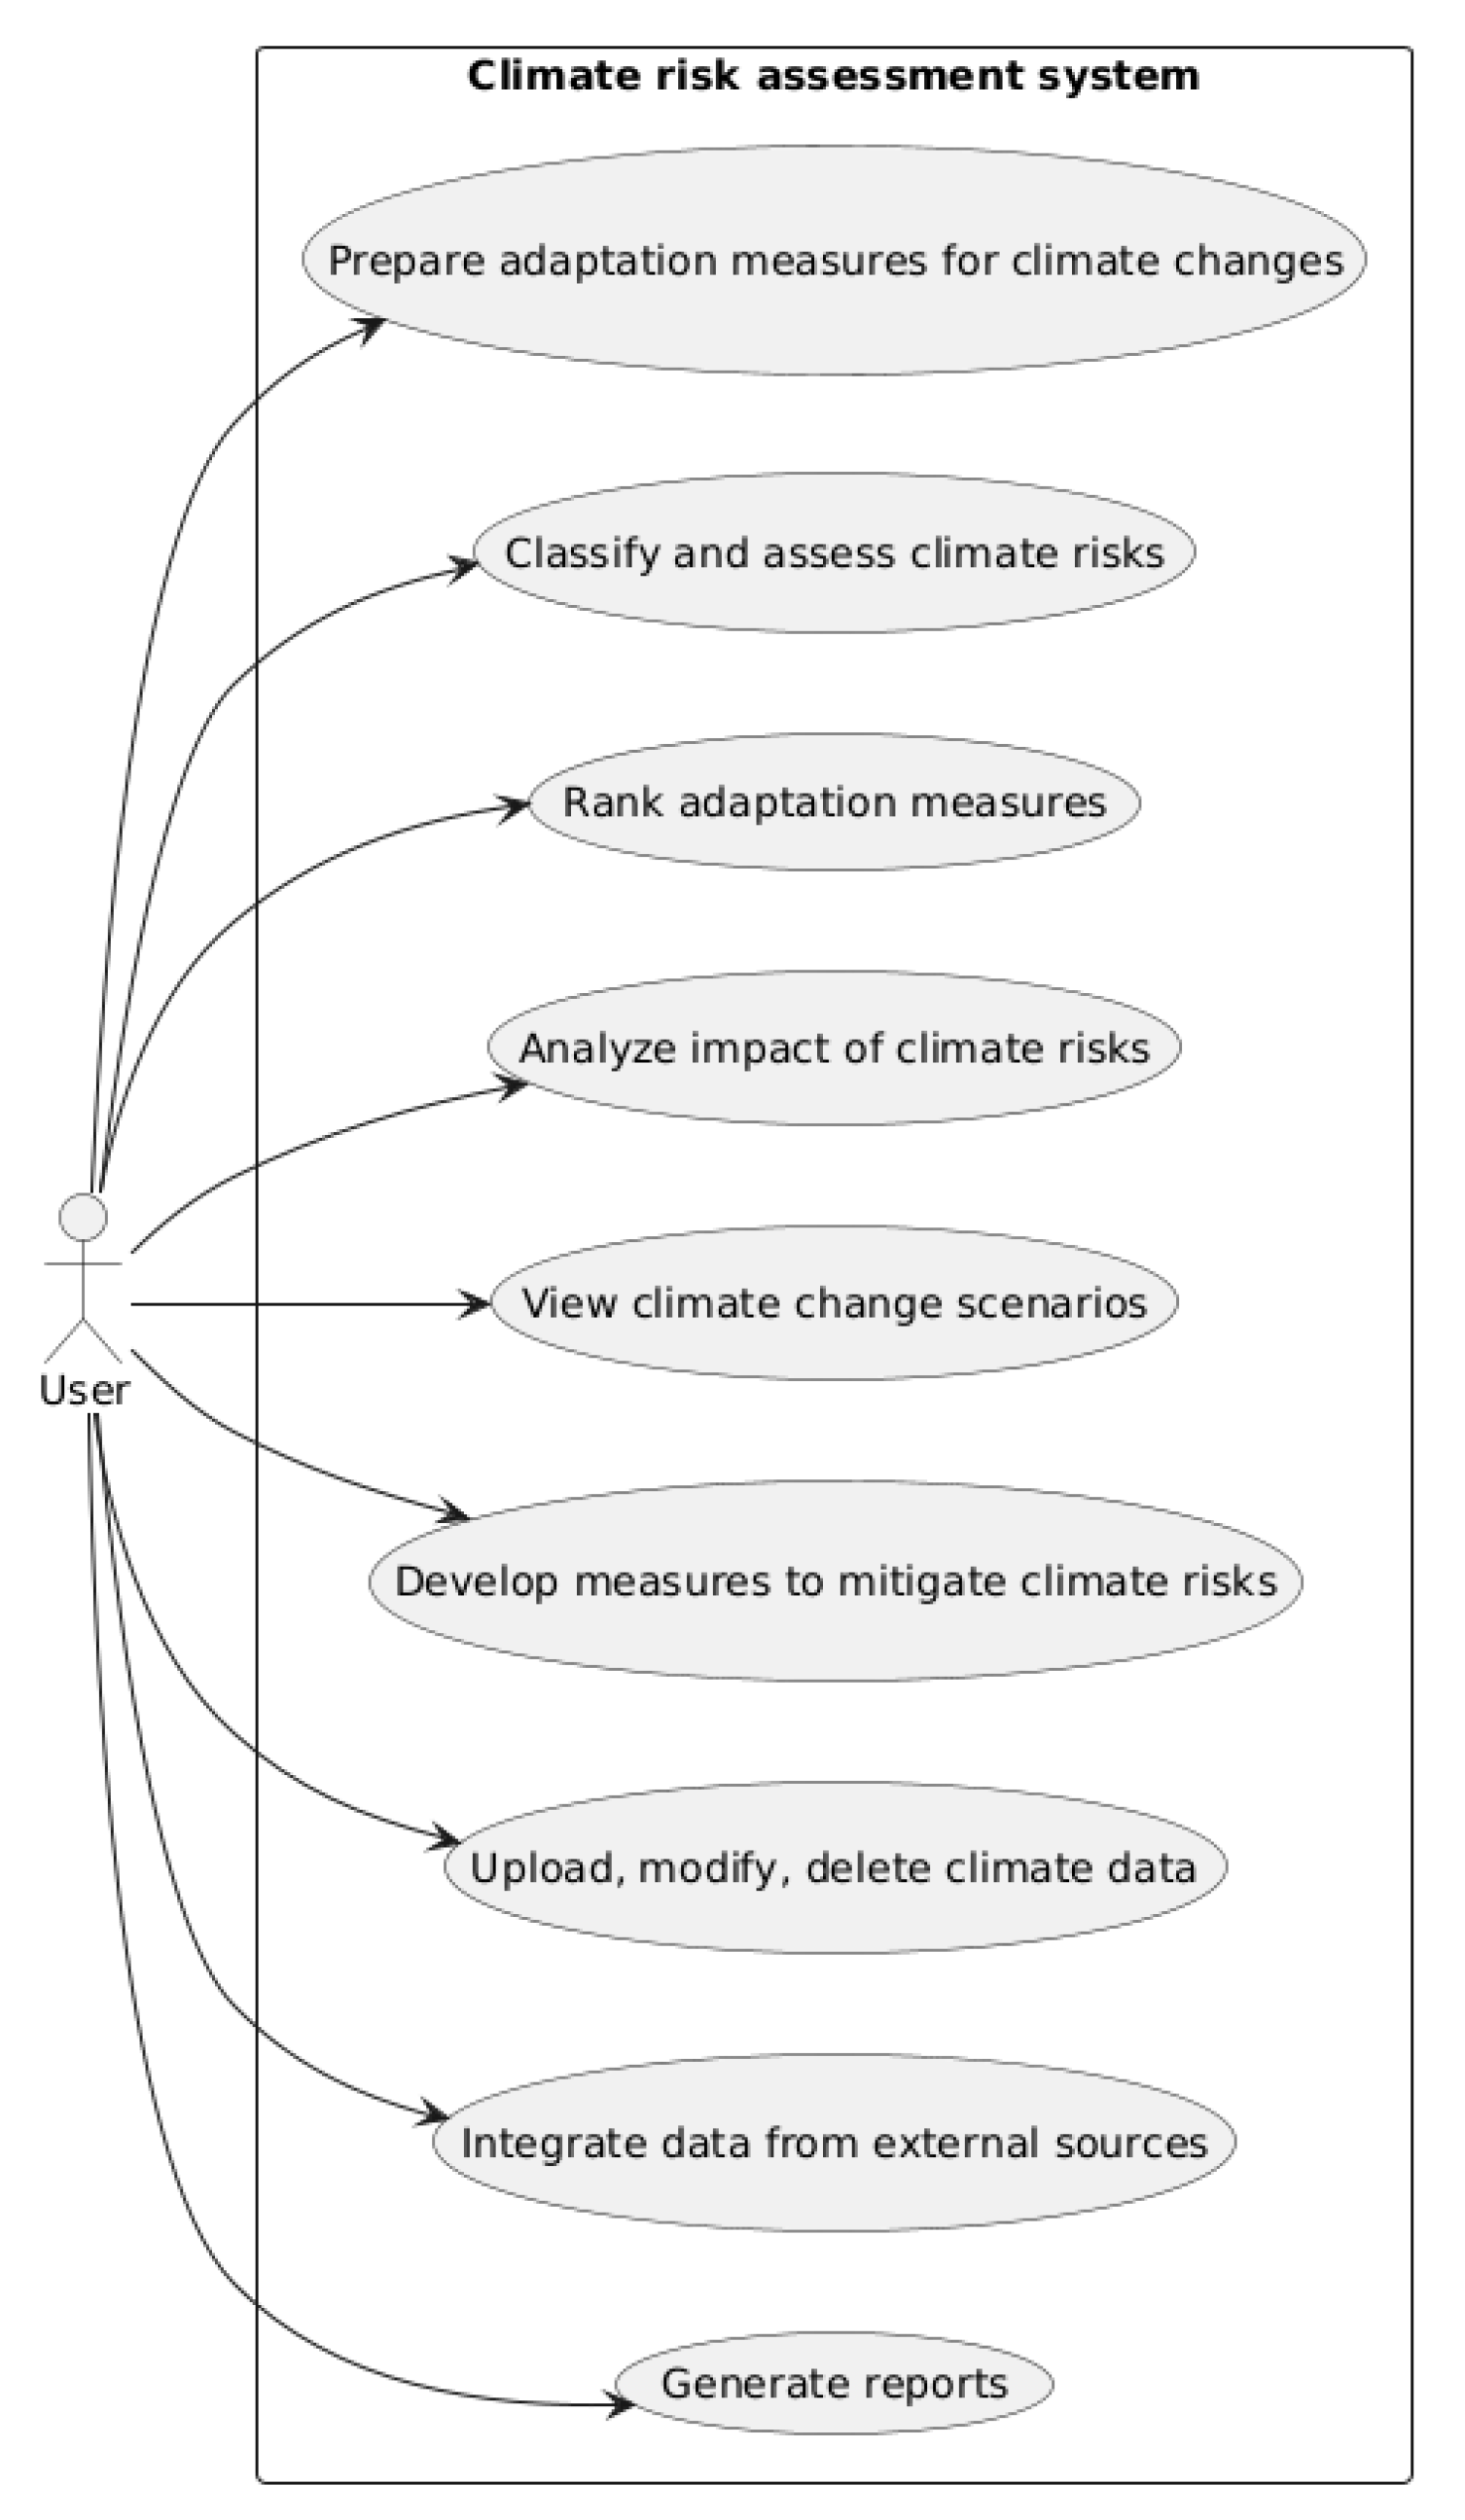
Figure 4.
Interface of the climate risk assessment system.
Disclaimer/Publisher’s Note: The statements, opinions and data contained in all publications are solely those of the individual author(s) and contributor(s) and not of MDPI and/or the editor(s). MDPI and/or the editor(s) disclaim responsibility for any injury to people or property resulting from any ideas, methods, instructions or products referred to in the content. |
© 2025 by the authors. Licensee MDPI, Basel, Switzerland. This article is an open access article distributed under the terms and conditions of the Creative Commons Attribution (CC BY) license (http://creativecommons.org/licenses/by/4.0/).
Copyright: This open access article is published under a Creative Commons CC BY 4.0 license, which permit the free download, distribution, and reuse, provided that the author and preprint are cited in any reuse.


