
Submitted:
02 September 2025
Posted:
05 September 2025
You are already at the latest version
Abstract
Based on the author's self-developed theoretical system of the Seismo-Geothermics theory, this paper uses the M 4.0+ earthquake catalog of Indonesia from the California Earthquake Center in the United States to determine the geographical distribution and three-dimensional spatial distribution characteristics of earthquakes and volcanoes in the study area, according to the concept of Seismic Cone Tectonic (SCT) divides 7 seismic sub-SCTs, formulates a holographic ideal model of SCT, and defines two concepts: the intra-crustal strong earthquake and volcanic eruption disaster chain, and the activity of sub-crustal earthquakes. For the 6 sub-SCT directly related to the Indonesian study area, time-series image analysis and annual and differential analysis of activity are carried out. On this basis, a prediction model and research plan for intra-crustal strong earthquakes and volcanic eruptions are formulated, which can provide a reference for the research on deep-source SCT in the Indonesian region, the Western Pacific region, the Southwestern Pacific region, and the west coast of South America.
Keywords:
Seismo-Geothermics
; seismic cone tectonic
; sub-crustal seismic activity
; intra-crustal strong earthquake and volcanic eruption disaster chain
; Indonesia
1. Preface
The impact area of the world's 16#th Indonesia Seismic Cone Tectonic (SCT for short) is located between 85°~138°E and -16°~10°N, as shown in Figure 1. The Indonesian SCT is one of the global deep-focus seismic cone tectonics, with a maximum focal depth of 675 km, and it is also one of the most active seismic cone tectonics in terms of intra-crustal strong earthquakes and volcanic eruptions in the world.
Based on the principles and working methods of the Seismo-Geothermics Theory created by the author [1,2,3,4,5,6,7,8], this paper aims to explore the relationship between intra-crustal strong earthquakes, volcanic eruptions and the seismic cone tectonic in the study area, and attempts to establish a prediction model for disaster events, namely the disaster chain of intra-crustal strong earthquakes and volcanic eruptions. It may be beneficial to the accumulation of experience in the prediction of global earthquake and volcanic disaster events and bring benefits to mankind.
2. Materials and Working Methods
The seismic data of the study area comes from the ANSS earthquake catalog of the Southern California Earthquake Center (USA). A total of 82,390 earthquakes with a magnitude of 4.0 or higher in the study area from 1963 to May 8, 2025 were obtained, and the distribution of the sub-crustal strata is shown in Table 1. Based on the three-dimensional distribution of seismic activity in this area, 7 research sub-areas, namely Inn A to Inn G, were divided, which are 7 sub-SCTs, as shown in Figure 1. These sub-cone tectonic have different shapes, each with its own unique three-dimensional morphology (Figure 2) and a disaster chain system (DCS for short, see Figure 3) where intra-crustal strong earthquakes, volcanic eruptions, and sub-crustal earthquakes coexist, thus having special research significance.
The earthquake and volcanic disaster chain system is composed of geological elements such as sub-crustal earthquakes (earthquakes with a focal depth greater than 35 km) within the SCT, strong intra-crustal earthquakes (with a depth less than 35 km, M 7.0+ or M 6.5+), surface seismogenic structural systems (torsional structures, thrust structures, etc.), habitual or newly formed volcanic channels, and so on.
The influence area of a sub-cone (sub-SCT) is not a fixed block; its range can be larger or smaller depending on the research objectives, but the core cone area remains unchanged. The core of the sub-SCT is dominated by sub-crustal earthquakes, rather than determined by surface seismic images. The most refined sub-SCT is a single sub-cone structure, which has an independent activity pattern and is not disturbed by adjacent sub-cone structures.
This paper adopts the traditional working method of the Seismo-Geothermics, that is, using the time series diagram of sub-crustal earthquakes to track the correlation between strong intra-crustal earthquakes and volcanic eruption events, and to find prediction models. At the same time, this paper uses Fourier spectrum analysis in the hope of finding some correlation between the earthquake and volcanic disaster chain and the Earth's nutation.
3. Sub-SCTs of the Indonesian SCT
Based on the three-dimensional images of Indonesia's SCT, this paper roughly divides 7 research zones, namely Inn A to Inn G, which are 7 seismic sub-cone structures, after multiple screenings. Since the In A sub-cone structure involves parts of the Philippines and the data is incomplete, it is not included in the research scope of this paper. Therefore, this paper focuses on the study of 6 seismic sub-cone structures from Inn B to Inn G.
The stratigraphic activity parameters of each sub-cone structure are shown in Table 2, the parameters of M 7.0+ intra-crustal strong earthquake activities from 1963 to 2025 are shown in Table 3, and the parameters of volcanic eruptions with a Volcanic Explosivity Index (VEI) of 3+ are shown in Table 4.
It can be seen from these data tables that each of the 6 sub-cone structures forms an independent disaster chain of intra-crustal strong earthquakes and volcanic eruptions. There are only 4 such regions with intense consecutive disaster chains in the world. In addition to Indonesia, they are the western Pacific (from the Okhotsk Sea to the Mariana Trench), the southwestern Pacific (from the Solomon Islands to Tonga and New Zealand), and the western coast of South America (Ecuador and Chile). These places are the best sites for us to explore the causes and prediction models of intra-crustal strong earthquakes and volcanoes.
The time series diagrams of sub-crustal seismic activities for each sub-cone structure are shown in Figure 4, Figure 5, Figure 6, Figure 7, Figure 8 and Figure 9. It can be seen from the figures that before 1975, the resolution of sub-crustal earthquake data in each sub-cone study area was relatively low, and the situation did not improve significantly until the mid-1980s. Therefore, the time period available for the study of annual seismic conditions is very limited. A short history of just over 40 years can only be regarded as a moment in both seismology and geology.
3.1. Concept and Definition of Annual Seismic Activityε0(t)
The dense seismic zone beneath the crust is an obvious sign of the structure of the seismic cone. The Seismo-Geothermics theory holds that all global events, such as strong intra-crustal earthquakes, volcanic eruptions, climate warming or cooling, etc., are related to the thermal movement in the deep upper mantle. Therefore, it is very important to investigate the activity intensity of sub-crustal earthquakes within deep seismic active structures.
The simplified Gutenberg (Gutenberg et al., 1956) relationship between the seismic wave energy E released by an earthquake and the earthquake magnitude M is as follows (the unit of energy E is erg):
Lg E=11.8+1.5Ms
Then the Benioff strain energy √E has
Lg √E=5.9+.75Ms
To avoid confusion regarding the unit of measurement for energy E and excessively large data volumes, it is advisable to convert √E into the number of M 4.0 earthquakes for annual accumulation. Then, the annual cumulative value E (t) is
In the formula, t represents the statistical year, among which the data for the last year, 2025, is incomplete and is for reference only. n is the total number of subshell earthquakes in that year. The annual anomaly normalized ratio ε ₀(t) of E (t) can be obtained from formula (3), which is as follows:
In the formula, E0 is the multi-year average value of E (t).
The average value of the ratio ε₀ is 0. The annual ratio ε₀ integrates the comprehensive effects of earthquake frequency N, magnitude M, and the strain energy released by earthquakes, and can comprehensively represent the activity intensity of sub-crustal earthquakes, so it is defined as the sub-crustal seismic activity. To examine the conditions of formations at different depths, the seismic activity of each target formation can be calculated.
Formula (3) is applicable regardless of whether the minimum magnitude of the earthquake catalog is M 1.0 or M 4.0, or whether the time window is annual or 0.1a. Of course, it is required that the earthquake catalog provides time series coordinates in annual units.
ANSS is originally a composite earthquake catalog that uses multiple magnitude scales. As a first-order approximation, all earthquake magnitudes in this paper are regarded as Ms.
3.2. Detailed Description of Seismic Conditions in Each Sub-Cone Study Area
The seismic and volcanic conditions of the study areas in sub-cones InB to InG are described separately as follows:
3.2.1. Inn B Sub-Cone Study Area
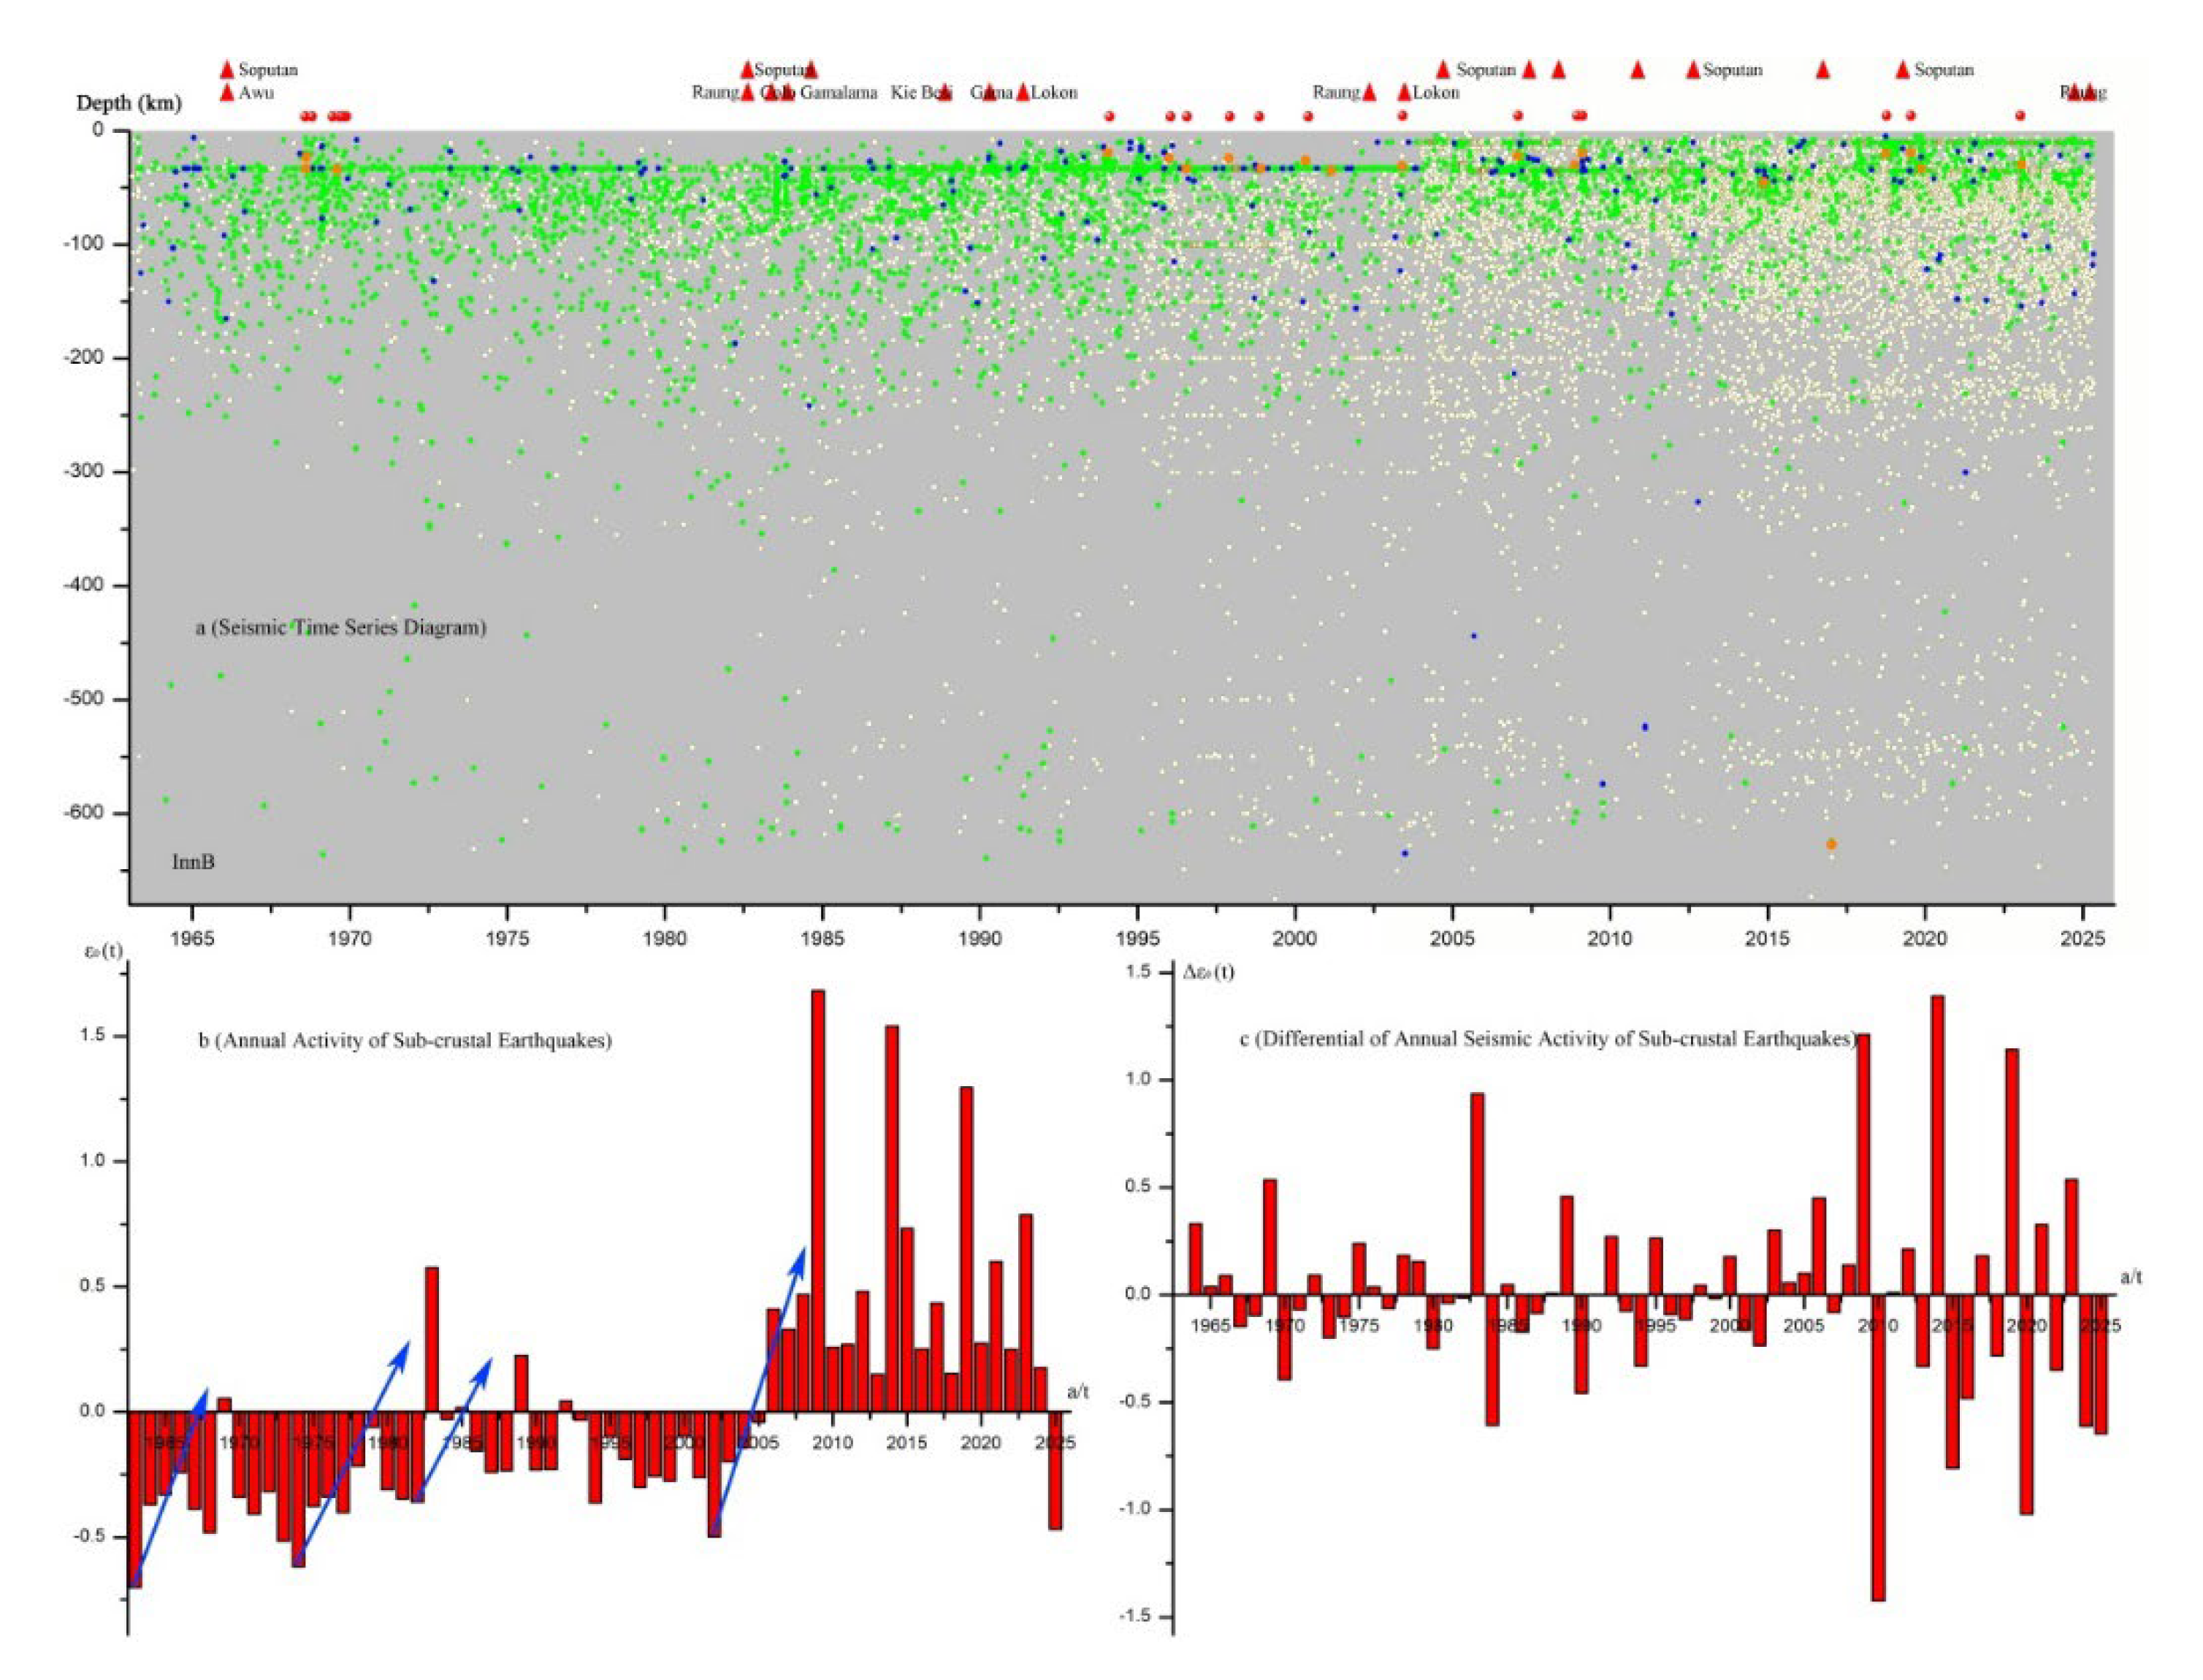
The Inn B sub-cone is located in the area east of East Kalimantan Province, Indonesia. Since the 1980s, intra-crustal strong earthquakes and volcanic eruptions have alternated, making it extremely active. See Figure 4 for details. There were successive strong intra-crustal earthquakes with a magnitude of 7+ between 1998 and 2008, and successive volcanic eruptions with a VEI of 3+ between 1982 and 1991 as well as between 2002 and 2025. The analysis shows that the continuous rising segment of the annual activity level ε0 (t) of sub-crustal earthquakes (marked by the blue arrow line) and the high differential value of the activity level have certain precursory significance for both intra-crustal strong earthquakes and volcanic eruptions. If the local Indonesian earthquake catalog of M 1.0+ to M 3.0+ can be used, this precursory significance will only increase rather than decrease.
Figure 4.
Time series diagram and analysis of the Inn B sub-SCT of the Indonesian SCT. Explanation of Figure 4: The egg-yellow dots represent M 4.0-4.9 earthquakes, the green dots represent M 5.0-5.9 earthquakes, the blue dots represent M 6.0-6.9 earthquakes, the orange dots represent M 7.0+ earthquakes, the red dots represent M 7.0+ strong intra-crustal earthquakes, and the red triangles represent VEI 3+ volcanic eruptions. (The same below).
3.2.2. Inn C Sub-Cone Study Area
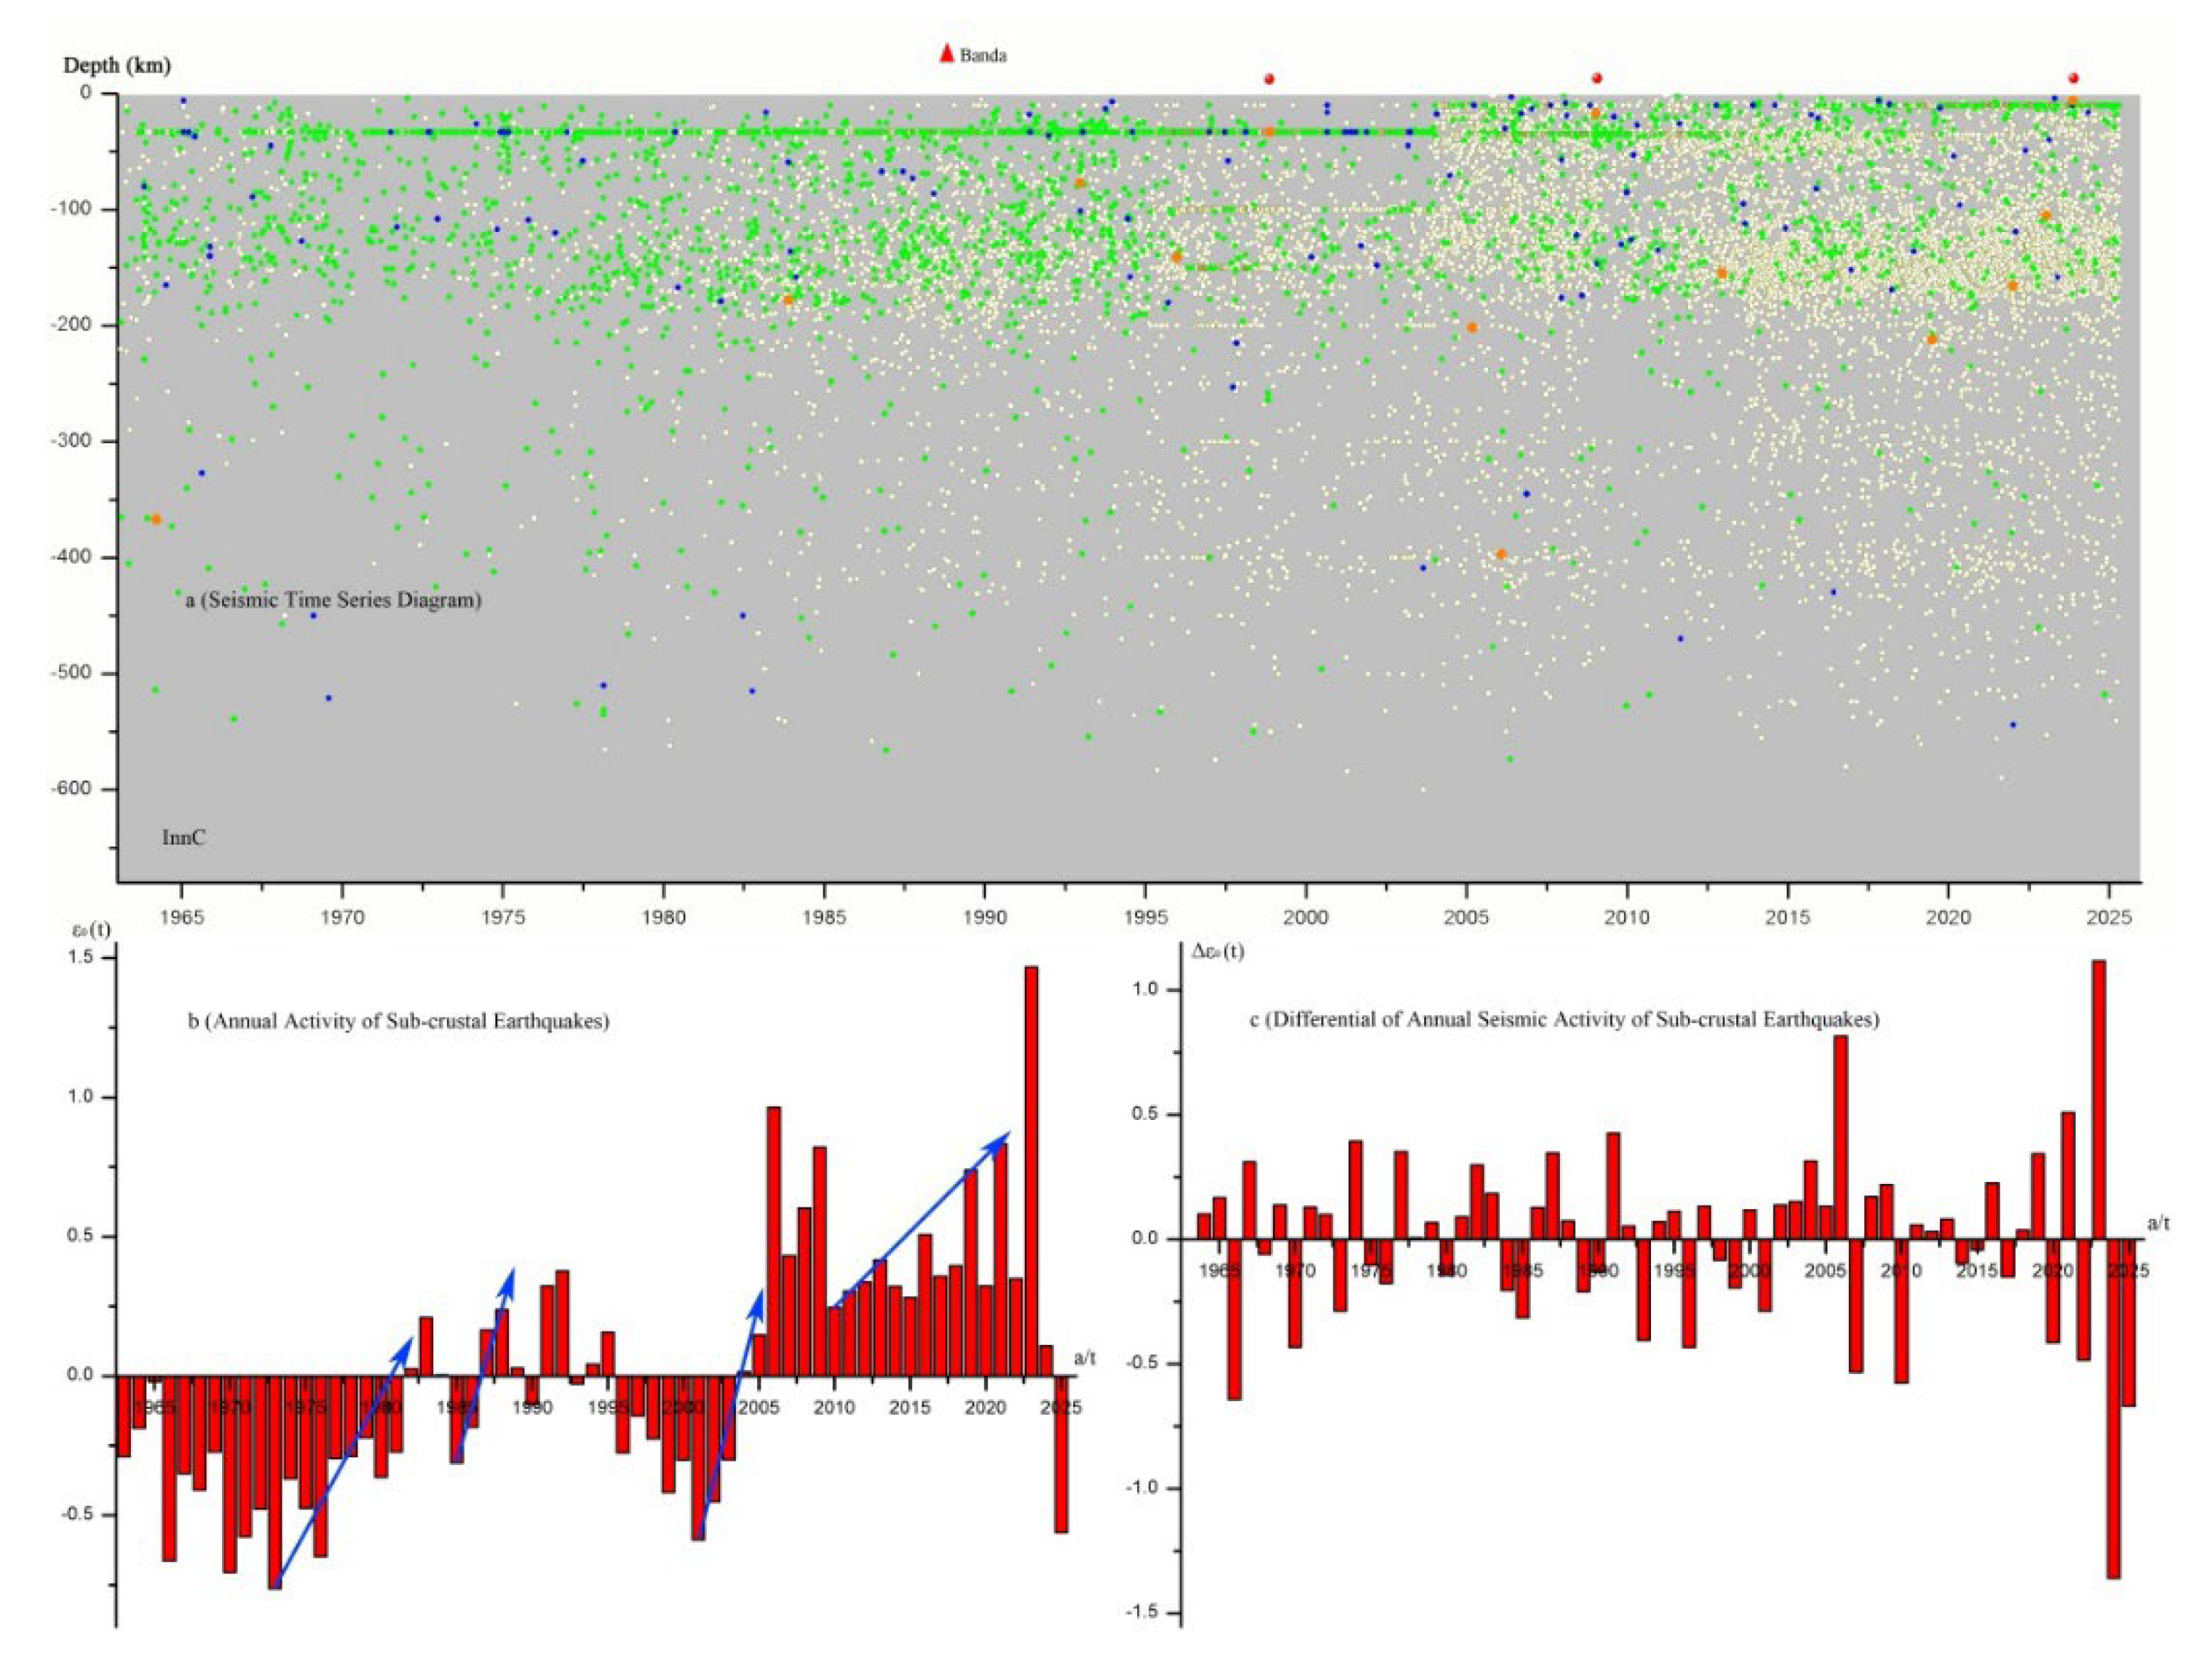
The Inn C sub-cone is located in the eastern part of the Banda Sea, Indonesia. Since the 1980s, strong intra-crustal earthquakes and volcanic eruptions have occurred alternately, with an interval of about 10 years. See Figure 5 for details.
Figure 5.
Time series diagram and analysis of the Inn C sub-SCT of the Indonesian SCT.
3.2.3. Inn D Sub-Cone Study Area
The Inn D sub-cone is located in the core area of the western Banda Sea, Indonesia, where strong intra-crustal earthquakes and volcanic eruptions occur alternately, with an interval of about 10 years, and the longest interval can reach 18 years. See Figure 6 for details.
Figure 6.
Time series diagram and analysis of the Inn D sub-SCT of the Indonesian SCT.
3.2.4. Inn E Sub-Cone Study Area
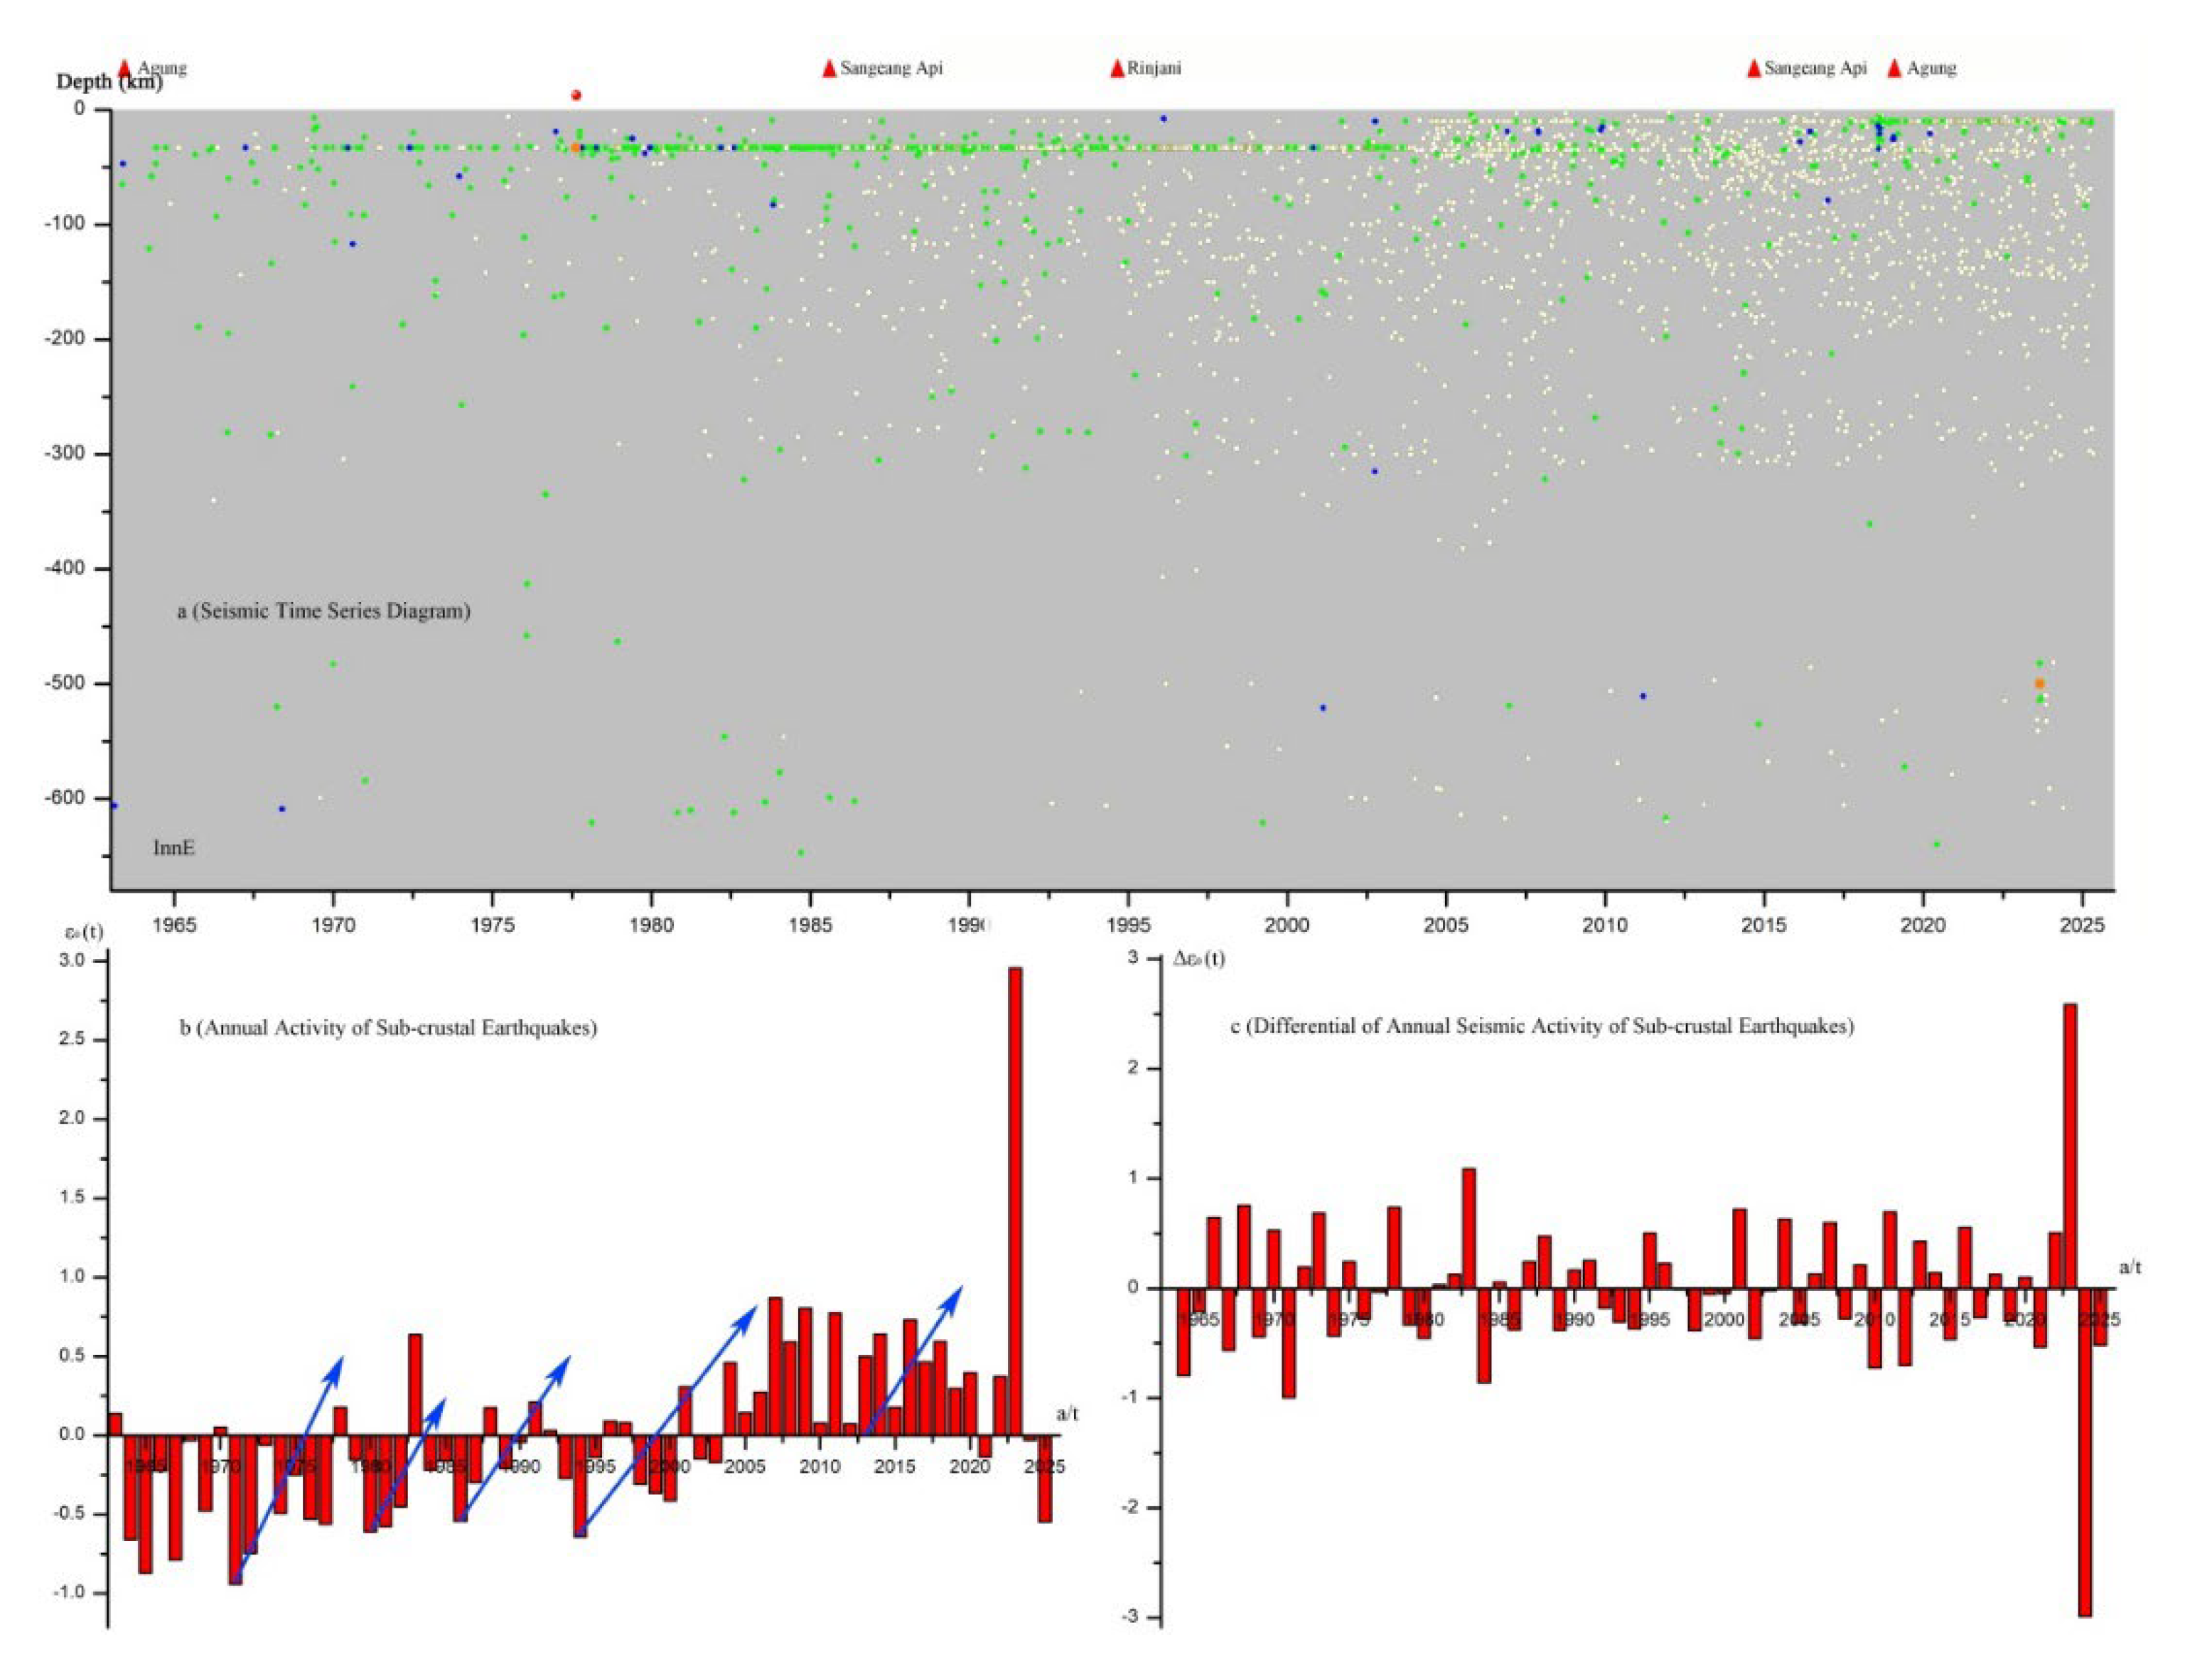
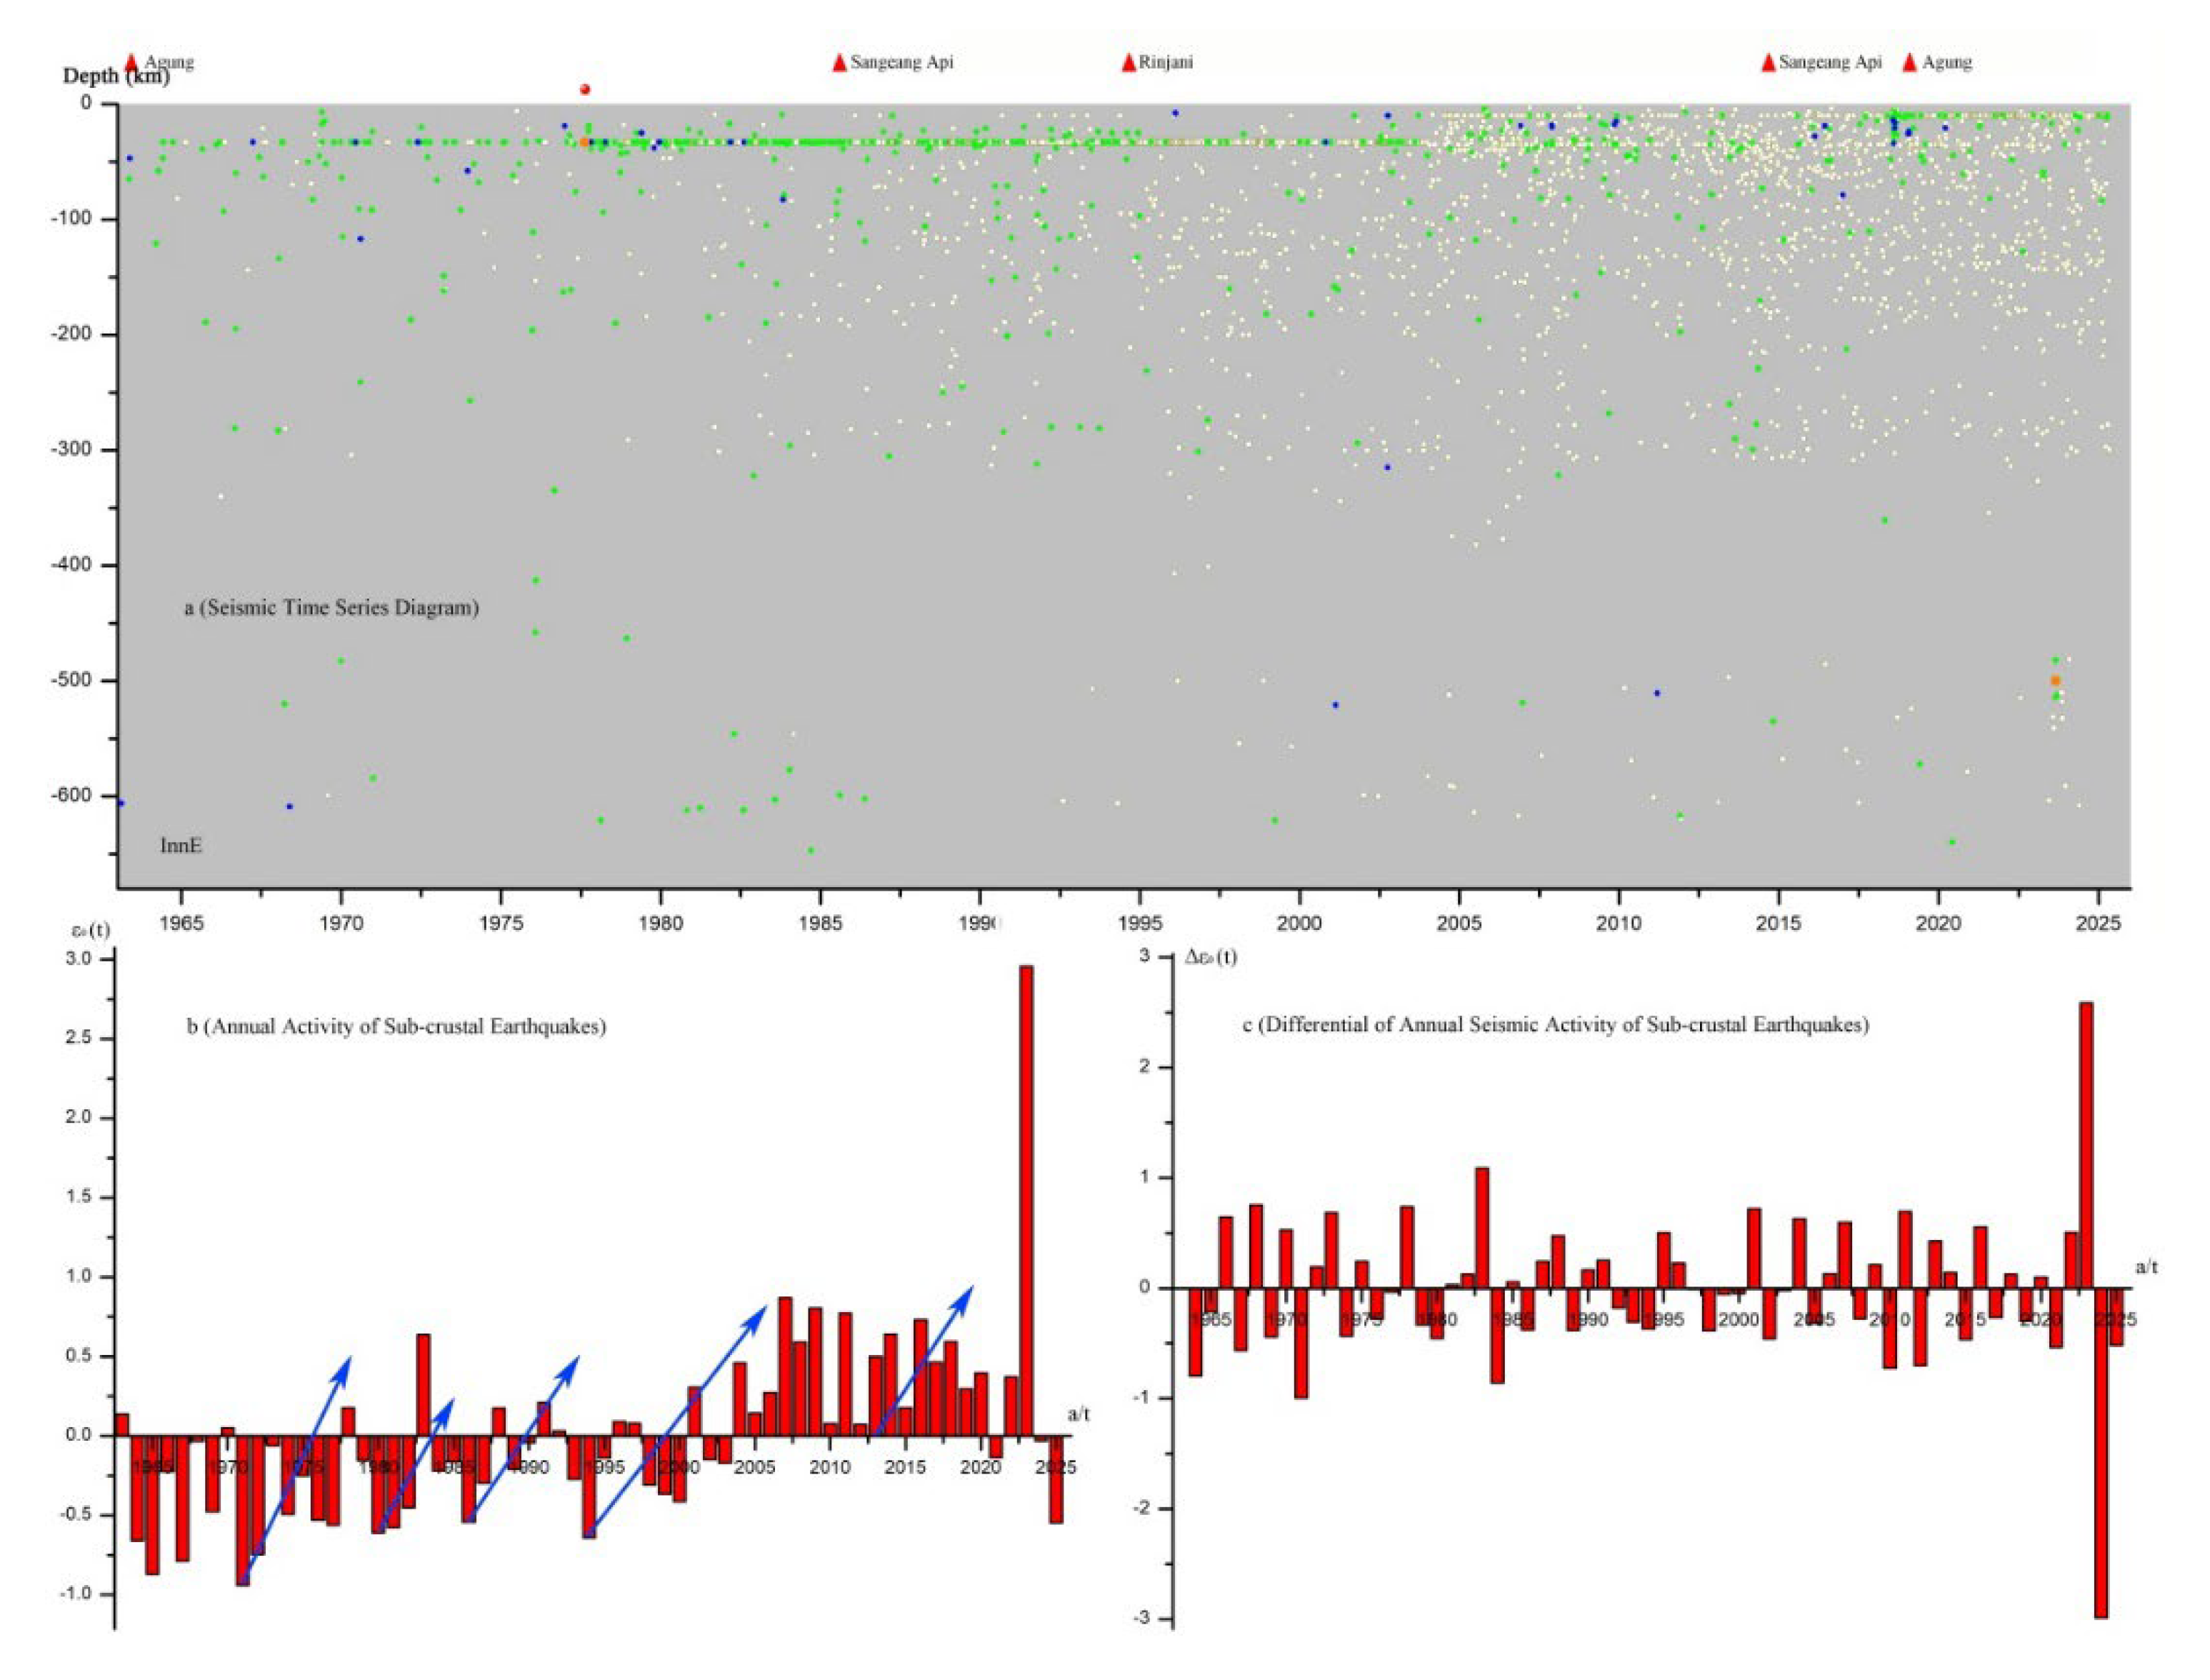
The Inn E sub-cone is located in the West Nusa Tenggara Province of Indonesia, where strong intra-crustal earthquakes and volcanic eruptions occur alternately, with an interval of about 10 years, and the longest interval can reach 20 years. The most powerful Agung Volcano (VEI 5) in Indonesia in recent years is located in this area. See Figure 7 for details.
Figure 7.
Time series diagram and analysis of the Inn E sub-SCT of the Indonesian SCT.
3.2.5. Inn F Sub-Cone Study Area
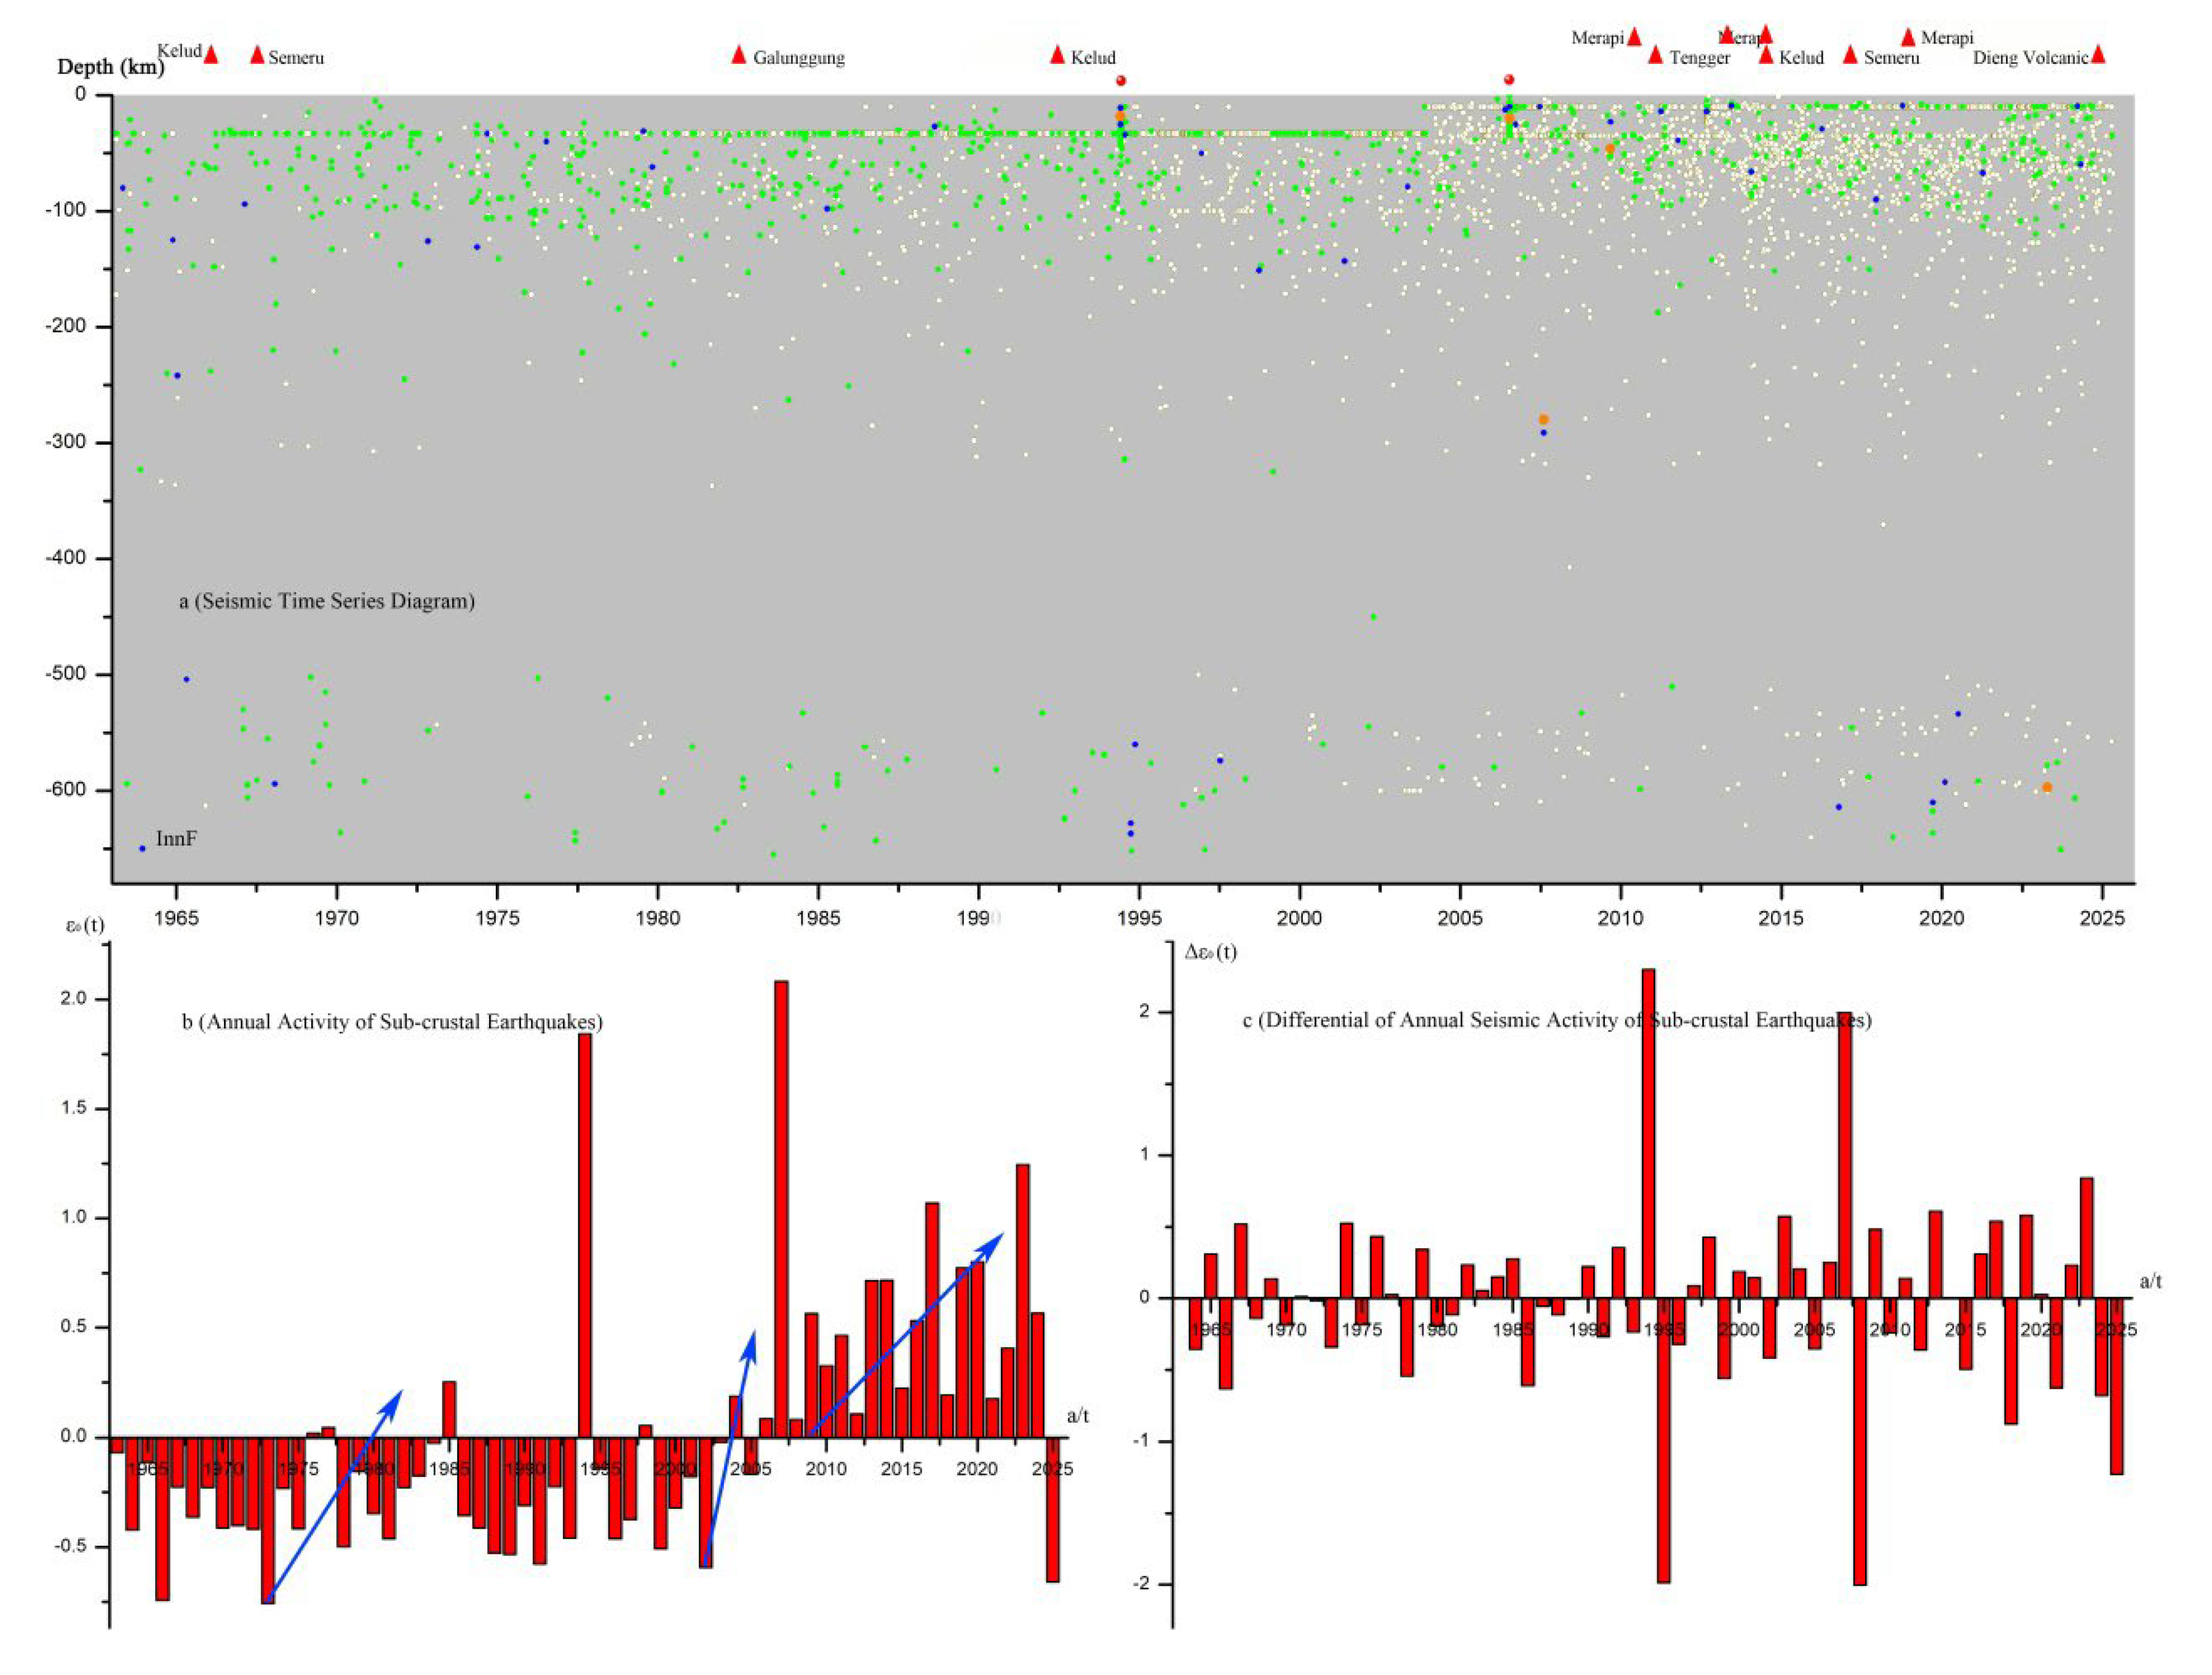
The Inn F sub-cone is located in the Java Island region of Indonesia, where strong intra-crustal earthquakes and volcanic eruptions occur alternately, with an interval of about 10 years, and the longest interval can reach 15 years. There were successive VEI 3+ volcanic eruptions between 2010 and 2020. Eruptions of volcanoes such as Semeru and Tengger can last for several months or even years. See Figure 8 and Table 4 for details.
Figure 8.
Time series diagram and analysis of the Inn F sub-SCT of the Indonesian SCT.
3.2.6. Inn G Sub-Cone Study Area
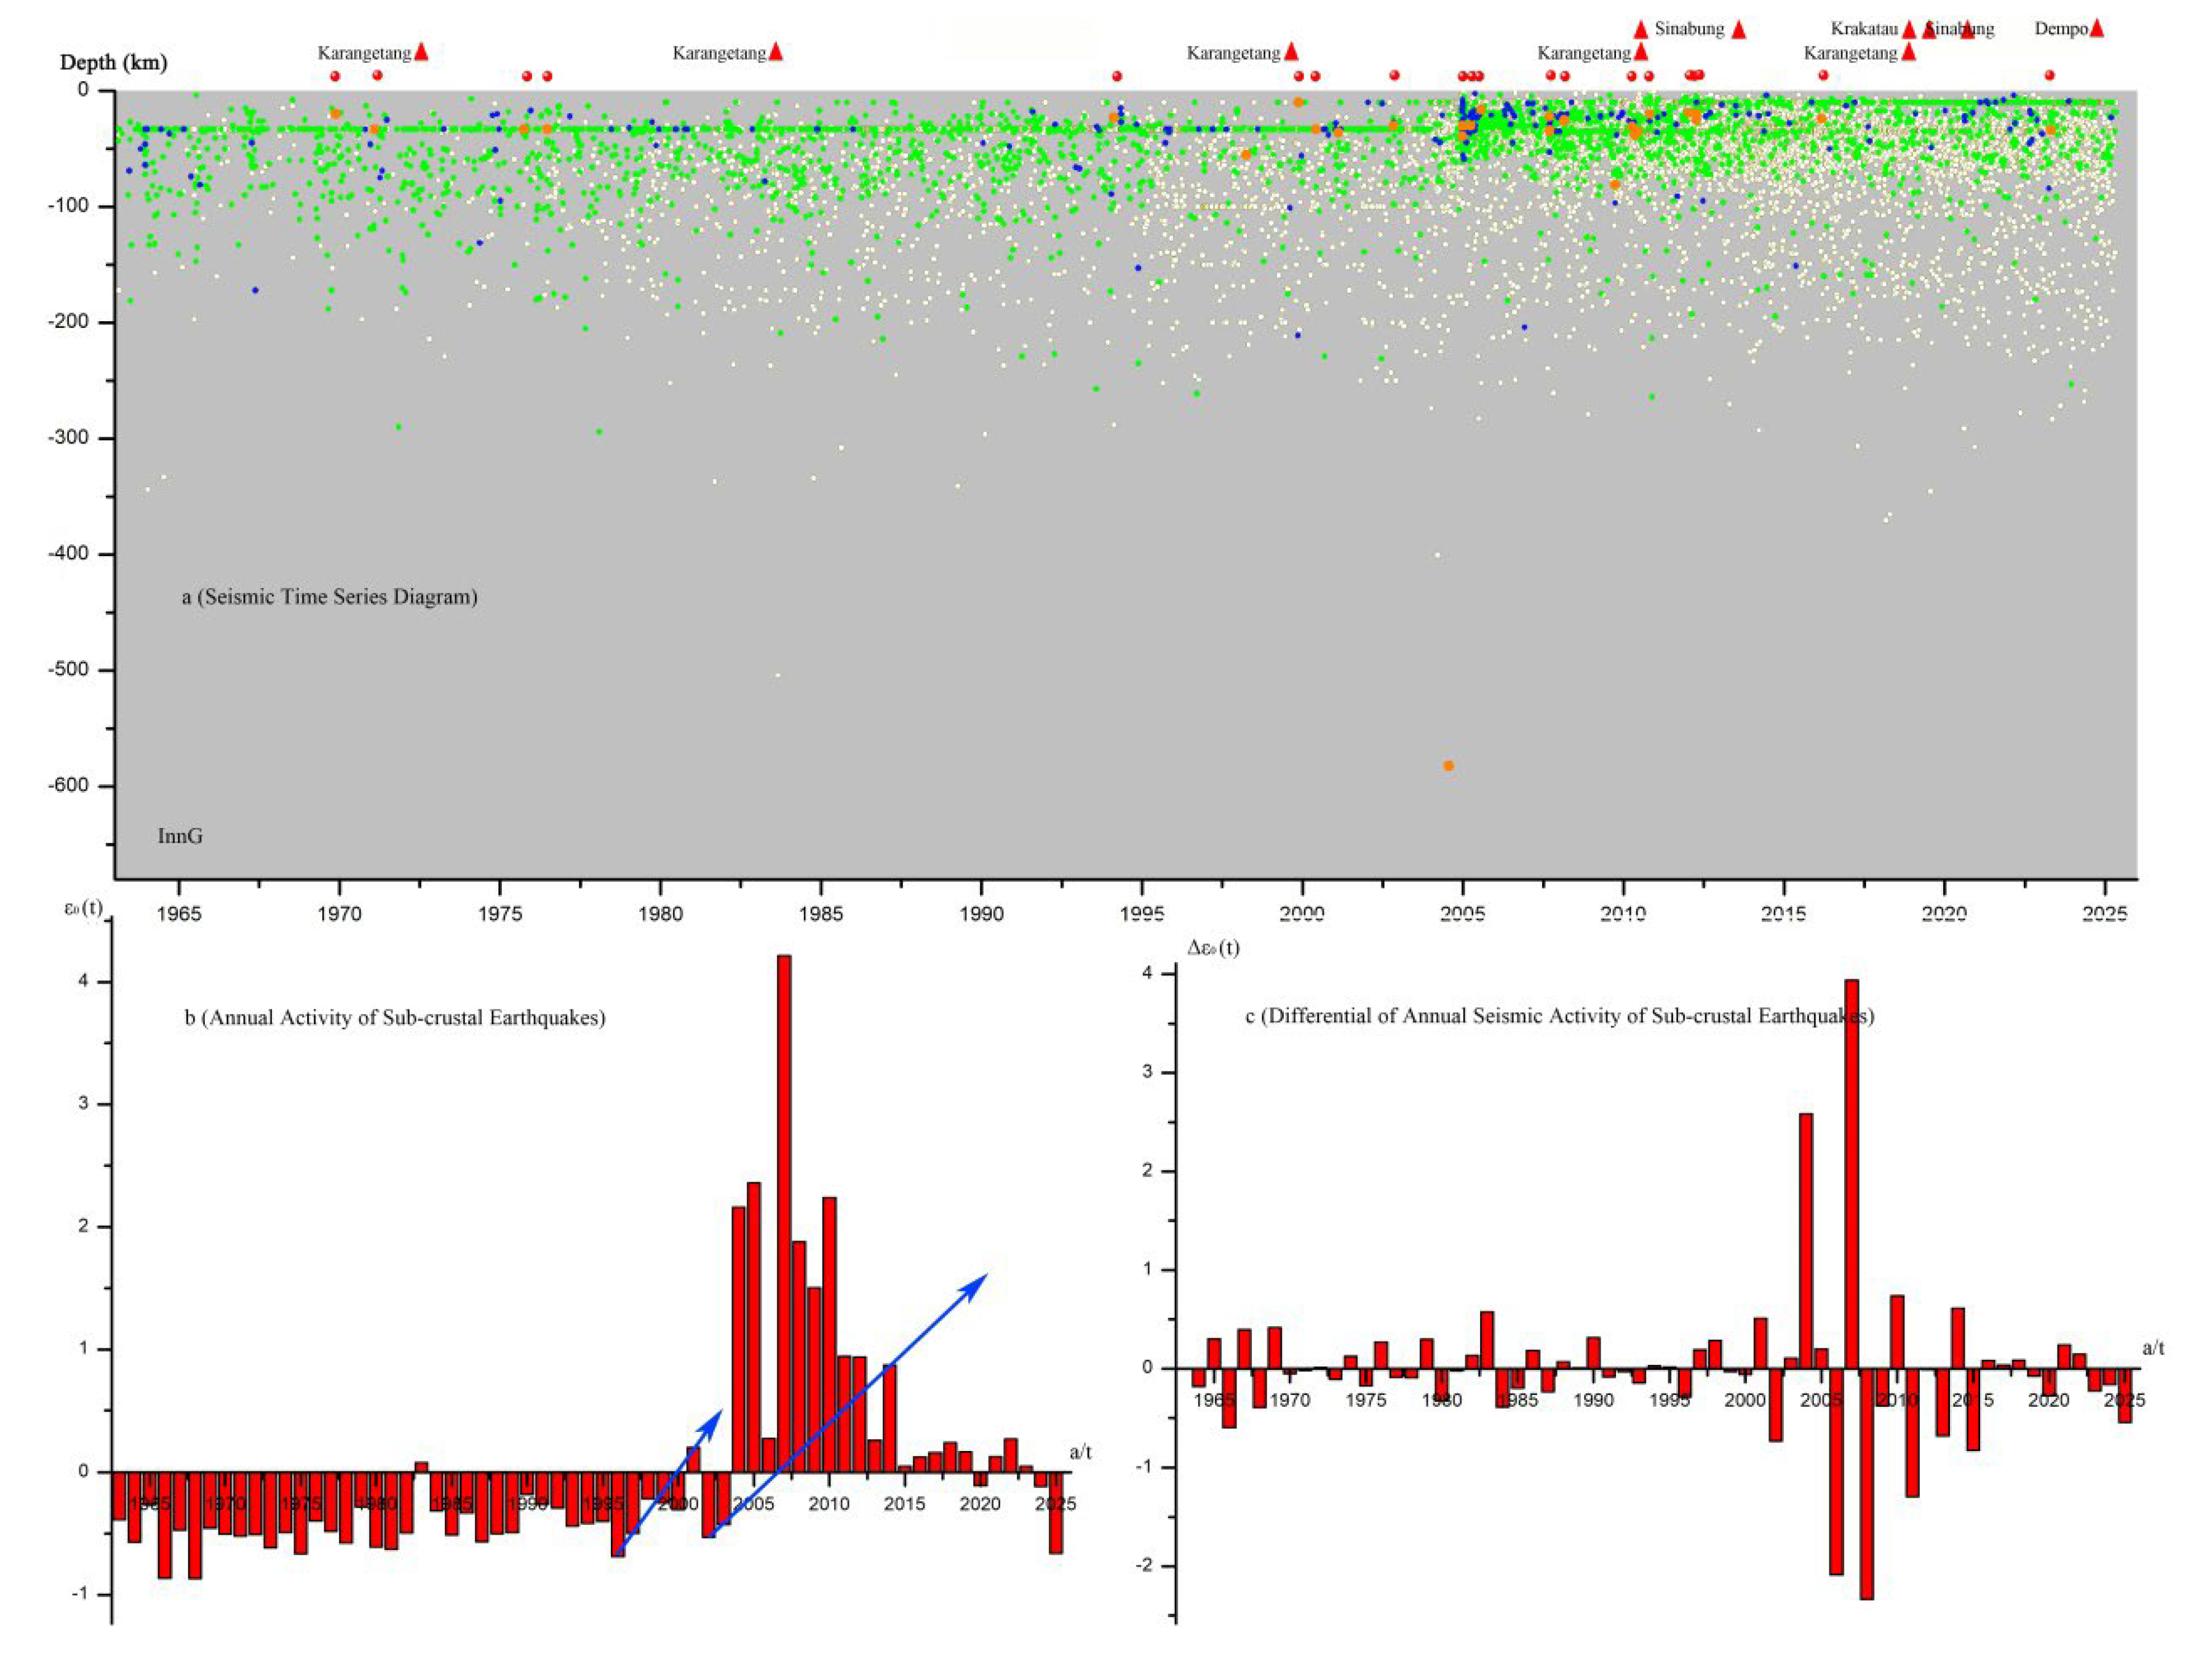
The Inn G sub-cone includes the entire island of Sumatra, Indonesia, where intense intra-crustal earthquakes and volcanic eruptions occur alternately, with an interval of about 10 years. Since 2000, intra-crustal earthquakes of magnitude 7+ and volcanic eruptions of VEI 3+ have occurred alternately in succession. Eruptions of volcanoes such as Sinabung, Krakatoa, and Karangetang can last for months or even years. See Figure 9 and Table 4 for details.
Unfortunately, more precursor information about the 2004 Indonesian M 9.2 earthquake could not be found in this figure, and it may be necessary to rely on Indonesia's local earthquake catalogs of M 1.0+ or M 2.0+.
Figure 9.
Time series diagram and analysis of the Inn G sub-SCT of the Indonesian SCT.
4. Discussion
4.1. Discussion on the Disaster Chain System
It is found through the research in this paper that each individual SCT or sub-SCT can form an independent disaster chain system of strong intra-crustal earthquakes and volcanic eruptions. The disaster chain system independently expresses the interrelationships between sub-crustal earthquakes, strong intra-crustal earthquakes, volcanic eruptions and the surface tectonic system within the SCT. When there is no volcanic activity in the SCT, it only forms a strong intra-crustal earthquake disaster chain system. The disaster chain system is a working platform for studying the causes of earthquakes and volcanoes and their prediction models. The global M 4.0+ earthquake catalog may only yield rough evaluation results, while local earthquake catalogs of M 1.0+ or M 2.0+ are conducive to more detailed research. Therefore, in each seismically and volcanically active area, efforts should be made to strengthen research on earthquake catalog compilation techniques, strive to improve the resolution capability of sub-crustal earthquakes, and it is best to form unified global compilation standards. The proportion of sub-crustal earthquakes must reach more than 20% to meet the basic requirements for the analysis of the Seismo-Geothermics theory.
4.2. Relationship Between the Disaster Chain System and the Surface Tectonic System
In this study, we are fortunate to discover the subtle relationship between sub-crustal seismic activity and the surface tectonic system. The Sumatra Fault in Figure 1 should be attributed to the Yunnan's zigzag-shaped tectonic structure system, a right-lateral strike-slip fault. It can be seen from Figure 5, Figure 6, Figure 7, Figure 8 and Figure 9 that along the sub-crustal seismic activity of this fault zone, the focal depth increases continuously from west to east. East of Java Island, the maximum focal depth stabilizes at over 600 km. What's more, the duration of volcanic eruptions along this fault zone gradually changes from several months or even years in the west to several days in the east. The strongest VEI 5 volcanic eruptions in this region occur in the area with the maximum focal depth.
It can be inferred from this that the seismic activity beneath the crust is not unrelated to the surface tectonic system.
4.3. The Issue of the Activity Cycle of the Driving Layer
The activity cycles of the driving layer in Figure 4, Figure 6, and Figure 8 show an obvious interval of about 18 years. It is speculated that sub-crustal seismic activity may be related to the nutation of the Earth, so an attempt was made to conduct a spectrum analysis of sub-crustal seismic activity. The results show that the spectrum analysis can only detect short cycles of several years, but no cycle components longer than 10 years, which may be due to the limited length of the sample size.
This paper raises this doubt for reference by future researchers.
4.4. The Continuous Rising Period of Activity from 2000 to 2024
As can be seen from Figure 4, Figure 5, Figure 6, Figure 7, Figure 8 and Figure 9, the energy activity of sub-crustal earthquakes is closely related to strong intra-crustal earthquakes and volcanic eruptions. This is the real reason for the frequent occurrence of these two disasters.
Since 2000, the sub-crustal seismic activity in the entire study area has been in a continuous rising state, which changes synchronously with global warming [9]. Synchronously, strong intra-crustal earthquakes and volcanic eruptions in Indonesia have been extremely active, especially in the area east of East Kalimantan Province and on Sumatra Island. This situation will take a long period to relieve, so the assessment or prediction of disasters is very important.
As can be seen from Figure 2, the sub-cone structure in the Indonesian study area can be further divided into several sub-columns. For this reason, it is necessary to use a more refined local seismic catalog of Indonesia to accurately map strong intra-crustal earthquakes and volcanic eruptions to each individual sub-cone structure for tracking and prediction research.
In Figure 9, before the 2004 M 9.2 earthquake in Indonesia, there was only a small rising segment of about 6 years in the sub-crustal seismic activity curve, which seems not to match the major earthquake. This may be related to the monitoring capacity of earthquakes, or it may be necessary to conduct tracking research based on Indonesia's local seismic catalog.
5. Conclusion
Based on the author's self-developed theoretical system of the Seismo-Geothermics theory, this paper uses the M 4.0+ earthquake catalog of Indonesia from the California Earthquake Center in the United States to determine the geographical distribution and three-dimensional spatial distribution characteristics of earthquakes and volcanoes in the study area, according to the concept of Seismic Cone Tectonic divides 7 sub-SCTs, formulates a holographic ideal model of SCT, and defines two concepts: the disaster chain of intra-crustal strong earthquakes and volcanic eruptions, and the annual activity of sub-crustal earthquakes of SCT. For the 6 sub-cone structures directly related to the Indonesian study area, temporal image analysis, annual analysis and differential analysis of activity are carried out. On this basis, a prediction model and research plan for intra-crustal strong earthquakes and volcanic eruptions are formulated, which can be used as a reference for the research on deep-source seismic cone structures in the Indonesian region, the Western Pacific region, the Southwest Pacific region, and the west coast of South America.
At present, people's understanding of the causes of intra-crustal strong earthquakes and volcanic eruptions is still in the realm of necessity in epistemology. They always think that M 7, M 8 or even M 9 intra-crustal strong earthquakes or volcanoes can be brewed by the accumulation of strain energy from surface tectonic movements or the pushing and squeezing of large and small blocks. Little do they know that such strong earthquakes and volcanic eruptions require the accumulation, storage and instantaneous release of energy at a celestial level, and only some kind of force from the overall movement of the Earth can such a miracle be created. Without realizing this, it will always be difficult to enter the realm of freedom.
In order to find such a force, the author has struggled hard all his life, hoping that hard work will be rewarded.
Acknowledgements
This article adopts the M 4.0+ ANSS earthquake catalog of the Indonesian region from California, USA, and has received great help from Researcher Tsering Zhima of the National Institute of Disaster Research of China. We hereby express our sincere gratitude!
Eighty-two years old, July 2025, first draft
Conflicts of Interest
The author declare no conflicts of interest.
References
- Chen Lijun. Study on Earthquake Focal Depth and Strong Earthquake Activity Status in China[J]. Seismology and Geology, 2000, 22(4): 360-370. [CrossRef]
- Chen Lijun, Chen Xiaofeng, Li Pinzhong. Study on Spatiotemporal Characteristics of Strong Earthquakes in China[J]. South China Journal of Seismology, 2007, 27(2): 40-48. [CrossRef]
- Chen Lijun. Principles and Applications of the Seismo-Geothermics[J]. Inland Earthquake, 2012, 26(2): 108-122. [CrossRef]
- Chen Lijun. The Concept of Seismic Cone and Their Basic Characteristics[J]. South China Journal of Seismology, 2013, 33(1): 1-14. [CrossRef]
- Chen Lijun, Hu Fengxiang, Chen Xiaofeng. Seismic Tomography Evidence of Global Seismic Cones[J]. South China Journal of Seismology, 2013, 33(4): 1-10. [CrossRef]
- Chen Lijun. Simplified Map of Major Tectonic Belts Exposed on the Surface of the Northern Hemisphere and Seismic Cone Tectonics in the Upper Mantle - Explanation of Mapping Based on the Seismo-Geothermics[J]. Natural Science, 2020, 8(3): 142-157. [CrossRef]
- Seisman. A Review of Research on Seismo-Geothermics[EB/OL]. 2025-7-7. /: http.
- Chen Lijun. The Dawn of Earthquake Prediction Research in China - A Case Study of Seismic Activity in the Tianshan Region[J]. Chinese Earth Science Review, 2024, 3(2): 52-66. [CrossRef]
- Chen Lijun. Analysis of the Seismo-Geothermics Theory on Global Warming[J]. Chinese Earth Science Review, 2024, 3(3): 99-112. [CrossRef]
Figure 1.
Seismic cone tectonic zoning map of the Indonesia SCT. (Data from the US ANSS Earthquake Catalogue, 1963-2025.5.8, M4.0+). Explanation of Figure 1: Dark green circles represent intra-crustal earthquakes with a depth of less than 35 km; dark green dots represent sub-crustal earthquakes with a depth ranging from 35 to 100 km (the same below); sky-blue dots represent earthquakes with a depth ranging from 100 to 300 km; blue dots represent earthquakes with a depth ranging from 300 to 500 km; orange dots represent earthquakes with a depth greater than 500 km, with the maximum depth being approximately 675 km. Red spheres represent strong intra-crustal earthquakes (with a focal depth of 0-35 km) of magnitude 7.0 or higher that occurred from 1963 to 2025, totaling 57. Red triangles represent volcanoes that erupted from 1963 to 2025 with a VEI of 3 or higher, totaling 26. The red dashed line represents the Sumatra Fault Zone. Solid polygons are schematic diagrams of the influence areas of sub-crustal column structures (sub-SCT), numbered as: Inn A, Inn B, Inn C, Inn D, Inn E, Inn F, and Inn G. The influence area of a sub-crustal column (sub-SCT) is not a fixed block; its scope can be larger or smaller depending on the research objectives, but the core cone area remains unchanged.
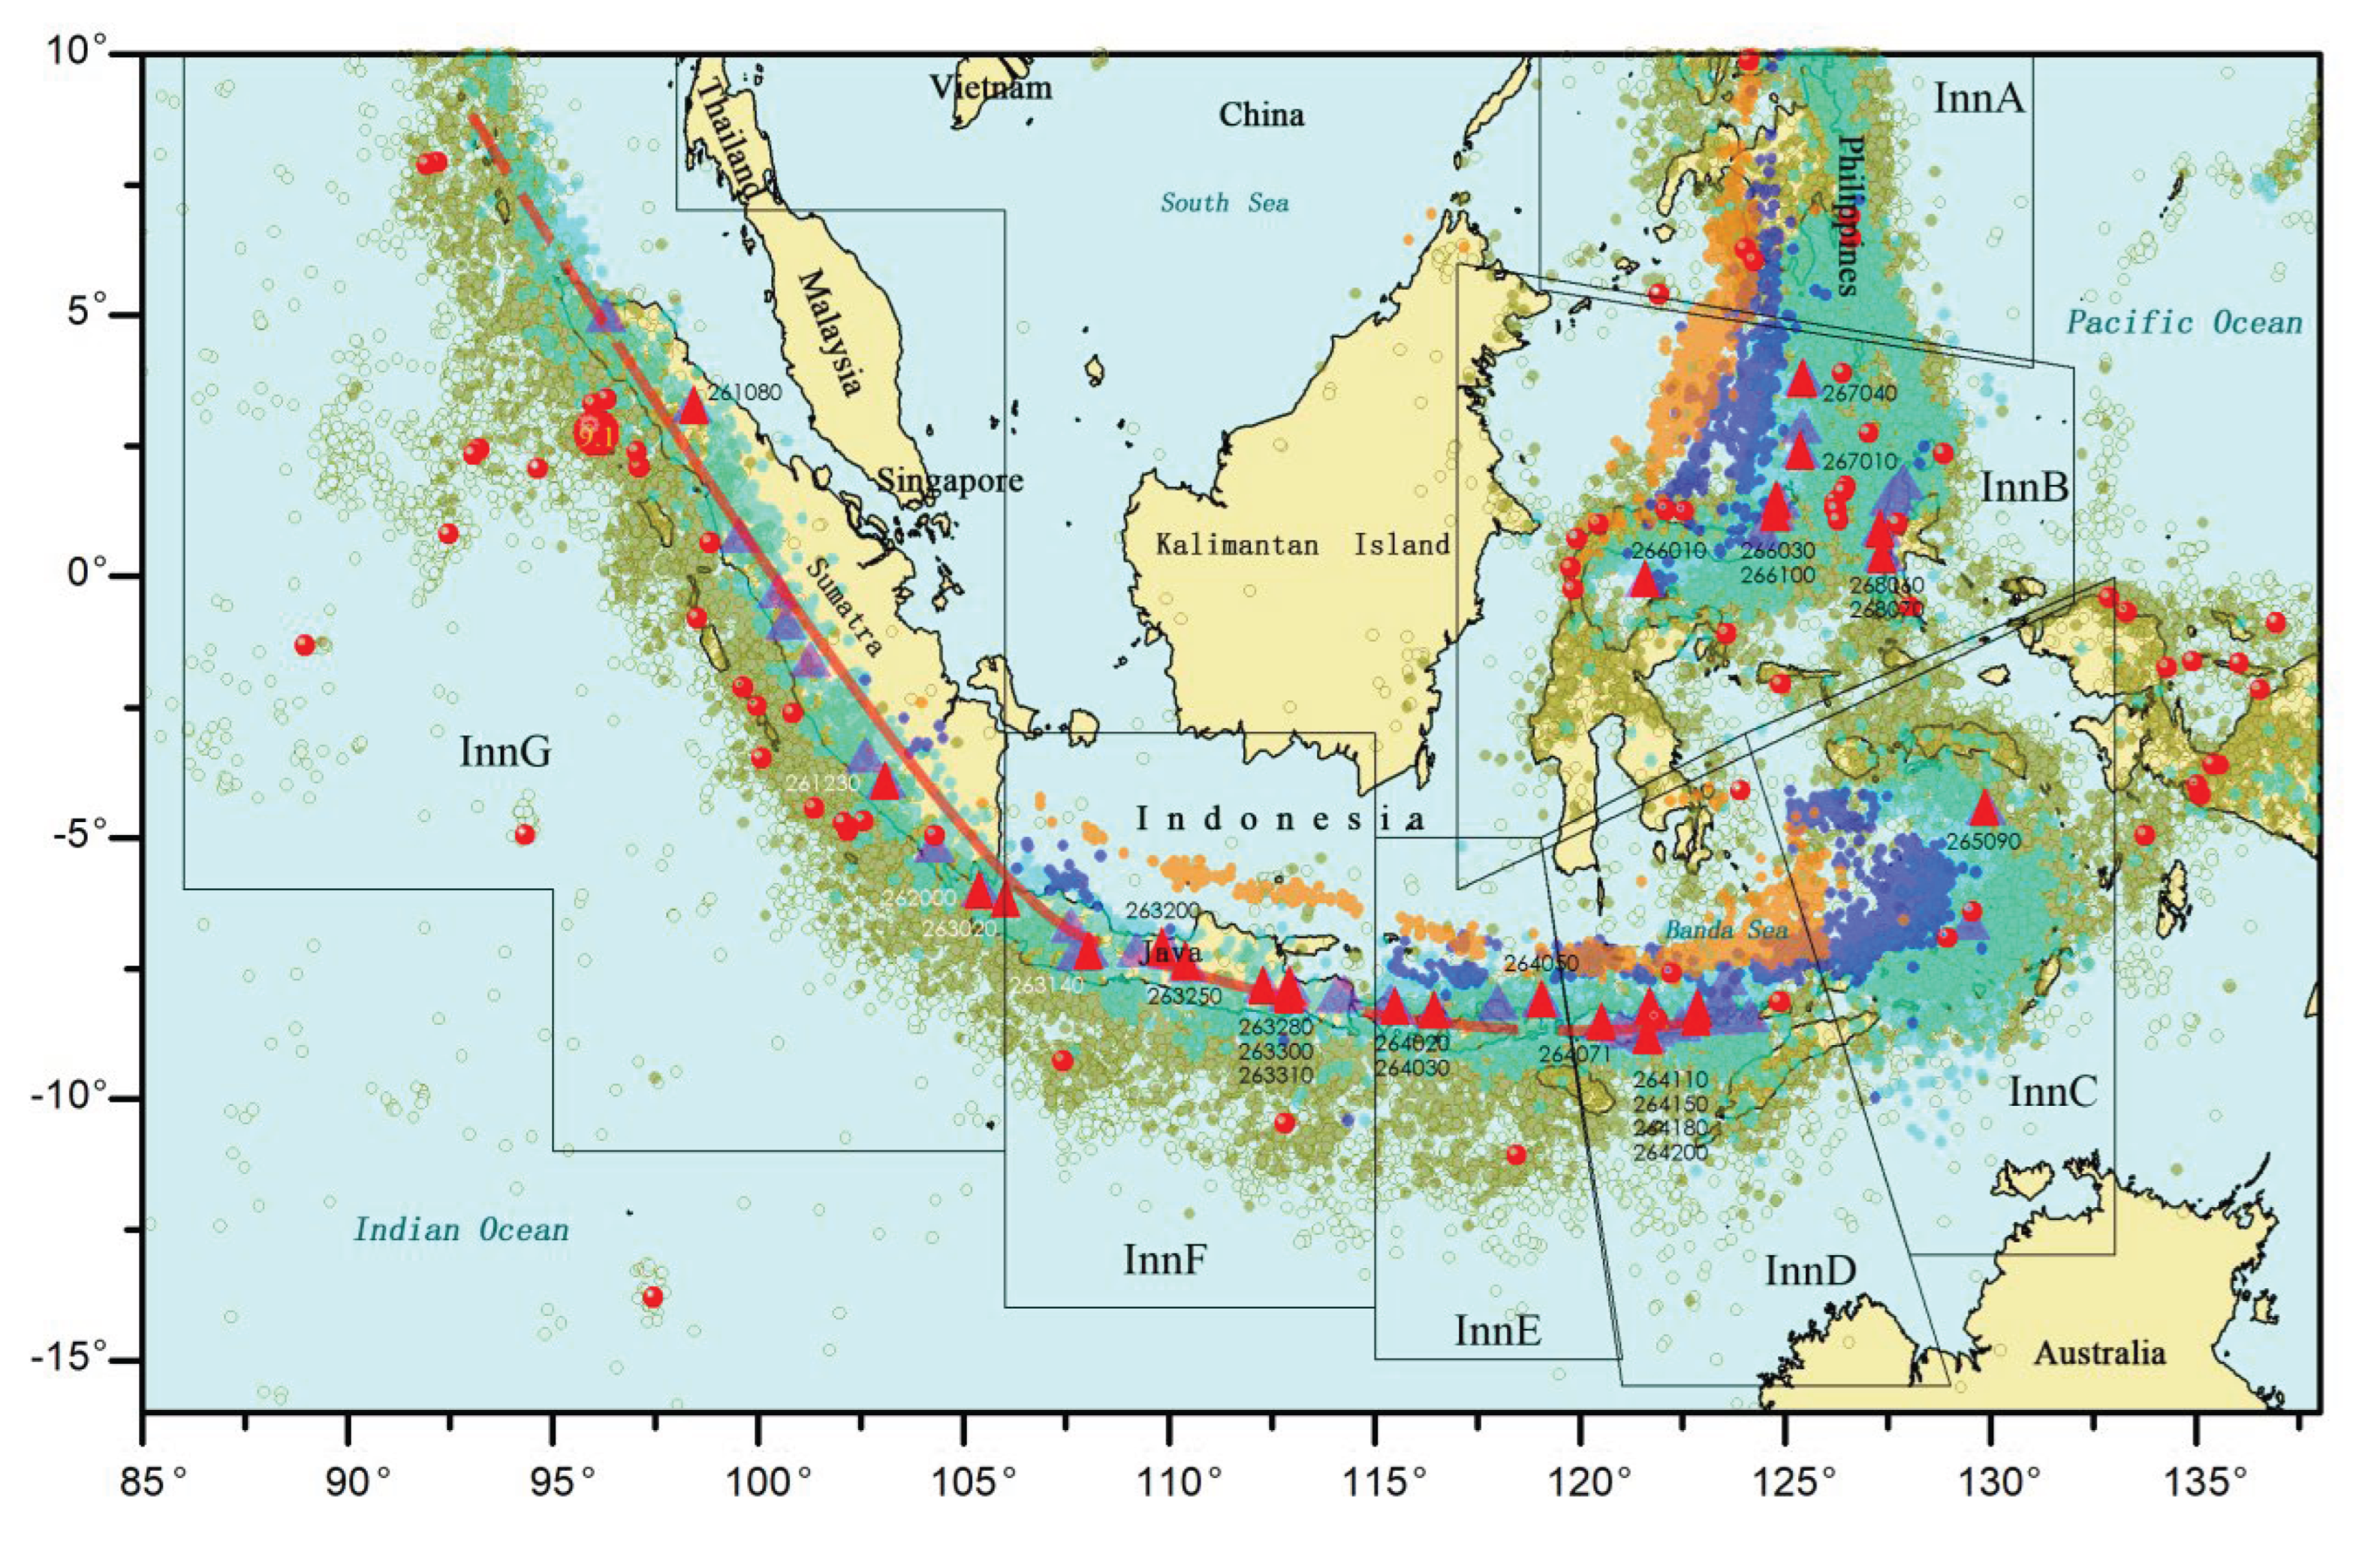
Figure 2.
Stereoscopic images of the sub-SCTs in Indonesia SCT. Explanation of Figure 2: The structure of sub-cones (sub-SCT) is relative. For example, in order to study the causes of a strong intra-crustal earthquake or a volcano in more detail, the relevant sub-SCT can be further decomposed into several sub-cone structures to avoid interference from adjacent sub-cones. The core of the sub-cone structure is dominated by sub-crustal earthquakes, rather than determined by the image of surface earthquakes.
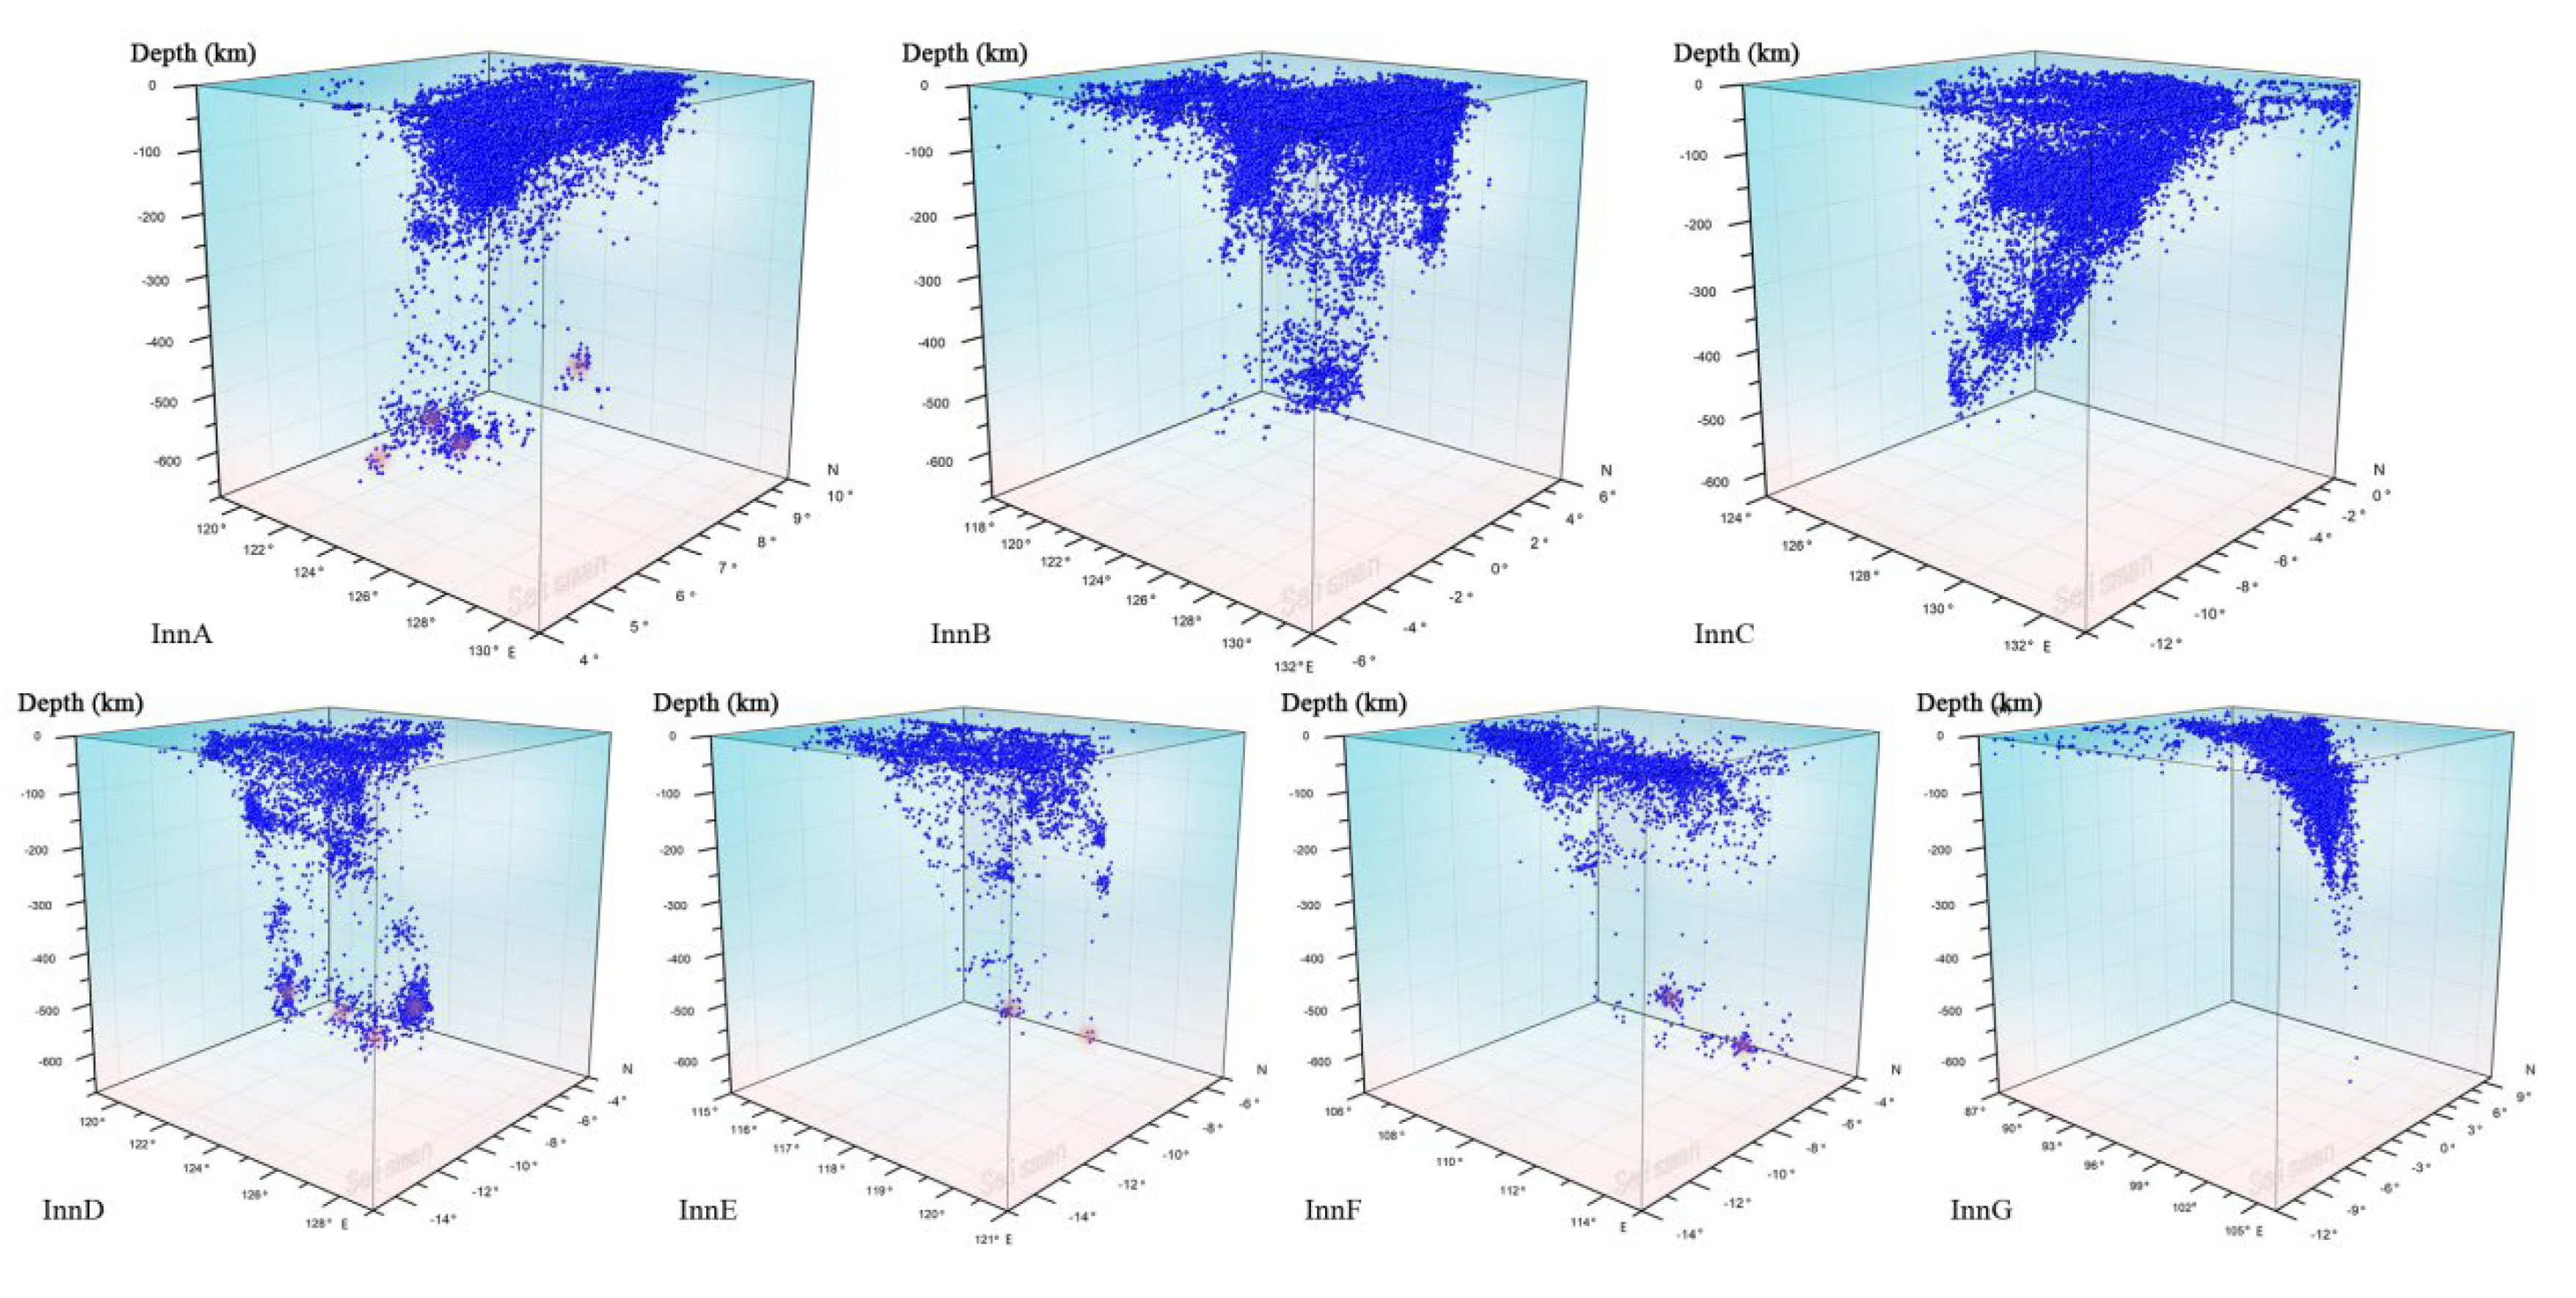
Figure 3.
shows the ideal model of SCT or sub-SCT and the schematic diagram of the disaster chain system. Explanation of Figure 3: The SCT is an inverted cone densely filled with the source bodies of all earthquakes within the affected area. Zone A is the core impact area of the SCT on the Earth's surface, and Zone B is the cross-section of the stable generatrix. The so-called "stable generatrix" refers to a generatrix that is continuous without any missing earthquakes. The generatrices of the cone are symmetric about the exit point O, and there are infinitely many pairs passing through the central axis OZ. The radius r 1 of Zone A, the radius r 2 of Zone B, and the depth h 1 are related to the apparent exit angle α of the generatrix, with the calculation formula "tanα = h 1 / (r 1 - r 2)". Zone C is the cross-section of the maximum source depth h 2 of the sub-crustal earthquakes confirmed by the initial magnitude, and its theoretical apparent radius is r 3. The calculation formula for the theoretical depth h 0 of the SCT is "h 0 = r 1 / tanα", and r 3 is given by "r 3 = (h 0 - h 2) tanα". The depth difference from the vertex Z to Zone C is h 3. When calculating the theoretical volume of the SCT, if necessary, the volume of the cone tip where no seismic activity is detected can be deducted using h 3 and r 3. Hidden in the center of the theoretical cone is a red cylinder, which is a P-wave high-velocity anomaly and can be detected by seismic tomography technology. The relationship between the SCT and the upper mantle strata is shown in the left coordinate axis: 0 -35 km is the crust, a dissipative layer, a heat-dissipating layer, and a working platform for strong intra-crustal earthquakes and seismic cone-type volcanic eruptions; 35-100 km is an energy storage layer containing volcanic magma chambers; 100-300 km is an active layer, a dominant area for olivine phase transformation, and the driving layer for shallow SCTs; 300-660 km is a driving layer, a dominant area for perovskite phase transformation; below that is the bottom of the upper mantle. The temperature and pressure conditions of each stratum are as noted on the coordinate axis. Volcanic eruptions mostly occur near the exit point, while strong intra-crustal earthquakes are located at varying distances from the exit point depending on the distribution of seismogenic structural belt. The Earthquake and Volcano Disaster Chain System (DCS) consists of geological elements such as subcrustal earthquakes within the SCT, strong intra-crustal earthquakes, surface seismogenic tectonic systems (mainly torsional tectonic system), habitual or newly formed volcanic channels, etc. There may also be similar Climate DCS [9].
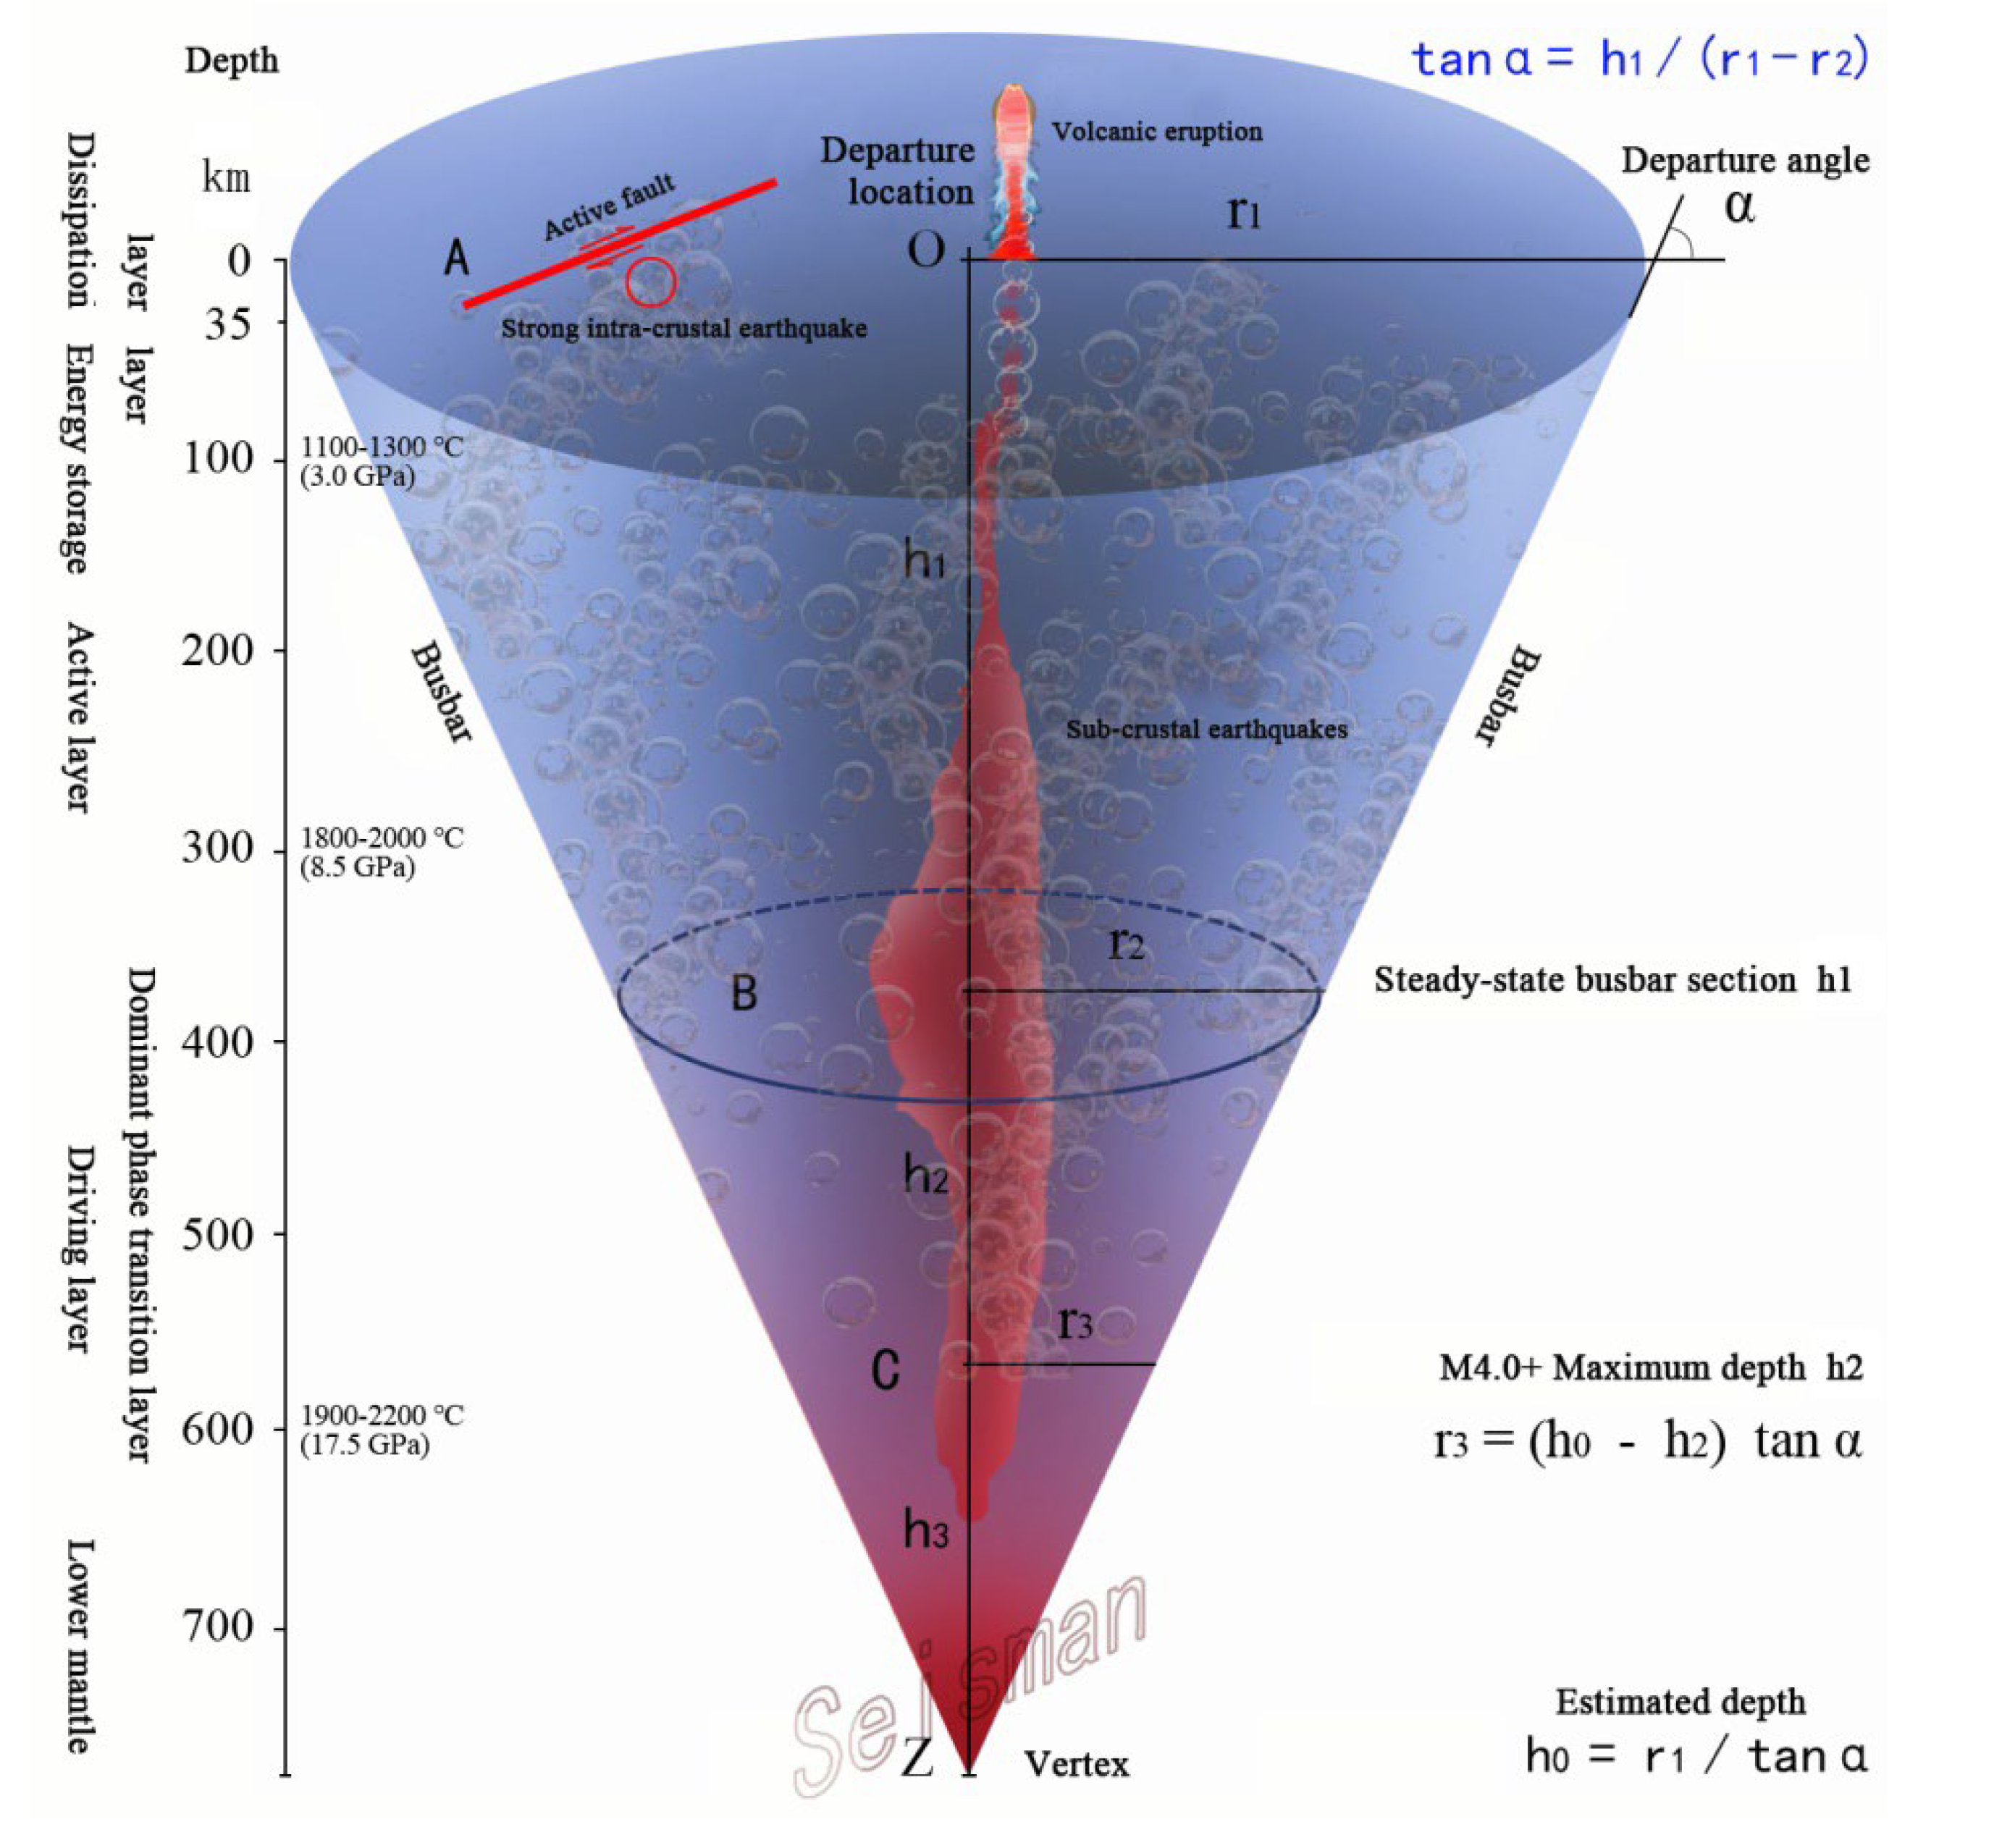

Table 1.
Presents a hierarchical overview of seismic activities of sub-crustal earthquake in the Indonesia SCT.
Table 1.
Presents a hierarchical overview of seismic activities of sub-crustal earthquake in the Indonesia SCT.
| area | sum | crust | shell | Under-shell ratio % | Layering under the shell(km) | Depth (km) |
Mmax | |||
|---|---|---|---|---|---|---|---|---|---|---|
| 35-100 | 100-300 | 300-500 | 500+ | |||||||
| 16Inn | 74,057 | 32,364 | 41,693 | 56.3 | 22,523 | 15,743 | 1,843 | 1,584 | -675 | 9.1 |
Table 2.
List of Parameters for the Six Sub-SCTs of the Indonesian SCT.
| Sub-SCT | sum | crust | shell | Under-shell ratio % | Layering under the shell(km) | Depth (km) |
MMax | |||
|---|---|---|---|---|---|---|---|---|---|---|
| 35-100 | 100-300 | 300-500 | 500+ | |||||||
| Inn B | 20,876 | 7,035 | 13,841 | 66.3 | 8,627 | 4,387 | 358 | 469 | -675 | 7.9 |
| Inn C | 14,839 | 3,989 | 10,850 | 73.1 | 2,947 | 6,706 | 1105 | 92 | -600 | 7.7 |
| Inn D | 4,700 | 1,852 | 2,848 | 60.6 | 844 | 1,111 | 227 | 666 | -675 | 7.9 |
| Inn E | 3,406 | 1,845 | 1,561 | 45.8 | 732 | 696 | 67 | 66 | -647 | 7.9 |
| Inn F | 4,524 | 2,073 | 2,451 | 54.2 | 1,692 | 538 | 29 | 192 | -655 | 7.7 |
| Inn G | 19,079 | 11,872 | 7,209 | 37.8 | 5,838, | 1,355 | 12 | 4 | -582 | 9.1 |
Table 3.
M 7.0+ Intra-crustal Strong Earthquakes in 6 Sub-cones of the Indonesian SCT from 1963 to 2025.
Table 3.
M 7.0+ Intra-crustal Strong Earthquakes in 6 Sub-cones of the Indonesian SCT from 1963 to 2025.
| Sub cone | date | latitude | longitude | depth | Intra-crustal strong earthquakes | Time sequence coordinates (/a) |
|---|---|---|---|---|---|---|
| Inn B | 19680810 | 1.42 | 126.22 | -33 | 7.6 | 1968.606798 |
| 19680814 | 0.16 | 119.78 | -23 | 7.4 | 1968.620018 | |
| 19690223 | -3.11 | 118.87 | -13 | 6.9 | 1969.145276 | |
| 19690811 | 1.72 | 126.47 | -34 | 7.0 | 1969.610945 | |
| 19940121 | 1.01 | 127.73 | -19 | 7.2 | 1994.055069 | |
| 19960101 | 0.72 | 119.93 | -24 | 7.9 | 1996.000921 | |
| 19960722 | 1.00 | 120.45 | -33 | 7.0 | 1996.556276 | |
| 19971125 | 1.24 | 122.53 | -24 | 7.0 | 1997.900028 | |
| 19981129 | -2.07 | 124.89 | -33 | 7.7 | 1998.911207 | |
| 20000504 | -1.10 | 123.57 | -26 | 7.6 | 2000.339294 | |
| 20030526 | 2.35 | 128.85 | -31 | 7.0 | 2003.399474 | |
| 20070121 | 1.065 | 126.282 | -22 | 7.5 | 2007.056103 | |
| 20081116 | 1.271 | 122.091 | -30 | 7.4 | 2008.876257 | |
| 20090211 | 3.886 | 126.387 | -20 | 7.2 | 2009.114336 | |
| 20180928 | -0.2559 | 119.8462 | -20 | 7.5 | 2018.740873 | |
| 20190714 | -0.5858 | 128.034 | -18.98 | 7.2 | 2019.532555 | |
| 20191114 | 1.6213 | 126.4156 | -33 | 7.1 | 2019.870353 | |
| 20230118 | 2.7306 | 127.0221 | -29.708 | 7 | 2023.047272 | |
| Inn C | 19981109 | -6.92 | 128.94 | -33 | 7.0 | 1998.855439 |
| 20090103 | -0.414 | 132.885 | -17 | 7.7 | 2009.007732 | |
| 20231108 | -6.416 | 129.5466 | -6 | 7.1 | 2023.852614 | |
| Inn D | 19921212 | -8.48 | 121.89 | -27 | 7.5 | 1992.94598 |
| 20011019 | -4.10 | 123.90 | -33 | 7.5 | 2001.797657 | |
| 20041111 | -8.152 | 124.868 | -10 | 7.5 | 2004.863097 | |
| 20211214 | -7.6033 | 122.2274 | -14.27 | 7.3 | 2021.951066 | |
| Inn E | 19770819 | -11.08 | 118.46 | -33 | 7.9 | 1977.630839 |
| Inn F | 19940602 | -10.47 | 112.83 | -18 | 7.2 | 1994.418527 |
| 20060717 | -9.284 | 107.419 | -20 | 7.7 | 2006.540676 | |
| Inn G | 19691121 | 2.06 | 94.64 | -20 | 7.7 | 1969.88791 |
| 19710204 | 0.64 | 98.83 | -33 | 7.1 | 1971.094927 | |
| 19751001 | -4.88 | 102.19 | -33 | 7.0 | 1975.748345 | |
| 19760620 | 3.39 | 96.31 | -33 | 7.0 | 1976.469591 | |
| 19940215 | -4.96 | 104.30 | -23 | 7.0 | 1994.125243 | |
| 19991115 | -1.33 | 88.97 | -10 | 7.0 | 1999.871885 | |
| 20000604 | -4.72 | 102.08 | -33 | 7.9 | 2000.425373 | |
| 20021102 | 2.82 | 96.08 | -30 | 7.4 | 2002.83578 | |
| 20041226 | 3.295 | 95.982 | -30 | 9.1 | 2004.983718 | |
| 20050328 | 2.085 | 97.108 | -30 | 8.6 | 2005.237461 | |
| 20050724 | 7.92 | 92.19 | -16 | 7.2 | 2005.560697 | |
| 20070912 | -4.438 | 101.367 | -34 | 8.4 | 2007.697166 | |
| 20070913 | -2.13 | 99.627 | -22 | 7 | 2007.69904 | |
| 20080220 | 2.768 | 95.964 | -26 | 7.4 | 2008.137539 | |
| 20080225 | -2.486 | 99.972 | -25 | 7.2 | 2008.151253 | |
| 20100406 | 2.383 | 97.048 | -31 | 7.8 | 2010.262814 | |
| 20101025 | -3.487 | 100.082 | -20.1 | 7.8 | 2010.815377 | |
| 20120110 | 2.433 | 93.21 | -19 | 7.2 | 2012.02671 | |
| 20120411 | 2.327 | 93.063 | -20 | 8.6 | 2012.27694 | |
| 20120411 | 0.802 | 92.463 | -25.1 | 8.2 | 2012.277177 | |
| 20160302 | -4.9521 | 94.3299 | -24 | 7.8 | 2016.168127 | |
| 20230424 | -0.8082 | 98.5112 | -34 | 7.1 | 2023.311874 |
Table 4.
VEI 3+ Volcanic Eruptions of Each Sub-SCTs in the Indonesian SCT from 1963 to 2025*.
| Sub-SCT | Volcano | name | latitude | Longitude | Start Date | Stop Date | VEI |
|---|---|---|---|---|---|---|---|
| Inn B | 266010 | Colo | -0.162 | 121.601 | 19830718 | 19831216±15d | 4 |
| 266030 | Soputan | 1.112 | 124.737 | 20181002 | 20181216 | 3 | |
| 20160102 | 20160207 | 3 | |||||
| 20120826 | 20120919 | 3 | |||||
| 20110703 | 20110815 | 3 | |||||
| 20080606 | 20081102(?) | 3 | |||||
| 20070616(?)±15d | 2007119(?) | 3 | |||||
| 20041018 | 20041227(?) | 3 | |||||
| 19840524 | 19840831 | 3 | |||||
| 19820826 | 19821110 | 3 | |||||
| 19660521 | 19671116±15d | 3 | |||||
| 266100 | Lokon-Empung | 1.3644 | 124.7992 | 20030912 | 20030912 | 3 | |
| 19910517 | 19920116±15d | 3 | |||||
| 267010 | Raung | 2.3058 | 125.3671 | 20250313 | 20250313 | ||
| 20241215 | 20241224 | ||||||
| 20020925 | 20020929(?) | 4 | |||||
| 19820718 | 19820720 | 3 | |||||
| 267040 | Awu | 3.689 | 125.447 | 19660812 | 19661016±15d | 4 | |
| 268060 | Gamalama | 0.81 | 127.3322 | 19900425 | 19900426 | 3 | |
| 19830809 | 19830812 | 3 | |||||
| 268070 | Kie Besi | 0.32 | 127.4 | 19880729 | 19880805 | 3 | |
| Inn C | 265090 | Banda Api | -4.523 | 129.881 | 19880509 | 19880517 | 3 |
| Inn D | 264071 | Ranakah | -8.637 | 120.5302 | 19871228 | 19890416(±15d) | 3 |
| 264110 | Iya | -8.891 | 121.641 | 19690127 | 19690130 | 3 | |
| 264150 | Paluweh | -8.32 | 121.708 | 20121008 | 20131031±7d | 3 | |
| 19721022 | 19730116 | 3 | |||||
| 264180 | Lewotobi | -8.542 | 122.775 | 20250116 | 20250502(cont.) | (3) | |
| 264200 | Leroboleng | -8.365 | 122.833 | 20030626 | 20030729 | 3 | |
| Inn E | 264020 | Agung | -8.343 | 115.508 | 20171121 | 20190613 | 3 |
| 19630218 | 19640127 | 5 | |||||
| 264030 | Rinjani | -8.42 | 116.47 | 1994063 | 19941121 | 3 | |
| 264050 | Sangeang Api | -8.2 | 119.07 | 20140530 | 20151105 | 4 | |
| 19850730 | 19880216±15d | 3 | |||||
| Inn F | 263140 | Galunggung | -7.25 | 108.058 | 19820405 | 19830108 | 4 |
| 263200 | Dieng Volcano | -7.2 | 109.879 | 20241218 | 20250106 | ||
| 263250 | Merapi | -7.45 | 110.446 | 20180511 | 20200621 | 3 | |
| 20140309 | 20140420 | 3 | |||||
| 20131118 | 20131118 | 3 | |||||
| 20101026 | 20101129 | 4 | |||||
| 263280 | Kelud | -7.935 | 112.314 | 20140213 | 20140215 | 4 | |
| 19900210 | 19900313±45d | 4 | |||||
| 19660426 | 19660427 | 4 | |||||
| 263300 | Semeru | -8.108 | 112.922 | 20170606 | 20250502(cont.) | 4 | |
| 19670831 | 20090315 | 3 | |||||
| 263310 | Tengger Caldera | -7.942 | 112.95 | 20101126 | 20110613 | 3 | |
| Inn G | 261080 | Sinabung | 3.17 | 98.392 | 20200808 | 20210923 | 3 |
| 20190206(?) | 20190609 | 4 | |||||
| 20130915 | 20180622 | 4 | |||||
| 20100827 | 20100917 | 3 | |||||
| 261230 | Dempo | -4.016 | 103.121 | 20241123 | 20250202 | ||
| 262000 | Krakatau | -6.1009 | 105.4233 | 20180618 | 20200417 | 3 | |
| 263020 | Karangetang | -6.268 | 106.05 | 20181125 | 20210130 | 3 | |
| 20100806 | 20101216(?)±15d | 3 | |||||
| 19990316(±15d) | 20031028 | 3 | |||||
| 19830516±15d | 19881231(±) | 3 | |||||
| 19720116±15d | 19760405 | 3 |
*Volcanic eruptions after May 2024 have not been assessed for the Volcanic Explosivity Index (VEI) value.
Disclaimer/Publisher’s Note: The statements, opinions and data contained in all publications are solely those of the individual author(s) and contributor(s) and not of MDPI and/or the editor(s). MDPI and/or the editor(s) disclaim responsibility for any injury to people or property resulting from any ideas, methods, instructions or products referred to in the content. |
© 2025 by the authors. Licensee MDPI, Basel, Switzerland. This article is an open access article distributed under the terms and conditions of the Creative Commons Attribution (CC BY) license (http://creativecommons.org/licenses/by/4.0/).
Copyright: This open access article is published under a Creative Commons CC BY 4.0 license, which permit the free download, distribution, and reuse, provided that the author and preprint are cited in any reuse.


