Submitted:
28 August 2025
Posted:
04 September 2025
You are already at the latest version
Abstract
This study presents a comparative analysis of the stiffness characteristics of brick masonry based on experimental data and an orthotropic model. The main focus is on the influence of mortar joint strength on the anisotropy of the elastic properties of masonry. For three series of samples (KRO-1, KRO-2, KRO-3) with different mortar strengths, experimental compression tests were conducted, along with numerical modeling in the Abaqus software, including micro-modeling and macro-modeling based on an orthotropic model. The results demonstrate that the ratio of the elastic moduli of brick and mortar (Eb/Em) significantly affects the distribution of strains and stresses in the masonry. An asymmetry in the stiffness matrix (D12≠D21) was observed, indicating the need to account for micromechanical effects in the "brick-mortar" contact zones. The highest anisotropy was found in samples with low-strength mortar (series KRO-3), where the anisotropy coefficient D11/D22 reached 1.253. The study confirms the validity of using an orthotropic model to describe the stiffness characteristics of masonry but highlights the necessity of its modification to account for structural heterogeneity and edge effects. The obtained results have practical significance for the design of masonry structures under complex stress conditions.
Keywords:
brick masonry
; orthotropic model
; stiffness anisotropy
; mortar strength
; finite element modeling
; Abaqus
1. Introduction
A critical challenge in designing composite materials lies in predicting their elastic properties. Various methods exist for predicting the elastic properties of composites [1,2,3,4,5,6], which can be broadly categorized into analytical and numerical approaches. Analytical methods, primarily represented by micromechanical models [7,8,9], provide explicit or semi-explicit solutions and thus require relatively low computational effort. However, these methods often rely on specific assumptions and simplifications. On the other hand, numerical methods, predominantly based on finite element analysis of representative volume elements [10,11,12,13], do not require special assumptions to obtain solutions but typically demand significant computational resources. A reliable analytical method is highly desirable in composite material design, as the design process usually involves iterative evaluations of numerous intermediate configurations before achieving the desired properties [14,15].
Consequently, predicting the mechanical behavior of macro-heterogeneous materials—accounting for their constituent properties and spatial arrangement—is of paramount importance. When designing structural elements using such materials, simple and robust computational methods are needed to determine their physico-mechanical properties, stress-strain conditions, and strength estimates. The problem of assessing the stress-strain state of structural elements made of heterogeneous materials [16,17] is addressed through solid mechanics, which often requires complex mathematical formulations. While extensive literature exists on composite material strength [18,19], a unified theory for formulating constitutive laws of structurally heterogeneous media remains lacking.
Research on the mechanical properties of brick masonry is crucial for reliable structural design and simulation. The work of Galyalyuk and Demchuk [20] presents both experimental and numerical data for three series of masonry specimens subjected to compressive loading. In this study, we reproduce and utilize these data to construct the stiffness matrix Dij based on an orthotropic model, identifying patterns and differences between the specimen series.
Recent studies on masonry mechanics, including works presented in [21,22,24,25], highlight the importance of accounting for anisotropy and structural heterogeneity. As demonstrated in [22], proper consideration of boundary conditions in masonry modeling is essential for accurately describing its anisotropic properties: weak mortars require an increased number of courses in the model to mitigate edge effects. For reinforced masonry [24], it has been established that mesh reinforcement compensates for anisotropy, reducing the required number of modeled courses. The study [21] proposes a homogenization method based on numerical simulations of 9-course masonry fragments in Abaqus [22], enabling the identification of a representative volume element (RVE) and revealing the stiffness matrix asymmetry (D12≠D21).
Research [25] demonstrates that the stiffness ratio between brick and mortar (Eb/Em) significantly influences strain distribution in masonry (Figure 1a). This is corroborated by calculations of the stiffness matrix Dij (Table 2) and aligns with experimental data for the KPO-1–KPO-3 series. The results illustrate how Eb/Em affects strain distribution: for KRO-1 (Eb/Em=1.12), the difference Δ1−Δ2 is minimal, whereas for KRO-3 (Eb/Em=2.58), maximum strain divergence is observed. This is quantitatively confirmed by the increase in the anisotropy coefficient D11/D22 from 1.13 to 1.25 (Table 2).
This study aims to develop the stiffness matrix Dij for three distinct series of brick masonry specimens and validate the computational results against experimental data. A complementary objective involves evaluating the applicability of the Abaqus finite element analysis system for simulating the structural performance of masonry, which is critical for predicting its mechanical behavior under various loading conditions.
2. Masonry Materials
2.1. Brick
The study utilized solid ceramic bricks with dimensions of 250×65×120 mm. The brick material exhibited the following mechanical properties:
- Elastic modulus, Eb = 11850 MPa
- Shear modulus, Gb = 4740 MPa
- Poisson’s ratio, μb=0.113
The compressive strength of the bricks, determined according to EN 772-1 standard, was fb = 44.1 MPa.
2.2. Mortar
Three types of masonry mortar with different strength characteristics were employed in the study:
-
Series KRO-1:
- Mortar strength, fm=10.9MPa
- Elastic modulus, Em=10580 MPa
- Shear modulus, Gm= 4232 MPa
- Poisson’s ratio, μm=0.17.
-
Series KRO-2:
- Mortar strength, fm=7.9 MPa
- Elastic modulus, Em=9210 MPa
- Shear modulus, Gm= 3684 MPa
- Poisson’s ratio, μm=0.19.
-
Series KRO-3:
- Mortar strength, fm=3.1 MPa
- Elastic modulus, Em=4600 MPa
- Shear modulus, Gm= 1840 MPa
- Poisson’s ratio, μm=0.23.
The mortar was prepared using dry mix No. 111/11 M100, with adjusted proportions to achieve the required strength. The thickness of mortar joints was maintained at 10 mm for all series.
3. Research Methodology
Masonry Specimens
Figure 1b shows the experimental setup for compression testing of brick masonry specimens. The tests were conducted using a P-125 hydraulic press in compliance with the EN 1052-1 standard [28]. The specimens were subjected to stepwise loading applied perpendicular to the horizontal mortar joints. Displacements and strains were measured using mechanical dial gauges and strain gauges.
where:
Figure 1b (a) diagram of the arrangement of devices (I1-I4 – clock-type movement indicators IGP-1 with a division value of 0.001 mm; hs = 515 mm; ls = 510 mm; ts = 120 mm)
Figure 1b (b) −diagram of the arrangement of devices (I1-I4 – clock-type movement indicators IGP-1 with a division value of 0.001 mm; hs = 780 mm; ls = 305 mm; ts = 120 mm)
The current study employs the following methods:
- a.
- Experimental Investigations
Compression tests were conducted on masonry specimens of series KRO-1, KRO-2 and KRO-3 (Figure 1b), determining the following mechanical properties: elastic modulus Ei, Poisson’s ratios (μxy, μyx) and shear modulus Gxy, calculated using the formulas:
where: Fi,max = ultimate failure load, Ai = cross-sectional area of the specimen, εi = relative longitudinal strain, “3” = load equal to one-third of the ultimate failure load, εx = transverse strain, εy = longitudinal strain.
- b.
- Analytical method for determining the stiffness matrix of anisotropic brick masonry.
This study employs an orthotropic model to construct the stiffness matrix Dij based on the known elastic moduli Ex, Ey and Poisson’s ratios μxy, μyx obtained from references [20,23]. The masonry behavior is assumed to follow a linear orthotropic model under plane stress conditions, where the stress-strain relationship is expressed through the compliance matrix:
To determine the components of the stiffness matrix DD, we solve the system of equations for stresses:
Let us examine two independent loading cases:
Case 1: Axial Loading in x-direction
Case 1: Axial Loading in Y-direction
Formulation of the Equation System
By applying the boundary conditions to the governing equations, we obtain:
Case 2: Axial Loading Along the y-Direction (σₓ ≠ 0, σy = 0, τxy = 0)
Case 2: Axial Loading Along the y-Direction (σₓ = 0, σy ≠ 0, τxy = 0)
Solution for the Stiffness Matrix Components Dij
We obtain the stiffness matrix D in the following form:
- c.
- Numerical Modeling
Finite element modeling of a 7-course unreinforced masonry fragment was performed in Abaqus (micromodeling) using C3D20R elements, with a mesh size of 10 mm for bricks and 5 mm for mortar joints, including local refinement in stress concentration zones. The contact interaction was defined using surface-based cohesive behavior, while boundary conditions consisted of full fixation at the bottom rigid beam and uniformly distributed compressive loading on the top plate, applied incrementally with energy convergence control (ETOL < 1×10⁻⁶) perpendicular to 10 mm thick horizontal mortar joints. For macromodeling, an orthotropic material model with Tie constraints between rigid beams and masonry was implemented using a 20 mm mesh, followed by experimental validation (Figure 2).
Two elastic-domain computational models were sequentially implemented: (1) an Engineering Constants model (Formula 1) with parameters derived from experimental elastic characteristics, and (2) an orthotropic model with stiffness matrix Dij (Formula 9). However, elastic-domain simulations failed to reproduce the experimentally observed stiffness matrix asymmetry (D12 ≠ D21). Accurate elastic-domain representation of this effect would require a fully anisotropic model with 36 independent stiffness components, whereas the experimental study only determined five key parameters (Ex, Ey, μxy, μyx, Gxy), making complete anisotropic characterization unachievable within the existing experimental dataset limited to elastic behavior.
The presented orthotropic model describes only the linear-elastic behavior of masonry, which is its main limitation; as experiments [20,23] show, in masonry with low-strength mortar (KRO-3), microcracks develop under loads exceeding 30–50% of the ultimate, leading to progressive stiffness degradation, and future studies are proposed to address this by introducing scalar damage parameters or employing multistage homogenization that accounts for the crack formation stage.
Finite element modeling in Abaqus was conducted using two approaches: (1) micromodeling of a 7-course masonry fragment (510×515×120 mm for loading perpendicular to joints and 305×780×120 mm for loading parallel to joints) with explicit brick/mortar representation, and (2) macromodeling of equivalent dimensions using an orthotropic material model. This resulted in four distinct models: two micromodels (one per loading direction) and two macromodels (one per loading direction), maintaining geometric consistency with experimental specimens.
Two types of macromodels were used in this study:
- Macromodel EXP – A homogenized model based on experimentally measured elastic properties (Young’s moduli Ex, Ey, Poisson’s ratios μxy, μyx and shear modulus Gxy) from reference [20].
- Macromodel Dij – A refined model incorporating the asymmetric stiffness matrix (calculated via Eqs. 8–9), where D12≠D21.
In Abaqus, the contact is modeled using Cohesive Behavior with separation into normal (Knn) and shear (Kss) stiffnesses. The elastic stage is defined by the interface stiffness matrix (10), which relates normal and shear stresses to relative displacements [29]:
where: tn, ts — normal and shear stresses at the interface, δn, δs — relative displacements (normal and shear), Knn, Kss — stiffness coefficients for tearing/compression and shear, respectively. To describe the behavior of “brick-mortar” contact surfaces, a micro-model approach is used that takes into account the equivalent stiffness of the interfaces. The stiffness characteristics of the contact surfaces are determined through the mechanical properties of the materials and the geometric parameters of the weld according to formula (11):
where hm is the mortar thickness of 10 mm.

Table 1.
Initial mechanical characteristics of materials for calculating contact stiffness in Abaqus.
Table 1.
Initial mechanical characteristics of materials for calculating contact stiffness in Abaqus.
| Series | contact stiffness in Abaqus | |||||||
|---|---|---|---|---|---|---|---|---|
| Eb (MPa) | Em (MPa) | Gb (MPa) | Gm (MPa) |
(MPa)/мм |
(MPa)/мм |
|||
| KRO -1 | 11850 | 10580 | 4740 | 4232 | 0.113 | 0.17 | 987.2 | 394.9 |
| КRО-2 | 9210 | 3684 | 0.19 | 413.4 | 165.4 | |||
| KRO -2 | 4600 | 1840 | 0.23 | 75.2 | 30.1 | |||
For the studied series of masonry (KRO-1, KRO-2, KRO-3), the rigidity parameters were calculated on the basis of experimental data:
4. Results and Discussion
4.1. Results
The results of calculating the stiffness matrix Dij, presented in Table 2, were obtained on the basis of experimental data and shear moduli using the orthotropic model.
The shear modulus Gxy in the xy plane is calculated according to the data of [20], Ex, Ey: Elastic moduli in principal material directions, D11, D22: Diagonal components of the stiffness matrix.
Key Observations:
- Model Validation:
The ratios Ex/Ey and D11/D22 are nearly identical for each series (difference < 0.001), confirming the validity of the orthotropic model.
- 2.
-
Anisotropy Trends:
- Maximum anisotropy occurs in KPO-2 (Ex/Ey=1.264)
- Minimum anisotropy is observed in KPO-1 (Ex/Ey=1.134)
- 3.
- Unexpected Stiffness Behavior:
For KPO-3, both Ex/Ey and D11/D22 exhibit a slight decrease compared to KPO-2, despite a more pronounced difference between Ex and Ey.
The discrepancy between experimental stiffness values and the orthotropic model (Eqs. 8–9) arises due to directional loading effects in experiments (measuring deformation modulus along load axes) versus the model’s comprehensive strain-stress coupling (including Poisson’s ratios μxy, μyx). Additionally, micromechanical heterogeneity at brick-mortar interfaces induces stiffness matrix asymmetry (D12≠D21), unaccounted for in classical orthotropy, necessitating modified homogenization approaches with asymmetry correction factors (e.g., α=D12/D21) and representative volume element (RVE) upscaling to mitigate edge effects.
Analysis and Comparison of Data in Table 2
The analysis revealed that KRO-1 specimens exhibited the highest stiffness characteristics in both X and Y directions, attributable to the use of high-strength mortar (grade M109). KRO-2 demonstrated intermediate values, while KRO-3 showed the lowest performance, consistent with experimental findings.
The D₃₃ shear stiffness component progressively decreased from KRO-1 to KRO-3, indicating degradation of brick-mortar interfacial mechanical behavior with reduced mortar strength. Comparative analysis confirmed the correlation between stiffness matrix components (D₁₁, D₂₂) and elastic moduli (Eₓ, Eᵧ) from reference [23], demonstrating a consistent trend: mortar strength reduction directly diminishes masonry stiffness. This effect was particularly pronounced for D₃₃, highlighting the critical role of material bonding in structural performance.
Using Table 2 data, anisotropy coefficients (k, n), parameter m, and averaged symmetric model Dsym were calculated through relationships (12, 13) from references [26,27]:
The parameters k and n, related to m through the equation m = n² - 2k, represent independent characteristics of an orthotropic plate. Their introduction simplifies stress calculations in formula (10) and generalizes results for plane strain problems through reduced coefficients, where:
- k quantifies the degree of stiffness anisotropy between orthogonal directions (x - along mortar joints, y - across joints), with k=1 indicating isotropic material (Eₓ=Ey) and k≠1 confirming anisotropy;
- m reflects the combined influence of shear stiffness (Gₓᵧ) and transverse deformations on anisotropy, where m=0 for isotropic materials and m>0 for masonry due to low shear stiffness of mortar joints;
- n serves as a comprehensive parameter combining longitudinal and shear anisotropy effects, with n=2 for isotropic cases and n≠2 demonstrating anisotropy.
Formula (13) introduces the averaged symmetric stiffness matrix Dsym that approximates the asymmetric components D12 and D21 of the classical orthotropic model through their arithmetic mean:
For an asymmetric stiffness matrix (D12 ≠ D21), a correction factor α is introduced, reflecting the degree of asymmetry:
characterizes the degree of deviation from the classical orthotropic model.
Modified parameters (15) are introduced to account for the stiffness matrix asymmetry D12≠D21:
Analysis of the data presented in Table 3 leads to the following conclusions:
- Effect of stiffness matrix asymmetry:
The consideration of asymmetric stiffness matrix components (D₁₂ ≠ D₂₁) results in a significant 30-65% increase in anisotropy coefficients compared to the symmetric model.
- 2.
- Critical case for KRO-2 series:
The most substantial deviations were observed for KRO-2 specimens, where the asymmetry coefficient α reaches 1.65 and the modified parameter nₘₒ𝒹 attains a value of 2.38.
- 3.
- Theoretical implications:
The obtained results demonstrate the necessity to modify the classical Lekhnitsky approach [26] through the introduction of a correction factor α, which is particularly relevant for materials with pronounced structural heterogeneity (Figure 3a).
The error is calculated as:
For α, the error is not specified, since the symmetric model by definition assumes α=1.
Table 4 clearly demonstrates that the asymmetric model (D₁₂≠D₂₁) more accurately captures masonry behavior, particularly for parameter k where symmetric model errors reach 65%, confirming the necessity of accounting for anisotropy in stiffness calculations; while differences are less critical for parameter n, simplifying its estimation in engineering applications (Figure 3b), with series KRO-2 showing critical error levels (65%) that mandate asymmetric model implementation, as derived from stiffness matrix Dij analysis.
The numerical simulation results presented in Figures 4–6; demonstrate the distribution of vertical compressive stresses and horizontal strains in perpendicular and horizontal mortar joints for three experimental series (KRO-1, KRO-2, KRO-3), obtained through: (1) micro-modeling, (2) EXP macro-modeling of a homogeneous anisotropic medium (based on experimental values from [20]), and (3) D macro-modeling of a homogeneous anisotropic medium (using the calculated stiffness matrix Dij), conclusively demonstrating the significant influence of mortar joint strength on the formation of structural stress states.
In Figure 4a (loading perpendicular to the joints), a uniform distribution of vertical stresses and horizontal deformations is observed in the KRO-1 series masonry, which is attributed to the high strength of the mortar (Eb>/Em=1.12), whereas in Figure 4b (loading parallel to the joints), the stress and strain distribution is less uniform but remains stable, confirming the anisotropy of the masonry. At the same time, as demonstrated in [22], to fully eliminate edge effects, modeling of masonry fragments with at least 9 vertical rows and 4 bricks in length is required, highlighting the importance of accounting for edge effects and the micromechanics of “brick-mortar” interactions for accurate prediction of masonry behavior, especially under complex loading conditions.
Table 5, Table 6 and Table 7 present calculated errors in vertical stress and horizontal strain determinations for KRO-1, KRO-2, and KRO-3 masonry under different load orientations relative to mortar joints, with the strain error (ε) calculation formula for each macromodel versus the micromodel given by:
Stres error (σ):
The error quantification methodology employs: (macromodel-calculated strain), (micromodel reference strain), (macromodel stress), and (reference micromodel stress), with percentage deviation calculated analogously for both stress and strain components using the unified formula (17, 18). For the analysis, control isopoles 2, 6, and 10 were selected, uniformly distributed along the specimen height, to: (1) eliminate local edge effects in contact zones with support plates, (2) cover all characteristic stress state regions (bottom, middle, and top), and (3) ensure data representativeness by analyzing zones with established stress fields.
- Figure 5a (loading perpendicular to joints, KRO-2): A uniform distribution of vertical stresses (σy) is observed, with localized concentrations (up to 15%) in edge zones, while horizontal strains (εx) exhibit elevated values near boundaries (EXP errors: up to 29%, D-model: up to 18.3%), confirming the influence of edge effects, partially mitigated by the orthotropic model.
- Figure 5b (loading parallel to joints, KRO-2): Stress distribution is less uniform, with pronounced concentrations near vertical joints (σy errors up to 15.1%), and strains (εx) in edge zones show significant deviations (EXP errors: up to 35.7%, D-model: up to 28.6%), highlighting the critical role of brick-mortar contact micromechanics and the need for larger RVEs to minimize inaccuracies.
As seen in Figure 6a and Figure 6b, masonry with low-strength mortar (KRO-3) exhibits significant stress heterogeneity, which correlates with high macro-modeling errors (Table 7), confirming the need to account for the micromechanics of contacts in computational models; moreover, as shown in [22], accurate description of edge effects requires modeling masonry fragments with a minimum of nine rows, which is particularly important for specimens with low mortar strength.
Stress-strain visualization (Figures 4–6) reveals pronounced masonry anisotropy, evidenced by fundamentally different mechanical responses under loading perpendicular (Figure 4a, Figure 5a and Figure 6a) versus parallel (Figure 4b, Figure 5b and Figure 6b) to mortar joints, with KRO-1 (high-strength mortar) exhibiting uniform stress distribution (≤15% variation) while KRO-3 (low-strength mortar) shows acute stress concentrations (local peaks ≤40%) and marked strain field heterogeneity.
Comparative experimental-calculated data analysis (Table 5, Table 6 and Table 7) demonstrates satisfactory agreement (≤7% error) for KRO-1 using orthotropic modeling, whereas KRO-3 displays significant discrepancies (≤65%) due to unaccounted microstrains in weak joints, substantiating the need for modified orthotropic models incorporating stiffness matrix asymmetry and edge effect correction factors.
4.2. Discussion
Experimental investigations revealed significant stiffness matrix asymmetry (D₁₂ ≠ D₂₁) [21,24], demonstrating the necessity to account for micromechanical effects, including localized brick-mortar interfacial deformation processes and structurally-induced anisotropy. The classical orthotropic model’s assumption of elastic symmetry (D₁₂ = D₂₁) produced statistically significant deviations from experimental data, particularly pronounced in specimens with weak mortar joints (KRO-3), where joints acted as stress-concentrating weak links. While macromodeling (orthotropic approach) simplified computations, it failed to capture microstructural influences on joint stress distribution.
To enhance predictive accuracy, we propose a modified anisotropic model incorporating asymmetry corrections through an anisotropy coefficient α = D₁₂/D₂₁ (Formula 14) for masonry series (KRO-1, KRO-2, KRO-3), with optimal Eb/Em ratios identified for edge effect mitigation.
The proposed orthotropic model with asymmetry correction provides accurate predictions for uniaxial compression of unreinforced brick masonry with medium-to-high mortar strength (series KRO-1–KRO-3). However, its applicability is limited by:
- (a)
- Material and geometric constraints: The model requires validation for reinforced masonry, thin-bed joints, or alternative brickwork patterns (e.g., English bond).
- (b)
- Loading scenarios: Nonlinear effects (cracking, creep) and multidirectional stresses were not considered.
- (c)
- Scale effects: The RVE size (4 courses for vertical loading) may not capture behavior in full-scale structures under complex boundary conditions.
5. Comparison of Voigt and Reuss Methods for Masonry Stiffness Assessment Considering RVE
In this section, a comparative analysis is presented of methods for evaluating masonry stiffness based on the classical Voigt and Reuss approaches, taking into account the determination of the representative volume element (RVE). These methods are widely used for predicting the effective mechanical properties of heterogeneous materials; however, their applicability to anisotropic structures such as brick masonry requires further investigation [30,31,32,33].
The conducted analysis demonstrates that classical methods based on the assumption of isotropy or symmetry of properties can lead to significant errors in masonry stiffness evaluation, particularly for specimens with low-strength mortar (KRO-3). To improve calculation accuracy, a modification of the orthotropic model has been proposed through the introduction of an asymmetry coefficient α = D₁₂/D₂₁, which enables accounting for micromechanical effects at the “brick-mortar” interfaces.
5.1. RVE Determination via Indicator Zones
The Representative Volume Element (RVE) was established using experimental indicator zone data (Figure 1b). For brickwork with brick dimensions 250×65×120 mm and 10 mm joint thickness, RVE selection followed:
- (a)
- Y-axis loading (vertical, perpendicular to joints): RVE encompasses 4 brick courses (indicator zones)
- (b)
- X-axis loading (horizontal, parallel to joints): RVE comprises 2 brick rows (indicator zones)
5.2. Stiffness Evaluation Methods
Two classical approaches were applied for effective stiffness calculation:
- Voigt Method: Assumes uniform strain across components, computing stiffness as volume-weighted average:
- Y-axis (perpendicular to joints): = 86.7%, = 13.3%
- X-axis (parallel to joints): = 86.7%, = 13.3%
with calculations based on cross-sectional area ratios in the RVE according to the formula.
where Ai − cross-sectional area of component in RVE, Atotal = Ab+ Am− total cross-sectional area сечения.
- 2.
- Method Reuss:
Assumes uniform stress across components, calculating compliance as:
where − compliance tensors for mortar and brick
Stiffness tensors for isotropic materials are defined via Young’s modulus (E) and Poisson’s ratio (μ):
Table 8 compares two classical methods for evaluating masonry stiffness—the Voigt method and the Reuss method—against the calculated stiffness matrix components Dij derived from experimental data and the orthotropic model. The goal is to assess the accuracy of these methods for different sample series (KRO-1, KRO-2, KRO-3) and identify their limitations.
The error for each method was calculated as the percentage deviation from the experimental Dij values:
Analysis of Table 8 reveals that the Voigt method demonstrates lower error for diagonal stiffness matrix components D11, D33, particularly for KRO-1 and KRO-2 series (error ≤ 5.6%), while the Reuss method shows better accuracy for off-diagonal terms (D12, D21) in KRO-3 series (error ≤44.9%). Both methods, however, significantly underestimate the matrix asymmetry (D12, D21), confirming the necessity to modify classical approaches to account for masonry anisotropy and micromechanical effects.
Figure 7 shows a graphical comparison of the errors obtained using two classical methods for estimating masonry stiffness — the Voigt method and the Reuss method — relative to the orthotropic model, with the errors calculated for the components of the stiffness matrix Dij (Table 8) and expressed as percentage deviations.
Although the Voigt and Reuss estimates provide reasonable results for isotropic composites, their underlying assumptions of (a) uniform stress/strain fields and (b) material symmetry make them fundamentally unsuitable for modeling the orthotropic behavior of masonry, particularly the experimentally observed stiffness matrix asymmetry (D12/D21>1.3) arising from the micromechanics of interfacial boundaries.
The Figure 8 illustrates the dependence of the effective elastic moduli on the stiffness ratio Eb/Em for the three series of specimens (KRO-1, KRO-2, KRO-3).
Both Ex and Ey decrease significantly as (Eb/Em) increases, reflecting the progressive weakening of mortar relative to brick. Specifically, Ex decreases from approximately 11.2 to 6.5 GPa, while Ey decreases from about 9.8 to 5.1 GPa.
The stiffness matrix components obtained from Eqs. (8–9) (D11, D22) closely follow the experimental trends and remain consistently bounded by the classical Voigt and Reuss estimates. The Voigt method provides an upper bound that slightly overestimates stiffness, while the Reuss method gives a lower bound that underestimates it. The widening gap between the bounds with increasing (Eb/Em) indicates a stronger influence of structural heterogeneity when weaker mortar is used, accompanied by a marked increase in anisotropy between the x- and y-directions.
Thus, the comparison confirms that the orthotropic model derived from Eqs. (8–9) accurately captures masonry behavior. Moreover, mortar stiffness is identified as a governing factor controlling both the magnitude of effective moduli and the degree of anisotropy. These findings support the applicability of the modified orthotropic model for numerical calibration (e.g., finite element simulations) and for predicting the in-plane mechanical response of masonry walls under compressive loading.
6. Conclusions
This study established fundamental relationships between mortar joint mechanical properties and anisotropic behavior of unreinforced brick masonry. Experimental and numerical results (including micro- and macro-modeling using orthotropic formulation) demonstrated significant stress distribution dependence on the brick-to-mortar elastic modulus ratio (Eb/Em). The identified stiffness matrix asymmetry (D12 ≠ D21) necessitates accounting for structural heterogeneity and micromechanical processes at brick-mortar interfaces in computational models.
The highest anisotropy occurred in low-strength mortar specimens (KRO-3 series) with anisotropy coefficient D11/D22 reaching 1.253. KRO-1 series (high-strength mortar) exhibited more uniform stress distribution, indicating reduced anisotropy effects. Nevertheless, even in this case, classical orthotropic models assuming matrix symmetry showed statistically significant deviations from experimental data.
The research results highlight the critical need to account for the following factors to enhance masonry behavior prediction accuracy:
- a)
- Material anisotropy driven by brick-mortar stiffness disparity
- b)
- Edge effects, particularly pronounced in low-strength mortar specimens
- c)
- Elastic property asymmetry, necessitating classical orthotropic model modifications
- d)
- Real service conditions, including loading direction and masonry component interactions
The stiffness matrix asymmetry represents a fundamental physical characteristic of masonry rather than an artifact, demanding model refinements. While the correction factor α can currently be employed for engineering calculations, comprehensive understanding requires additional experimental and numerical investigations.
Future work should address:
- Extension to reinforced masonry and non-standard geometries.
- Incorporation of nonlinear material models for damage analysis.
- Experimental validation under shear and combined loading.
Author Contributions
The author confirms sole responsibility for study conception, design, data collection, analysis, interpretation, and manuscript preparation.
Funding
This research did not receive any specific grant from funding agencies in the public, commercial, or not-for-profit sectors.
Acknowledgments
This research did not receive any specific grant from funding agencies in the public, commercial, or not-for-profit sectors.
Competing Interests
The author declares no competing interests.
References
- Pindera, M.-J.; Khatam, H.; Drago, A.S.; Bansal, Y. Micromechanics of spatially uniform heterogeneous media: A critical review and emerging approaches. Composites Part B Engineering 2009, 40, 349–378. [Google Scholar] [CrossRef]
- Armbrister, O.I.; Okoli, C.E.E.; Shanbhag, S. Micromechanics predictions for two-phased nanocomposites and three-phased multiscale composites: A review. Journal of Reinforced Plastics and Composites 2015, 34, 605–623. [Google Scholar] [CrossRef]
- Buryachenko, V.A. Multiparticle effective field and related methods in micromechanics of composite materials. Applied Mechanics Reviews 2001, 54, 1–47. [Google Scholar] [CrossRef]
- Raju, B.; Hiremath, S.R.; Mahapatra, D.R. A review of micromechanics-based models for effective elastic properties of reinforced polymer matrix composites. Composite Structures 2018, 204, 607–619. [Google Scholar] [CrossRef]
- Wang, Y.; Huang, Z. A review of analytical micromechanics models on composite elastoplastic behaviour. Procedia Engineering 2017, 173, 1283–1290. [Google Scholar] [CrossRef]
- Christensen, R.M. A critical evaluation for a class of micromechanics models. Journal of the Mechanics and Physics of Solids 1990, 38, 379–404. [Google Scholar] [CrossRef]
- Muzel, S.D.; Bonhin, E.P.; Guimarães, N.M.; Guidi, E.S. Application of the finite element method in the analysis of composite materials: A review. Polymers 2020, 12, 818. [Google Scholar] [CrossRef]
- Bargmann, S.; et al. Generation of 3D representative volume elements for heterogeneous materials: A review. Progress in Materials Science 2018, 96, 322–384. [Google Scholar] [CrossRef]
- Yim, S.O.; Lee, W.J.; Cho, D.H.; et al. Finite element analysis of compressive behavior of hybrid short fiber/particle/mg metal matrix composites using RVE model. Metals and Materials International 2015, 21, 408–414. [Google Scholar] [CrossRef]
- Singh, I.V.; Shedbale, A.S.; Mishra, B.K. Material property evaluation of particle reinforced composites using finite element approach. Journal of Composite Materials 2016, 50, 2757–2771. [Google Scholar] [CrossRef]
- Li, V. Integrated structures and materials design. Materials and Structures 2007, 40, 387–396. [Google Scholar] [CrossRef]
- Nellippallil, A.B.; Allen, J.K.; Gautham, B.P.; Singh, A.K.; Mistree, F. Integrated design of materials, products, and associated manufacturing processes. In Architecting Robust Co-Design of Materials, Products, and Manufacturing Processes; Springer: Cham, 2020. [Google Scholar]
- Reznikov, B.S.; Nikitenko, A.F.; Kucherenko, I.V. Prediction of macroscopic properties of structurally heterogeneous media. Part 1. News of Higher Educational Institutions Construction 2008, 2, 10–17. [Google Scholar]
- Christensen, R. Introduction to the Mechanics of Composites; Mir: Moscow, 1982; 334p. [Google Scholar]
- Shermergor, T.D. Theory of Elasticity of Microheterogeneous Media; Nauka: Moscow, 1977. [Google Scholar]
- Polilov, A.N. Etude Problems of Composite Mechanics: Textbook; Educational and Scientific Testing Complex for Technical Universities of Moscow: Moscow, 2004. [Google Scholar]
- Maksimenko, V.N.; Olein, I.P. Theoretical Foundations of Methods for Calculating the Strength of Structural Elements Made of Composites; Publishing House of the Novosibirsk State Technical University: Novosibirsk, 2006. [Google Scholar]
- Nemirovsky, Y.V.; Reznikov, B.S. Strength of Structural Elements Made of Composite Materials; Nauka. Sib. Department: Novosibirsk, 1986. [Google Scholar]
- Fujii, T.; Dzako, M. Fracture Mechanics of Composite Materials; Mir: Moscow, 1982. [Google Scholar]
- Galalyuk, A.V. Anisotropy of Elastic and Strength Characteristics of Ceramic Brick Masonry under Axial Uniaxial Compression: Dissertation. Brest State Technical University, 2024; 140p.
- Adishchev, V.V.; Shakarneh, O.M.D. Homogenization method for determining the matrix of effective stiffness coefficients of masonry. News of Higher Educational Institutions Construction 2025, 4, 32–44. [Google Scholar]
- Adishchev, V.V.; Shakarneh, O.M.D. Identification of effective stiffness characteristics of masonry based on comparative analysis of numerical and physical experiments. News of Higher Educational Institutions Construction 2024, 8, 5–21. [Google Scholar] [CrossRef]
- Galalyuk, A.V.; Demchuk, I.E. Mathematical modeling of masonry samples under compression. Problems of Modern Concrete and Reinforced Concrete 2012, 4, 20–29. [Google Scholar]
- Shakarneh, O.M.D. Homogenization method for determining the matrix of effective stiffness coefficients of reinforcement masonry wall. Proceedings of the Novosibirsk State University of Architecture and Civil Engineering 2024, 27. [Google Scholar] [CrossRef]
- Shakarneh, O.M.D.; Adishchev, V.V. Numerical modeling of the stress-strain state in masonry reinforced with reinforcing meshes. News of Higher Educational Institutions Construction 2023, 3, 5–21. [Google Scholar] [CrossRef]
- Lekhnitsky, S.G. Theory of Elasticity of an Anisotropic Body; Nauka: Moscow, 1977; 467p. [Google Scholar]
- Derkach, V.N. Anisotropy of deformation properties of masonry. Scientific and Technical Bulletin of SPbSPU Science and Education 2011, 1, 201–207. [Google Scholar]
- EN 1052-1:1998; Methods of Test for Masonry – Part 1: Determination of Compressive Strength. European Committee for Standardization: Brussels.
- Lourenço, P.B. Computational Strategies for Masonry Structures. Ph.D. Thesis, Delft University of Technology, Netherlands, 1996. [Google Scholar]
- Ghanooni-bagha, M.; Tarvirdi Yaghbasti, M.; Ranjbar, M.R. Determination of Homogeneous Stiffness Matrix for Masonry Structure by means of Homogenizing Theorem. Journal of Materials and Environment al Science 2016, 7, 1773–1790. [Google Scholar]
- Ghanooni-bagha, M.; Tarvirdi Yaghbasti, M.; Ranjbar, M.R. Determination of Homogeneous Stiffness Matrix for Masonry Structure by means of Homogenizing Theorem. Journal of Structural Engineering 2021, 147, 04021045. [Google Scholar]
- Berto, L.; et al. Machine Learning-Assisted Homogenization of Masonry Walls Under Seismic Loads. Journal of Computational Physics 2023, 472, 111648. [Google Scholar]
- Cecchi, A.; Sab, K. A New Homogenization Approach for Periodic Masonry Based on Strain Energy Equivalence. Engineering Structures 2022, 250, 113422. [Google Scholar]
Figure 1a.
Distribution pattern of horizontal stresses in brick and mortar joint for different stiffness ratios Eb/Em [22].
Figure 1a.
Distribution pattern of horizontal stresses in brick and mortar joint for different stiffness ratios Eb/Em [22].
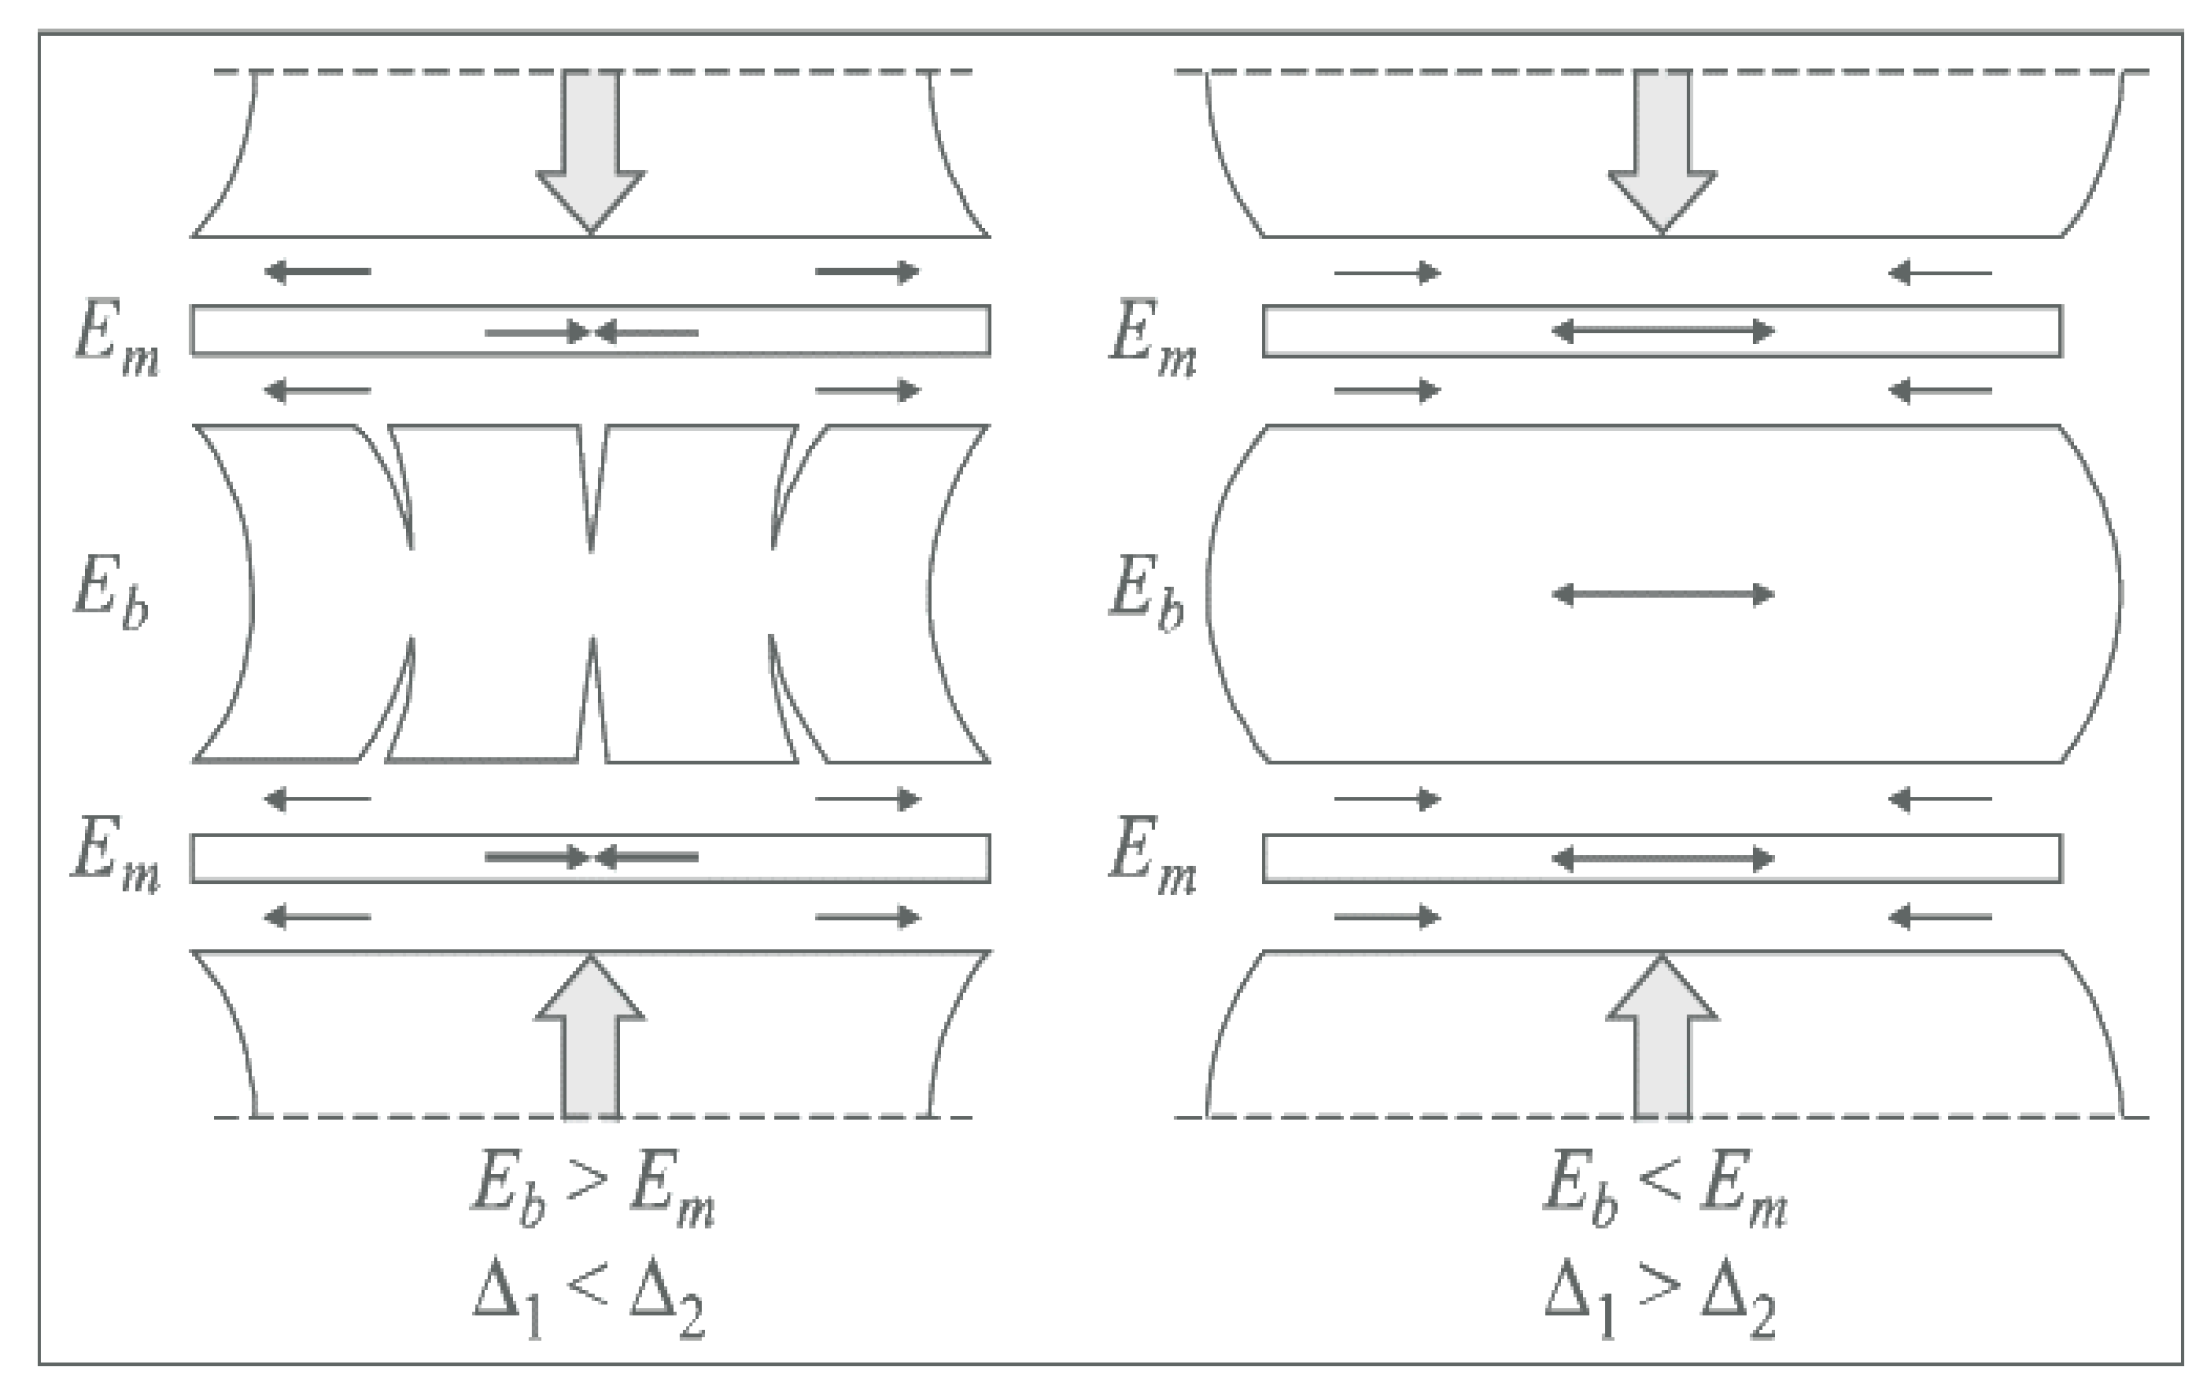
Figure 1b.
Scheme of testing prototypes, a− perpendicular to horizontal mortar joints, b −parallel to horizontal mortar joints, [23].
Figure 1b.
Scheme of testing prototypes, a− perpendicular to horizontal mortar joints, b −parallel to horizontal mortar joints, [23].
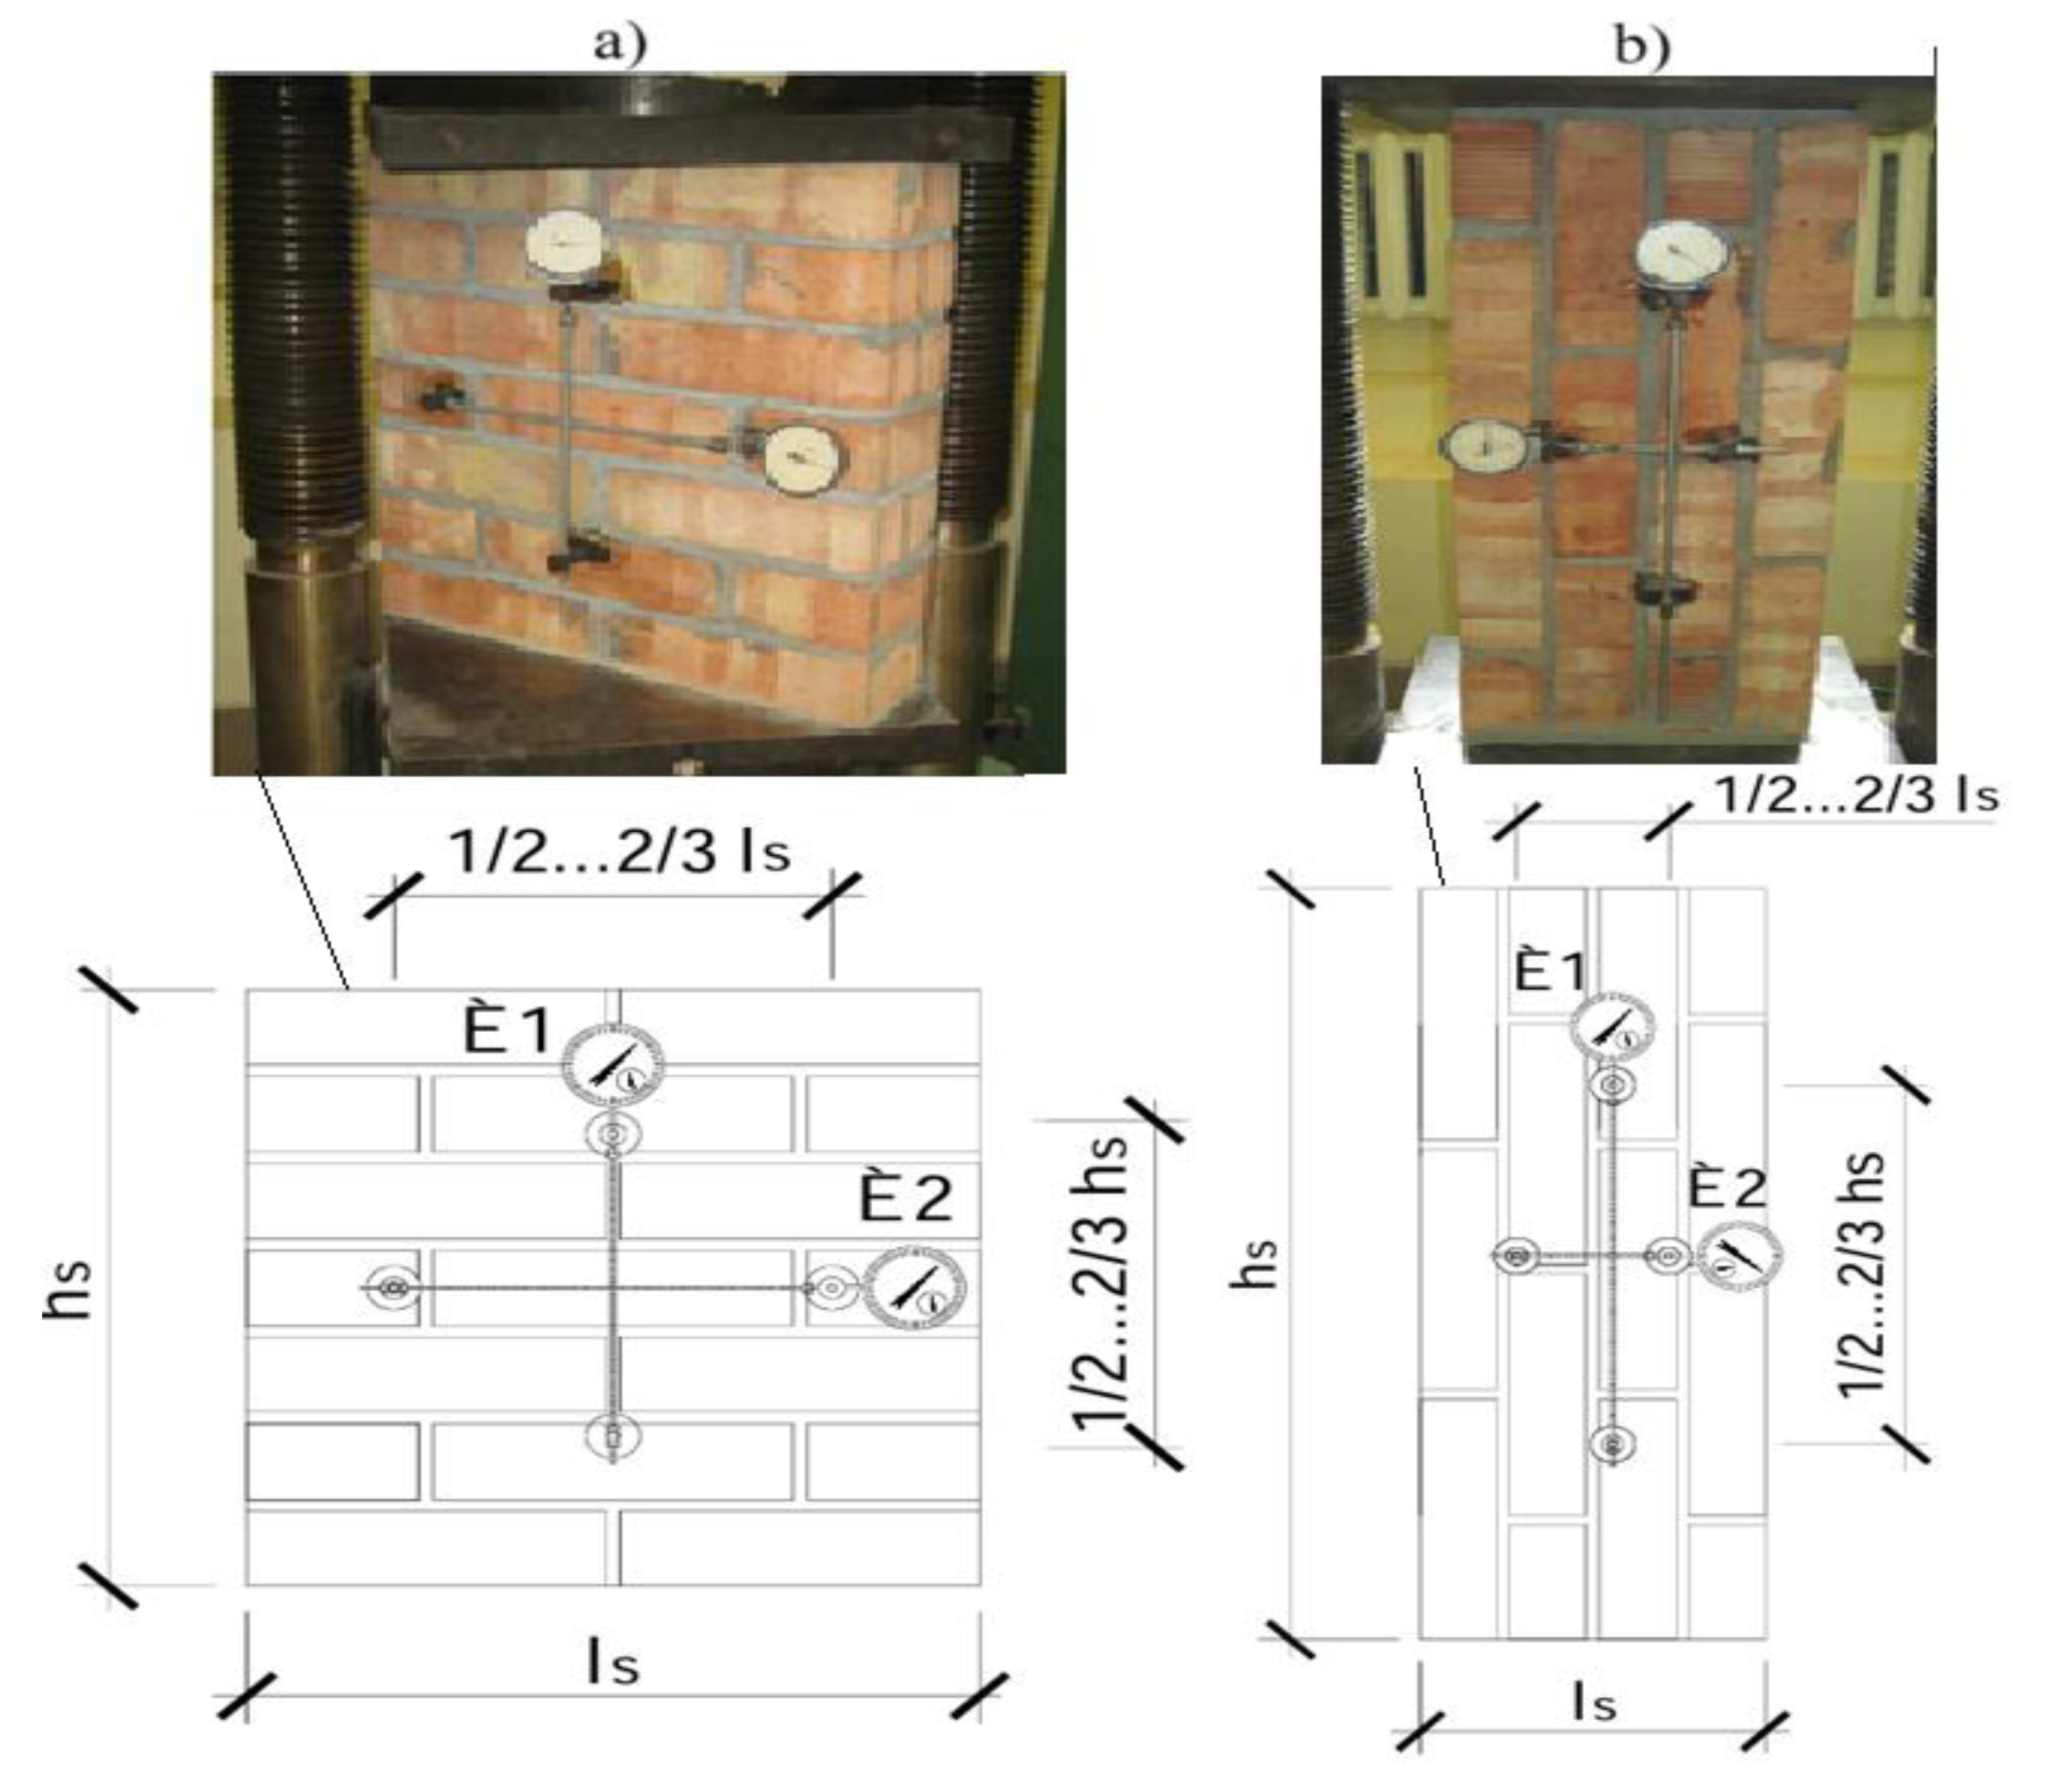
Figure 2.
FE models of masonry samples: a — Micromodel, b — Macromodel.
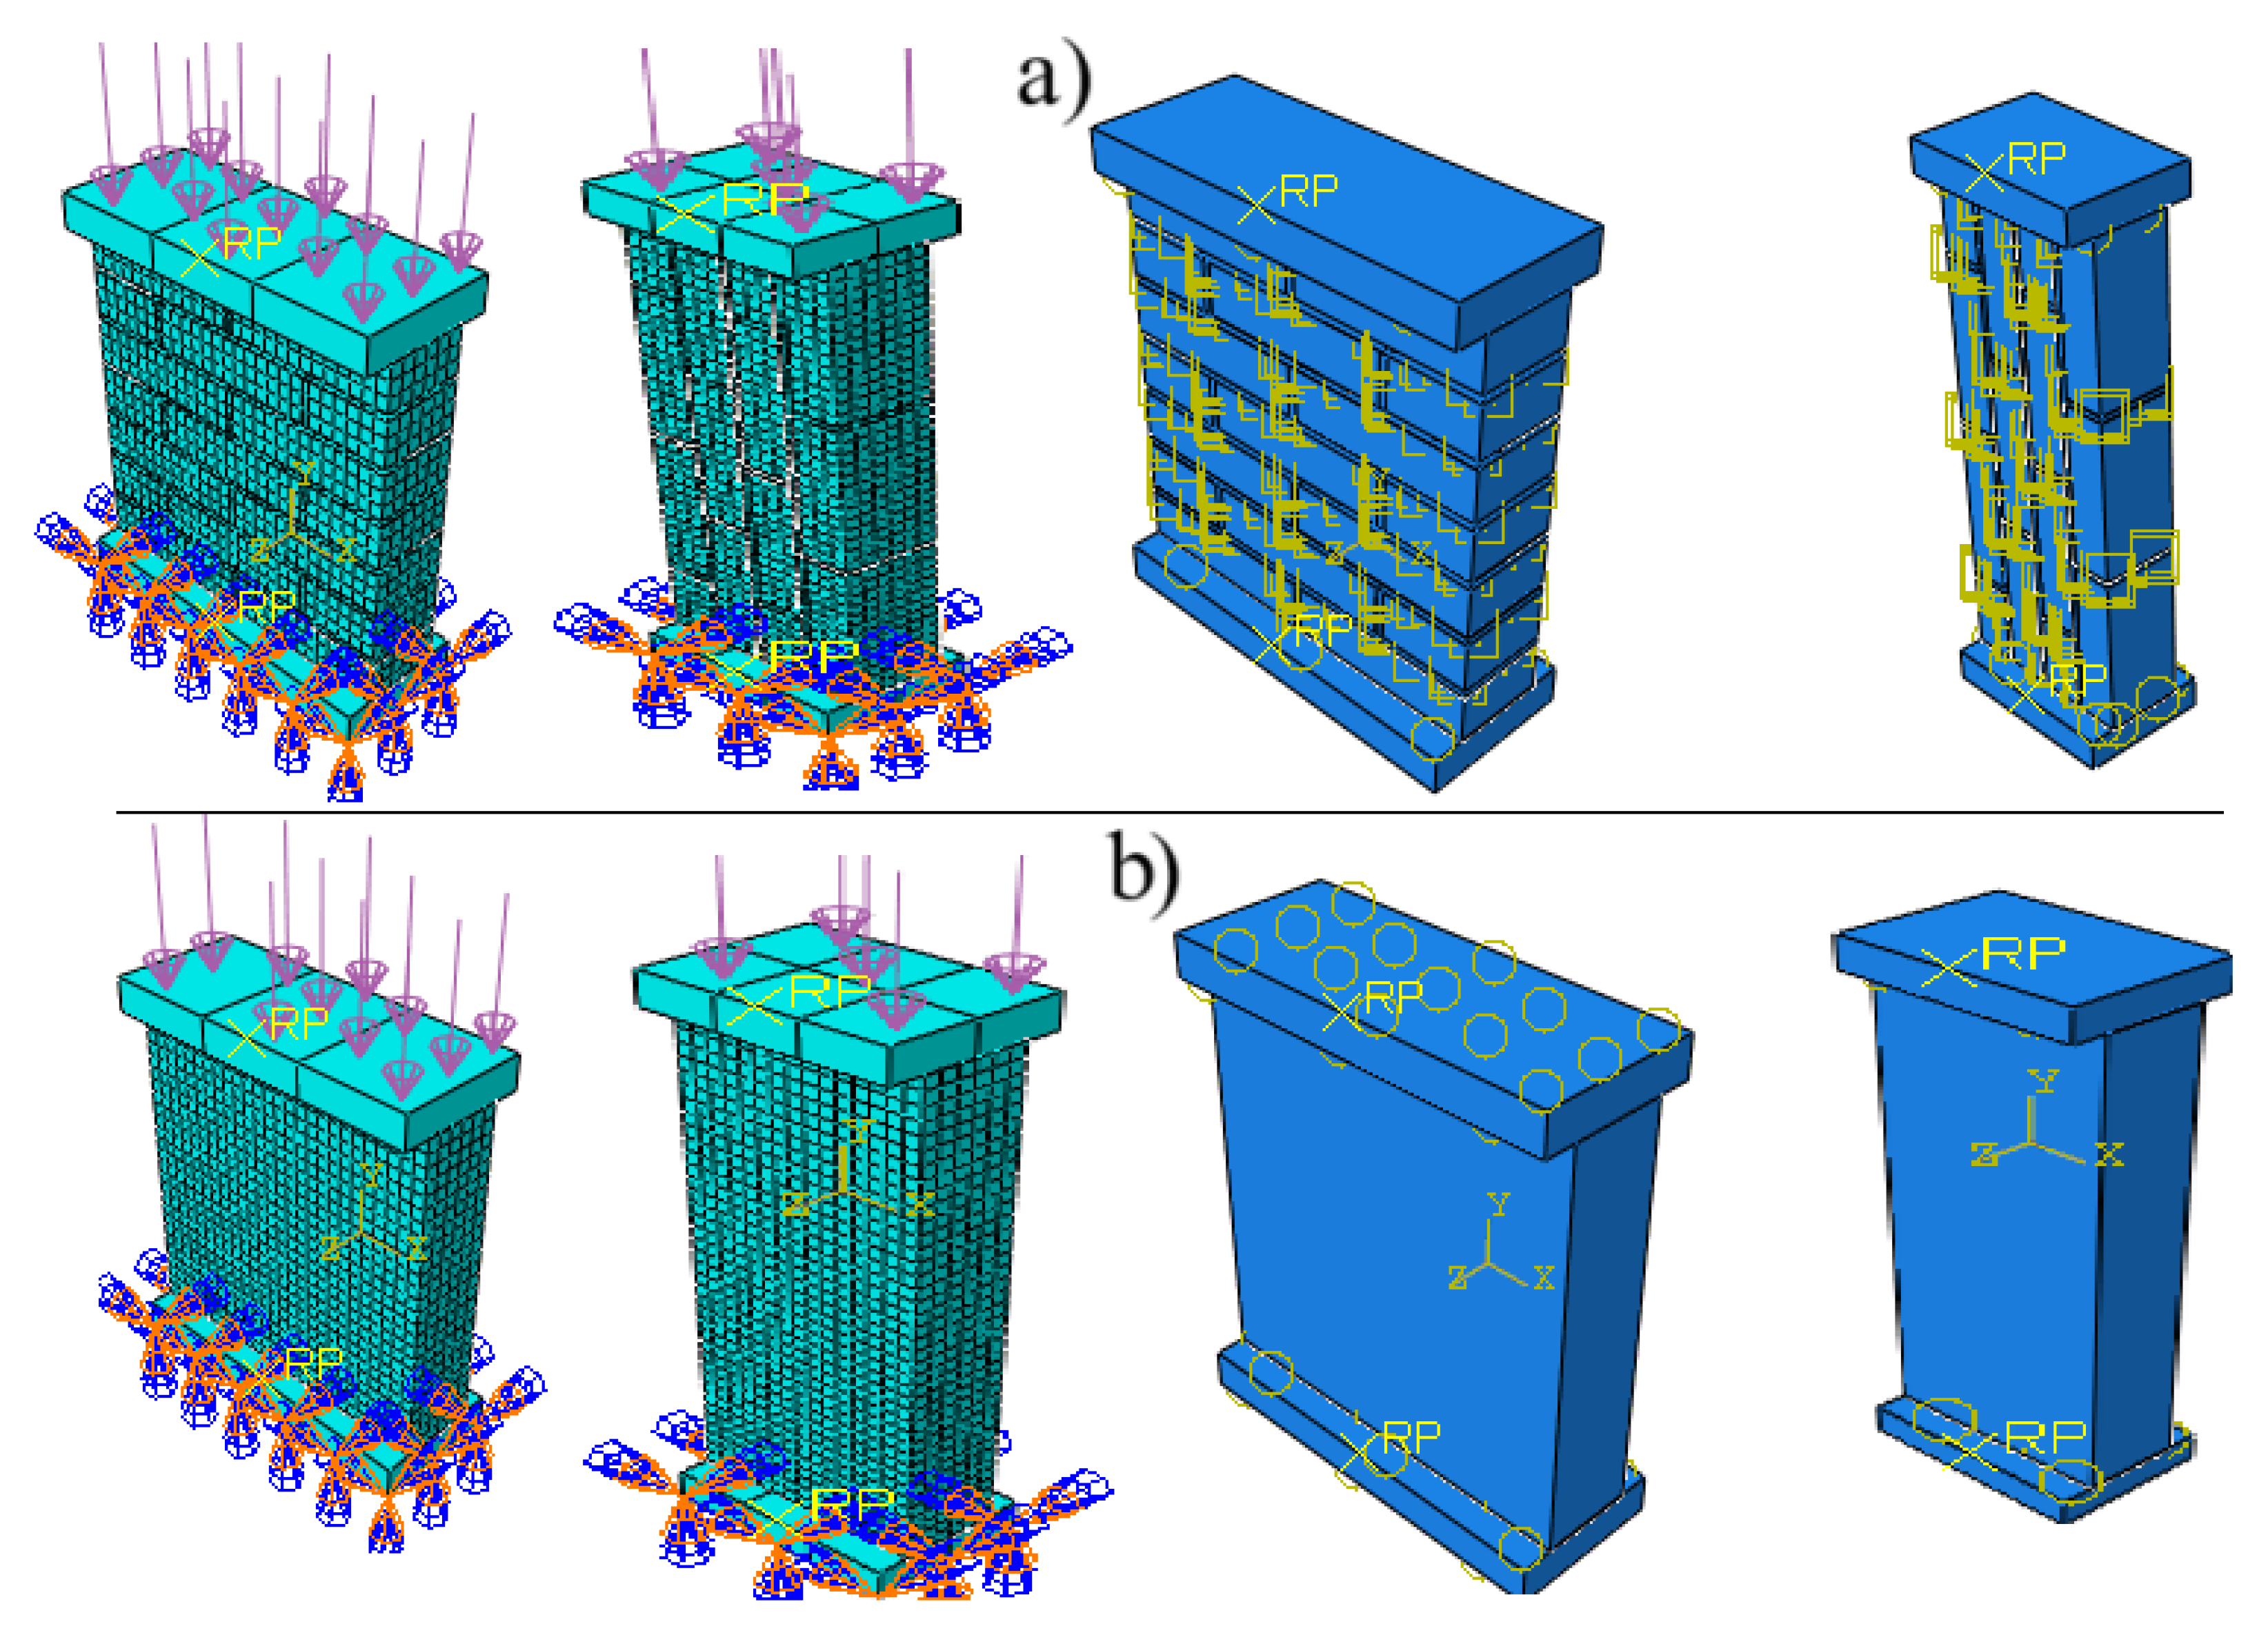
Figure 3a.
Comparison of real asymmetry with an idealized symmetric model.
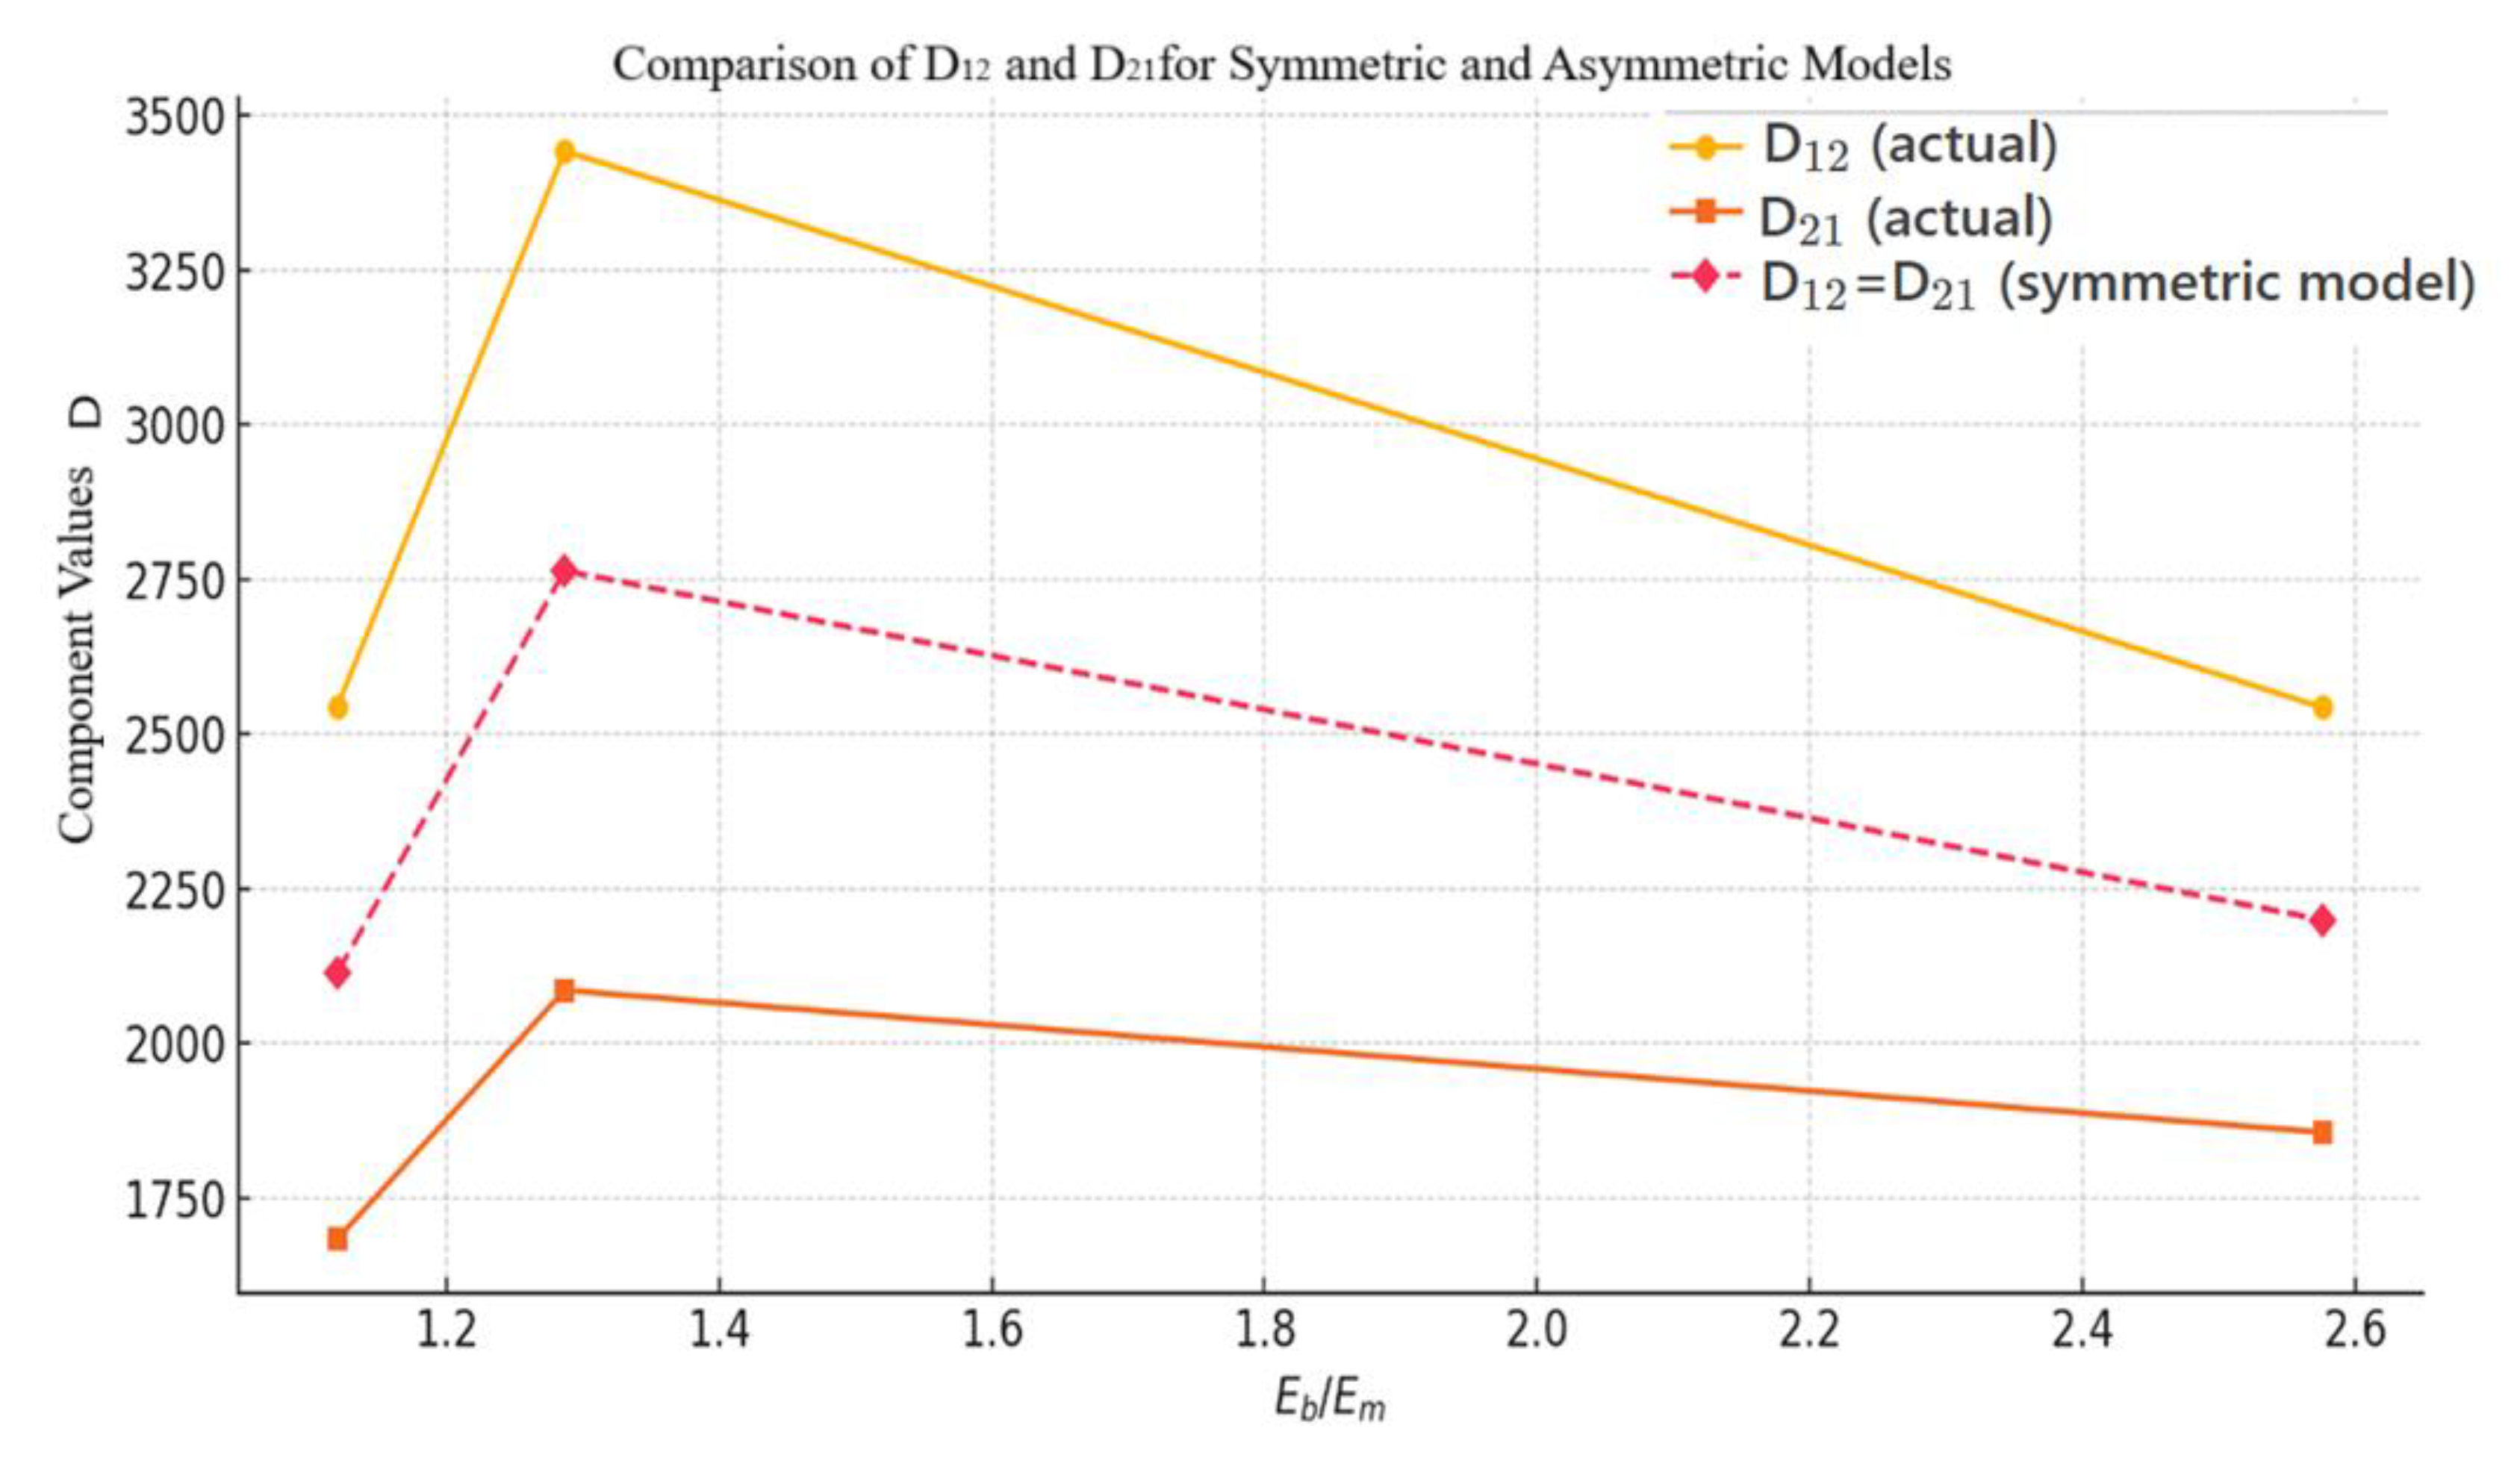
Figure 3b.
Error analysis of the symmetric model for the anisotropy coefficients (n and k).
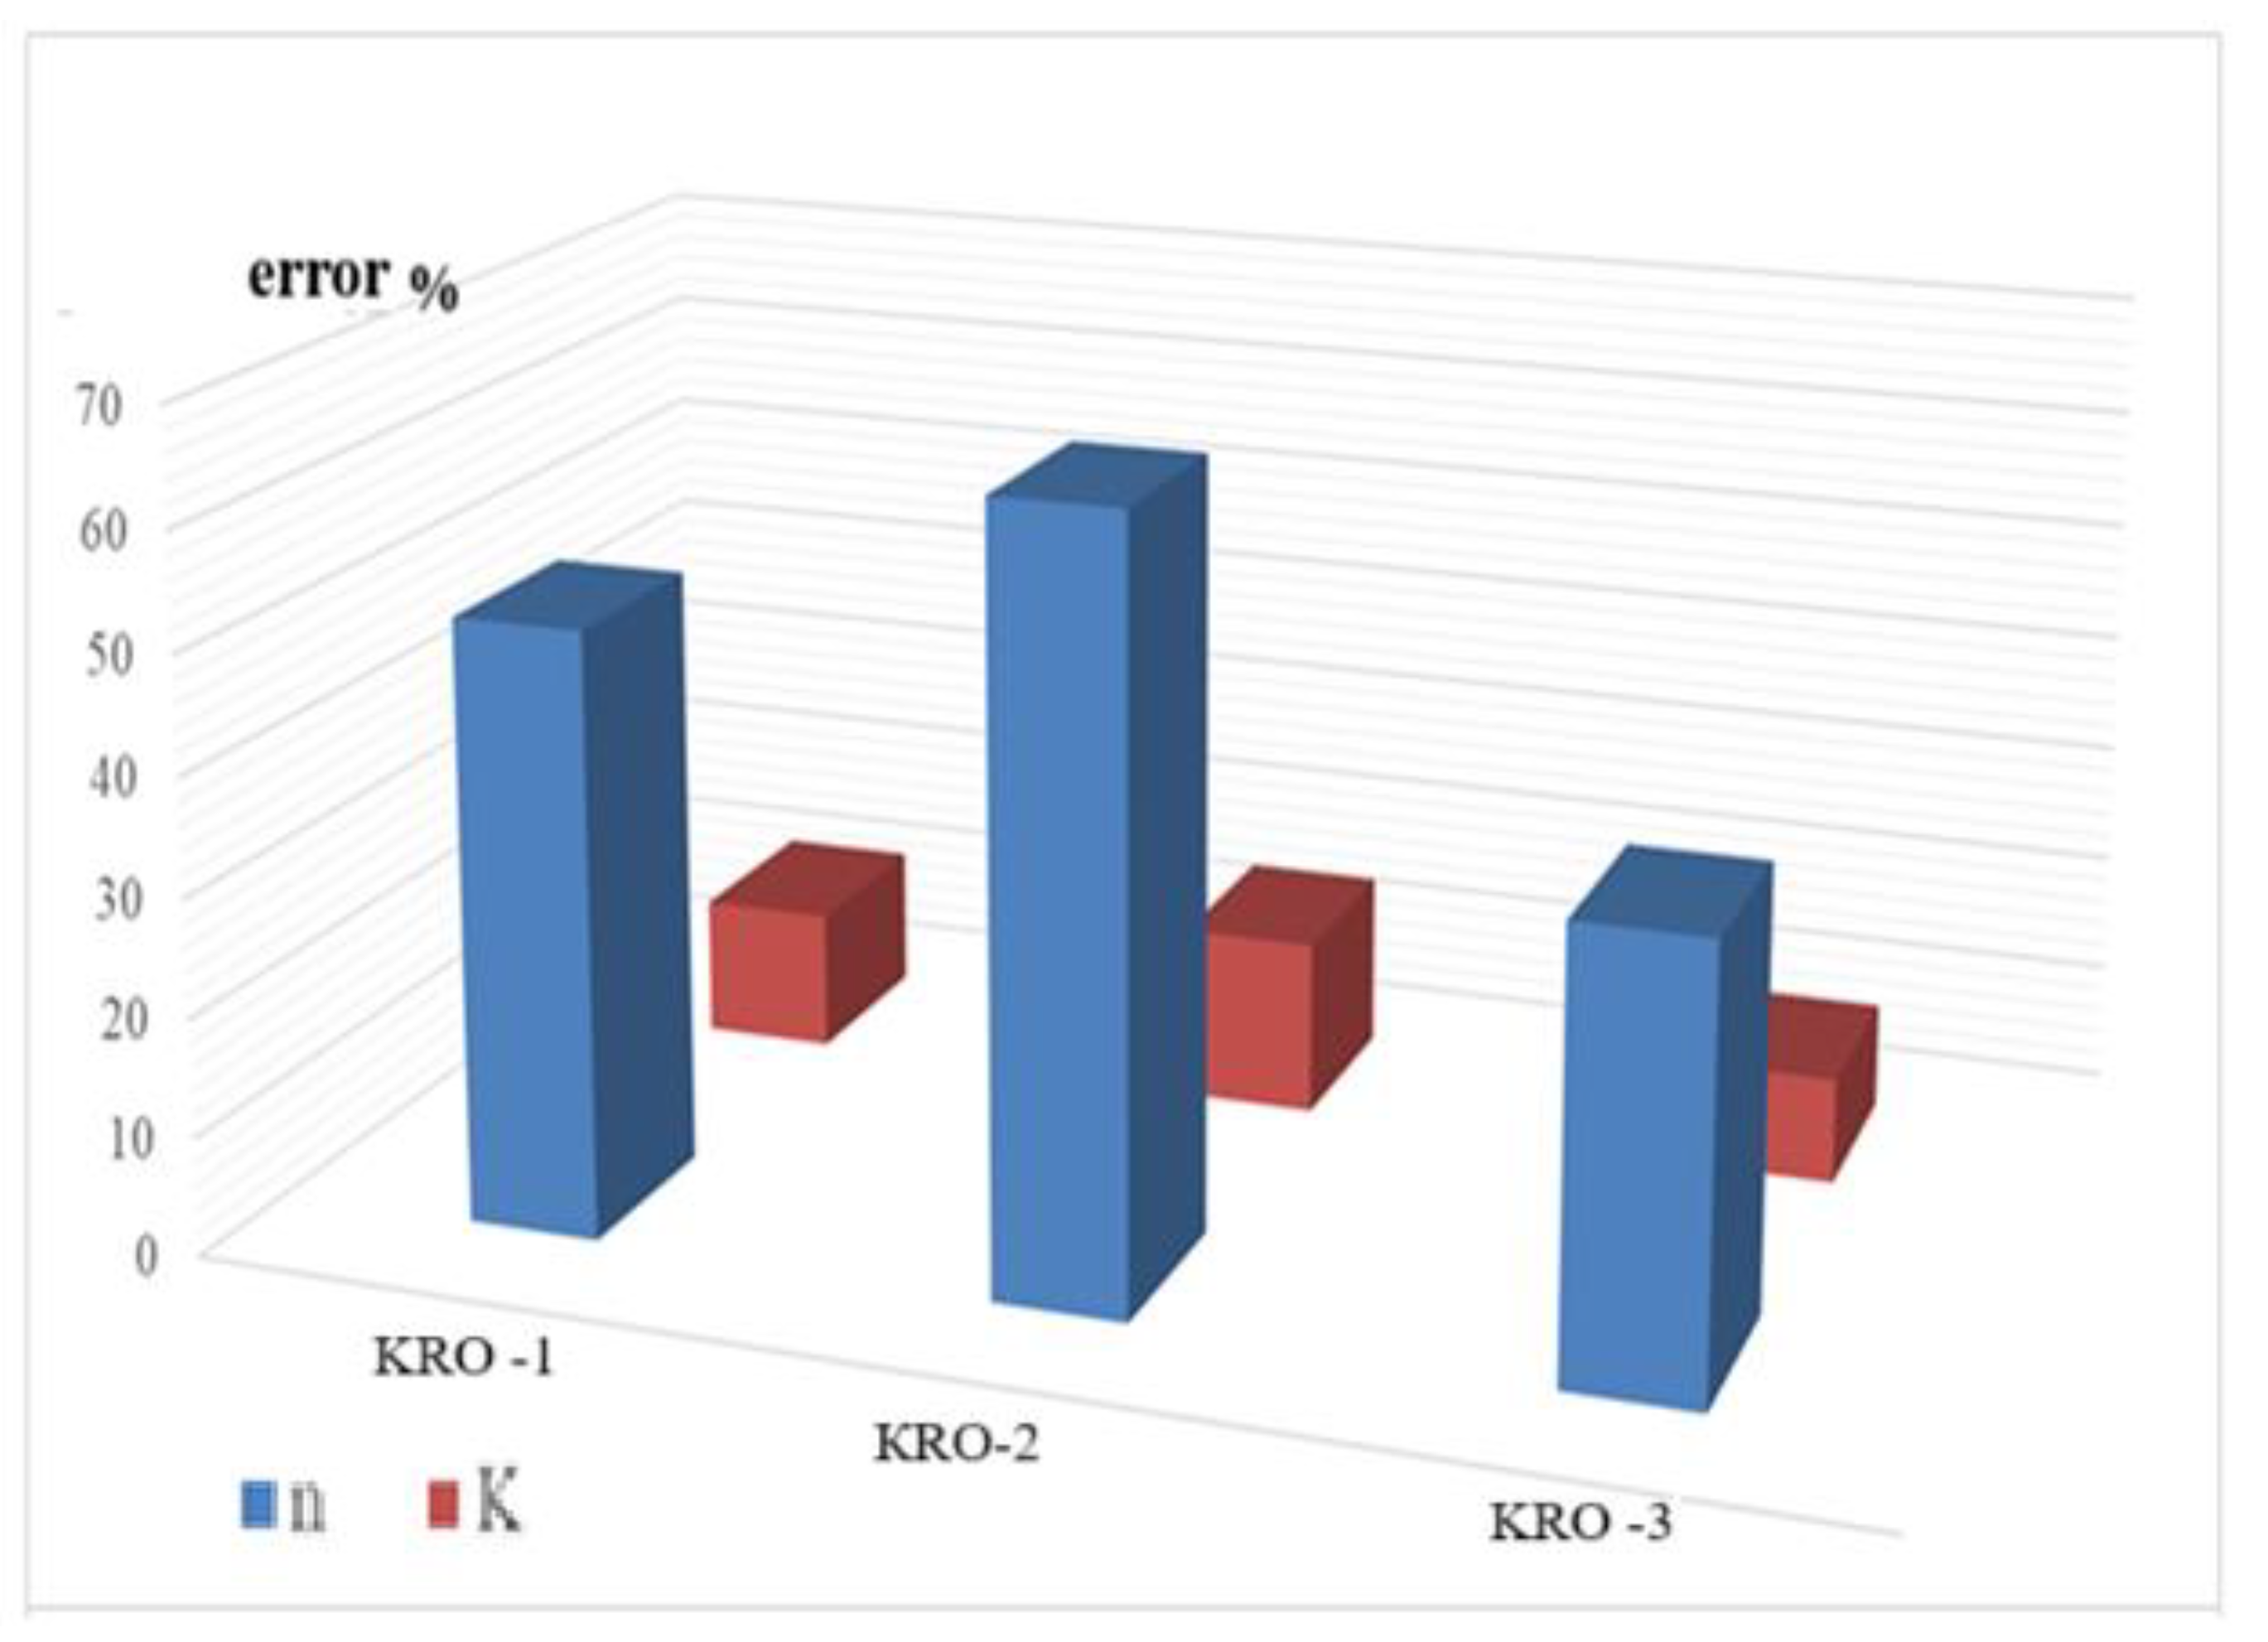
Figure 4a.
Isofields of compressive stresses σy and horizontal strain distributions under loading perpendicular to joints mortar for KRO-1 masonry.
Figure 4a.
Isofields of compressive stresses σy and horizontal strain distributions under loading perpendicular to joints mortar for KRO-1 masonry.
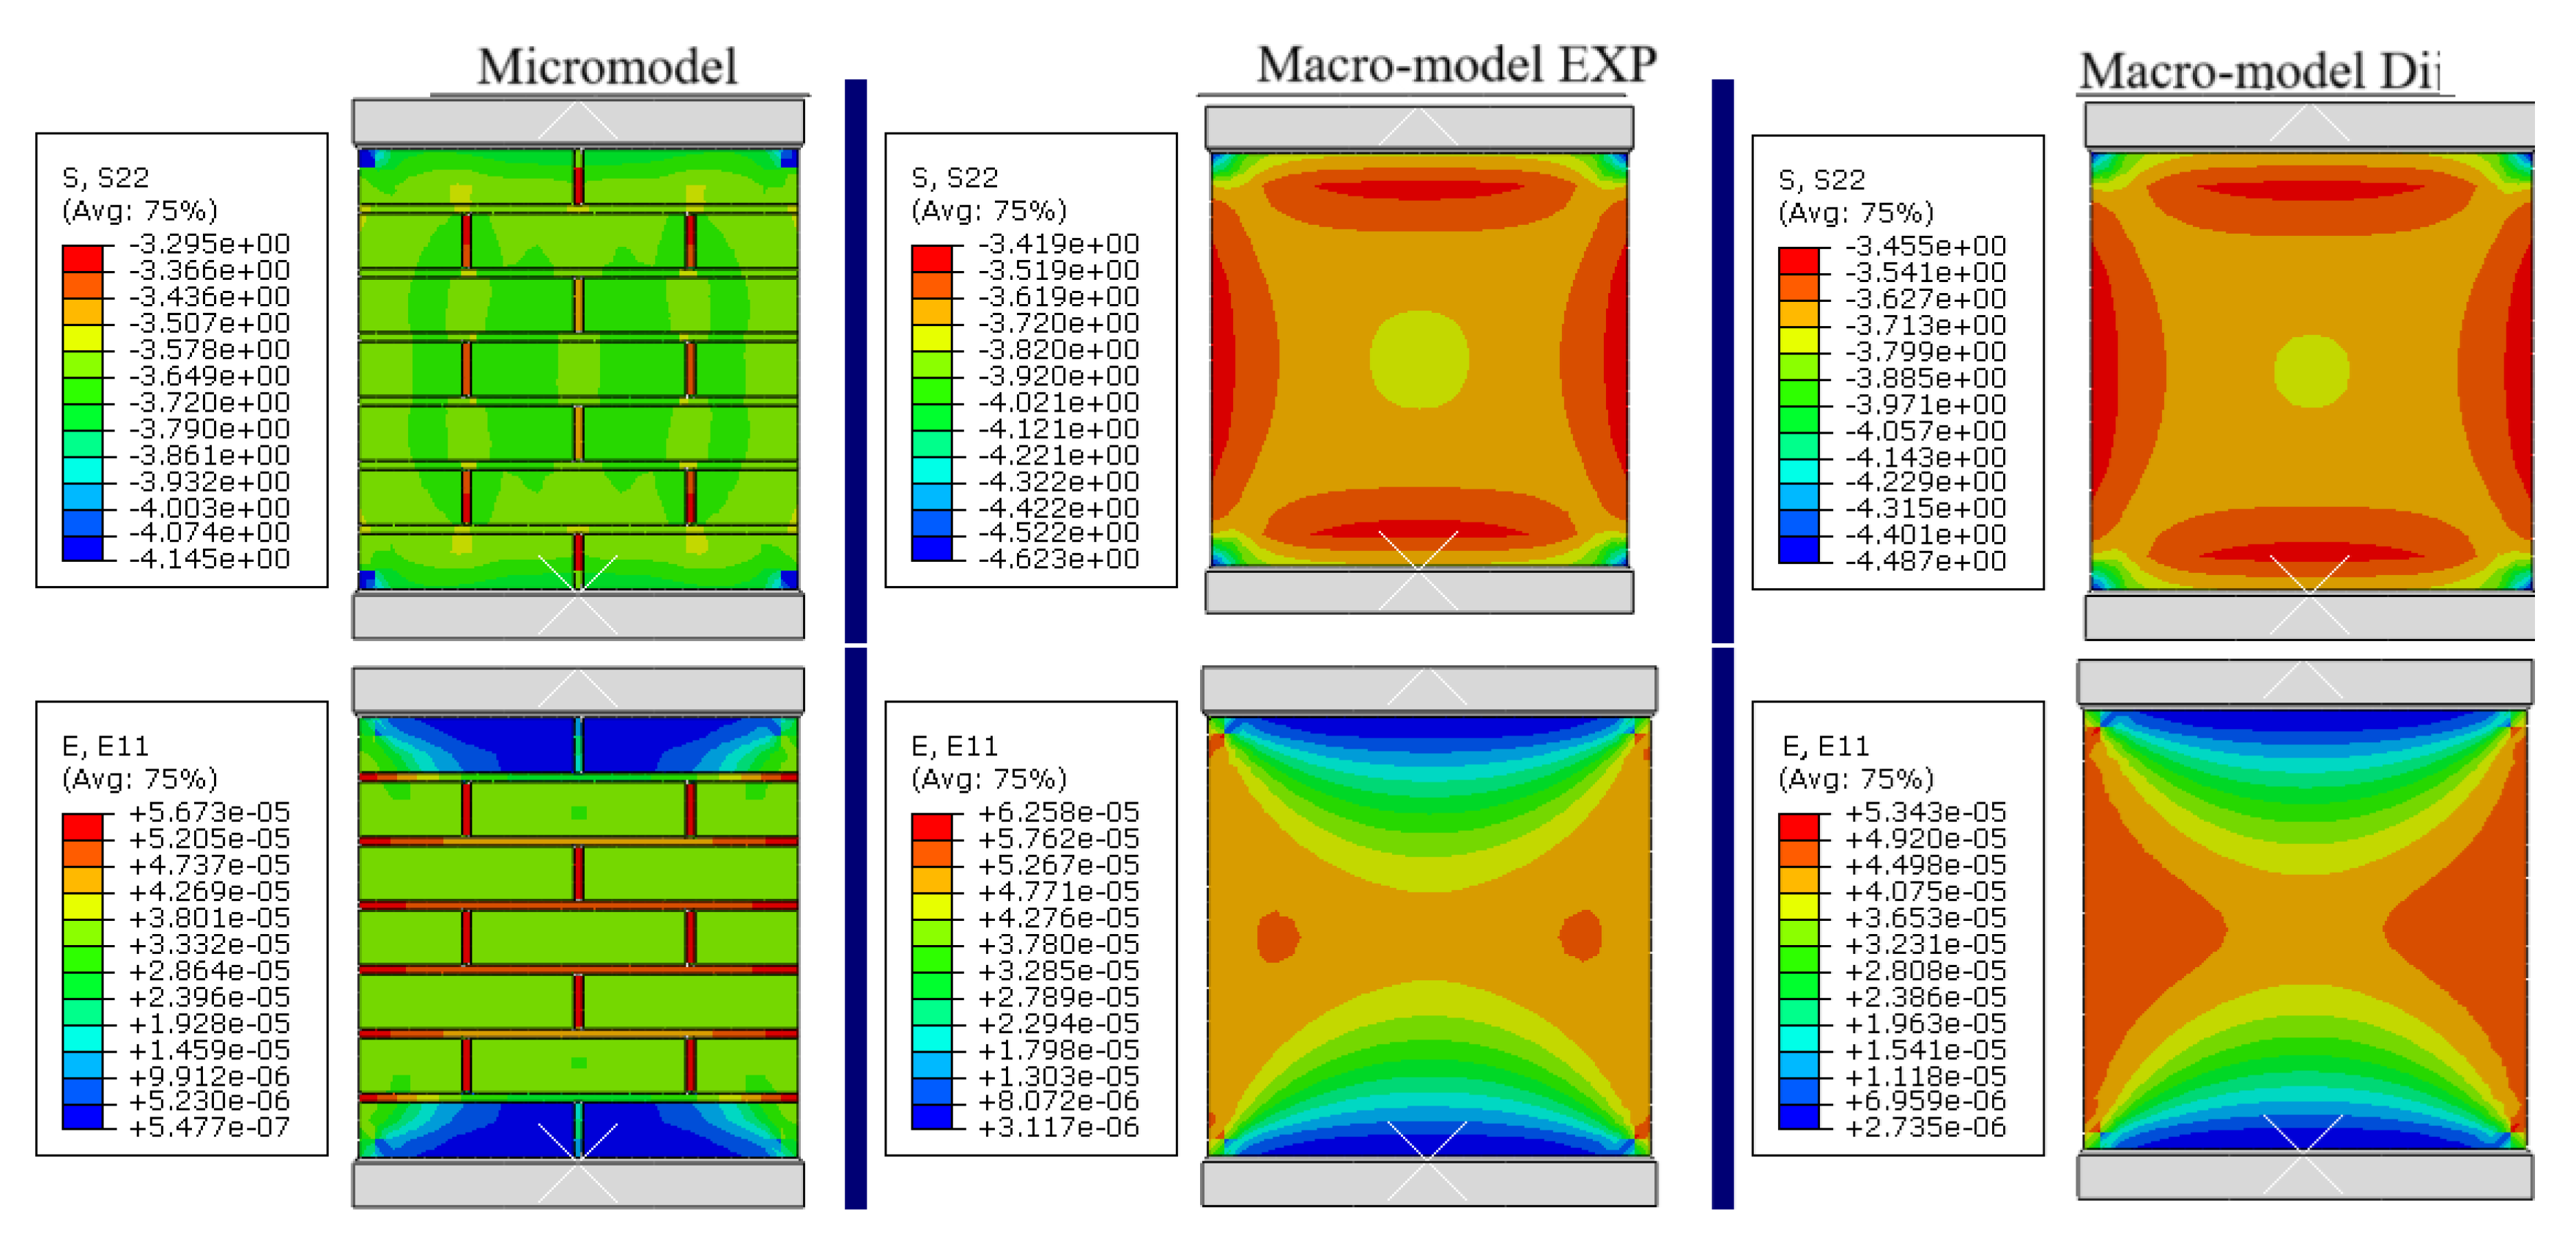
Figure 4b.
Isofields of compressive stresses σy and horizontal strain distributions under loading parallel to joints mortar for KRO-1 masonry.
Figure 4b.
Isofields of compressive stresses σy and horizontal strain distributions under loading parallel to joints mortar for KRO-1 masonry.
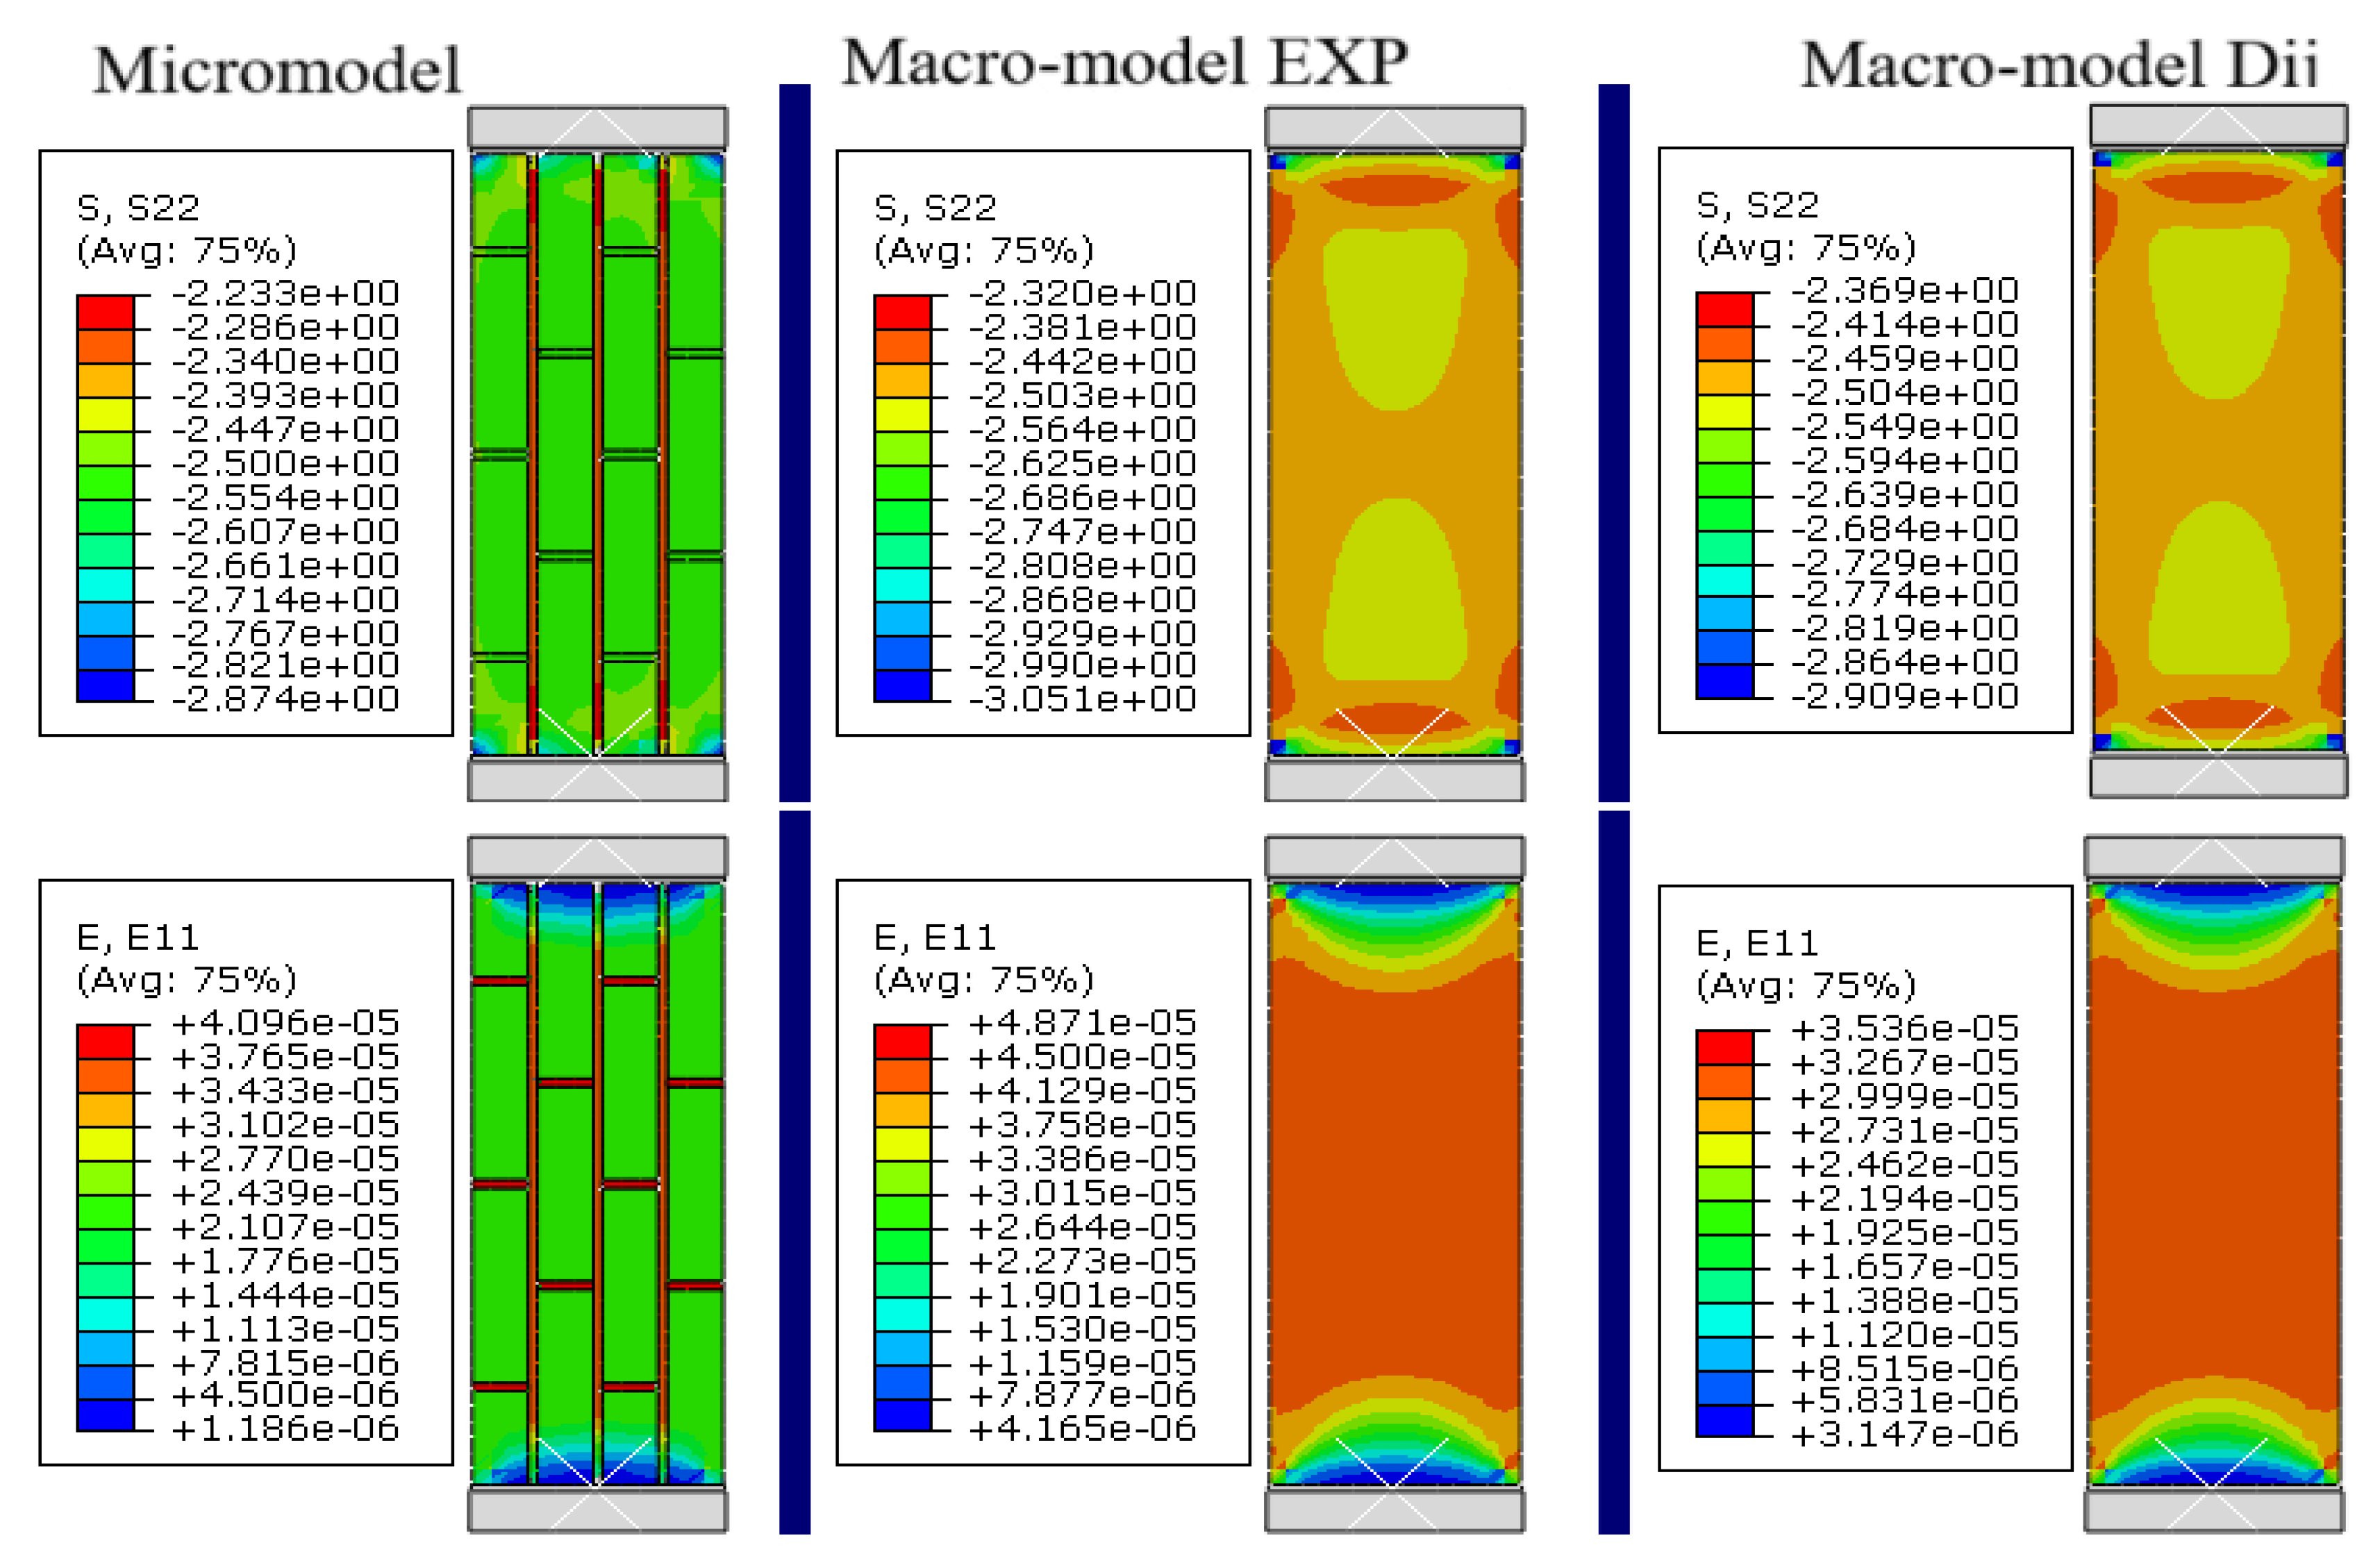
Figure 5a.
Isofields of compressive stresses σy and horizontal strain distributions under loading perpendicular to joints mortar for masonry КRО-2.
Figure 5a.
Isofields of compressive stresses σy and horizontal strain distributions under loading perpendicular to joints mortar for masonry КRО-2.
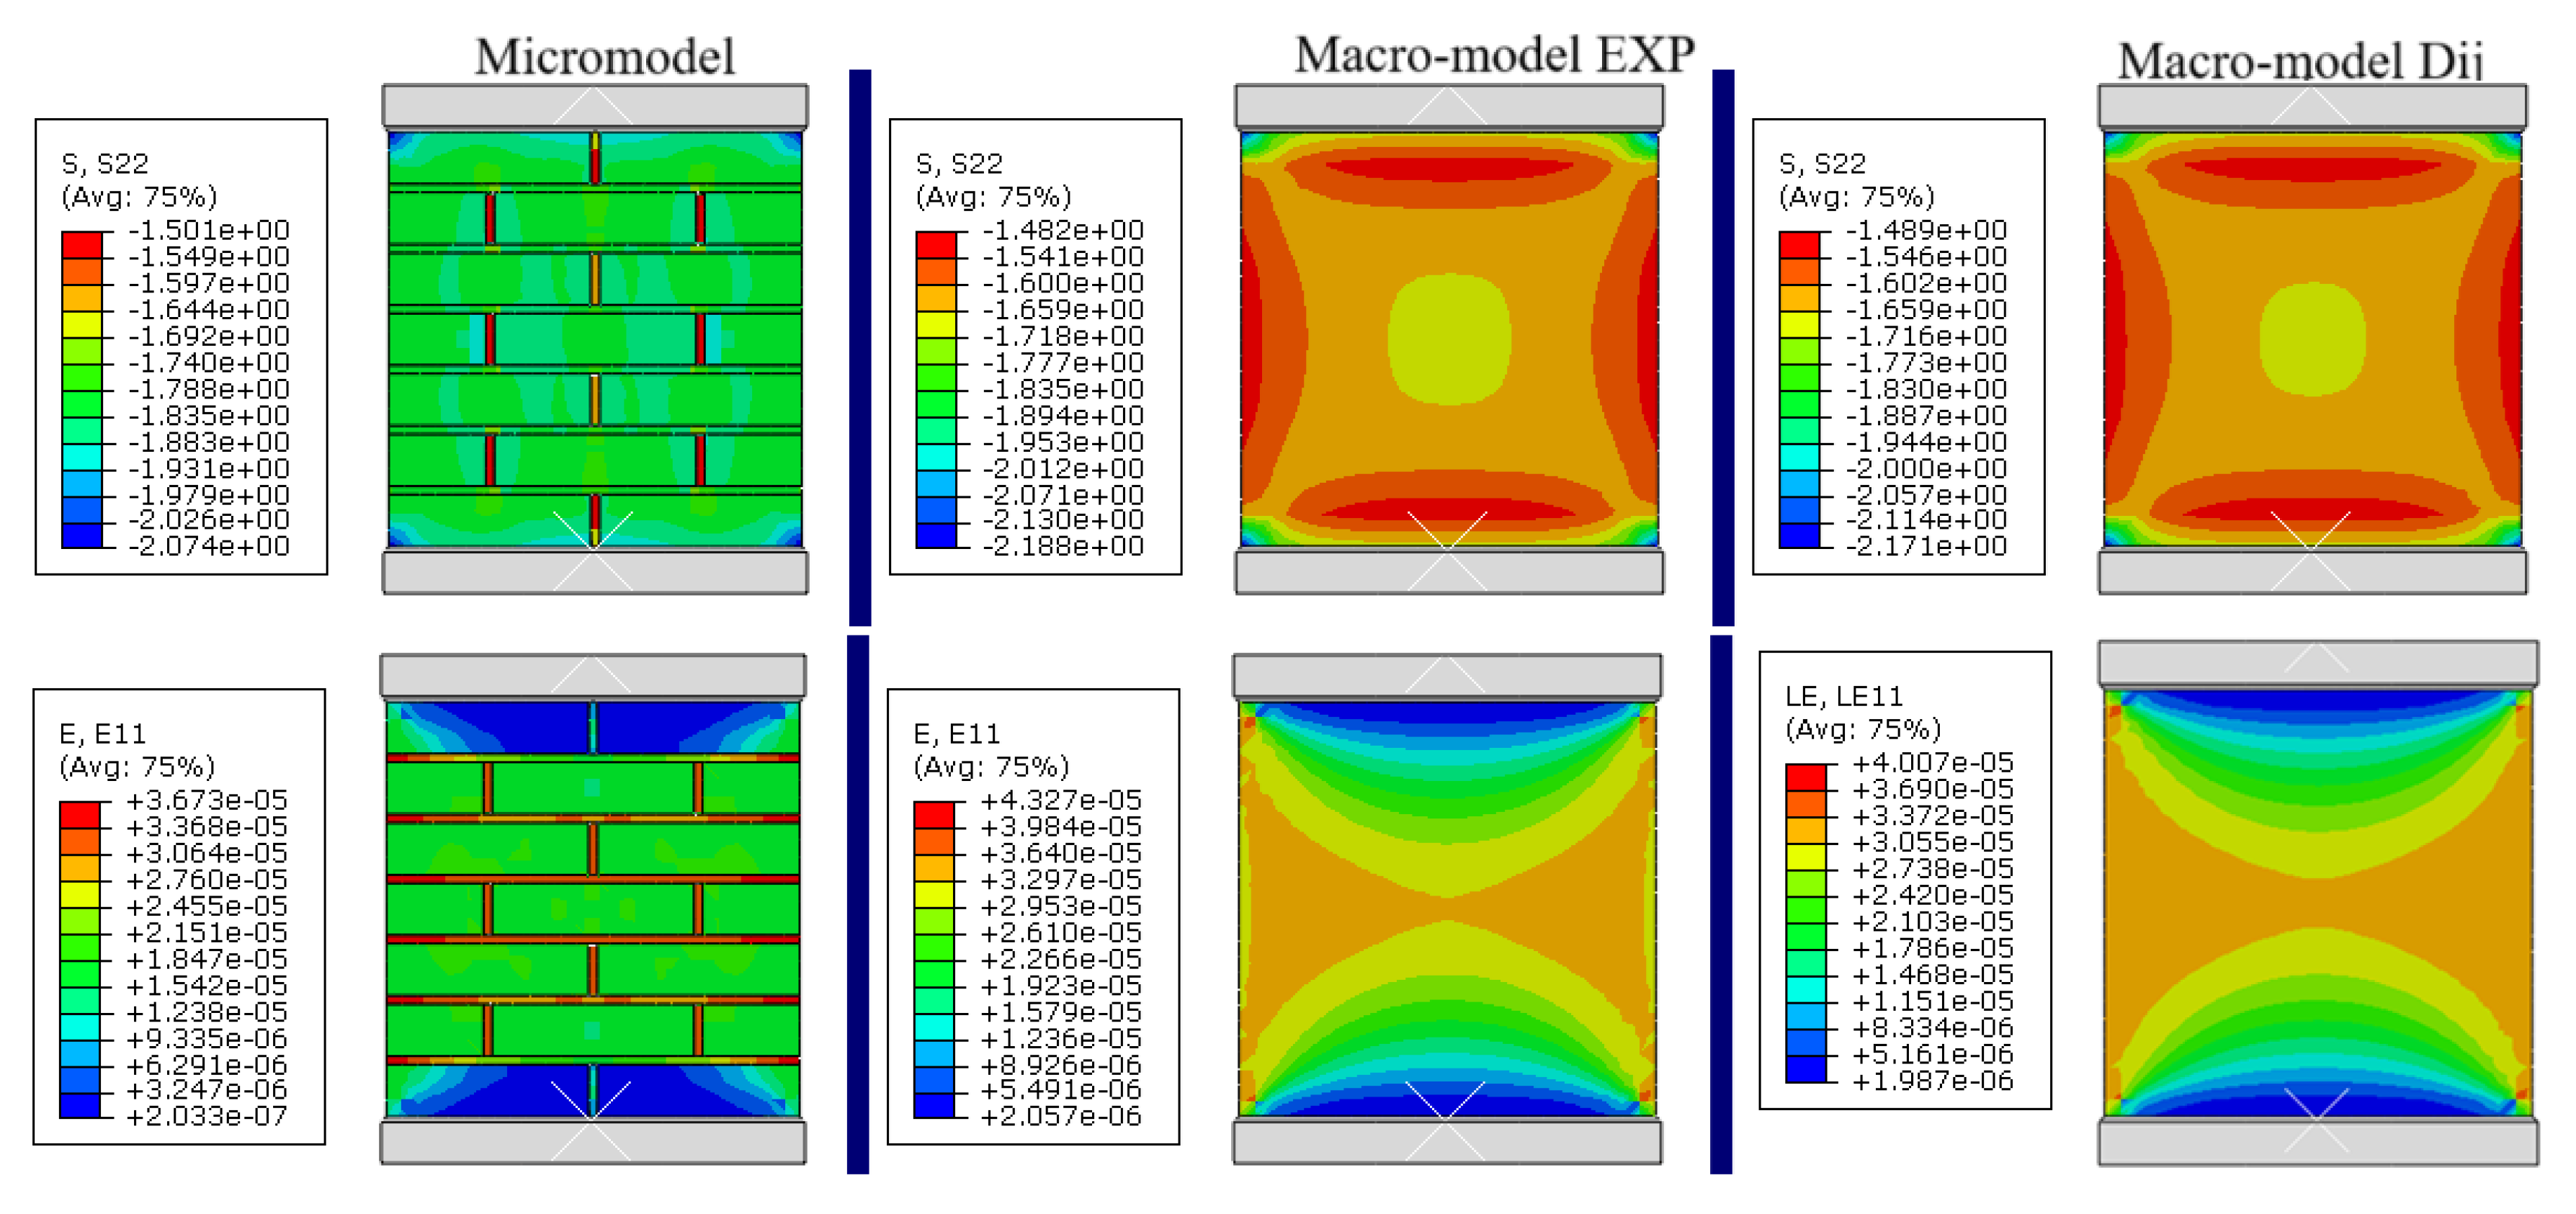
Figure 5b.
Isofields of compressive stresses σy and horizontal strain distributions under loading parallel to joints mortar for KRO-2 masonry.
Figure 5b.
Isofields of compressive stresses σy and horizontal strain distributions under loading parallel to joints mortar for KRO-2 masonry.
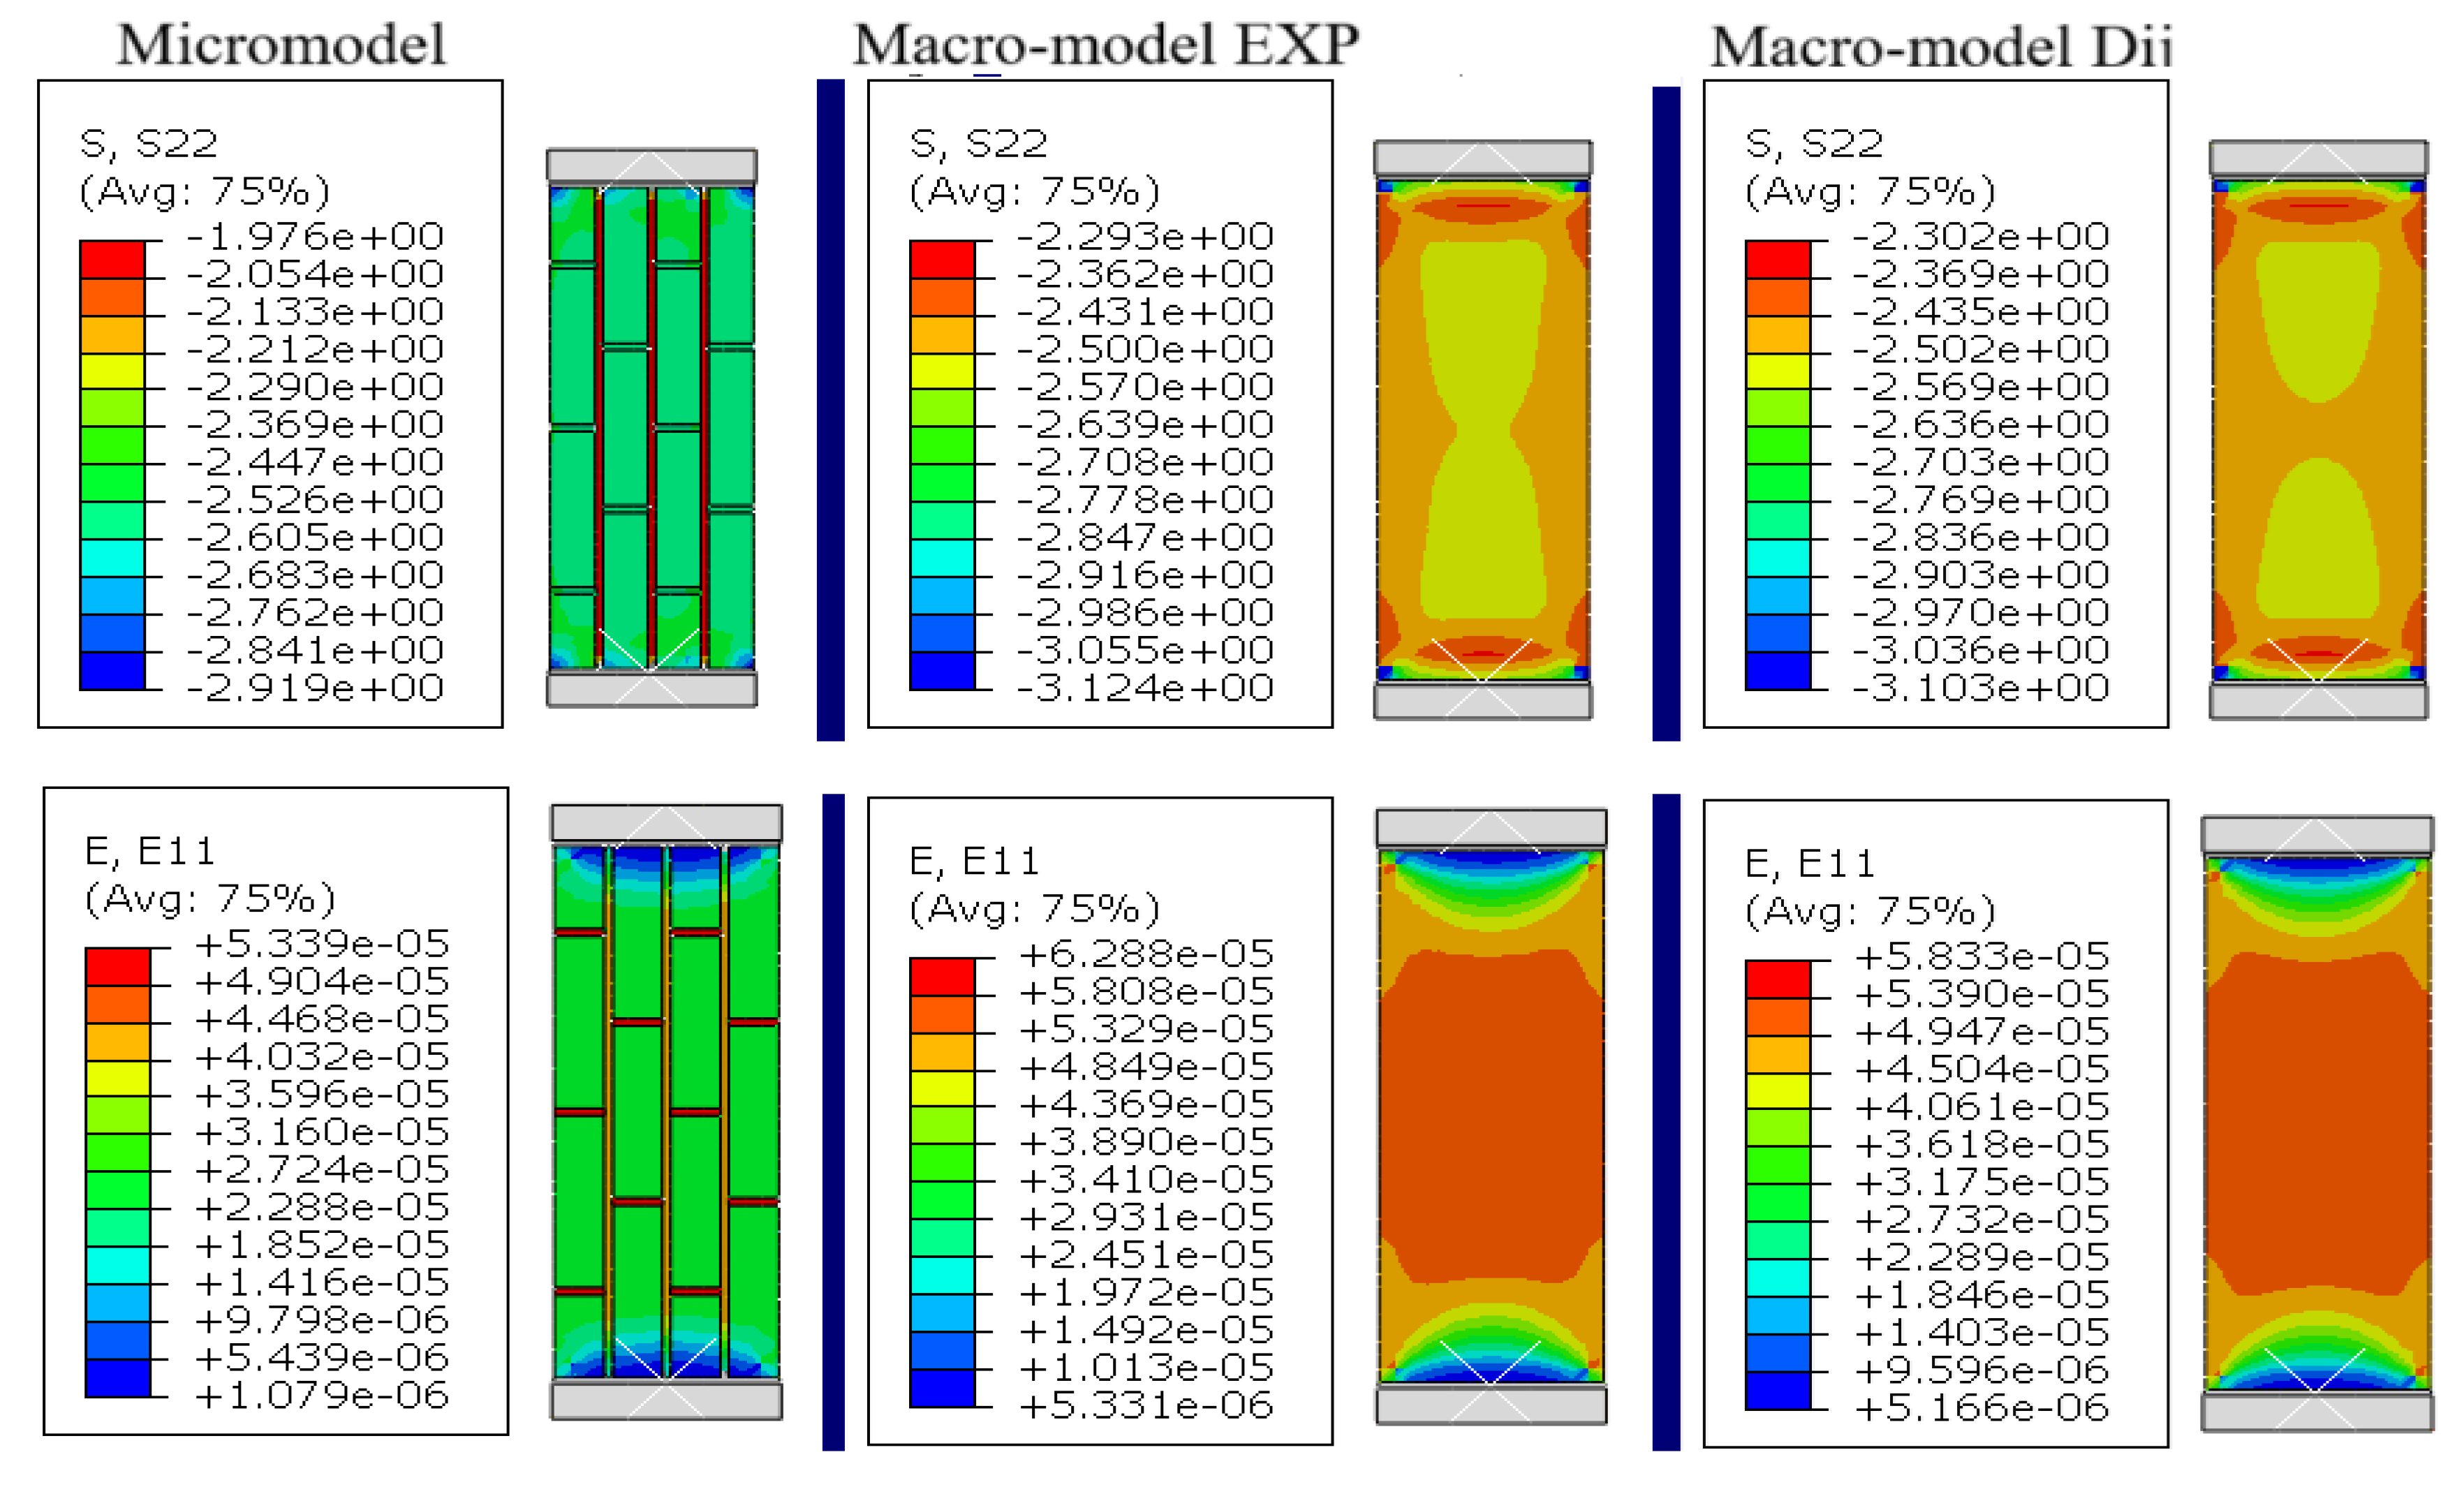
Figure 6a.
Isofields of compressive stresses σy and horizontal strain distributions under loading perpendicular to joints mortar for masonry КRО-3.
Figure 6a.
Isofields of compressive stresses σy and horizontal strain distributions under loading perpendicular to joints mortar for masonry КRО-3.
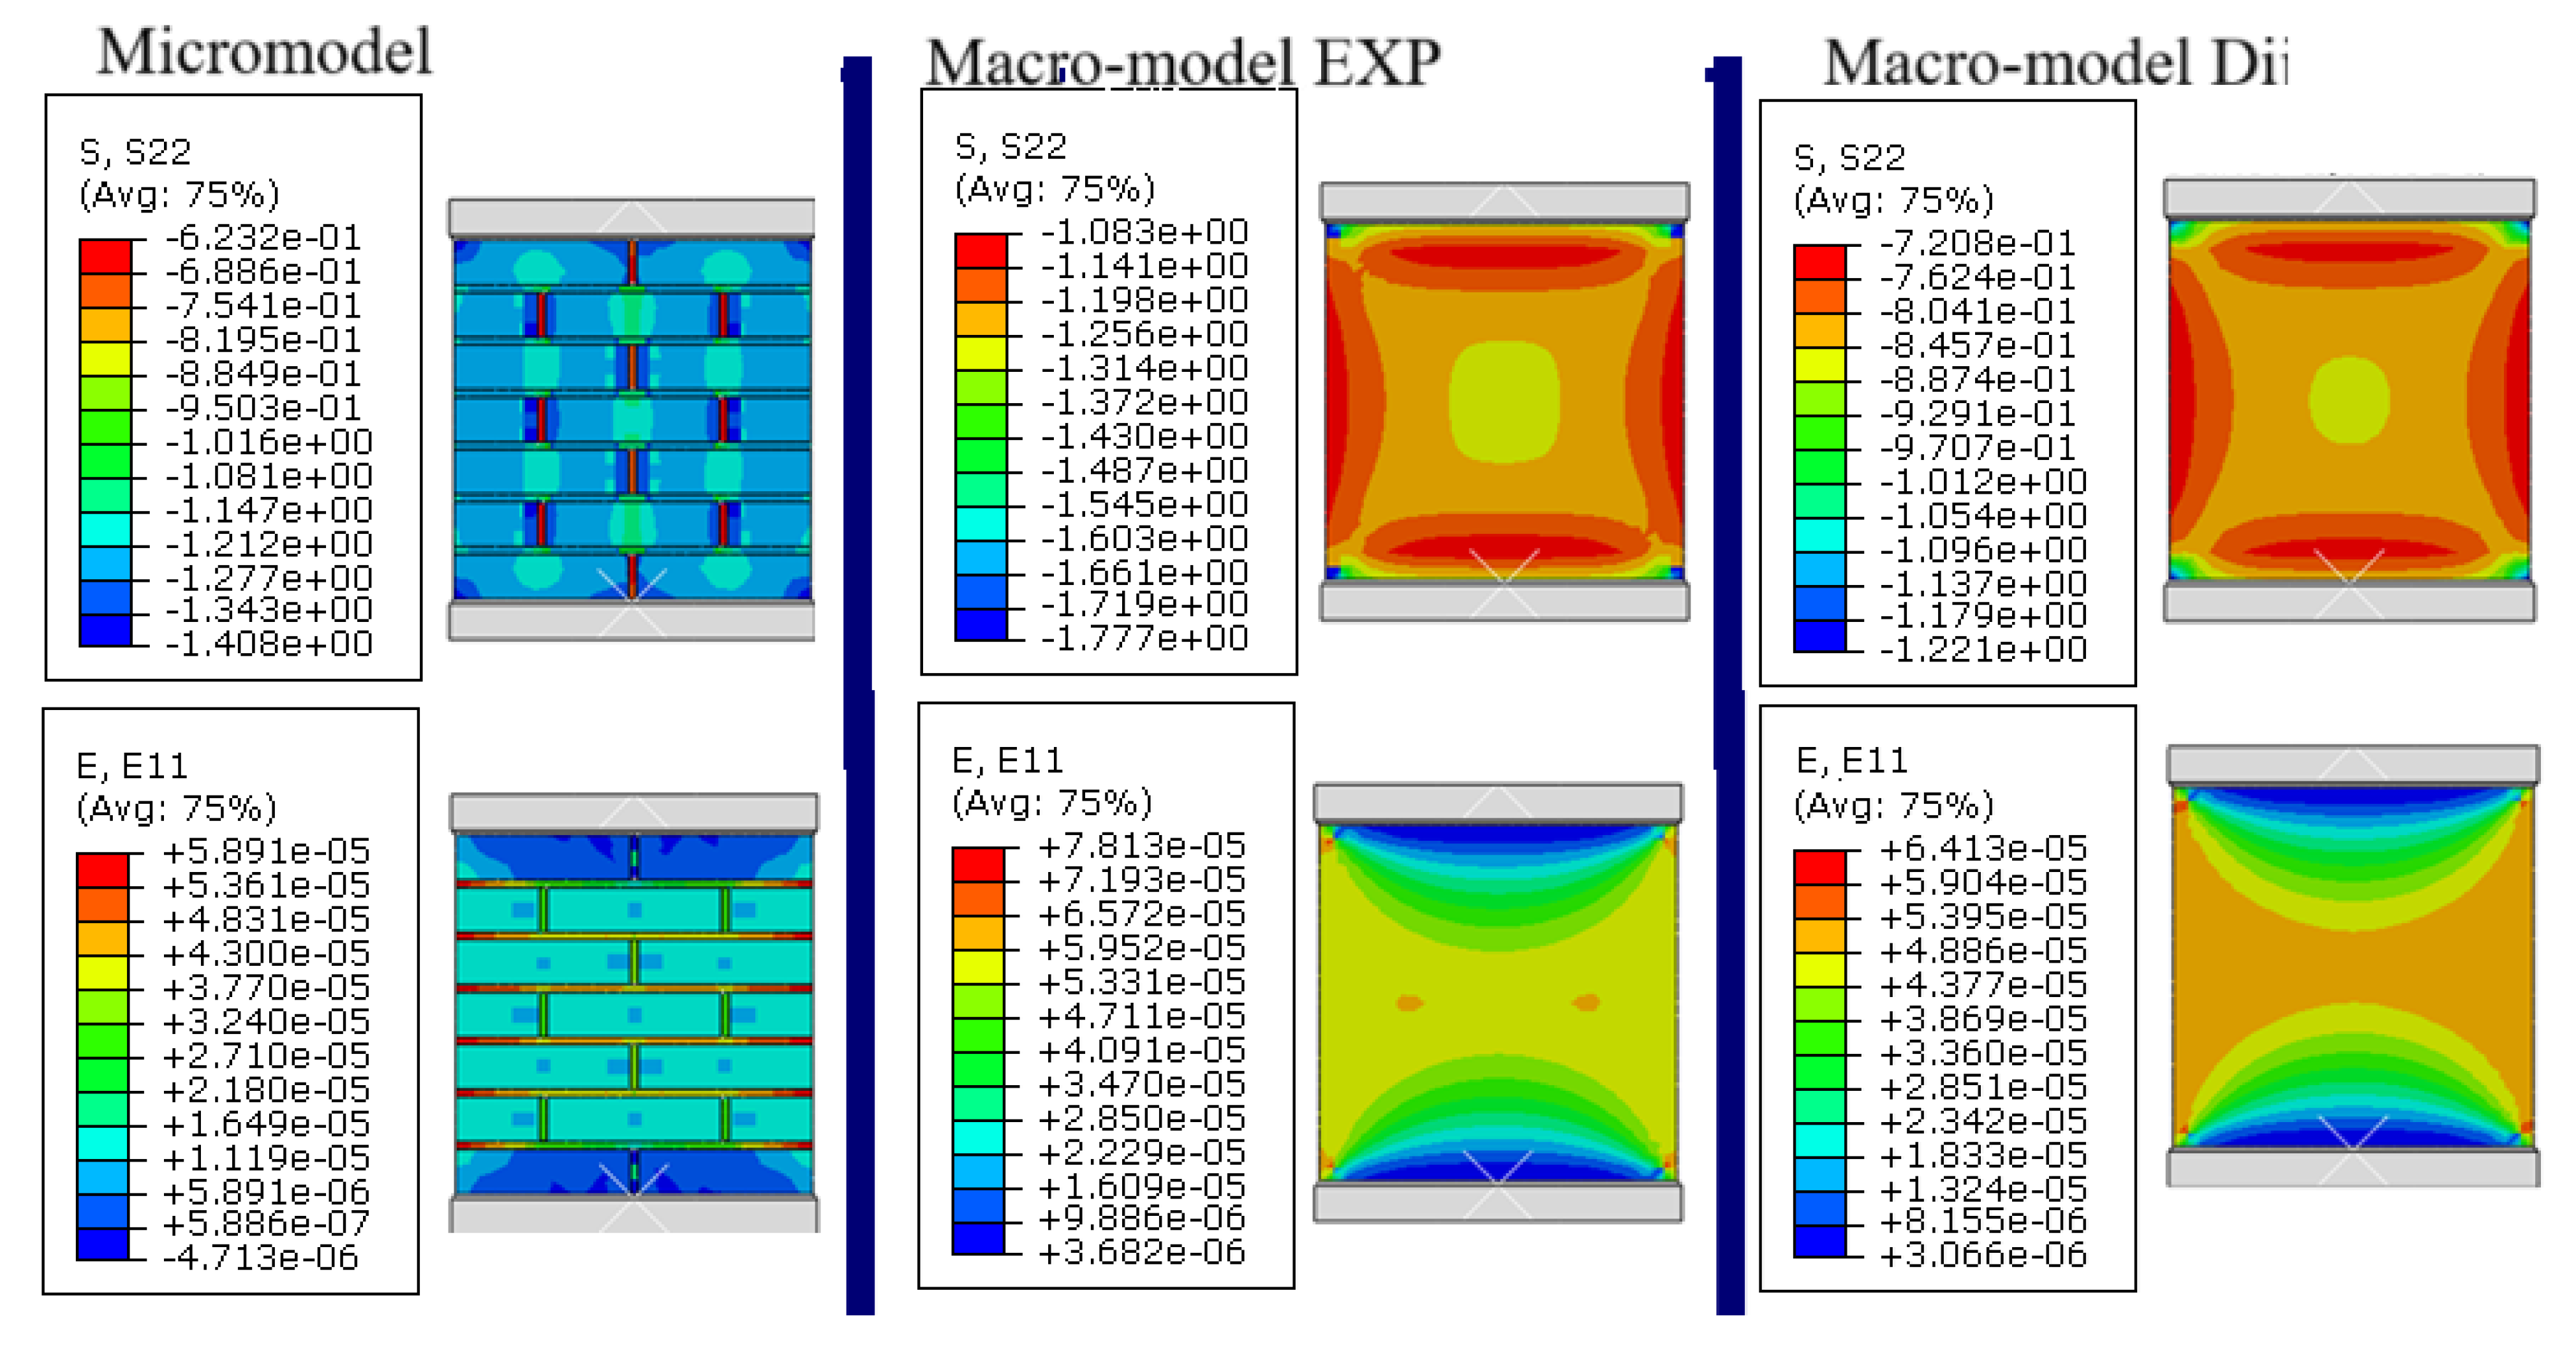
Figure 6b.
Isofields of compressive stresses σy and horizontal strain distributions under loading parallel to joints mortar for KRO-3 masonry.
Figure 6b.
Isofields of compressive stresses σy and horizontal strain distributions under loading parallel to joints mortar for KRO-3 masonry.
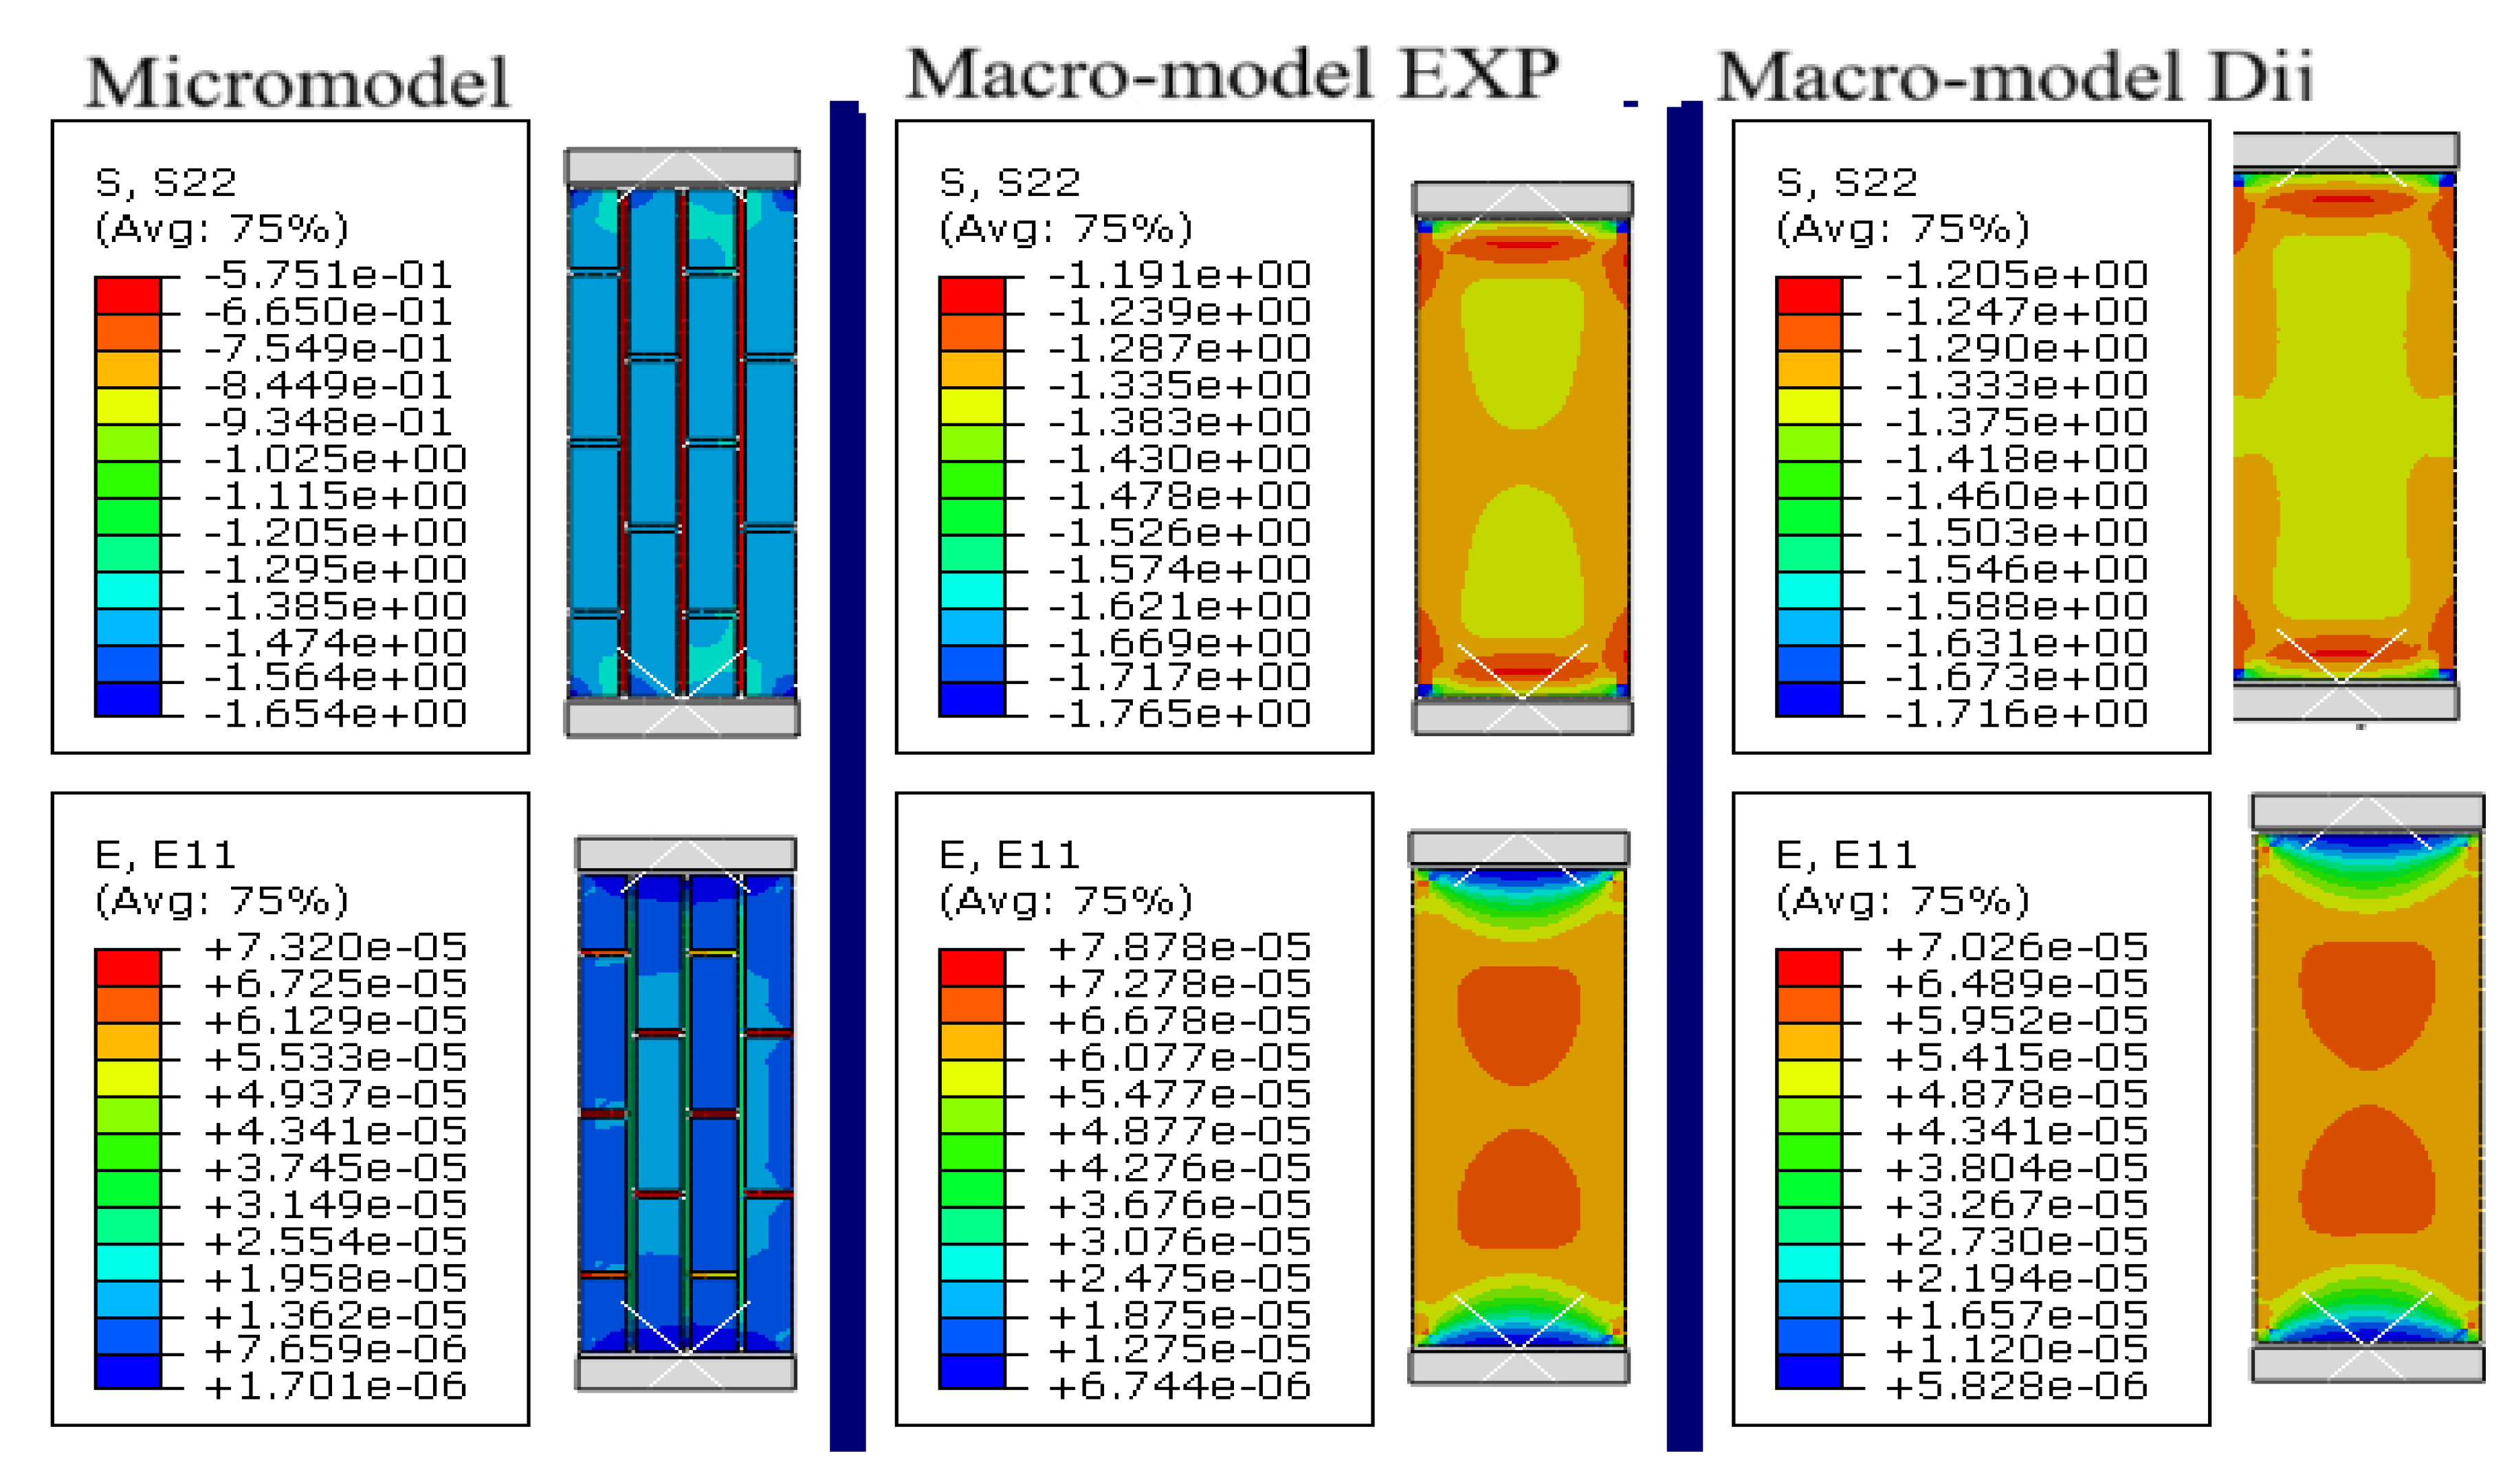
Figure 7.
Comparison of Voigt and Reuss error.
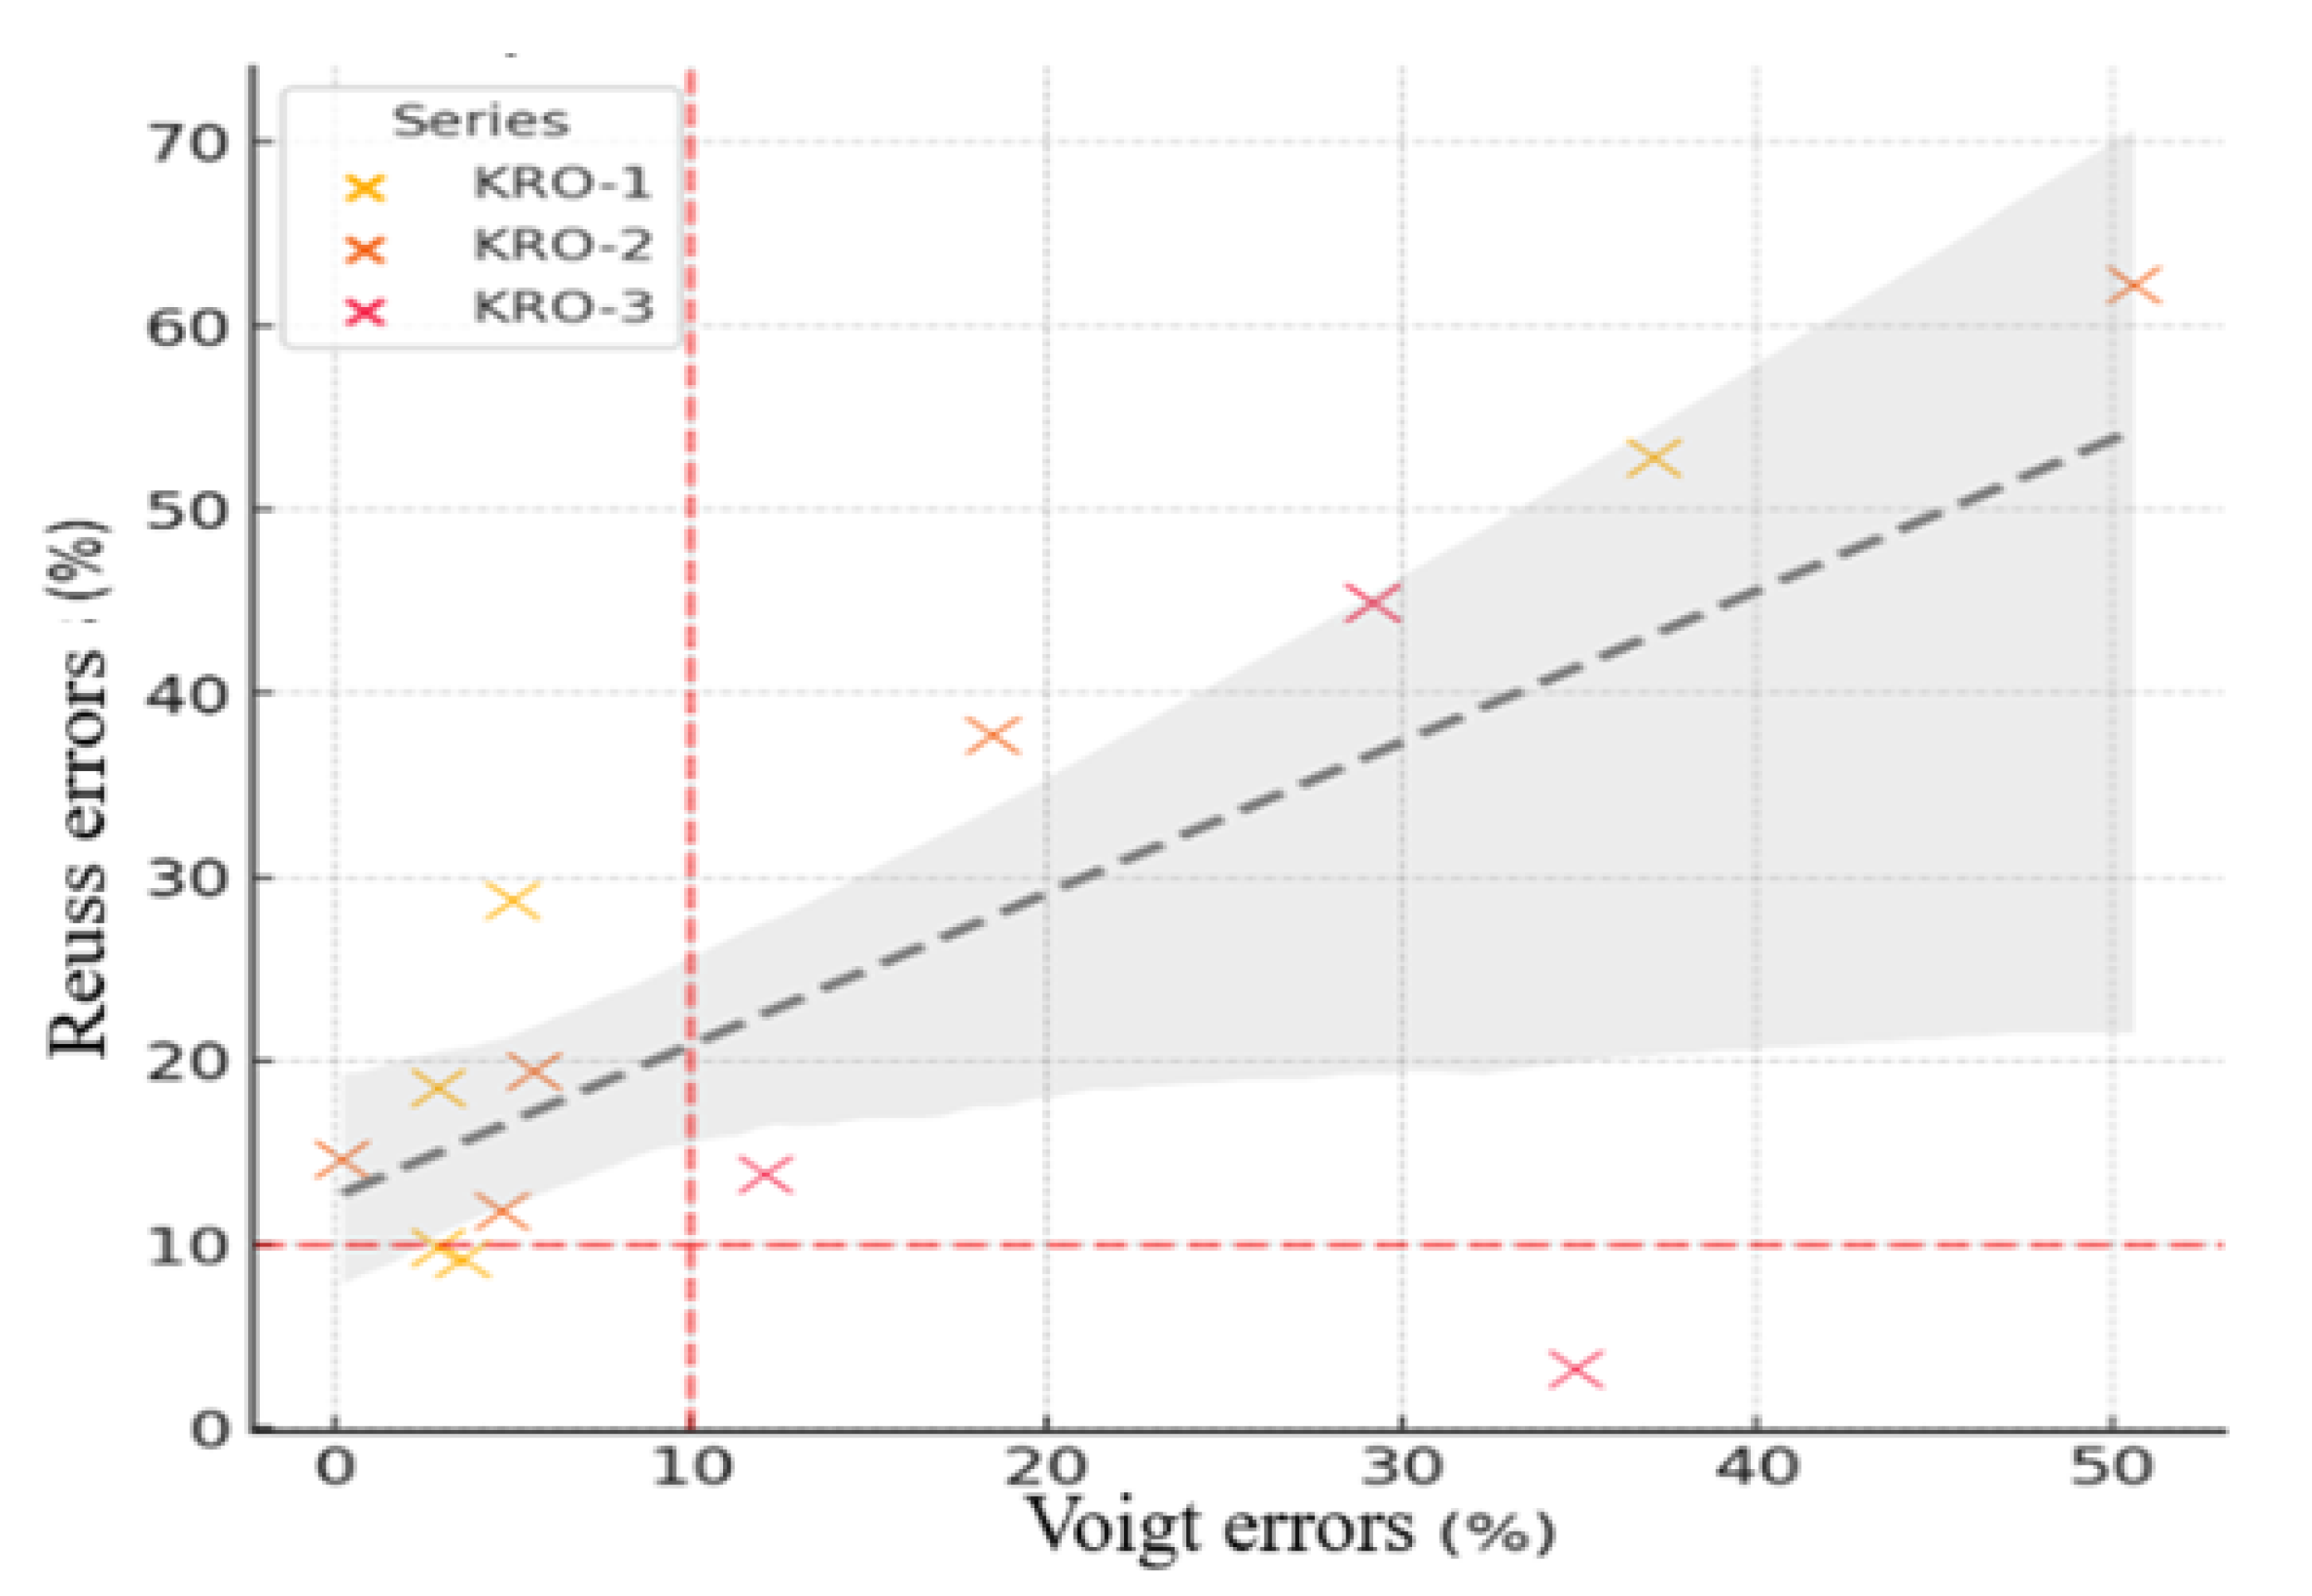
Figure 8.
Effect of the brick-to-mortar stiffness ratio on the effective elastic moduli of masonry: comparison of experimental results, stiffness matrix components from Eqs. (8–9), and Voigt–Reuss bounds.
Figure 8.
Effect of the brick-to-mortar stiffness ratio on the effective elastic moduli of masonry: comparison of experimental results, stiffness matrix components from Eqs. (8–9), and Voigt–Reuss bounds.
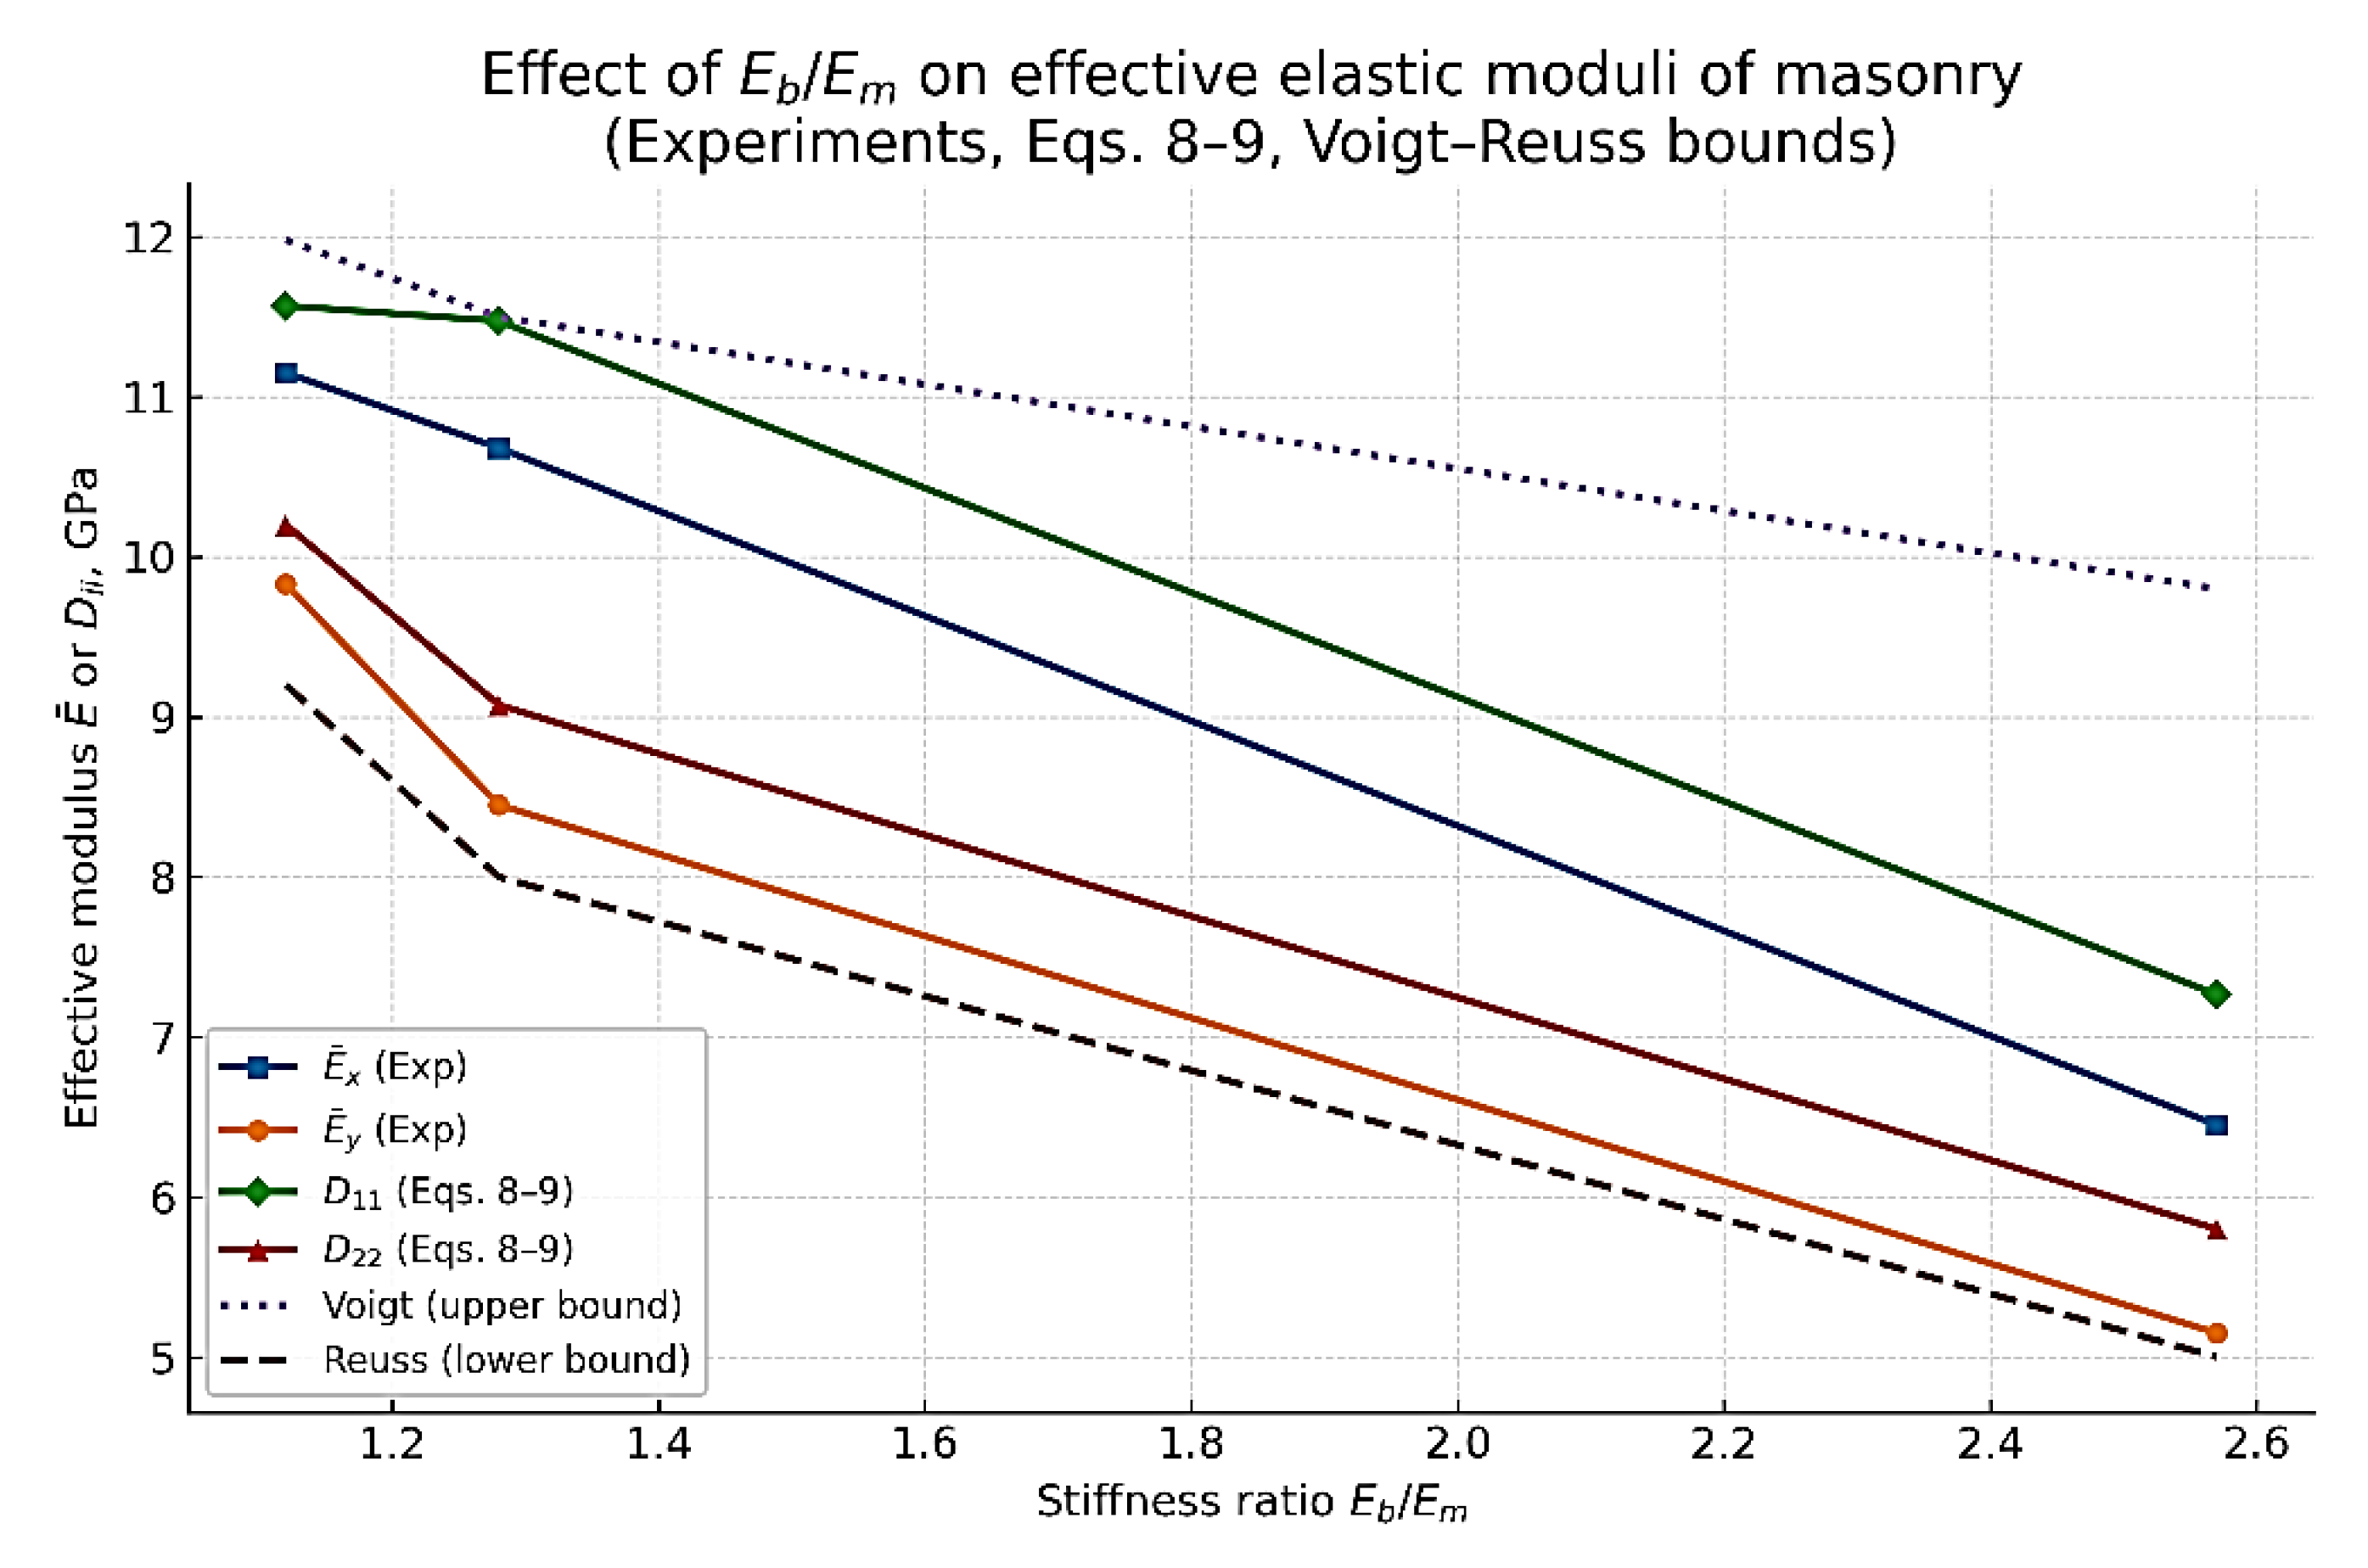
Table 2.
Stiffness characteristics of masonry.
| Series | Experimental values from work [20] | ||||||
|---|---|---|---|---|---|---|---|
| Eb/Em | Ex (MPa) | Ey (MPa) | GXY (MPa) | Ex / Ey | |||
| KRO -1 | 1.12 | 11150 | 9830 | 0.165 | 0.22 | 4786.5 | 1.134 |
| КRО-2 | 1.28 | 10680 | 8450 | 0.23 | 0.30 | 4341.5 | 1.264 |
| KRO -2 | 2.57 | 6450 | 5150 | 0.32 | 0.35 | 2443.2 | 1.252 |
| Series | Results of calculation of the stiffness matrix Dij | ||||||
| Eb/Em | D11 (MPa) | D12 (MPa) | D21 (MPa) | D22 (МПа) | D33 (MPa) | D₁₁/D₂₂ | |
| KRO -1 | 1.12 | 11568.3 | 2545.0 | 1684.2 | 10201.4 | 4786.5 | 1.134 |
| КRО-2 | 1.28 | 11473.7 | 3442.1 | 2085.9 | 9074.1 | 4341.5 | 1.264 |
| KRO -2 | 2.57 | 7264.9 | 2542.8 | 1856.1 | 5799.5 | 2443.2 | 1.253 |
Table 3.
Anisotropy coefficients for the KRO-1, KRO-2, KRO-3 series.
| Series | Accounting for Symmetry in Anisotropy Coefficients | |||
|---|---|---|---|---|
| (MPa) | ||||
| KRO -1 | 2114.6 | 1.065 | 2 | 2.03 |
| КRО-2 | 2764 | 1.126 | 2 | 2.06 |
| KRO -3 | 2199.45 | 1.118 | 2 | 2.06 |
| Series | Accounting for an asymmetric in Anisotropy Coefficients | |||
| KRO -1 | 1.51 | 1.61 | 1.945 | 2.27 |
| KRO -2 | 1.65 | 1.86 | 1.93 | 2.38 |
| KRO -3 | 1.37 | 1.53 | 1.97 | 2.24 |
Table 4.
Comparison of parameters of symmetric and asymmetric models.
| Series | Parameters | D12 ≠ D21 | (%) | |
|---|---|---|---|---|
| KRO -1 | 1.065 | 1.61 | 51% | |
| 2.03 | 2.27 | 12% | ||
| KRO -2 | 1.126 | 1.86 | 65% | |
| 2.06 | 2.38 | 15% | ||
| KRO -3 | 1.118 | 1.53 | 37% | |
| 2.06 | 2.24 | 9% |
Table 5.
Calculation of errors in horizontal deformations and vertical stresses under load parallel and perpendicular to the joints for KRO -1 masonry.
Table 5.
Calculation of errors in horizontal deformations and vertical stresses under load parallel and perpendicular to the joints for KRO -1 masonry.
| № | (MPa) | -EXP (MPa) | EXP (%) | -D (MPa) | D (%) |
|---|---|---|---|---|---|
| Calculation of errors for vertical stresses under load perpendicular to the seams | |||||
| 2 | -3.36 | -3.51 | 4.46 | -3.54 | 5.36 |
| 6 | -3.64 | -3.92 | 7.69 | -3.88 | 6.59 |
| 10 | -3.93 | -4.32 | 9.92 | -4.22 | 7.38 |
| № | -EXP | EXP (%) | -D (E11) | D (%) | |
| Calculation of errors of horizontal deformations under load perpendicular to the seams | |||||
| 2 | 0.000052 | 0.000057 | 9.62 | 0.000049 | 5.77 |
| 6 | 0.000033 | 0.000037 | 12.12 | 0.000032 | 3.03 |
| 10 | 0.000014 | 0.000017 | 21.43 | 0.000015 | 7.14 |
| № | (MPa) | -EXP (MPa) | EXP (%) | -D (MPa) | D (%) |
| Calculation of errors for vertical stresses under load parallel to seams | |||||
| 2 | -2.28 | -2.38 | 4.39 | -2.41 | 5.70 |
| 6 | -2.50 | -2.62 | 4.80 | -2.19 | 12.40 |
| 10 | -2.71 | -2.86 | 5.54 | -2.77 | 2.21 |
| № | -EXP | EXP (%) | -D (E11) | D (%) | |
| Calculation of errors of horizontal deformations under load parallel to seams | |||||
| 2 | 0.000037 | 0.000045 | 21.62 | 0.000032 | 13.51 |
| 6 | 0.000024 | 0.00003 | 25 | 0.000021 | 12.50 |
| 10 | 0.000011 | 0.000015 | 36.36 | 0.000011 | 0.00 |
Table 6.
Calculation of errors in horizontal deformations and vertical stresses under load parallel and perpendicular to the joints for KRO -2 masonry.
Table 6.
Calculation of errors in horizontal deformations and vertical stresses under load parallel and perpendicular to the joints for KRO -2 masonry.
| № | (MPa) | -EXP (MPa) | EXP (%) | -D (MPa) | D (%) |
|---|---|---|---|---|---|
| Calculation of errors for vertical stresses under load perpendicular to the seams | |||||
| 1 | -1.501 | -1.482 | 1.27 | -1.489 | 0.8 |
| 5 | -1.692 | -1.718 | 1.54 | -1.716 | 1.42 |
| 10 | -1.931 | -2.012 | 4.19 | -2 | 3.57 |
| № | -EXP | EXP (%) | -D | D (%) | |
| Calculation of errors of horizontal deformations under load perpendicular to the seams | |||||
| 2 | 0.000036 | 0.000039 | 8.3 | 0.000036 | 0 |
| 6 | 0.000021 | 0.000026 | 23.8 | 0.000024 | 14.3 |
| 10 | 0.0000093 | 0.000012 | 29.0 | 0.000011 | 18.3 |
| № | (MPa) | -EXP (MPa) | EXP (%) | -D (MPa) | D (%) |
| Calculation of errors for vertical stresses under load parallel to seams | |||||
| 2 | -2.05 | -2.36 | 15.1 | -2.36 | 15.1 |
| 6 | -2,36 | -2.63 | 11.4 | -2,63 | 11.4 |
| 10 | -2.68 | -2.91 | 8.6 | -2.9 | 8.2 |
| № | -EXP | EXP (%) | -D | D (%) | |
| Calculation of errors of horizontal deformations under load parallel to seams | |||||
| 2 | 0.000049 | 0.000058 | 18.4 | 0.000053 | 8.2 |
| 6 | 0.000031 | 0.000038 | 22.6 | 0.000036 | 16.1 |
| 10 | 0.000014 | 0.000019 | 35.7 | 0.000018 | 28.6 |
Table 7.
Calculation of errors in horizontal deformations and vertical stresses under load parallel and perpendicular to the joints for KRO -3 masonry.
Table 7.
Calculation of errors in horizontal deformations and vertical stresses under load parallel and perpendicular to the joints for KRO -3 masonry.
| № | (MPa) | -EXP (MPa) | EXP (%) | -D (MPa) | D (%) |
|---|---|---|---|---|---|
| Calculation of errors for vertical stresses under load perpendicular to the seams | |||||
| 2 | -0.68 | -1.14 | 67.65 | -0.76 | 11.76 |
| 6 | -0.95 | -1.37 | 44.21 | -0.92 | 3.16 |
| 10 | -1.2 | -1.6 | 33.33 | -1.01 | 15.83 |
| № | -EXP | EXP (%) | -D | D (%) | |
| Calculation of errors of horizontal deformations under load perpendicular to the seams | |||||
| 2 | 0.000053 | 0.000071 | 33.96 | 0.000059 | 11.32 |
| 6 | 0.000032 | 0.000047 | 46.88 | 0.000038 | 18.75 |
| 10 | 0.000011 | 0.000022 | 100 | 0.000018 | 63.64 |
| № | (MPa) | -EXP (MPa) | EXP (%) | -D (MPa) | D (%) |
| Calculation of errors for vertical stresses under load parallel to seams | |||||
| 2 | -0.66 | -1.2 | 81.82 | -1.2 | 81.82 |
| 6 | -1 | -1.4 | 40 | -1.4 | 40 |
| 10 | -1.3 | -1.6 | 23.08 | -1.5 | 15.38 |
| № | -EXP | EXP (%) | -D | D (%) | |
| Calculation of errors of horizontal deformations under load parallel to seams | |||||
| 2 | 0.000067 | 0.000072 | 7.46 | 0.000064 | 4.48 |
| 6 | 0.000043 | 0.000048 | 11.63 | 0.000043 | 0 |
| 10 | 0.000019 | 0.000024 | 26.32 | 0.000021 | 10.53 |
Table 8.
Comparison of methods for assessing the stiffness of masonry.
| Series | Parameter | Calculation by Dij (MPa) | Voigt Method (MPa) | Voigt errors (%) | Reuss Method (MPa) | Reuss errors (%) |
|---|---|---|---|---|---|---|
| КRО-1 | D11 | 11568.3 | 11980 | 3.6 | 10500 | 9.2 |
| D12 | 2545.0 | 1600 | 37.1 | 1200 | 52.8 | |
| D21 | 1684.2 | 1600 | 5.0 | 1200 | 28.7 | |
| D22 | 10201.4 | 10500 | 2.9 | 9200 | 9.8 | |
| D33 | 4786.5 | 4650 | 2.9 | 3900 | 18.5 | |
| КRО-2 | D11 | 11473.7 | 11500 | 0.2 | 9800 | 14.6 |
| D12 | 3442.1 | 1700 | 50.6 | 1300 | 62.2 | |
| D21 | 2085.9 | 1700 | 18.5 | 1300 | 37.7 | |
| D22 | 9074.1 | 9500 | 4.7 | 8000 | 11.8 | |
| D33 | 4341.5 | 4100 | 5.6 | 3500 | 19.4 | |
| КRО-3 | D11 | 7264.9 | 9800 | 34.9 | 7500 | 3.2 |
| D12 | 2542.8 | 1800 | 29.2 | 1400 | 44.9 | |
| D21 | 1856.1 | 1800 | 29.2 | 1400 | 44.9 | |
| D22 | 5799.5 | 6500 | 12.1 | 5000 | 13.8 | |
| D33 | 2443.2 | 4100 | 67.8% | 3500 | 43.2% |
Disclaimer/Publisher’s Note: The statements, opinions and data contained in all publications are solely those of the individual author(s) and contributor(s) and not of MDPI and/or the editor(s). MDPI and/or the editor(s) disclaim responsibility for any injury to people or property resulting from any ideas, methods, instructions or products referred to in the content. |
© 2025 by the author. Licensee MDPI, Basel, Switzerland. This article is an open access article distributed under the terms and conditions of the Creative Commons Attribution (CC BY) license (http://creativecommons.org/licenses/by/4.0/).
Copyright: This open access article is published under a Creative Commons CC BY 4.0 license, which permit the free download, distribution, and reuse, provided that the author and preprint are cited in any reuse.


