
Submitted:
28 August 2025
Posted:
01 September 2025
You are already at the latest version
Abstract
Low crystalline hydroxyapatite was synthesized from an aqueous solution of calcium chloride CaCl2 and a mixed-anionic (HPO42- и CO32-) aqueous solution prepared from potassium hydro-phosphate trihydrate K2HPO4 3Н2О and potassium carbonate K2CO3. The interaction of K2CO3 and K2HPO4 salts during synthesis from a mixed anionic solution in the reaction zone without additional regulation provided the pH level necessary for the synthesis of hydroxyapatite. For comparison, as references, powders were also synthesized from an aqueous solution of calcium chloride CaCl2 and from aqueous solutions of either potassium hydrophosphate K2HPO4 or potassium carbonate K2CO3. The phase composition of the powder synthesized from aqueous solutions of calcium chlo-ride CaCl2 and potassium hydrophosphate K2HPO4 included brushite CaНРО4·2H2O. The phase composition of the powder synthesized from aqueous solutions of calcium chloride CaCl2 and po-tassium carbonate K2CO3 included calcite CaCO3. The phase composition of all synthesized pow-ders contained potassium chloride (sylvine) KCl as a reaction by-product. After heat treatment at 1000 °C of the powder containing low crystalline hydroxyapatite and potassium chloride (sylvine) KCl, powder of chlorapatite Са10(РО4)6Cl2 was obtained. After heat treatment of a powder con-taining brushite CaНРО4·2H2O and potassium chloride (sylvine) KCl at 800 and 1000 °C, a powder with the phase composition including β-calcium pyrophosphate β-Ca2P2O7, β-calcium ortho-phosphate β-Ca3(PO4)2 and potassium-calcium pyrophosphate K2CaP2O7 was obtained. Heat treatment of calcite CaCO3 powder at 800 °C, as expected, led to the formation of calcium oxide CaO. Synthesized powders including biocompatible minerals such as hydroxyapatite, chlorapatite, brushite, monetite, calcium pyrophosphate, calcium potassium pyrophosphate, tricalcium phos-phate, calcite can be used for creation of biocompatible inorganic materials or composite materials with a biocompatible polymer matrix. The potassium chloride present in the synthesized powders can act as one of the precursors of biocompatible minerals such as chlorapatite or calcium potassium pyrophosphate; or it can be treated as a removable inorganic porogen.
Keywords:
synthesis
; mixed anionic solution
; hydroxyapatite
; brushite
; calcite
; sylvine
; monetite
; calcium pyrophosphate
; tricalcium phosphate
; calcium potassium pyrophosphate
; chlorapatite
1. Introduction
Fine powders with a given chemical and phase composition and high uniformity of component distribution are required for creation of inorganic materials or composite materials with unique functional properties [1,2,3]. The simplest and most obvious is the method of mechanical homogenization of powder mixtures, which is carried out using special equipment, such as a planetary mill [4]. High-temperature solid-phase synthesis from a homogeneous mixture of salts obtained by drying a solution of these salts at subzero temperatures is more difficult for implementation [5]. The maximum level of homogenization is achieved in mixed-anionic compounds, which are produced using high-temperature (synthesis in the solid phase, synthesis by interaction of gas and solid phases, synthesis using pressure) and low-temperature reactions (topochemical, solvothermal synthesis, synthesis in thin films) [6]. Precipitation of hydroxides [7], carbonates or oxalates are also used to obtain homogeneous precursors of oxide powders [8]. Synthesis of inorganic powders consisting of small particles with a high specific surface area and activity via precipitation from solution is the most convenient for implementation [9].
High uniformity of the distribution of components in a powder intended for the production of biocompatible materials can be achieved using synthesis from both mixed-cationic [10] and mixed-anionic solutions, for example, containing HPO42-/P2O74- [11], HPO42-/CO32- [12,13,14], P2O74−/CO32− [15], HPO42-/SiO32- [16].
The mineral component of bone tissue is mainly represented by carbonate-substituted hydroxyapatite [17]. Calcium hydroxyapatite Ca10(PO4)6(OH)2 is a well-known and unique ion exchanger [18,19,20], therefore, various cations such as Na+, K+, Mg2+, Zn2+, Ba2+, or Sr2+ [21] and anions such as CO32− or SiO44−, F− or Cl− can be included in the composition of bone tissue [22,23].
Various powders obtained by one of the methods of chemical synthesis are used for the manufacture of bone implants [24]. Precipitation from solutions including a hydrophosphate ion, a carbonate ion, and a calcium ion is preferable due to the possibility of obtaining powders similar in chemical and phase composition to natural bone tissue [12,13,14,25]. Powders of calcium phosphates with molar ratio Ca/P<1.67 and calcium carbonates are used to creating materials for temporary bone implants. At the same time, hydroxyapatite-based materials (molar ratio Ca/P=1.67) are resistant to dissolution and can be used as implants for long time substituting [26].
Materials based on calcium carbonates [27,28,29] and calcium phosphates with a molar ratio of Ca/P<1.67 are able to dissolve gradually during implantation and therefore they are used in regenerative methods of bone defects treating [30]. Synthetic powders of calcium carbonate CaCO3 and calcium phosphates with a molar ratio of Ca/P<1.67 can be used as fillers in biocompatible and biodegradable composites with polymer [31] or mineral (obtained as a result of chemical bonding reactions) matrices [32]. In addition, these powders can also be used to produce biocompatible ceramic materials with the phase composition belonging to oxide systems, including calcium oxide and phosphorus oxide [33].
The aim of the present work consisted in preparing and investigating powders synthesized from an aqueous solution of calcium chloride CaCl2 and a mixed anionic solution containing orthophosphate and carbonate ions. Potassium hydroorthophosphate K2HPO4 was used as the source of orthophosphate ions, and potassium carbonate K2CO3 was used as the source of carbonate ions. For comparison, as references, powders were also synthesized from an aqueous solution of calcium chloride CaCl2 and aqueous solutions including either potassium hydrophosphate K2HPO4 or potassium carbonate K2CO3.
2. Materials and Methods
For the synthesis of powders, calcium chloride CaCl2 (CAS No. 10043-52-4, Rushim, Moscow, Russia), potassium hydrophosphate trihydrate K2HPO4 3H2O (CAS No. 16788-57-1, Rushim, Moscow, Russia) and potassium carbonate K2CO3 (CAS No. 584-08-7, Rushim, Moscow, Russia) were used.
The following reactions were used to calculate the amounts of starting salts and expected products:
CaCl2 + K2HPO4·3H2O→CaHPO4·2H2O + 2KCl + H2O
CaCl2 + 0,5K2HPO4·3H2O + 0,5K2CO3→0,5CaCO3 + 0,5CaHPO4·2H2O + 2KCl+0,5H2O
CaCl2 + K2CO3→CaCO3 + 2KCl
The labeling and synthesis conditions of the powders from CaCl2 and K2HPO4 and/or K2CO3 are shown in Table 1.
500 ml of 0.5M aqueous solution of potassium hydrophosphate K2HPO4 (PO4 powder); 500 ml of 0.5M aqueous solution of potassium carbonate K2CO3 (CO3 powder); 500 ml aqueous solution containing 0.125M potassium hydrophosphate K2HPO4 and 0.125M potassium carbonate K2CO3 (PO4_CO3 powder) were added to the 500 ml of 0.5M aqueous CaCl2 solutions. The resulting suspensions were kept on a stirrer for 30 minutes. The resulting precipitates were separated from the mother liquor using vacuum filtration. The synthesized powders were dried in a thin layer at room temperature for a week. After drying, the powders were crushed using an agate mortar and pestle, and then passed through a polyester sieve with a mesh size of 200 microns. For the isolation of salts dissolved in the mother liquors they were dried at 40 °C for a month. The synthesized powders and isolated reaction by-products were weighed to determine their mass and to estimate the yield of synthesized powders and reaction by-products relatively to the theoretically possible amounts. Table 2 shows the quantities of the initial, expected target products and reaction by-product calculated in accordance with reactions (1-3).
To study the thermal evolution of the phase composition of the synthesized powders, they were placed in porcelain boats and heated at a heating rate of 5 °C/min, followed by exposure for 2 hours at various temperatures in the range of 200-1000 °C. The labeling of the powders after heat treatment used in the figures is shown in Table 3.
The phase composition of powders after synthesis and after heat treatment was performed by X-ray powder diffraction (XRD) analysis using CuKa radiation (λ = 1.5418 Å, step 2θ – 0.02°) using Rigaku D/Max-2500 diffractometers (Rigaku Corporation, Tokyo, Japan) in the angle range 2θ = 2…70° or Tongda TD-3700 (Dandong Tongda Science & Technology Co., Ltd., Dandong, China) in the angle range 2θ = 3…70°. The X-ray images were analyzed using the WinXPOW program using the ICDD PDF-2 (http://www.icdd.com/products/pdf2.htm, accessed on 18 August 2025) [34] databases and the Match! program. (https://www.crystalimpact.com/, accessed on 18 August 2025). The quantitative ratio of the target and related products in the obtained powders was determined using the Match!3 program, https://www.crystalimpact.com/. The infrared (IR) spectra were collected in the wavelength range 500-4000 cm−1 using the Spectrum Three IR spectrometer (Perkin Elmer, Waltham, Massachusetts, USA) in the mode of disturbed total internal reflection using the Universal ATR accessory (crystal diamond/KRS-5). The bands in the spectra were assigned based on the literature data [35]. Synchronous thermal analysis (TA), including thermogravimetric analysis (TGA) and differential scanning calorimetry (DSC), was performed on a NETZSCH STA 449 F3 Jupiter thermal analyzer (NETZSCH, Selb, Germany) in air in the temperature range of 40-1000 °C at a heating rate of 10 °C/min, using pre-thermostating at 40 °C for 30 minutes. The mass of the sample was at least 10 mg. The composition of the gas phase was monitored using a Netzsch QMS 403 Quadro quadrupole mass spectrometer (NETZSCH, Germany) combined with a NETZSCH STA 449 F3 Jupiter thermal analyzer (NETZSCH, Selb, Germany). Mass spectra (MS) were recorded for m/z=44 (CO2). The microstructure of the powders was studied by scanning electron microscopy (SEM) using a scanning electron microscope with an auto emission source JEOL JSM-6000PLUS Neoscope II (JEOL Ltd., Japan). For the study, the samples were glued onto a copper substrate using carbon tape, and a layer of gold ~ 15nm was sprayed. The survey was carried out in vacuum mode. The accelerating voltage of the electron gun was up to 5 kV. The images were obtained in secondary electrons at magnifications up to 1000× and recorded in digitized form on a computer.
3. Results and Discussion
The XRD data of synthesized powders are shown in Figure 1.
Phase composition of powder, synthesized from water solutions CaCl2 and K2CO3, included calcite CaCO3. Phase composition of powder, synthesized from water solutions CaCl2 and K2HPO4, included brushite CaHPO4·2H2O. Phase composition of powder, synthesized from water solutions CaCl2 and mixed-anionic solution containing K2CO3 и K2HPO4, included a low crystalline product with the main peaks corresponding to hydroxyapatite Ca10(PO4)6(OH)2. All synthesized powders included potassium chloride (sylvine) KCl as a reaction by-product. XRD data of reaction by-products isolated from mother liquors is presented in Figure 2. The phase composition of the by-products isolated from the mother liquors was presented by potassium chloride (sylvine) KCl.
The formation of brushite CaHPO4·2H2O and calcite CaCO3 can be caused by reactions (1) and (3), respectively. During the preparation of the mixed-anionic aqua solution from potassium hydrophosphate K2HPO4 and potassium carbonate K2CO3 taken in an equimolar ratio, not only the release of CO2 was observed, but also the formation of potassium orthophosphate K3PO4, occurred. Reaction (4) indicates that when mixing solutions of these two salts the presence of potassium carbonate K2CO3 also persists.
2K2HPO4 + K2CO3 → 2K3PO4 + H2O + CO2
So, due to hydrolysis (reactions 5 and 6) the mixed-anionic solution had an alkaline pH, characteristic of aqua solution of salts formed by a strong base and a weak acid:
K2CO3 + 2H2O → KHCO3 + KOH + H2O
K3PO4 + H2O → K2HPO4 + KOH
The synthesis of hydroxyapatite can be represented formally as reaction (7) taking into account the molar ratio of the salts used for synthesis as it was described in Materials and methods (reaction 2):
12CaCl2 + 6K2HPO4 + 6K2CO3 → Ca10(PO4)6(OH)2 + 2CaCO3 + 24KCl + 2H2O + 4CO2
In this case, the theoretically possible amount of hydroxyapatite Ca10(PO4)6(OH)2 (0.0208 mol=20.9 g) can be calculated as 1/6 of the amount of potassium hydrophosphate K2HPO4 (0.125 mol) used for preparation of a mixed-anionic solution (Table 1). Taking into account the possibility of formation of calcium carbonate CaCO3, the mass of the precipitate can be calculated as the sum of the possible amounts of hydroxyapatite and calcium carbonate. The amount of calcium carbonate CaCO3 (0.0417 mol=4.17 g) can be calculated as 1/6 of the amount of CaCl2 (0.25 mol). Thus, the mass of the precipitate in the synthesis of PO4_CO3 can be calculated as 25.07 g. Theoretically calculated (expected) and experimentally obtained masses of target products and by-products, as well as their comparison, are presented in Table 4.
The data presented in the Table 4 indicate that the total yield of synthesis products was close to ~90% in all cases. According to the estimation obtained using the Match! program, the content of the reaction by-product (potassium chloride, sylvine KCl) was maximal (30.9%) in the powder synthesized from a mixed-anionic solution. The amount of potassium chloride (sylvine) KCl in the PO4 powder was determined as 2.8%, and in the CO3 powder it was determined as 1.8%. The estimation of the amount of by-product in synthesized powders obtained using the Match! program is consistent with the estimation of the amount of by-product retained in PO4_CO3 and CO3 powders (Table 4). A small particle size and a significant specific surface area may determine the ability of the synthesized PO4_CO3 powder to retain (occlude) mother liquors and the by-product dissolved in it, as it has been shown in other studies [36].
Figure 3 shows the FTIR spectroscopy data of synthesized powders.
The FTIR spectroscopy data (Figure 3) is consistent with the X-ray diffraction data, since the appearance of the curves corresponds to the reference and literature data for brushite (SpectraBase Spectrum ID 9u0yn3G2J6i https://spectrabase.com/spectrum/9u0yn3G2J6i [37,38,39]), calcite (SpectraBase Compound ID YYVCfbcpX1 https://spectrabase.com/spectrum/YYVCfbcpX1 [40,41,42]), hydroxyapatite (SpectraBase Spectrum ID BxeLPnr9PTc https://spectrabase.com/spectrum/BxeLPnr9PTc [43], and carbonate-hydroxyapatite [14,44,45]). On the spectra of PO4 and CO3 powders, there are valence (ν) and deformation (δ) vibrations which are characteristic of brushite CaHPO4·2H2O: ν(OH) – 3539, 3473, 3270, 3153 cm-1; ν(P-O-H) – 1204 cm-1; ν(PO) – 1120, 1052, 980 cm-1 δ(OH) – 1645 cm-1; 980 cm-1; δ(P-OH) – 871 cm-1; δ(PO) – 656, 575, 519 cm-1) and calcite CaCO3: ν(CO32-) – 1390 cm-1; π(CO32-) – 874 cm-1; δ(CO32-) – 710 cm-1) respectively.
Characteristic vibrations of the phosphate group PO43-, which confirm the formation of weakly crystallized hydroxyapatite, can also be seen on the spectrum of the powder PO4_CO3. Vibrations of ν(CO32-) – 1410 cm-1; and π(CO32-) – 874 cm-1 in the spectrum of PO4_CO3 powder suggest the presence of carbonate groups in the structure of the synthesized low crystalline hydroxyapatite. The presence of potassium chloride KCl, regardless of its content in the synthesized powders, is not determined due to the absence of absorption bands in the studied region [46,47].
Figure 4 shows micrographs of synthesized powders.
The particles of PO4 powder (Figure 4, a) with a size of 10-20 microns and a thickness of 1-2 μm have a lamellar morphology characteristic for brushite CaHPO4·2H2O [48]. The particles of CO3 powder (Figure 4, c) with a size of 10-20 μm have the cubic shapes which is one of typical for calcite CaCO3 [49]. The powder PO4_CO3 (Figure 4, b) is composed of large aggregates of 5-60 μm in size, consisting of particles less than 1 μm in size. Hydroxyapatite powders synthesized by precipitation from solutions, as a rule, consist of particles having a size of less than a micron [44]. It was estimated that the mass (33.5 g) of the synthesized PO4_CO3 powder after drying was 8.4 g higher than the expected (25.1 g) mass of the powder (Table 4). The mass of reaction by-product (PO4_CO3_by) isolated from the mother liquor was 11.8 g less than the expected (37.3 g) mass. Thus, after drying and grinding in a mortar, KCl (reaction by-product) retaining in synthesized powder acted as a binder, binding hydroxyapatite particles in large aggregates visible in the micrographs (Figure 4, b).
Figure 5 shows the TA data of the synthesized powders. According to the TGA data (Figure 5, a), the total weight loss at 1000 °C for PO4 powder was 27.9%. The change in the weight of the PO4 powder is possible due to the removal of physically bounded water, dehydration of brushite CaHPO4·2H2O and the formation of monetite CaHPO4 (reaction 8), and the conversion of monetite CaHPO4 into Ca2P2O7 pyrophosphate (reaction 9).
CaHPO4·2H2O → CaHPO4 + 2H2O
2CaHPO4 → Ca2P2O7 + H2O
The theoretically possible mass loss during reactions 8 and 9 is 26.16%, which is close to the value of the total mass loss for PO4 powder determined by the TGA method. All the processes indicated for the PO4 powder, leading to weight loss, occur with heat absorption in the ranges 87-168 °C, 168-243 °C, 375-477 °C (Figure 5, b). It can be assumed that the presence of KCl in the PO4 powder, as well as the stage of thermostating the sample at 40 °C for 30 minutes before heating at a set rate (10 °C/min), causes decomposition of the metastable brushite at lower temperatures in the range of 87-168 °C (reaction 8). In article [50] the authors conclude that two-stage conversion of brushite into monetite was possible with formation of an amorphous phase at the first stage. The range 168-243 °C should be considered as characteristic of the monetite CaHPO4 formation from brushite CaHPO4·2H2O; and the range 375-477 °C should be considered as characteristic of the calcium pyrophosphate Ca2P2O7 from CaHPO4 monetite formation [51]. In the range of 477-840 °C, the smooth change in mass was 3%, while it is difficult to identify the intervals for processes occur with heat absorption or release.
According to the TGA data (Figure 5, a), the total weight loss at 1000 °C for the CO3 powder was 44.9%. The theoretically possible mass change for calcite during thermal decomposition in accordance with reaction (10) is 44%. The change in the mass of the CO3 powder occurred with heat absorption in the range 622-844 °C, amounted to 42.9% due to the decomposition of calcite and was accompanied by the release of CO2 (reaction 10).
CaCO3 → CaO + CO2
The graph of the mass change of the CO3 powder (Figure 5, a) and the dependence of the ion current on temperature (Figure 5, c) have the forms characteristic for calcite CaCO3 [52]. In Figure 5, c, for the CO3 powder, one can see a graph of the dependence of the ion current on temperature for m/z=44 (CO2), typical for CaCO3. It should be noted that in the range 844-949 °C, a loss (2%) of mass is observed, which is most likely associated with both the removal of CO2 and the removal of that insignificant amount of KCl (Table 4), which could be captured by the synthesized CO3 powder above the melting point of KCl (776 °C [53] or 769 ± 2 °C (1042 ± 2 K) [54]).
According to the TGA data (Figure 5, a), the total weight loss at 1000 °C for PO4_CO3 powder was 16.2%. Three sections can be distinguished on the curve of mass versus temperature for PO4_CO3 powder: removal of physically bound water (7.5% mass loss), which proceeds with heat absorption in the range of 43-240 °C; a section of smooth weight reduction (2.6%) in the range of 240-829 °C; and a section of mass loss (6.1%), apparently related to the removal of KCl, in the range of 829-1000 °C. The endothermic peak at 765 °C clearly seen on the DSC curve (Figure 5, b) can be attributed to the melting of KCl, since according to the estimate (Table 4), the mass of the retained reaction by-product (KCl) in the PO4_CO3 powder was the maximum. No endothermic peaks that could be attributed to the KCl melting process were found in the DSC graphs for PO4 and CO3 powders synthesized for comparison. Significantly lower values of the ion current can be seen on the curve m/z =44 (CO2) for PO4-CO3 powder (Figure 5, c) in wide ranges of 460-800 °C and 900-940 °C than for CO3 powder.
Figure 6 shows the XRD of the CO3 powder synthesized from aqueous solutions of CaCl2 and K2CO3 after heat treatment at various temperatures.
According to the XRD data, the phase composition of the CO3 powder synthesized from aqueous solutions of CaCl2 and K2CO3, after heat treatment at various temperatures in the range of 200-600 °C for 2 hours, was represented by calcite CaCO3. And after heat treatment at 800 °C, the phase composition of the CO3 powder was represented by calcium oxide CaO (reaction 10).
Figure 7 shows micrographs of CO3 powders after heat treatment for 2 hours at various temperatures in the range of 200-600 °C. The particle size and shape of the powder particles after heat treatment does not significantly differ from the particle size and shape of the synthesized powder. It is difficult to detect particles with dimensions less than 2 μm and more than 20 μm in the micrographs.
Figure 8 shows the XRD of PO4 powder synthesized from aqueous solutions of CaCl2 and K2HPO4 after heat treatment at various temperatures. After heat treatment at 200 °C for 2 hours, the phase composition of the PO4_200 powder is represented by monetite CaHPO4 (reaction 9). The phase composition of the PO4_400 and PO4_600 powders was represented by γ-calcium pyrophosphate γ-Ca2P2O7 (reaction 10) after heat treatment at 400 °C and at 600 °C for 2 hours. The phase composition of the PO4_800 and PO4_1000 powders included β-tricalcium phosphate β-Ca3(PO4)2, β-calcium pyrophosphate β-Ca2P2O7, as well as calcium potassium pyrophosphate K2CaP2O7 after heat treatment at 800 °C and at 1000 °C for 2 hours
Reaction (11) may reflect the formation of β-calcium orthophosphate β-Ca3(PO4)2 and calcium potassium pyrophosphate K2CaP2O7:
2Ca2P2O7 + 2KCl + H2O → Ca3(PO4)2 + K2CaP2O7 + 2HCl
Figure 9 shows micrographs of PO4 powders after thermal treatment for 2 hours at various temperatures in the range of 200-1000 °C. The particle size and shape of the powder particles after heat treatment at 200 and 400 ° C practically does not differ from the particle size and shape of the synthesized powder. After heat treatment in the range of 600-1000 °C, as the temperature increases, the powder particles more and more lose their lamellar morphology. And after heat treatment at 1000 °C, the PO4_1000 powder is composed of conglomerates 5-20 microns in size, consisting of particles 1-3 microns in size, sintered together.
Figure 10 shows the FTIR data for PO4 and PO4_1000 powders, along with the XRD and SEM data, confirming the transformation of the synthesized powder after heat treatment at 1000 °C. After heat treatment of the PO4 powder at 1000 °C, according to the FTIR data, the presence of PO43- groups remains and a δ(POP) 720 cm-1 vibration appears, which confirms the presence of the pyrophosphate ion P2O74- in both calcium pyrophosphate formed from brushite (reactions 8 and 9) and calcium potassium pyrophosphate (reaction 11).
Figure 11 shows the XRD of the PO4_CO3 powder synthesized from aqueous solutions of CaCl2, KHPO4 and K2CO3 after heat treatment at various temperatures. The phase composition of PO4_CO3 powders after thermal treatment in the range of 200-800 °C is represented by weakly crystallized hydroxyapatite and potassium chloride (sylvine) KCl. After heat treatment at 1000 °C, the phase composition of the powder PO4_CO3_1000 is represented by chlorapatite Ca10(PO4)6Cl2. The formation of chlorapatite can be reflected by the reaction (12):
Ca10(PO4)6(OH)2 + 2KCl → Ca10(PO4)6Cl2 + 2KOH
A similar formation of chlorapatite was observed at 1000 °C from weakly crystalline hydroxyapatite of natural origin and sodium chloride NaCl [55].
Micrographs of PO4_CO3 powder after synthesis and after heat treatment at various temperatures are presented in Figure 12. The microstructure of PO4_CO3 powders, after thermal treatment in the range of 200-800 °C, does not significantly differ from the microstructure of the powder after synthesis and drying. Powders consist of sufficiently large agglomerates (up to 100-200 μm) consisting of particles of weakly crystallized hydroxyapatite bonded with reaction by-product KCl. The microstructure of the PO4_CO3_1000 powder after heat treatment at 1000 °C differs significantly from the microstructure of powders after heat treatment in the range of 200-800 °C. The PO4_CO3_1000 powder after heat treatment at 1000 °C consists of particles with a prismatic shape 5-20 μm long and a transverse dimension of 2-5 μm. In the micrograph (Figure 12, e, left side) with a lower magnification, one can see loose aggregates up to 100 microns in size, consisting of mentioned above prismatic particles.
Figure 13 shows the FTIR spectroscopy data for PO4_CO3 powder after synthesis and after heat treatment at 1000 °C. In the spectrum of the PO4_CO3_1000 powder, there are no peaks that could be attributed to ν(OH), ν(CO32-) or π(CO32-). The FTIR spectrum for the powder PO4_CO3_1000 corresponds to the reference data for chlorapatite (SpectraBase Compound ID KKRjtSFM3Pp, https://spectrabase.com/spectrum/KKRjtSFM3Pp).
4. Conclusions
This section is not mandatory but can be added to the manuscript if the discussion is unusually long or complex.
Powders with the phase composition including target products such as brushite CaHPO4·2H2O and calcium carbonate (calcite) CaCO3, as well as potassium chloride (sylvine) KCl as a reaction by-product, were synthesized from aqueous solutions of calcium chloride CaCl2, potassium hydrophosphate K2HPO4 and potassium carbonate K2CO3. The interaction of a aqueous mixed anionic solution including HPO42- and CO32- anions and an aqueous solution of calcium chloride CaCl2 made it possible to obtain a powder that combined weakly crystallized hydroxyapatite and a significant amount (estimated to be up to 30-35% by weight) of potassium chloride (sylvine) KCl in its phase composition. The XRD, SEM, and FTIR data confirmed the possibility of synthesizing chlorapatite Ca10(PO4)6Cl2 from this powder via heat treatment at 1000 °C for 2 hours.
After heat treatment of the synthesized powder containing brushite CaHPO4·2H2O and potassium chloride (sylvine) KCl at 800 and 1000 °C, powders with the phase composition included β-calcium pyrophosphate β-Ca2P2O7, β-calcium orthophosphate β-Ca3(PO4)2 and potassium calcium pyrophosphate K2CaP2O7 was obtained. Heat treatment of calcite CaCO3 powder at 800 °C as it was expected lead to the formation of calcium oxide CaO.
Powders including biocompatible phases such as hydroxyapatite, chlorapatite, brushite, monetite, calcium pyrophosphate, calcium potassium pyrophosphate, tricalcium phosphate, calcite can be used for creation of biocompatible inorganic materials or composite materials with a biocompatible polymer matrix. Potassium chloride (sylvine) KCl present in synthesized powders can act as one of the precursors of biocompatible phases such as chlorapatite or calcium potassium pyrophosphate; or it can act as a removable inorganic porogen.
Author Contributions
Conceptualization, T.V.S.; methodology, T.V.S.; investigation, T.V.S., H.M.N.L., T.B.S., A.M.M., T.V.F., E.A.M., D.M.T., D.O.G., O.V.B. and A.V.K.; resources, T.V.S., T.B.S., D.M.T., O.V.B.; writing—original draft preparation, T.V.S., H.M.N.L.; writing—review and editing, T.V.S.; visualization, T.V.S., H.M.N.L., T.B.S., A.M.M., T.V.F., D.M.T., D.O.G., O.V.B. and A.V.K.; supervision, T.V.S.; project administration, T.V.S.; funding acquisition, T.V.S. All authors have read and agreed to the published version of the manuscript.
Funding
This work was carried out with the support of the State assignment of the Lomonosov Moscow State University, Registration Number No. AAAAA-A21-121011590082-2.
Acknowledgments
This research was carried out using the equipment of the MSU Shared Research Equipment Center “Technologies for obtaining new nanostructured materials and their complex study”, and had been purchased by MSU within the framework of the Equipment Renovation Program (National Project “Science”), and within the framework of the MSU Program of Development.
Conflicts of Interest
The authors declare no conflicts of interest.
References
- Andrianov, N.T.; Balkevich, V.L.; Belyakov, A.V.; Vlasov, A.S.; Guzman, I.Ya.; Lukin, E.S.; … & Skidan, B.S. Chemical technology of ceramics: textbook. handbook for universities/Edited by I.Ya. Guzman. Moscow: Rif Stroymaterialy LLC, 2012.-496 p. ISBN 978-5-94026-01966. In Russian.
- Butt Yu.M., Sychev M.M., Timashev V.V. Chemical technology of binder materials [Textbook for universities on spec. “Chemical technology of binding materials”] / Ed. Timasheva V.V. - M.: Higher School, 1980. — 472 p. ill.; 22. In Russian.
- Lee B., Komarneni S., ed. by // Chemical Processing of Ceramics, CRC Press, 2005 Pages 756. eBook ISBN 978-0-42911-963-7. [CrossRef]
- Gerasimov M.D., Latyshev S.S., Bogdanov N.E., Loktionov I.O. Review of constructive solutions in the field of grinding mills // Energy-saving technological complexes and equipment for the production of building materials: An Interuniversity collection of articles / Edited by V.S. Bogdanov. Volume Issue XVII. Belgorod: Belgorod State Technological University named after V.G. Shukhov, 2018, 132-146. Available online: https://www.elibrary.ru/item.asp?id=42997967.
- Shlyakhtin, O.A.; Tretyakov, Y.D. Recent progress in cryochemical synthesis of oxide materials. J. Mater. Chem. 1999, 9(1), 19–24. [Google Scholar] [CrossRef]
- Hiroshi Kageyama, Hiraku Ogino (Eds.). Mixed-anion Compounds. 2024. RSC. Pages 276. ISBN: 978-1-83916-512-2. [CrossRef]
- Lukin, E.S.; Makarov, N.A.; Kozlov, A.I.; Popova, N.A.; Anufrieva, E.V.; Vartanyan, M.A.; Kozlov, I.A.; Safina, M.N.; Lemeshev, D.O.; Gorelik, E.I. Oxide ceramics of the new generation and areas of application. Glass Ceram. 2008, 65(9), 348–352. [Google Scholar] [CrossRef]
- Lukin, E.S. Modern high-density oxide ceramics with controlled microstructure. Part I. Effect of aggregation of oxide powders on the sintering and microstructure of ceramics. Refractories 1996, 37, 6–14. [Google Scholar] [CrossRef]
- Ring, T.A. Fundamentals of ceramic powder processing and synthesis. – Elsevier, 1996. 1st Edition - April 30, 1996, Imprint: Academic Press. eBook ISBN: 9780080532196. [CrossRef]
- Safronova, T.V.; Putlyaev, V.I.; Filippov, Y.Y.; Shatalova, T.B.; Fatin, D.S. Ceramics Based on Brushite Powder Synthesized from Calcium Nitrate and Disodium and Dipotassium Hydrogen Phosphates. Inorg. Mater. 2018, 54, 195–207. [Google Scholar] [CrossRef]
- Safronova, T.V.; Knot’ko, A.V.; Shatalova, T.B.; Evdokimov, P.V.; Putlyaev, V.I.; Kostin, M.S. Calcium phosphate ceramic based on powder synthesized from a mixed-anionic solution. Glass Ceram. 2016, 73, 25–31. [Google Scholar] [CrossRef]
- Safronova, T.V.; Putlyaev, V.I.; Filippov, Ya.Yu.; Knot’ko, A.V.; Klimashina, E.S.; Peranidze, K.Kh.; Evdokimov, P.V.; Vladimirova, S.A. Powders synthesized from calcium acetate and mixed-anionic solutions, containing orthophosphate and carbonate ions, for obtaining bioceramic // Glass Ceram. 2018, 75, 118–123. [CrossRef]
- Song, Y.; Hahn, H.H.; Hoffmann, E. The effect of carbonate on the precipitation of calcium phosphate. Environ. technol. 2002, 23(2), 207–215. [Google Scholar] [CrossRef]
- Frank-Kamenetskaya, O.; Kol’tsov, A.; Kuz’mina, M.; Zorina, M.; Poritskaya, L. Ion substitutions and non-stoichiometry of carbonated apatite-(CaOH) synthesised by precipitation and hydrothermal methods. J. Mol. Struct. 2011, 992(1-3), 9-18. [CrossRef]
- Peranidze, K.; Safronova, T.V.; Filippov, Y.; Kazakova, G.; Shatalova, T.; Rau, J.V. Powders Based on Ca2P2O7-CaCO3-H2O System as Model Objects for the Development of Bioceramics. Ceramics 2022, 5, 423–434. [Google Scholar] [CrossRef]
- Golubchikov, D.; Safronova, T.V.; Nemygina, E.; Shatalova, T.B.; Tikhomirova, I.N.; Roslyakov, I.V.; Khayrutdinova, D.; Platonov, V.; Boytsova, O.; Kaimonov, M.; et al. Powder Synthesized from Aqueous Solution of Calcium Nitrate and Mixed-Anionic Solution of Orthophosphate and Silicate Anions for Bioceramics Production. Coatings 2023, 13, 374. [Google Scholar] [CrossRef]
- Rey, C.; Combes, C.; Drouet, C.; Glimcher, M.J. Bone mineral: update on chemical composition and structure. Osteoporos. Int. 2009, 20, 1013–1021. [Google Scholar] [CrossRef]
- Inorganic Ion Exchange Materials, CRC Press, 2018.
- Ivanets, A.I.; Shashkova, I.L.; Kitikova, N.V.; Radkevich, A.V.; Davydov, Yu.P. Recovery of strontium ions with calcium and magnesium phosphates from aqueous solutions against the background of CaCl2. Radiochemistry 2015, 57(6), 610–615. [Google Scholar] [CrossRef]
- Berlyand, A.S., Snyakin A.P., Prokopov A.A. Adsorption capacity of hydroxyapatite for several amino acids and heavy metal ions. Pharm. Chem. J. 2012, 46(5), 292. [CrossRef]
- Bystrov, V.S.; Paramonova, E.V.; Filippov, S.V.; Likhachev, I.V.; Bystrova, A.V.; Avakyan, L.A.; Kovrigina, S.A.; Makarova, S.V.; Bulina, N.V. Features of the Structure and Properties of Hydroxypapatite with Various Cationic Substitutions. Proceedings of the International Conference “Mathematical Biology and Bioinformatics”. Ed. V.D. Lakhno. Pushchino: IMPB RAS. 2024, 10, Paper No. e11. [CrossRef]
- Tite, T.; Popa, A.-C.; Balescu, L.M.; Bogdan, I.M.; Pasuk, I.; Ferreira, J.M.F.; Stan, G.E. Cationic Substitutions in Hydroxyapatite: Current Status of the Derived Biofunctional Effects and Their In Vitro Interrogation Methods. Materials 2018, 11, 2081. [Google Scholar] [CrossRef] [PubMed]
- Jiang, Y.; Yuan, Z.; Huang, J. Substituted hydroxyapatite: a recent development. Mater. Technol. 2020, 35(11-12), 785-796. [CrossRef]
- Safronova, T.V., Putlyaev, V.I. Powder systems for calcium phosphate ceramics. Inorg. Mater. 2017, 53, 17–26. [CrossRef]
- Kapolos, J.; Koutsoukos, P.G. Formation of calcium phosphates in aqueous solutions in the presence of carbonate ions. Langmuir. 1999, 15(19), 6557–6562. [Google Scholar] [CrossRef]
- Miron, R.J.; Fujioka-Kobayashi, M.; Pikos, M.A.; Nakamura, T.; Imafuji, T.; Zhang, Y.; Shinohara, Y.; Sculean, A.; Shirakata, Y. The development of non-resorbable bone allografts: Biological background and clinical perspectives. Periodontol. 2000. 2024, 94(1), 161–179. [Google Scholar] [CrossRef]
- He, F.; Zhang, J.; Tian, X.; Wu, S.; Chen, X. A facile magnesium-containing calcium carbonate biomaterial as potential bone graft. Colloid. Surf., B. 2015, 136, 845-852. [CrossRef]
- Huang, Y.; Cao, L.; Parakhonskiy, B.V.; Skirtach, A.G. Hard, Soft, and Hard-and-Soft Drug Delivery Carriers Based on CaCO3 and Alginate Biomaterials: Synthesis, Properties, Pharmaceutical Applications. Pharmaceutics. 2022, 14, 909. [Google Scholar] [CrossRef]
- Liu, H.; Wen, Z.; Liu, Z.; Yang, Y.; Wang, H.; Xia, X.; … & Liu, Y. Unlocking the potential of amorphous calcium carbonate: A star ascending in the realm of biomedical application. Acta Pharm. Sin. B. 2024, 14(2), 602-622. [CrossRef]
- Min, K.H.; Kim, D.H.; Kim, K.H.; Seo, J.-H.; Pack, S.P. Biomimetic Scaffolds of Calcium-Based Materials for Bone Regeneration. Biomimetics 2024, 9, 511. [Google Scholar] [CrossRef]
- Mishchenko, O.; Yanovska, A.; Kosinov, O.; Maksymov, D.; Moskalenko, R.; Ramanavicius, A.; Pogorielo, M. Synthetic Calcium–Phosphate Materials for Bone Grafting. Polymers 2023, 15, 3822. [Google Scholar] [CrossRef]
- Tavoni, M.; Dapporto, M.; Tampieri, A.; Sprio, S. Bioactive Calcium Phosphate-Based Composites for Bone Regeneration. J. Compos. Sci. 2021, 5, 227. [Google Scholar] [CrossRef]
- Safronova, T.V. Inorganic Materials for Regenerative Medicine. Inorg. Mater. 2021, 57, 443–474. [Google Scholar] [CrossRef]
- ICDD (2010). PDF-4+ 2010 (Database), edited by Dr. Soorya Kabekkodu, International Centre for Diffraction Data. Newtown Square. PA. USA. Available online: http://www.icdd.com/products/pdf2.htm.
- Nakamoto, K. Infrared and Raman Spectra of Inorganic and Coordination Compounds, 5th ed.; Wiley: New York, NY, USA, 1986; pp. 156–159. [Google Scholar]
- Safronova, T.V.; Sterlikov, G.S.; Kaimonov, M.R.; Shatalova, T.B.; Filippov, Y.Y.; Toshev, O.U.; Roslyakov, I.V.; Kozlov, D.A.; Tikhomirova, I.N.; Akhmedov, M.R. Composite Powders Synthesized from the Water Solutions of Sodium Silicate and Different Calcium Salts (Nitrate, Chloride, and Acetate). J. Compos. Sci. 2023, 7, 408. [Google Scholar] [CrossRef]
- Casciani F., Condrate Sr R.A. The vibrational spectra of brushite, CaHPO4·2H2O. Spectrosc. Lett. 1979. 12(10), 699-713.
- Berry, E.E.; Baddiel, C.B. The infra-red spectrum of dicalcium phosphate dihydrate (brushite). Spectrochim. Acta A-M. 1967, 23(7), 2089-2097.
- Hirsch, A.; Azuri, I.; Addadi, L.; Weiner, S.; Yang, K.; Curtarolo, S.; Kronik, L. Infrared absorption spectrum of brushite from first principles. Chem Mater. 2014, 26(9), 2934–2942. [Google Scholar] [CrossRef]
- Wang, X.; Xu, X.; Ye, Y.; Wang, C.; Liu, D.; Shi, X.; Wang, S.; Zhu, X. In-situ High-Temperature XRD and FTIR for Calcite, Dolomite and Magnesite: Anharmonic Contribution to the Thermodynamic Properties. J. Earth Sci. 2019, 30, 964–976. [Google Scholar] [CrossRef]
- Bosch Reig, F.; Gimeno Adelantado, J.V.; Moya Moreno, M.C.M. FTIR quantitative analysis of calcium carbonate (calcite) and silica (quartz) mixtures using the constant ratio method. Application to geological samples. Talanta 2002, 58(4), 811–821. [Google Scholar] [CrossRef]
- Čadež, V.; Šegota, S.; Sondi, I.; Lyons, D.M.; Saha, P.; Saha, N.; Sikirić, M.D. Calcium phosphate and calcium carbonate mineralization of bioinspired hydrogels based on β-chitin isolated from biomineral of the common cuttlefish (Sepia officinalis, L.). J. Polym. Res. 2018, 25, 226. [CrossRef]
- Hossain, M.S.; Ahmed, S. FTIR spectrum analysis to predict the crystalline and amorphous phases of hydroxyapatite: a comparison of vibrational motion to reflection. RSC adv. 2023, 13(21), 14625–14630. [Google Scholar] [CrossRef]
- Lee, IH., Lee JA., Lee JH.; Heo, YW; Kim, JJ. Effects of pH and reaction temperature on hydroxyapatite powders synthesized by precipitation. J. Korean Ceram. Soc. 2020, 57, 56–64. [CrossRef]
- Fleet, M.E.; Liu, X. Carbonate apatite type A synthesized at high pressure: new space group (P3) and orientation of channel carbonate ion. J. Solid State Chem., 2003, 174(2), 412-417. [CrossRef]
- Shiehpour, M.; Solgi, S.; Tafreshi, M.J.; Ghamsari, M.S. ZnO-doped KCl single crystal with enhanced UV emission lines. Appl. Phys. A 2019, 125, 531. [Google Scholar] [CrossRef]
- Chruszcz-Lipsk,a K.; Zelek-Pogudz, S.; Solecka, U.; Solecki, M.L.; Szostak, E.; Zborowsk,i K.K.; Zając, M. Use of the Far Infrared Spectroscopy for NaCl and KCl Minerals Characterization—A Case Study of Halides from Kłodawa in Poland. Minerals 2022, 12, 1561. [CrossRef]
- Toshima, T.; Hamai, R.; Tafu, M.; Takemura, Y.; Fujita, S.; Chohji, T.; Tanda, S.; Li, S.; Qin, G.W. Morphology control of brushite prepared by aqueous solution synthesis. J. Asian Ceram. Soc. 2014, 2(1), 52–56. [Google Scholar] [CrossRef]
- Niu, Y.Q., Liu, J.H., Aymonier, C.; Fermani, S.; Kralj, D.; Falini, G.; Zhou, C.H. Calcium carbonate: controlled synthesis, surface functionalization, and nanostructured materials. Chem. Soc. Rev. 2022, 51(18), 7883-7943. [CrossRef]
- Dosen, A.; Giese, R.F. Thermal decomposition of brushite, CaHPO4·2H2O to monetite CaHPO4 and the formation of an amorphous phase. Am. Mineral. 2011, 96(2-3), 368-373. [CrossRef]
- Safronova, T.; Kuznetsov, A.; Korneychuk, S.; Putlyaev, V.; Shekhirev, M. Calcium phosphate powders synthesized from solutions with [Ca2+]/[PO43−]=1 for bioresorbable ceramics. Open Chem. 2009, 7(2), P. 184-191. [CrossRef]
- Babou-Kammoe, R.; Hamoudi, S.; Larachi, F.; Belkacemi, K. Synthesis of CaCO3 nanoparticles by controlled precipitation of saturated carbonate and calcium nitrate aqueous solutions. Can. J. Chem. Eng. 2012, 90(1), 26–33. [Google Scholar] [CrossRef]
- Rabinovich V.A., Khavin Z.Ya. A short chemical reference book. Leningrad.: Chemistry, 1978, 392 p. in Russian.
- Zhou, D.; Dong, J.; Si, Y.; Zhu, F.; Li, J. Melting Curve of Potassium Chloride from in situ Ionic Conduction Measurements. Minerals 2020, 10, 250. [Google Scholar] [CrossRef]
- Cavalcante, L.d.A.; Ribeiro, L.S.; Takeno, M.L.; Aum, P.T.P.; Aum, Y.K.P.G.; Andrade, J.C.S. Chlorapatite Derived from Fish Scales. Materials 2020, 13, 1129. [Google Scholar] [CrossRef] [PubMed]
Figure 1.
XRD data of synthesized powders: c – calcium carbonate (calcite) CaCO3 (PDF card No 5-586; No 96-210-0190); o – potassium chloride (sylvine) KCl (PDF card No 41-1476; No 96-900-8652); * - hydroxyapatite Ca10(PO4)6(OH)2 (PDF card No 9-432, No 96-900-1234); b – brushite CaHPO4·2H2O (PDF card No 9-77; No 96-231-0527).
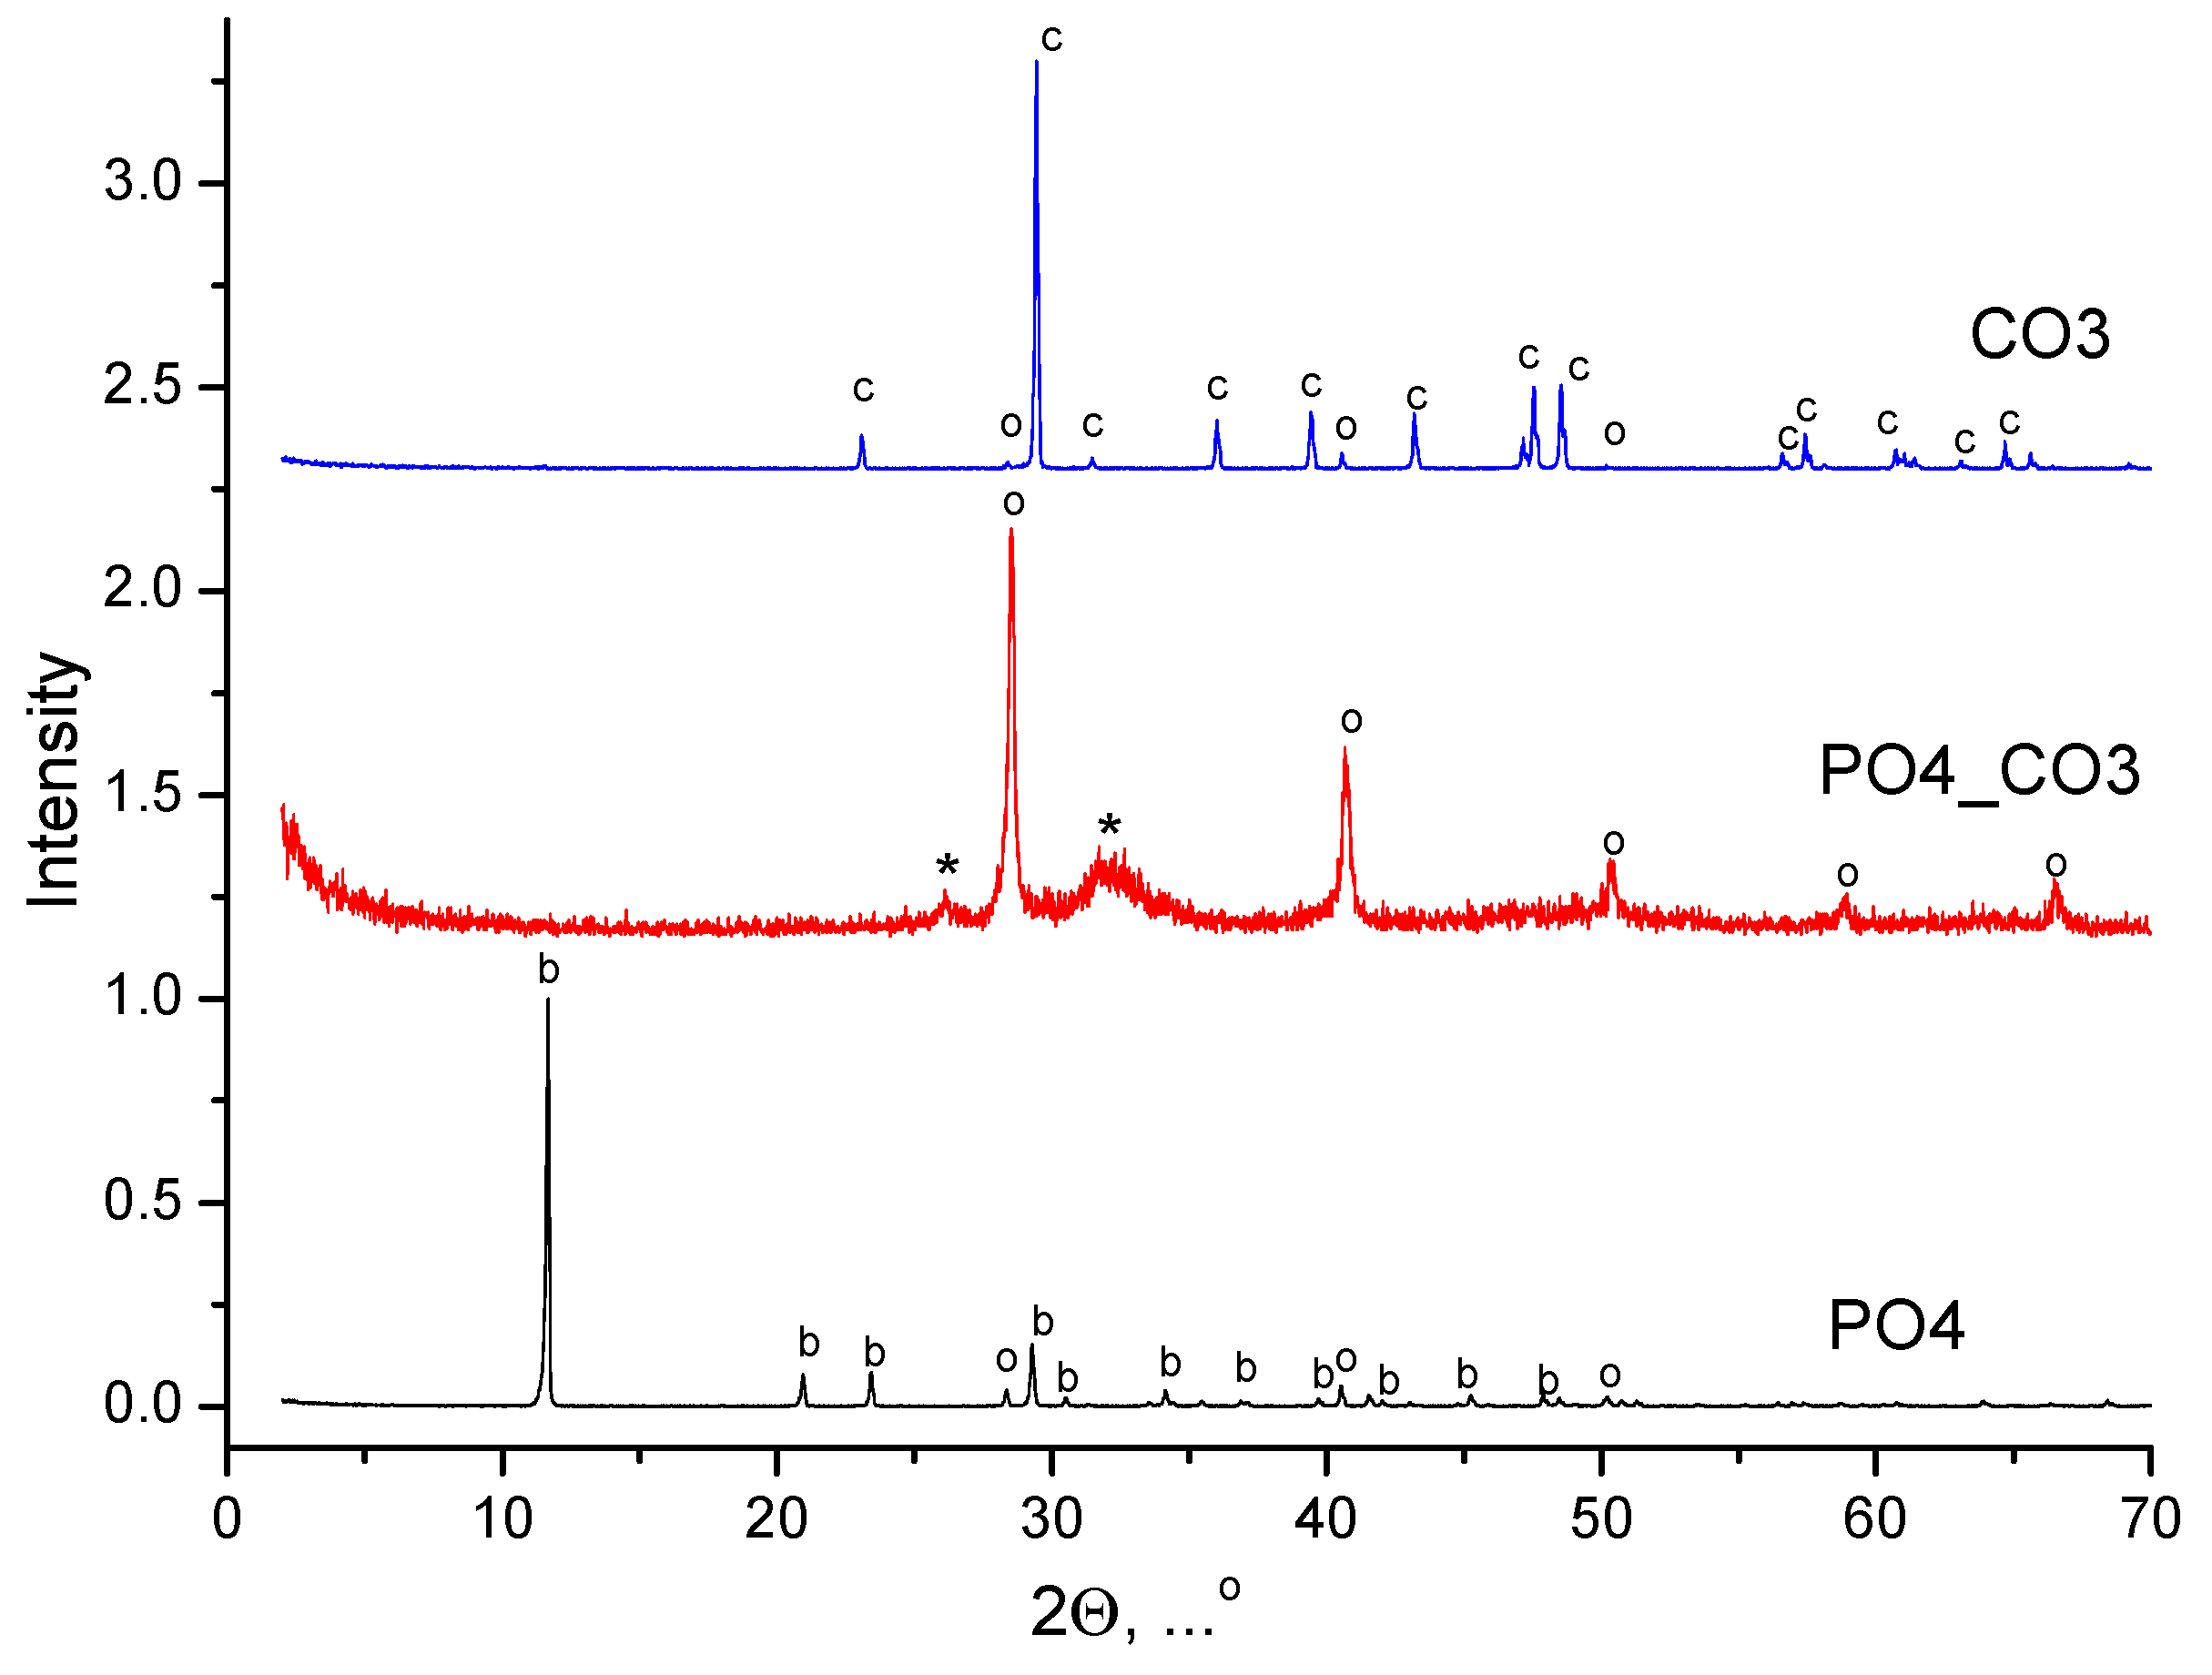
Figure 2.
XRD data of products isolated from mother liquors after synthesis: o – potassium chloride (sylvine) KCl (PDF card No 41-1476; No 96-900-8652).
Figure 2.
XRD data of products isolated from mother liquors after synthesis: o – potassium chloride (sylvine) KCl (PDF card No 41-1476; No 96-900-8652).
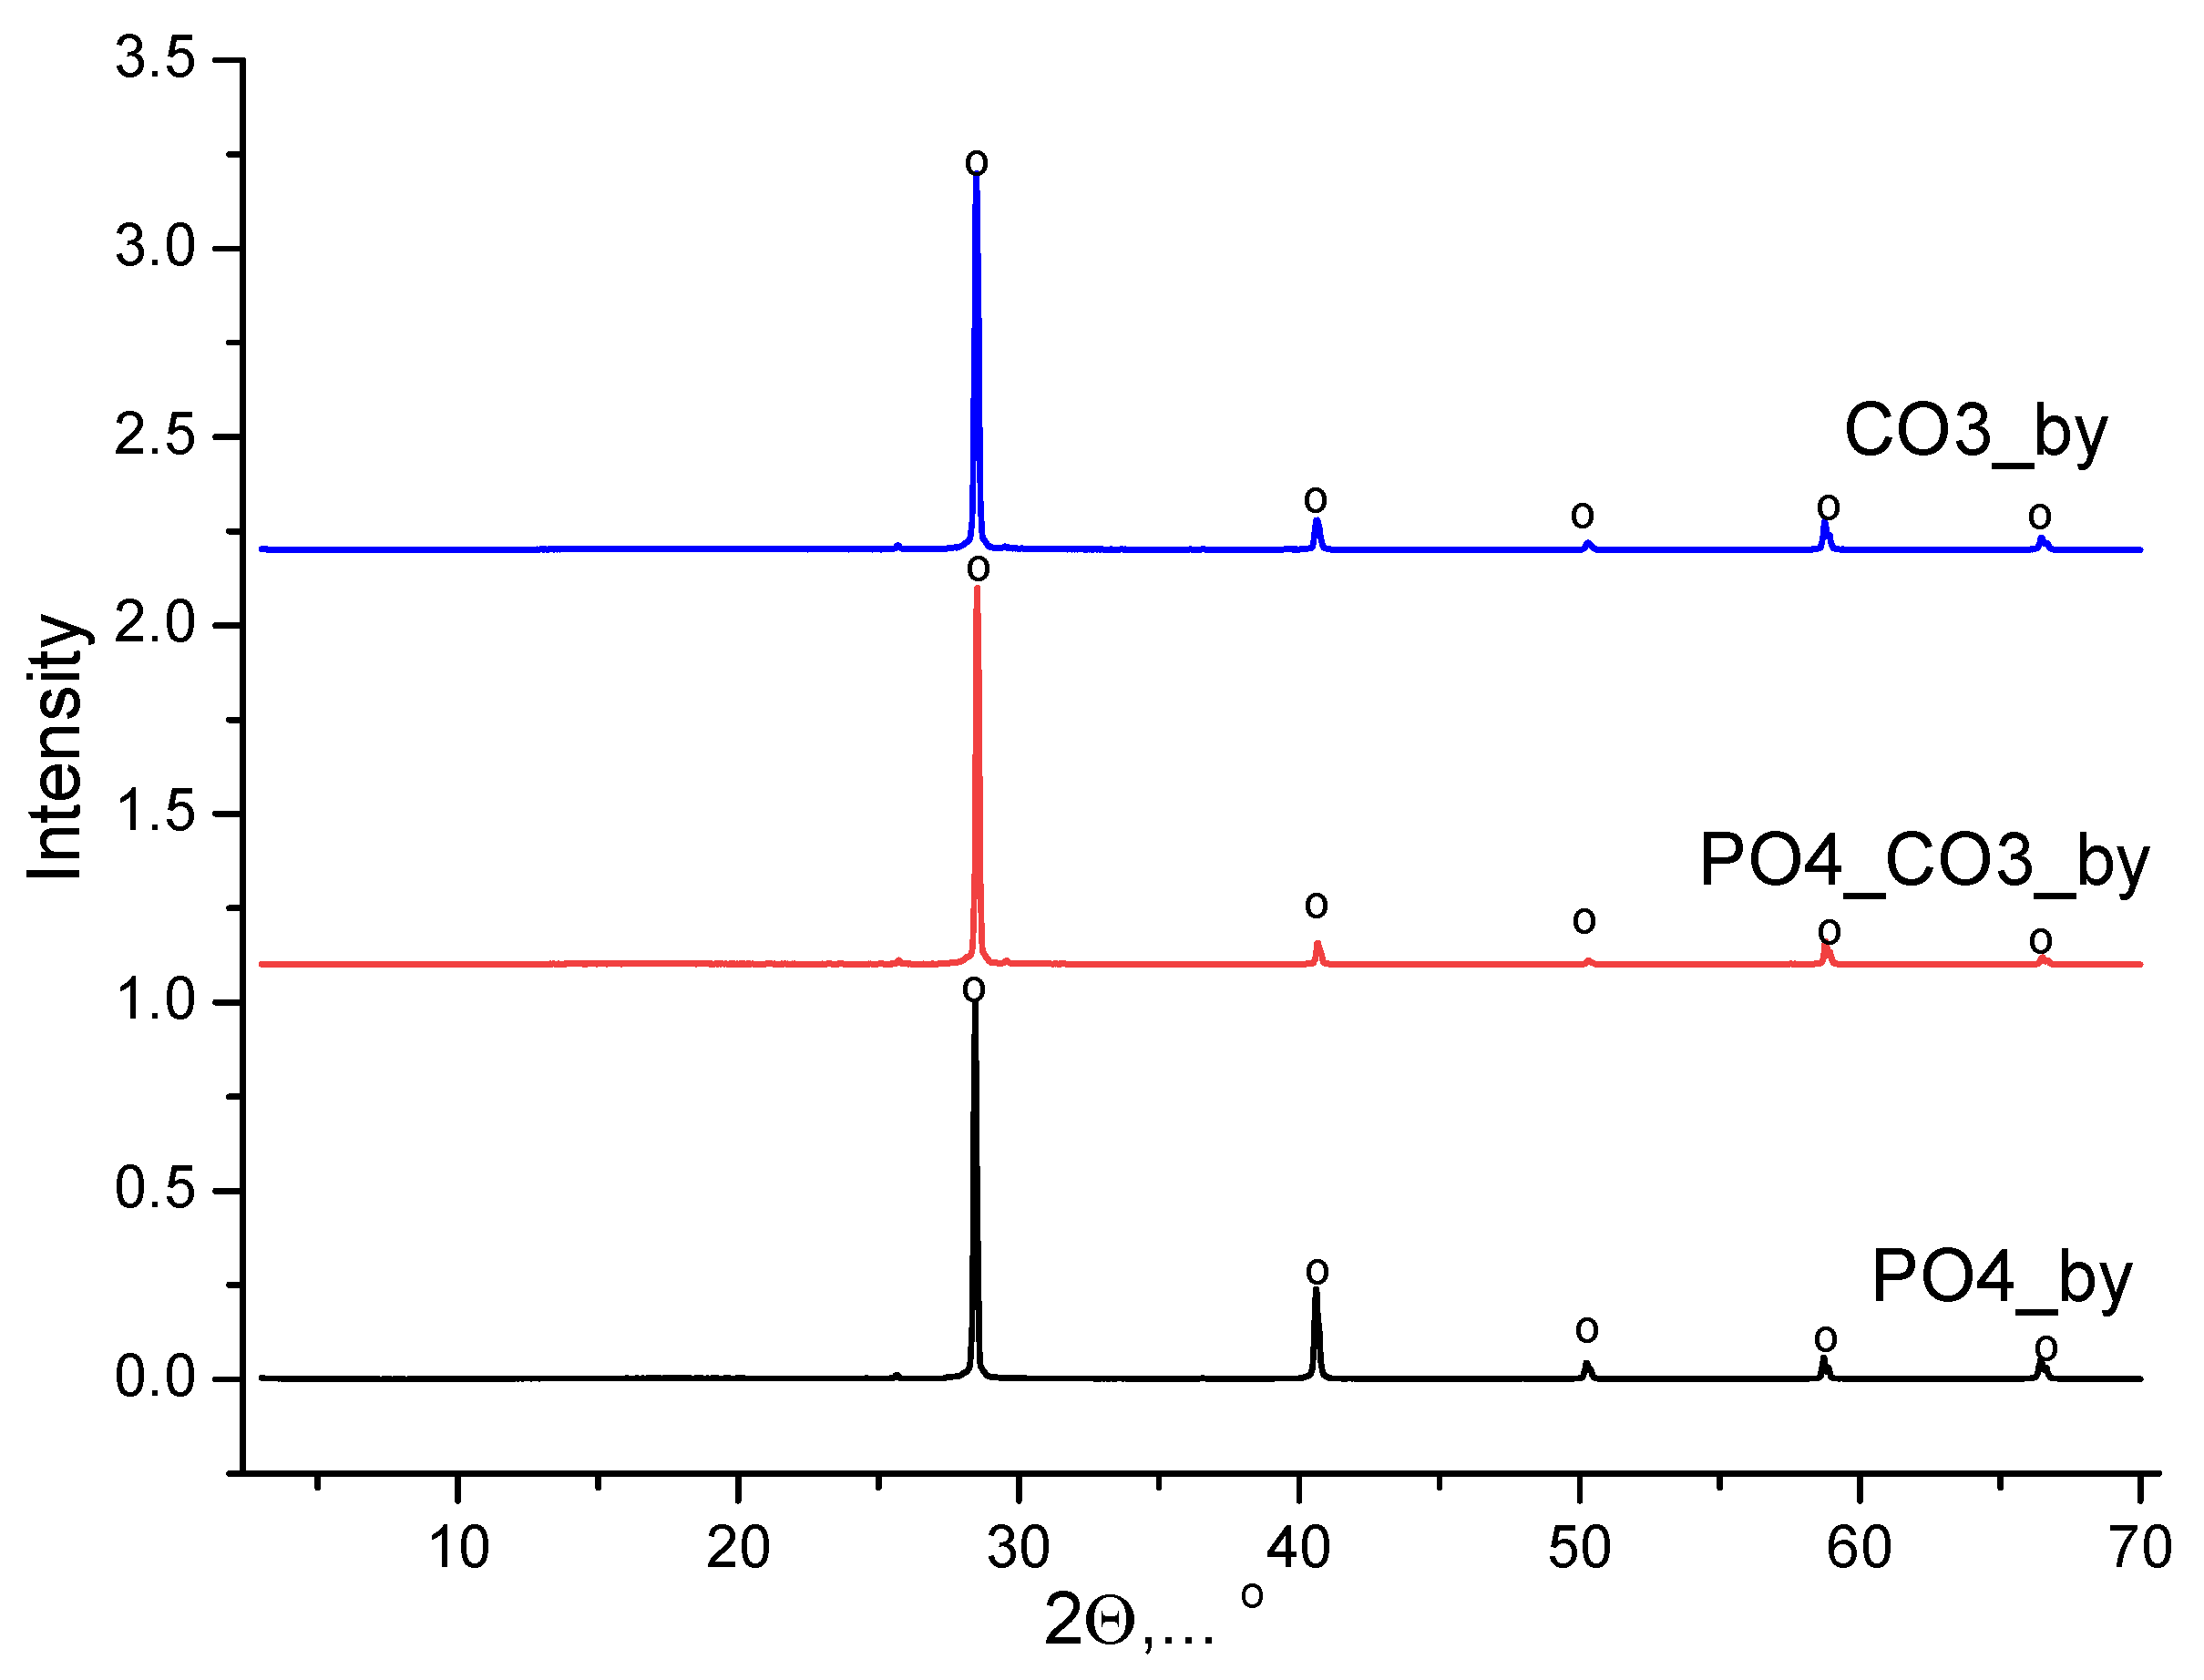
Figure 3.
FTIR spectra of synthesized powders PO4, PO4_CO3, CO3.
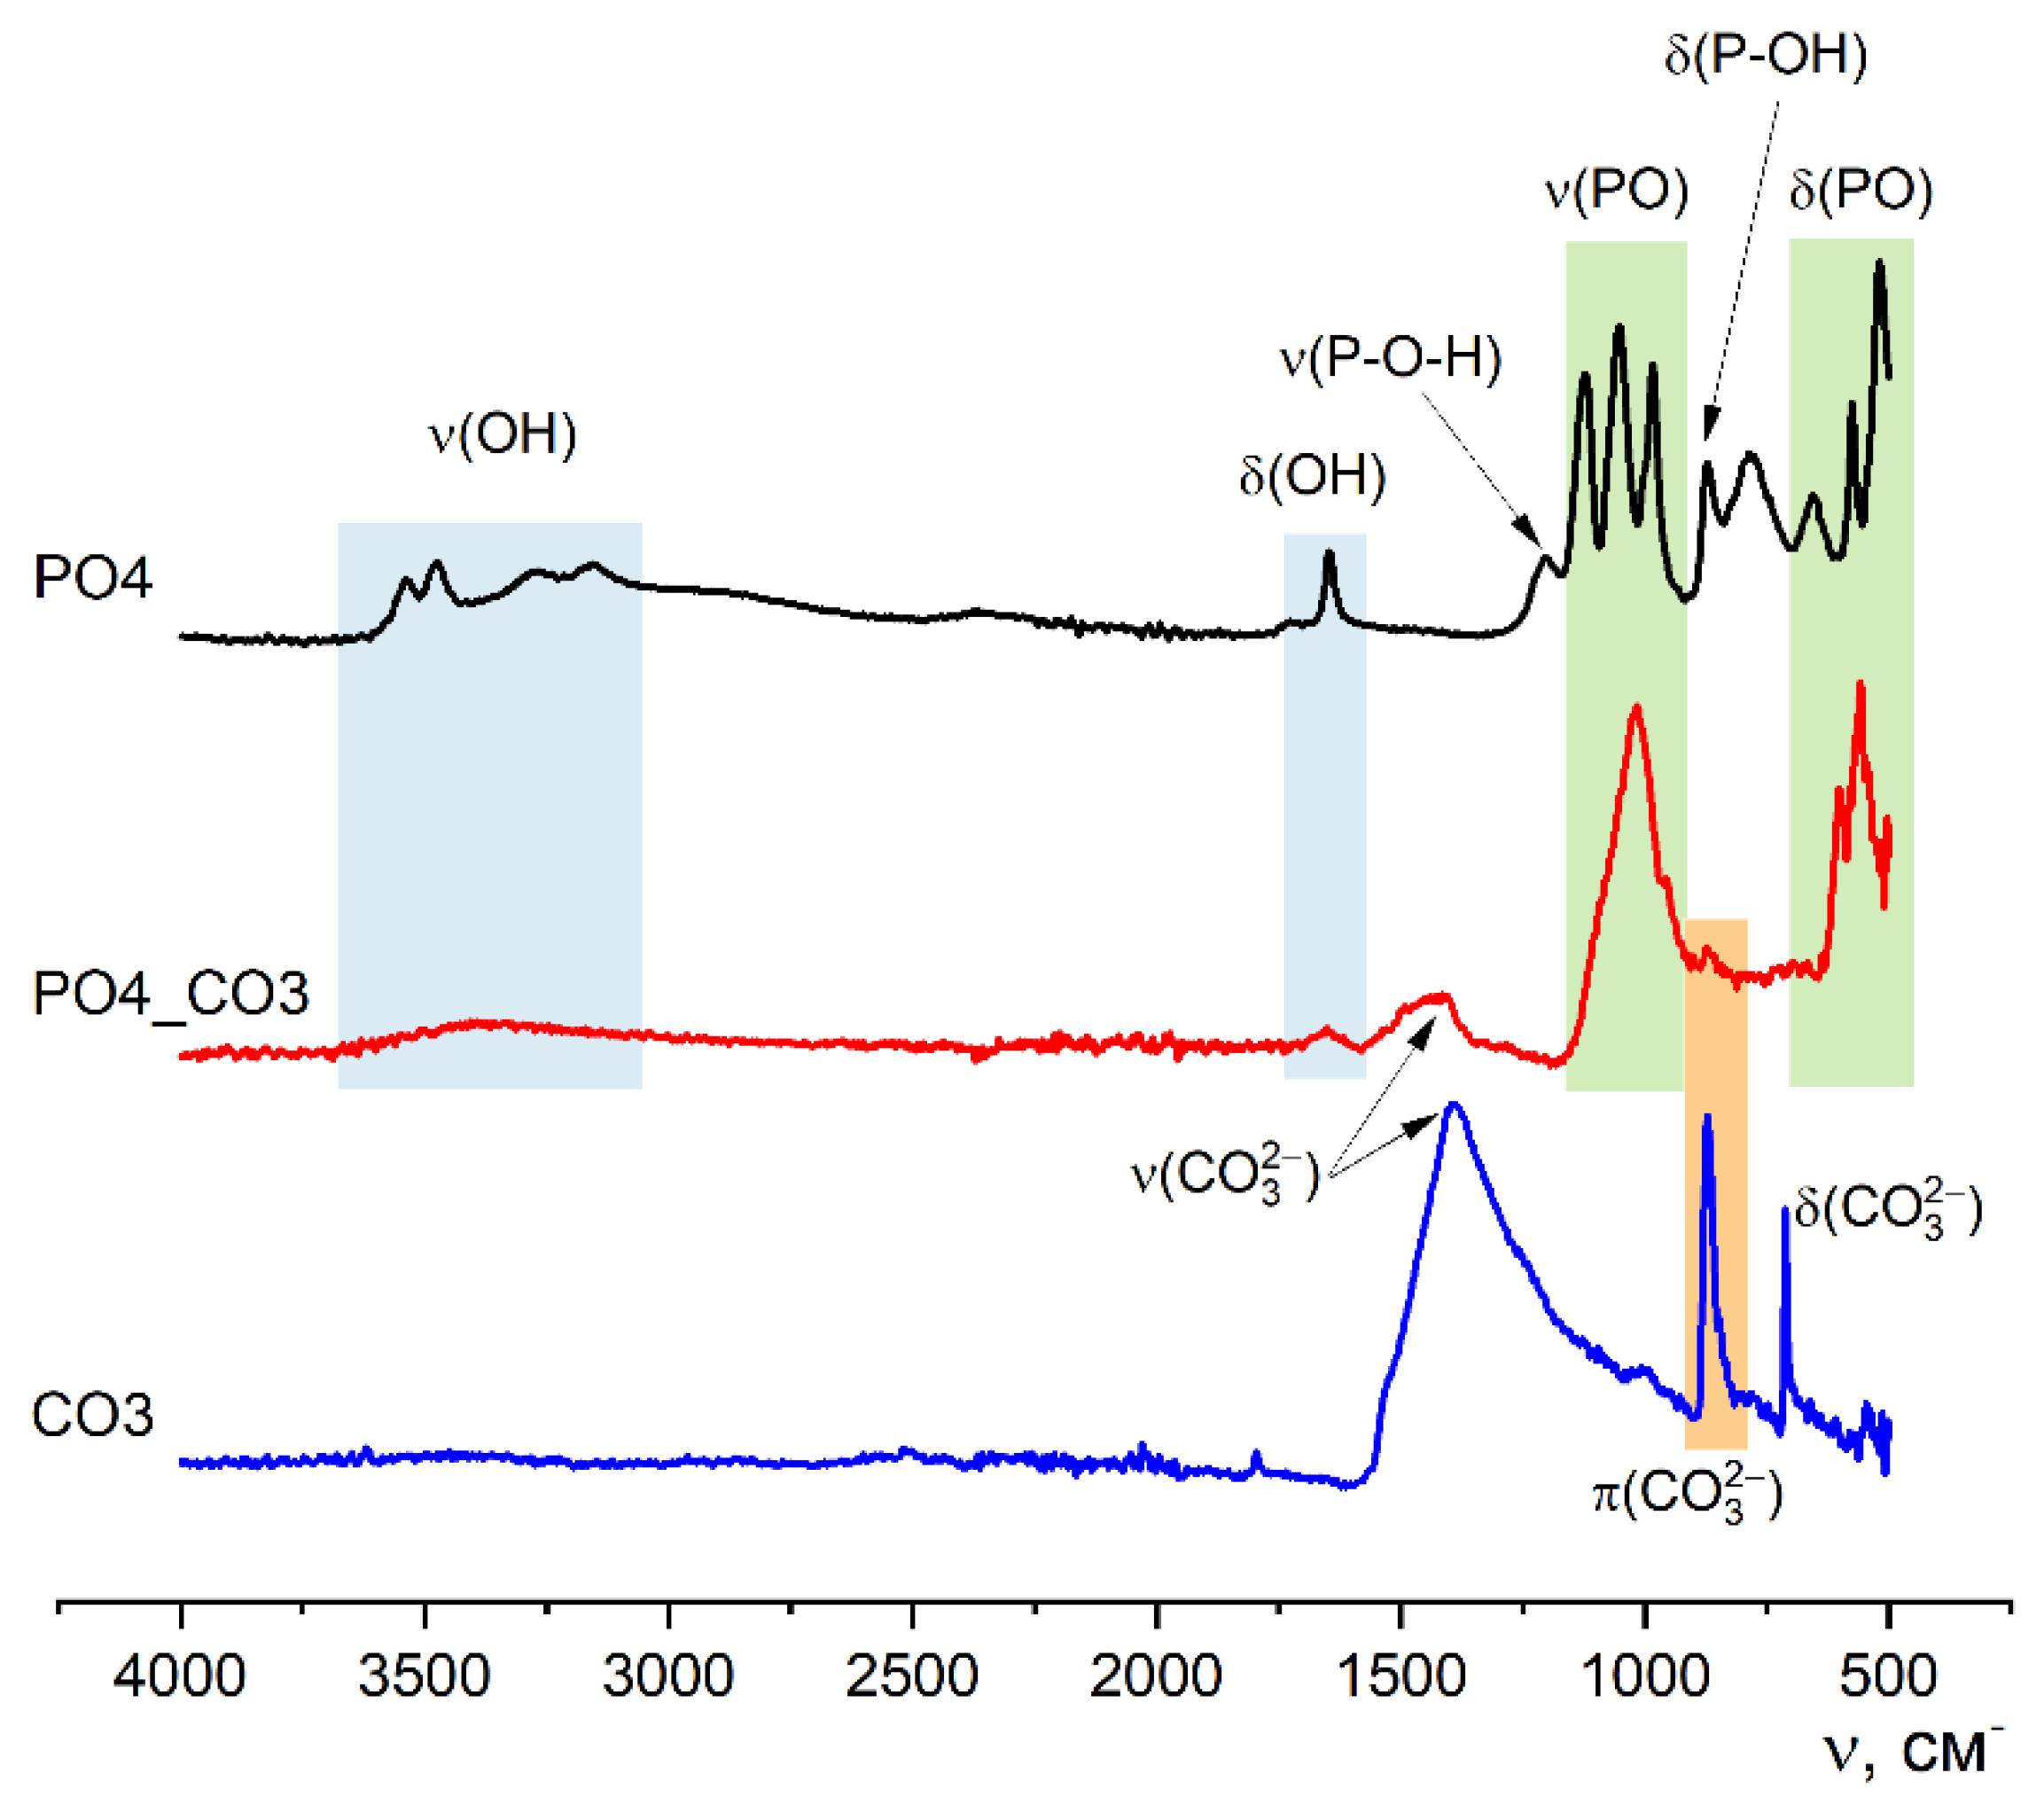
Figure 4.
Micrographs of synthesized powders PO4 (a), PO4_CO3 (b), CO3 (c).
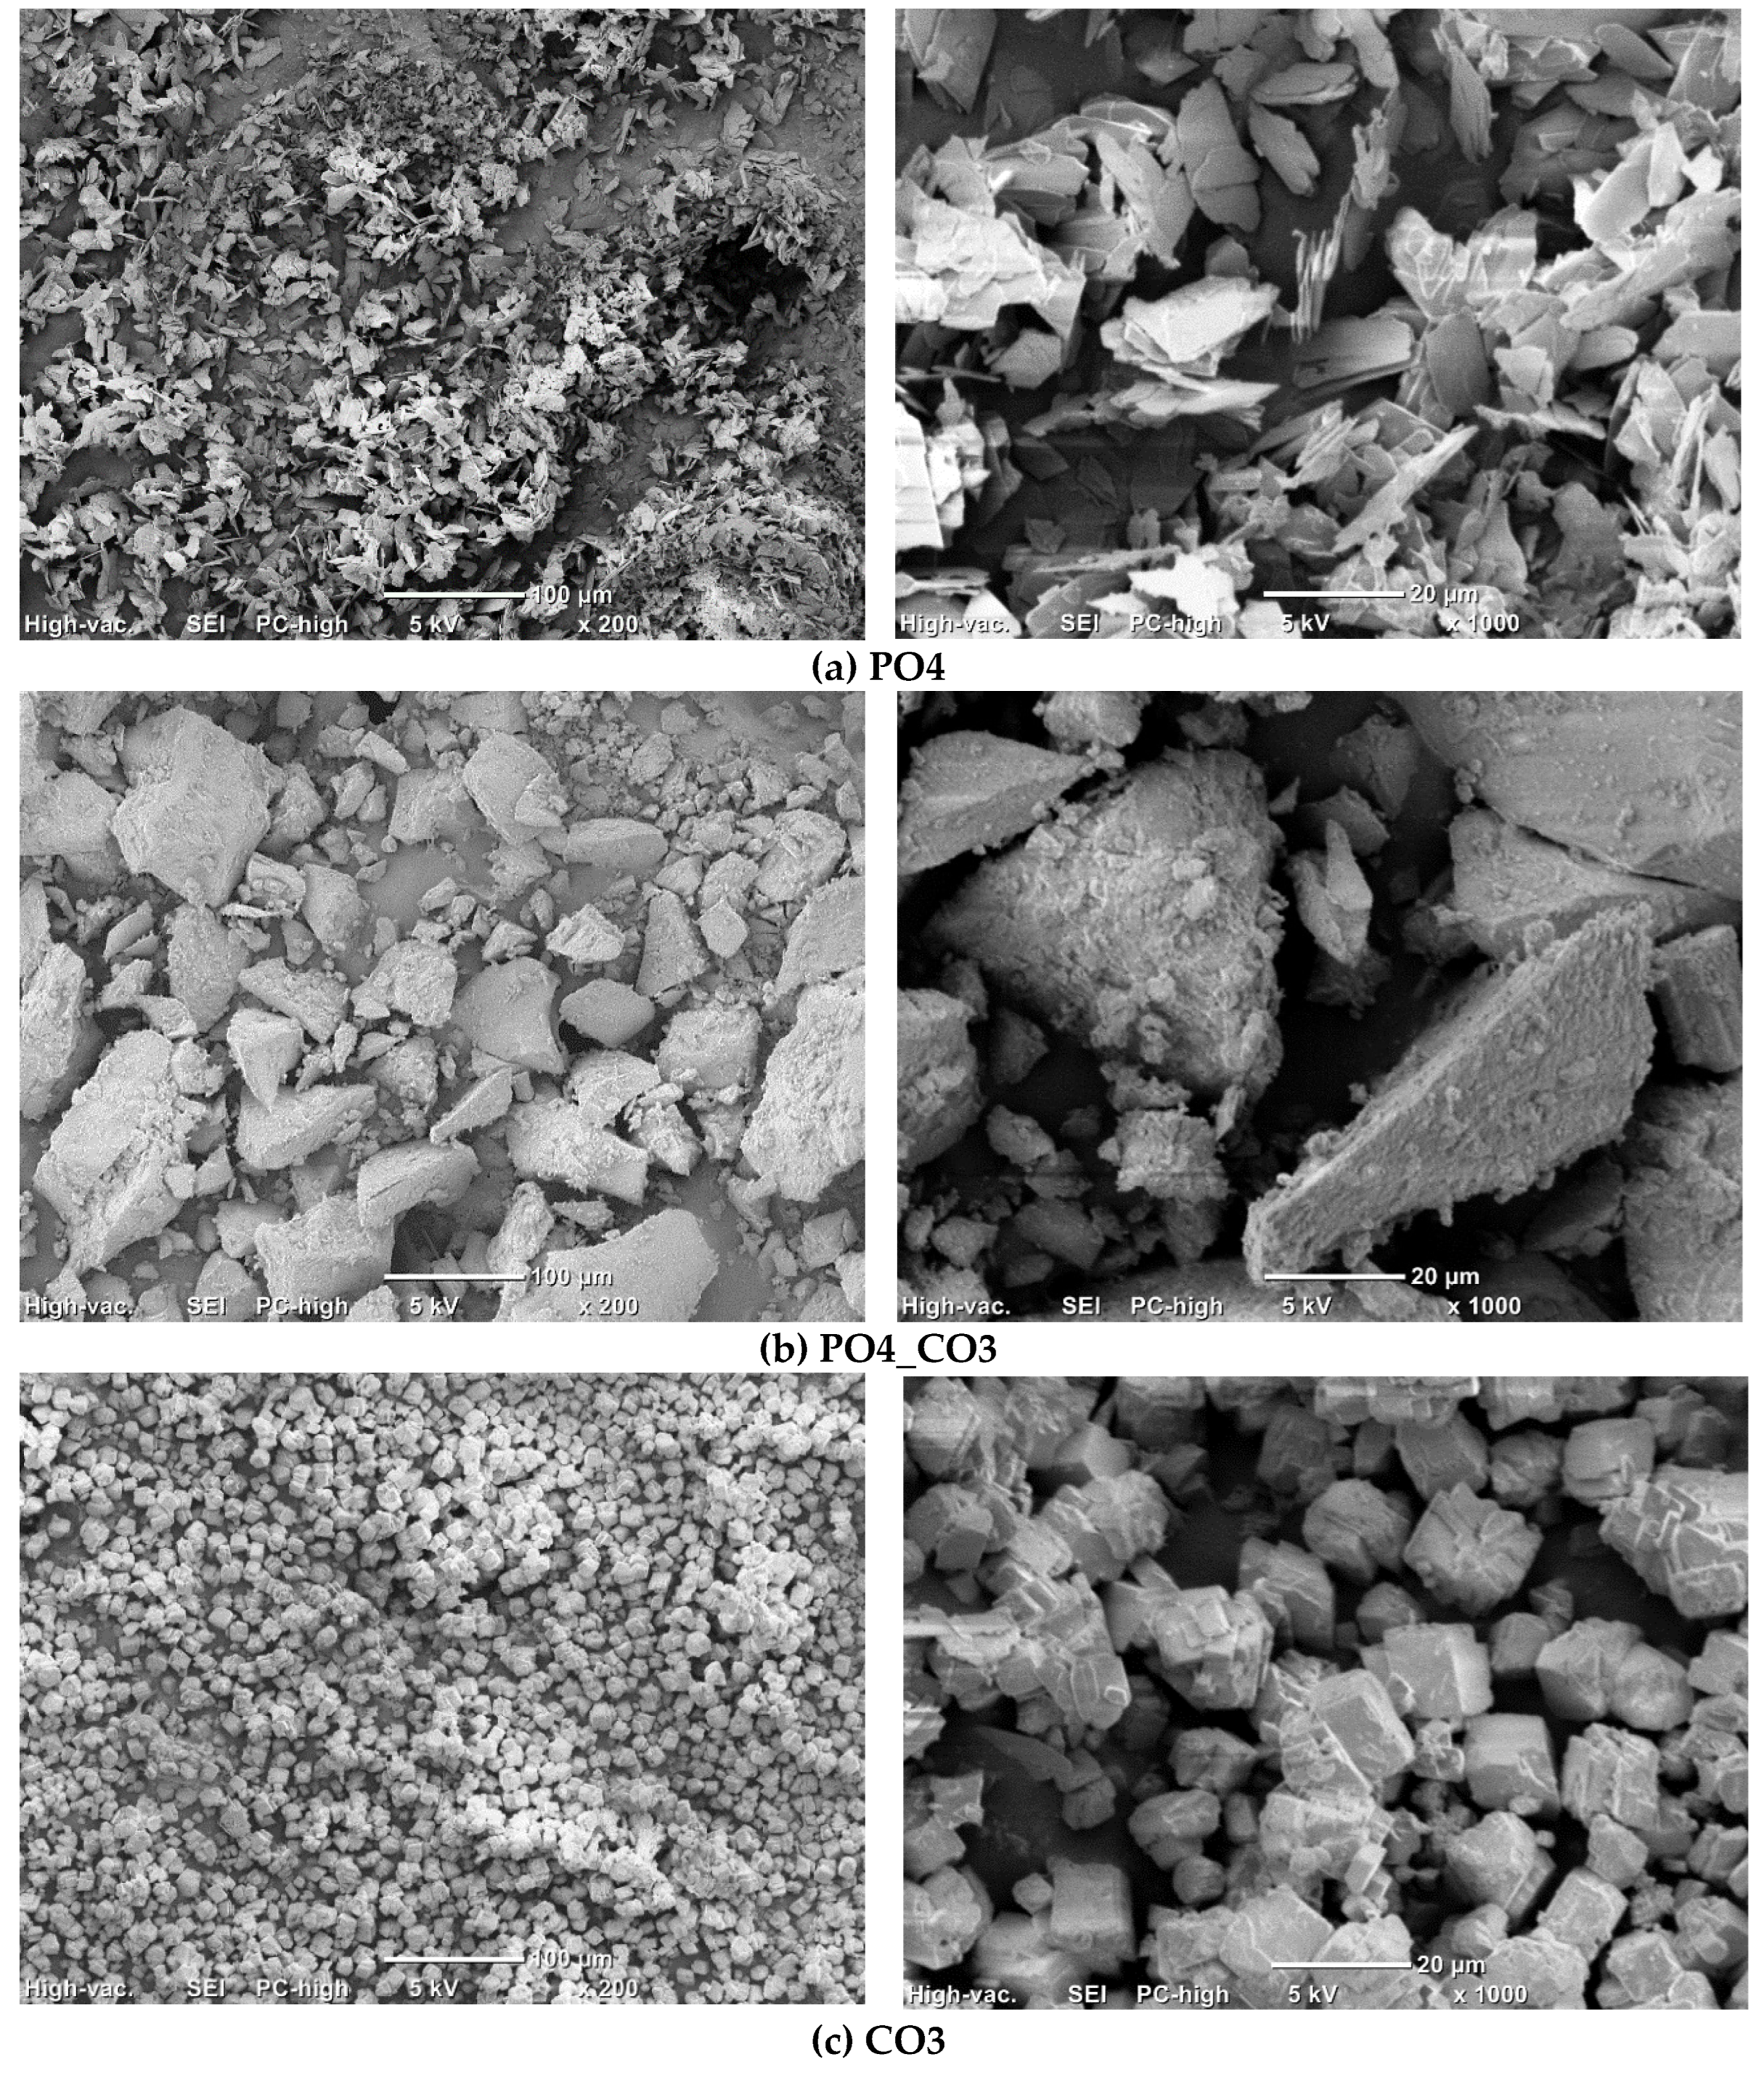
Figure 5.
TA data of synthesized powders: TGA (a), DSC (b), MS for m/z=44 (CO2).
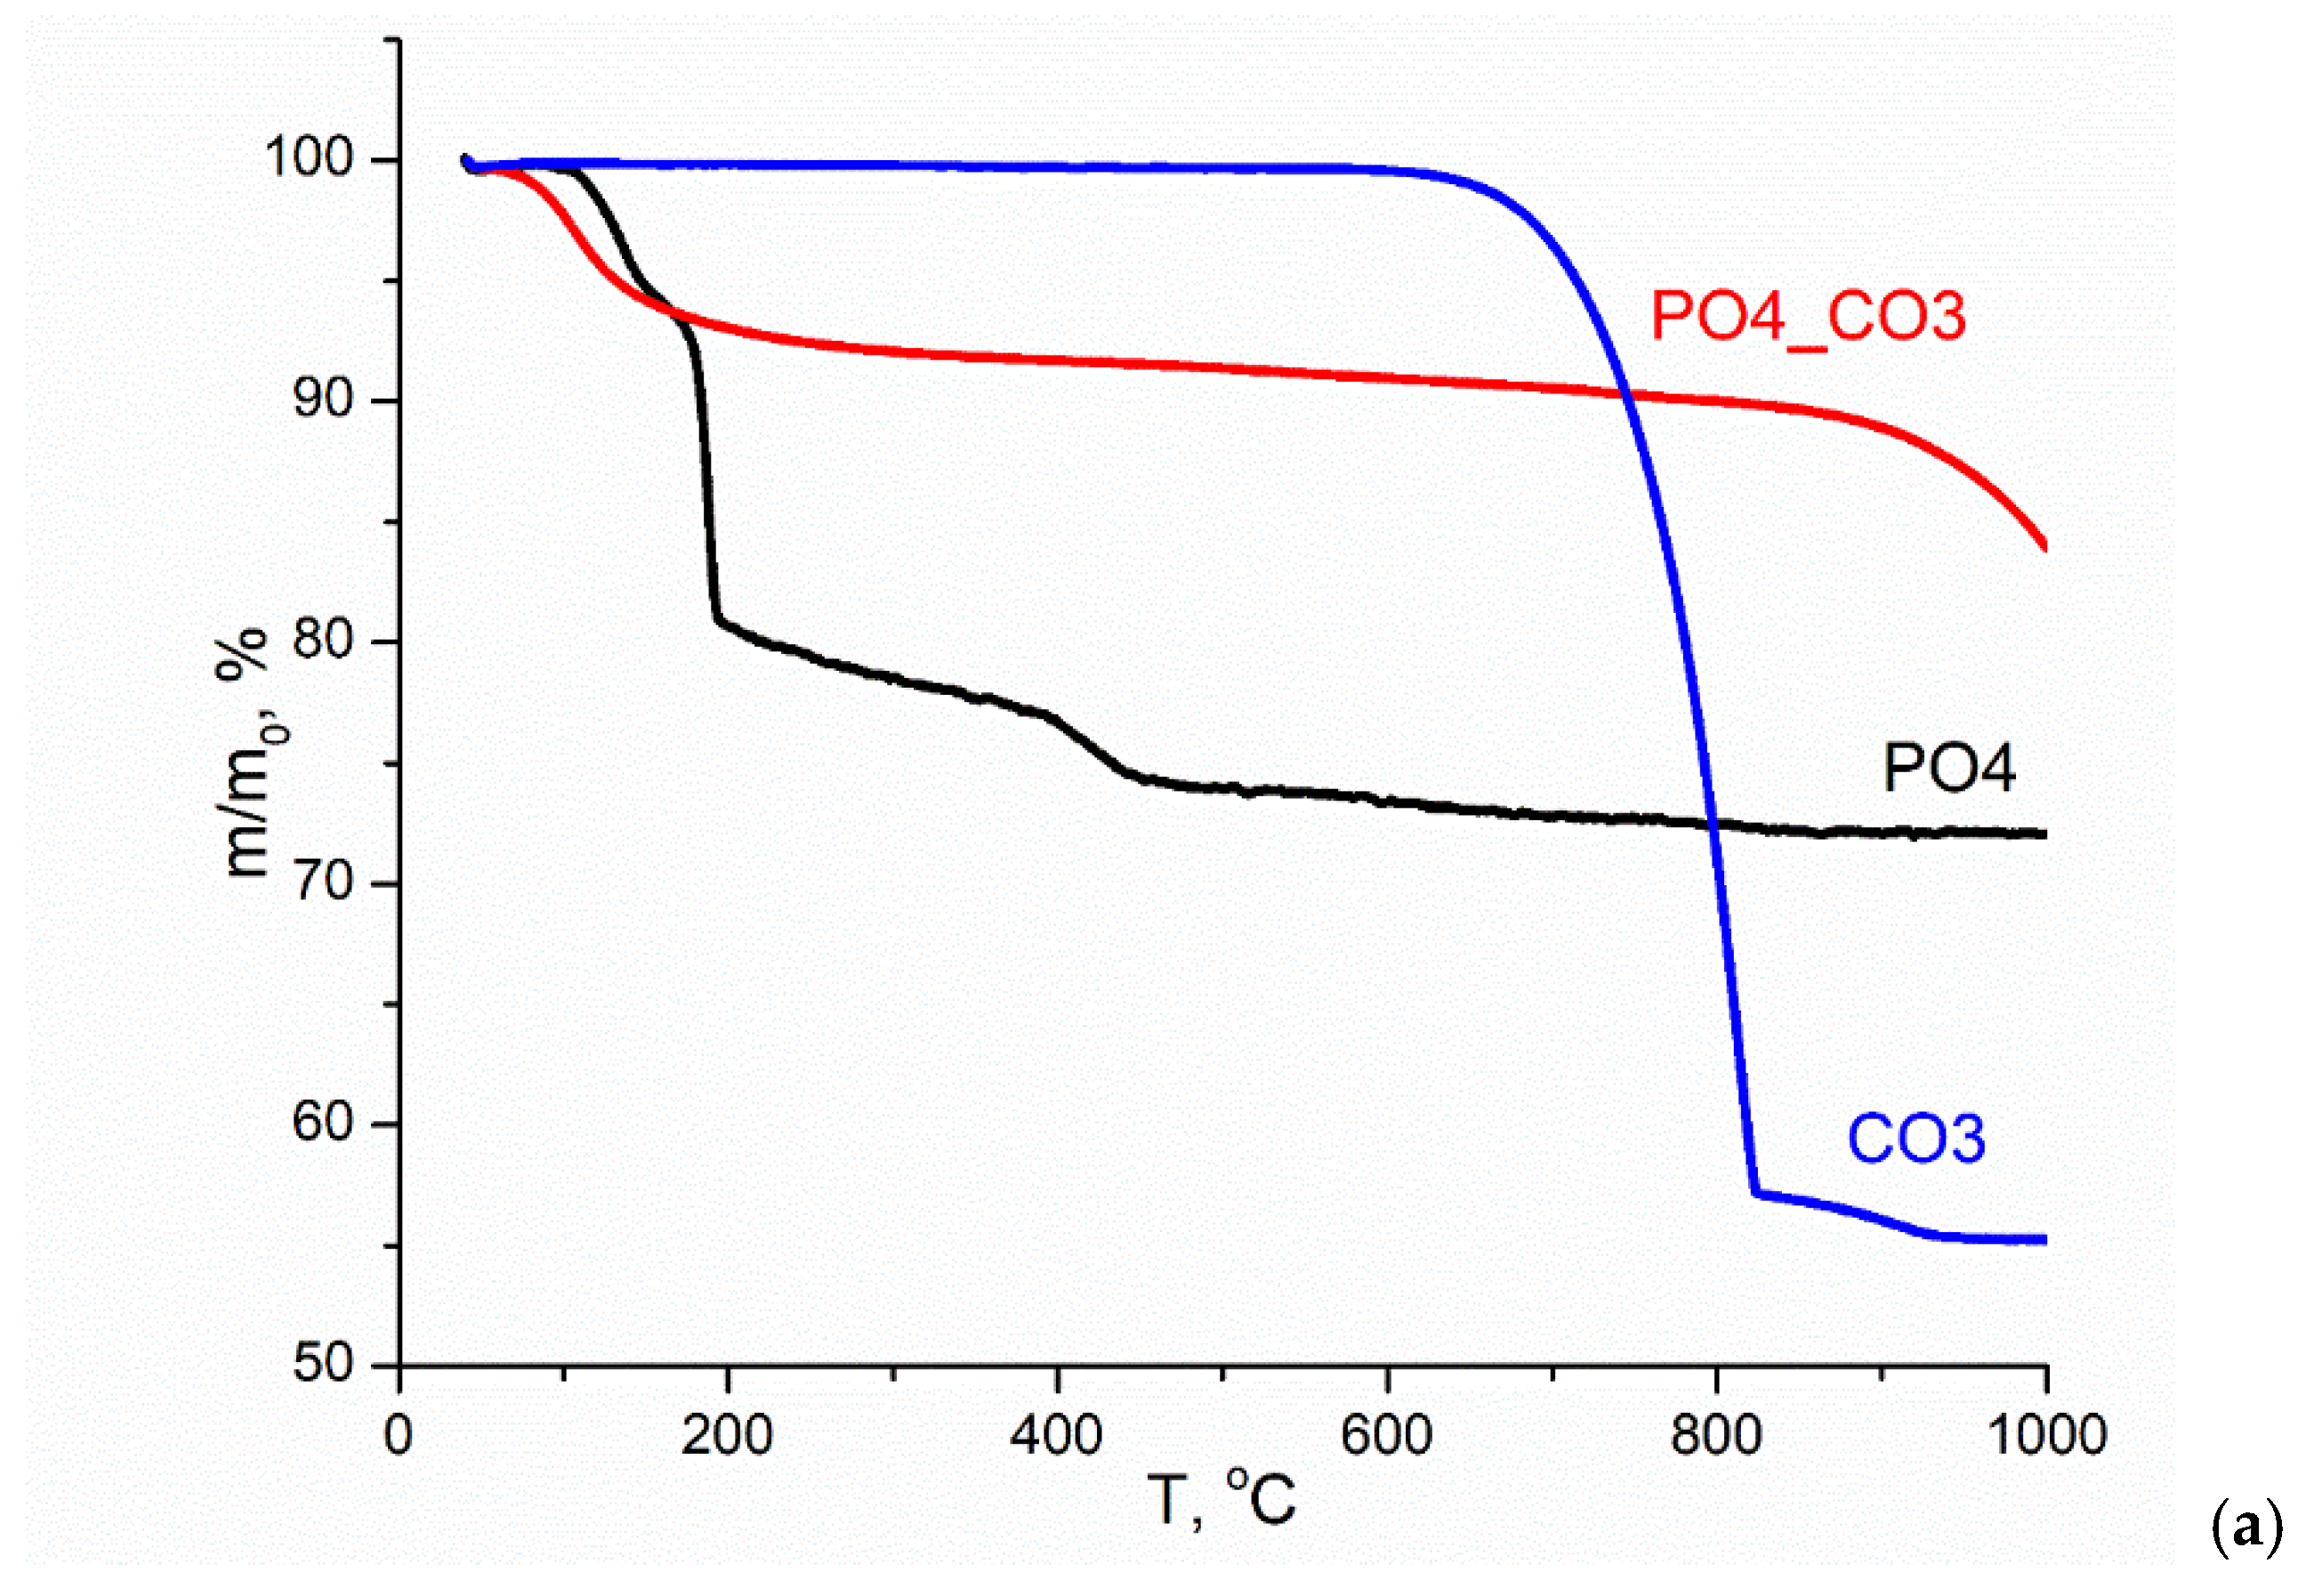
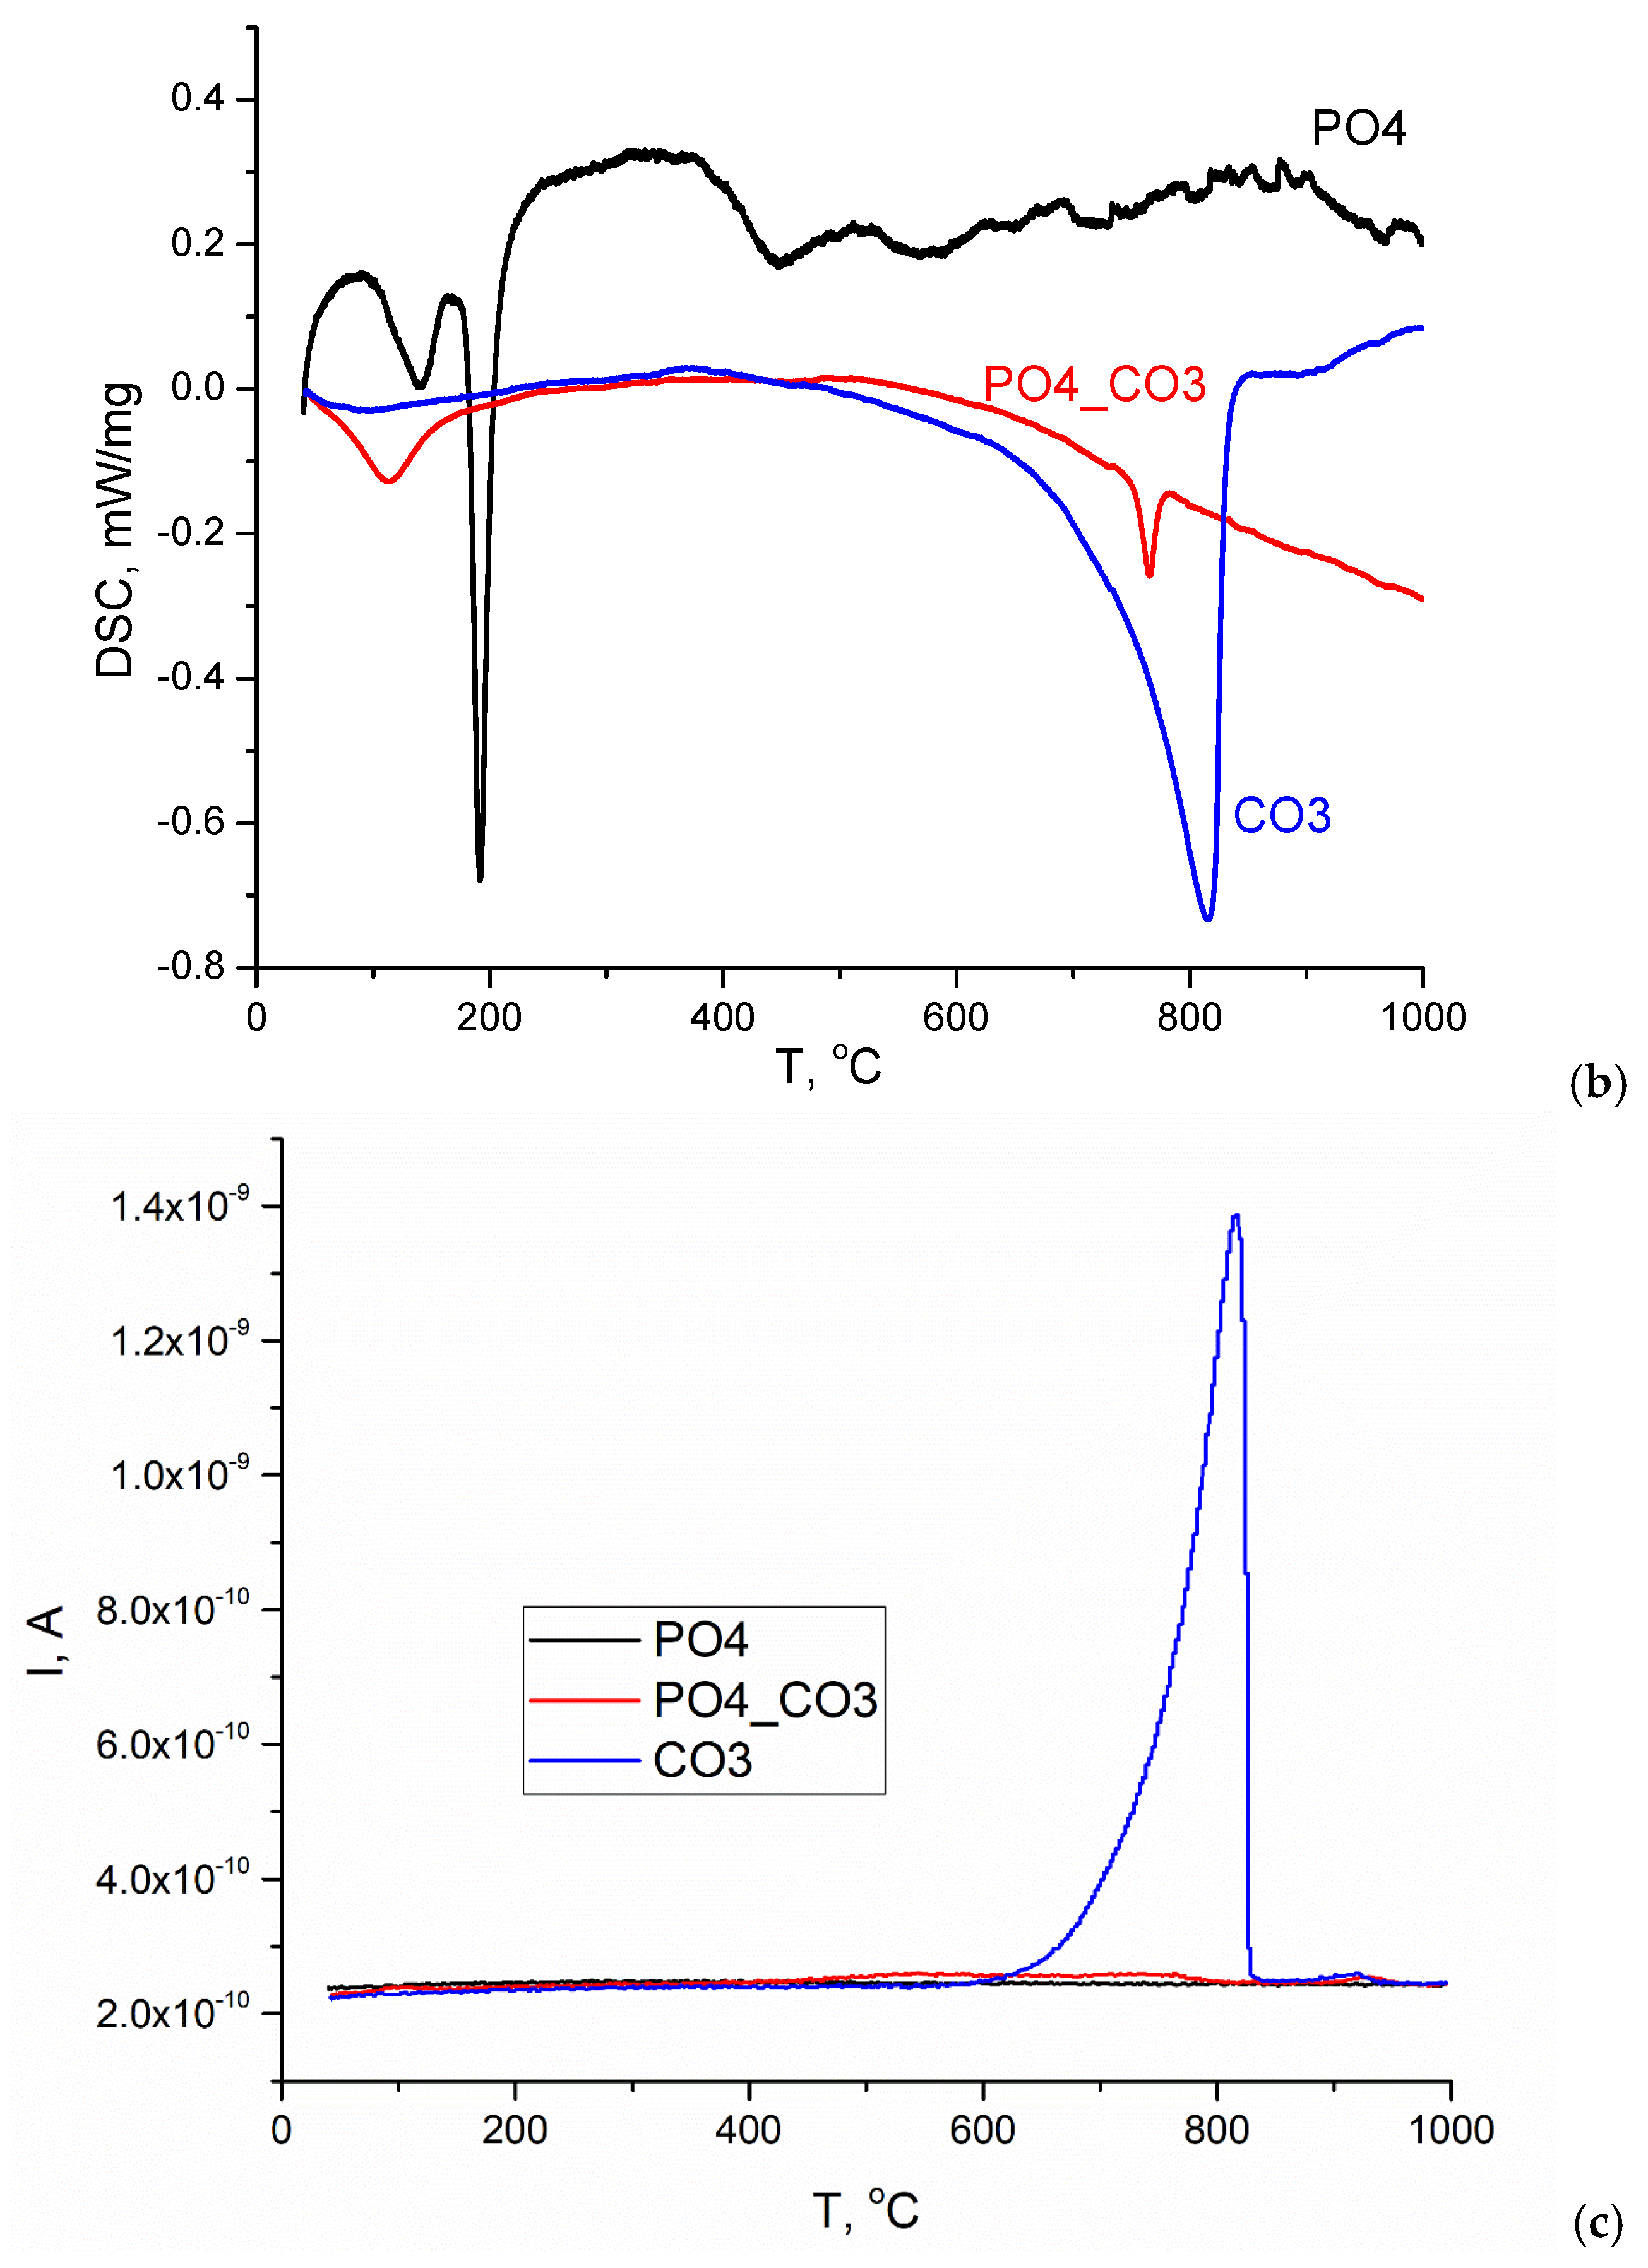
Figure 6.
XRD data of CO3 powder after synthesis and after heat treatment at different temperatures. c – calcium carbonate (calcite) CaCO3 (PDF card No 5-586; No 96-210-0190); o - potassium chloride (sylvine) KCl (PDF No 41-1476; No 96-900-8652); x – calcium oxide CaO (PDF No 37-1497, No 96-101-1096).

Figure 7.
Microphotographs of CO3 powder after synthesis (a) and after heat treatment at different temperatures 200 oC (b), 400 oC (c), 600 oC (d).
Figure 7.
Microphotographs of CO3 powder after synthesis (a) and after heat treatment at different temperatures 200 oC (b), 400 oC (c), 600 oC (d).
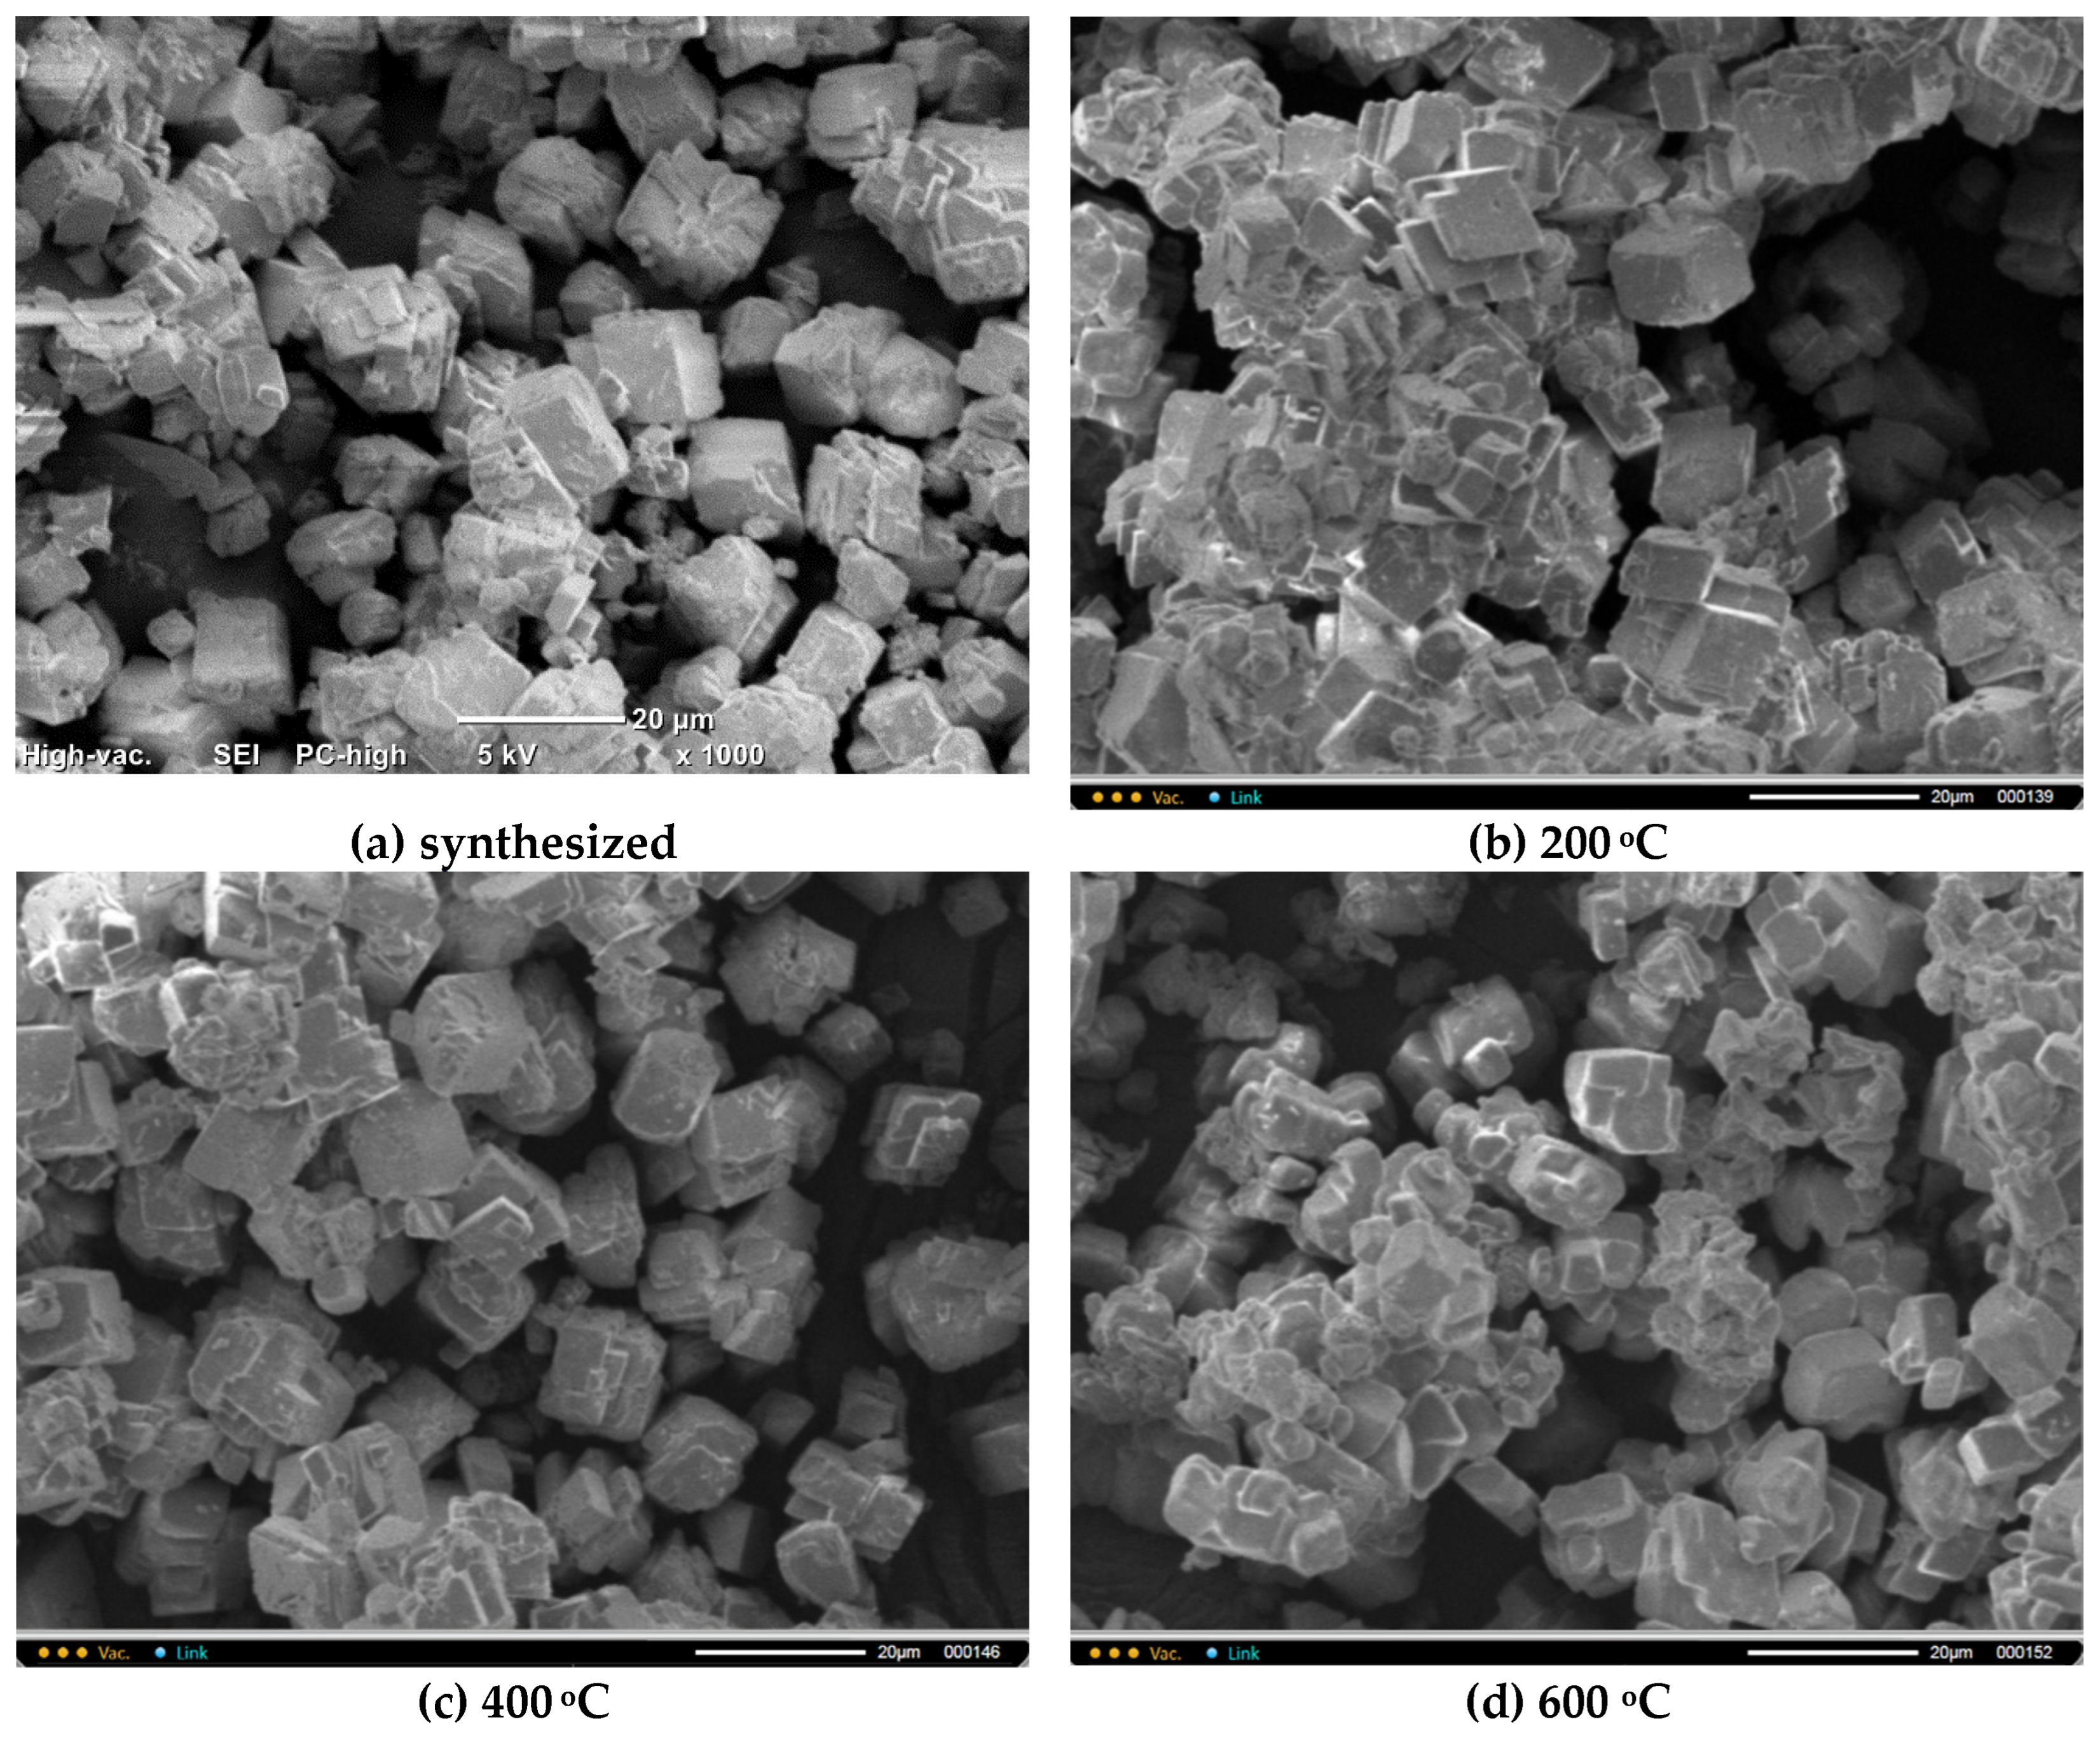
Figure 8.
XRD data of powder PO4 b after synthesis and after heat treatment at different temperatures. o - potassium chloride (sylvine) KCl (PDF No 41-1476; No 96-900-8652); b – brushite CaHPO4·2H2O (PDF card No 9-77; No 96-231-0527); m – monetite CaHPO4 (PDF card No 9-80; 96-210-6185); γ - γ-calcium pyrophosphate γ-Ca2P2O7 (PDF card No 17-499); p - β- calcium pyrophosphate β-Ca2P2O7 (PDF card 9-346; No 96-100-1557); # - β-tricalcium phosphate β-Ca3(PO4)2 (PDF card No 9-169; No 96-151-7239) v – K2CaP2O7 (PDF card No 22-805; No 96-220-2941).
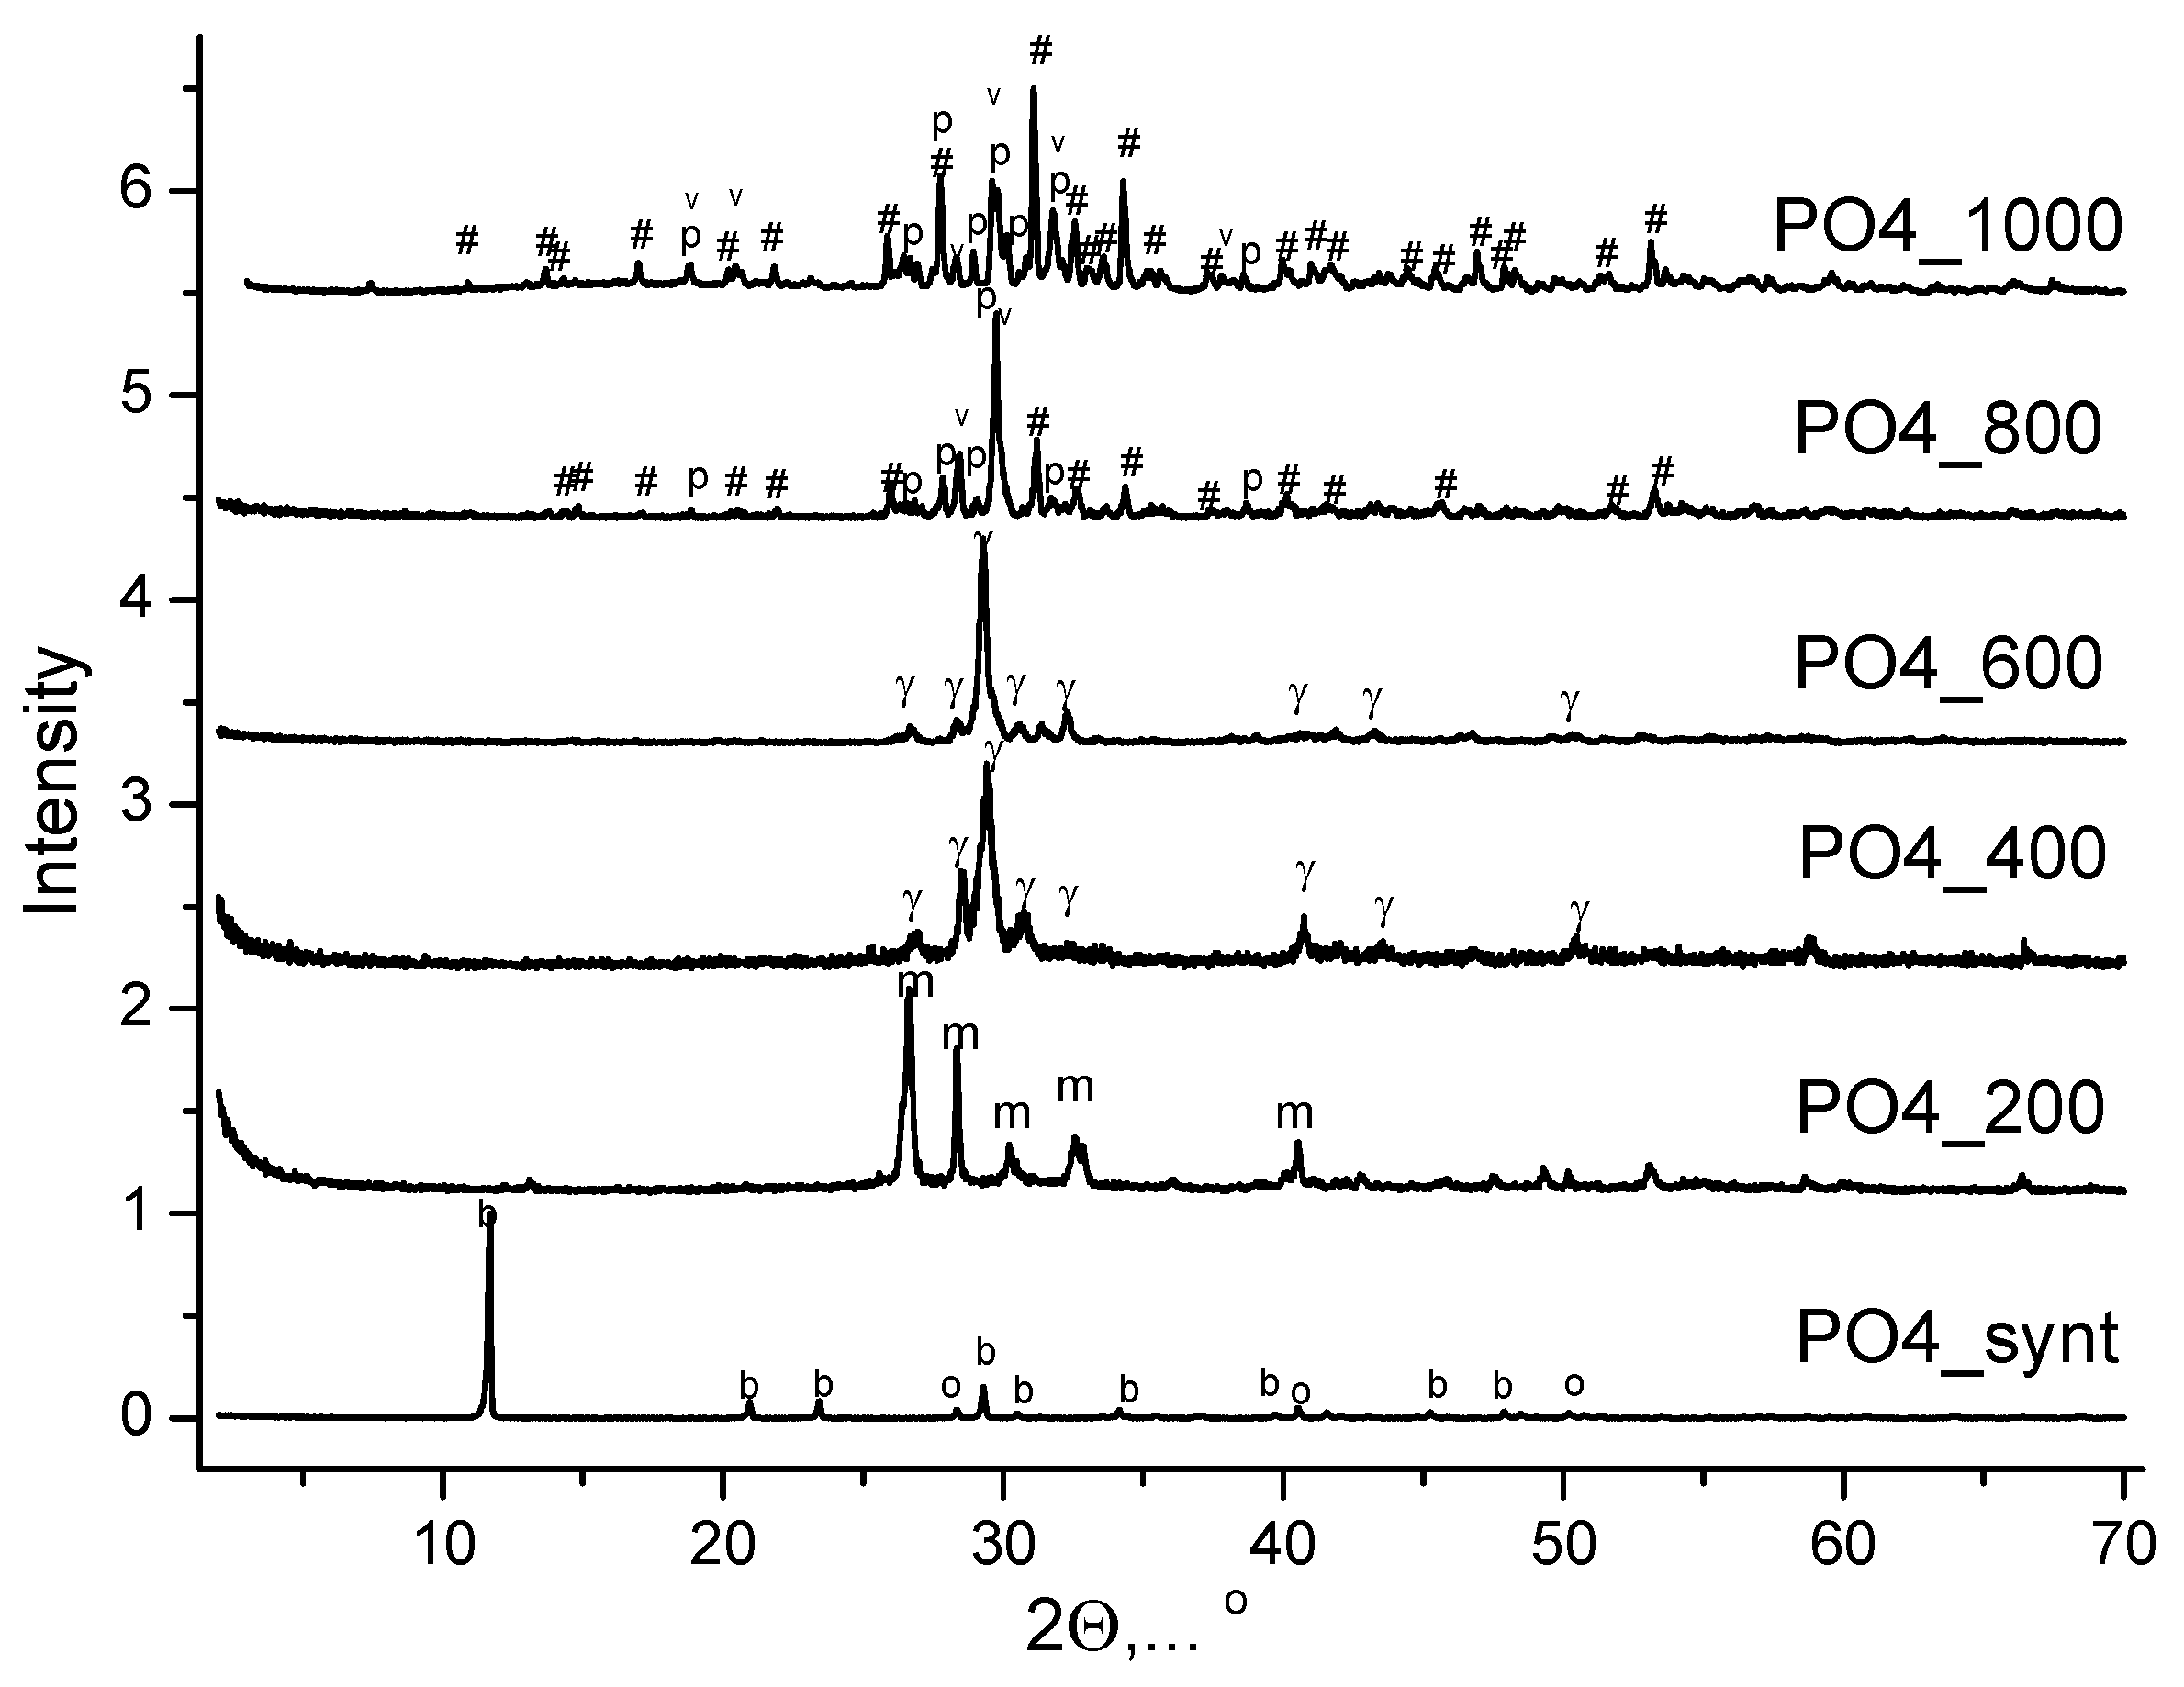
Figure 9.
Micrographs of PO4 powder after synthesis (a) and after heat treatment at various temperatures: 200 (b), 400 (c), 600 (d), 800 (e), 1000 (f).
Figure 9.
Micrographs of PO4 powder after synthesis (a) and after heat treatment at various temperatures: 200 (b), 400 (c), 600 (d), 800 (e), 1000 (f).
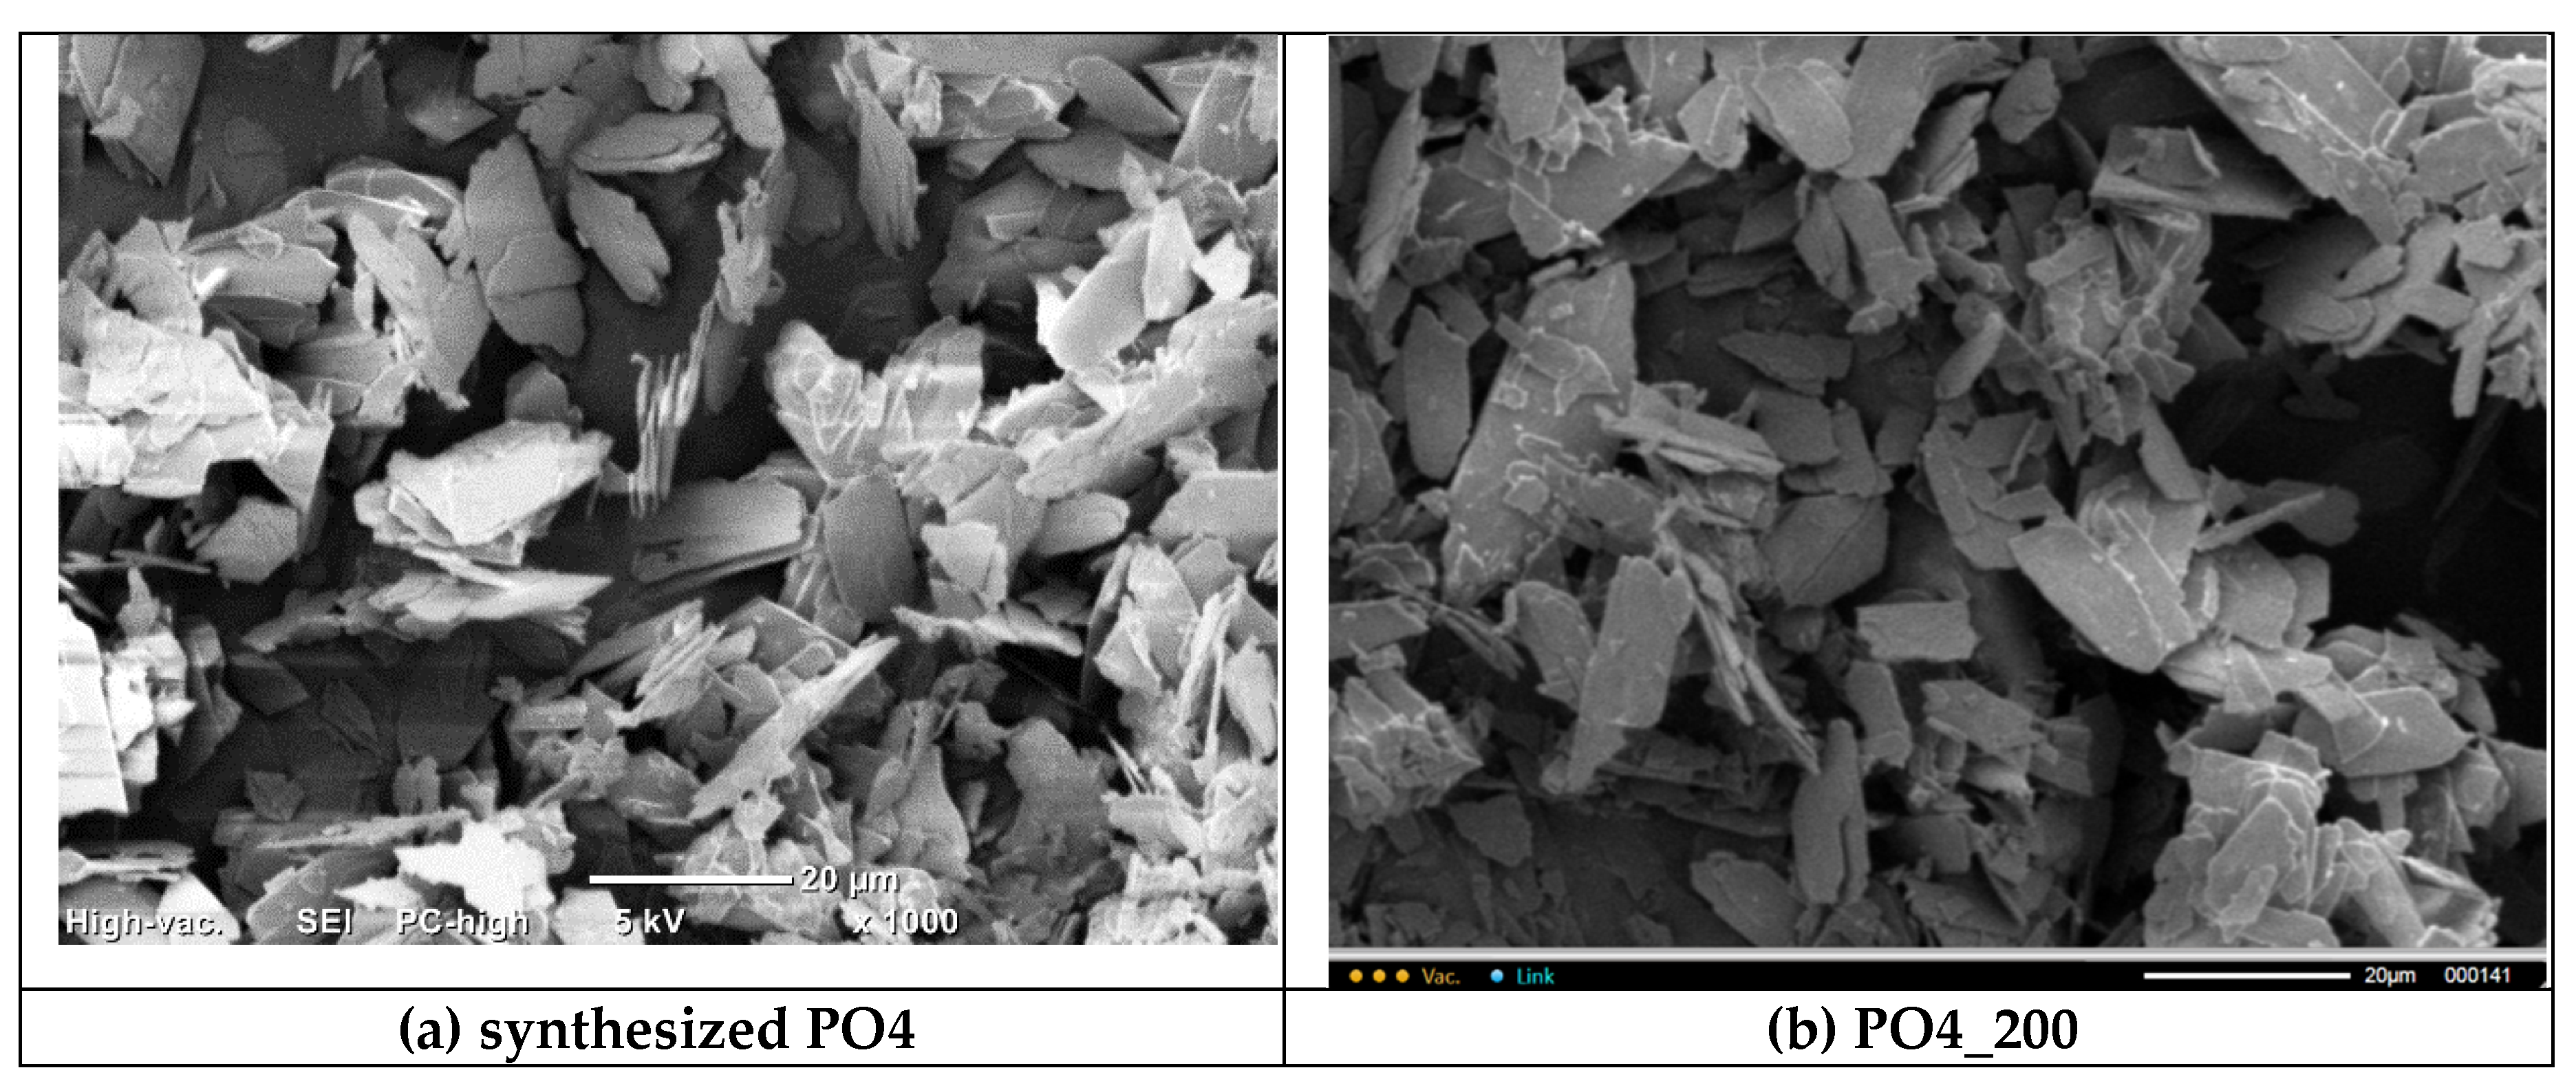
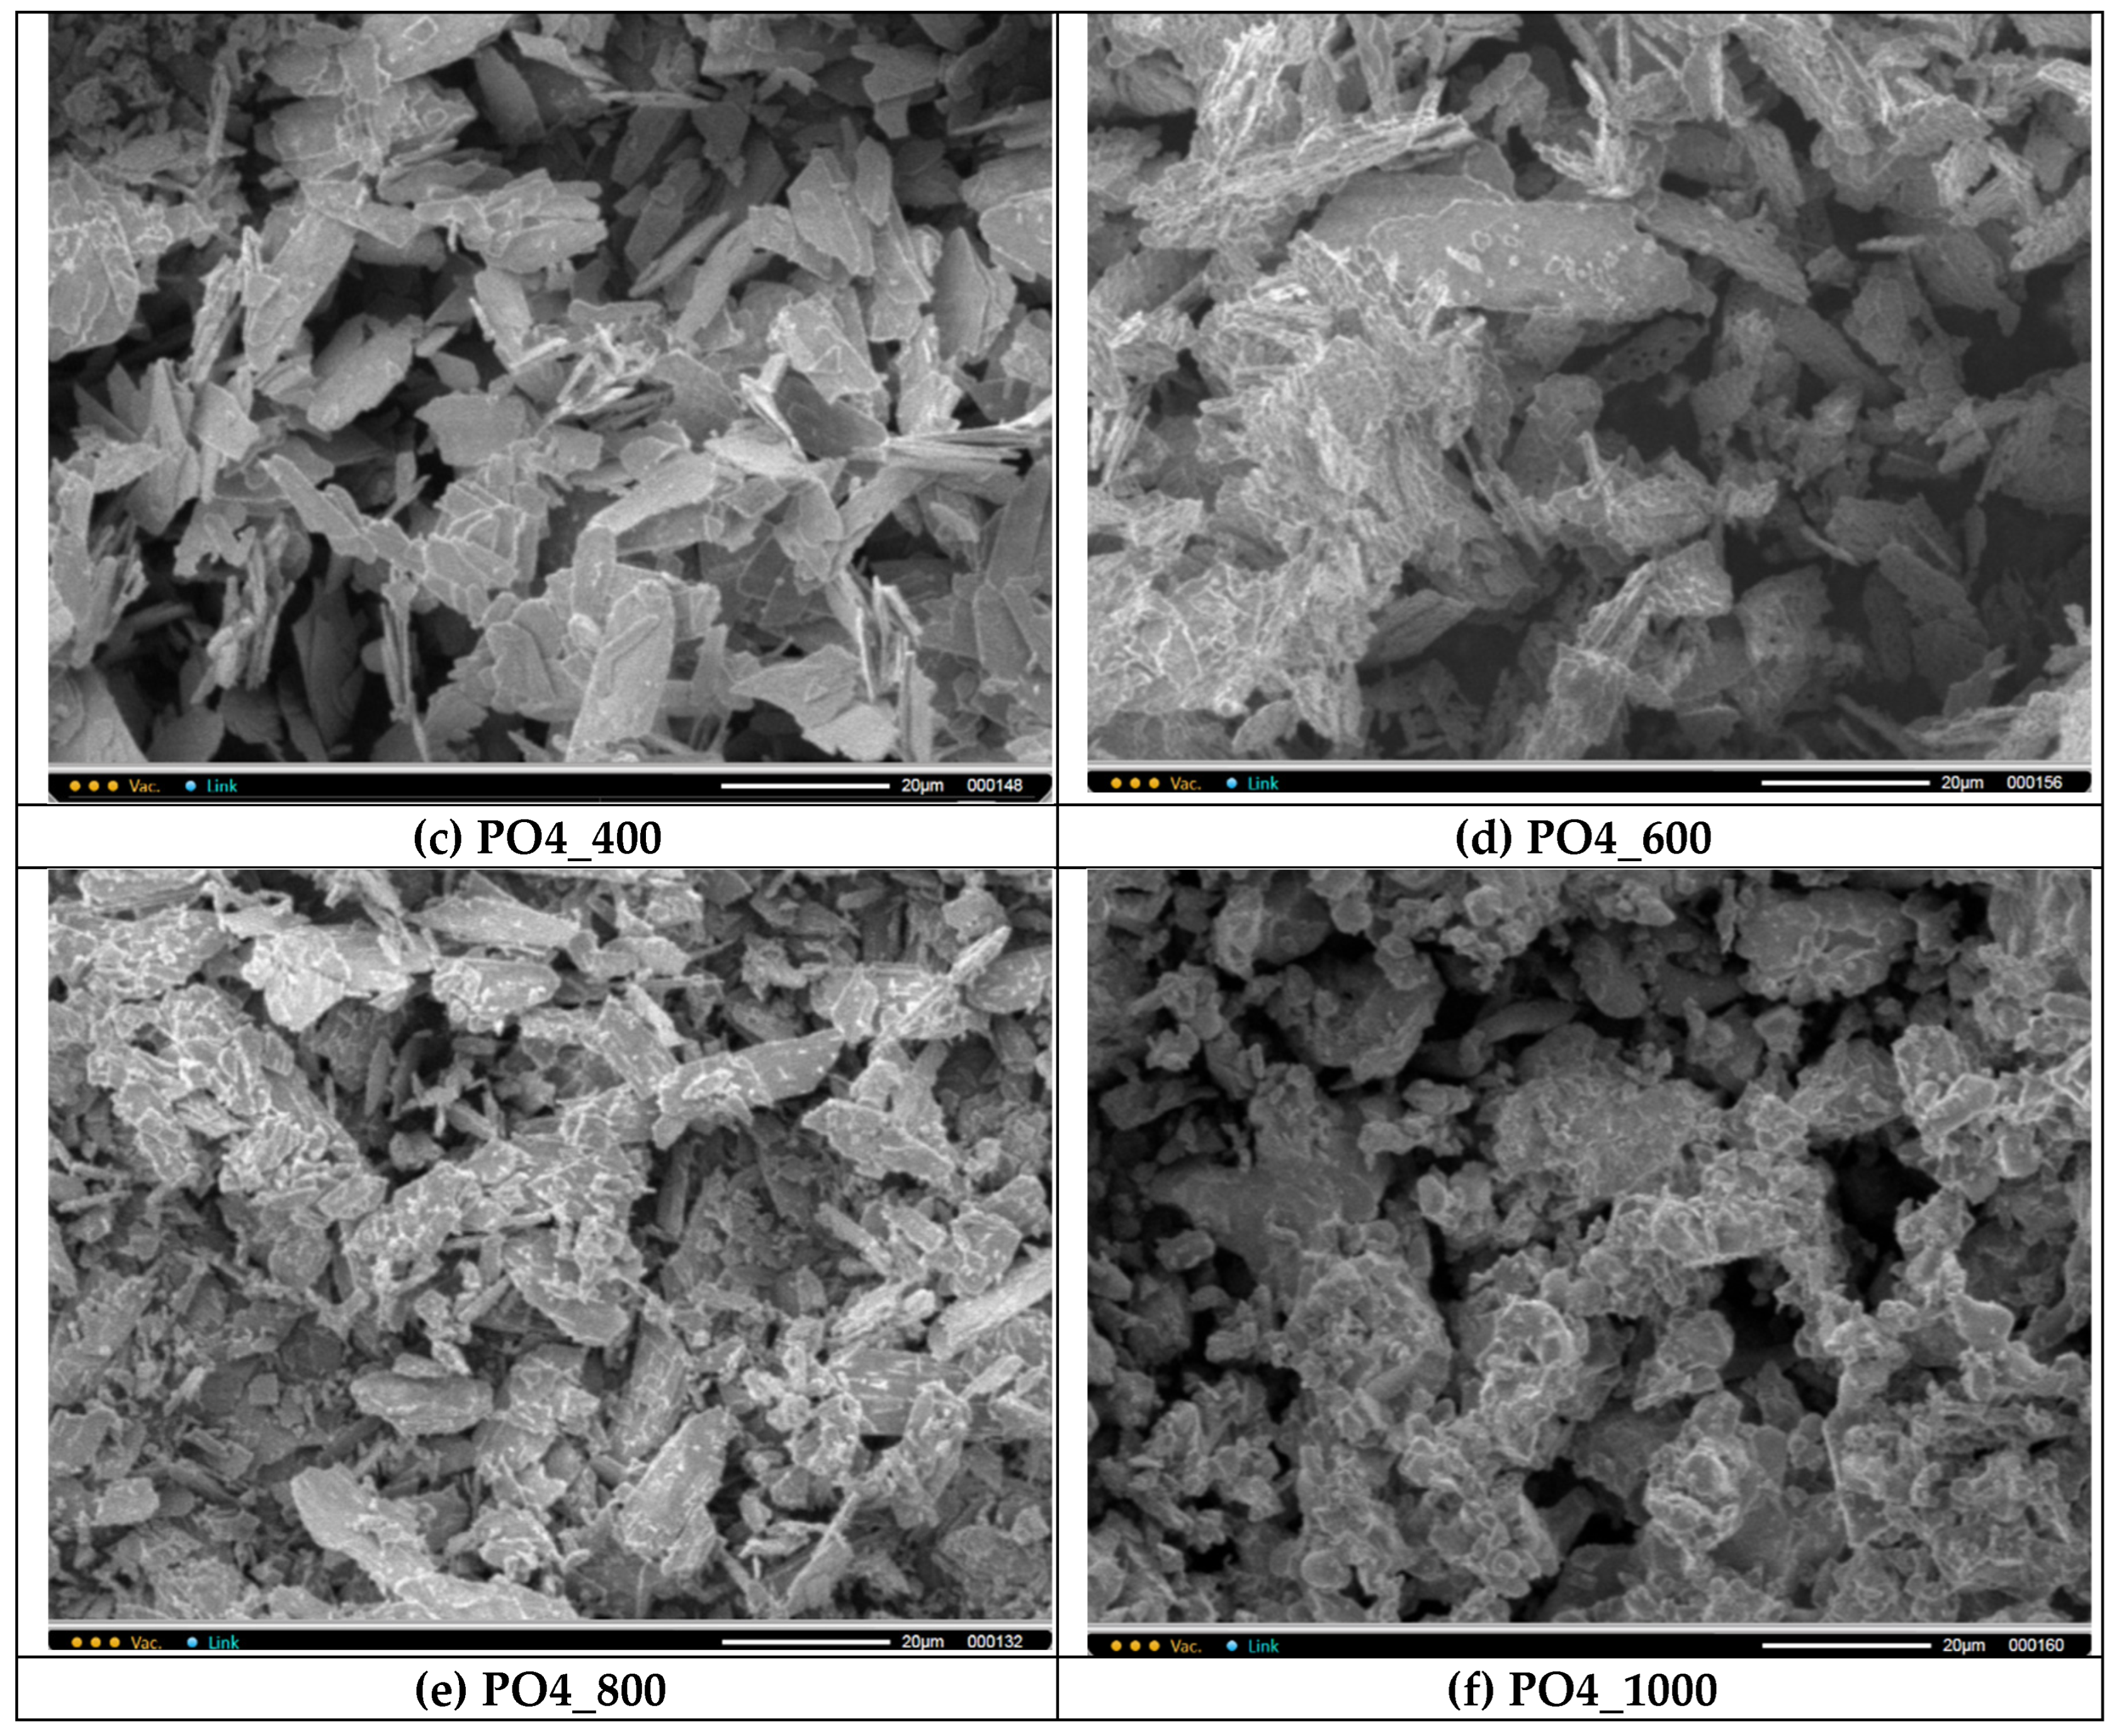
Figure 10.
FTIR spectra of synthesized PO4 powder and powder PO4_1000 after heat treatment at 1000 oC.
Figure 10.
FTIR spectra of synthesized PO4 powder and powder PO4_1000 after heat treatment at 1000 oC.
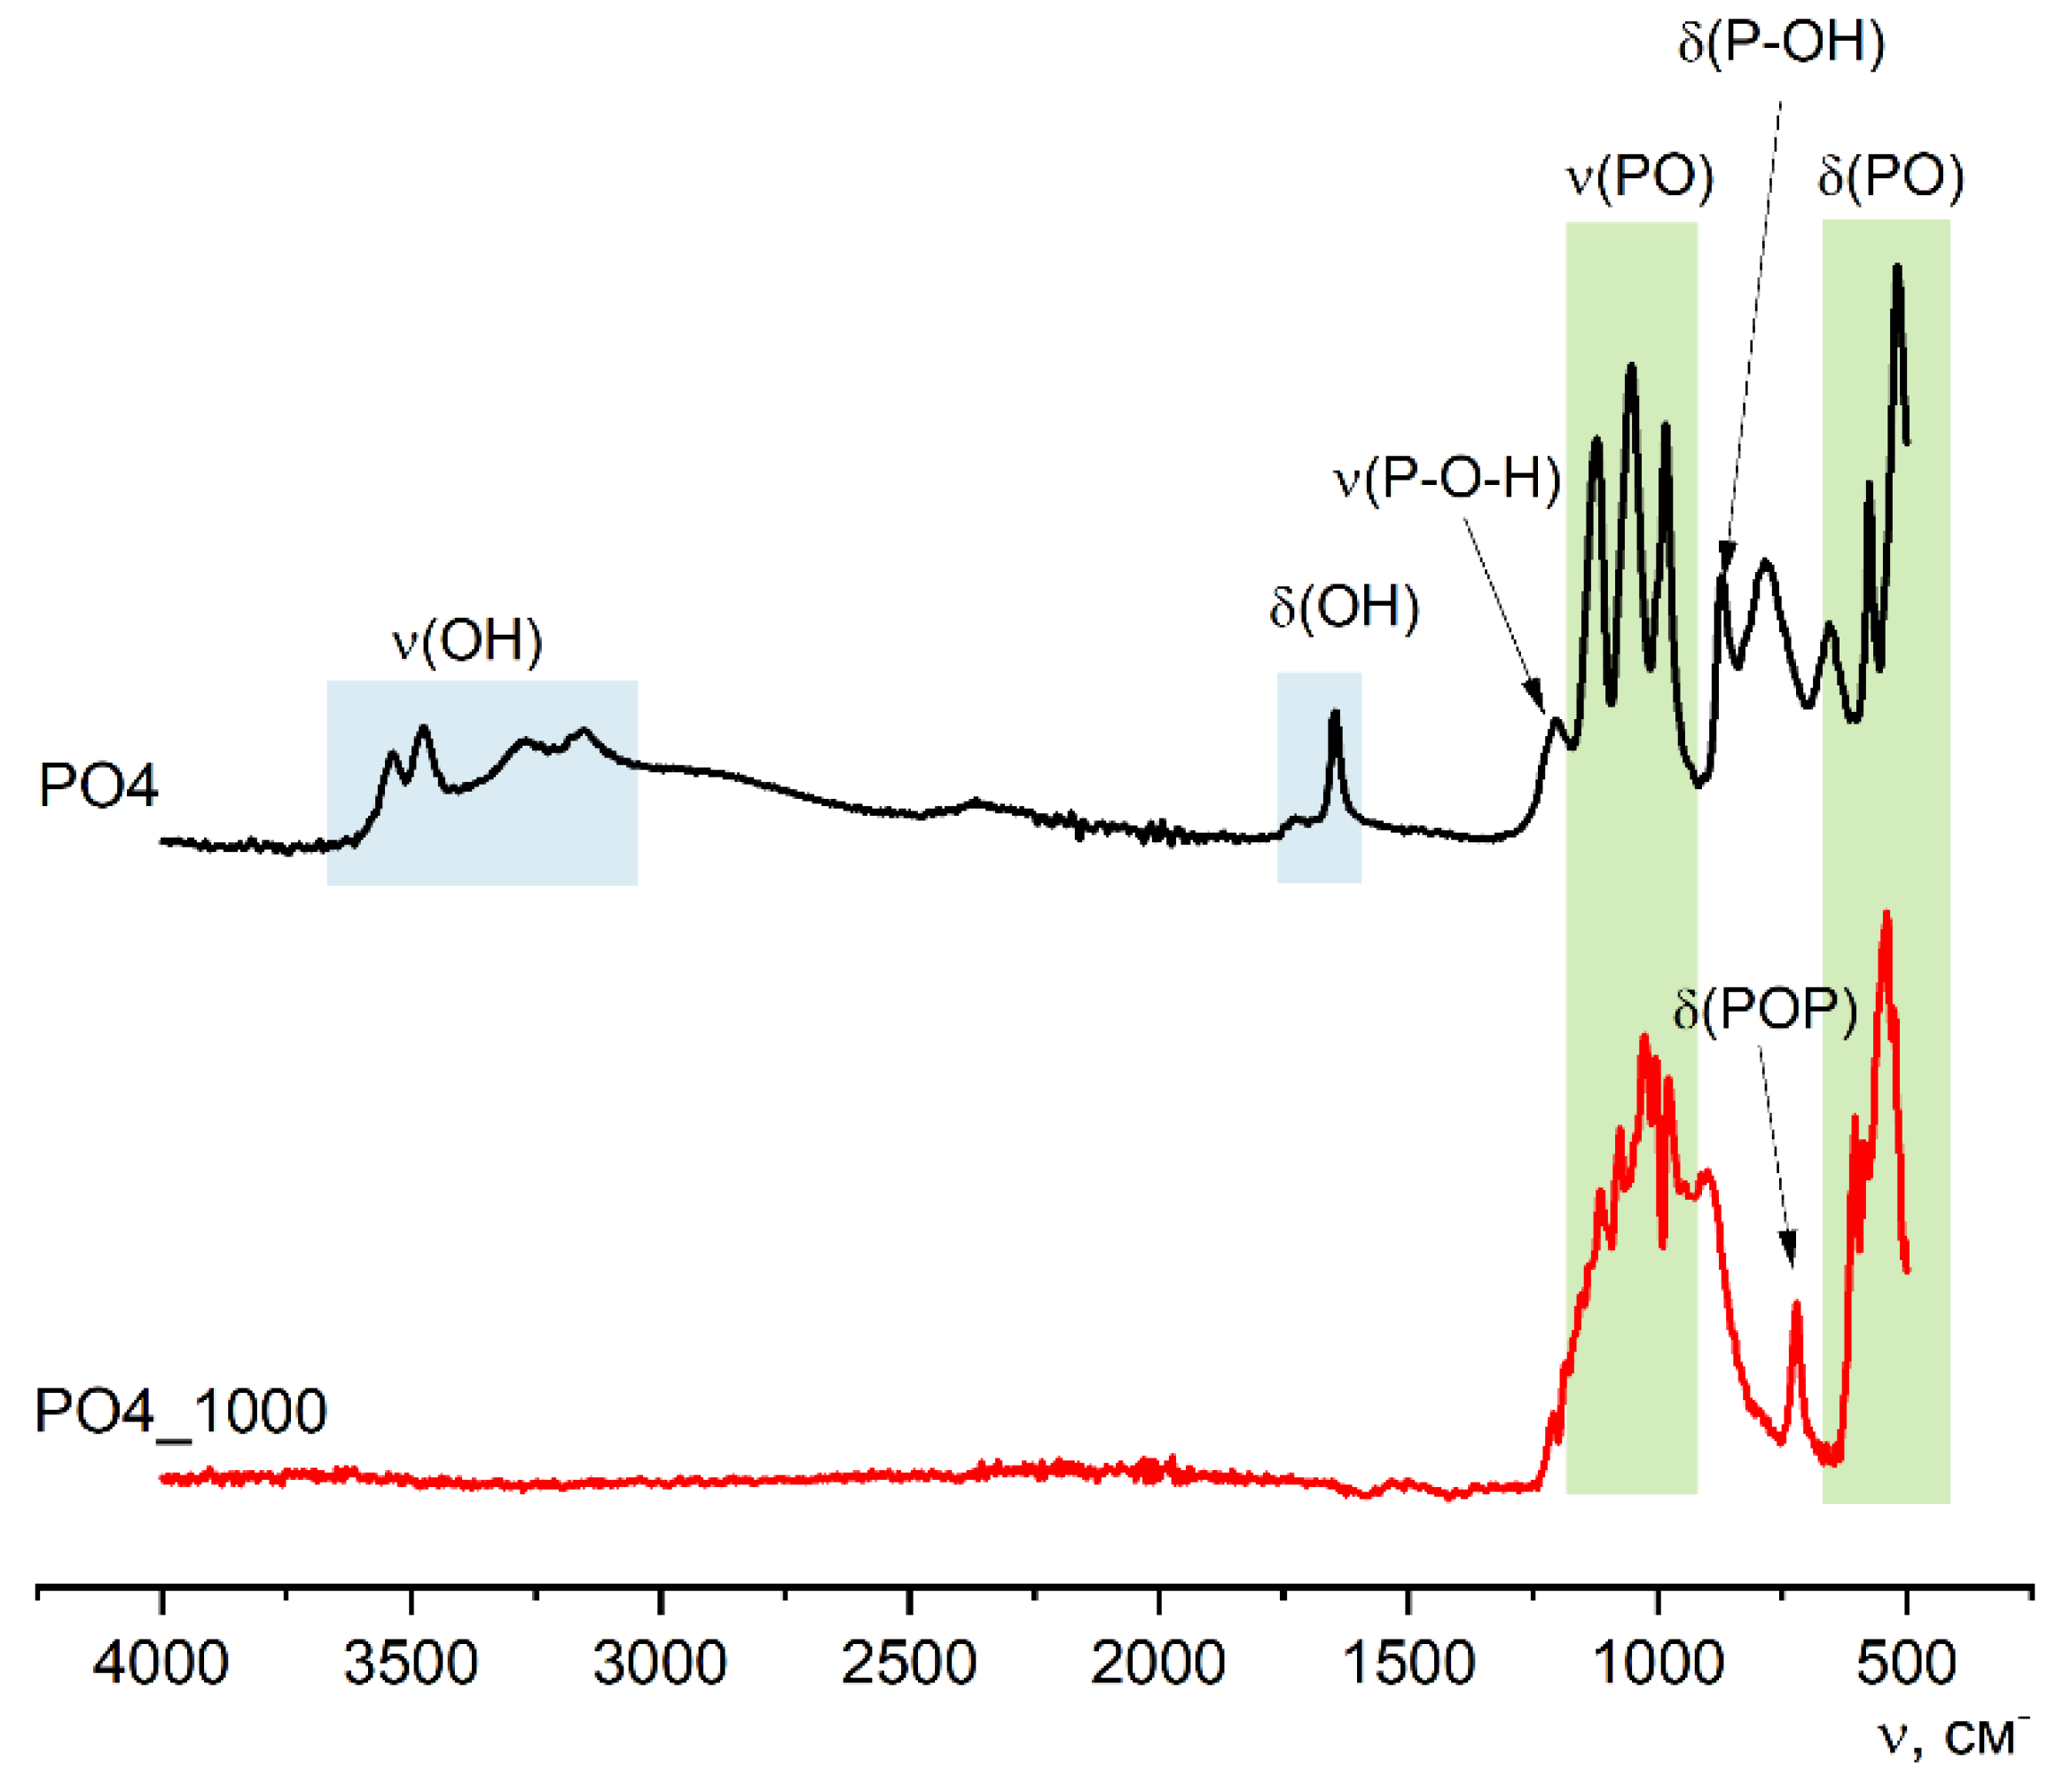
Figure 11.
XRD data of PO4_CO3 powder after synthesis and after heat treatment at different temperatures. * - hydroxyapatite Ca10(PO4)6(OH)2 (PDF No 96-901-4314) o - potassium chloride (sylvine) KCl (PDF No 41-1476; No 96-900-8652); δ – chlorapatite Ca10(PO4)6Cl2 (PDF No 73-1728; No 96-101-0917).
Figure 11.
XRD data of PO4_CO3 powder after synthesis and after heat treatment at different temperatures. * - hydroxyapatite Ca10(PO4)6(OH)2 (PDF No 96-901-4314) o - potassium chloride (sylvine) KCl (PDF No 41-1476; No 96-900-8652); δ – chlorapatite Ca10(PO4)6Cl2 (PDF No 73-1728; No 96-101-0917).
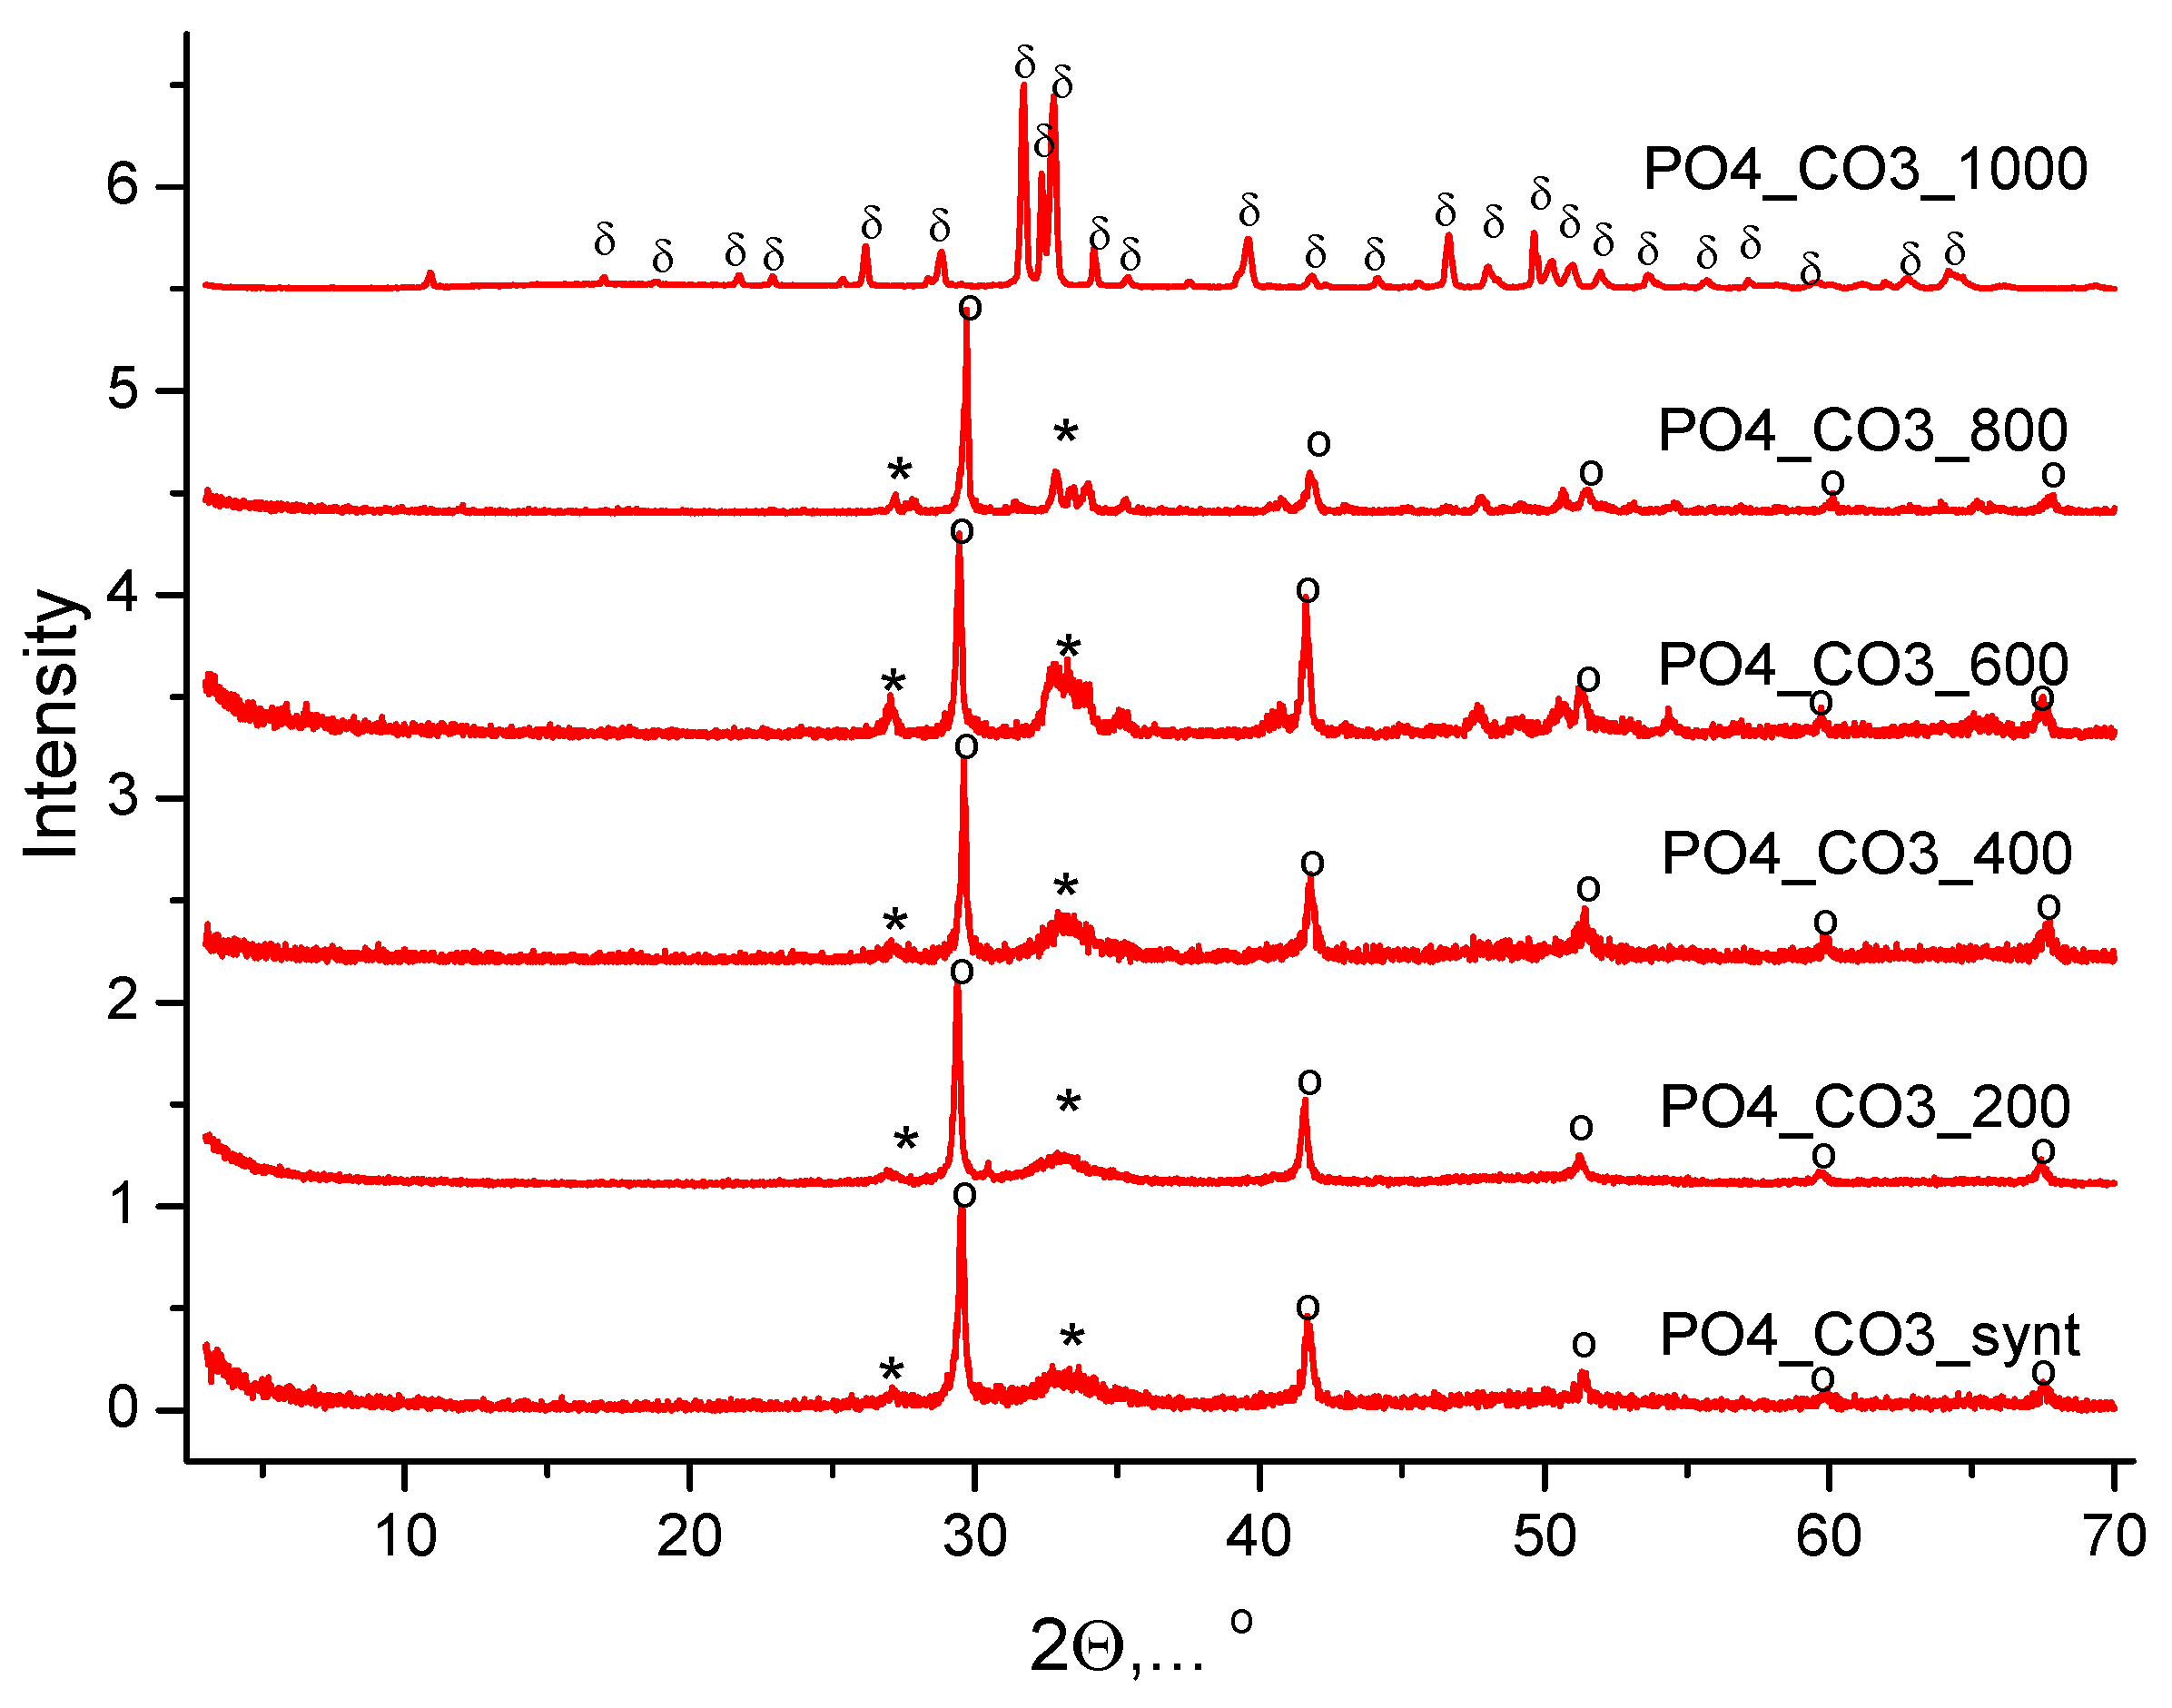
Figure 12.
Micrographs of PO4_CO3 powder after heat treatment at various temperatures: 200 (a), 400 (b), 600 (c), 800 (d), 1000 (e).
Figure 12.
Micrographs of PO4_CO3 powder after heat treatment at various temperatures: 200 (a), 400 (b), 600 (c), 800 (d), 1000 (e).
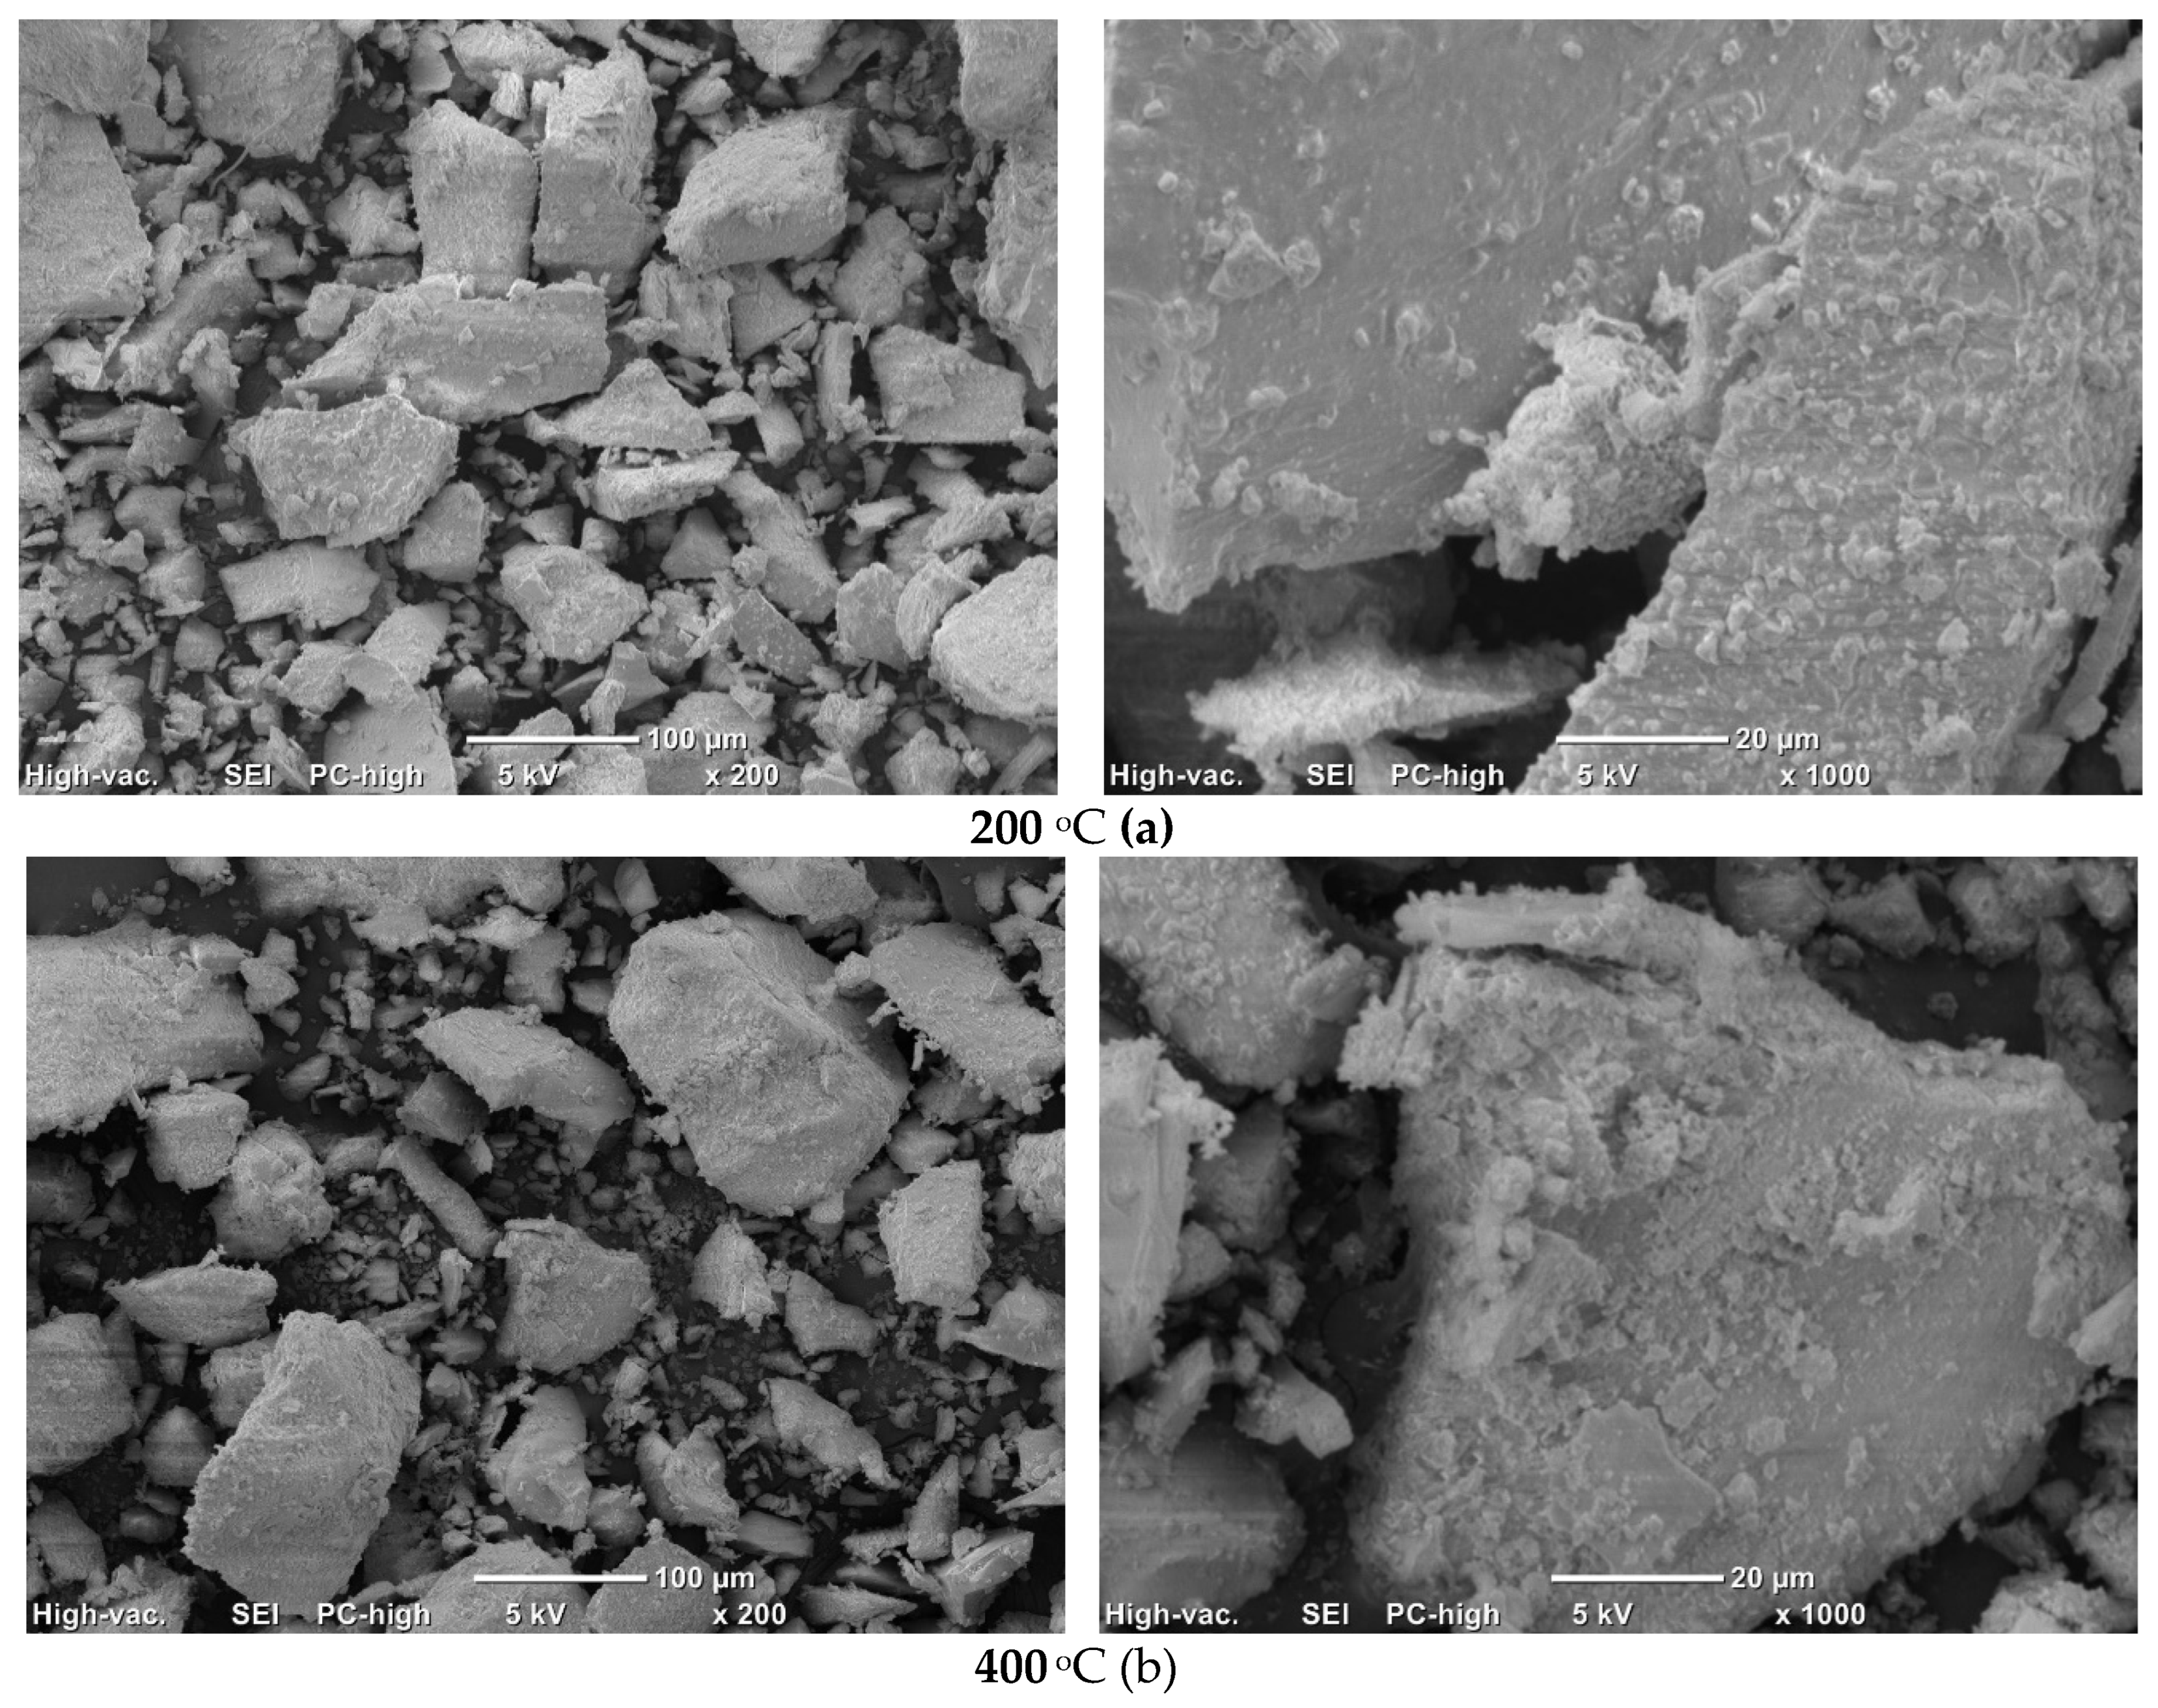
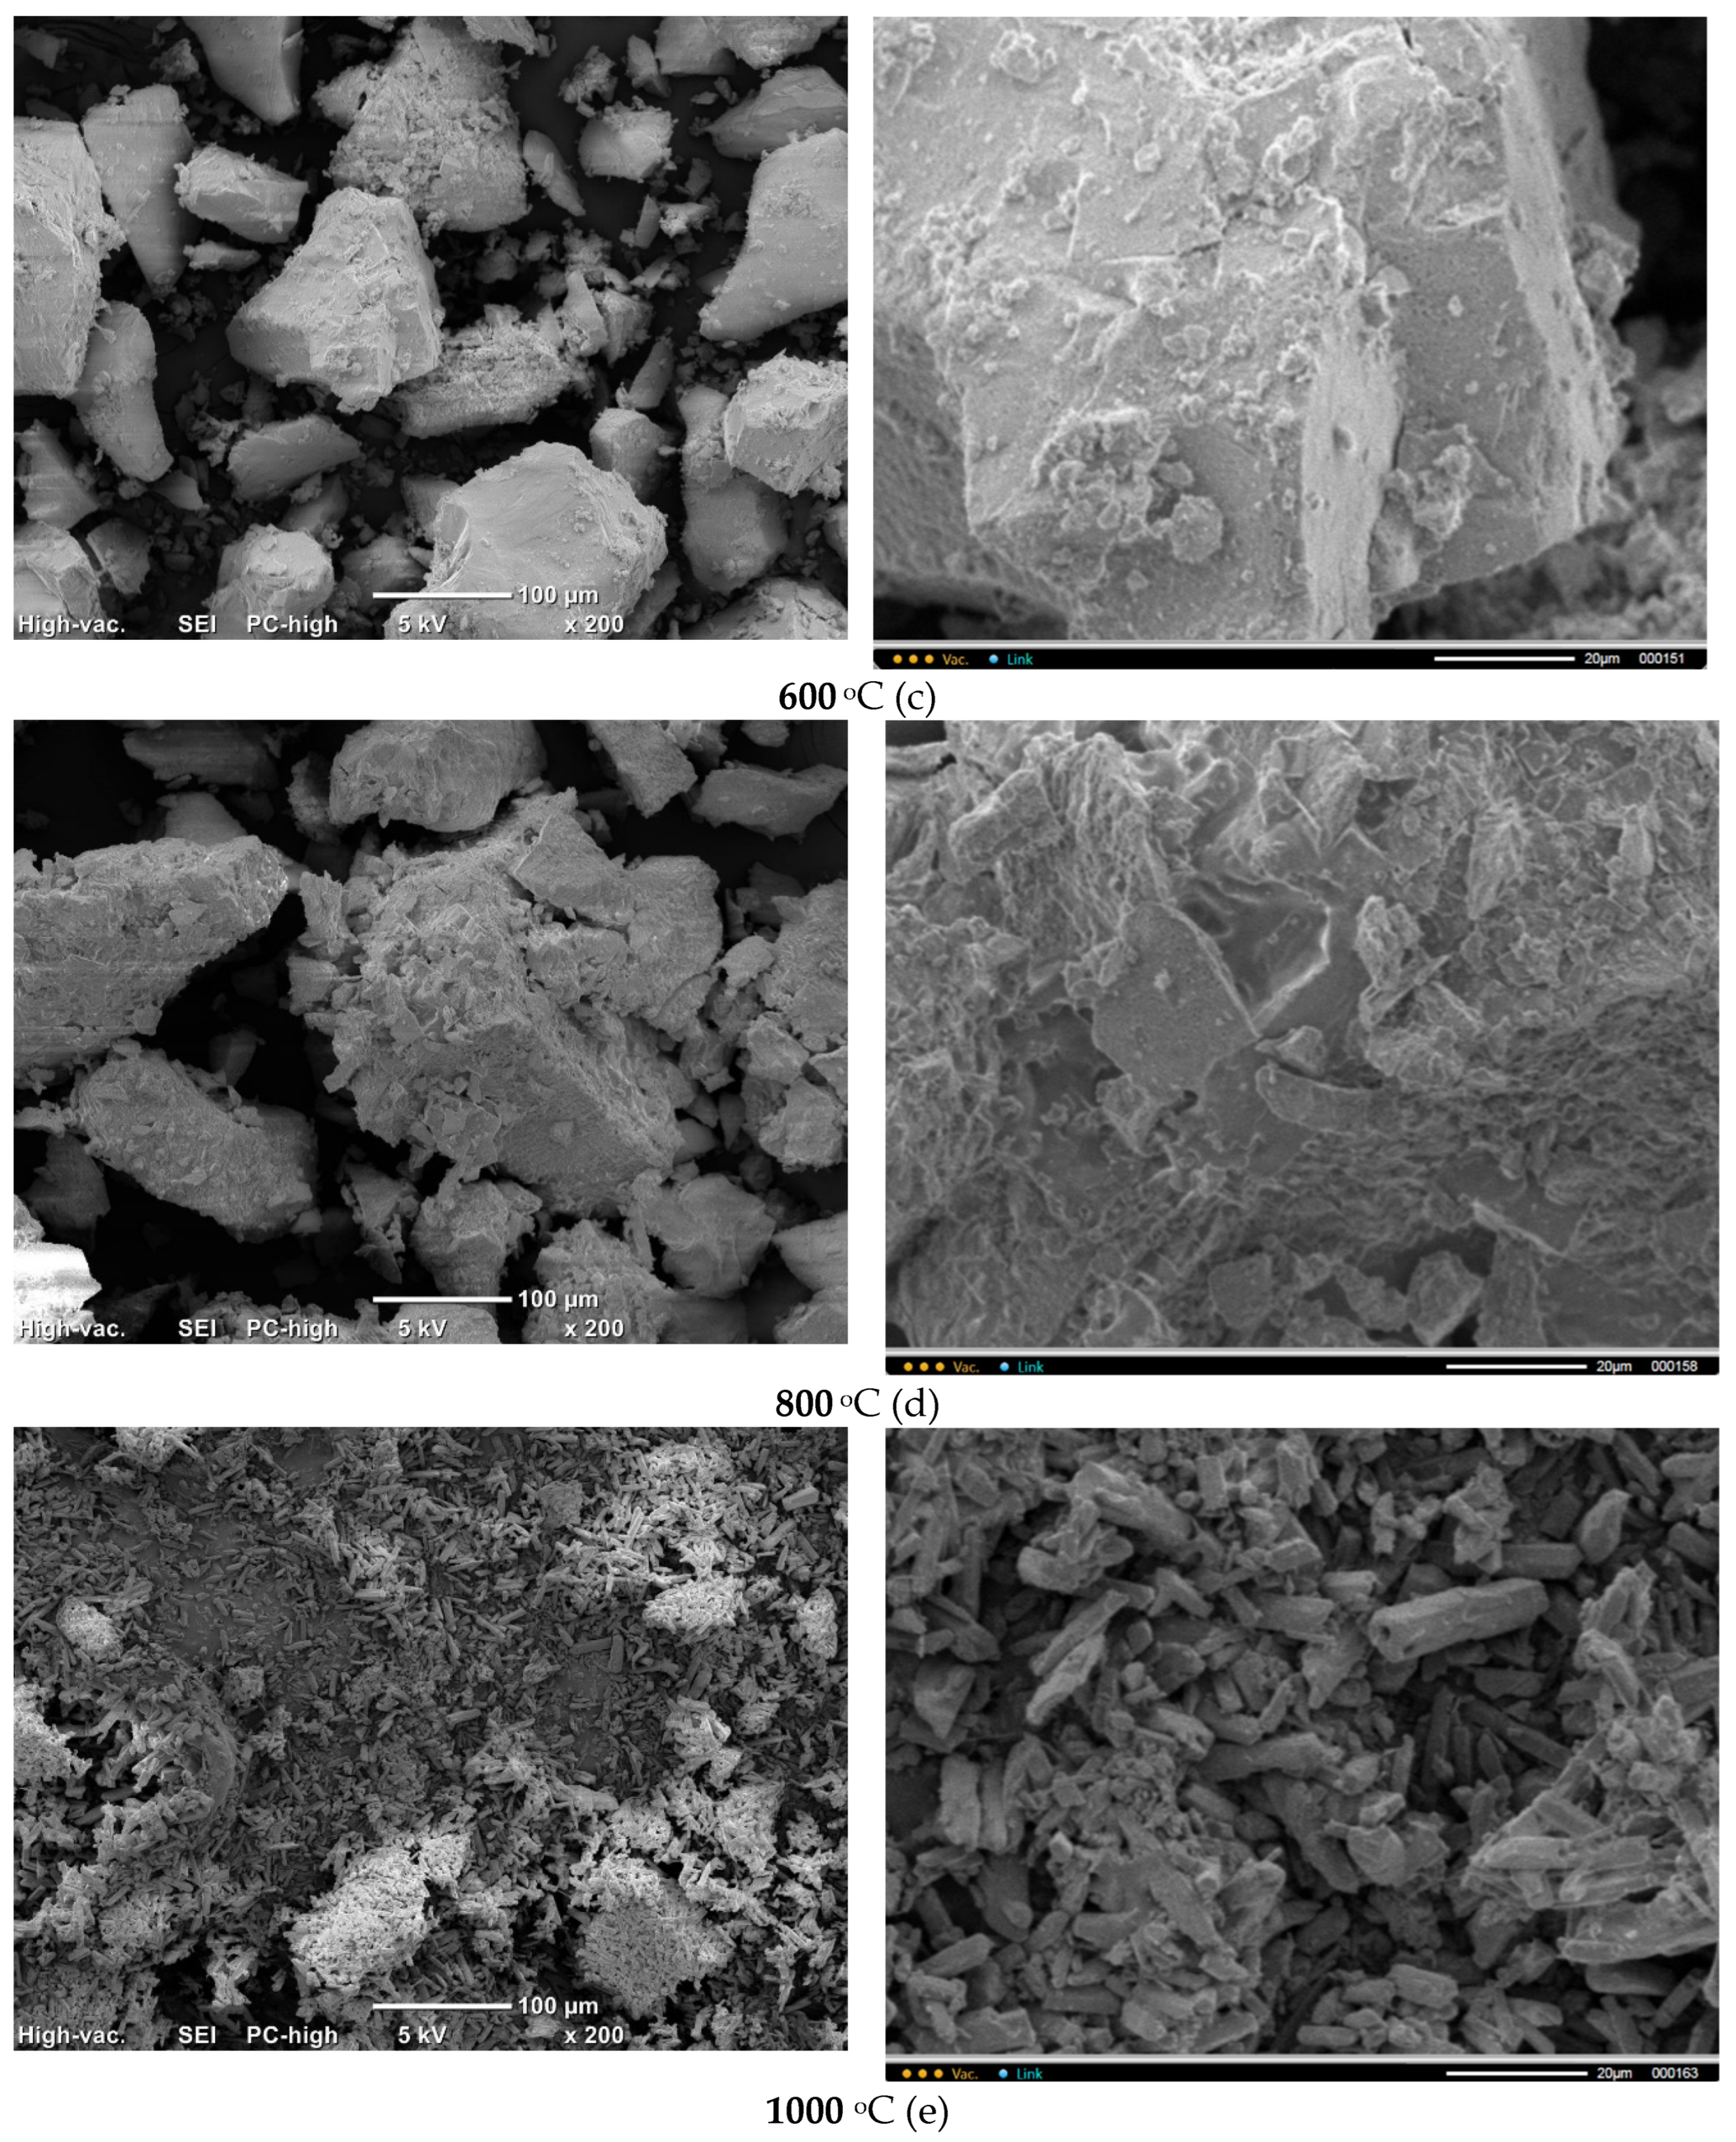
Figure 13.
FTIR spectra of PO4_CO3 powder after synthesis and after heat treatment at 1000 oC.
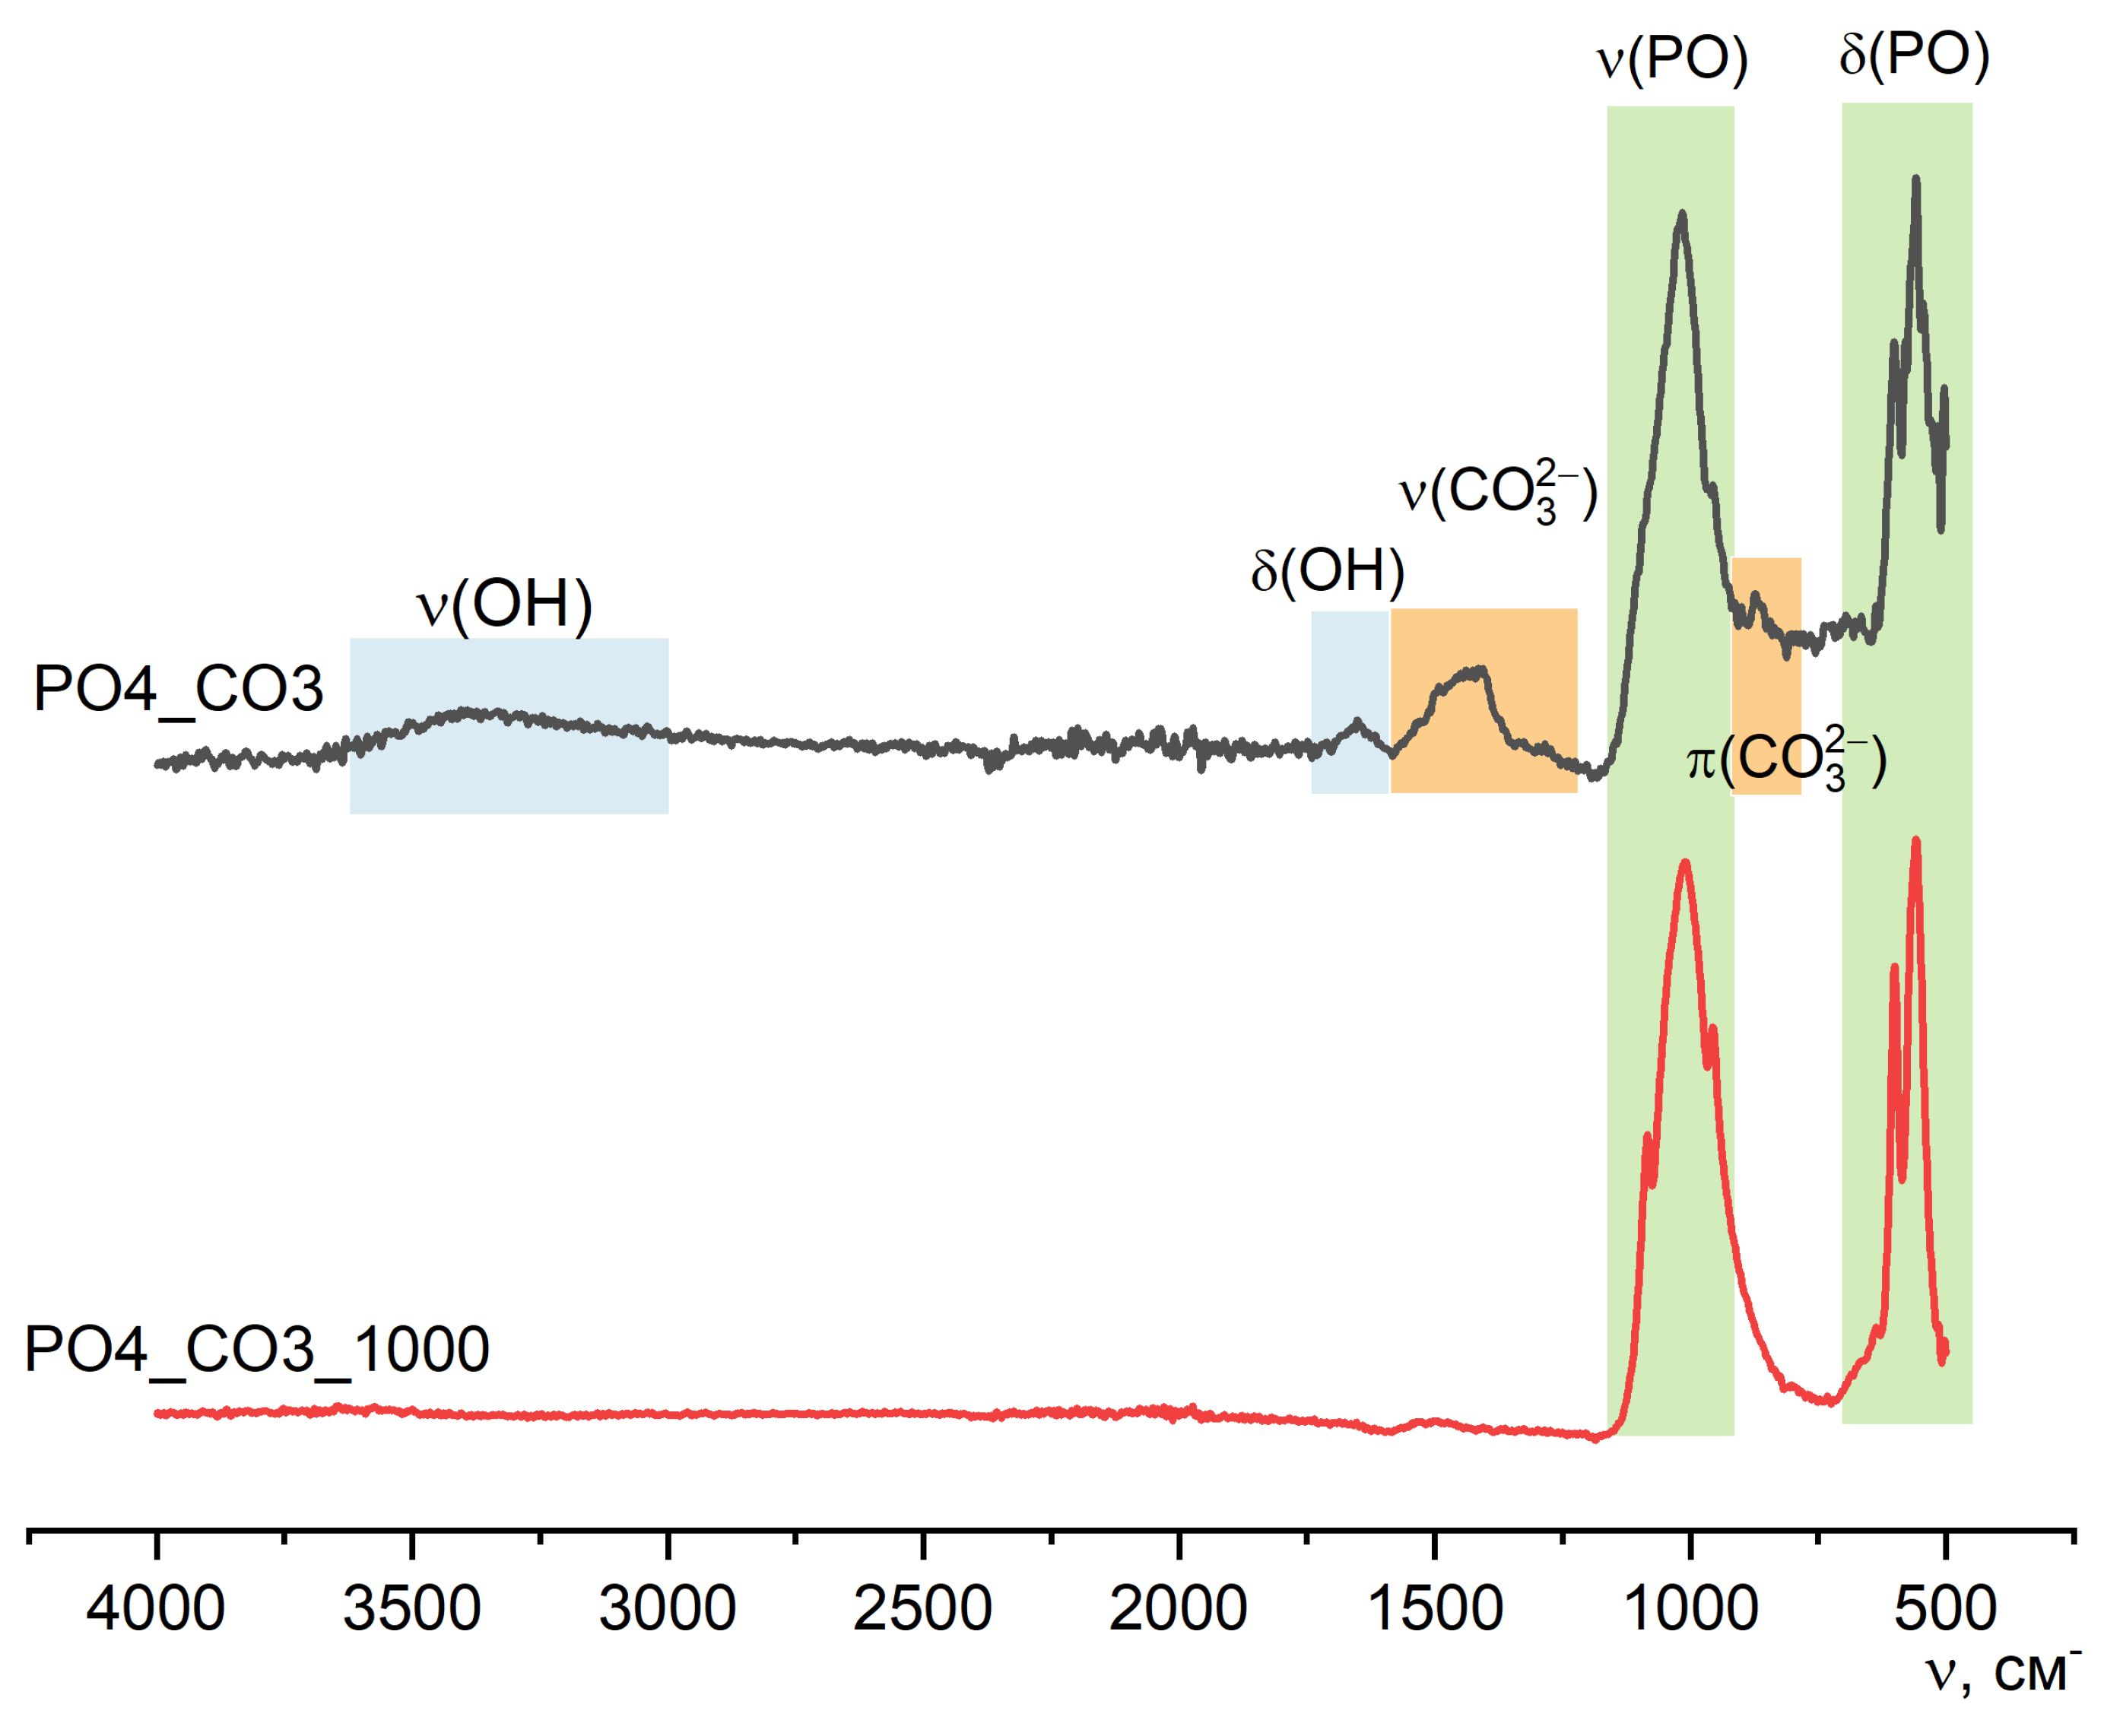

Table 1.
The labeling and synthesis conditions of the powders.
| Labeling of powders | PO4 | PO4_CO3 | CO3 |
|---|---|---|---|
| The molar ratio of Ca/(HPO42-+CO32-) | 1 | 1 | 1 |
| CaCl2, mol | 0,25 | 0,25 | 0,25 |
| V of solution CaCl2, l | 0,5 | 0,5 | 0,5 |
| C (CaCl2), mol/l | 0,5 | 0,5 | 0,5 |
| K2HPO4·3H2O, mol | 0,25 | 0,125 | - |
| K2CO3, moль | - | 0,125 | 0,25 |
| V of solution, containing anions (HPO42-) and/or (CO32-), l | 0,5 | 0,5 | 0,5 |
| C(K2HPO4·3H2O), mol/l | 0,5 | 0,25 | - |
| C(K2CO3), mol/l | - | 0,25 | 0,5 |
Table 2.
Quantities of initial, as well as expected target products and reaction by-product.
| Starting reagents | Labeling of synthesized powders | ||
|---|---|---|---|
| PO4 | PO4_CO3 | CO3 | |
| CaCl2, mol | 0,25 | 0,25 | 0,25 |
| K2HPO4·3H2O, mol | 0,25 | 0,125 | - |
| K2CO3, mol | - | 0,125 | 0,25 |
| Target products | |||
| CaHPO4·2H2O, mol | 0,25 | 0,125 | - |
| Mass of CaHPO4·2H2O, g | 43,0 | 21,5 | - |
| CaCO3, mol | - | 0,125 | 0,25 |
| Mass of CaCO3, g | - | 12,5 | 25,0 |
| By-product | Labeling of by-products | ||
| PO4_by | PO4_CO3_by | CO3_by | |
| KCl, moль | 0,5 | 0,5 | 0,5 |
| Мacca KCl, г | 37,3 | 37,3 | 37,3 |
| Total mass of expected products* | 80,3 | 73,1 | 62,3 |
* The total mass of the expected products is defined as the sum of the mass of target products (CaHPO4·2H2O and/or CaCO3) and mass of reaction by-product (KCl).
Table 3.
Labeling of powders obtained after heat treatment.
| Temperature of heat treatment | Labeling of synthesized powders | ||
|---|---|---|---|
| PO4 | PO4_CO3 | CO3 | |
| 200 °C | PO4_200 | PO4_CO3_200 | CO3_200 |
| 400 °C | PO4_400 | PO4_CO3_400 | CO3_400 |
| 600 °C | PO4_600 | PO4_CO3_600 | CO3_600 |
| 800 °C | PO4_800 | PO4_CO3_800 | CO3_800 |
| 1000 °C | PO4_1000 | PO4_CO3_1000 | - |
Table 4.
The expected and obtained masses of synthesized powders and reaction by-products.
| Labeling | PO4 | PO4_CO3 | CO3 |
|---|---|---|---|
| The expected quantities of target products and by-product: | |||
| CaHPO4·2H2O, g | 43,0 | - | - |
| Ca10(PO4)6(OH)2 + CaCO3, g | - | 25,1 | - |
| CaCO3, g | - | - | 25,0 |
| KCl, g | 37,3 | 37,3 | 37,3 |
| Total mass of expected products *, g | 80,3 | 62,4 | 62,3 |
| The obtained masses of the synthesized powders and the extracted by-products: | |||
| Mass of the powders after drying, g | 43,0 | 33,5 | 17,4 |
| Mass of the extracted reaction by-product, g | 30,6 | 25,5 | 37,1 |
| Total mass of prepared products**, g | 73,6 | 59,0 | 54,5 |
| The yield of synthesized products | 91,7% | 94,5% | 87,5% |
| The yield of reaction by-product | 82,0% | 68,4% | 99,4% |
| Mass of by-product, preserved by precipitate (estimation), g | 6,7 | 11,8 | 0,2 |
| Content of by-product in powders (estimation) | 15,6% | 35,2% | 1,1% |
| Content of by-product in powders (estimation according to Match!) | 2.8% | 30.9% | 1,8% |
* Total mass of expected products was determent as sum of target product (CaHPO4·2H2O and/or CaCO3) and reaction by-product (KCl). ** Total mass of prepared products was determined as sum of mass powder after drying and mass of the product extracted from mother liquor.
Disclaimer/Publisher’s Note: The statements, opinions and data contained in all publications are solely those of the individual author(s) and contributor(s) and not of MDPI and/or the editor(s). MDPI and/or the editor(s) disclaim responsibility for any injury to people or property resulting from any ideas, methods, instructions or products referred to in the content. |
© 2025 by the authors. Licensee MDPI, Basel, Switzerland. This article is an open access article distributed under the terms and conditions of the Creative Commons Attribution (CC BY) license (https://creativecommons.org/licenses/by/4.0/).
Copyright: This open access article is published under a Creative Commons CC BY 4.0 license, which permit the free download, distribution, and reuse, provided that the author and preprint are cited in any reuse.


