
Submitted:
28 August 2025
Posted:
02 September 2025
You are already at the latest version
Abstract
Existing qualitative direction-relation matrix models employ rigid classification schemes, limiting their ability to differentiate directional relationships between multiple targets within the same directional tile. This paper presents dual-scale quantitative frameworks for cardinal directions that can discern both incremental variations within specific directional tiles and angular modifications along the same radial vectors. The proposed synthesis of dual quantitative descriptors with the established multi-scale qualitative directional relationship pyramid model creates a holistic framework that connects qualitative and quantitative spatial representations. This integrated multi-scale directional relationship pyramid model enables bidirectional transformation between descriptive paradigms across multiple granularity levels. Experimental assessment confirms that this innovative architecture substantially improves directional relationship precision through its quantitative elements while supporting various application domains requiring multi-resolution spatial reasoning functionalities.
Keywords:
order directional-relation matrix
; coordinate directional-relation matrix
; quantitative model of cardinal directions
; multiscale pyramid model of cardinal directions
1. Introduction
A spatial configuration consists of an assemblage of spatial entities arranged in a specific distribution within the reference frame [1]. Spatial relations effectively encapsulate the fundamental structural composition of spatial scenes, with human cognition primarily interpreting these environments through object identification and relational analysis. This analytical framework encompasses topological configurations, directional orientations, and metric measurements between spatial entities [2] (Bruns et al. 1996). Spatial directional relations exhibit extensive applicability across multiple domains and quotidian contexts [2,3,4,5,6]. Direction-relation formal models constitute the mathematical formalization of directional semantic relationships within spatial reasoning frameworks. By formalizing the directional spatial relationships between target and reference entities through rigorous mathematical models, we enable efficient spatial data retrieval and support complex geospatial applications including urban morphological analysis, hazard prediction systems, environmental surveillance protocols, and related spatial decision support frameworks [7-10]. Directional-relation frameworks are extensively deployed across image retrieval and processing, spatial reasoning, computer vision, language processing, robotic wayfinding, semantic interpretation of remote sensing imagery, multi-resolution cartographic integration, and dynamic environmental simulation [8] [10-27]. Research on directional-relation formalization not only advances theoretical geospatial science but also bridges the gap between human spatial cognition and computational spatial representation, enabling more sophisticated machine-based spatial reasoning. The proliferation of emerging technologies, particularly digital twin environments, will further accentuate the critical importance of refined directional-relation models in spatial information science.
Directional relationships can be categorized into two fundamental paradigms: quantitative models, which employ precise numerical representations, and qualitative models, which utilize symbolic abstractions of spatial configurations [28-29]. Human spatial cognition predominantly employs qualitative descriptors for communicating spatial relationships and concepts, rather than relying on quantitative measurements and coordinates [1] [30-31].
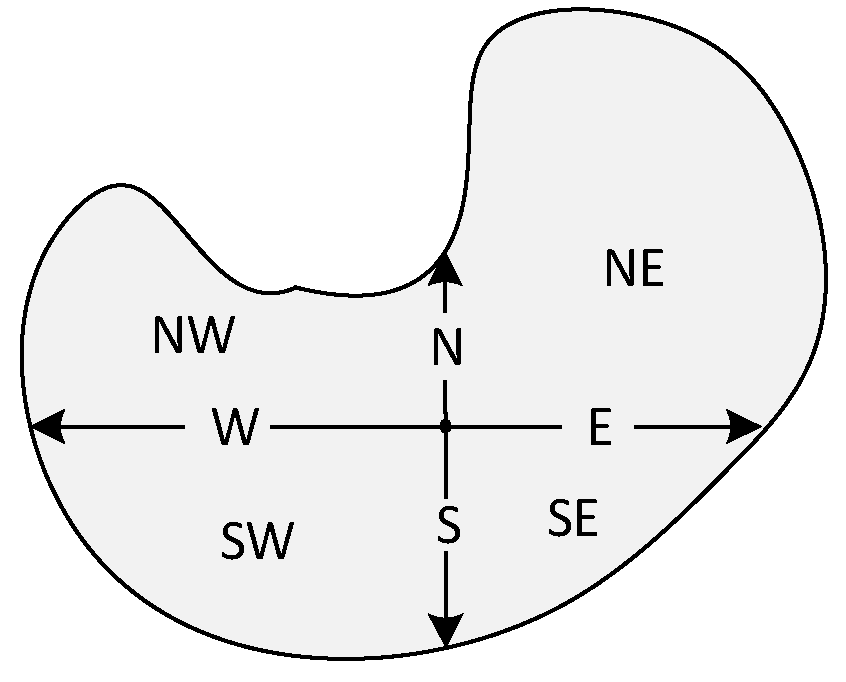
A quantitative directional model designates a specific ray as the reference direction (e.g., due north) and employs angular measurement to represent directional relationships. While this approach enables precise directional definition, its practical application in everyday spatial reasoning is limited due to its continuous value domain spanning 0-360 degrees. Qualitative direction-relation models, conversely, partition the reference object's spatial domain into distinct directional regions according to cardinal direction reference systems, and classify directional relationships based on the target object's position within these regions. Human spatial cognition typically employs either absolute directional references (north-south-east-west) or relative directional references (front-back-left-right). The adoption of four cardinal directions as a standard reference system demonstrates optimal dimensionality when analyzed against Cartesian coordinate systems. As illustrated in Figure 1, the four cardinal directions exhibit direct correspondence with two-dimensional coordinate axes: north and south align with the positive and negative y-axis, respectively, while east and west correspond to the positive and negative x-axis. This orthogonal arrangement provides complete coverage for spatial positioning in two-dimensional coordinate space.
Existing models of cardinal directions principally included cone models [32, 33], projection-based models [3, 34, 35], and Voronoi-based models [8]. The cone-shaped model partitions space into quadrants or octants via angular division; however, the cardinal direction definitions relative to a reference line or plane may not align with conventional directional perception in certain contexts. Projection-based models, which partition directional tiles according to the reference object's four cardinal direction projection regions as previously defined, achieve completeness in two-dimensional space [36] and are aligned with the Earth's geodetic positioning system defined by latitude and longitude [37]. The direction-relation matrix (Figure 2b) and its extensions represent prevalent projection-based directional models. The basic matrix treats the Minimum Bounding Rectangle (MBR) as a singular directional partition, failing to resolve directional variance within the MBR; thus, extended matrix models address MBR region subdivision from multiple perspectives, enhancing the description of directional relationships [9, 10, 36]. However, most extended models operate at a single precision level, and while they enhance expressive accuracy, they inevitably introduce complexities in the model and computational inefficiencies, significantly limiting their practical application. To address this issue, Tang et al. (2025) [38] developed a multi-scale pyramid model. The multi-scale pyramid model not only subsumes the qualitative projected directional relationship matrix model but also introduces a segmentation direction-relation matrix model, enhancing the precision of qualitative directional descriptions and accommodating the requirements for qualitative directional relationship representation across varying scales. However, these qualitative matrix models, constrained by their rigid directional partitioning, fail to discern nuanced directional relationships between distinct targets within a single directional tile. For example, the segmentation direction-relation matrix subdivides the northeast direction slice into three direction slices, such as east-northeast, northeast, and north-northeast; however, it remains limited in distinguishing targets within the east-northeast partition. Furthermore, the qualitative direction relation model may classify targets with closely aligned directions in adjacent partitions as disparate. Addressing this hard classification issue necessitates a quantitative model for soft classification of directional relationships, capturing the continuous, sequential nature of directional changes. Conversely, given that source map data typically consists of vector coordinates or raster imagery, the quantitative direction description matrix model facilitates the transformation between vector coordinates and qualitative directional-relation models, serving as a computational parameter for alternative qualitative directional relation matrices.
In this paper, based on the qualitative directional relation matrix model, we propose two different scale quantitative description matrix models of directional relations, which are based on order features and distance features, respectively, to construct an order matrix of cardinal directions and a directional coordinate matrix, to realize the soft classification of directional relations, and to differentiate between directional feature differences within the same direction tile and on the same ray direction. The proposed quantitative directional relationship matrices serve as a parametric foundation for existing qualitative directional relationship matrices, enabling seamless integration with the established multi-scale qualitative direction-relation pyramid model. This integration facilitates a comprehensive multi-scale representation of directional spatial relations across the quantitative-qualitative spectrum.
2. Related work
2.1. Direction-relation matrix and its extended models
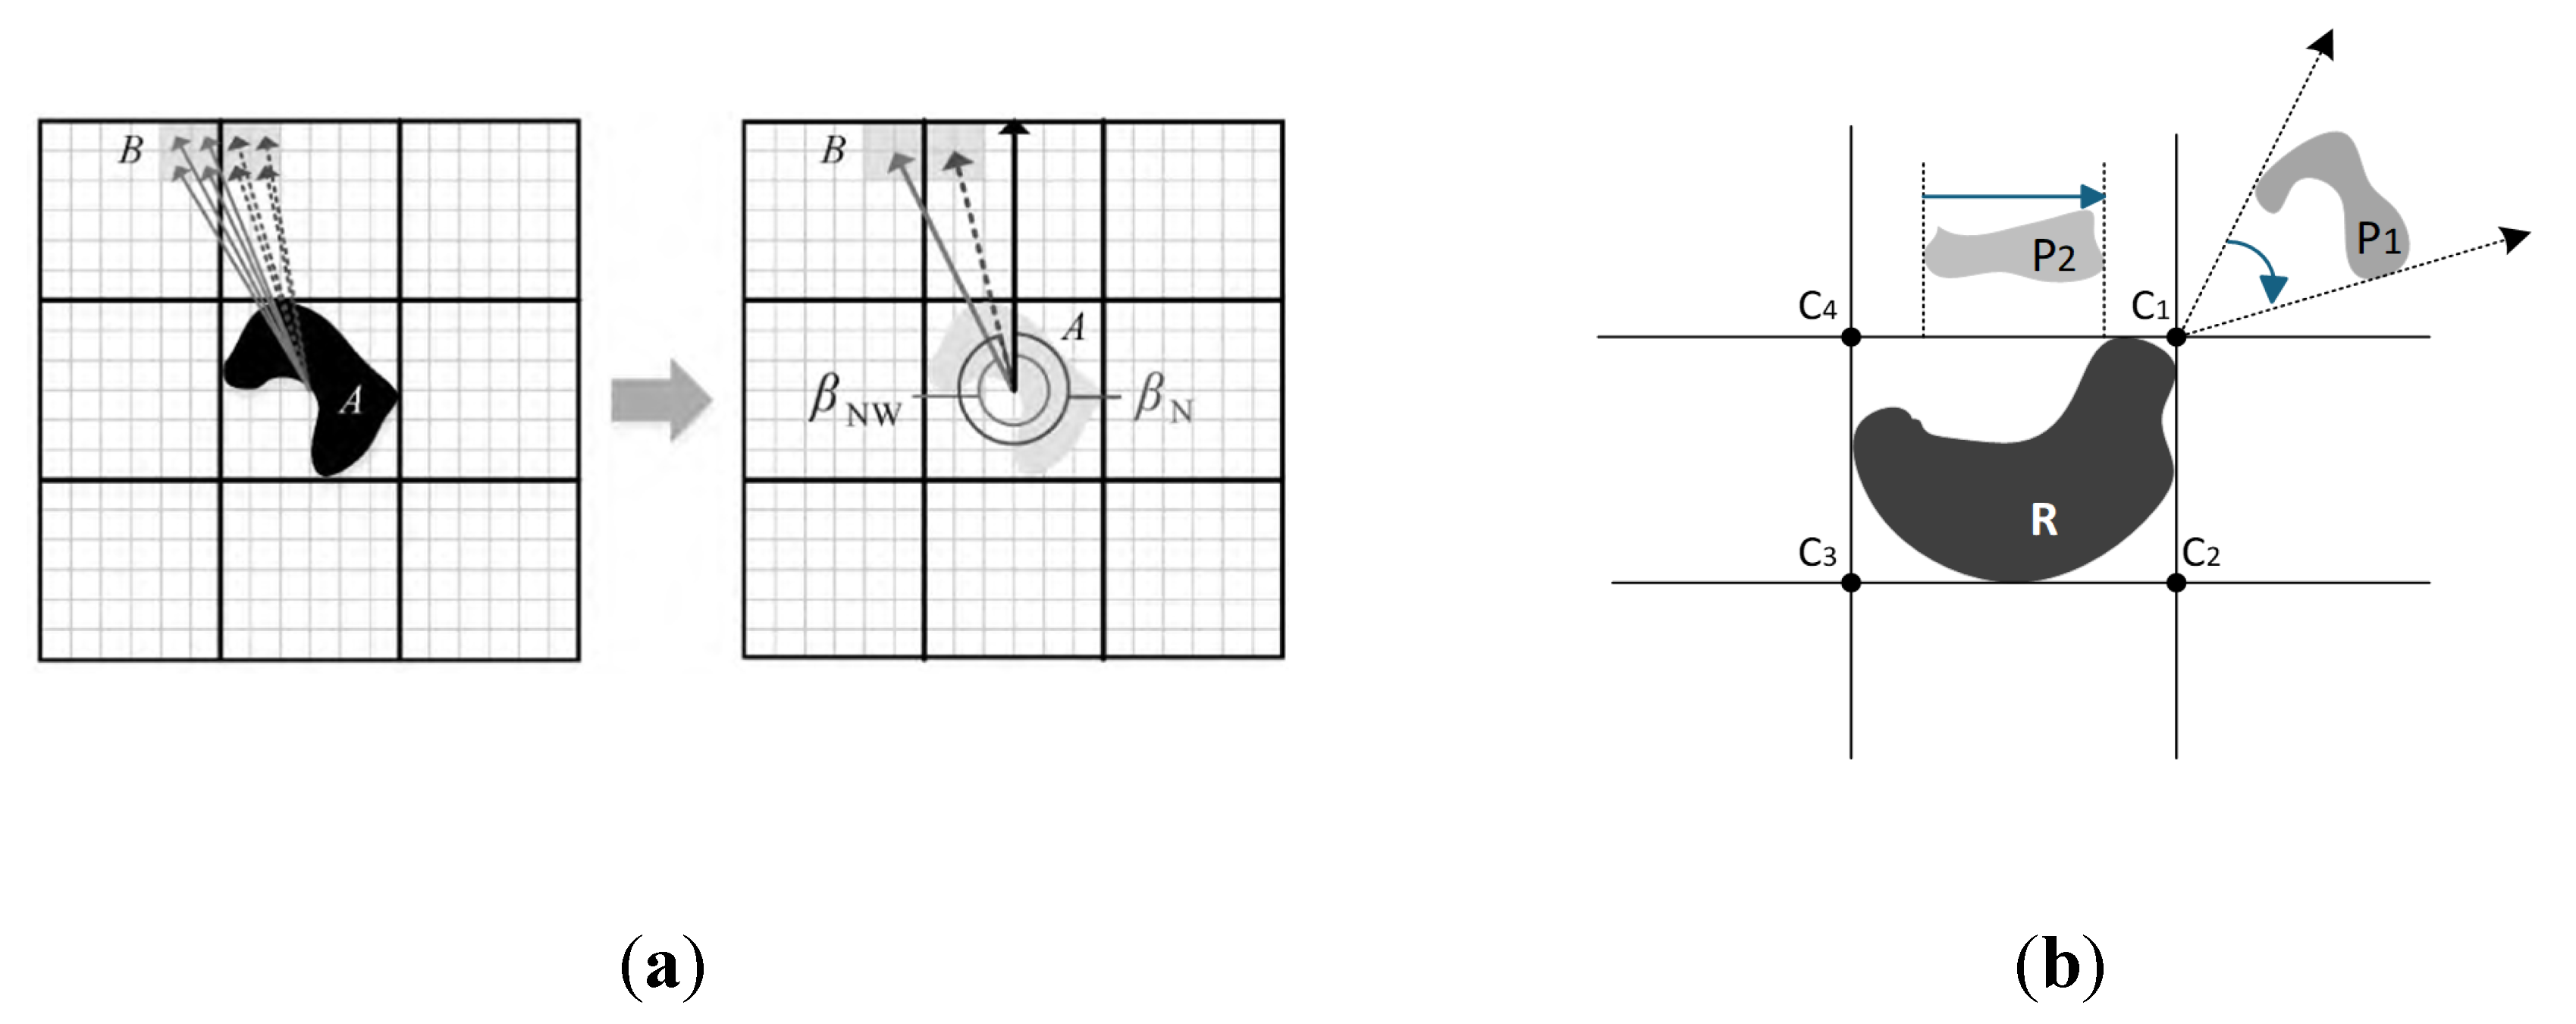
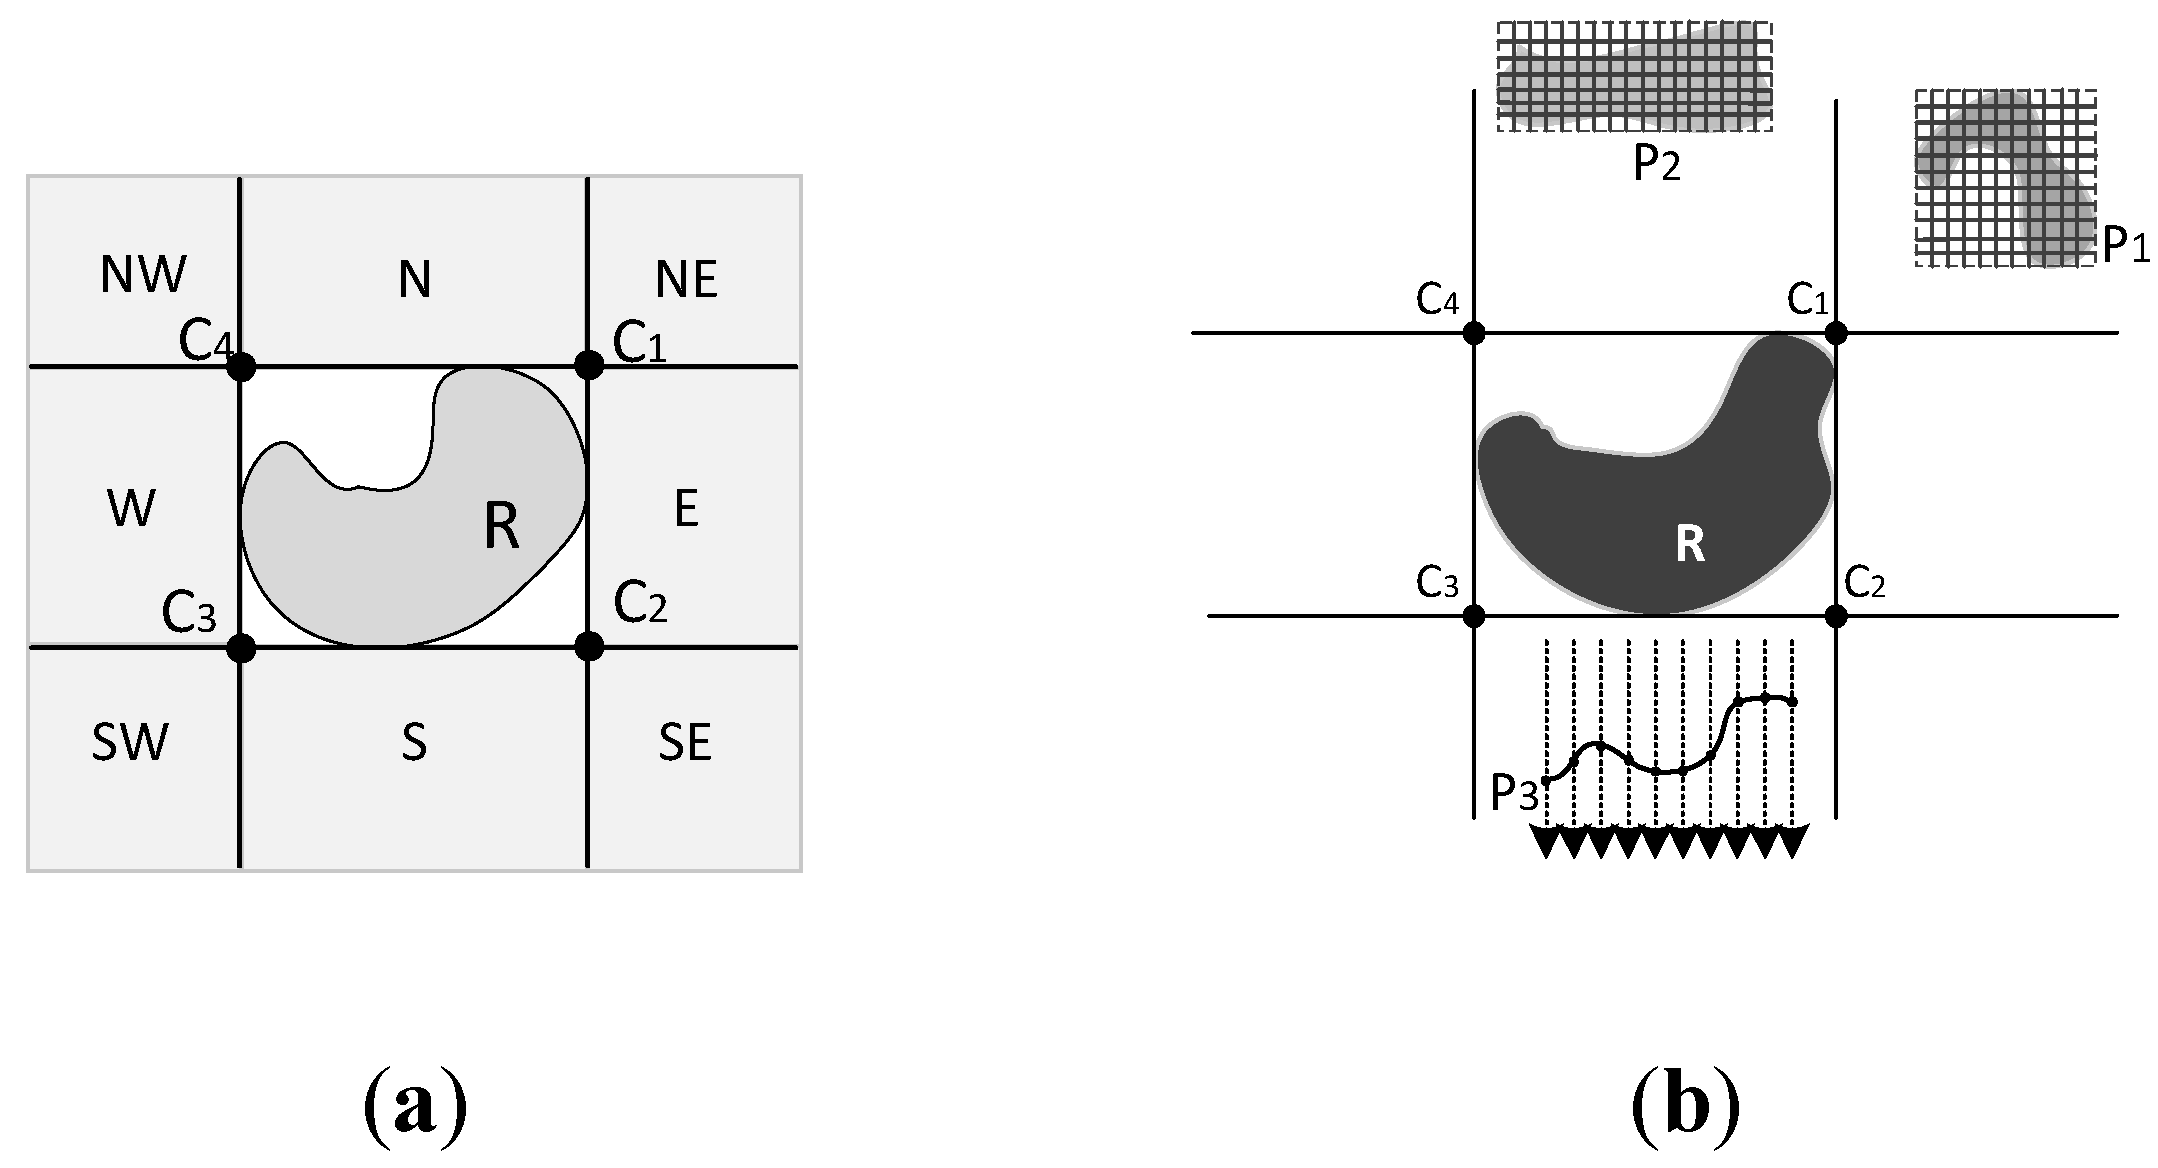
The basic direction-relation matrix model defines a 3*3 matrix, which captures a binary relation involving a reference object and a target object. The elements of the matrix are a non-empty subset of nine direction tiles {N, S, E, W, NE, SE, SW, NW, O}(Figure 2a). The detailed direction-relation matrix is an extended 3*3 matrix that records the neighborhood of the partition around the reference object and the ratio of the target object that falls into the tile. The direction-relation matrix model's directional segment partitioning aligns with human cognitive patterns for directional perception of extended reference objects. However, this model has been consistently criticized for its inability to distinguish directional relationship characteristics within the MBR (Minimum Bounding Rectangle), as the entire MBR is designated as a single directional segment O.
To distinguish directional relationship definitions within MBR (Minimum Bounding Rectangle), as shown in Figure 2b, a detailed directional relationship matrix partitions the MBR using its central region as the reference origin [9]. However, since using the MBR center as both the interior and boundary center contradicts cognitive conventions, Tang et al. (2014) [36] implemented topological partitioning within the MBR region and defined corresponding topological references for different topological regions (Figure 2c), thereby resolving the directional relationship description problem between objects with complex topological relationships. The granular partitioning of directional tile, while enhancing representational fidelity, necessarily incurs computational overhead. This presents a fundamental tension between expressive precision and algorithmic efficiency in direction-relation modelling. Practical implementation contexts necessitate the development of multi-scale directional relationship frameworks to address varying application requirements.
2.2. The multiscale pyramid model of cardinal directions
The direction-relation matrix and its extensions facilitate qualitative representation of spatial orientations across multiple scales. However, these models employ inconsistent partitioning schemas, thereby precluding inter-scale conversion between different representational frameworks. Tang et al. (2025) introduced a pyramid model that addresses the multi-scale properties of directional spatial relations across diverse application domains [38]. This hierarchical framework integrates and extends current spatial representation paradigms, establishing a comprehensive multi-scale direction-relation model capable of accommodating spatial entities with varying geometric typologies and precision requirements. As shown in Figure 3, firstly, it extends the direction-relation model of reference point by increasing the division from the basic directional tiles to segmentation directional tiles, thus enhancing the accuracy of qualitative directional description. Extending from the reference point framework, the pyramid model provides a dual-layer representational structure for extended spatial entities: the non-topological overall matrix and the topological local matrix. The overall matrix model evolves the direction-relation matrix within MBR into basic and segmentation matrices, treating the MBR of the reference object (line or polygon) as a unified entity while establishing directional partitioning with dual-level representational granularity. The local matrix derived from topological primitives performs topological segmentation and directional quadrant decomposition of the minimum bounding rectangle (MBR), thereby resolving directional relationship representation within complex topological configurations.
Concurrently, the hierarchical spatial representation framework generates dual model types: qualitative relation matrices and statistical distribution matrices, addressing requirements for spatial similarity assessment. Significantly, this novel framework implements adaptive transformation pathways between multi-resolution spatial models, enabling enhanced spatial relationship precision while maintaining computational efficiency and performance optimization.
Figure 4.
Targets at varying distances along the same ray.
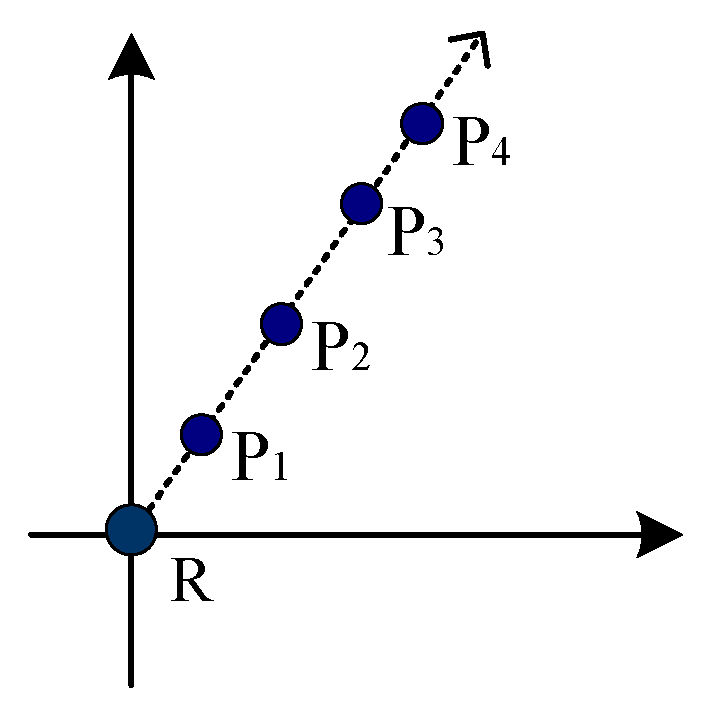
Direction-relation pyramid model employs segmentation matrices to expand cardinal direction granularity, partially addressing the definitional limitations within homogeneous directional tiles. However, both the pyramid framework and conventional direction-relation matrix implement discrete categorization schemes for directional relationship distribution, failing to capture the continuous gradients of spatial transitions that occur within the same directional tile. Hard classification frameworks fail to differentiate directional variations within identical directional tiles, irrespective of the quantity of cardinal directions employed. For instance, reference points P1 and P2 illustrated in Figure 2a both yield identical segmentation matrix classifications in the north-northeast quadrant.
The direction relation two-tuple model combines a grid-based direction relation matrix and a centroid-based direction relation matrix to characterize both the spatial distribution ratio variations and centroid positional shifts between spatial entities [10]. The two-tuple model addresses the issue of rigid classification by employing centroid-based angular to differentiate direction-relation variations within a single tile. However, its reliance on the centroid as the reference point for angle is inadequate when applied to concave polygons, where the centroid may not represent a meaningful spatial anchor. Furthermore, the model uniformly utilizes the centroid as the reference for all directional partitions, contravening the principle of distinguishing between distinct directional sectors. Additionally, it fails to resolve the ambiguity between targets located at varying distances along the same angular line.
3. Framework of multi-scale quantitative model relations
To address the constraints of descriptive granularity associated with hard classification in qualitative directional relations, we introduce two quantitative models for representing qualitative directional relationships across hierarchical levels, thereby facilitating multi-scale soft classification: the order matrix and the coordinate matrix.
The order matrix encodes the order characteristics of targets within the same directional tile, with sequence parameters varying across different tiles. For reference lines or polygons, azimuth is employed to capture the sequential features within combined directional tiles, while the distance to the central axis is used to represent the sequential characteristics within positive directional tiles.
The order matrix enables a quantitative description of directional sequence characteristics, addressing the soft classification of targets with different sequential features within the same tile. However, it remains ineffective for targets at different distances along the same radial direction. From a mathematical perspective, the angular representation corresponds to polar coordinates in a two-dimensional plane, where determining a point's position requires both angular and radial coordinates. Directional models based solely on angular values neglect the distance parameter. Consequently, regardless of how fine-grained the directional model's partitioning becomes, whether based on angles or sequential relationships, it cannot reflect the directional relationship differences between targets along the same radial line. On the other hand, this also reflects the constraints of distance relationships on directional relationship definitions, primarily manifested in the distinction of directional relationships between different points along the same radial direction: specifically, how varying distances from the directional reference origin influence the positional directional relationships.
Building upon the directional tiles of the multi-scale directional relationship pyramid model, we propose a novel direction-relation coordinate matrix model. This model facilitates the discrimination of targets at multiple radial distances within a unified directional axis and functions as a computational parameter for directional order matrices and other qualitative direction-relation matrices. Unlike the original direction-relation coordinate matrix, this new coordinate matrix incorporates directional tile partitioning derived from qualitative spatial relations, thereby establishing a quantitative representational structure for qualitative directional relationships.
The newly two-layer quantitative matrices preserve structural congruence with the multi-scale qualitative direction-relation pyramid model, specifically in terms of directional tile and matrix configuration. These matrices thus function as quantitative analogues to the qualitative matrices, enhancing the model’s representational fidelity. By embedding these quantitative matrix models within the existing pyramid framework, a novel integrated pyramid model is constructed. Figure 5 illustrates the pyramid model for reference point, wherein the first and second layers correspond to the qualitative matrix at distinct partitioning granularities, while the third and fourth layers represent the order matrix and coordinate matrix models, respectively. All four layers maintain uniform matrix structures and directional tile schemes, facilitating direct and lossless transformation between representations. Figure 6 delineates the extended pyramid model for reference lines and polygons, wherein the vertical stratification mirrors the partitioning logic of the reference point. The horizontal stratification is organized by topological region, encompassing the whole external, minimum bounding rectangle (MBR), the MBR exterior, boundary, and interior regions, with each region associated with matrices at varying descriptive resolutions.
The newly two-layer quantitative matrices maintain consistency with the existing multi-scale qualitative pyramid model in terms of directional tile and matrix structure, thus serving as a complementary quantitative representation to the qualitative description matrices. By integrating these two quantitative matrix models into the existing pyramid model, we build a new pyramid model. Figure 5 depicts the pyramid model for reference point, where the first and second layers represent qualitative matrix models at different scales of division; the third and fourth layers correspond to the ordinal matrix and coordinate matrix models respectively. Although the four layers are defined by different parameters, they share consistent matrix forms and directional tiles, enabling seamless interconversion. Figure 6 presents the new pyramid model for reference line/polygon, with vertical divisions similar to point reference object partitioning. The horizontal division is dimensioned by different topological regions, segmented into external, MBR whole, MBR exterior, boundary, and interior regions, with matrices defined at different descriptive scales for each region.
4. Order direction-relation matrix
4.1. Point as reference object
The order direction-relation matrix for reference point is a 3*3 matrix that records the azimuthal trend of the target object relative to the reference point.
Definition 1.
The order matrix of reference point is a 3x3 matrix that captures the partition around the reference point R and records for each tile, whether the target object falls into it (Equation 2). The element codes of , , , , and are binary values indicating whether the target object P intersects with the tiles or not. And the other element codes of , , , and (Formula 1) record the azimuthal trend in the combined directional tiles using the ratio of the coordinate offsets.
As shown in Figure 7, the element values of the northeast (), southeast (), southwest () and northwest () in the order matrix are the ratios of two direction offset values, reflecting the difference in the angular distribution in the four combined direction tiles. The sequential distribution of these four tiles is mainly angularly referenced, assuming that the reference point and the target point , four order parameters are defined as:
Since the order matrix only considers ordinal distribution relationships, for line or polygon targets, as shown in Figure 8a, the order matrix essentially records the fan-shaped regions of directional angle distributions within different directional tiles. Therefore, we must first calculate the tangent values of the angles formed between each node point of the line or polygon boundary and the reference point, then sort these values to determine their range. As shown in Figure 8b, the elements of the combined directional tiles within the order matrix for the polygon target are represented by a value range corresponding to this fan-shaped region.
4.2. Line/Polygon as reference object
For the reference line/polygon, nine directional tiles are classified based on the direction-relation matrix model. According to the directional tile frame in the multi-scale pyramid model, we analyze the directional order characterization of the outer MBR (Exterior) and the MBR region (MBR) separately, and build the order matrices.
4.2.1. Exterior region
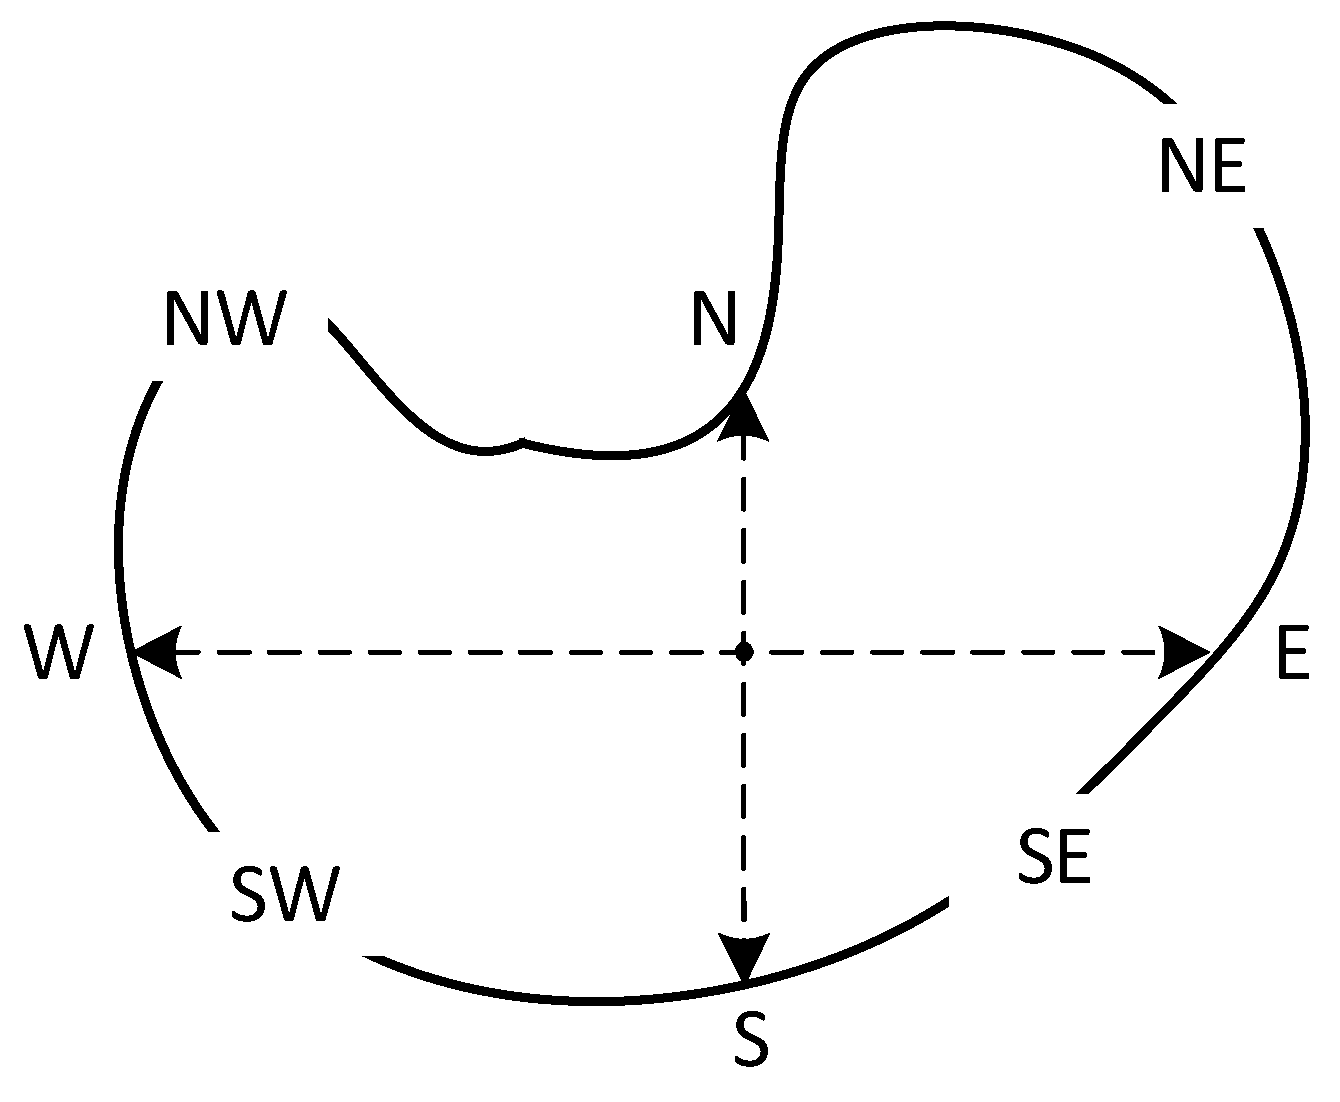
Relative to the point reference target, the external four main directional tiles of reference line/polygon also need to be soft categorized. According to the cognitive habit, the trend of the directional order of the line-plane reference target is shown in Figure 9, so we adopt the distance as the soft categorization parameter for the positive direction slices, while the angle factor is used as the soft categorization parameter for the combined direction tiles.
Let the four endpoints of the MBR of the reference target and their coordinates be , , , and , respectively, then the direction relation order matrix of the external region of the MBR is:
Definition 2.
The order matrix of reference line/polygon is a 3x3 matrix that captures the partition around the reference point R and records for each tile, whether the target object falls into it (Equation 3). The order parameters , , and of the cardinal directional tiles are the distances from the target to the centerlines of the directional tiles (Formula 4), reflecting the tendency in positive and negative terms. And the order parameters of the combined directional tiles , , , and are the angles from the target point to the starting ray of this directional tile, and for the convenience of calculation, the sine of this angle is used to replace the angle (Formula 5).
As shown in Figure10a, the two-tuple model [10] employs mean centroid azimuth to represent quantitative distributions across directional tiles, presenting several limitations: 1) Centroid azimuths utilize the centroid as the reference origin, which may fall outside the reference polygon, contradicting cognitive conventions; 2) All objects within different directional tiles use the centroid as their reference origin, violating the fundamental principle of projection-based model; 3) Substituting actual angular distribution ranges with mean centroid azimuths compromises expressive precision.
For line or polygon targets, similar to point-line/polygon, we use the origin of each directional tile as the reference origin point to determine the order distribution range of the tile. For combined directional tiles, this manifests as a fan-shaped region, while for cardinal directional tiles, it presents as a linearly distributed area (e.g. P2 in Figure10b).
Figure 10.
Comparison of order matrix and centroid azimuth matrix: (a) Centroid azimuth Matrix; (b) Order matrix.
Figure 10.
Comparison of order matrix and centroid azimuth matrix: (a) Centroid azimuth Matrix; (b) Order matrix.
4.2.2. MBR region
Based on the idea of the multiscale pyramid qualitative model for cardinal directions, there are two different ways of dividing directional tiles and defining matrices for the MBR region. If we focus on the overall distribution of the target and ignore the topological division of the reference target, and take the center of the MBR as the reference point to divide the MBR into four ray directions and four faceted direction slices, the form of the corresponding sequential direction relation matrices is similar to that of the sequential direction relation matrices of the point reference target. If we are concerned about the local boundary distribution of the target, we have to do the topological division first, and then construct the order matrices of different topological regions separately.
- MBR overall order matrix
The overall order matrix focuses on the overall distribution range of the reference line/polygon, ignoring the effect of topological division, and divides the MBR into four ray direction and four face direction slices by taking the center of the MBR as the reference point, the center point of the MBR is equivalent to the point reference, and its order direction-relation matrix is similar to that of the order matrix of the reference point target, that is:
Definition 3.
The MBR overall order matrix of reference line/polygon is a 3x3 matrix that captures the partition around the center of the reference line/polygon’s MBR region and records for each tile, whether the target object falls into it (Equation 6). The element codes of , , , , and are the same as those in the basic matrix. the order parameters in the combined directional tiles, , , , and , are calculated with the center of the MBR as the origin, refer to Equation 1.
Figure 11.
Directional tiles of MBR overall order matrix for reference polygon.

The computational methodology for line or polygon targets follows the same approach for reference points.
- 2.
- Local order matrix
If the target is mainly distributed in the MBR region and the local boundary influence of the reference target is to be considered, based on the idea of the third level of local direction relation matrix model in the pyramid model, the MBR region is divided into three topological parts, namely, the MBR exterior, the boundary, and the interior, and the corresponding local order matrices are constructed respectively.
The directional tiles of the three regions are defined as follows:
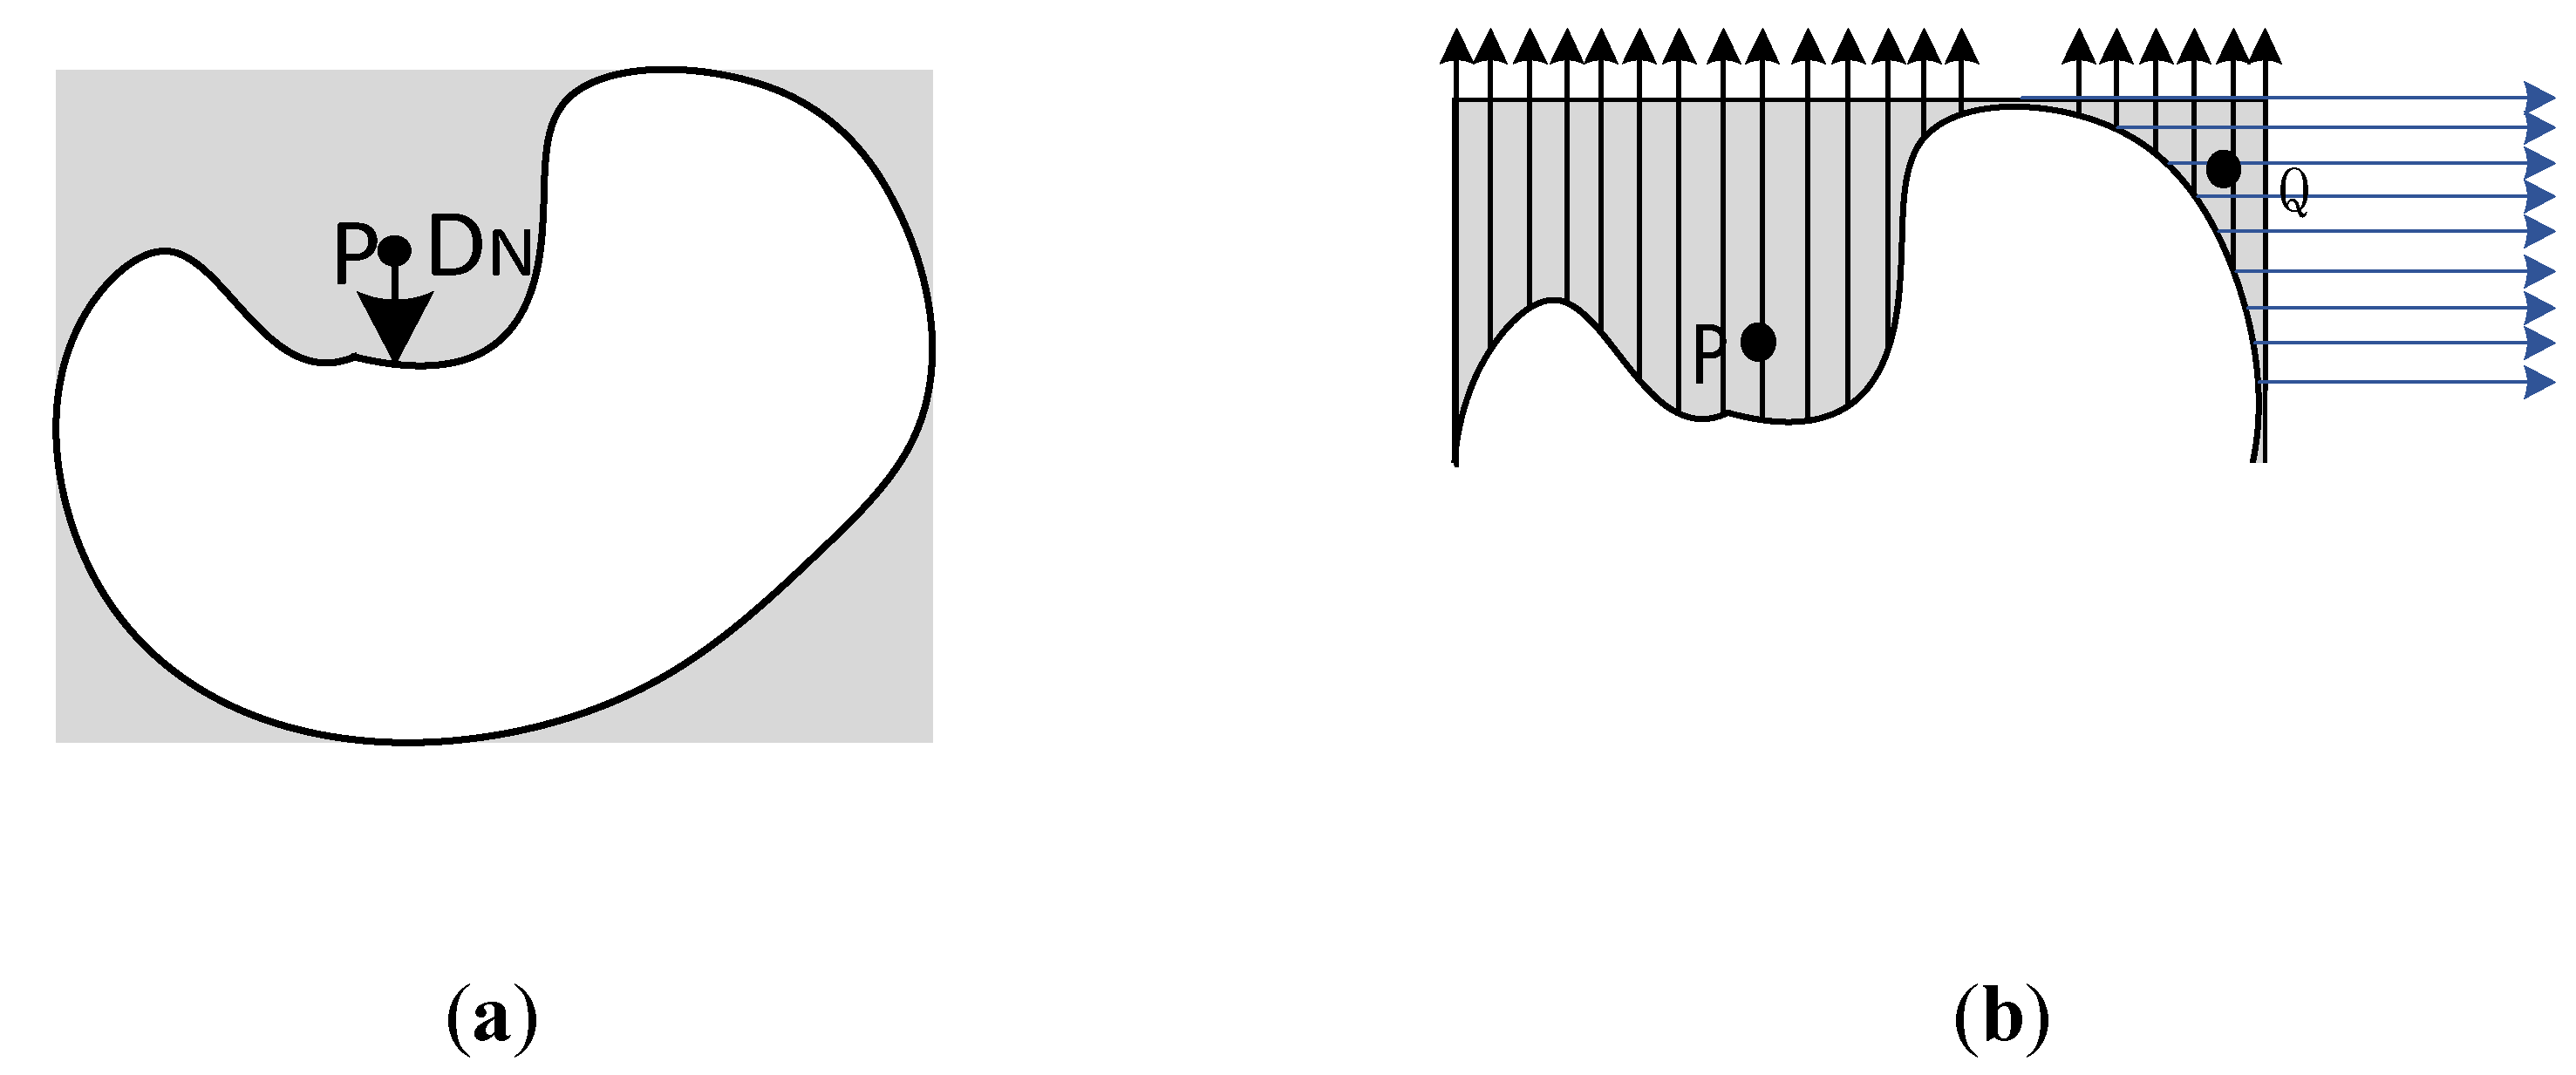
- MBR exterior
This region lies outside the reference polygon but within the MBR. Its direction-relation character is influenced by the local boundary of reference object. The projection distance is defined based on the four cardinal directions. Referring to the local direction relation matrix model, we divide the boundary of the reference object into four segments along the cardinal directions: east, south, west, and north. Each part of the boundary corresponding to a cardinal direction consists of the points with the maximum value of the reference object in that cardinal direction. The projection distance of a target point is defined as its projection distance to the corresponding cardinal direction boundary.
Let the projected distances of the target point in each of the four main directions be , then the order matrix of the MBR exterior is:
Definition 4.
The MBR exterior order matrix is a 3x3 matrix that captures the partition of the exterior area around the reference line/polygon and records the directional relationship between the target object and the neighboring local boundary of the reference object (Equation 7). Where the combined directional element is the ratio of the two projection distances, the rule for taking the value on the cardinal direction ray region is that if the projection distance of this cardinal direction is non-zero, then the element of this main direction is one.
Figure 12.
Projection distance of MBR exterior region: (a) Projection distance of cardinal direction; (b) Projection distance of combined direction.
Figure 12.
Projection distance of MBR exterior region: (a) Projection distance of cardinal direction; (b) Projection distance of combined direction.
For line or polygon targets, projection distances of boundary node points are first calculated point by point, followed by statistical analysis of the projection distance ranges within different directional tiles.
- Boundary
Referring to the pyramid model idea, when the target object falls into the boundary or interior region, for the reference concave polygon, if the controid or the center of MBR is used as the reference point to divide the directional tile, the center may fall outside the reference object. Therefore, the inner center [36, 38] based on the skeleton line algorithm [39, 40] is computed and used as the reference point to define the boundary order matrix and the inner order matrix.
The boundary of the reference line is constituted by the two nodes of the line. The boundary of the reference polygon is its boundary line.
Definition 5.
The boundary order matrix is a 3x3 matrix that captures the directional partition for the boundary of the reference line/polygon (Equation 8). The element codes of , , , , and are binary values indicating whether the target object P intersects with the tiles or not. And the other element codes of , , , and (Formula 1) record the azimuthal trend in the combined directional tiles using the ratio of the coordinate offsets (based on the interior center as the reference point).
where the order parameters are calculated in a similar way to those for reference point.
Figure 13.
Directional tiles of boundary order matrix for reference polygon.
- Interior
As shown in Figure14, the partition of directional tiles facilitates the construction of a 3x3 matrix to capture the interior order direction-relation.
Definition 6.
The interior order matrix is a 3x3 matrix that captures the directional partition for the boundary of reference line/polygon (Equation 8). The element codes of , , , , and are binary values indicating whether the target object P intersects with the tiles or not. And the other element codes of , , , and (Equation 1) record the azimuthal trend in the combined directional tiles using the ratio of the coordinate offsets (based on the interior center as the reference point).
Figure 14.
Directional tiles of interior order matrix for reference polygon.
For line or polygon targets, the boundary and interior matrices are calculated with the interior center as the origin, employing the same computational methodology as used for reference point.
5. Coordinate matrix
5.1. Point as reference object
Based on the preceding analysis, the coordinate description can reflect projection values along different cardinal directions. Therefore, four cardinal directions are sufficient to comprehensively represent directional relationships in two-dimensional space, denoted as . As illustrated in Figure 12, the positive X-axis aligns with the east direction while its negative counterpart corresponds to west; the positive Y-axis aligns with north while its negative counterpart corresponds to south. The four cardinal directions essentially divide the two coordinate axes into two pairs of opposing directions. The directional coordinates for one target point are defined as follows:
Definition 7.
Given a reference point with two-dimensional coordinates and a target point P with coordinates , the directional coordinate of P is represented by the directional coordinate quaternion . The cardinal directional coordinates are calculated as Equation 9:
For linear or polygon targets whose distribution spans multiple directional tiles, we define a directional coordinate matrix corresponding to the qualitative directional relationship matrix (Definition 8).
Definition 8.
The directional coordinates for line/polygon targets begins with equidistant discretization, converting the object into a set of target point. Given a target object with a set of two-dimensional discrete point coordinates and a reference object with the coordinate , the directional coordinates matrix is represented by the Equation 8.
Where the coordinate parameters for different directional tiles are calculated as follows:
The coordinates for the four cardinal direction tiles are:
: , ;
: ;
: ;
: .
The four parameters , , , and are the numbers of discretized points within different directional tiles. Consequently, the elements in the coordinate matrix of linear and areal features contain directional coordinate data comprising multiple coordinate values. During spatial analysis and semantic extraction, these arrays can be directly utilized for computation, or alternatively, they can be transformed into mean values or other statistical indicators.
The coordinates for the four combined direction tiles are:
: ;
: ;
: ;
: .
Where the four parameters , , , and are the numbers of discretized points within several combined directional tiles. Unlike single coordinate sets of cardinal directional tiles, combined directional coordinates incorporate coordinate sets from two cardinal directions.
Using the reference point as the origin point, the corresponding directional coordinates are calculated. The calculation of directional coordinates follows Equation 9.
As shown in Figure 15b, since line targets are one-dimensional, uniform discretization at equal intervals along the x-coordinate direction is performed, followed by sequential calculation of the directional coordinates for each discrete point in the set.
For two-dimensional polygon objects, as shown in Figure 15c, uniform gridding is first applied, followed by the calculation of directional coordinates for each grid point.
5.2. Line/Polygon as reference object
The topological partitioning is initially performed based on reference lines or polygons. Drawing from the qualitative pyramid model concept, the topological partitioning first divides the space into two segments: the exterior and the Minimum Bounding Rectangle (MBR). Using directional sector origins and the MBR center as reference points, coordinate matrices are constructed for both the exterior region and the complete MBR. When the target object falls within the MBR and topological references need to be considered, the MBR is further subdivided into three distinct tiles: MBR exterior, boundary, and interior. Corresponding coordinate matrices are then constructed using local boundary points and the interior center as reference origins.
5.2.1. Exterior region
For regions outside the Minimum Bounding Rectangle (MBR), based on the partitioning concept of direction-relation matrix, the space is divided into nine tiles with the MBR as the center. For objects falling within each directional sector, as shown in Figure 14, the directional coordinates are calculated using the boundary points of each tile as reference origins. Using the sets of directional coordinates of objects within each sector as matrix elements, the external directional relationship coordinate matrix is defined as follows:
Definition 9
. The exterior coordinate matrix is a 3x3 matrix (Equation 12) that records the distribution of cardinal directional coordinates for target objects across different exterior directional tiles. The coordinate matrix elements represent the coordinate sets of the target's discrete point set in the directional tile along two cardinal directions.
Assume that and represent the boundary points of the four combined tiles: Northeast (NE), Southeast (SE), Southwest (SW), and Northwest (NW), the coordinate parameters for different directional tiles are calculated as follows:
The coordinates for the four cardinal direction tiles are:
: ,where ;
: ,where ;
: ,where ;
: ,where .
The coordinates for the four combined direction tiles are:
: , where ;
: , where ;
: , where ;
: , where .
Figure 16.
Directional coordinates for exterior region: (a) The original points of different tiles; (b) Discretization strategy for line and polygon targets.
Figure 16.
Directional coordinates for exterior region: (a) The original points of different tiles; (b) Discretization strategy for line and polygon targets.
As shown in the Figure16b, the discretization method for line and polygon targets is similar to that of reference point, with the key distinction being the different reference origins for each directional tile (Figure16a).
5.2.2. MBR region
- MBR overall coordinate matrix
Taking the MBR region as a unified entity, the overall directional coordinates within the MBR are calculated using its centroid as the origin point.
Definition 10.
The MBR overall coordinate matrix is a 3x3 matrix (Equation 14) that records the distribution of cardinal directional coordinates for target objects across different MBR directional tiles. The coordinate matrix elements represent the coordinate sets of the target's discrete point set in the directional tile along different cardinal directions.
Similar to point reference targets, coordinate parameters in the formula are calculated using the MBR center as the origin point.
- 2.
- Local coordinate matrix
Based on topological reference, the Minimum Bounding Rectangle (MBR) is partitioned into three distinct regions, namely the exterior, MBR exterior, boundary, and interior matrices.
Since directional relationships for MBR exterior region are defined by local boundaries of reference object, projection distances are directly utilized as directional coordinates.
Definition 11.
The MBR exterior coordinate matrix is a 3x3 matrix (Equation 11) which represents the directional coordinates within the MBR exterior region. The elements of the matrix are the projection distance of the target on the local boundary of the reference object.
Definition 12.
The boundary coordinate matrix is a 3x3 matrix (Equation 12) which records the distribution of cardinal directional coordinates on the boundary of the reference. The origin center of the boundary direction tiles is the interior center.
Definition 13.
The interior coordinate matrix is a 3x3 matrix (Equation 13) that records the distribution of cardinal directional coordinates for the target with the directional tiles inside the reference object. The origin center of the boundary direction tiles is the interior center.
Taking the interior as a reference point, the calculation of boundary coordinate matrix and interior coordinate matrix follows a similar approach to the coordinate matrix of reference point.
6. Experimental evaluations
6.1. Expressive Power Analysis and Evaluation of Multi-Scale Quantitative Model Description Accuracy
To validate the expressive capability and completeness of the new model, three sets of simulation data precision experiments were conducted. These experiments utilized the target object rotation, translation, and special scenarios within the same directional section to verify and compare the accuracy and completeness of the new model against other models.
6.1.1. Rotate the target around the reference polygon
Figure 14 illustrates the scenario of a target object rotating around a reference object and the corresponding sequential matrix description results. The table presents the sequential matrices and other matrix description results for different scenarios. Due to space constraints, only the matrices for two directional slices are listed.
Due to the implementation of soft classification parameters in sequential matrices, it is possible to distinguish targets along any different radial directions within the same directional segment—a capability that hard classification methods cannot achieve.
Figure 17.
The target object P moves around the MBR of the reference object R.
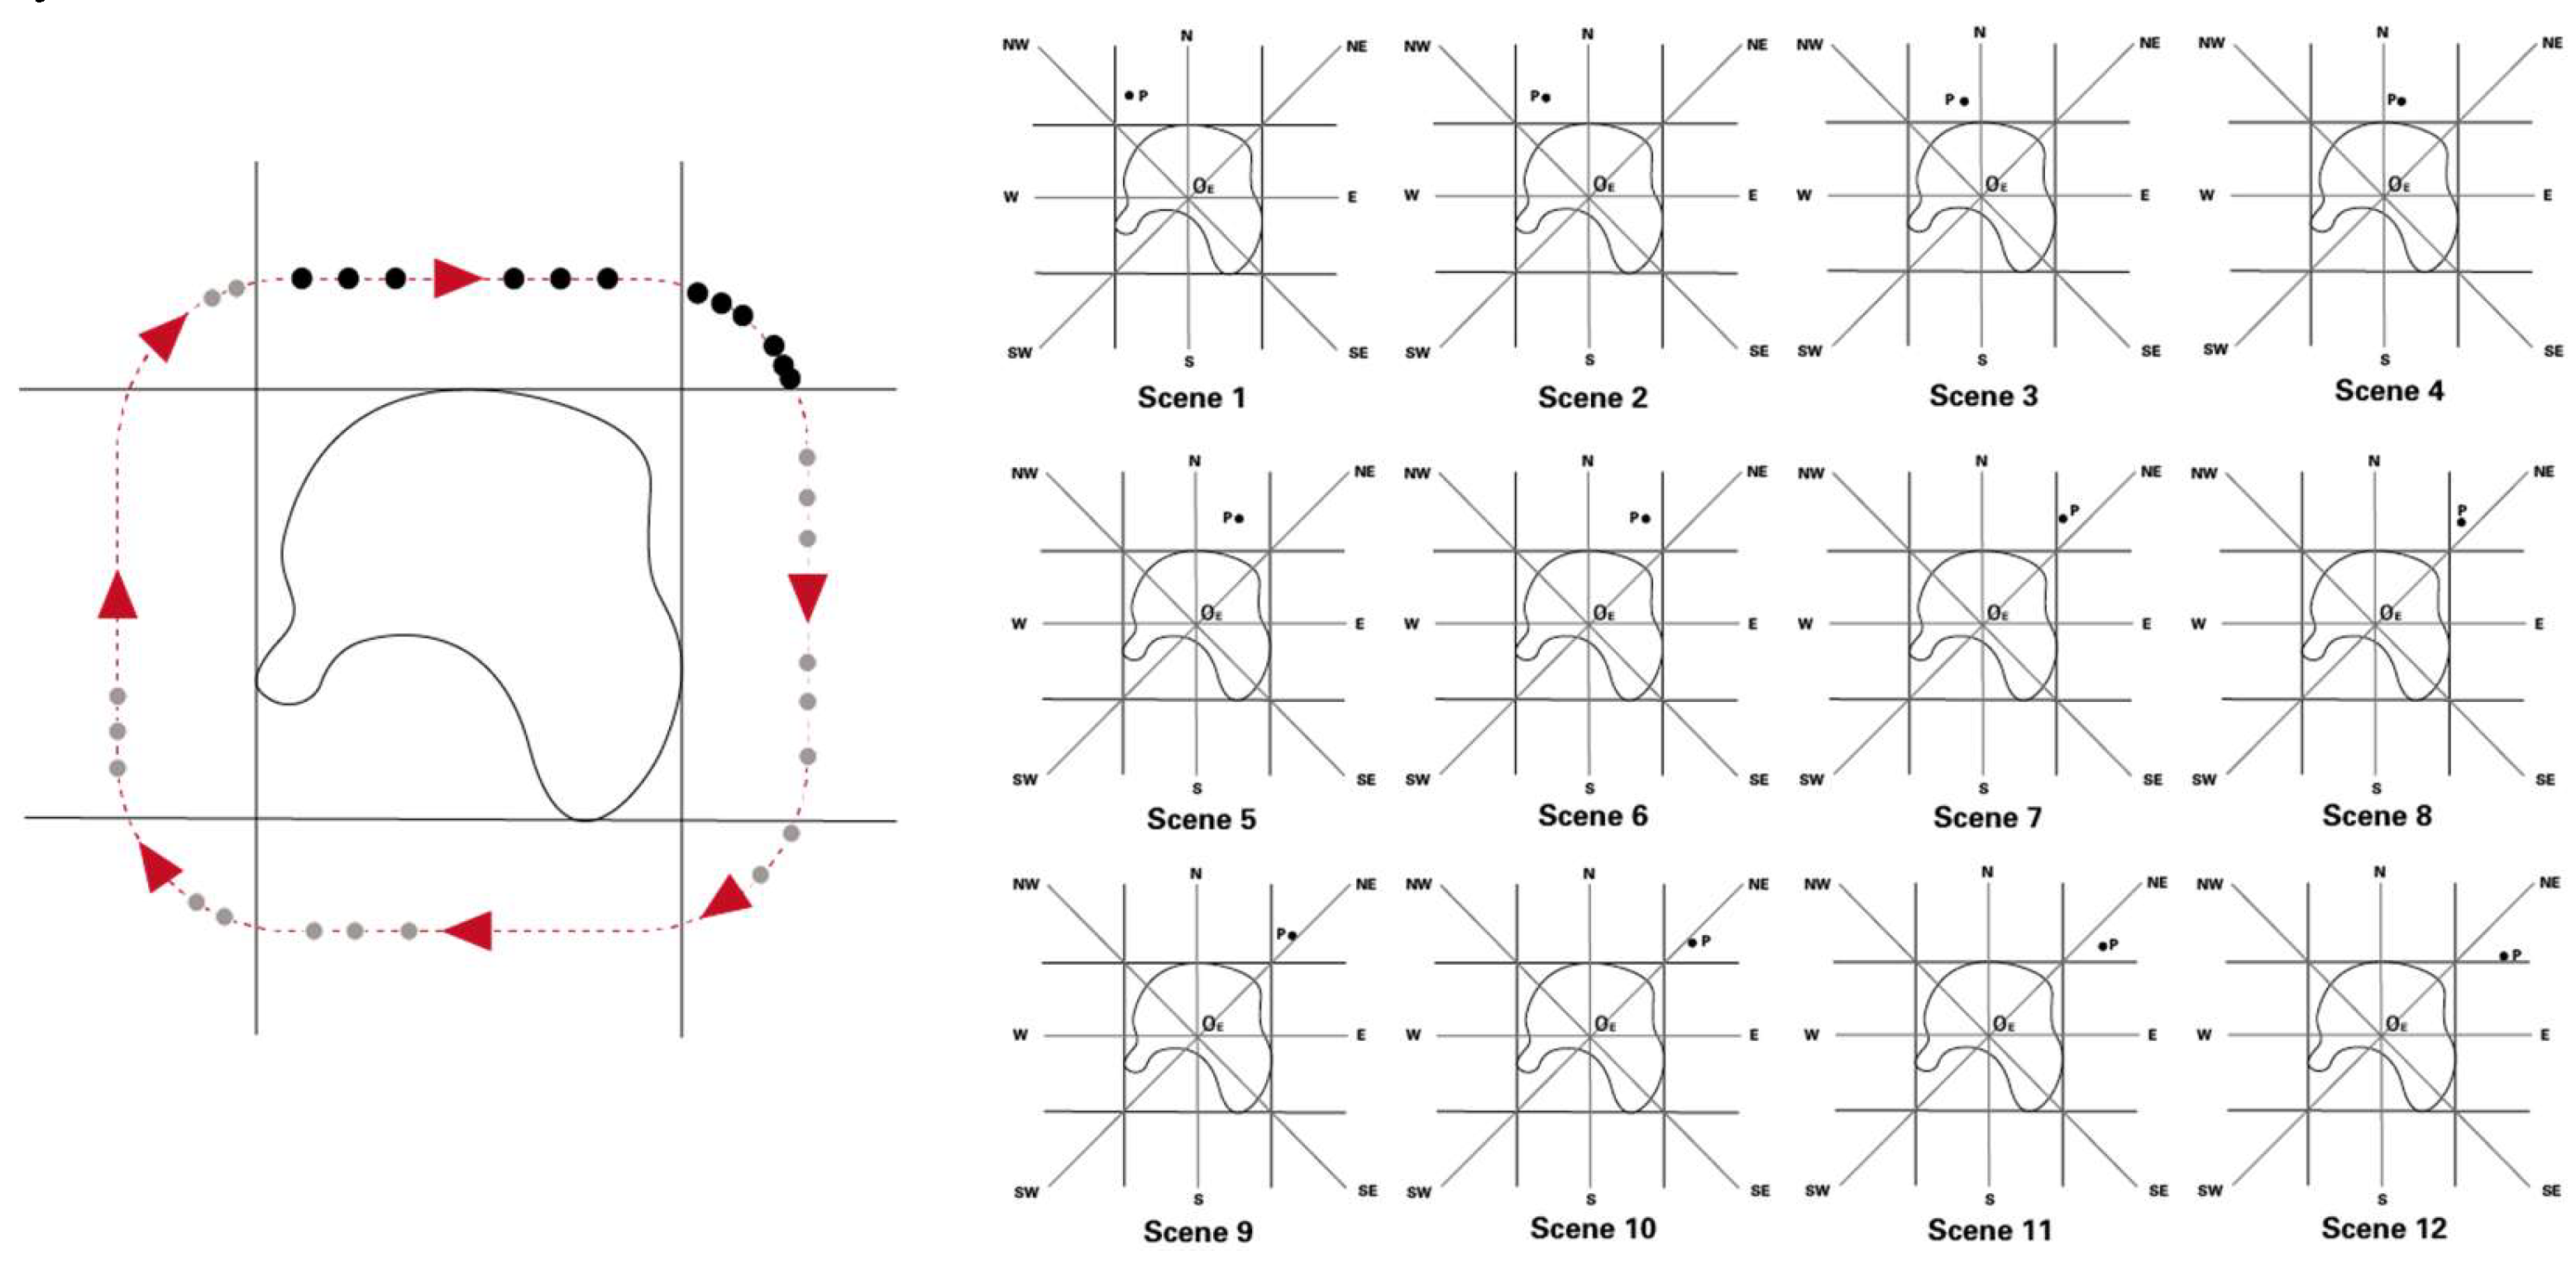
The qualitative matrix model utilizes a rigid classification approach for orientation segments, which constrains its capacity to discern orientation differences within an individual segment, irrespective of segmentation granularity. Conversely, the quantitative matrix model adopts a probabilistic, or soft, classification framework, facilitating the detection of directional heterogeneity among distinct targets within the same orientation segment. As a result, the qualitative model is confined to a limited set of distinguishable scenarios, while the quantitative model, in principle, accommodates an unlimited spectrum of scenarios.
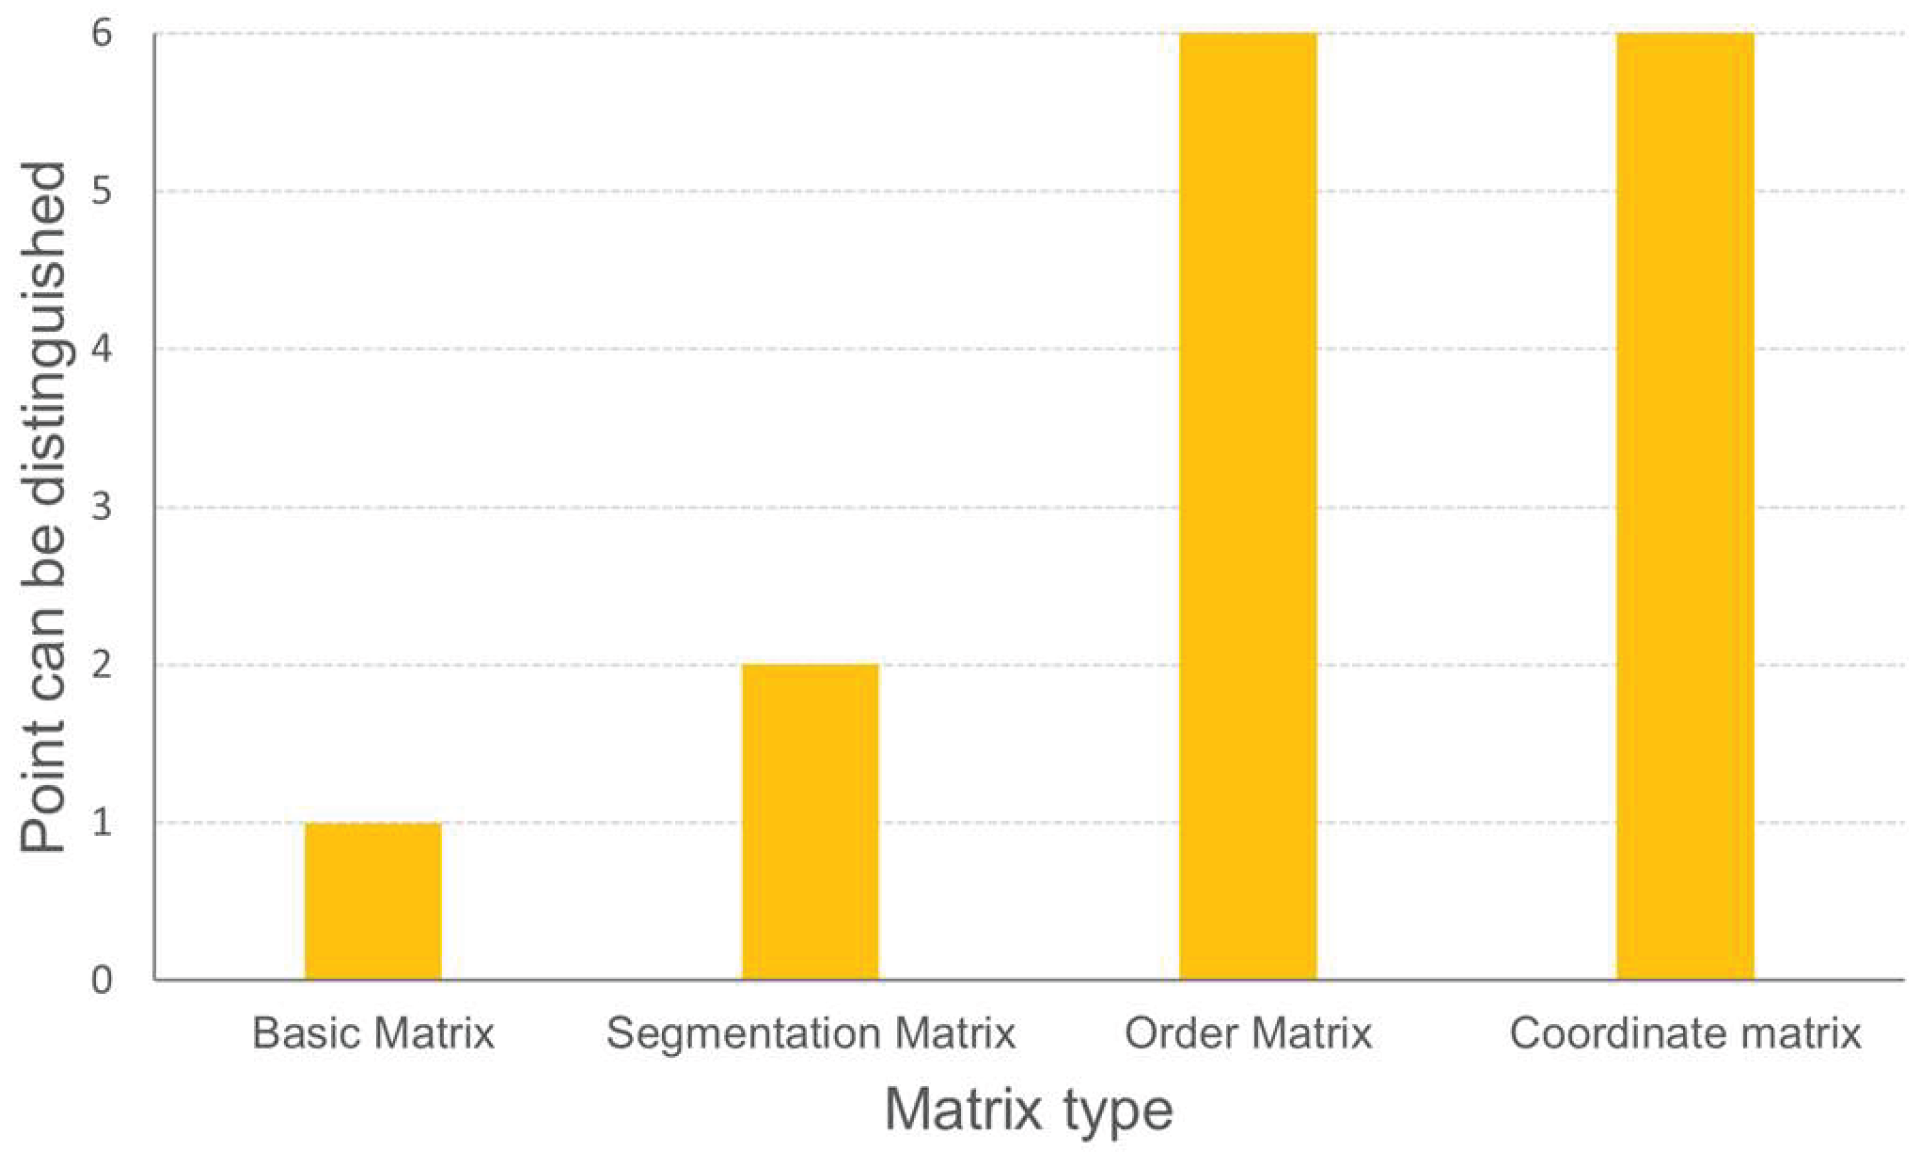
As demonstrated in Figure 18 and Table 1, the qualitative matrix values remain consistent across scenarios 1 to 6, as the target is located within the same directional sector. In contrast, the quantitative sequential matrix provides a more granular distinction, capturing subtle variations in target direction among these six scenarios. Figure 16 visually illustrates the differences in discriminatory capacity and comparative performance among diverse qualitative and quantitative models. The data clearly demonstrate that quantitative descriptive models exhibit substantially greater discriminatory power than their qualitative counterparts.
Figure 18.
Comparison of Direction-Relations Description Accuracy Across Different Models.
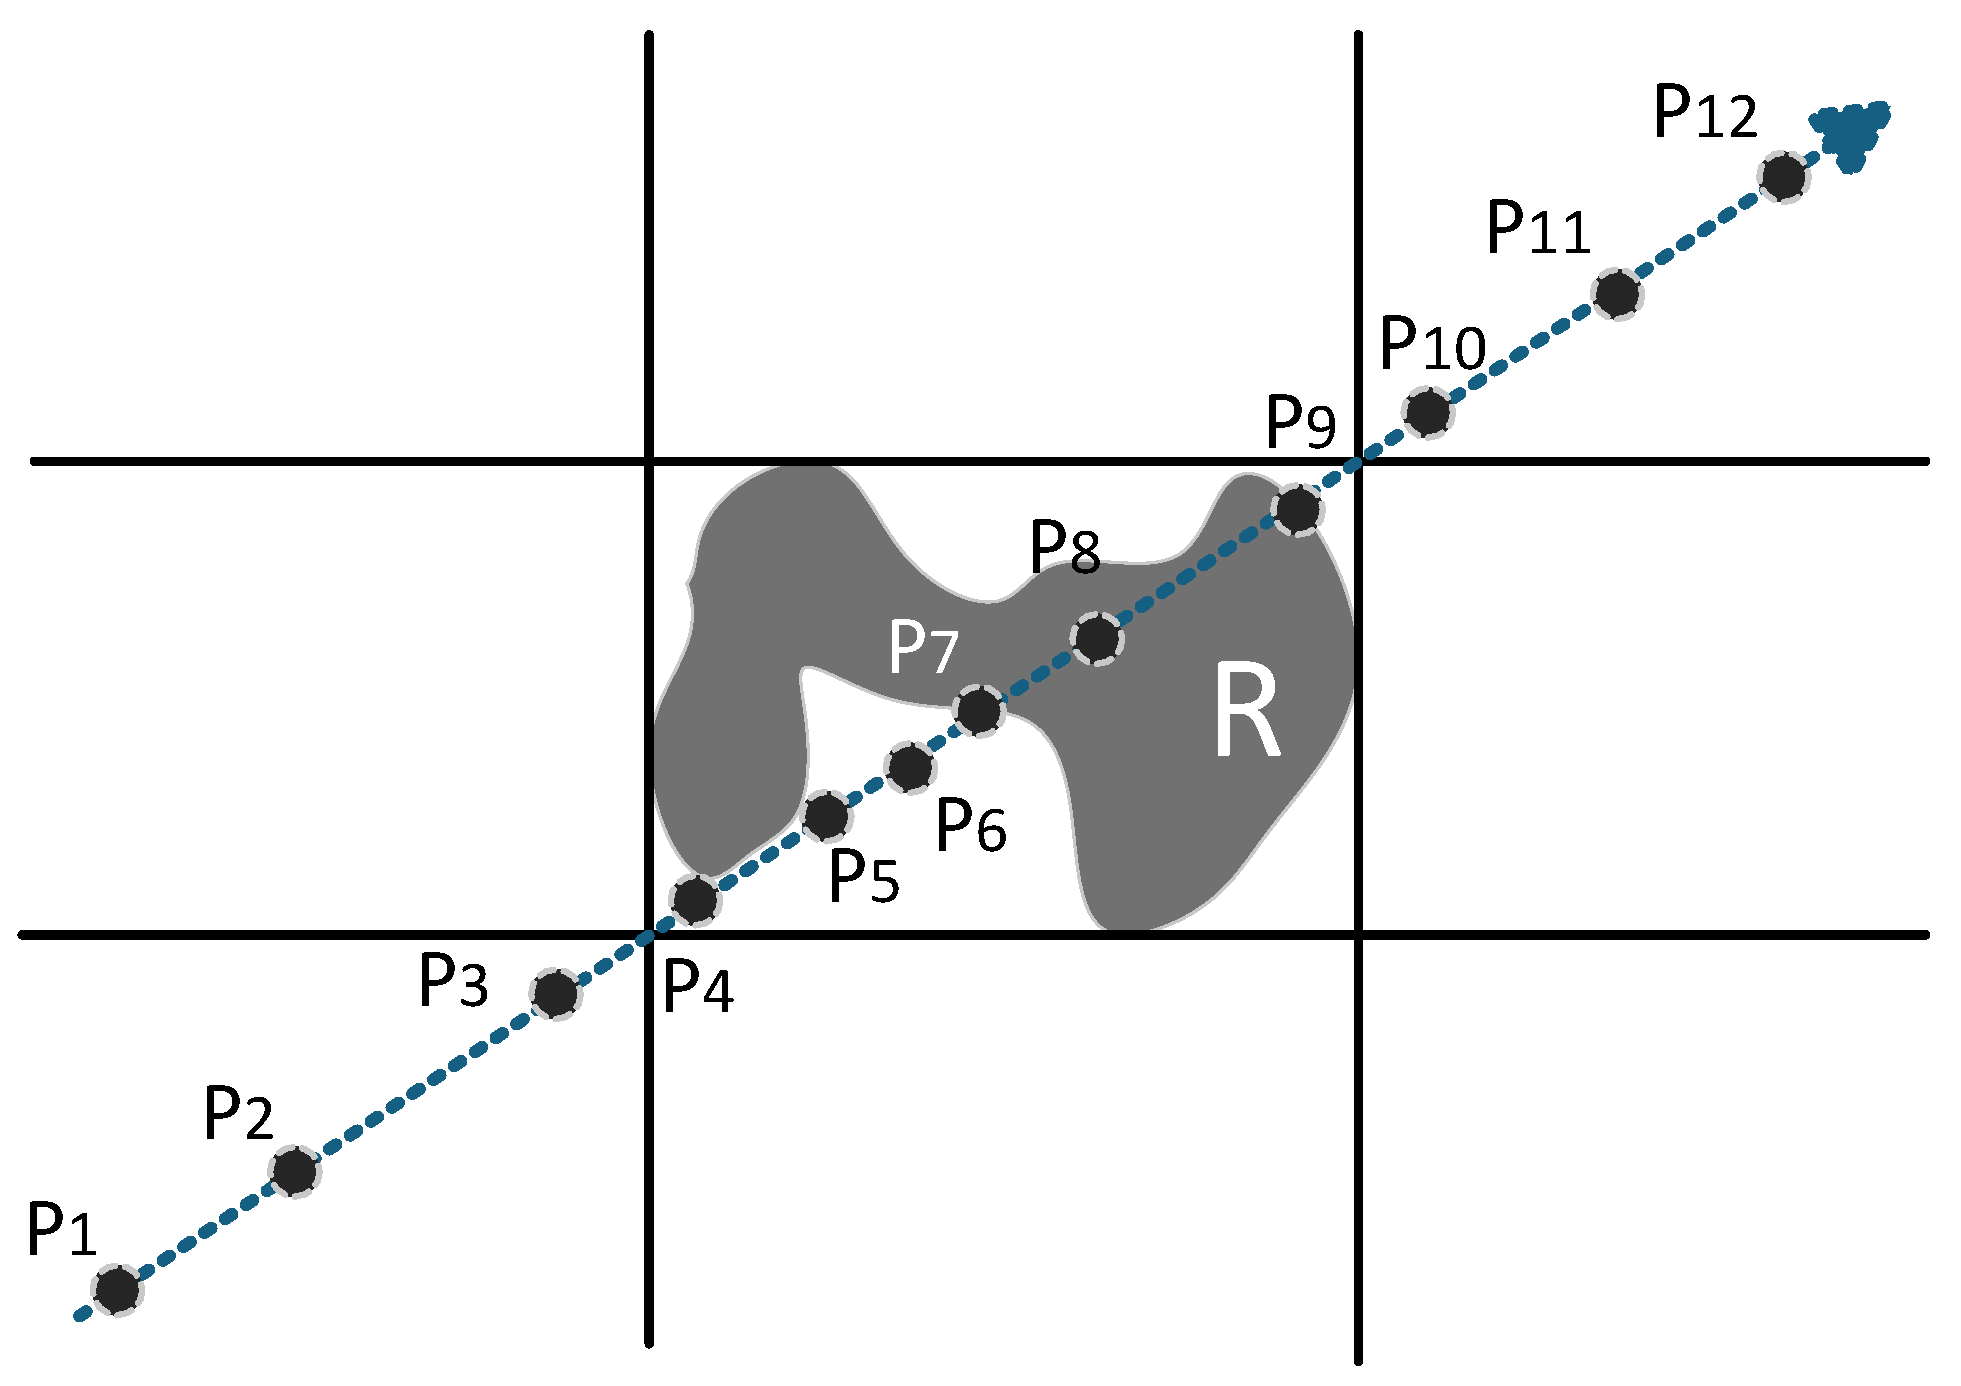
6.1.2. Moving the target across the reference polygon
The quantitative matrix models of cardinal directions operate at two distinct levels: the order matrix and the coordinate matrix, each offering unique focal points and resolutions. Order matrices emphasize the sequential properties of directions, employing angular measurements and coordinate offsets to parameterize the sequential distinctions among targets. However, they are limited in their ability to differentiate directional variations along the same ray. In contrast, coordinate matrices articulate directional attributes through spatial coordinates, concentrating on projection distances along various principal axes. This approach enables the discrimination of directional offsets along the same ray, though it does not directly capture sequential properties. From a theoretical standpoint, coordinate matrices provide greater directional descriptive accuracy compared to order matrices, although their respective domains of application are distinct.
As illustrated in Figure 16, the target point P undergoes translation along a consistent ray trajectory from the southwest to the northeast directional tile. Throughout this process, the target point not only maintains its translation within the same directional sector but also traverses multiple topological domains. This movement enables the validation of the coordinate matrix’s soft classification performance.
As demonstrated in Table 2, the experimental findings robustly confirm that the coordinate matrix effectively addresses the challenge of directional feature representation for distinct targets aligned along the same ray. Moreover, by maintaining the structural integrity of the qualitative directional relationship matrix, the coordinate matrix is capable of simultaneously capturing both the directional sector and the topological region occupied by the targets.
Figure 19.
The target object P moves across the MBR of the reference object R along the same ray direction.
Figure 19.
The target object P moves across the MBR of the reference object R along the same ray direction.
6.2. Application experiments
Directional relations constitute the predominant method for expressing relative spatial positioning in natural language. The extraction of directional relation components and the facilitation of directional relation queries via formalized modeling represent critical research directions for endowing computational systems with imprecise spatial reasoning abilities. The innovative pyramid model of directional relations synthesizes topological and metric relationships across hierarchical levels, establishing a multi-scale framework for primary direction representation that bridges quantitative and qualitative domains. This approach effectively addresses the requirements for multi-scale directional relation modeling in diverse application contexts.
To further substantiate the viability of the proposed model and assess its scalability across multiple resolutions, we develop a natural language-driven fuzzy query system for directional relationships, enabling a wide range of imprecise directional relation queries.
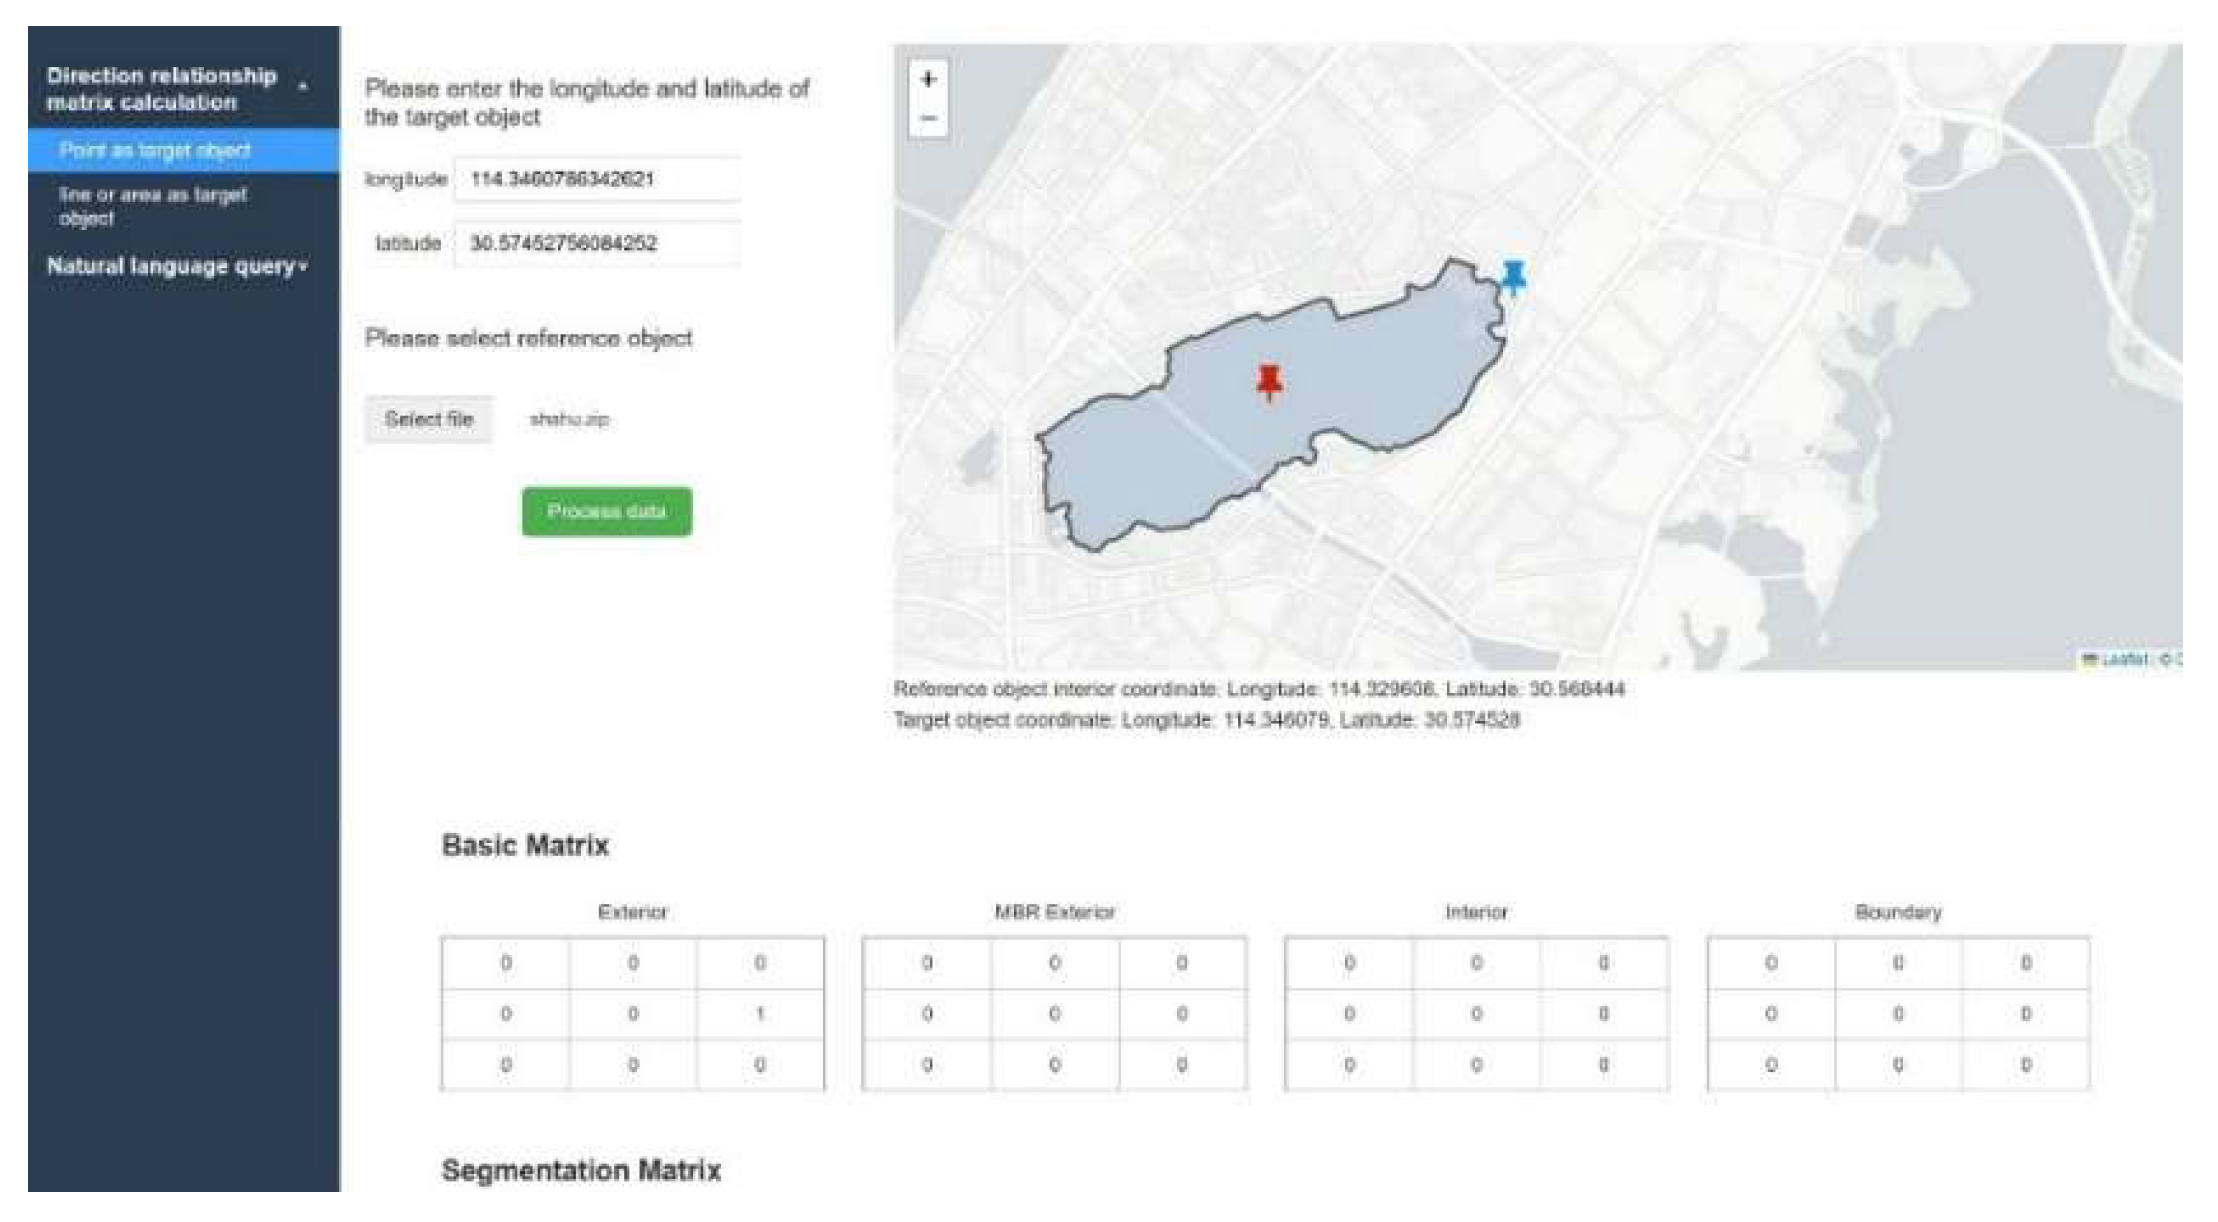
The initial query approach entails designating both the reference and target objects to compute the associated directional matrix outcomes. This functionality principally facilitates the calculation and comparative analysis of matrices across various hierarchical levels within the multi-scale model. As illustrated in the figure, users define the reference and target objects by entering their respective coordinates, prompting the system to generate the corresponding matrix descriptors.
Figure 20.
Example of multi-scale direction-relations matrices.
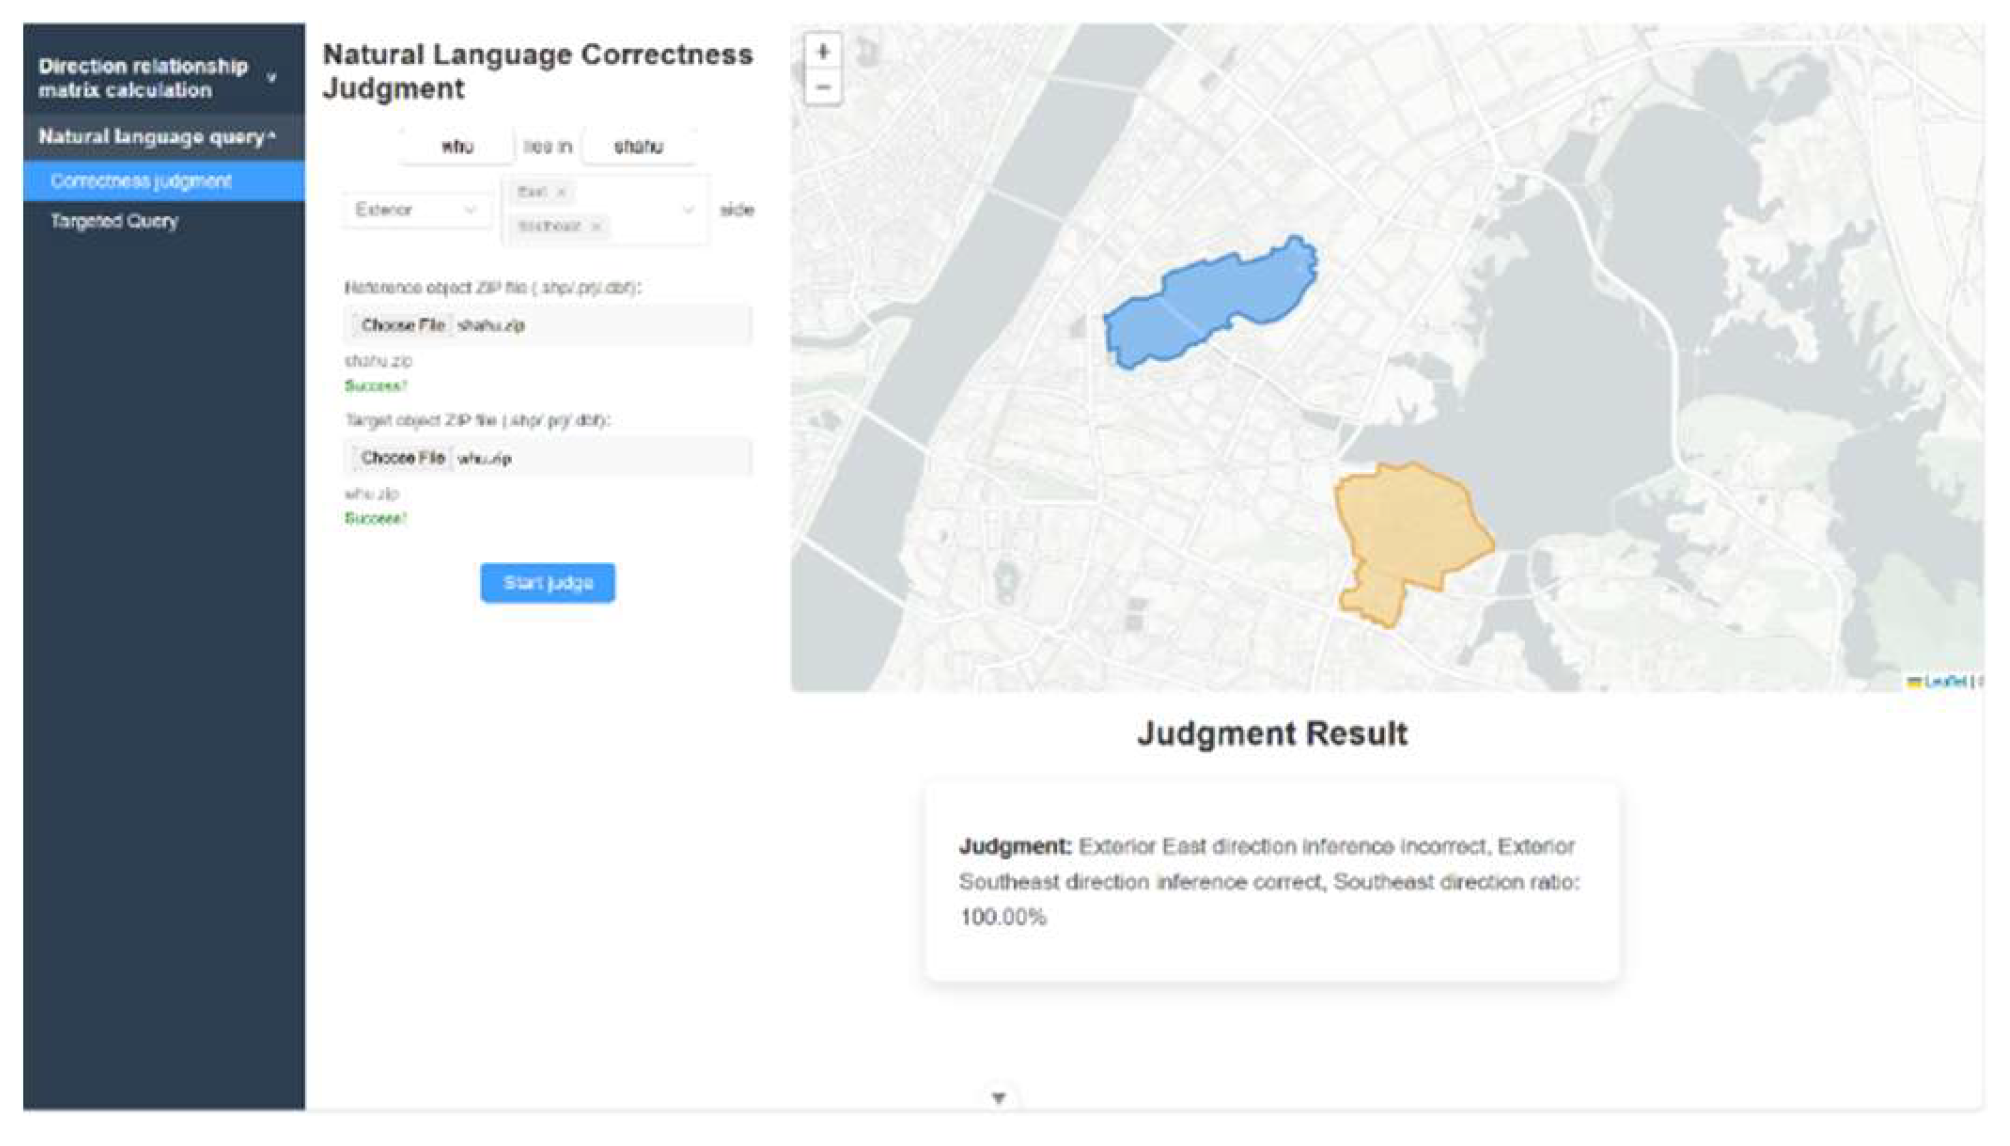
The second approach entails assessing the validity of user-submitted directional relationship assertions. For instance, when a user states, "Wuhan University is located to the southeast outside of East Lake," the system computes directional attributes based on the specified reference and target entities to verify the statement's accuracy. As illustrated in the figure, the final evaluation confirms the statement's correctness—Wuhan University is unequivocally situated to the southeast of East Lake.
Figure 21.
Correctness judgment of directional relationship features based on natural language.
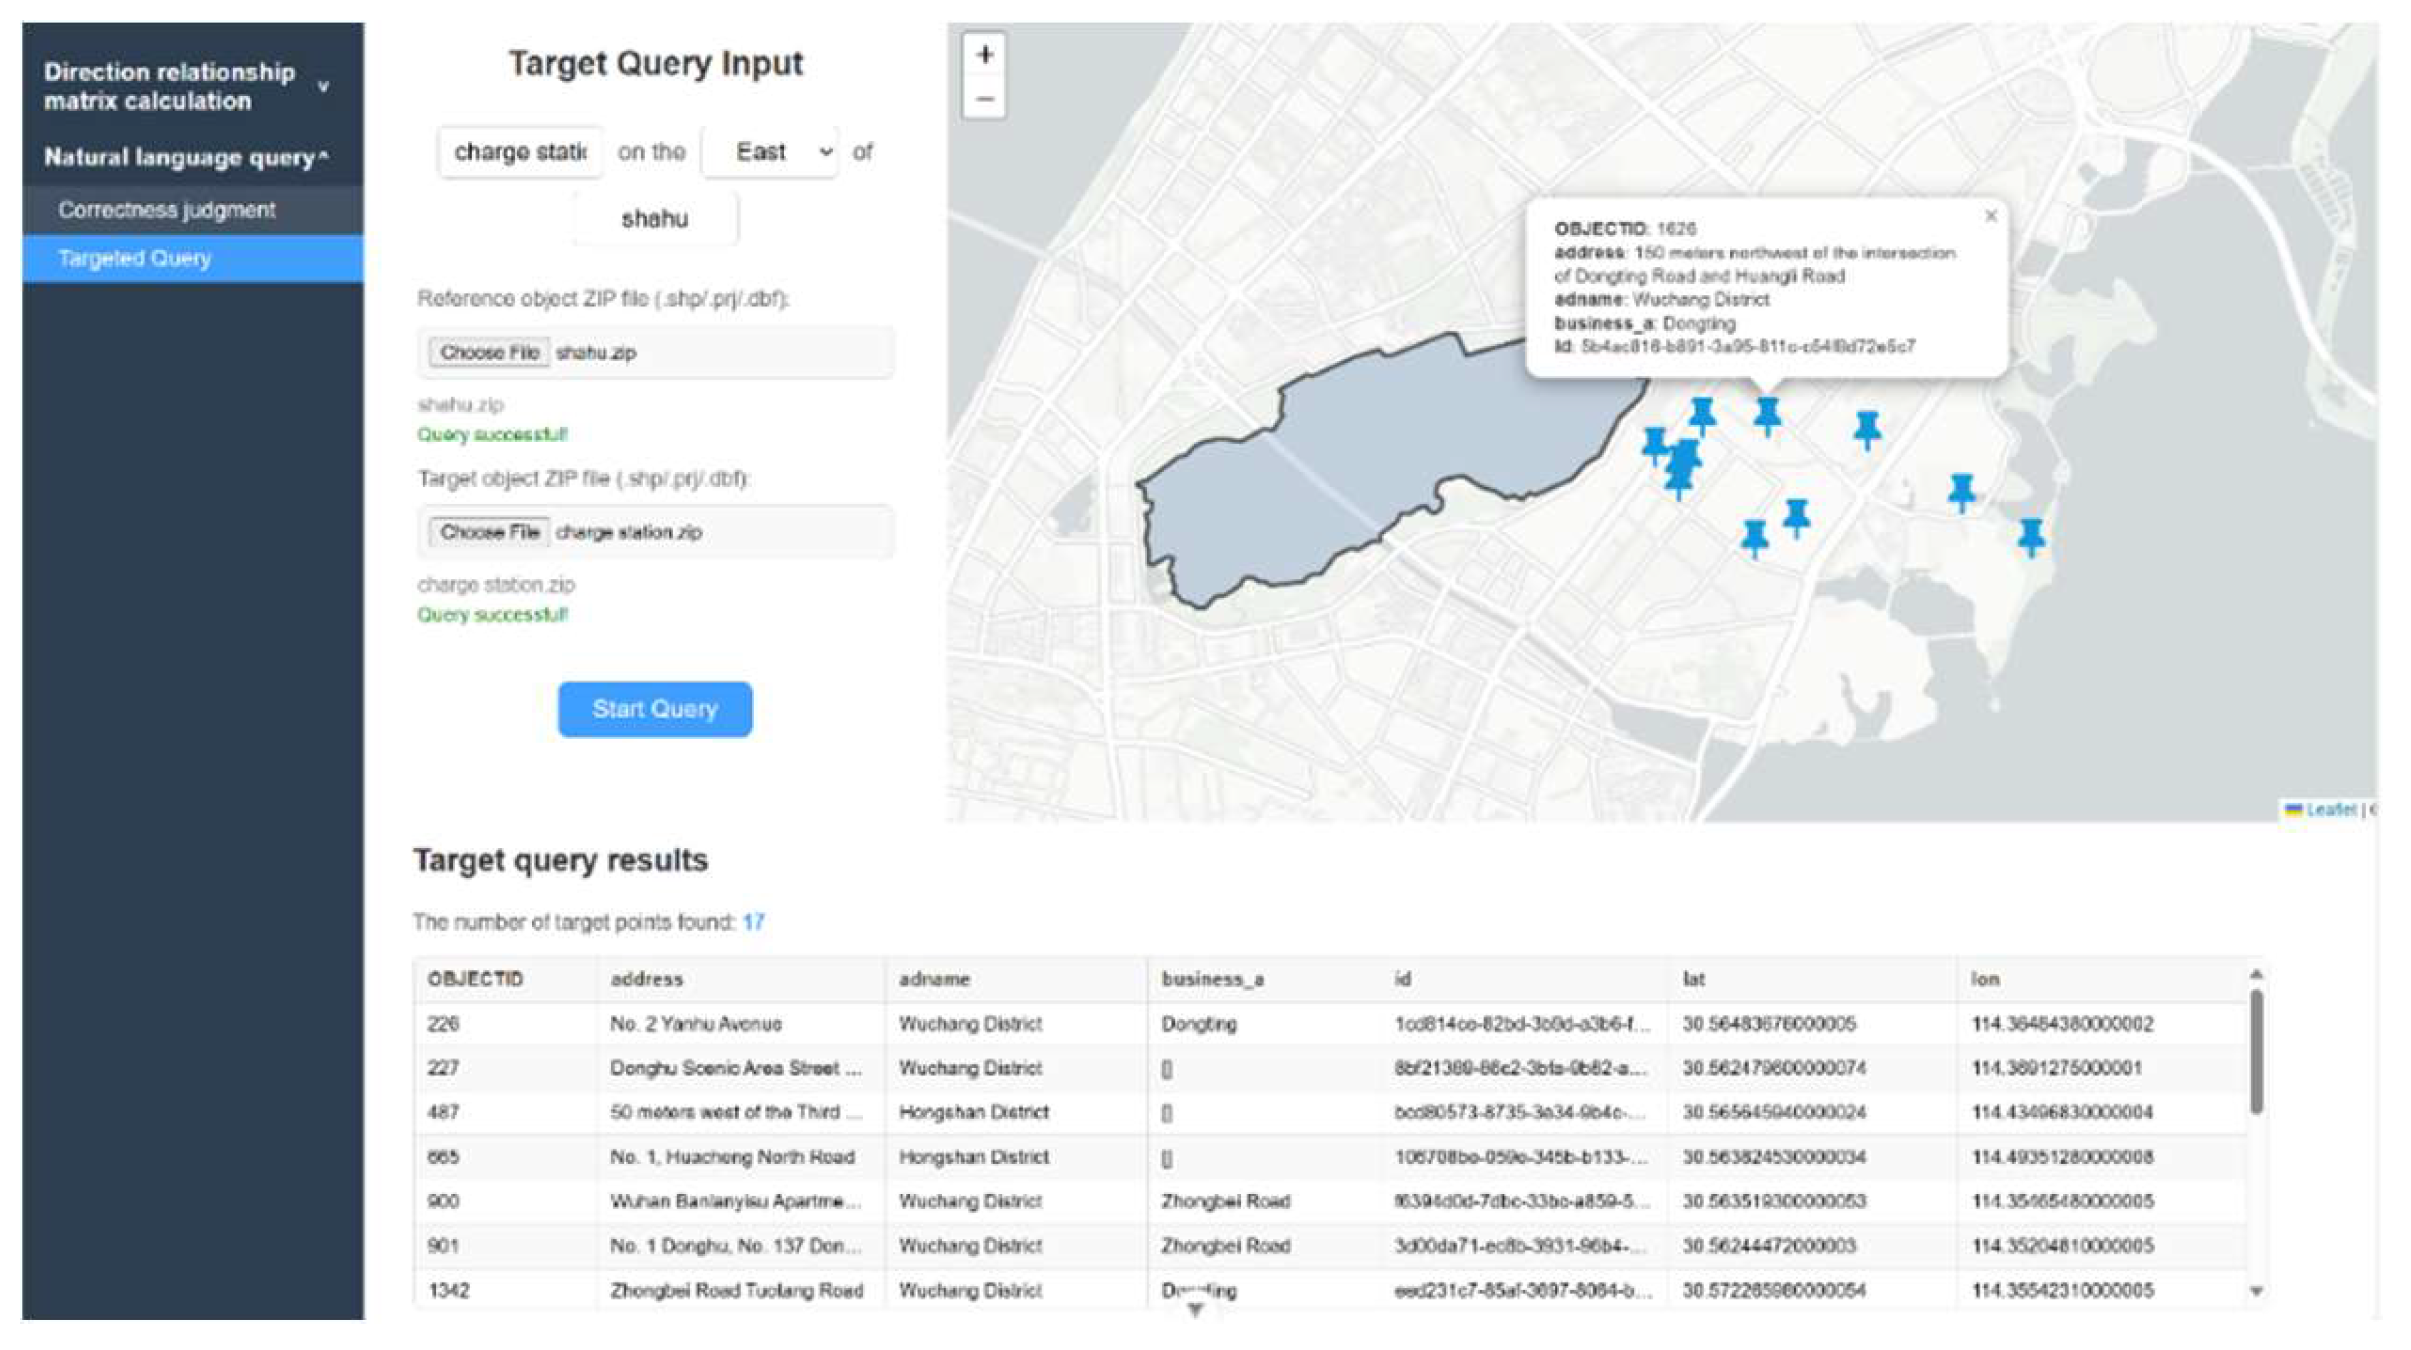
The third method involves the system identifying all target features that meet the specified directional relationship conditions based on the reference object. For example, as shown in the figure, the user selects East Lake as the reference object and sets the directional condition as "east." The query results are displayed in the figure accordingly.
Figure 22.
Directional relationship query based on the Natural Language.
7. Conclusion and Discussion
In this paper, we introduce two novel quantitative matrix models at different scales for characterizing primary directional relationships, enabling soft classification of qualitative directional relations at both order and coordinate levels. Unlike traditional qualitative matrix models that rely on hard classification, these quantitative approaches fundamentally resolve the issue of directional variability within the same directional tile, allowing for a more precise representation of cardinal directions. The order matrix model emphasizes the sequential characteristics of directional relations, capturing the order-based variation of targets across different directional segments, and its outputs can be efficiently transformed into various qualitative directional matrices. The coordinate matrix model, on the other hand, addresses the spatial distribution of targets aligned along the same line—an aspect not distinguishable by the ordinal matrix—by employing directional coordinates for accurate depiction. As the most refined quantitative coordinate-based model, it not only differentiates targets sharing the same line of sight but also serves as a parameter for order matrix calculations. Notably, in contrast to conventional angular quantitative methods for describing directional relationships, both models remain within the qualitative direction-relations framework, defined by four cardinal directions that encapsulate the spatial distribution characteristics of targets. These models provide a quantitative basis for qualitative direction-relations models and, when integrated with existing multi-scale qualitative directional pyramid models, facilitate the development of a new multi-scale qualitative directional pyramid model that bridges quantitative and qualitative descriptions. The introduction of these two quantitative models significantly improves the fidelity of qualitative direction-relations descriptions and establishes a robust conversion mechanism from quantitative vector to qualitative direction-relations, thereby addressing the computational challenges inherent in qualitative directional matrix analysis.
Based on the preceding discussion and analysis of experimental results, the primary advantages of the quantitative models proposed in this paper can be summarized as follows:
- By integrating both order and coordinate quantitative parameters, the proposed models facilitate the soft classifications of qualitative directional relationships, effectively addressing the limitations of hard classification within the same directional tile. This approach achieves a significantly higher degree of accuracy compared to traditional qualitative description matrices.
- The quantitative models not only enable highly accurate characterization of qualitative directional relationships, but also serves as the computational parameters for other qualitative direction-relation matrices, thereby establishing a bridge from precise quantitative coordinate descriptions to qualitative directional semantics.
- By integrating these two quantitative descriptive matrix models with the original multi-scale qualitative direction-relations pyramid model, we build a comprehensive directional relationship pyramid model that spans from quantitative to qualitative analysis, transitioning from precise coordinate-based descriptions to nuanced, fuzzy directional relationship semantics. This establishes a robust framework for the transformation of qualitative directional relationship semantics.
Author Contributions
Conceptualization, Xuehua Tang and Mei-po Kwan; Methodology, Xuehua Tang and Yang Yu; Coding, Yang Yu and Linxuan Xie; Experiments, Xuehua Tang, Linxuan Xie, Yong Zhang and Binbin Lu; Writing-original draft preparation, Xuehua Tang and Linxuan Xie; Writing-review and editing, Mei-po Kwan, Kun Qin, Yong Zhang and Binbin Lu; Supervision, Mei-po Kwan and Binbin Lu. All authors have read and agreed to the published version of the manuscript.
Funding
This research was funded by the National Key Research and Development Program of China (Grant No. 2023YFF0611904), the Fundamental Research Funds for the Central Universities, China (Grant No. 2042022dx0001;2042024kf0005) and the National Natural Science Foundation of China (Grant No. 42171448).
Data Availability Statement
The original contributions presented in this study are included in the article. Further inquiries can be directed to the corresponding author.
Conflicts of Interest
The authors declare no conflicts of interest.
References
- Nedas, K.A.; Egenhofer, M.J. Spatial-scene Similarity Queries. Trans. GIS 2008, 12, 661–681. [Google Scholar] [CrossRef]
- Bruns, H.T.; Egenhofer, M. Similarity of Spatial Scenes.; Delft, The Netherlands, 1996; pp. 31–42.
- Frank, A.U. Qualitative Spatial Reasoning: Cardinal Directions as an Example. Int. J. Geogr. Inf. Sci. 1996, 10, 269–290. [Google Scholar] [CrossRef]
- Goyal, R.K.; Egenhofer, M.J. Consistent Queries over Cardinal Directions across Different Levels of Detail.; IEEE, 2000; pp. 876–880.
- Li, B.; Fonseca, F. TDD: A Comprehensive Model for Qualitative Spatial Similarity Assessment. Spat. Cogn. Comput. 2006, 6, 31–62. [Google Scholar] [CrossRef]
- Zhu, R.; Janowicz, K.; Mai, G. Making Direction a First-class Citizen of Tobler’s First Law of Geography. Trans. GIS 2019, 23, 398–416. [Google Scholar] [CrossRef]
- Goyal, R.K.; Egenhofer, M.J. Similarity of Cardinal Directions.; Springer, 2001; pp. 36–55.
- YAN, H.; GUO, R. A Formal Description Model of Directional Relationships Based on Voronoi Diagram. Geomat. Inf. Sci. Wuhan Univ. 2003, 28, 468–471. [Google Scholar]
- Du, S.; Wang, Q.; Yang, Y. A Qualitative Description Model of Detailed Direction Relations. J. Image Graph. 2004, 12, 1496–1503. [Google Scholar]
- Xi, G.; Zhong, X.; Lin, Z.; Zhanjun, H. A Two-Tuple Model Based Spatial Direction Similarity Measurement Method. Acta Geod. Cartogr. Sin. 2021, 50, 1705. [Google Scholar]
- Bloch, I. Fuzzy Spatial Relationships for Image Processing and Interpretation: A Review. Image Vis. Comput. 2005, 23, 89–110. [Google Scholar] [CrossRef]
- Xu, J. Formalizing Natural-language Spatial Relations between Linear Objects with Topological and Metric Properties. Int. J. Geogr. Inf. Sci. 2007, 21, 377–395. [Google Scholar] [CrossRef]
- Wang, J.; Jiang, G.; Guo, R. Hierarchical Detailed Description for Spatial Direction Relations. Geo-Spat. Inf. Sci. 2008, 11, 56–61. [Google Scholar] [CrossRef]
- Liu, Y.; Guo, Q.H.; Wieczorek, J.; Goodchild, M.F. Positioning Localities Based on Spatial Assertions. Int. J. Geogr. Inf. Sci. 2009, 23, 1471–1501. [Google Scholar] [CrossRef]
- Liu, W.; Li, S. Reasoning about Cardinal Directions between Extended Objects: The NP-Hardness Result. Artif. Intell. 2011, 175, 2155–2169. [Google Scholar] [CrossRef]
- Du, Y.; Liang, F.; Sun, Y. Integrating Spatial Relations into Case-Based Reasoning to Solve Geographic Problems. Knowl.-Based Syst. 2012, 33, 111–123. [Google Scholar] [CrossRef]
- Sun, W.; Ouyang, J.; Huo, L.; Li, S. Similarity of Direction Relations in Spatial Scenes. J. Comput. Inf. Syst. 2012, 8, 8589–8596. [Google Scholar]
- Vasardani, M.; Winter, S.; Richter, K.-F. Locating Place Names from Place Descriptions. Int. J. Geogr. Inf. Sci. 2013, 27, 2509–2532. [Google Scholar] [CrossRef]
- Zhanlong, C.; Lin, Z.; Xi, G.; Liang, W. A Quantitative Calculation Method of Spatial Direction Similarity Based on Direction Relation Matrix. Acta Geod. Cartogr. Sin. 2015, 44, 813. [Google Scholar]
- Yan, H. Quantitative Relations between Spatial Similarity Degree and Map Scale Change of Individual Linear Objects in Multi-Scale Map Spaces. Geocarto Int. 2015, 30, 472–482. [Google Scholar] [CrossRef]
- Chen, J.; Shao, Q.; Deng, M.; Mei, X.; Hou, J. High-Resolution Remote Sensing Image Retrieval via Land-Feature Spatial Relation Matching. J. Remote Sens. 2016, 20, 397–408. [Google Scholar]
- Li, P.; Liu, J.; Yan, H.; Xiaomin, L. An Improved Model for Calculating the Similarity of Spatial Direction Based on Direction Relation Matrix. J. Geomat. Sci. Technol. 2018, 35, 216–220. [Google Scholar]
- KANG, S.; LI, J.; QU, S. A Qualitative Reasoning Method for Cardinal Directional Relations under Concave Landmark Referencing. Geomat. Inf. Sci. Wuhan Univ. 2018, 43, 24–30. [Google Scholar]
- Wang, M.; Wang, X.; Li, S.; Hao, Z. Reasoning with the Original Relations of the Basic 2D Rectangular Cardinal Direction Relation. J. Xi’An Jiaotong Univ. 2020, 54, 133–143. [Google Scholar]
- Jie, C.; Xinyi, D.; Xing, Z.; Geng, S.; Min, D. Semantic Understanding of Geo-Objects’ Relationship in High Resolution Remote Sensing Image Driven by Dual LSTM. Natl. Remote Sens. Bull. 2021, 25, 1085–1094. [Google Scholar]
- Nong, Y.; Wang, J.; Zhao, X. Spatial Relation Ship Detection Method of Remote Sensing Objects. Acta Opt. Sin. 2021, 41, 212–217. [Google Scholar]
- Lan, H.; Zhang, P. Question-Guided Spatial Relation Graph Reasoning Model for Visual Question Answering. J. Image Graph. 2022, 27, 2274–2286. [Google Scholar] [CrossRef]
- Deng, M.; Li, Z. A Statistical Model for Directional Relations between Spatial Objects. Geoinformatica 2008, 12, 193–217. [Google Scholar] [CrossRef]
- Takemura, C.M.; Cesar Jr, R.M.; Bloch, I. Modeling and Measuring the Spatial Relation “along”: Regions, Contours and Fuzzy Sets. Pattern Recognit. 2012, 45, 757–766. [Google Scholar] [CrossRef]
- Lynch, K. The Image of the City; MIT press: Cambridge, MA, 1960; ISBN 0-262-62001-4. [Google Scholar]
- Cao, H.; Chen, J.; Du, D. Qualitative Extension Description for Cardinal Directions of Spatial Objects. Acta Geod. Cartogr. Sin. 2001, 30, 162–167. [Google Scholar]
- Haar, R. Computational Models of Spatial Relations; University of Maryland: College Park, MD, 1976. [Google Scholar]
- Peuquet, D.J.; Ci-Xiang, Z. An Algorithm to Determine the Directional Relationship between Arbitrarily-Shaped Polygons in the Plane. Pattern Recognit. 1987, 20, 65–74. [Google Scholar] [CrossRef]
- Papadias, D.; Theodoridis, Y. Spatial Relations, Minimum Bounding Rectangles, and Spatial Data Structures. Int. J. Geogr. Inf. Sci. 1997, 11, 111–138. [Google Scholar] [CrossRef]
- Goyal, R.K. Similarity Assessment for Cardinal Directions between Extended Spatial Objects. The University of Maine, 2000.
- Tang, X.; Qin, K.; Meng, L. A Qualitative Matrix Model of Direction-Relation Based on Topological Reference. Acta Geod. Cartogr. Sin. 2014, 43, 396–403. [Google Scholar]
- Kulik, L.; Klippel, A. Reasoning about Cardinal Directions Using Grids as Qualitative Geographic Coordinates.; Springer, 1999; pp. 205–220.
- Tang, X.; Kwan, M.; Yu, Y.; Xie, L.; Qin, K.; Zhang, T. A Multiscale Pyramid Model of Cardinal Directions for Different Scenarios. Trans. GIS 2025, 29, e70010. [Google Scholar] [CrossRef]
- Chen, T.; Ai, T. Automatic Extraction of Skeleton and Center of Area Feature. Geomat. Inf. Sci. Wuhan Univ. 2004, 29, 443–446. [Google Scholar]
- LU, W.; AI, T. Center Point Extraction of Simple Area Object Using Triangulation Skeleton Graph. Geomat. Inf. Sci. Wuhan Univ. 2020, 45, 337–343. [Google Scholar]
Figure 1.
The qualitative and quantitative directional models.
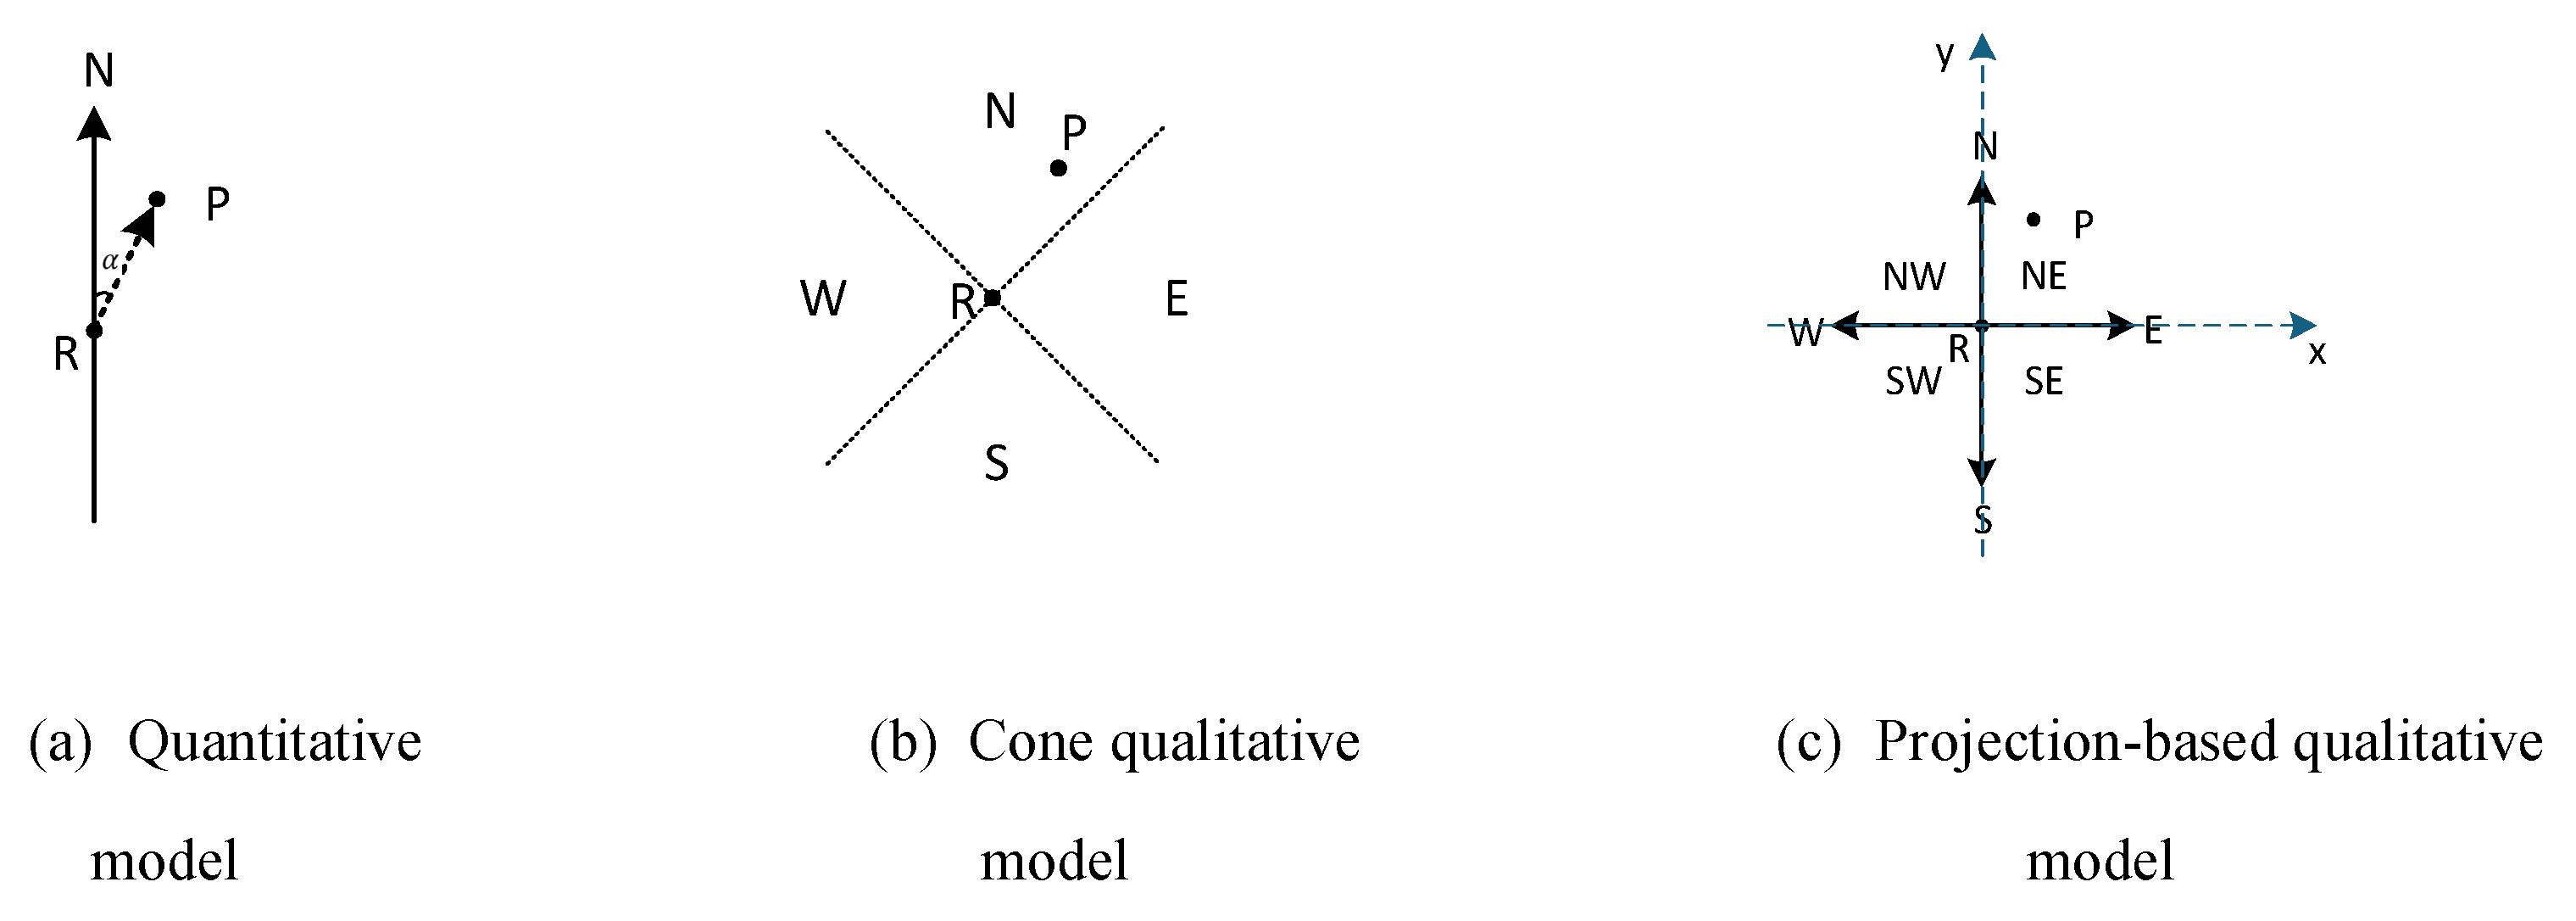
Figure 2.
Directional tiles of the direction-relation matrix and its extended model: (a) Direction-relation matrix [34]; (b) Detailed direction relations matrix [9] ; (c) Direction-relation matrix based on topological reference [35] .
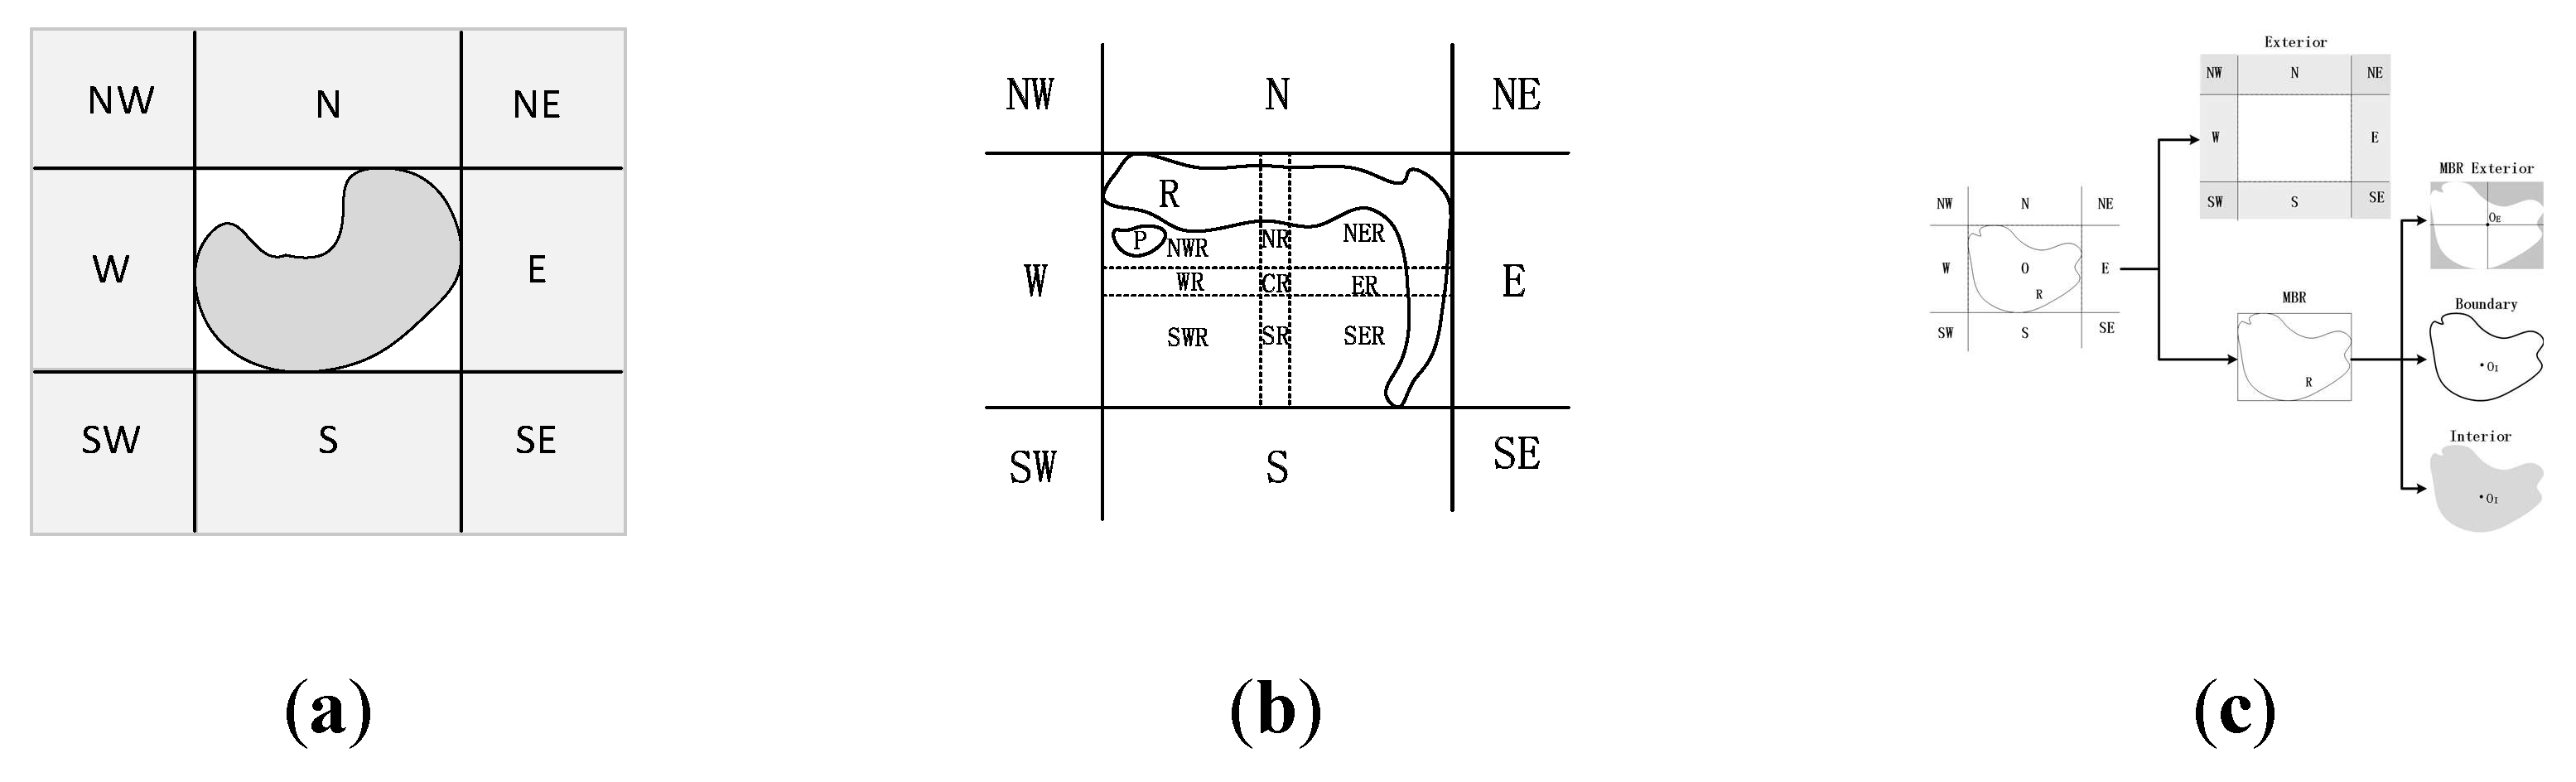
Figure 3.
The framework of the multi-scale pyramid model of cardinal directions.
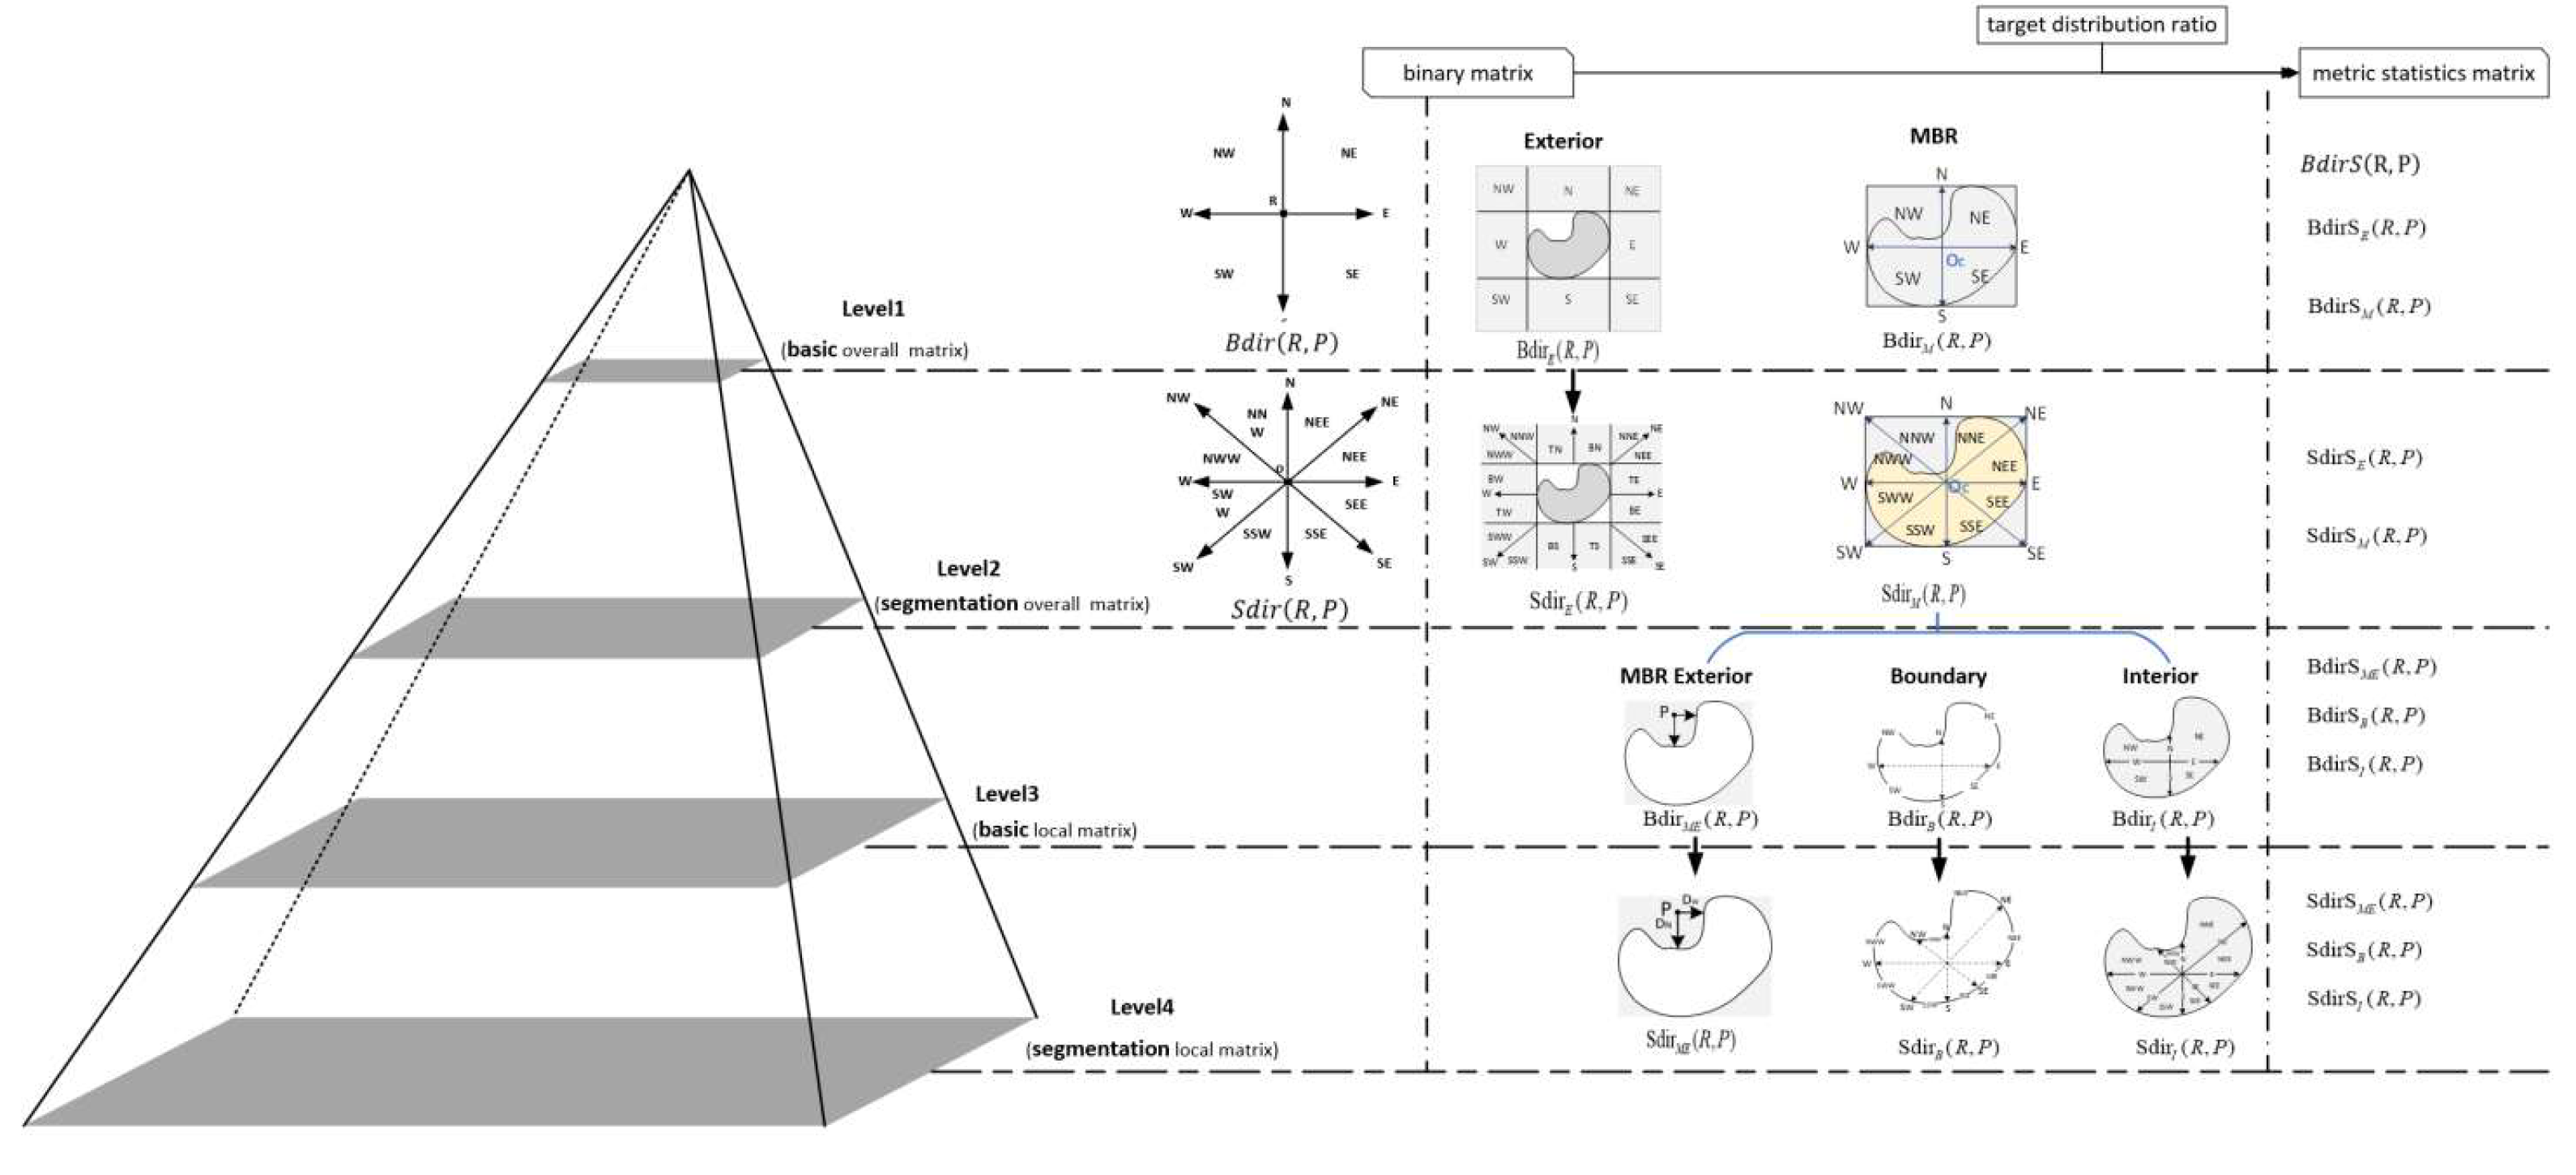
Figure 5.
The framework of the multiscale pyramid model of cardinal directions for reference point.
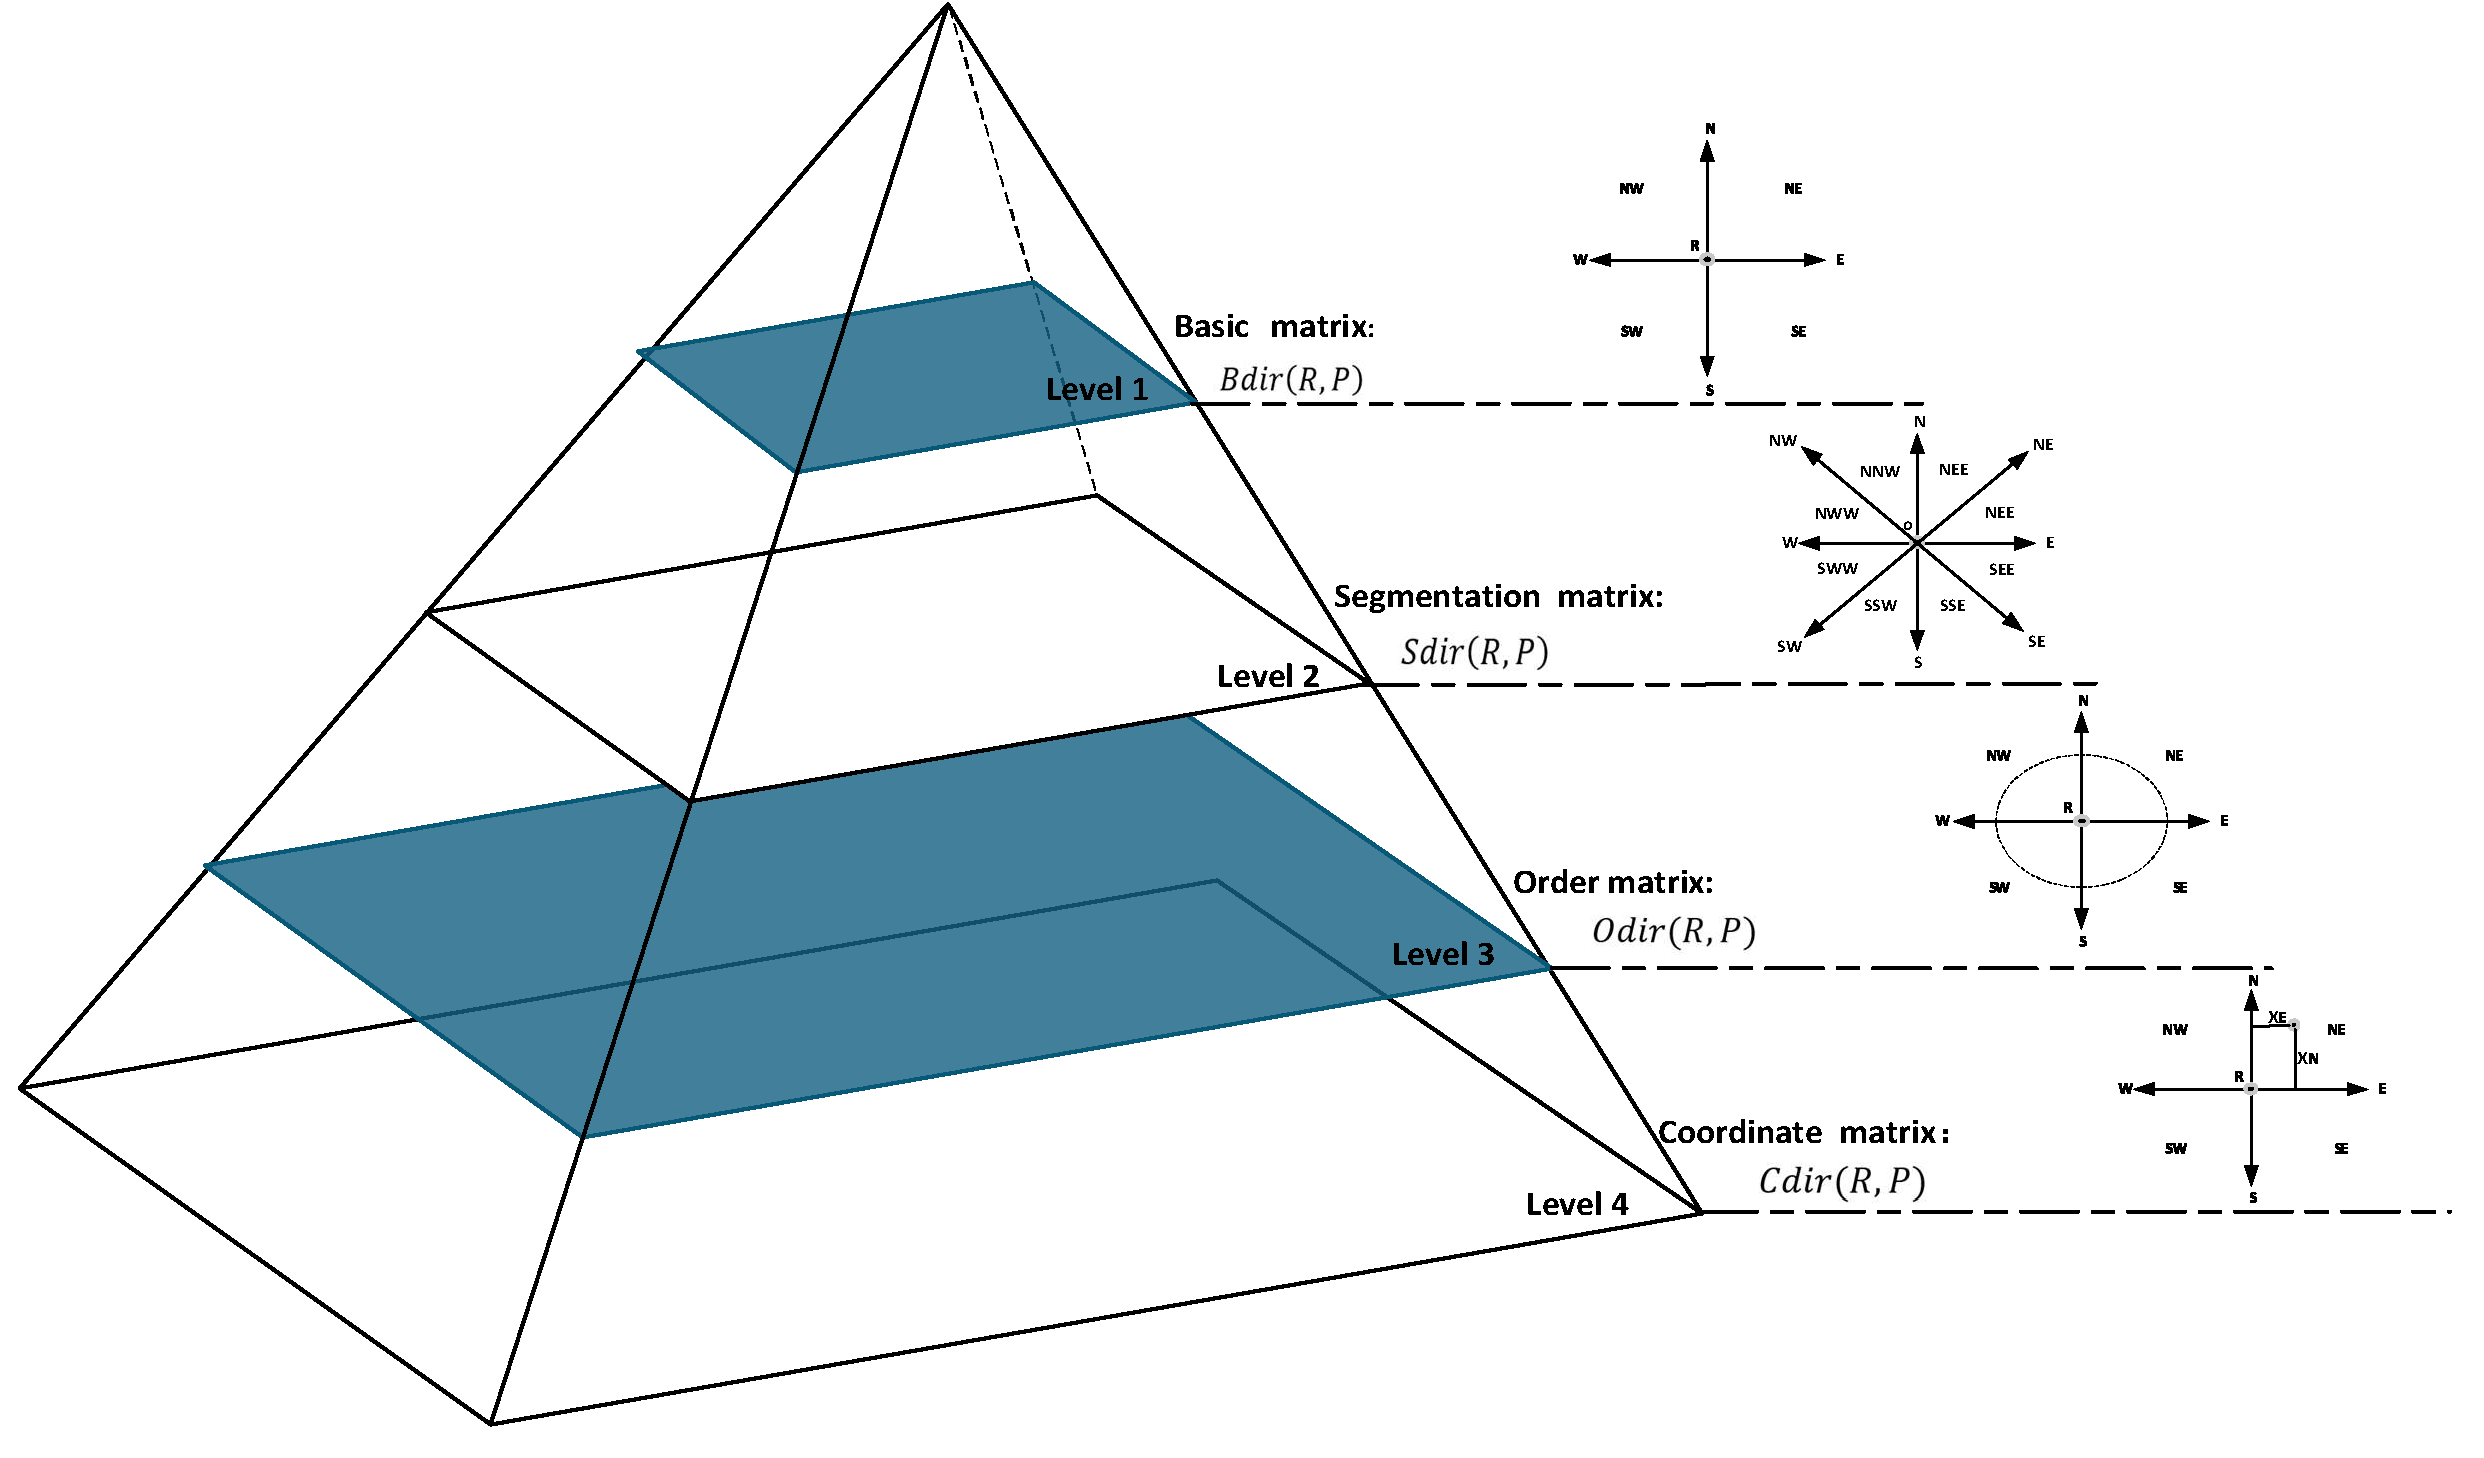
Figure 6.
The framework of the new multi-scale pyramid model for cardinal directions.
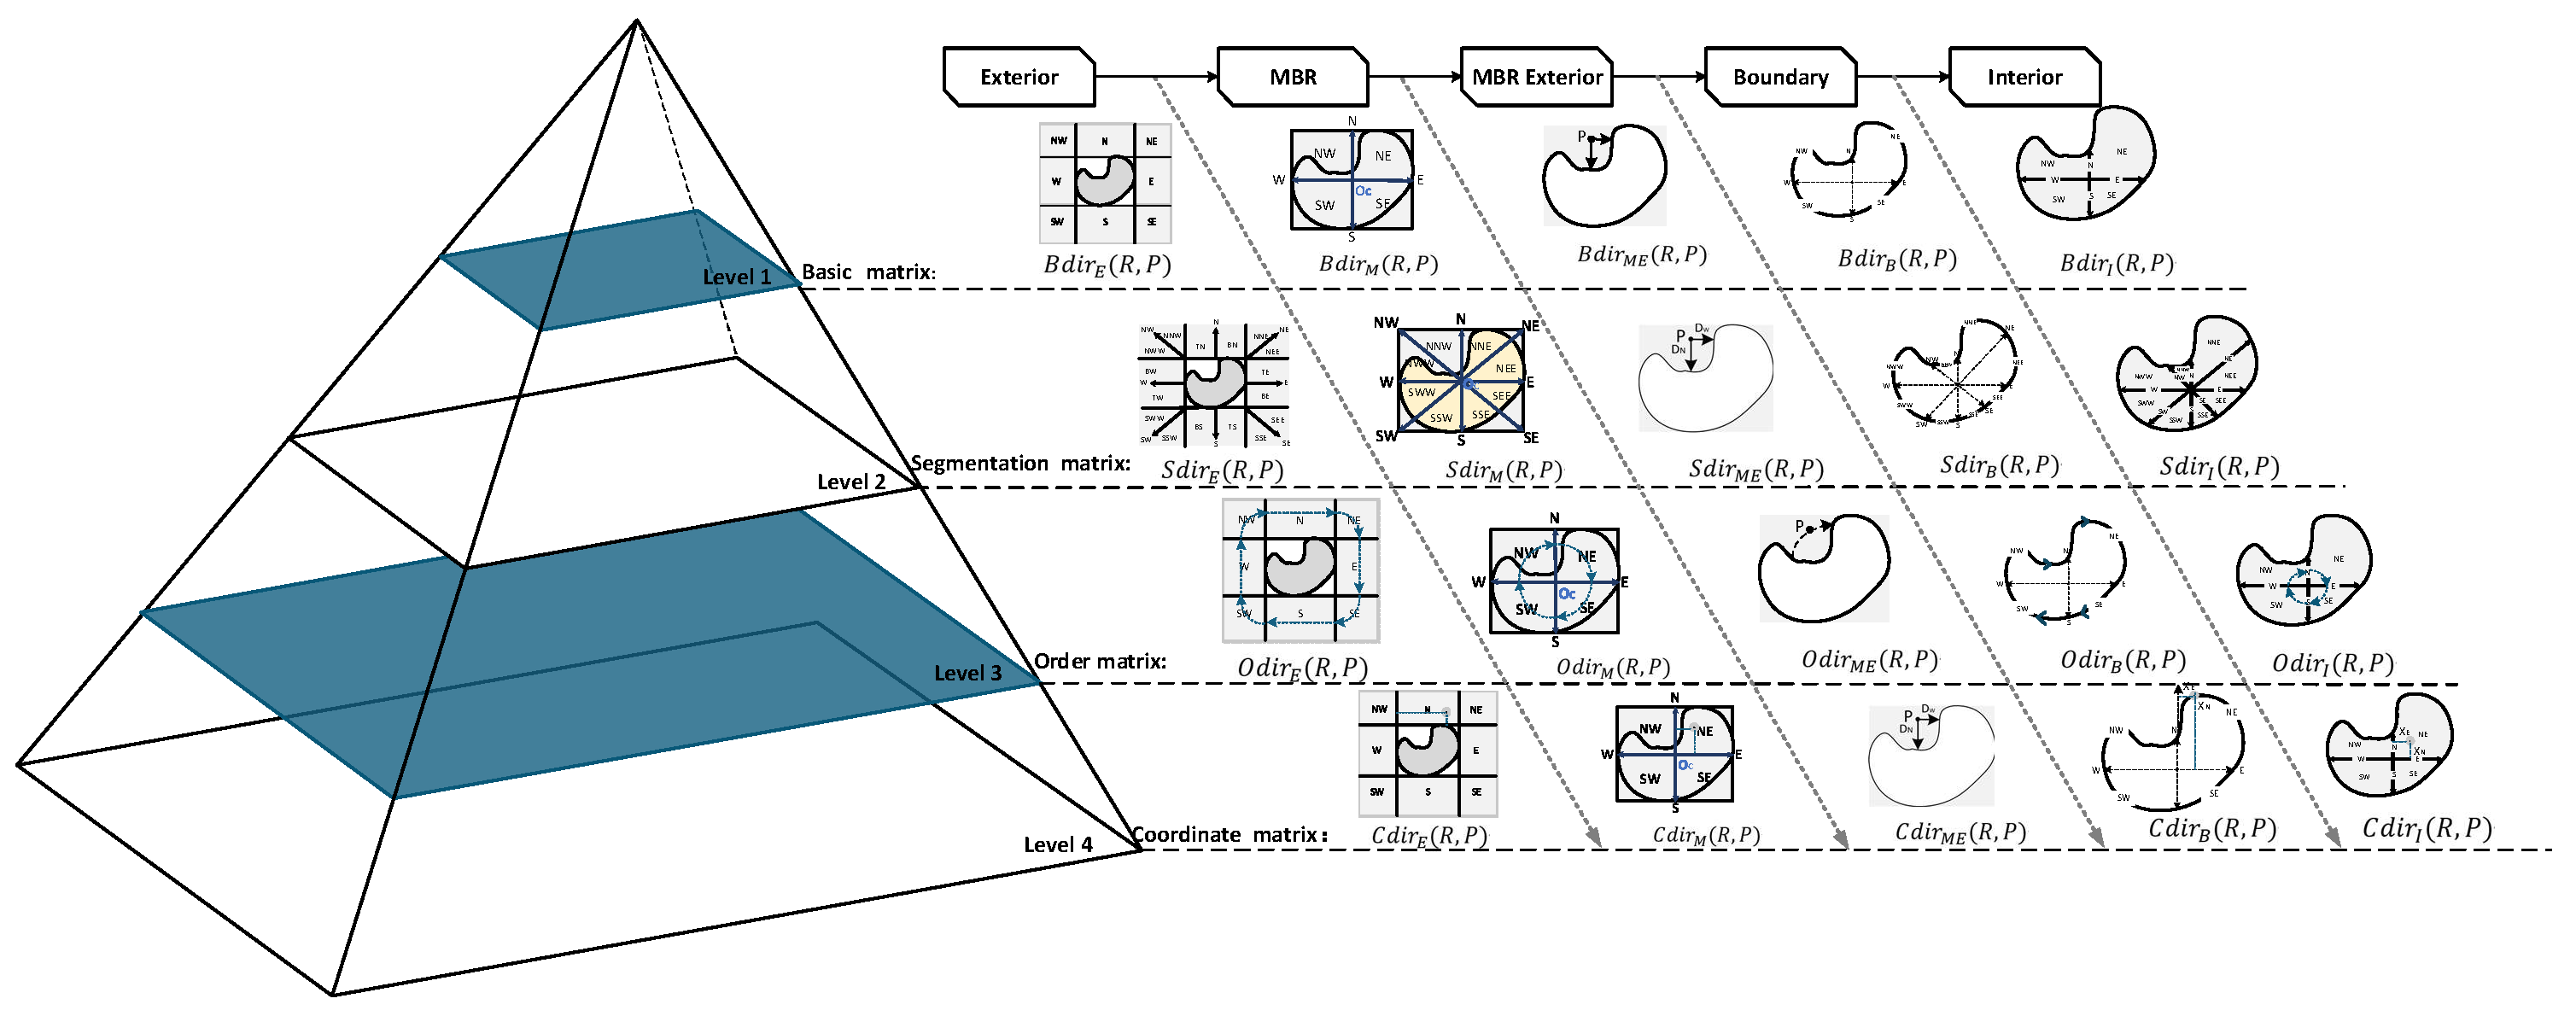
Figure 7.
The order matrix for reference point: (a) Directional tiles of the order matrix for reference point; (b) The values of order matrix.
Figure 7.
The order matrix for reference point: (a) Directional tiles of the order matrix for reference point; (b) The values of order matrix.
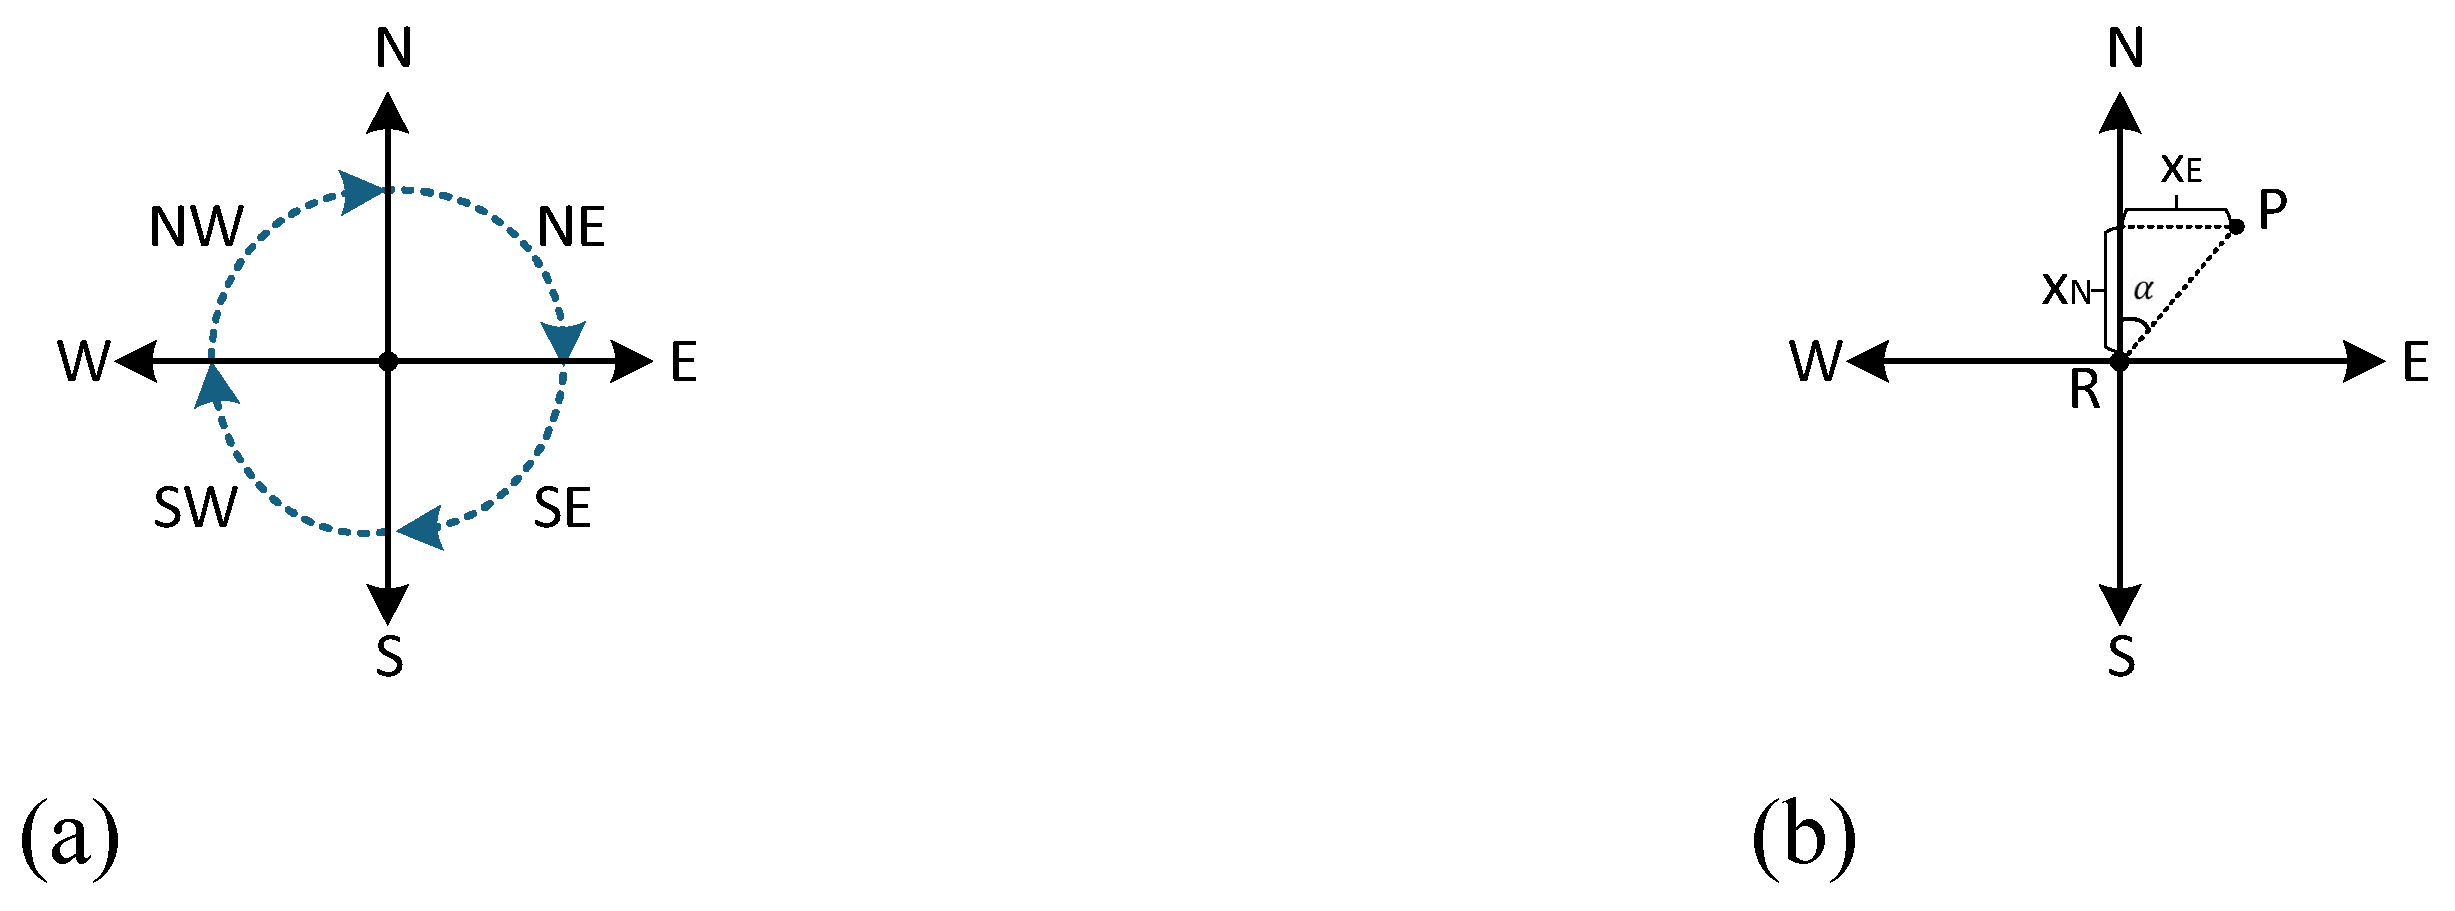
Figure 8.
The order matrix for point-polygon: (a) Azimuth Range for reference point; (b) Order matrix.
Figure 8.
The order matrix for point-polygon: (a) Azimuth Range for reference point; (b) Order matrix.
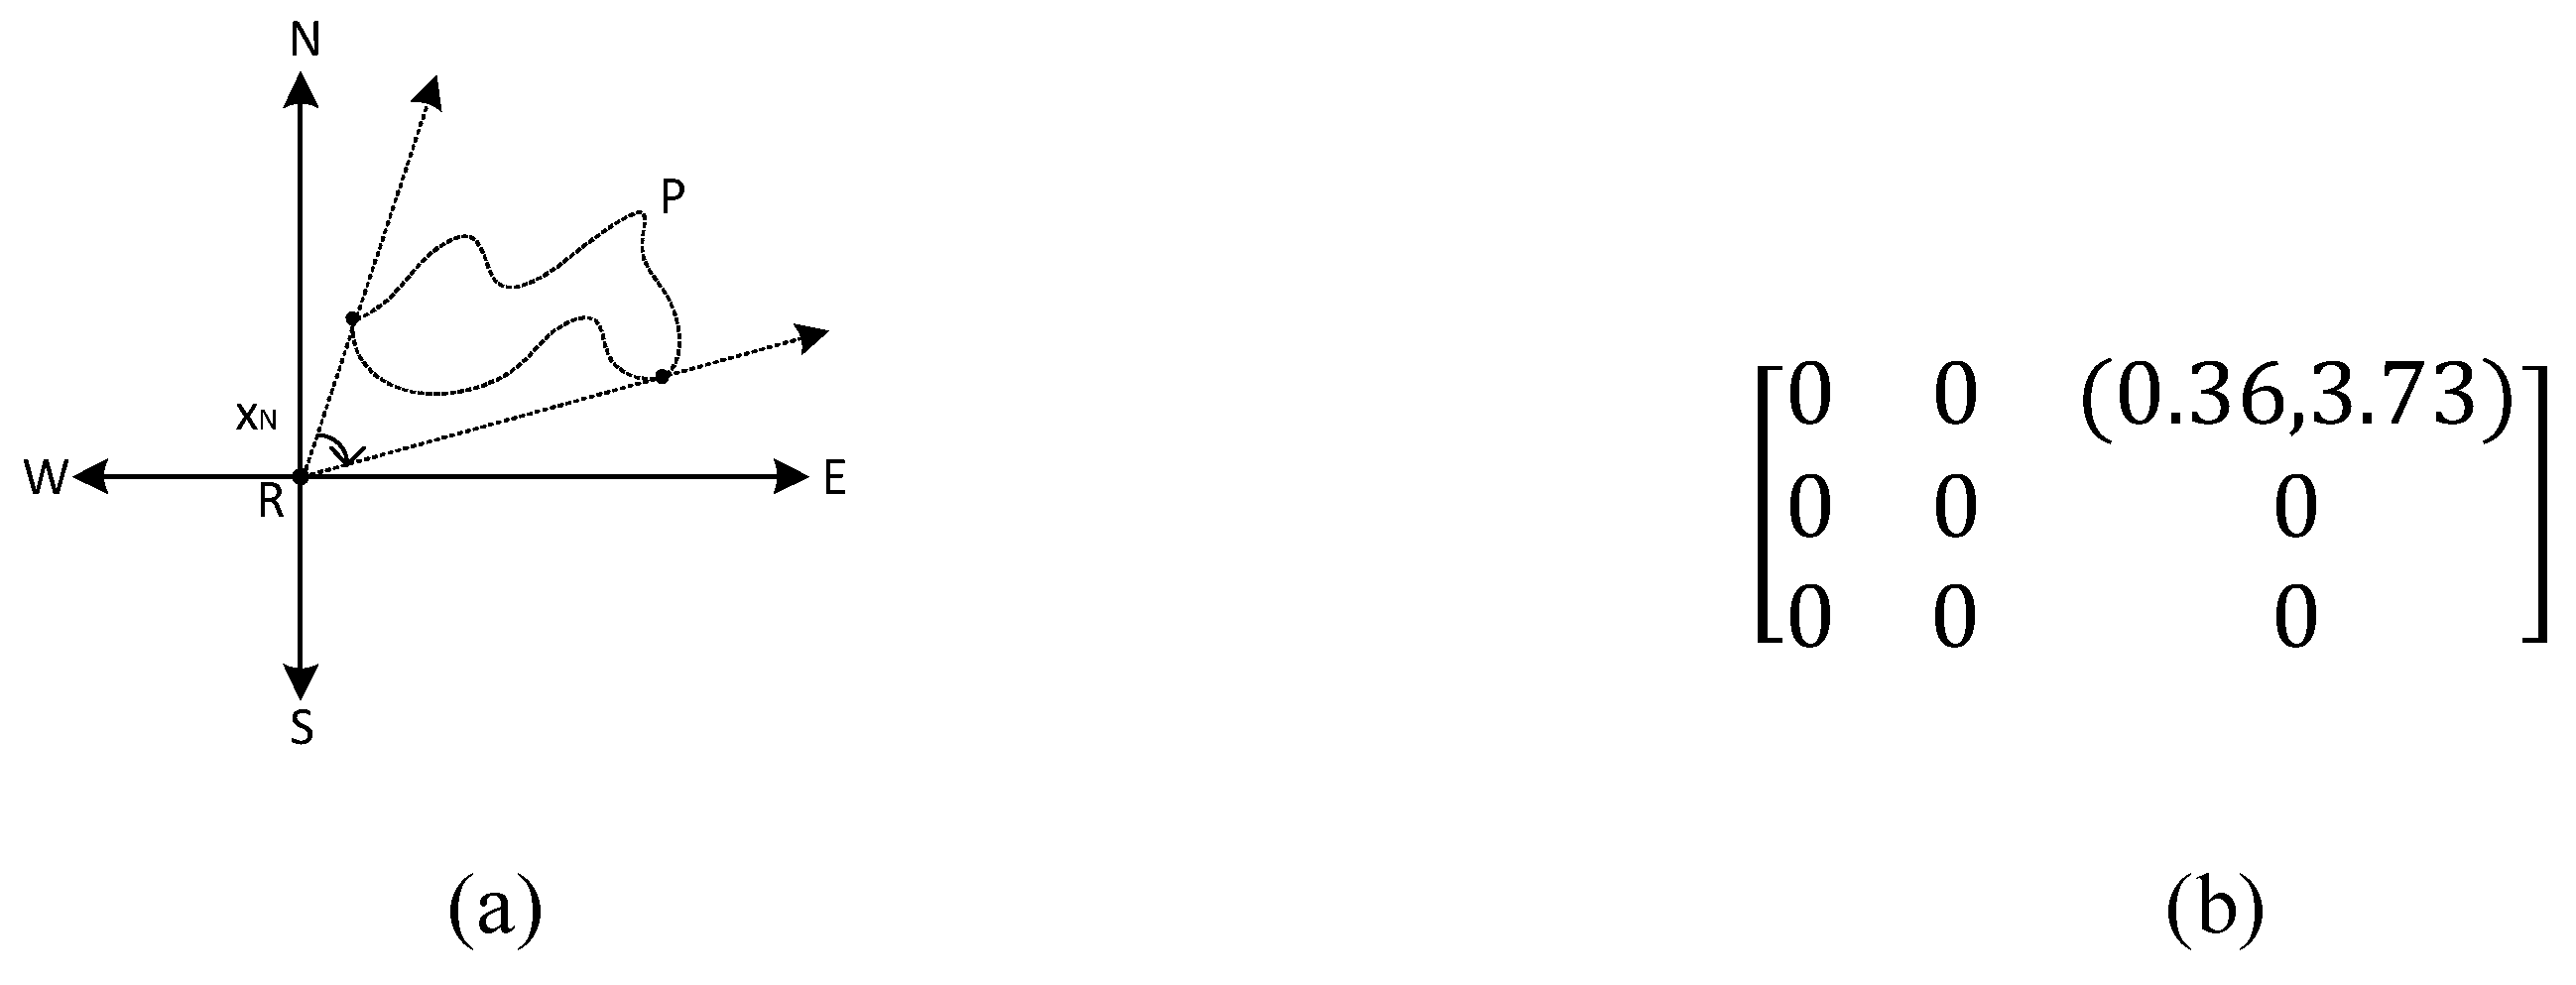
Figure 9.
Directional tiles of exterior order matrix for reference polygon: (a) Directional tiles of the exterior order matrix; (b) Origin points of the exterior order matrix.
Figure 9.
Directional tiles of exterior order matrix for reference polygon: (a) Directional tiles of the exterior order matrix; (b) Origin points of the exterior order matrix.
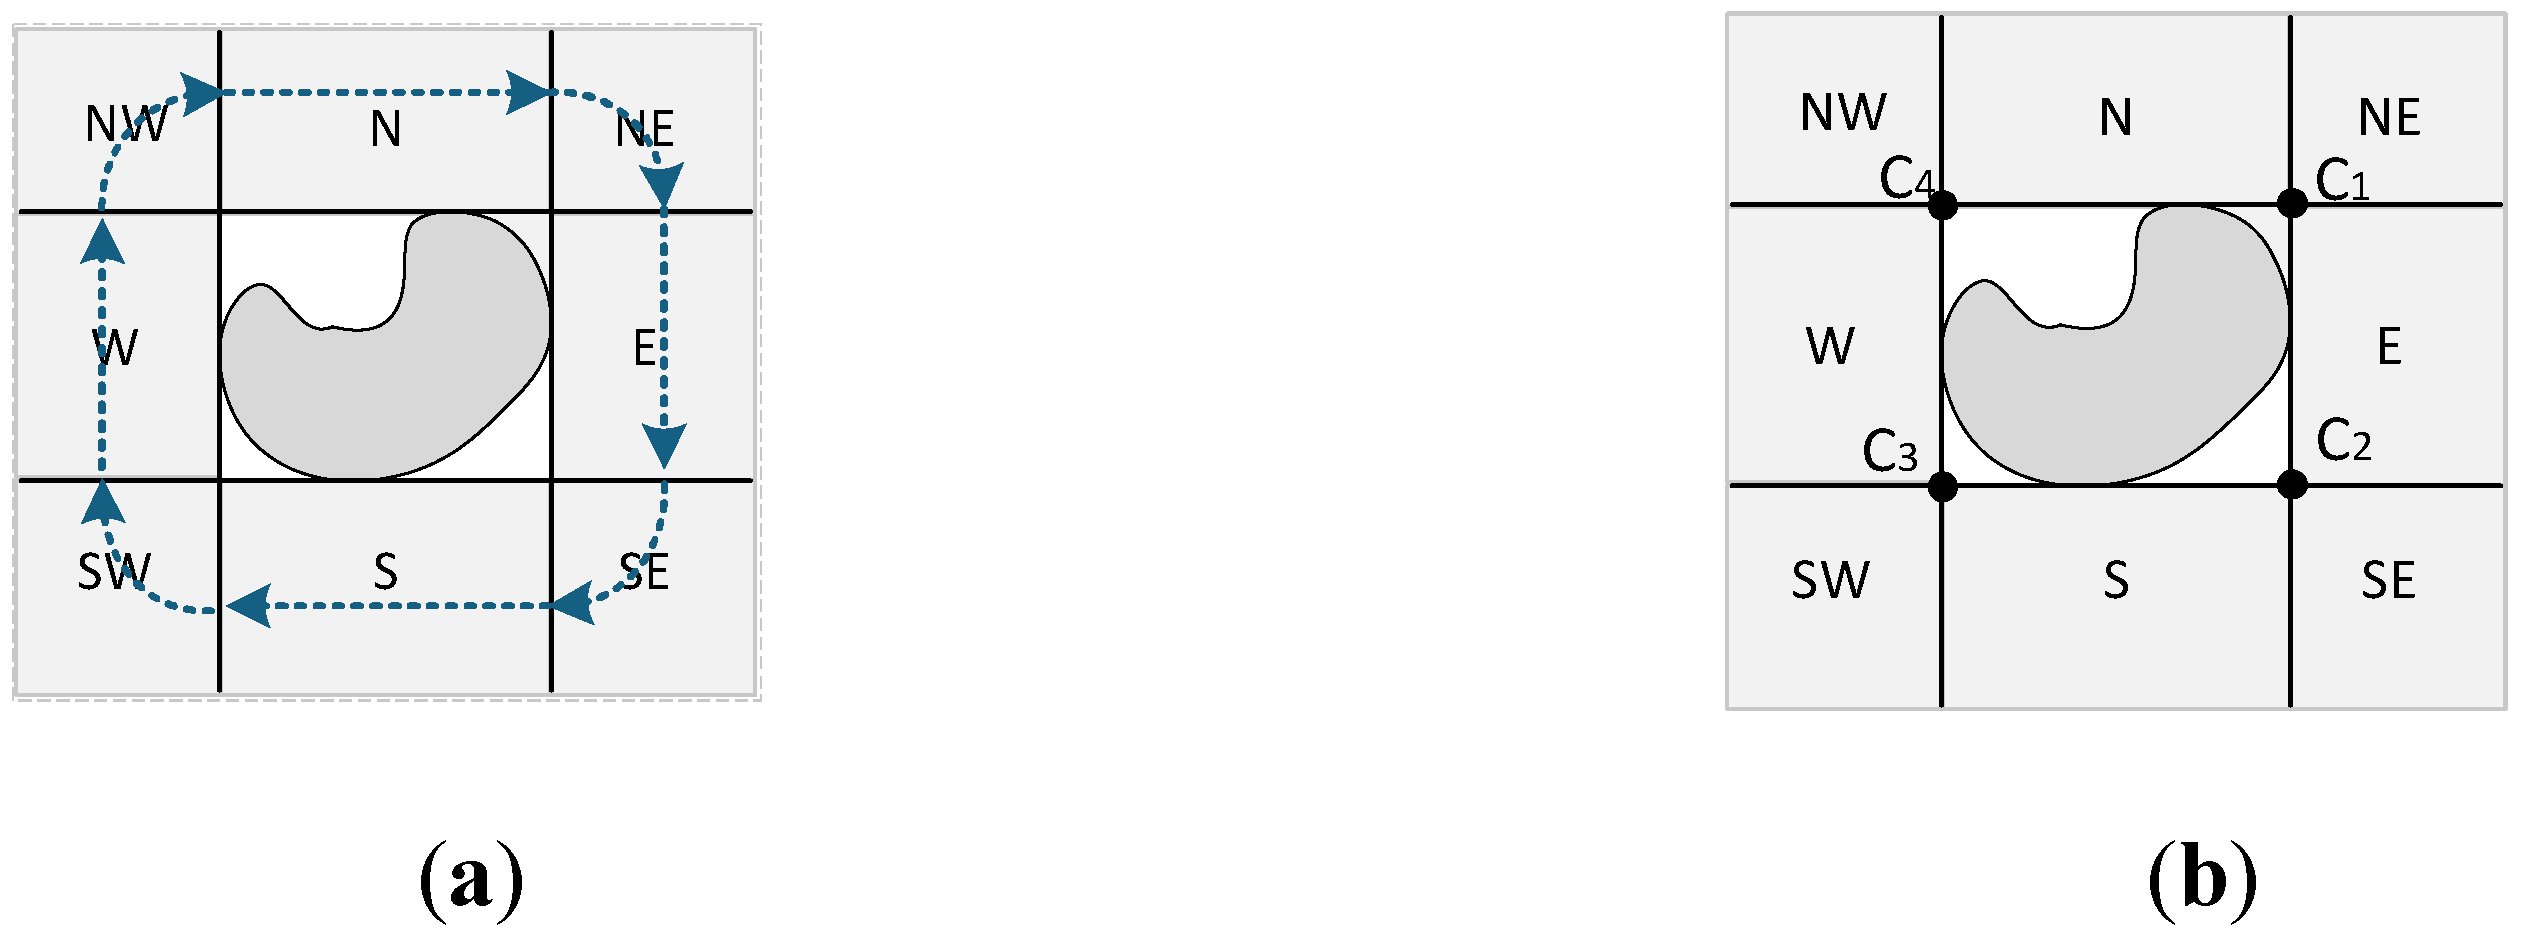
Figure 15.
Coordinates matrix for reference point: (a) Point target; (b) Line target; (c) Polygon target.
Figure 15.
Coordinates matrix for reference point: (a) Point target; (b) Line target; (c) Polygon target.
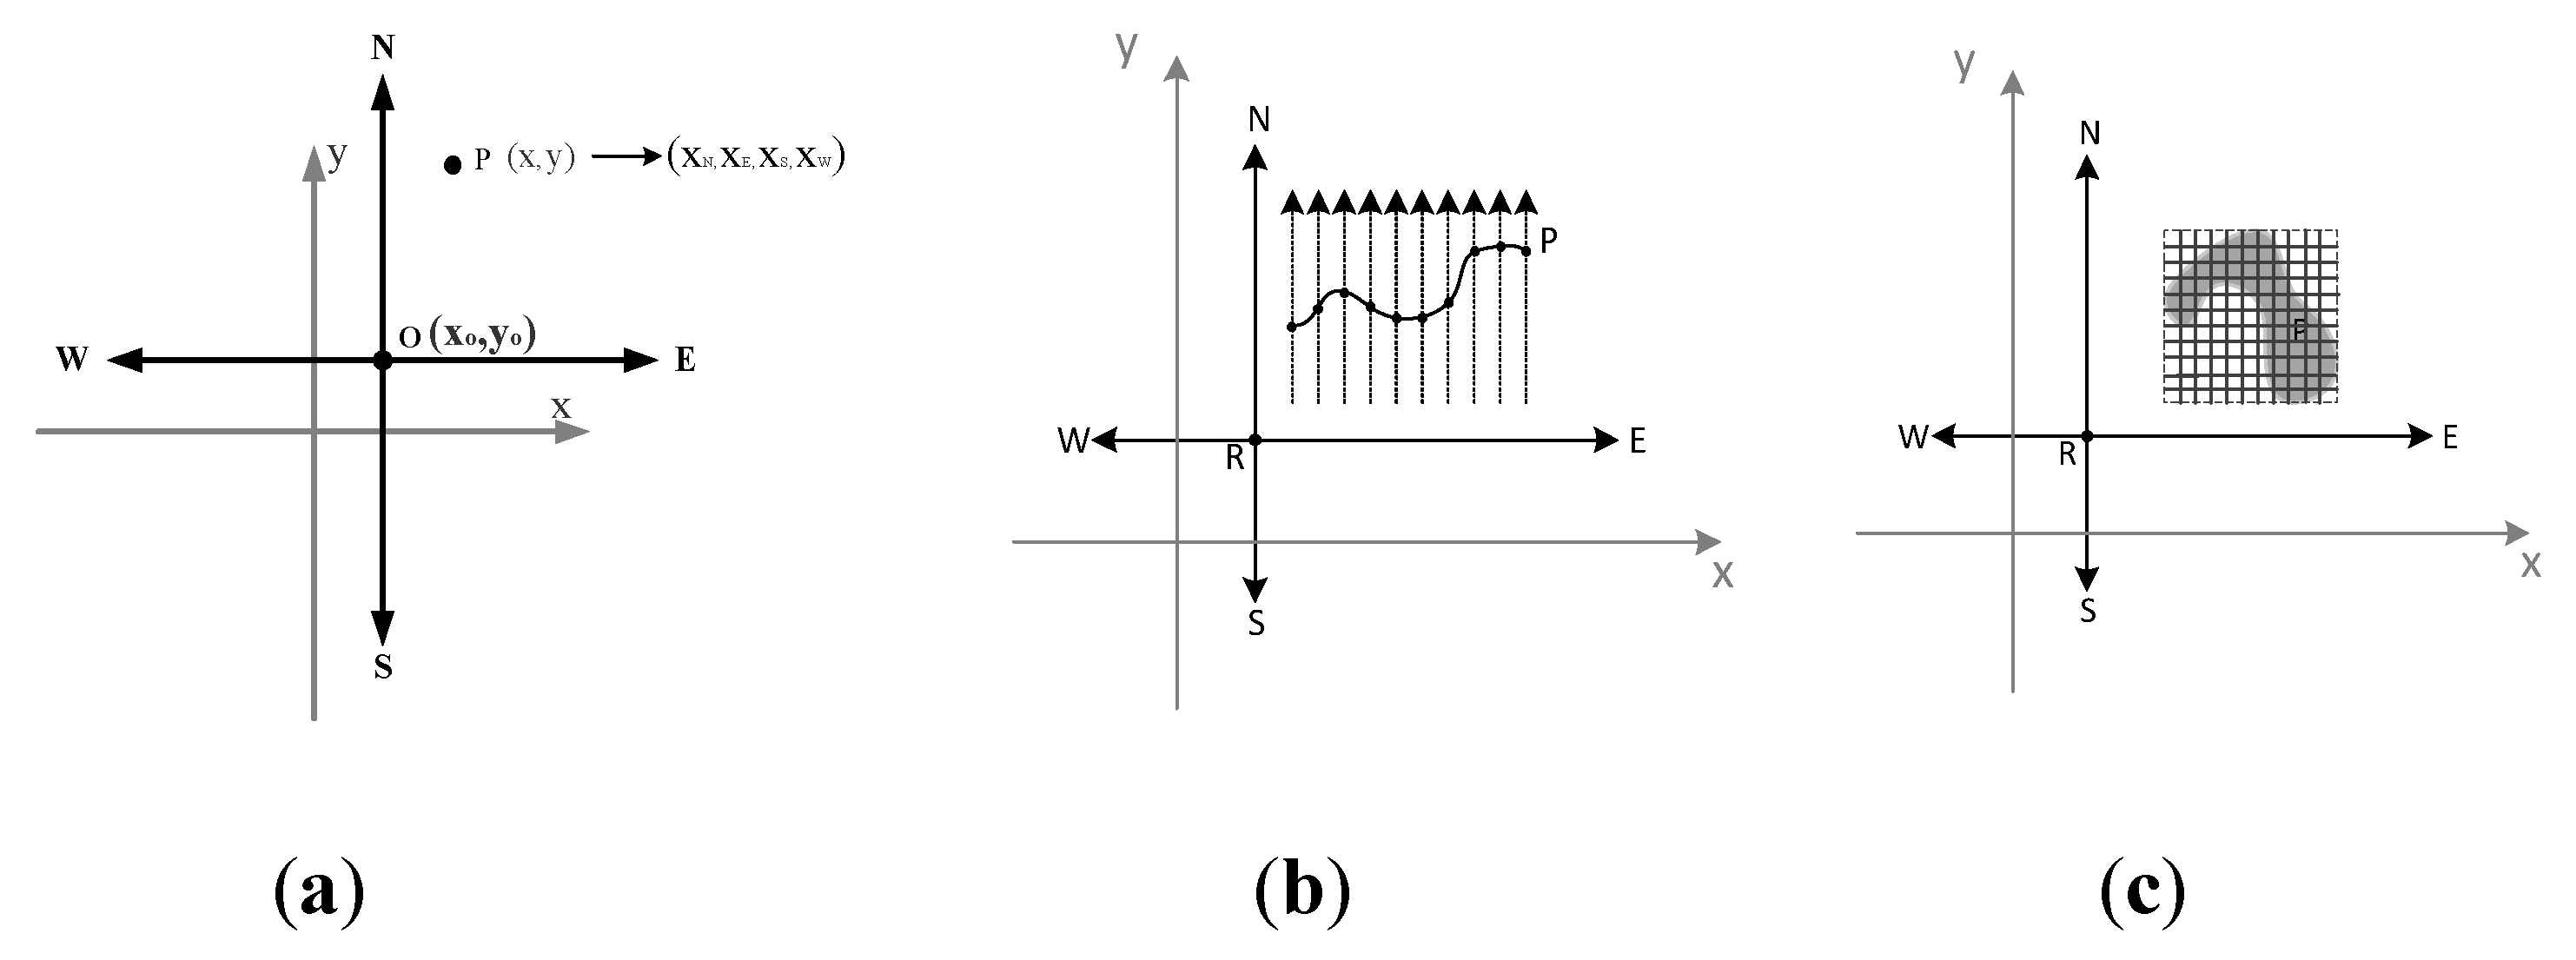

Table 1.
Accuracy comparison with the other models in the exterior region.
| Scene | Basic Matrix | Segmentation Matrix | Order Matrix | Coordinate matrix |
|---|---|---|---|---|
| Scene1 | ||||
| Scene2 | ||||
| Scene3 | ||||
| Scene4 | ||||
| Scene5 | ||||
| Scene6 | ||||
| Scene7 | ||||
| Scene8 | ||||
| Scene9 | ||||
| Scene10 | ||||
| Scene11 | ||||
| Scene12 |
Table 2.
Accuracy comparison with the other models along the same ray direction.
| Point | Basic Matrix | Segmentation Matrix | Order Matrix | Coordinate matrix |
|---|---|---|---|---|
| P1 | ||||
| P2 | ||||
| P3 | ||||
| P4 | ||||
| P5 | ||||
| P6 | ||||
| P7 | ||||
| P8 | ||||
| P9 | ||||
| P10 | ||||
| P11 | ||||
| P12 |
Disclaimer/Publisher’s Note: The statements, opinions and data contained in all publications are solely those of the individual author(s) and contributor(s) and not of MDPI and/or the editor(s). MDPI and/or the editor(s) disclaim responsibility for any injury to people or property resulting from any ideas, methods, instructions or products referred to in the content. |
© 2025 by the authors. Licensee MDPI, Basel, Switzerland. This article is an open access article distributed under the terms and conditions of the Creative Commons Attribution (CC BY) license (http://creativecommons.org/licenses/by/4.0/).
Copyright: This open access article is published under a Creative Commons CC BY 4.0 license, which permit the free download, distribution, and reuse, provided that the author and preprint are cited in any reuse.


