
Submitted:
26 August 2025
Posted:
27 August 2025
You are already at the latest version
Abstract
Training users to correctly identify potential security threats like social engineering attacks such as phishing emails is a crucial aspect of cybersecurity. One challenge in this training is providing useful educational feedback to maximize student learning outcomes. Large Language Models (LLMs) have recently been applied to wider and wider applications, including domain-specific education and training. These applications of LLMs have many benefits, such as cost and ease of access, but there are potential biases and constraints within LLMs that may make them worse teachers for important and vulnerable subpopulations including the elderly and those with less technical knowledge. In this work we present a dataset of LLM embeddings of conversations between human students and LLM teachers in an anti-phishing setting. We apply these embeddings onto an analysis of human-LLM educational conversations to develop specific and actionable targets for LLM training, fine-tuning, and evaluation that can potentially improve the educational quality of LLM teachers and ameliorate potential biases that may disproportionally impact specific subpopulations.
Keywords:
cybersecurity
; phishing
; large language models
; embeddings
1. Introduction
Recent advances in Generative Artificial Intelligence (GAI) including the advent of foundational models such as Large Language Models (LLMs) have been fundamentally transformative, demonstrating unprecedented performance across a wide range of tasks, including text generation, sentiment analysis, and question answering [1,2]. While the generalist nature of LLMs and other GAI models has facilitated their broad applicability, it poses significant limitations in scenarios requiring nuanced, user-specific responses [3], such as in educational contexts like anti-phishing training [4]. One of the most critical efforts to prevent social harm done by these new technologies is the effective training against social engineering, deepfakes of news or other media, and other nefarious applications of GAI.
The complexity of social engineering attacks has significantly increased in recent months due in part to the advanced sophistication of GAI models [5]. These models can be used to quickly design new attacks from scratch using various methods such as translating previously used databases of attacks or create complex novel attacks leveraging images, video, text, and audio [6] in an attempt to increase the success of social engineering attempts. Despite the significant threat posed by GAI models such as LLMs in accelerating social engineering attacks [7,8,9], only 23% of companies polled by Proofpoint in 2024 had trained their employees on GAI safety [10].
One reason for this limitation of adequate training regarding GAI based phishing attacks is the high cost associated with traditional training methods such as in-person lecturing [11], and the time required to develop remote learning materials [12]. However, research has suggested that virtual learning of social engineering training can be more effective than in-person training [11]. A recent approach to addressing this limitation in GAI related training is to leverage GAI models themselves to design educational materials while providing feedback to users [4]. In the context of social engineering training in identifying phishing emails, this approach has the benefit of allowing for a training platform that can simultaneously generate realistic phishing attempts. While LLM supported training and education has benefits of easy access and scalability, it has issues related to domain specific knowledge and individualization of feedback in educational settings [13].
In this work we begin by presenting a dataset that serves to augment the original dataset presented by Malloy et al [4] that contains a set of messages sent between human students and an LLM teacher in an anti-phishing education platform. We augment this dataset with two embedding dictionaries; the first is a set of embeddings of the messages sent by LLM teachers and human students; the second is a set of embeddings of the open responses that students provided to describe the method that they used to determine if emails were phishing or not. After describing this presented dataset, we evaluate the usefulness of these embedding dictionaries by comparing the cosine similarity of the embeddings of messages sent by LLM teachers and students with the embeddings of the emails presented to students. These cosine similarity measurements are compared with several metrics of student learning performance, demographics, and other measures of the educational platform. We conclude this paper with a description of the results we present and a contextualization of these results with specific recommendations for improving LLM teaching methods.
2. Related Work
This section provides an overview of related work to place our study in context and show how it builds on previous research.
2.1. Anti-Phishing Education
Anti-Phishing education seeks to train end-users to correctly identify phishing emails they receive in real life and react appropriately. This education is an important first step in cybersecurity as user interaction with emails and other forms of social engineering is often the easiest means for cyberattackers to gain access to privileged information and services [14]. Part of the ease with which attackers can leverage emails is due to the high number of emails that users receive as a part of their daily work, which leads to a limited amount of attention being placed on each email [15]. Additionally, phishing emails are relatively rare to receive as many filtering and spam detection methods prevent them from being sent to users’ inboxes. For this reason, many users are relatively inexperienced with phishing emails and may incorrectly identify them [16]. Despite the commonality of cybersecurity education and training in many workplaces, social engineering including phishing emails remains a common method of attack with a significant impact on security [17].
Part of the challenge of anti-phishing education is defining the qualities of a good education platform and determining how to evaluate both the platform and the ability of users to detect emails in the real world. In their survey, Jampen et al. note the importance of anti-phishing education platforms that can equitably serve large and diverse populations in an inclusive manner [14]. This review compared ’user-specific properties and their impact on susceptibility to phishing attacks’ to identify key features of users such as age, gender, email experience, confidence, and distrust. This is crucial as cybersecurity preparedness is only as effective as its weakest link, meaning anti-phishing education platforms that only work for some populations are insufficient to appropriately address the dangers associated with phishing emails [18]. It is important for anti-phishing training platforms to serve populations as they vary across these features to ensure that the general population is safe and secure from attacks using phishing emails [19].
Another important area of research uses laboratory and on-line experiments with human participants engaged in a simulation of anti-phishing training to compare different approaches. This has the benefit of allowing for more theoretically justified comparisons, since traditional real-world anti-phishing education has high costs associated with it, making more direct comparisons difficult [17]. Some results within this area of research indicate that more detailed feedback, rather than only correct or incorrect information, significantly improves post-training accuracy in categorizing emails as either phishing or ham [20]. Additional studies indicate that personalizing LLM-generated detailed feedback to the individual user through prompt engineering can further improve the educational outcomes of these platforms [4,21]. However, these previous previous approaches do not involve the training or fine-tuning of more domain-specific models, and rely on off-the-shelf black box models using API calls to generate responses.
2.2. LLM Generated Phishing Emails
Several studies have highlighted that generative AI can be leveraged to create highly convincing phishing emails, significantly reducing the human and financial resources typically required for the creation of them [22,23,24,25,26,27]. This development is driven in part by the increasing ability of LLMs to maintain syntactic and grammatical integrity while they also embed cultural knowledge into artificially generated messages [28]. Moreover, with the capacity to generate multimedia elements such as images and audio, GAI can enhance phishing emails by adding elements that further support social engineering attacks [22]. The collection of personal data for targeting specific individuals can also be facilitated through AI-based tools [26].
In [25], Bethany et al. evaluated the effectiveness of GPT-4-generated phishing emails and confirmed their persuasive power in controlled studies. A related study, revealed that while human-crafted phishing emails still demonstrated a higher success rate among test subjects, they were also more frequently flagged as spam compared to those generated by GPT-3 models.[23] Targeted phishing attacks—commonly known as spear phishing—can also be rapidly and extensively generated by low experienced actors using GAI, as demonstrated in [26] experiments with a LLaMA-based model.
2.3. Automatic Phishing Detection
On the defensive side, research efforts are increasingly focused on countering these threats. The growing sophistication of LLM-generated phishing emails presents challenges for traditional phishing detection systems, many of which are no longer able to reliably identify such attacks. This issue has thus become a focal point in AI-driven cybersecurity research, which is particularly evident in the following two leading approaches.
[27] employed LLMs to rephrase phishing emails in order to augment existing phishing datasets, with the goal of improving the ability of detection systems to identify automatically generated phishing content. Their findings suggest that the detection of LLM-generated phishing emails often relies on different features and keywords than those used to identify traditional phishing emails.
LLM-generated phishing emails were also used in the approach of [25] to fine-tune various AI models, including BERT-, T5- and GPT-based architectures. Their results demonstrated a significant improvement in phishing detection performance across both human- and LLM-generated messages, compared to the baseline models.
2.4. LLM Personalization Methods
Personalization techniques have traditionally been extensively researched within information retrieval and recommendation systems but remain relatively underexplored in the context of LLMs [1]. Developing personalized and domain-specific educational LLMs involves leveraging user-specific data such as profiles, historical interactions, and preferences to tailor model outputs [29]. Effective personalization of LLMs is critical in domains such as conversational agents, education, healthcare, and content recommendation, where understanding individual preferences significantly enhances user satisfaction and engagement [29,30].
Recent literature highlights various strategies for personalizing LLMs, broadly categorized into fine-tuning approaches, retrieval augmentation, and prompt engineering [2,29,30]. Fine-tuning methods adapt LLM parameters directly to user-specific contexts, showing significant performance improvements in subjective tasks like sentiment and emotion recognition [2] . However, these approaches are resource-intensive and often impractical for real-time personalization across numerous users.
Retrieval augmentation, on the other hand, enhances personalization efficiency by dynamically incorporating external user-specific information at inference time without extensive model retraining [31]. Methods like LaMP utilize user profiles and historical data, selectively integrating relevant context through retrieval techniques [1]. More recently, frameworks such as OPEN-RAG have significantly improved reasoning capabilities within retrieval-augmented systems, especially when combined with open-source LLMs [30]. Prompt engineering and context injection represent lighter-weight approaches where user-specific information is embedded within the prompt or input context, guiding the LLM toward personalized responses [29,32]. These methods, while efficient, are limited by context length constraints and impermanent personalization.
2.5. Modeling Human Decision Making
In the original experiment that collected the dataset of educational conversations [4], there are three different conditions that are important to understand for our analysis of communication between students and the LLM teacher [4]. The main difference between these conditions is the presence or absence of a computational cognitive model using Instance Based Learning Theory (IBLT) [33], which is a mathematical framework that describes and predicts human decision making and learning in a variety of contexts [34]. This cognitive model is used to determine which emails to use as educational examples and/or to augment the prompting of the LLM that provides educational feedback to students. The remainder of this section will provide further background on cognitive modeling, and the following Dataset section will detail the differences between the experiment conditions more explicitly.
2.5.1. Decision Modeling in Cybersecurity
One of the most important aspects of cybersecurity is the human-factor, which is often the weakest link in cyberdefense [35], making the ability to understand and predict how humans make decisions in security contexts very valuable [36]. Some approaches to modeling the decisions that humans make in cybersecurity contexts rely on methods such as Reinforcement Learning (RL), which has been used in other contexts to understand how humans make decisions in a variety of contexts like game play and physical intuition [37], or collaboration with humans [38]. In the context of cybersecurity decision modeling, RL has been shown to accurately model how humans apply their experience in simulated ’red-team’ exercises to improve their ability as cyber-defenders [39]. In more abstract cybersecurity contexts, game-theoretic optimization has been applied to Stackelberg Security Games [40], which has been used in real world systems such a poaching prevention and fair evasion prevention [41].
A related line of research to applications of RL in decision modeling is the use of cognitive models of human learning and decision making that simulate the cognitive processes underlying human decision making in an attempt to emulate the biases and constraints of human decision making [34]. Using cognitive models to predict human decision making in cybersecurity has been applied onto the design of AI agents that better interact with humans in cybersecurity settings using IBL models[42]. By leveraging cognitive models, these AI agents can better predict human behavior which allows for improved collaboration in contexts like recommending actions to take in network security analysis [43], and in providing educational feedback to students in anti-phishing training [44]. Other approaches have used cognitive architectures like Soar [45], in conjunction with generative AI methods to design a cybersecurity-focused agent [46].
2.5.2. Decision Modeling from Complex Stimuli
One of the challenging aspects of predicting human decision making in cybersecurity contexts is the huge amount of information that is available to decision makers and the complexity of the stimuli that is used to make decisions. Another difficult aspect of decision modeling with complex stimuli is understanding how humans transfer their past experience onto new tasks [47]. This can include decision making and learning based on natural language or visual information which is difficult for traditional cognitive modeling methods to account for.
One approach to addressing this limitation of cognitive models has been to integrate Generative Artificial Intelligence (GAI) models into cognitive models to allow for predictions of human learning and decision making based on visual information [48], natural language, or a combination of both of these types of stimuli [49]. These approaches have also been used to understand how humans make decisions in large groups [50], which could have important future applications in cybersecurity contexts where there are many interacting actors. Still other approaches have sought to address wide ranging cognitive processes like memory, perception, motor control, and emotion through the integration of GAI models [51].
2.6. Decision Modeling Using LLM Embeddings
One method that has received recent attention in modeling human decision making based on natural language information is the use if LLM embeddings as part of the data within a cognitive model [52]. These types of integrations of LLMs and cognitive models have been used to predict how human students measure the similarity of different instances of their experience in an anti-phishing training platform [53]. This improvement in modeling human cognitive processes lead to better accuracy in predicting the behavior of students, which could be used to improve their educational outcomes [44]. This theory was tested in the paper that presented the original dataset [4], which showed improved educational outcomes by selecting emails to show students in anti-phishing training based on a cognitive model that uses LLM embeddings.
Other applications of LLM embeddings and cognitive models and architectures include an integration that uses the ACT-R cognitive architecture [54] and LLM embeddings to model human-like decision making in manufacturing applications [55]. Outside of the context of decisions specifically, other cognitive processes have used LLM embeddings as a part of their modeling such as in healthcare settings predicting the presence of dementia in patients [56].
3. Dataset
The experimental methods used to gather the dataset used for analysis in this work are described in [4] and made available on OSF by the original authors1. 417 participants made 60 total judgments about whether emails they were shown were safe or dangerous, with 8 different experiment conditions that varied the method of generating emails and the specifics of the LLM teacher prompting for educational feedback. These emails were gathered from a dataset of 1461 emails, with a variety of methods used to create these emails. In each of the four conditions we examine used educational example emails that were generated by a GPT-4 LLM model. While the experimentation methods contained 8 different conditions, we are interested only in the four conditions that involved conversations between users and the GPT-4.1 LLM chatbot. In each of these experiments, the participants were given feedback on the accuracy of their categorization from an LLM that they could also converse with.
Between these four conditions, the only difference was the presentation of emails to participants and the prompting of the LLM model for feedback. In the ‘base’ first condition, emails were selected randomly, and the LLM model was prompted to provide feedback based on the information in the email and the decision of the student. In the second condition, emails were selected by an IBL cognitive model in an attempt to give more challenging emails to the student, based on the past decisions they made. The third condition selected emails randomly but included information from the IBL cognitive model in the prompt to the LLM; specifically, this information was a prediction of which features of an email the current student may struggle with. Finally, the fourth condition combined the two previous ones, using the IBL cognitive model for both email selection and prompting.
In the original dataset, there are three sets of LLM embeddings of each email shown to participants using OpenAI API to access 3 embedding models (’text-embedding-3-large’, ’text-embedding-3-small’, and ’text-embedding-ada-002’) [57]. These embeddings were used alongside a cognitive model of human learning and decision making called Instance Based Learning [33,34,58] to predict the training progress of users. However, the original paper [4] did not directly analyze the conversations between end users and the LLM chatbots, and did not create a database of chatbot conversation embeddings.
In this work we introduce an embedding dictionary 2 of these messages and evaluate the usefulness of this embedding dictionary in different use cases. We also include in the same dataset an embedding dictionary of the open response replies that students gave at the end of the experiment to answer the question of how they determined if emails were safe or dangerous. In the majority of our analysis we combine the four conditions that included conversations with chatbots because the previously mentioned differences do not impact conversations between participants and the LLM chatbot.
This subset of the original dataset contained 3846 messages sent between chatbots and 146 different users during the anti-phishing training. Our introduced database of chatbot conversations and open response embeddings is constructed of the same 3 embedding models used by the authors in [4], for a total of 12789 embeddings in the dictionary. Another part of our analysis of these embeddings in the following section is the differences in usefulness of these email embeddings depending on the size and type of the embedding model.
4. Conversation Analysis
In this section we demonstrate the usefulness of the presented dataset of embeddings between users and the teacher LLM in this anti-phishing education context. We begin by comparing the cosine similarity of the embeddings of messages sent by students and the LLM teacher with the emails that the student was viewing when the message was sent. This is an exploratory analysis that serves to examine whether cosine similarity is correlated with three different student performance metrics. Code to generate all figures and statistical analysis in this section is included online3.
In all regression analyses in this section, we first bin the message embedding cosine similarities to email embeddings to the nearest 0.01, grouped based on the sender. Additionally, all message cosine similarity values on the x-axis are normalized to between 0-1 grouped by the message sender. This is the source of the values on the x-axis of each plot. Then, we plot as a scatterplot the averages for the metric on the y-axis of all of the binned messages. For example, in the left column of Figure 1, the leftmost blue point represents the average correct categorization for all trials where messages were sent that had embeddings with a cosine similarity to email embeddings of 0.00. The significance of these regressions is based on Pearson correlation coefficients with the and p values shown at the top of each subplot. Finally, each variable comparison (e.g correct categorization and message cosine similarity to email) has a T-Test run to compare the correlation in a different manner that does not use binned message cosine similarity values.
The first of these metrics is the percent of correct categorization by the student, the second is their confidence in the categorization, and the last is the reaction time of the student. Ideally, the teacher LLM would be providing feedback that is easy to quickly understand and leads to high confidence and correct categorizations. These three metrics are compared to the cosine similarity of emails with respect to both student and teacher message embeddings as shown in Figure 1.
4.1. Categorization Accuracy
The relationship between message cosine similarity and user categorization accuracy is shown on the middle column of Figure 1. The analysis of student accuracy in categorization revealed that both the human student’s and teacher LLM message cosine similarities to emails were positively associated with the likelihood of a correct categorization. The human student’s message-email cosine similarity showed a moderate positive correlation with correct categorization, that is not robust when evaluated with ANOVA (Pearson Correlation: , ANOVA: , , ). The teacher LLM’s message similarity exhibited a strong positive association with correct outcomes, a relationship further corroborated by statistically significant results from ANOVA (Pearson Correlation , ANOVA: , , ) These results indicate that student performance was higher when the messages sent by either them or their teacher were more closely related to the email that was being observed by the student. Furthermore, the ANOVA results indicate that the LLM’s message similarity is a substantially stronger predictor of correct categorization than the human student’s similarity.
4.2. Categorization Confidence
The relationship between message cosine similarity and user confidence in their categorization is shown in the middle column of Figure 1. The analysis of students’ categorization confidence showed a divergent trend for the student and the teacher in relation to message similarity. This is a surprising result, since the previous analysis of categorization accuracy indicated that both student and teacher messages that were more related to the current email were associated with better performance. However, confidence is a separate dimension from accuracy as low confidence correct answers and high confidence incorrect answers can change the relationship between message embedding similarities and this metric of student performance. The cosine similarity between a student’s message and the email content was negatively associated with the student’s confidence rating (Pearson Correlation: , ANOVA: , , ). In other words, students who more closely echoed the email’s content in their own messages tended to report lower confidence in their categorization decisions. By contrast, the teacher LLM’s message similarity showed a positive correlation with student confidence (Pearson Correlation: , ANOVA: , , ) , indicating that when the teacher’s response closely matched the email content, students tended to feel slightly more confident about their categorizations. All results in this case were shown to be significant with both methods used to determine.
4.3. Categorization Reaction Time
The relationship between message cosine similarity and reaction time is shown on the right hand side of Figure 1. The relationship between reaction time and message similarity differed markedly by role. There was no significant association between the human student’s message similarity and their reaction time, not with Pearson Correlation nor with ANOVA (Pearson Correlation: , ANOVA: , , ), indicating that how closely a student’s message mirrored the email content did not measurably influence how quickly they responded. In contrast, the teacher LLM’s message similarity was significantly associated with longer reaction times in regard to Pearson Correlation, but ANOVA also showed just a small effect size (Pearson Correlation: , ANOVA: , , ).
Higher cosine similarity between the teacher’s message and the email corresponded to increased time taken by students to complete the categorization task, even if the effect was not conventionally significant with ANOVA, it shows a trend. In practical terms, when the teacher’s response closely resembled the email text, students tended to require more time to finalize their categorization, whereas the student’s own content overlap had little to no observable effect on timing. These results are presented as correlational patterns (from the regression analysis) and do not imply causation, but they highlight that teacher-provided content overlap was linked to slower student responses while student-provided overlap was not.
4.4. Student Learning Outcomes
The next analysis that we perform is related to the learning outcomes of the students, as well as their responses to the post-experiment questionnaire that asked them questions about whether they thought the emails that they observed were written by humans or an LLM. Note that in the three conditions we examine here, all of the emails were written and stylized with HTML and CSS code by a GPT-4.1 LLM, meaning that the correct perception of emails as AI generated is 100 percent. The open response question that is analyzed on the right column of Figure 2 is the student’s response to the question of how they made their decisions about whether an email was safe or dangerous.
4.4.1. User Initial Performance
The left column of Figure 2 compares the average message cosine similarity to the current email being observed by the student with the initial performance of the student. Here we see that neither the messages sent by human students nor the teacher LLM are strongly correlated with user initial performance. There is a slight positive trend for both regressions where higher cosine similarity with student messages is associated with better initial performance (Pearson Correlation: , ANOVA: , , ), and similarly for teacher LLM similarity (Pearson Correlation , ANOVA: , , ). However, both of these have low correlations with high p-values and the ANOVA results show no significance and small effect sizes. This indicates that there is no relationship between the conversations of human students and LLM teachers and initial performance, at least when measured by message cosine similarity to emails. This makes intuitive sense as the messages between participants and students begin after this initial pre-training phase when there is no feedback yet.
4.4.2. User Training Outcomes
The middle column of Figure 2 compares the user improvement to our measure of message cosine similarity to emails. Here, we can see that only the messages sent by human students have cosine similarities to emails that are correlated with user improvement, supported by both, Pearson Correlation and ANOVA. However, interestingly this is actually a negative trend, meaning that higher human message cosine similarity to emails results in lower average user improvement (Pearson Correlation (Pearson Correlation: ANOVA: , , ). Meanwhile, this same comparison of teacher LLM messages shows no correlation at all (Pearson Correlation: ANOVA: , , ). This goes against the intuition that conversations that focus on the content of emails are beneficial to student learning outcomes that were established in the previous set of results. However, we believe they are not completely contradictory as a human student sending messages about specific parts of emails, even including specific passages of the email, may indicate a high level of confusion about the categorization.
4.4.3. User Final Performance
The right column of Figure 2 compares the user improvement to the message cosine similarity to emails. Similarly to the comparison to user improvement, here we see no correlation with the LLM teacher messages and user final performance (Pearson Correlation ANOVA: , , ), while the human emails have a similar negative correlation (Pearson Correlation ANOVA: , , ). Both correlation measures support these outcomes. This supports the conclusions of the previous comparison of regressions which suggested that participants who frequently make comments that reference specific parts of the emails they are shown may have worse training outcomes. Taking these results in mind while observing the results of regressions shown in Figure 1 suggests that LLM models should seek to make their feedback specific and reference the emails that are being shown to participants, but steer human participants away from focusing too much on the specifics of the email in question in their own messages.
4.5. Student Quiz Responses
The next set of cosine similarity analyses that we perform using the cosine similarity of messages and emails compares the performance of students on the quizzes they completed before and after training.
4.5.1. Student Pre-Experiment Quiz
The left column of Figure 3 compares the pre-experiment quiz score of students to the message cosine similarity between the emails and the messages sent by human students and LLM teachers. Here we see no correlation between the messages sent by either students (Pearson Correlation: , ANOVA: , , ) or teachers (Pearson Correlation: , ANOVA: , , ). As with the user initial performance, this makes intuitive sense since the base level of student ability shouldn’t have a direct impact on the way that students and teachers communicate relative to the email that the student is observing. One potential difference between these communications that is not directly measured in this analysis is the information within the email itself that may be focused on more or less in conversations depending on student initial ability.
4.5.2. Student Post-Experiment Quiz
The middle column of Figure 3 compares user participant perception of emails as being AI generated and the similarity of messages sent between human students and LLM teachers and the current email being observed. Here we see no correlation for messages sent by human students (Pearson Correlation: , ANOVA: , , ) or for messages sent by the LLM teacher (Pearson Correlation , ANOVA: , , ). There is a slight negative trend here where a lower perception of emails as being AI generated is slightly associated with a lower LLM teacher message cosine similarity. This is an interesting trend as the true correct percentage of emails that are AI generated is 100%, however this trend is not significant.
4.5.3. Student Post-Experiment Open Response
The right column of Figure 3 compares the similarity between the current email being observed by a student and the open response messages that they gave to the question of how they made their decisions of whether emails were safe or dangerous. Here we see the strongest and most significant trend over all of the embedding similarity regressions we have performed. There is a strong positive trend for both human student messages with both correlation measures (Pearson Correlation: , ANOVA: , , ) and LLM teacher messages (Pearson Correlation , ANOVA: , , ) where the more similar a message is to the email that the human student is observing, the more similar that message is to the open response question at the end of the experiment. For the LLM teacher messages, this effect shows less robust according to ANOVA.
4.6. User Demographics
The final set of cosine similarity regressions we perform compares the similarity of messages sent by human students and LLM teachers and the different demographics measurements that were included in the original dataset.
4.6.1. Age
Comparing the age of participants and their conversations demonstrates a significant correlation to the messages sent by human students (Pearson Correlation: , ANOVA: , , ), and an insignificant but present trend for the messages sent by the Teacher LLM (Pearson Correlation: , ANOVA: , , ). Both of these correlations trend negative, indicating that older participants have less correlation in the messages they send and the emails they are currently observing. ANOVA confirms a small-to-moderate effect of this for the student-message similarity over groups, while being not conventionally significant.
4.6.2. Gender
To perform a regression in the same format as the previous analyses, we arbitrarily assigned female to a value of 1 and male to a value of 0 (there were 0 non-binary students in this subset of the original dataset). This allowed for an analysis, shown in the top-middle of Figure 4, which shows no correlation between the gender number of students and the messages sent by either human students (Pearson Correlation: , ANOVA: , , ) or by teacher LLMs (Pearson Correlation: , ANOVA: , , ). This indicates that male and female students sent similar messages, and that the LLM replied with similar messages. While these results are insignificant, they do suggest that accounting for gender differences in how LLM teaching models give feedback to students is less of a priority compared to other subpopulations of students.
4.6.3. Education
Comparing the similarity of embeddings of messages sent between human students and LLM teachers demonstrates a correlation with the years of education that the student has received for messages sent by the human student (Pearson Correlation: , ANOVA: , , ) but not for the messages sent by the teacher LLM (, ANOVA: , , ). The positive trend between the number of years of education and the human student message cosine similarity to emails indicates that students with higher education send messages that more closely match the information contained in the emails they are observing. This effect is continuous but not significant with ANOVA, so it is more a trend showing than a stepwise jump between education categories. As mentioned with regards to age, education level is another important group to account for when improving educational outcomes, meaning education level could be a target for future improvement in LLM teacher feedback.
4.6.4. Phishing Experience
The next analysis we performed compared the level of phishing experience of human students, as measured by the response that students gave to the number of times that they have received a phishing email. We again mapped this discrete categorization onto a value to perform a regression. When we compare this measure of experience to the cosine similarity of messages sent and emails, we see no significant correlation in either messages sent by human students (Pearson Correlation: , ANOVA: , , ) or the teacher LLM (Pearson Correlation: , ANOVA: , , ). While insignificant, both of these regressions demonstrate a slightly positive trend suggesting that more experienced users may be more likely to send messages related to the emails they are observing.
4.6.5. Chatbot Experience
Similar to phishing experience, chatbot experience was determined by mapping a multiple choice question onto values to allow for a regression. Interestingly, we see no correlation between email embeddings and the embeddings of messages sent by either human students (Pearson Correlation: , ANOVA: , , ) or teacher LLMs (Pearson Correlation: , ANOVA: , , ), with both regressions displaying near 0 trends and high p-values. This indicates that the conversations during training were equally likely to be related to the emails that were being observed by participants whether the student had little or a high amount of experience with LLM chatbots. Typically we would assume that participants would converse differently if they had more experience, but here it is important to note we are comparing one specific aspect of the messages, whether they are related to the email being observed, meaning other comparisons of these conversations may display a difference across chatbot experience level.
4.6.6. Cognitive Model Activity
The final regression that we perform looked at the ’cognitive model activity’, which is a stand-in for the condition of the experiment. While not directly a demographic, this did compare the messages sent by humans and the LLM based on the condition of the experiment. This metric was determined based on whether the IBL cognitive model used in the experiment performed no role (0), either determined the emails to send to participants or was used to prompt the LLM (1), or if the IBL model performed both of these tasks (2).
Comparing this measure of cognitive model activity which differed across experiment conditions demonstrates a positive and significant trend for messages sent by the LLM teacher (Pearson Correlation: , ANOVA: , , ) but not for messages sent by the student (Pearson Correlation: , ANOVA: , , ). Some difference between the messages sent by the LLM model is expected, since they are prompted for feedback in different ways across different experiments. However the specific difference that a stronger connection between the IBL cognitive model and LLM providing natural language feedback was not directly mentioned in the original work [4]. This indicates that the Cognitive LLMs proposed in the original work are more likely to send messages that are similar to the emails currently being observed by participants, consistent with the positive correlation despite minimal group differences indicated by ANOVA.

Table 1.
Significant Mediation Effects on Correct Categorization.
| Context | Indirect Coef. | SE | p | CI 2.5% | CI 97.5% | Sig |
| (Student+Teacher) ∼ | ||||||
| Age | -0.00586 | 0.00238 | 0.012 | -0.0109 | -0.0019 | Yes |
| (Student+Teacher) ∼ | ||||||
| AI Generation Perception | 0.00395 | 0.00220 | 0.044 | 0.000156 | 0.00834 | Yes |
| (Student+Teacher) ∼ | ||||||
| Response Message Similarity | 0.00884 | 0.00347 | 0.004 | 0.00285 | 0.0157 | Yes |
| (Teacher) ∼ | ||||||
| Education Years | -0.00582 | 0.00292 | 0.020 | -0.0131 | -0.00137 | Yes |
| (Teacher) ∼ | ||||||
| Response Message Similarity | 0.00922 | 0.00296 | 0.000 | 0.00459 | 0.0165 | Yes |
4.7. Mediation Analysis
In addition to regression analyses, we are interested in the impact of each of the demographic variables (Figure 3-4) on measures of student performance (Figure 1-2). For brevity, we focus our analysis on demographic measure impact on correct categorization. Mediation analysis can be used to test whether the impact of a variable X on Y is at lest partially explained by the effects of an intermediate variable M, called the ’mediator’ [59]. This analysis is commonly used in social psychology [60], human-computer interaction [61], and in LLM research such as investigations of potential gender biases in LLMs [62]. This analysis was performed using the Pingouin python library package [63]. All of the significant mediation effects reported in this section are summarized in Table 1.
4.7.1. Mediation of Student and Teacher Messages
Our first set of mediation analyses compared whether the impact of demographic variables on student correct categorization could be mediated by the cosine similarity of student or teacher message embeddings and email embeddings. Out of all of the demographic variables, three significant mediation effects were observed. The first was Age, which had a significant total effect , a significant direct effect , and a significant indirect effect .
The next significant mediation effect was of the effect of AI generation perception on correct categorization. There was a significant total effect , direct effect and indirect effect .
The final significant mediation effect when using both student and teacher message similarities as a mediator is Response Message Similarity which had a significant total effect , direct effect , and indirect effect
4.7.2. Mediation of Teacher Messages Only
The first of the two significant mediation effects with respect to teacher message cosine similarity to emails is on Education Years which had a significant total effect , direct effect , and indirect effect .
The second significant effect of teacher messages is that of Response Message Similarity which had a significant total effect , direct effect , and indirect effect .
5. Results
Across the 30 regressions that we performed, 12 reached statistical significance and 6 of the others showed meaningful trends. We additionally performed 25 mediation analyses which showed 5 significant mediation effects. Taken together, these results form a coherent picture of how email embedding cosine similarity to embeddings of messages sent by both students and teachers relates to student performance and learning. The following analyses summarize and synthesize the results of our message-email similarity analysis and make actionable recommendations for both real-world online training platforms and future studies of human learning using natural language feedback provided by LLMs.
In categorization accuracy, both student and teacher message-email similarity were positively correlated with student categorization accuracy. The similarity between the student message and email with the emails showed a moderate effect that is not consistent across categories, while this same metric for the LLM teacher messages showed a strong effect that is also confirmed by ANOVA score, suggesting that the LLM teacher messages that closely aligned with the observed email were most useful for guiding correct responses. This makes intuitive sense since feedback for participants that references the email they are currently observing would typically be more relevant than less email-related feedback. While this analysis is correlational, it does demonstrate one area that future LLMs could be trained to optimize, by encouraging or preferring responses that are more closely related to the emails that students are currently categorizing.
Building on this, the confidence results gave important insights: students who echoed the content of the emails more closely actually felt less confident, whereas higher teacher message-email similarity increased confidence. This correlation indicates that a student who is frequently making questions or comments that directly reference parts of the emails in the training might indicate someone who needs more experience and varied feedback to achieve higher improvement levels. Taken together, these findings indicate that while alignment with the email improves accuracy, when it is the student providing the overlap, it may signal uncertainty, whereas teacher-provided overlap reassures students.
For LLM-supported learning platforms, this finding suggests potential avenues for development toward greater user engagement in the conversation with the LLM teacher during email categorization, which also extends the insights reported in [4,21]. Also, such a level of guidance cannot be provided in traditional in-person training [11].
With taking also reaction times into account, we found that teacher message-email similarity was significantly associated with longer response times in terms of Pearson Correlation, while student message cosine message-email similarity showed no significant effect. The ANOVA results suggested that neither variable exerted a statistically significant effect. While accuracy and confidence are clear objectives for improvement, which are both increased with higher teacher message-email similarity, a preference for either higher or lower reaction time is less obvious. Taking these results on reaction into account with the previous correlation analysis may indicate that while teacher message-email similarity may improve the important metrics of accuracy and confidence, that may come at the cost of a longer time requirement for students. In some educational scenarios this may be a trade-off, if student time is a significantly constrained resource. However, in other settings the improvement on accuracy and confidence correlated with teacher message-email similarity may be much more important, meaning the increased time requirement is relatively irrelevant.
When we turn from immediate task performance to learning outcomes, the results show a different pattern. Greater similarity between student message and the email text was negatively associated with both learning improvement and final performance, while teacher message-email similarity showed no significant relationship in either case. So high student message-email similarity predicts weaker learning, suggesting that anti-phishing training should encourage flexible strategies rather than focusing on specific examples. Taken together with the results on confidence and accuracy, this set of findings indicates that student message-email similarity is positively associated with immediate correctness but negatively associated with learning gains and final outcomes, while teacher message-email similarity is linked to immediate performance benefits without clear effects on longer-term improvement.
Students who closely echo phishing emails may rely too heavily on surface features, indicating that training should emphasize broader pattern recognition rather than simple repetition. Overall, over-reliance on specific email features may hinder broader learning and decision-making, highlighting the importance of teaching generalizable strategies for identifying phishing attempts. This becomes particularly important in the context of GAI-generated phishing emails, as these may be detected based on patterns beyond mere textual features [22,23,25].
The strongest effects we observed came in the post-experiment open responses, where both student and teacher message-email similarity were strongly and positively related to the strategies that students reported using. This is an interesting result as the open response questions ask the student to reply on their general strategy, rather than a specific email they observed. This indicates that it may be useful for LLM teachers to discuss the strategies that students use to determine if an email is safe during their feedback conversations with students.
Because these questions asked students to describe their general strategy rather than respond to a specific email, this suggests that anti-phishing training could benefit from emphasizing strategy development over rote memorization of individual examples [20], building on what was previously outlined in this regard. GAI LLMs could support this by providing strategy-focused feedback and offering personalized prompts when students rely too heavily on surface cues, as well as guiding post-task reflection on the strategies applied. Together, these approaches could help address a common challenge in phishing defense: students’ tendency to over-rely on specific email features rather than developing robust, transferable detection strategies.
Our analysis of the LLM teacher and human student message-email similarity with respect to student demographics revealed important implications for improving diversity, equity, and inclusion in online training platforms. One of the most important aspects of equality in education is effective progress for students of all ages. This is especially important in anti-phishing education and the elderly as they are one of the most susceptible subpopulations with regards to phishing attempts [64]. These results indicate that older age groups may be less likely to have conversations about the specific emails they are observing in anti-phishing training. Taking this into account when providing natural language educational feedback could improve the learning outcomes of more aged individuals.
Finally, our analysis of mediation effects provided further support to the evidence that the types of messages that are sent between students and teachers, as well as the types of messages teachers send independently, can alter the impact of demographics on student performance. This was identified by the five mediation analyses with significant indirect effects, demonstrating that part of the impact of these demographics effects on correct categorization can be explained in part by effects related to how students and teachers communicate. This indicates that by improving the way that teacher LLMs, such as by using the metrics we suggest in this section, there maybe a similar improvement in the performance of students that reduces the biases related to specific subpopulations of students. This is a major target for improving LLM teacher quality, as it can potentially lead to more equitable outcomes in the application of LLM teachers, and reduce some of the concern over their widespread adoption.
6. Discussion
In this work we present a dataset of embeddings of messages sent between LLM teachers and human students in an online anti-phishing educational platform. The goal of this dataset is to be applied onto improving the quality of LLM teacher educational feedback in a way that can account for potential biases that exist within LLMs that raise concerns regarding their widespread adoption. Our analysis revealed relationships between metrics of educational outcomes and the semantic alignment of educational feedback discussions, as measured by the cosine similarity of message embeddings and the educational email embeddings. In general, we found that when the LLM teacher’s feedback closely mirrored the content of the email under discussion, students performed better on the immediate task. We additionally found some correlations between these educational outcomes and the similarity of student messages to email examples, but overall the conclusions were more mixed compared to the analysis of teacher messages. Additionally, our mediation analysis provided further support that teacher message and email embedding similarity can serve as a mediator for the effect of several important demographics on the impact of student performance.
These results suggest that message-email similarity can be an important target for testing methods in training, fine-tuning, and prompting without the requirement of running additional tests with human subjects which can be costly, or relying on simulated LLM students which can have issues transferring to real world student educational improvement. Moreover, these results have applications outside of describing targets for testing methods by detailing some of the most important subpopulations to focus on for improvement of the quality of LLM teacher responses in the content of anti-phishing training. Specifically, age, education, phishing experience and experience with AI chatbots were identified as demographics in which certain subpopulations may be disproportionally negatively impacted by lower quality teacher LLMs. Our mediation analysis, as well as ANOVA and regression analyses, provided evidence that improving the quality of LLM teacher responses using the methods we suggest can have a positive impact on the educational outcomes of these subpopulations.
Another possible approach to incorporate the lessons learned from this work into the design of new LLM teaching models is to attempt to detect and address learner confusion over phishing emails proactively. The negative correlation of student message similarity with learning outcomes indicates that over-fixation on specific aspects of the email examples can be a real-time signal that LLM teachers can use to adjust their feedback. Whether done through chain of thought reasoning or other methods, leveraging the similarity of user messages to their emails can give insight into their learning and indicate a way to improve training by adjusting the teaching approach in response to these types of messages. In the dataset we present, we noted a correlation between teacher and student message similarity with respect to several metics, which indicates that LLM teachers are often similarly narrow-focused as students. The degree of this specificity could be adjusted in response to student message similarity to emails, and avoid merely mirroring the specificity that user messages exhibit.
In addition to the significant positive correlations we report, there are also interesting negative correlations that differ from expectations given the correlation of other demographics and educational metrics. Specifically, we found that students who frequently send messages that are more closely related to the emails being observed actually had worse overall performance and training improvement. This can be explained by several different causes, such as less knowledgeable students more often choosing to ask questions that make reference to specific aspects of the emails they are observing, rather than the topic they are learning more broadly. This type of effect may allow for a chain of thought reasoning LLM model to identify when students are sending messages of this type, and adjust the method of providing educational feedback based on this insight.
By implementing these recommendations, anti-phishing and other types of online training platforms that use LLMs can potentially produce more responsive educational tools rather than one-size-fits-all chatbots that could disproportionally negatively impact the educational quality of important subpopulations. However, there are limitations to this work that raise important areas for future research. As mentioned, we performed only regression and mediation analysis on the demographics and learning outcomes of the dataset we had available, and our introduced embeddings of conversations. While this allowed us to make useful recommendations for future LLM teaching models, it is a limited view of the ways that LLM models can be improved. One useful area of future research that could leverage this same dataset or collect new data would be to compare the prompting of the LLMs and how they output educational feedback. LLM prompting was not a major investigation of this research as we chose to create embeddings of messages themselves, but a similar approach using LLM prompts could also be used to draw conclusions for important targets of LLM teacher optimization.
Appendix A.
Appendix A.1. ANOVA Analyses Tables
Table A1.
ANOVA results relating Message–Email ECSS to outcomes.
| Source | Outcome | F | p | |||
| Student | Correct | 22 | 464 | |||
| Teacher | Correct | 25 | 1720 | |||
| Student | Confidence | 22 | 464 | |||
| Teacher | Confidence | 25 | 1720 | |||
| Student | ReactionTime | 22 | 464 | |||
| Teacher | ReactionTime | 25 | 1720 | |||
| Student | User Initial Performance | 22 | 464 | |||
| Teacher | User Initial Performance | 25 | 1720 | |||
| Student | User Improvement | 22 | 464 | |||
| Teacher | User Improvement | 25 | 1720 | |||
| Student | User Final Performance | 22 | 464 | |||
| Teacher | User Final Performance | 25 | 1720 | |||
| Student | Pre-Experiment Quiz Score | 22 | 464 | |||
| Teacher | Pre-Experiment Quiz Score | 25 | 1720 | |||
| Student | AI Gen Percept | 22 | 464 | |||
| Teacher | AI Gen Percept | 25 | 1720 | |||
| Student | Response Mssg Sim | 22 | 464 | |||
| Teacher | Response Mssg Sim | 25 | 1720 | |||
| Student | Age | 22 | 464 | |||
| Teacher | Age | 25 | 1720 | |||
| Student | Gender Number | 22 | 464 | |||
| Teacher | Gender Number | 25 | 1720 | |||
| Student | Education Years | 22 | 464 | |||
| Teacher | Education Years | 25 | 1720 | |||
| Student | Phishing Experience | 22 | 464 | |||
| Teacher | Phishing Experience | 25 | 1720 | |||
| Student | Chatbot Experience | 22 | 464 | |||
| Teacher | Chatbot Experience | 25 | 1720 | |||
| Student | Cognitive Model Activity | 22 | 464 | |||
| Teacher | Cognitive Model Activity | 25 | 1720 |
Appendix A.2. Mediation Analyses
Table A2.
Mediation analysis Student and Teacher Messages on User Improvement by Age.
| Path | Coef. | SE | p | CI 2.5% | CI 97.5% | Sig |
| Age | ||||||
| ∼ Age | -0.0609 | 0.0211 | 0.00396 | -0.102 | -0.0195 | Yes |
| User Improvement | ||||||
| ∼ Age | 0.00136 | 0.0212 | 0.949 | -0.0402 | 0.0429 | No |
| Total | -0.0264 | 0.0212 | 0.212 | -0.0679 | 0.0151 | No |
| Direct | -0.0264 | 0.0212 | 0.213 | -0.068 | 0.0151 | No |
| Indirect | 0.00116 | 0.98 | -0.00254 | 0.00219 | No |
Table A3.
Mediation analysis Student and Teacher Messages on User Improvement by Education Years
| Path | Coef. | SE | p | CI 2.5% | CI 97.5% | Sig |
| Education Years | ||||||
| ∼ Education Years | -0.0326 | 0.0212 | 0.124 | -0.0741 | 0.00893 | No |
| User Improvement | ||||||
| ∼ Education Years | -0.214 | 0.0207 | -0.255 | -0.173 | Yes | |
| Total | -0.0264 | 0.0212 | 0.212 | -0.0679 | 0.0151 | No |
| Direct | -0.0334 | 0.0207 | 0.106 | -0.074 | 0.00713 | No |
| Indirect | 0.007 | 0.00466 | 0.1 | -0.00167 | 0.017 | No |
Table A4.
Mediation analysis Age Messages on Correct Categorization by Student and Teacher
| Path | Coef. | SE | p | CI 2.5% | CI 97.5% | Sig |
| Message Email Similarity | ||||||
| ∼ Age | -0.0609 | 0.0211 | 0.00396 | -0.102 | -0.0195 | Yes |
| User Improvement | ||||||
| ∼ Message Email Similarity | 0.093 | 0.0211 | 0.0516 | 0.134 | Yes | |
| Total | 0.046 | 0.0211 | 0.0299 | 0.00448 | 0.0874 | Yes |
| Direct | 0.0518 | 0.0211 | 0.0141 | 0.0104 | 0.0932 | Yes |
| Indirect | -0.00586 | 0.00238 | 0.012 | -0.0109 | -0.0019 | Yes |
Table A5.
Mediation analysis Education Years Messages on Correct Categorization by Student and Teacher
Table A5.
Mediation analysis Education Years Messages on Correct Categorization by Student and Teacher
| Path | Coef. | SE | p | CI 2.5% | CI 97.5% | Sig |
| Message Email Similarity | ||||||
| ∼ Education Years | -0.0326 | 0.0212 | 0.124 | -0.0741 | 0.00893 | No |
| User Improvement | ||||||
| ∼ Message Email Similarity | 0.093 | 0.0211 | 0.0516 | 0.134 | Yes | |
| Total | -0.151 | 0.0209 | -0.192 | -0.11 | Yes | |
| Direct | -0.148 | 0.0209 | -0.189 | -0.107 | Yes | |
| Indirect | -0.00287 | 0.00208 | 0.1 | -0.0085 | 0.000427 | No |
Table A6.
Mediation analysis Phishing Experience Messages on Correct Categorization by Student and Teacher
Table A6.
Mediation analysis Phishing Experience Messages on Correct Categorization by Student and Teacher
| Path | Coef. | SE | p | CI 2.5% | CI 97.5% | Sig |
| Message Email Similarity | ||||||
| ∼ Phishing Experience | 0.0242 | 0.0212 | 0.254 | -0.0173 | 0.0657 | No |
| User Improvement | ||||||
| ∼ Message Email Similarity | 0.093 | 0.0211 | 0.0516 | 0.134 | Yes | |
| Total | 0.172 | 0.0209 | 0.131 | 0.213 | Yes | |
| Direct | 0.17 | 0.0208 | 0.129 | 0.211 | Yes | |
| Indirect | 0.00215 | 0.00202 | 0.26 | -0.00159 | 0.0064 | No |
Table A7.
Mediation analysis Chatbot Experience Messages on Correct Categorization by Student and Teacher
Table A7.
Mediation analysis Chatbot Experience Messages on Correct Categorization by Student and Teacher
| Path | Coef. | SE | p | CI 2.5% | CI 97.5% | Sig |
| Message Email Similarity | ||||||
| ∼ Chatbot Experience | 0.000442 | 0.0212 | 0.983 | -0.0411 | 0.042 | No |
| User Improvement | ||||||
| ∼ Message Email Similarity | 0.093 | 0.0211 | 0.0516 | 0.134 | Yes | |
| Total | -0.0209 | 0.0212 | 0.323 | -0.0624 | 0.0206 | No |
| Direct | -0.021 | 0.0211 | 0.32 | -0.0623 | 0.0204 | No |
| Indirect | 0.00202 | 0.94 | -0.00374 | 0.00476 | No |
Table A8.
Mediation analysis AI Generation Perception Messages on Correct Categorization by Student and Teacher
Table A8.
Mediation analysis AI Generation Perception Messages on Correct Categorization by Student and Teacher
| Path | Coef. | SE | p | CI 2.5% | CI 97.5% | Sig |
| Message Email Similarity | ||||||
| ∼ AI Generation Perception | 0.0403 | 0.0212 | 0.0567 | -0.00115 | 0.0818 | No |
| User Improvement | ||||||
| ∼ Message Email Similarity | 0.093 | 0.0211 | 0.0516 | 0.134 | Yes | |
| Total | -0.12 | 0.021 | -0.161 | -0.0788 | Yes | |
| Direct | -0.124 | 0.0209 | -0.165 | -0.0829 | Yes | |
| Indirect | 0.00395 | 0.0022 | 0.044 | 0.000156 | 0.00834 | Yes |
Table A9.
Mediation analysis Pre Experiment Quiz Score Messages on Correct Categorization by Student and Teacher
Table A9.
Mediation analysis Pre Experiment Quiz Score Messages on Correct Categorization by Student and Teacher
| Path | Coef. | SE | p | CI 2.5% | CI 97.5% | Sig |
| Message Email Similarity | ||||||
| ∼ Pre Experiment Quiz Score | -0.0079 | 0.0212 | 0.709 | -0.0494 | 0.0336 | No |
| User Improvement | ||||||
| ∼ Message Email Similarity | 0.093 | 0.0211 | 0.0516 | 0.134 | Yes | |
| Total | 0.0702 | 0.0211 | 0.0288 | 0.112 | Yes | |
| Direct | 0.0709 | 0.021 | 0.0297 | 0.112 | Yes | |
| Indirect | -0.000738 | 0.00204 | 0.684 | -0.0046 | 0.00331 | No |
Table A10.
Mediation analysis Response Message Similarity Messages on Correct Categorization by Student and Teacher
Table A10.
Mediation analysis Response Message Similarity Messages on Correct Categorization by Student and Teacher
| Path | Coef. | SE | p | CI 2.5% | CI 97.5% | Sig |
| Message Email Similarity | ||||||
| ∼ Response Message Similarity | 0.149 | 0.0209 | 0.108 | 0.191 | Yes | |
| User Improvement | ||||||
| ∼ Message Email Similarity | 0.093 | 0.0211 | 0.0516 | 0.134 | Yes | |
| Total | 0.235 | 0.0206 | 0.195 | 0.275 | Yes | |
| Direct | 0.226 | 0.0208 | 0.185 | 0.267 | Yes | |
| Indirect | 0.00884 | 0.00347 | 0.004 | 0.00285 | 0.0157 | Yes |
Table A11.
Mediation analysis Age Messages on Correct Categorization by Teacher
| Path | Coef. | SE | p | CI 2.5% | CI 97.5% | Sig |
| Message Email Similarity | ||||||
| ∼ Age | -0.0347 | 0.0239 | 0.147 | -0.0817 | 0.0122 | No |
| User Improvement | ||||||
| ∼ Message Email Similarity | 0.109 | 0.0238 | 0.0625 | 0.156 | Yes | |
| Total | 0.0323 | 0.0239 | 0.177 | -0.0146 | 0.0793 | No |
| Direct | 0.0362 | 0.0238 | 0.129 | -0.0105 | 0.0829 | No |
| Indirect | -0.00383 | 0.00258 | 0.1 | -0.00978 | 0.00013 | No |
Table A12.
Mediation analysis Education Years Messages on Correct Categorization by Teacher
| Path | Coef. | SE | p | CI 2.5% | CI 97.5% | Sig |
| Message Email Similarity | ||||||
| ∼ Education Years | -0.0563 | 0.0239 | 0.0186 | -0.103 | -0.00944 | Yes |
| User Improvement | ||||||
| ∼ Message Email Similarity | 0.109 | 0.0238 | 0.0625 | 0.156 | Yes | |
| Total | -0.109 | 0.0238 | -0.155 | -0.0619 | Yes | |
| Direct | -0.103 | 0.0237 | -0.149 | -0.0562 | Yes | |
| Indirect | -0.00582 | 0.00292 | 0.02 | -0.0131 | -0.00137 | Yes |
Table A13.
Mediation analysis Phishing Experience Messages on Correct Categorization by Teacher
| Path | Coef. | SE | p | CI 2.5% | CI 97.5% | Sig |
| Message Email Similarity | ||||||
| ∼ Phishing Experience | -0.00269 | 0.0239 | 0.91 | -0.0497 | 0.0443 | No |
| User Improvement | ||||||
| ∼ Message Email Similarity | 0.109 | 0.0238 | 0.0625 | 0.156 | Yes | |
| Total | 0.0798 | 0.0239 | 0.033 | 0.127 | Yes | |
| Direct | 0.0801 | 0.0237 | 0.0336 | 0.127 | Yes | |
| Indirect | -0.000295 | 0.00264 | 0.848 | -0.00468 | 0.00516 | No |
Table A14.
Mediation analysis Chatbot Experience Messages on Correct Categorization by Teacher
| Path | Coef. | SE | p | CI 2.5% | CI 97.5% | Sig |
| Message Email Similarity | ||||||
| ∼ Chatbot Experience | 0.0254 | 0.0239 | 0.288 | -0.0215 | 0.0724 | No |
| User Improvement | ||||||
| ∼ Message Email Similarity | 0.109 | 0.0238 | 0.0625 | 0.156 | Yes | |
| Total | -0.0248 | 0.0239 | 0.301 | -0.0717 | 0.0222 | No |
| Direct | -0.0275 | 0.0238 | 0.247 | -0.0742 | 0.0192 | No |
| Indirect | 0.00279 | 0.00288 | 0.316 | -0.00189 | 0.00933 | No |
Table A15.
Mediation analysis AI Generation Perception Messages on Correct Categorization by Teacher
Table A15.
Mediation analysis AI Generation Perception Messages on Correct Categorization by Teacher
| Path | Coef. | SE | p | CI 2.5% | CI 97.5% | Sig |
| Message Email Similarity | ||||||
| ∼ AI Generation Perception | 0.00958 | 0.0239 | 0.689 | -0.0374 | 0.0565 | No |
| User Improvement | ||||||
| ∼ Message Email Similarity | 0.109 | 0.0238 | 0.0625 | 0.156 | Yes | |
| Total | -0.082 | 0.0239 | -0.129 | -0.0351 | Yes | |
| Direct | -0.083 | 0.0237 | -0.13 | -0.0365 | Yes | |
| Indirect | 0.00105 | 0.00283 | 0.756 | -0.00371 | 0.00719 | No |
Table A16.
Mediation analysis Pre Experiment Quiz Score Messages on Correct Categorization by Teacher
Table A16.
Mediation analysis Pre Experiment Quiz Score Messages on Correct Categorization by Teacher
| Path | Coef. | SE | p | CI 2.5% | CI 97.5% | Sig |
| Message Email Similarity | ||||||
| ∼ Pre Experiment Quiz Score | 0.00486 | 0.0239 | 0.839 | -0.0421 | 0.0518 | No |
| User Improvement | ||||||
| ∼ Message Email Similarity | 0.109 | 0.0238 | 0.0625 | 0.156 | Yes | |
| Total | 0.052 | 0.0239 | 0.0298 | 0.00511 | 0.0989 | Yes |
| Direct | 0.0515 | 0.0238 | 0.0305 | 0.00484 | 0.0981 | Yes |
| Indirect | 0.000529 | 0.00242 | 0.88 | -0.0038 | 0.00657 | No |
Table A17.
Mediation analysis Response Message Similarity Messages on Correct Categorization by Teacher
Table A17.
Mediation analysis Response Message Similarity Messages on Correct Categorization by Teacher
| Path | Coef. | SE | p | CI 2.5% | CI 97.5% | Sig |
| Message Email Similarity | ||||||
| ∼ Response Message Similarity | 0.106 | 0.0238 | 0.0591 | 0.153 | Yes | |
| User Improvement | ||||||
| ∼ Message Email Similarity | 0.109 | 0.0238 | 0.0625 | 0.156 | Yes | |
| Total | 0.217 | 0.0234 | 0.171 | 0.263 | Yes | |
| Direct | 0.208 | 0.0234 | 0.162 | 0.254 | Yes | |
| Indirect | 0.00922 | 0.00296 | 0.00459 | 0.0165 | Yes |
Table A18.
Mediation analysis Age Messages on Correct Categorization by Student
| Path | Coef. | SE | p | CI 2.5% | CI 97.5% | Sig |
| Message Email Similarity | ||||||
| ∼ Age | -0.131 | 0.045 | 0.00371 | -0.22 | -0.0428 | Yes |
| User Improvement | ||||||
| ∼ Message Email Similarity | 0.0628 | 0.0453 | 0.166 | -0.0262 | 0.152 | No |
| Total | 0.092 | 0.0452 | 0.0424 | 0.00316 | 0.181 | Yes |
| Direct | 0.102 | 0.0455 | 0.0255 | 0.0126 | 0.191 | Yes |
| Indirect | -0.01 | 0.00724 | 0.104 | -0.0292 | 0.000972 | No |
Table A19.
Mediation analysis Education Years Messages on Correct Categorization by Student
| Path | Coef. | SE | p | CI 2.5% | CI 97.5% | Sig |
| Message Email Similarity | ||||||
| ∼ Education Years | 0.0234 | 0.0454 | 0.607 | -0.0658 | 0.113 | No |
| User Improvement | ||||||
| ∼ Message Email Similarity | 0.0628 | 0.0453 | 0.166 | -0.0262 | 0.152 | No |
| Total | -0.247 | 0.044 | -0.333 | -0.16 | Yes | |
| Direct | -0.248 | 0.044 | -0.334 | -0.162 | Yes | |
| Indirect | 0.0016 | 0.00366 | 0.58 | -0.00317 | 0.0116 | No |
Table A20.
Mediation analysis Phishing Experience Messages on Correct Categorization by Student
| Path | Coef. | SE | p | CI 2.5% | CI 97.5% | Sig |
| Message Email Similarity | ||||||
| ∼ Phishing Experience | 0.0839 | 0.0452 | 0.0642 | -0.00498 | 0.173 | No |
| User Improvement | ||||||
| ∼ Message Email Similarity | 0.0628 | 0.0453 | 0.166 | -0.0262 | 0.152 | No |
| Total | 0.353 | 0.0425 | 0.269 | 0.436 | Yes | |
| Direct | 0.35 | 0.0427 | 0.266 | 0.434 | Yes | |
| Indirect | 0.00281 | 0.00433 | 0.5 | -0.00345 | 0.0142 | No |
Table A21.
Mediation analysis Chatbot Experience Messages on Correct Categorization by Student
| Path | Coef. | SE | p | CI 2.5% | CI 97.5% | Sig |
| Message Email Similarity | ||||||
| ∼ Chatbot Experience | -0.0704 | 0.0453 | 0.121 | -0.159 | 0.0186 | No |
| User Improvement | ||||||
| ∼ Message Email Similarity | 0.0628 | 0.0453 | 0.166 | -0.0262 | 0.152 | No |
| Total | -0.000662 | 0.0454 | 0.988 | -0.0899 | 0.0886 | No |
| Direct | 0.00378 | 0.0455 | 0.934 | -0.0856 | 0.0931 | No |
| Indirect | -0.00444 | 0.00473 | 0.264 | -0.0177 | 0.00179 | No |
Table A22.
Mediation analysis AI Generation Perception Messages on Correct Categorization by Student
Table A22.
Mediation analysis AI Generation Perception Messages on Correct Categorization by Student
| Path | Coef. | SE | p | CI 2.5% | CI 97.5% | Sig |
| Message Email Similarity | ||||||
| ∼ AI Generation Perception | 0.114 | 0.0451 | 0.0121 | 0.025 | 0.202 | Yes |
| User Improvement | ||||||
| ∼ Message Email Similarity | 0.0628 | 0.0453 | 0.166 | -0.0262 | 0.152 | No |
| Total | -0.192 | 0.0446 | -0.279 | -0.104 | Yes | |
| Direct | -0.202 | 0.0447 | -0.29 | -0.114 | Yes | |
| Indirect | 0.00975 | 0.00632 | 0.06 | 0.00106 | 0.0258 | No |
Table A23.
Mediation analysis Pre Experiment Quiz Score Messages on Correct Categorization by Student
Table A23.
Mediation analysis Pre Experiment Quiz Score Messages on Correct Categorization by Student
| Path | Coef. | SE | p | CI 2.5% | CI 97.5% | Sig |
| Message Email Similarity | ||||||
| ∼ Pre Experiment Quiz Score | -0.0423 | 0.0454 | 0.351 | -0.131 | 0.0468 | No |
| User Improvement | ||||||
| ∼ Message Email Similarity | 0.0628 | 0.0453 | 0.166 | -0.0262 | 0.152 | No |
| Total | 0.112 | 0.0451 | 0.0136 | 0.0231 | 0.2 | Yes |
| Direct | 0.115 | 0.0451 | 0.0114 | 0.026 | 0.203 | Yes |
| Indirect | -0.00287 | 0.00459 | 0.48 | -0.0177 | 0.0027 | No |
Table A24.
Mediation analysis Response Message Similarity Messages on Correct Categorization by Student
Table A24.
Mediation analysis Response Message Similarity Messages on Correct Categorization by Student
| Path | Coef. | SE | p | CI 2.5% | CI 97.5% | Sig |
| Message Email Similarity | ||||||
| ∼ Response Message Similarity | 0.336 | 0.0428 | 0.252 | 0.42 | Yes | |
| User Improvement | ||||||
| ∼ Message Email Similarity | 0.0628 | 0.0453 | 0.166 | -0.0262 | 0.152 | No |
| Total | 0.201 | 0.0445 | 0.114 | 0.289 | Yes | |
| Direct | 0.203 | 0.0473 | 0.11 | 0.296 | Yes | |
| Indirect | -0.00185 | 0.0162 | 0.912 | -0.0355 | 0.0283 | No |
Appendix A.3. Pre-experiment Instructions
Instructions. In this experiment you will determine whether example emails are genuine or phishing. When reviewing potential phishing emails, pay attention to the following features. After this screen, there will be a quiz on this information.
- Real sender does not match the claimed sender: Phishing emails often pretend to be from reputable companies, but you can usually spot a fake by checking the address that sent the message. If the From address is a series of numbers, an odd mix of characters, or not the official domain of the company it claims to be from, it’s likely a phishing attempt.
- Email requests credentials: Legitimate companies will never ask for sensitive information via email. If the email requests your username, password, credit card information, or other sensitive data, it’s a phishing attempt.
- Suspicious subject line: Phishing emails often use alarmist, threatening, or enticing subject lines to grab your attention. If the subject is odd, generic, or doesn’t match the content, it could be a phishing email.
- Urgent tone: Phishing scams create a sense of urgency to panic you into acting without thinking. If an email asks for immediate action (e.g., “Your account will be suspended unless you update your information”), it’s likely a scam.
- Too-good-to-be-true offers: Emails that promise rewards, discounts, or prizes in exchange for personal information are likely phishing.
- Link does not match the text: A common tactic is disguising a dangerous link with innocent-looking text. Hover your cursor over links before clicking. If the URL doesn’t match the link text, or looks suspicious in any way, do not click. For instance, if the link text reads “bank.com” but hovering shows “hackingsite.com”, it’s a phishing attempt.
Appendix A.4. Pre-experiment Quiz
-
What type of language do phishing emails often use to create a sense of panic?
- Urgent language
- Friendly language
- Rude language
- Mean language
-
What might a phishing email request of you that would compromise your identity?
- Personal information like your favorite color
- Sensitive information like credit card numbers
- Sensitive information like your celebrity crush
- Irrelevant information like your dog’s name
-
What types of actions might phishing emails request from you that could lead to malware being installed on your computer?
- Clicking links only
- Downloading attachments only
- Replying with your computer’s information only
- All of the above
-
How might a phishing email try to ensure that you are susceptible to a phishing attempt?
- Being overly friendly
- Calling you a generic title
- Using poor grammar
- Saying you won the lottery
-
How might a phishing email attempt to convince you that it was sent from a legitimate source?
- Using an email from a website that you have never heard of
- Sending the email from a website with a famous company name
- Adding a link to a real website in the text of the email
- Using another website name that is different from the one sending the email
-
How might a phishing email convince you to click on a fake link?
- Adding a lot of random numbers and letters into the link
- Changing the text of the link (can be checked by hovering over it)
- Changing the color of the link to make it look like you’ve clicked it before
- Keeping the link short so it looks legitimate
Appendix A.5. Experiment Questions
-
Is this a phishing email?
- Yes
- No
-
On a scale from 1–5, with 5 being totally confident, how confident are you in your answer to Question 1?
- 1
- 2
- 3
- 4
- 5
-
What action would you take after receiving this email?
- Respond
- Click link
- Check sender
- Check link
- Delete email
- Report email
Appendix A.6. Post-experiment Questionnaire
-
Of the phishing emails you’ve encountered, what percentage do you think were generated by artificial intelligence models?
- 100% of the phishing emails I read were written by an Artificial Intelligence model.
- 75% of the phishing emails I read were written by an Artificial Intelligence model.
- 50% of the phishing emails I read were written by an Artificial Intelligence model.
- 25% of the phishing emails I read were written by an Artificial Intelligence model.
-
Of the ham (i.e., non-phishing) emails you’ve encountered, what percentage do you think were generated by artificial intelligence models?
- 100% of the ham emails I read were written by an Artificial Intelligence model.
- 75% of the ham emails I read were written by an Artificial Intelligence model.
- 50% of the ham emails I read were written by an Artificial Intelligence model.
- 25% of the ham emails I read were written by an Artificial Intelligence model.
-
Of the phishing emails you’ve encountered, what percentage do you think were styled (i.e., appearance and format) by artificial intelligence models?
- 100% of the phishing emails I read were styled by an Artificial Intelligence model.
- 75% of the phishing emails I read were styled by an Artificial Intelligence model.
- 50% of the phishing emails I read were styled by an Artificial Intelligence model.
- 25% of the phishing emails I read were styled by an Artificial Intelligence model.
-
Of the ham (i.e., non-phishing) emails you’ve encountered, what percentage do you think were styled (i.e., appearance and format) by artificial intelligence models?
- 100% of the ham emails I read were styled by an Artificial Intelligence model.
- 75% of the ham emails I read were styled by an Artificial Intelligence model.
- 50% of the ham emails I read were styled by an Artificial Intelligence model.
- 25% of the ham emails I read were styled by an Artificial Intelligence model.
-
What criteria did you use to identify whether an email was a phishing attempt?Open response.
References
- Salemi, A.; Mysore, S.; Bendersky, M.; Zamani, H. LaMP: When Large Language Models Meet Personalization. Arxiv 2024. [Google Scholar]
- Woźniak, S.; Koptyra, B.; Janz, A.; Kazienko, P.; Kocoń, J. Personalized Large Language Models. Arxiv 2024. [Google Scholar]
- Zhang, Z.; Rossi, R.A.; Kveton, B.; Shao, Y.; Yang, D.; Zamani, H.; Dernoncourt, F.; Barrow, J.; Yu, T.; Kim, S.; et al. Personalization of Large Language Models: A Survey. Arxiv 2025. [Google Scholar]
- Malloy, T.; Ferriera, M.; Fang, F.; Gonzalez, C. Improving Online Anti-Phishing Training Using Cognitive Large Language Models. Under Review for Computers and Human Behavior 2025. [Google Scholar]
- Pedersen, K.T.; Pepke, L.; Stærmose, T.; Papaioannou, M.; Choudhary, G.; Dragoni, N. Deepfake-Driven Social Engineering: Threats, Detection Techniques, and Defensive Strategies in Corporate Environments. Journal of Cybersecurity and Privacy 2025, 5, 18. [Google Scholar] [CrossRef]
- Schmitt, M.; Flechais, I. Digital deception: Generative artificial intelligence in social engineering and phishing. Artificial Intelligence Review 2024, 57, 324. [Google Scholar] [CrossRef]
- Jabir, R.; Le, J.; Nguyen, C. Phishing Attacks in the Age of Generative Artificial Intelligence: A Systematic Review of Human Factors. AI 2025, 6, 174. [Google Scholar] [CrossRef]
- Ayodele, T.O. Impact of AI-Generated Phishing Attacks: A New Cybersecurity Threat. In Proceedings of the Intelligent Computing-Proceedings of the Computing Conference. Springer; 2025; pp. 301–320. [Google Scholar]
- Mahal, A.; Singh, K.; Singh, K. Influence of Generative AI on Cyber Security. International journal of all research education and scientific methods 2025, pp. 1922–1928.
- Proofpoint. 2024 State of the Phish: Risky actions, real-world threats and user resilience in an age of human-centric cybersecurity.
- Hartzler, B.; Hinde, J.; Lang, S.; Correia, N.; Yermash, J.; Yap, K.; Murphy, C.M.; Ruwala, R.; Rash, C.J.; Becker, S.J.; et al. Virtual training is more cost-effective than in-person training for preparing staff to implement contingency management. Journal of Technology in Behavioral Science 2023, 8, 255–264. [Google Scholar] [CrossRef]
- o’Doherty, D.; Dromey, M.; Lougheed, J.; Hannigan, A.; Last, J.; McGrath, D. Barriers and solutions to online learning in medical education–an integrative review. BMC medical education 2018, 18, 130. [Google Scholar] [CrossRef]
- Luo, Y.; Yang, Y. Large language model and domain-specific model collaboration for smart education. Frontiers of Information Technology & Electronic Engineering 2024, 25, 333–341. [Google Scholar] [CrossRef]
- Jampen, D.; Gür, G.; Sutter, T.; Tellenbach, B. Don’t click: towards an effective anti-phishing training. A comparative literature review. Human-centric Computing and Information Sciences 2020, 10, 33. [Google Scholar] [CrossRef]
- Huang, L.; Jia, S.; Balcetis, E.; Zhu, Q. Advert: an adaptive and data-driven attention enhancement mechanism for phishing prevention. IEEE Transactions on Information Forensics and Security 2022, 17, 2585–2597. [Google Scholar] [CrossRef]
- Singh, K.; Aggarwal, P.; Rajivan, P.; Gonzalez, C. Training to detect phishing emails: Effects of the frequency of experienced phishing emails. In Proceedings of the Proceedings of the human factors and ergonomics society annual meeting. SAGE Publications Sage CA: Los Angeles, CA, 2019, Vol. 63, pp. 453–457.
- Brunken, L.; Buckmann, A.; Hielscher, J.; Sasse, M.A. {“To} Do This Properly, You Need More {Resources”}: The Hidden Costs of Introducing Simulated Phishing Campaigns. In Proceedings of the 32nd USENIX Security Symposium (USENIX Security 23), 2023, pp. 4105–4122.
- Salahdine, F.; Kaabouch, N. Social engineering attacks: A survey. Future internet 2019, 11, 89. [Google Scholar] [CrossRef]
- Abroshan, H.; Devos, J.; Poels, G.; Laermans, E. Phishing happens beyond technology: The effects of human behaviors and demographics on each step of a phishing process. IEEE Access 2021, 9, 44928–44949. [Google Scholar] [CrossRef]
- Singh, K.; Aggarwal, P.; Rajivan, P.; Gonzalez, C. Cognitive elements of learning and discriminability in anti-phishing training. Computers & Security 2023, 127, 103105. [Google Scholar] [CrossRef]
- Malloy, T.; Gonzalez, C. Applying Generative Artificial Intelligence to Cognitive Models of Decision Making. Frontiers in Psychology 2024. [Google Scholar] [CrossRef]
- Google Cloud. Google Cloud Cybersecurity Forecast 2024. https://services.google.com/fh/files/misc/google-cloud-cybersecurity-forecast-2024.pdf, 2024. Accessed: 2025-08-08.
- Sharma, M.; Singh, K.; Aggarwal, P.; Dutt, V. How well does GPT phish people? An investigation involving cognitive biases and feedback. In Proceedings of the 2023 IEEE European Symposium on Security and Privacy Workshops (EuroS&PW). IEEE, 2023, pp. 451–457.
- Hasanov, I.; Virtanen, S.; Hakkala, A.; Isoaho, J. Application of large language models in cybersecurity: A systematic literature review. IEEE Access 2024. [Google Scholar] [CrossRef]
- Bethany, M.; Galiopoulos, A.; Bethany, E.; Karkevandi, M.B.; Vishwamitra, N.; Najafirad, P. Large language model lateral spear phishing: A comparative study in large-scale organizational settings. arXiv preprint arXiv:2401.09727, arXiv:2401.09727 2024.
- Hazell, J. Spear Phishing With Large Language Models, 2023, [arXiv:cs.CY/2305.06972]. arXiv:cs.CY/2305.06972].
- Afane, K.; Wei, W.; Mao, Y.; Farooq, J.; Chen, J. Next-Generation Phishing: How LLM Agents Empower Cyber Attackers, 2024, [arXiv:cs.CR/2411.13874].
- Myung, J.; Lee, N.; Zhou, Y.; Jin, J.; Putri, R.; Antypas, D.; Borkakoty, H.; Kim, E.; Perez-Almendros, C.; Ayele, A.A.; et al. Blend: A benchmark for llms on everyday knowledge in diverse cultures and languages. Advances in Neural Information Processing Systems 2024, 37, 78104–78146. [Google Scholar]
- Liu, J.; Qiu, Z.; Li, Z.; Dai, Q.; Zhu, J.; Hu, M.; Yang, M.; King, I. A Survey of Personalized Large Language Models: Progress and Future Directions. Arxiv 2025. [Google Scholar]
- Islam, S.B.; Rahman, M.A.; Hossain, K.S.M.T.; Hoque, E.; Joty, S.; Parvez, M.R. Open-RAG: Enhanced Retrieval-Augmented Reasoning with Open-Source Large Language Models. Arxiv 2024. [Google Scholar]
- Jin, C.; Zhang, Z.; Jiang, X.; Liu, F.; Liu, X.; Liu, X.; Jin, X. RAGCache: Efficient Knowledge Caching for Retrieval-Augmented Generation. Arxiv 2024. [Google Scholar]
- Sun, C.; Yang, K.; Reddy, R.G.; Fung, Y.R.; Chan, H.P.; Small, K.; Zhai, C.; Ji, H. Persona-DB: Efficient Large Language Model Personalization for Response Prediction with Collaborative Data Refinement. Arxiv 2025. [Google Scholar]
- Gonzalez, C.; Lerch, J.F.; Lebiere, C. Instance-based learning in dynamic decision making. Cognitive Science 2003, 27, 591–635. [Google Scholar] [CrossRef]
- Gonzalez, C. Building Human-Like Artificial Agents: A General Cognitive Algorithm for Emulating Human Decision-Making in Dynamic Environments. Perspectives on Psychological Science 2023, p. 17456916231196766.
- Pollini, A.; Callari, T.C.; Tedeschi, A.; Ruscio, D.; Save, L.; Chiarugi, F.; Guerri, D. Leveraging human factors in cybersecurity: an integrated methodological approach. Cognition, Technology & Work 2022, 24, 371–390. [Google Scholar]
- Kavak, H.; Padilla, J.J.; Vernon-Bido, D.; Diallo, S.Y.; Gore, R.; Shetty, S. Simulation for cybersecurity: state of the art and future directions. Journal of Cybersecurity 2021, 7, tyab005. [Google Scholar] [CrossRef]
- Lake, B.M.; Ullman, T.D.; Tenenbaum, J.B.; Gershman, S.J. Building machines that learn and think like people. Behavioral and brain sciences 2017, 40, e253. [Google Scholar] [CrossRef] [PubMed]
- Collins, K.M.; Sucholutsky, I.; Bhatt, U.; Chandra, K.; Wong, L.; Lee, M.; Zhang, C.E.; Zhi-Xuan, T.; Ho, M.; Mansinghka, V.; et al. Building machines that learn and think with people. Nature human behaviour 2024, 8, 1851–1863. [Google Scholar] [CrossRef] [PubMed]
- Malloy, T.; Cleotilde, G. Learning to Defend by Attacking (and Vice-Versa): Transfer Learning in Cyber-Security Games. In Proceedings of the IEEE European Symposium on Security and Privacy Workshop Series; 2023. [Google Scholar]
- Kar, D.; Nguyen, T.H.; Fang, F.; Brown, M.; Sinha, A.; Tambe, M.; Jiang, A.X. Trends and applications in Stackelberg security games. In Handbook of dynamic game theory; Springer, 2016; pp. 1–47.
- Sinha, A.; Fang, F.; An, B.; Kiekintveld, C.; Tambe, M. Stackelberg security games: Looking beyond a decade of success. In Proceedings of the Proceedings of the International Joint Conference on Artifical Intelligence. IJCAI, 2018.
- Du, Y.; Prebot, B.; Malloy, T.; Fang, F.; Cleotilde, G. Experimental Evaluation of Cognitive Agents for Collaboration in Human-Autonomy Cyber Defense Teams. Under Review for Computers and Human Behavior: Artificial Agents 2025.
- Du, Y.; Prebot, B.; Malloy, T.; Cleotilde, G. A Cyber-War Between Bots: Cognitive Attackers are More Challenging for Defenders than Strategic Attackers. ACM Transactions on Social Computing 2024.
- Malloy, T.; Ferriera, M.; Fang, F.; Gonzalez, C. Using Cognitive Models to Improve Training Against Human and GPT-4 Generated Social Engineering Attacks. In Proceedings of the International Conference on Human Computer Interaction, 2025.
- Laird, J.E.; Newell, A.; Rosenbloom, P.S. Soar: An architecture for general intelligence. Artificial intelligence 1987, 33, 1–64. [Google Scholar] [CrossRef]
- Prieto, I.; Blakely, B. Proposed uses of generative AI in a cybersecurity-focused soar agent. In Proceedings of the Proceedings of the AAAI Symposium Series, 2023, Vol. 2, pp. 386–390.
- Malloy, T.; Du, Y.; Fang, F.; Gonzalez, C. Accounting for Transfer of Learning in Human Behavior Models. In Proceedings of the Human Computation and Crowdsourcing, 2023.
- Malloy, T.; Sims, C.R. Efficient Visual Representations for Learning and Decision Making. Psychological review 2024, in press.
- Malloy, T.; Du, Y.; Fang, F.; Gonzalez, C. Generative Environment-Representation Instance-Based Learning: A Cognitive Model. In Proceedings of the AAAI Symposium on Integration of Cognitive Architectures and Generative Models, 2023.
- Mitsopoulos, K.; Bose, R.; Mather, B.; Bhatia, A.; Gluck, K.; Dorr, B.; Lebiere, C.; Pirolli, P. Psychologically-Valid Generative Agents: A Novel Approach to Agent-Based Modeling in Social Sciences. In Proceedings of the Proceedings of the 2023 AAAI Fall Symposium on Integrating Cognitive Architectures and Generative Models. AAAI Press, 2023, pp. 1–6.
- West, R.L.; Eckler, S.; Conway-Smith, B.; Turcas, N.; Tomkins-Flanagan, E.; Kelly, M.A. Bridging Generative Networks with the Common Model of Cognition. In Proceedings of the Proceedings of the 2023 AAAI Fall Symposium on Integrating Cognitive Architectures and Generative Models. AAAI Press, 2023.
- Xu, T.; Singh, K.; Rajivan, P. Modeling Phishing Decision using Instance Based Learning and Natural Language Processing. In Proceedings of the HICSS, 2022, pp. 1–10.
- Malloy, T.; Ferreira, M.J.; Fang, F.; Gonzalez, C. Leveraging a Cognitive Model to Measure Subjective Similarity of Human and GPT-4 Written Content. arXiv preprint, arXiv:2409.00269 2024.
- Anderson, J.R.; Matessa, M.; Lebiere, C. ACT-R: A theory of higher level cognition and its relation to visual attention. Human–Computer Interaction 1997, 12, 439–462. [Google Scholar] [CrossRef]
- Wu, S.; Oltramari, A.; Francis, J.; Giles, C.L.; Ritter, F.E. LLM-ACTR: from Cognitive Models to LLMs in Manufacturing Solutions. In Proceedings of the Proceedings of the AAAI Symposium Series, 2025, Vol. 5, pp. 340–349.
- Llaca-Sánchez, B.A.; García-Noguez, L.R.; Aceves-Fernández, M.A.; Takacs, A.; Tovar-Arriaga, S. Exploring LLM Embedding Potential for Dementia Detection Using Audio Transcripts. Eng 2025, 6, 163. [Google Scholar] [CrossRef]
- OpenAI. OpenAI API Documentation. https://platform.openai.com/docs/, 2025. Accessed: May 18, 2025.
- Gonzalez, C.; Dutt, V. Instance-based learning: integrating sampling and repeated decisions from experience. Psychological review 2011, 118, 523. [Google Scholar] [CrossRef]
- Fiedler, K.; Schott, M.; Meiser, T. What mediation analysis can (not) do. Journal of Experimental Social Psychology 2011, 47, 1231–1236. [Google Scholar] [CrossRef]
- Baron, R.M.; Kenny, D.A. The moderator–mediator variable distinction in social psychological research: Conceptual, strategic, and statistical considerations. Journal of personality and social psychology 1986, 51, 1173. [Google Scholar] [CrossRef] [PubMed]
- Bodker, S.; Andersen, P.B. Complex mediation. Human-computer interaction 2005, 20, 353–402. [Google Scholar] [CrossRef]
- Vig, J.; Gehrmann, S.; Belinkov, Y.; Qian, S.; Nevo, D.; Singer, Y.; Shieber, S. Investigating gender bias in language models using causal mediation analysis. Advances in neural information processing systems 2020, 33, 12388–12401. [Google Scholar]
- Vallat, R. Pingouin: statistics in Python. Journal of Open Source Software 2018, 3, 1026. [Google Scholar] [CrossRef]
- Alwanain, M.I. Phishing awareness and elderly users in social media. International Journal of Computer Science and Network Security 2020, 20, 114–119. [Google Scholar]
| 1 | |
| 2 | |
| 3 |
Figure 1.
Regression plots comparing the cosine similarity of messages sent by Students (blue) and the LLM Teacher (orange) with three metrics of student behavior, percent correct categorization (left), confidence (middle), and reaction time (right).
Figure 1.
Regression plots comparing the cosine similarity of messages sent by Students (blue) and the LLM Teacher (orange) with three metrics of student behavior, percent correct categorization (left), confidence (middle), and reaction time (right).
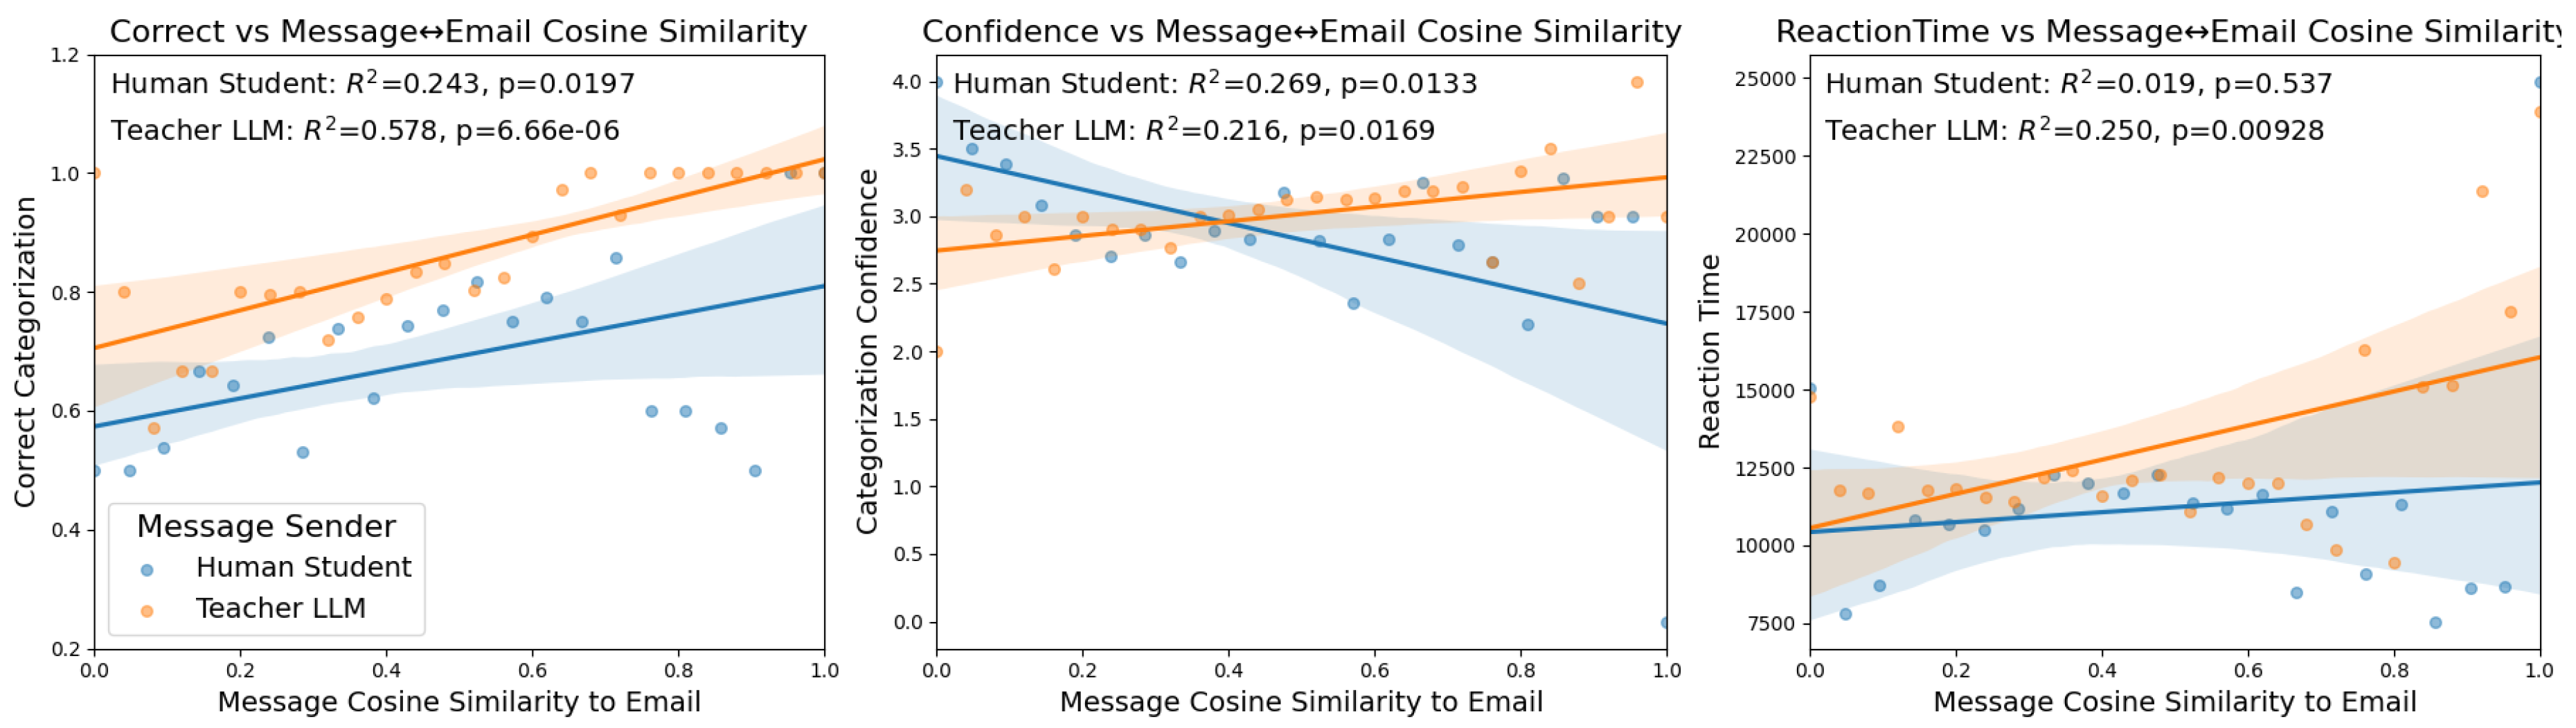
Figure 2.
Regression plots comparing the cosine similarity of messages sent by Students (blue) and the LLM Teacher (orange) with three metrics of student learning, pre-experiment performance (left), learning outcomes (middle), and final performance (right).
Figure 2.
Regression plots comparing the cosine similarity of messages sent by Students (blue) and the LLM Teacher (orange) with three metrics of student learning, pre-experiment performance (left), learning outcomes (middle), and final performance (right).
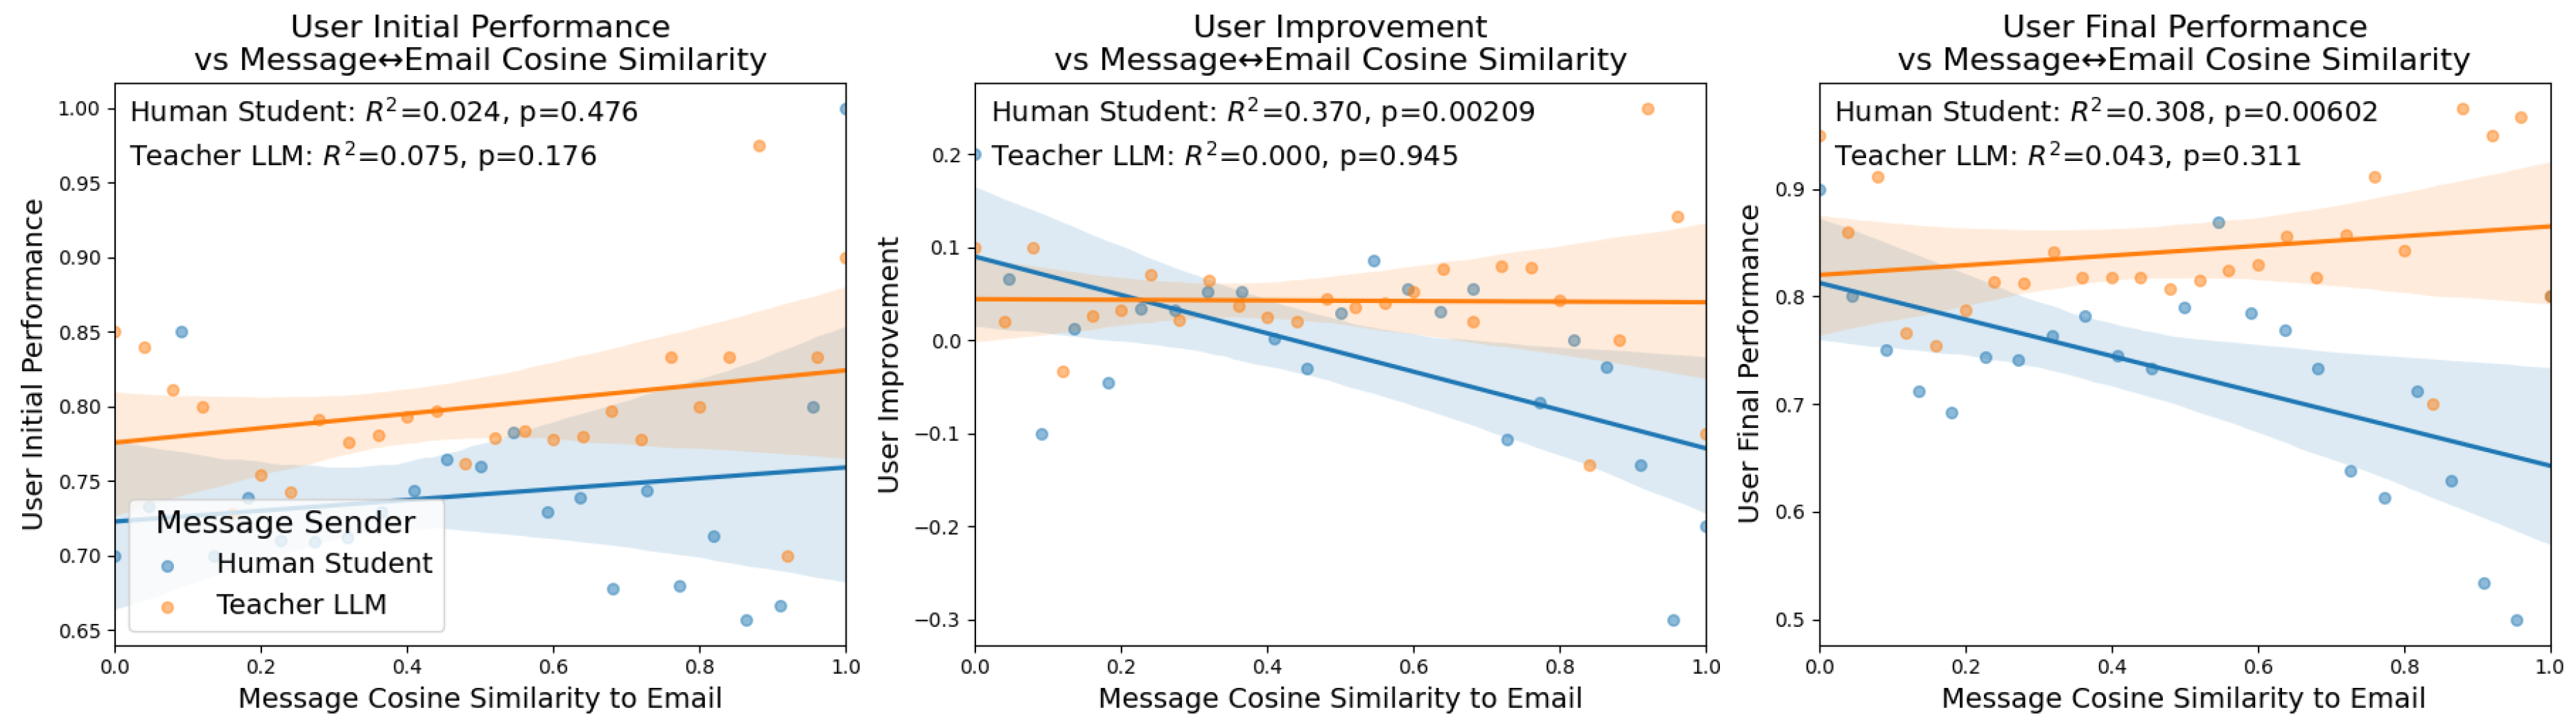
Figure 3.
Regression plots comparing the cosine similarity of messages sent by Students (blue) and the LLM Teacher (orange) with three metrics of student learning, pre-experiment performance (left), learning outcomes (middle), and final performance (right).
Figure 3.
Regression plots comparing the cosine similarity of messages sent by Students (blue) and the LLM Teacher (orange) with three metrics of student learning, pre-experiment performance (left), learning outcomes (middle), and final performance (right).
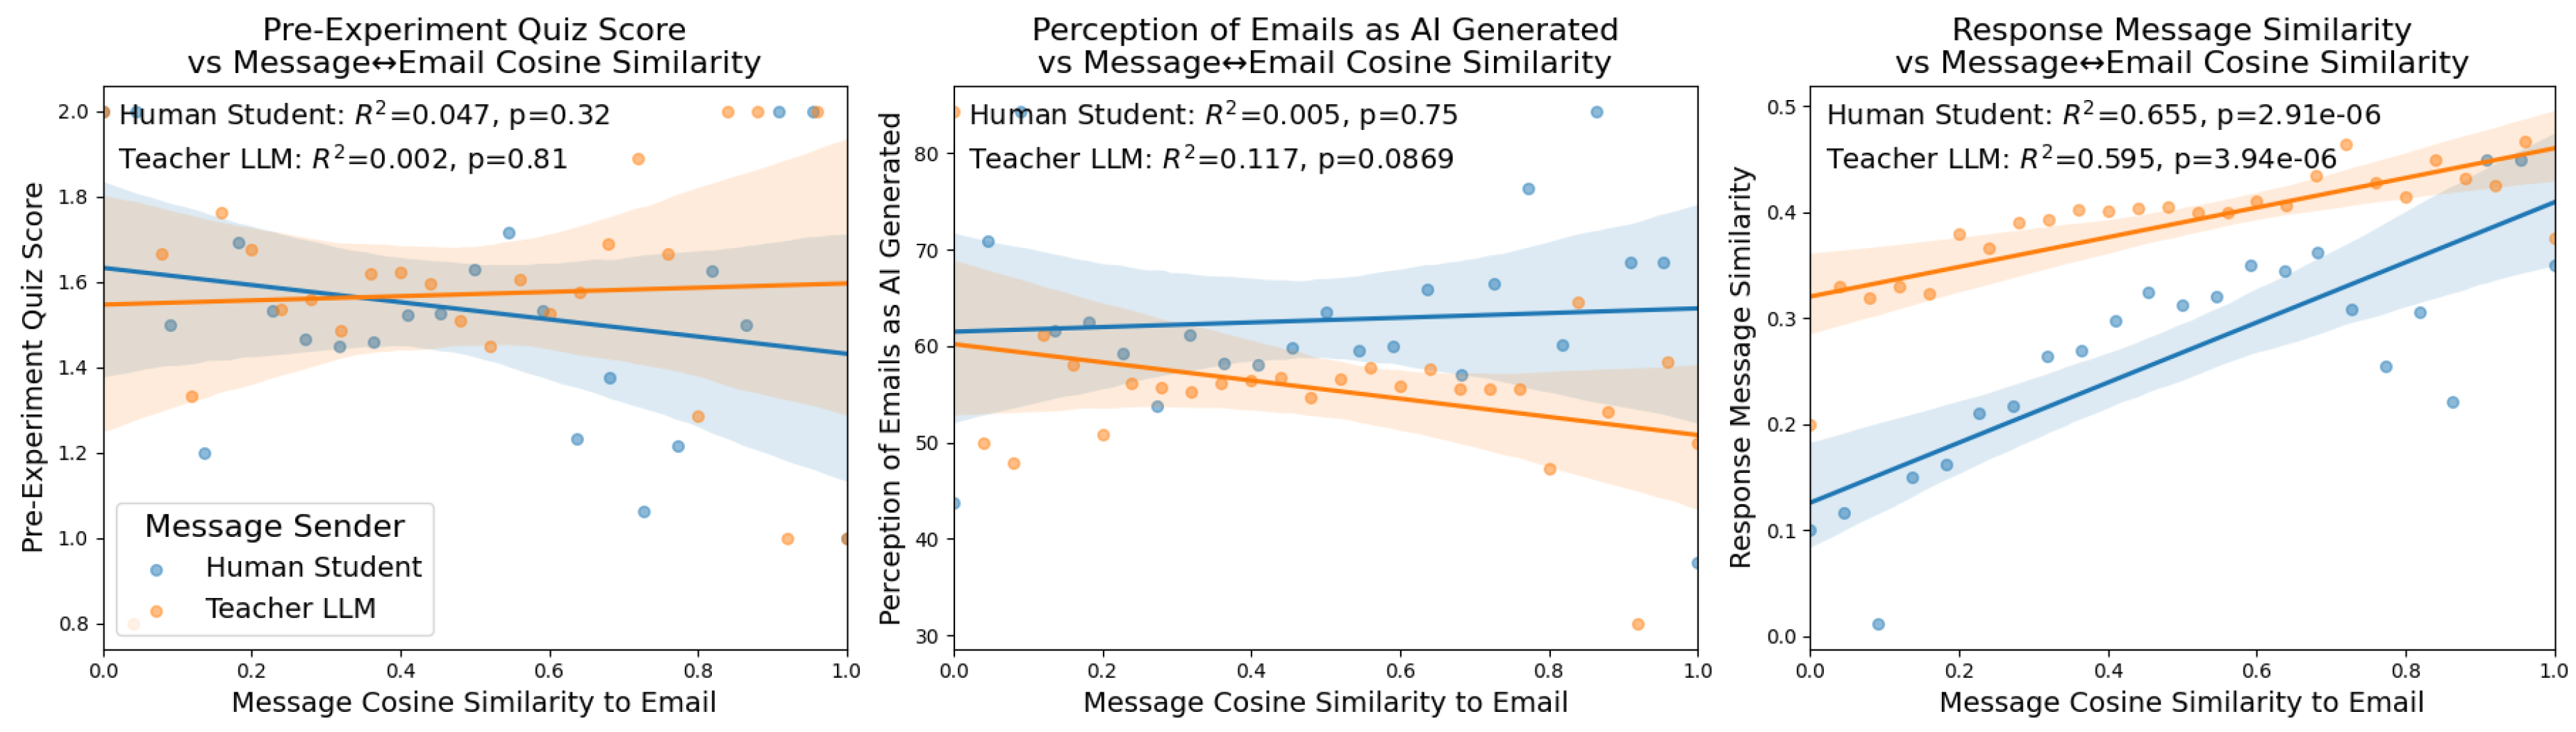
Figure 4.
Regression plots comparing the cosine similarity of messages sent by Students (blue) and the LLM Teacher (orange) with six demographics categories of human students, Age (top-left), Gender (top-middle), where 1 corresponds to female and 0 to male, Education Years (top-right), Phishing Experience (bottom-left), Chatbot Experience, (bottom-middle) and Cognitive Model Activity (bottom-right), as determined by the experiment condition.
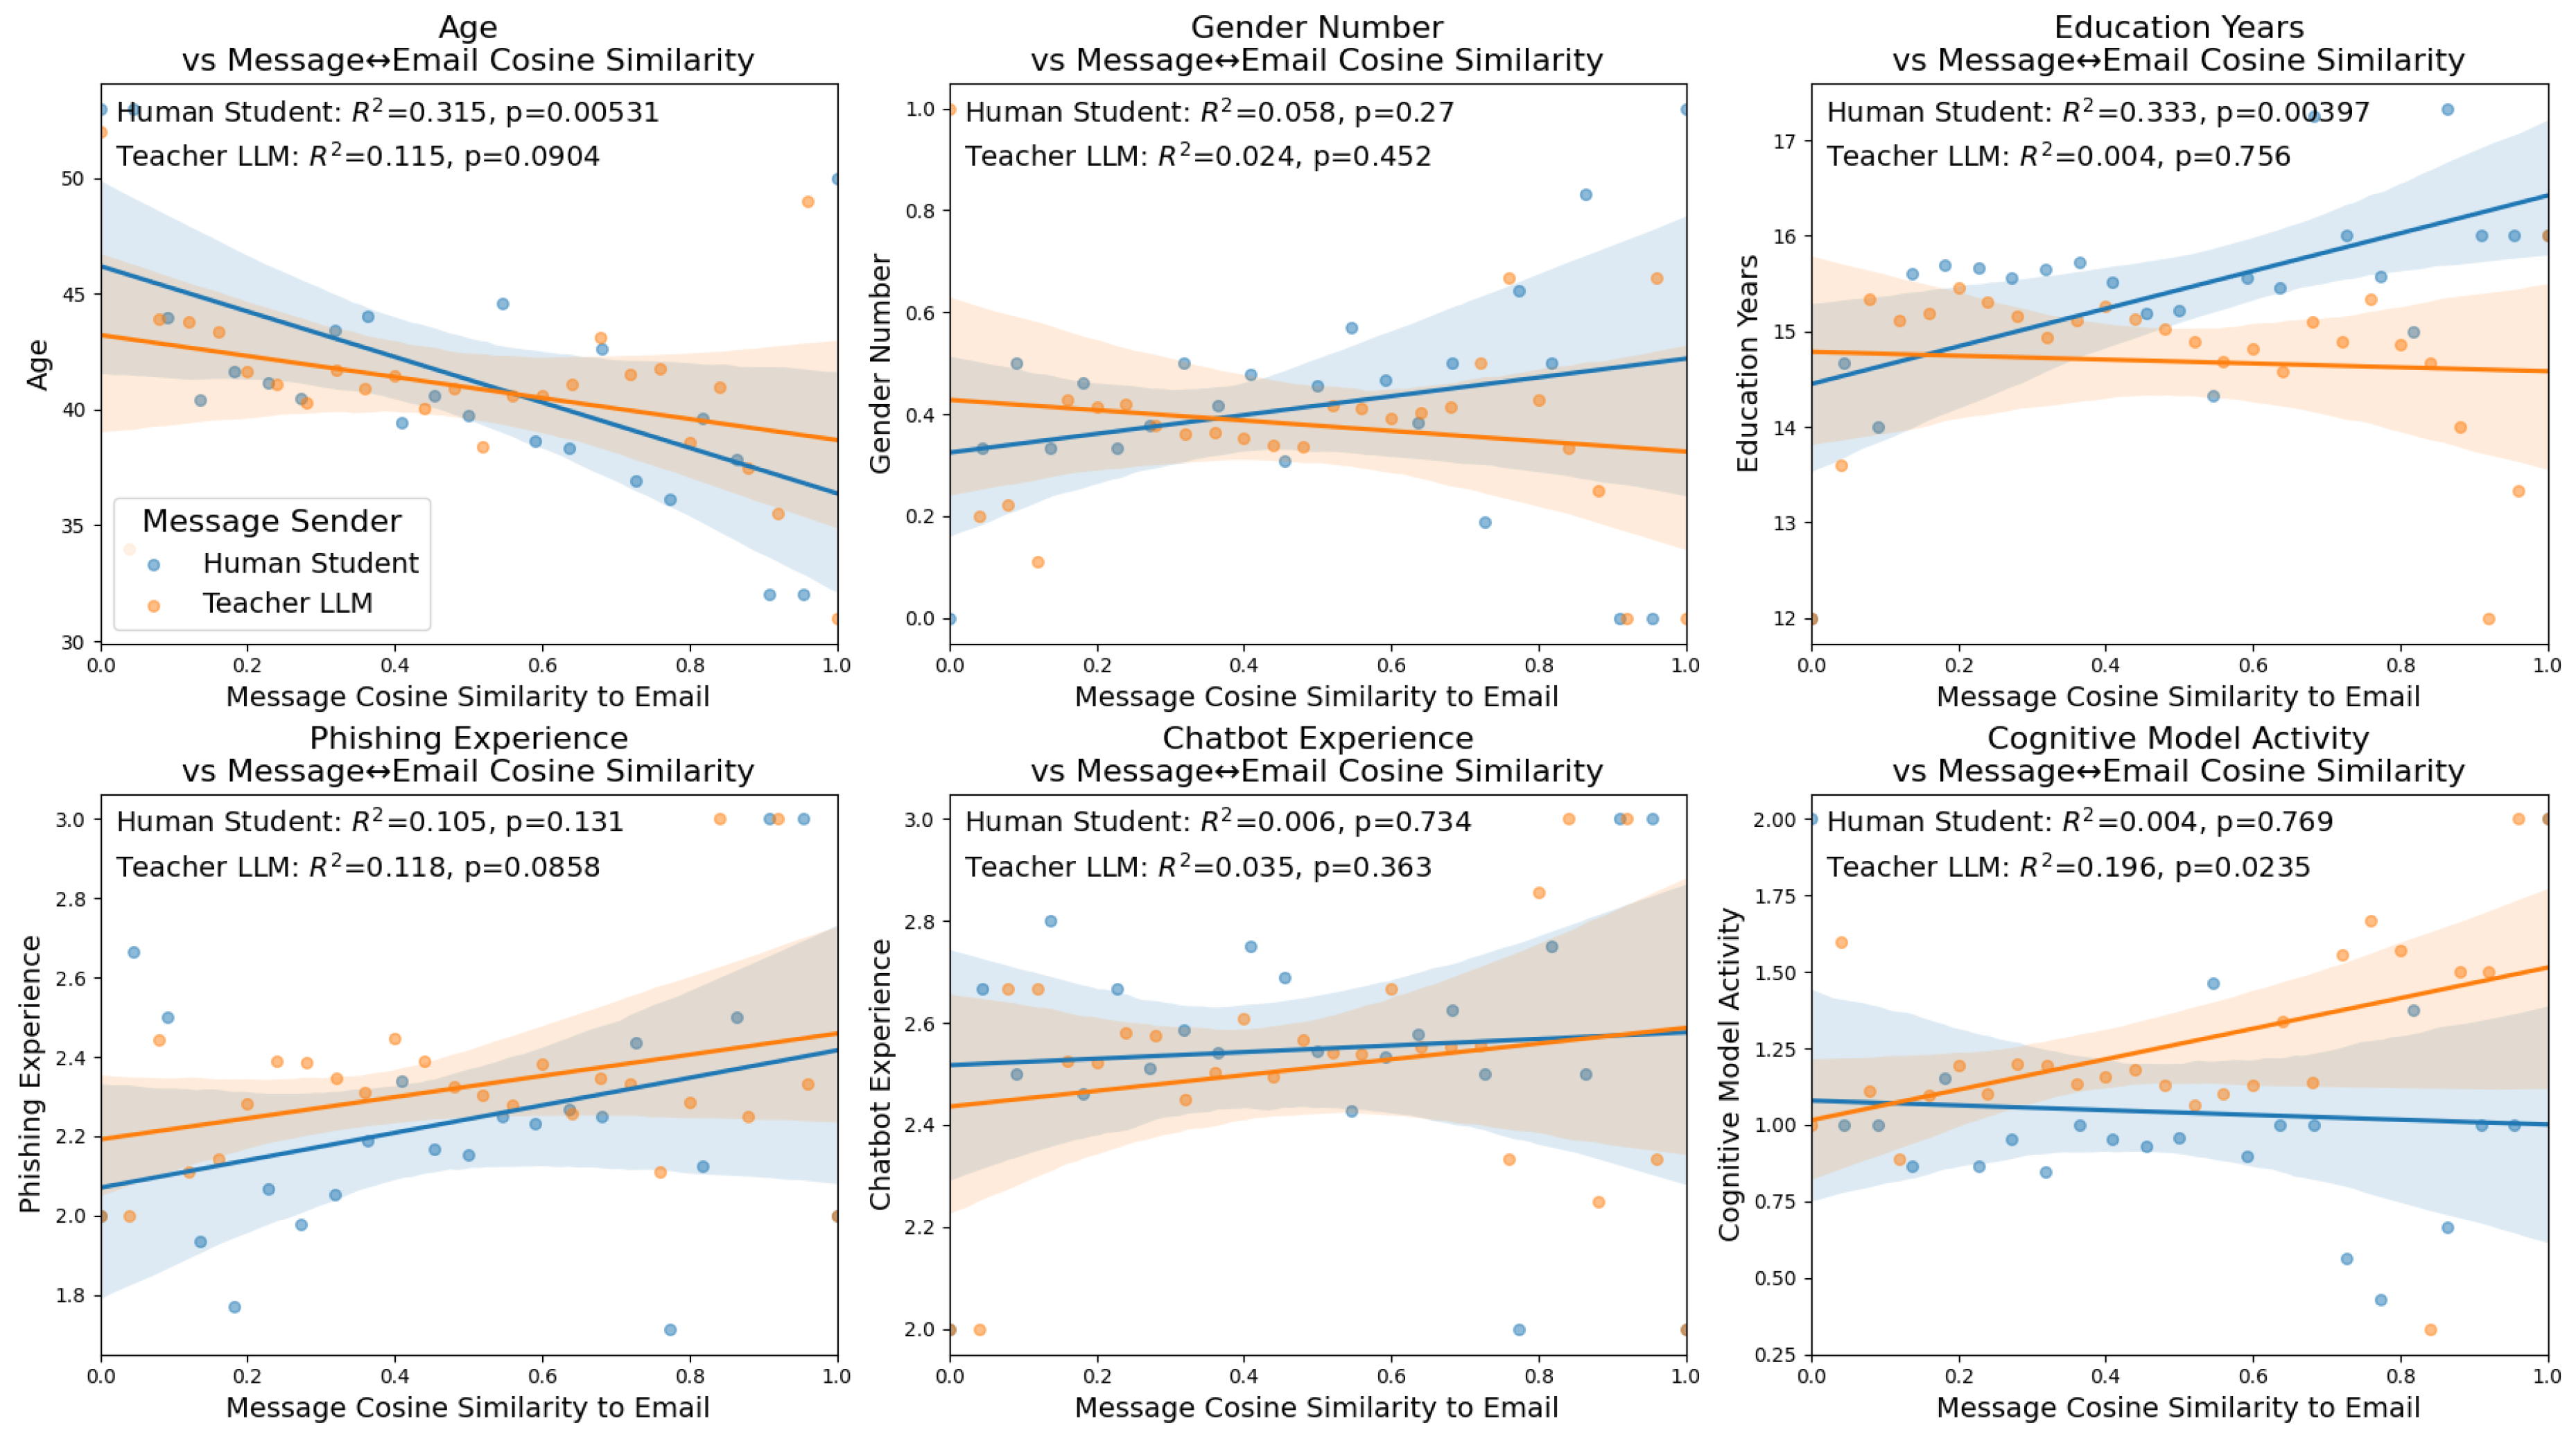
Disclaimer/Publisher’s Note: The statements, opinions and data contained in all publications are solely those of the individual author(s) and contributor(s) and not of MDPI and/or the editor(s). MDPI and/or the editor(s) disclaim responsibility for any injury to people or property resulting from any ideas, methods, instructions or products referred to in the content. |
© 2025 by the authors. Licensee MDPI, Basel, Switzerland. This article is an open access article distributed under the terms and conditions of the Creative Commons Attribution (CC BY) license (http://creativecommons.org/licenses/by/4.0/).
Copyright: This open access article is published under a Creative Commons CC BY 4.0 license, which permit the free download, distribution, and reuse, provided that the author and preprint are cited in any reuse.


