
Submitted:
25 August 2025
Posted:
26 August 2025
You are already at the latest version
Abstract
Background: Functional near-infrared spectroscopy (fNIRS) is a neuroimaging method for evaluating cortical network dynamics during cognitive tasks. Conventional graph pipelines require threshold/density choices that can bias between-subject comparisons. We therefore use the minimum spanning tree (MST)—a unique, cycle-free tree connecting all recorded regions at minimal cost without thresholding—to obtain a standardized, density-invariant network representation comparable across participants and cognitive conditions to study the neuro-psychiatric problems as Obsessive Compulsive Disorder (OCD), Schizophrenia (SCHIZO) and Migraine . Objective: This study examined prefrontal cortex network topology differences across patients groups via MST analysis computed from fNIRS data during a Stroop task, aiming to detect diagnosis-related changes, to relate network organization to behavior, and to assess hemispheric similarity and connectivity. Methods: 16-channel fNIRS recordings were obtained under neutral, congruent, and incongruent conditions. Partial correlation--based functional connectivity matrices were transformed into MSTs to compute seven global metrics, survival ratio, and hemispheric edge counts; reaction time and accuracy were also measured. Results: Schizophrenia (SCHIZO) showed a less integrated network than controls, with longer characteristic path length and trends toward larger diameter, lower leaf fraction, and lower degree divergence. Slower responses correlated with less integrated MST patterns. Within-group similarity was lower in OCD and SCHIZO, while hemispheric organization was stable. Migraine showed no robust differences from controls. Conclusion: MST metrics offer unbiased, threshold-free descriptors of large-scale brain organization, revealing diagnosis-related topology changes in task-based fNIRS studies.
Keywords:
fNIRS
; MST
; graph theory
; functional connectivity
; SCHIZO
; obsessive compulsive disorder
; migraine
; Stroop test
1. Introduction
Objective, reliable decision support remains a pressing need in neuropsychiatry because routine workflows still depend on potentially biased, interpreted information by the clinician. fNIRS is attractive here: portable, low cost, motion tolerant, and task friendly, but the community still struggles with analytic heterogeneity; as noted, “there is no consensus on how to approach fNIRS data” [1]. This motivates analysis frameworks that minimize arbitrary choices while preserving cross-subject comparability.
Beyond these general considerations, the inclusion of obsessive–compulsive disorder (OCD), migraine, and schizophrenia (SCHIZO) within the same analytic framework is motivated by convergent evidence implicating prefrontal cortex dysfunction across these conditions. OCD has been associated with altered prefrontal–striatal interactions underlying intrusive thoughts and compulsive rituals [2], while migraine patients demonstrate abnormal prefrontal activation linked to impaired attentional control and sensory hypersensitivity [3]. Schizophrenia, likewise, is characterized by widespread prefrontal dysconnectivity, contributing to deficits in working memory, inhibition, and executive control [4]. Studying these groups together allows a transdiagnostic assessment of prefrontal network alterations during the Stroop task, where inhibitory control demands are maximized. This comparative design aligns with contemporary circuit-based approaches in psychiatry, such as the Research Domain Criteria (RDoC) initiative [5], and leverages the advantage that the prefrontal cortex is optimally accessible for fNIRS measurements, thereby providing a robust setting to examine both shared and disorder-specific connectivity profiles.
Network neuroscience characterizes large-scale brain organization via graphs that balance global integration and local segregation [6]. SCHIZO and OCD, for example, show altered small-worldness and hub organization across modalities [7,8,9]. However, conventional graph pipelines are vulnerable to density/threshold confounds. A persistent obstacle is the thresholding problem, in which trivial differences in edge number / strength bias comparisons are made [10,11].
Minimum-spanning trees (MSTs) offer a principled workaround. MSTs extract a unique, acyclic backbone that connects all nodes with minimal overall cost and avoids density matching. Critically, “the MST is unaffected by the thresholding problem provided that the ranking of edge weights remains unaltered” [12,13]. In practical terms, an MST “connects all the nodes in the network without forming cycles,” enabling standardized cross-subject comparison [14]. In the fNIRS literature this advantage is stated explicitly: “common problems with graph theory networks such as concern over proper thresholding… can be avoided with MSTs” [15]. Beyond robustness, MSTs summarize topology along intuitive axes: longer diameter/paths and fewer leaves reflect a more line-like, less integrated backbone; the converse reflects a more star-like, centralized organization [16].
Recent applications confirm this potential: fNIRS-based MSTs revealed frontal network disruption in amyotrophic lateral sclerosis [17] and backbone alterations in Alzheimer’s disease [15]. EEG/MEG studies similarly reported MST-based classification of Alzheimer’s and related dementias [18], while task paradigms such as mental arithmetic demonstrate dynamic reorganization toward more line-like, stable backbones [19]. These findings illustrate that MST metrics are sensitive to both clinical pathology and task-evoked changes in network topology.
fNIRS is well suited to probe the dynamics of the prefrontal cortex (PFC) network during cognitive control. In Stroop paradigms, task-based graph analyzes report load-dependent reconfiguration: for example, global efficiency decreases from neutral to congruent to incongruent [20]. In the same cohort we analyze here, complementary pipelines that combine features extracted from fNIRS data with behavior (Cognitive Quotient) or composite indices (Neurocognitive Ratio) achieved strong diagnosis separability [1,21], and small-world analyses showed backbone-level alterations during Stroop in OCD and SCHIZO [22]. Because these studies use the same dataset with different pipelines, they indicate methodological convergence rather than independent replication, and they reinforce the value of topology-focused, threshold-resistant summaries.
Against this backdrop, we analyze the MST backbones of fNIRS-derived PFC connectivity during a Stroop task across four groups: healthy controls, migraine, OCD, and SCHIZO. Our goals were threefold. First, we tested global differences in MST in diameter, characteristic path length, leaf fraction, tree hierarchy, maximum degree, assortativity, and degree divergence, with the a priori expectation that SCHIZO would deviate toward a more line-like backbone, consistent with transdiagnostic MST patterns and the literature on psychosis [7,8,9,16,22]. Second, we examined behavior–network coupling by relating MST metrics to reaction time and accuracy, given the inverse relation between characteristic path length and global efficiency [6]. Third, we assessed organizational stability and lateralization via the survival ratio (within-diagnosis backbone overlap) and hemispheric MST edge counts (left, right, inter-hemispheric). Based on interictal heterogeneity, we anticipated limited migraine–control separation in global MST summaries, with migraine effects more likely phenotype-/task-evoked or band-limited [21].
Methodologically, our choice of MSTs is guided by their threshold-free standardization and clinical interpretability. As it is emphasized in [15], MSTs “provide… the most essential connections in a network that are necessary for information to flow properly” and thus offer compact, comparable descriptors of backbone topology that are less susceptible to density/preprocessing variability than those of conventional thresholded graphs [16]. Building on these advantages, we use MSTs to test diagnosis-related shifts in integration, to link network topology to behavior, and to quantify group-wise similarity and hemispheric organization in PFC networks measured with fNIRS during Stroop.
2. Materials and Methods
2.1. Subjects
13 healthy individuals (6 female, mean age = 26), 20 patients with migraine without aura (12 female, mean age = 27), 26 patients diagnosed with OCD (11 female, mean age = 29), and 21 patients with SCHIZO (10 female, mean age = 28) participated in the study. The experimental protocol was approved by the Ethics Committee of Pamukkale University. Informed consent was obtained from all participants prior to the experiment, and they were thoroughly briefed on the study procedures. Portions of these data have been included in earlier publications by our research group and collaborators [20,23,24,25,26,27,28,29,30,30].
2.2. Experimental Procedure
All experiments were conducted in a dimly lit, acoustically isolated room. Participants were seated comfortably in front of a computer monitor positioned approximately 1 meter away at eye level. Before the experiment began, the task protocol was briefly explained, and participants were instructed to remain relaxed and avoid head movement throughout the recording. The experimental task was a computerized color-word Stroop paradigm, adapted to Turkish from the protocol developed by Zysset et al. [31].
Each stimulus type (N, C, IC) was presented in five stimulus blocks, resulting in a total of 15 task blocks per session Figure 1. The blocks were randomized in order for each participant. Each block consisted of six trials from the same stimulus type. Within each block, stimuli were displayed on the screen for 2.5 seconds, followed by a 4-second inter-stimulus interval. All blocks were separated by 20-second rest periods.
During each trial, two rows of letters were shown on the screen. Participants were asked to determine whether the color of the top-row letters matched the semantic meaning of the bottom-row word. For match cases, they responded by pressing the left mouse button with their index finger; for non-match cases, the right mouse button with their middle finger. Match and non-match trials were balanced across all stimulus types (Figure 2). The color stimuli were randomly drawn from four basic colors: yellow, red, blue, and green.
In Neutral trials, the top row consisted of meaningless letter strings (e.g., “XXXX”) displayed in color, while the bottom row featured a color name printed in black. In Congruent trials, a color word was shown in a matching font color (e.g., the word “RED” in red). In Incongruent trials, a color word was displayed in a non-matching font color (e.g., “RED” in green) (Figure 2), requiring participants to inhibit automatic color processing and resolve the semantic conflict. This manipulation reliably induced Stroop interference [20,25,29,30,31].
Reaction times and accuracies were recorded for each stimulus type (N, C, and IC) separately and analyzed offline.
2.3. fNIRS Equipment
The fNIRS system used in this study was the NIROXCOPE 301, developed by the Neuro-Optical Imaging Laboratory at Boğaziçi University [24,30]. The system operates at a sampling frequency of 1.77 Hz and consists of three main components: a data acquisition unit, a control computer, and a flexible optode probe designed to be positioned on the subject’s forehead.
The rectangular probe incorporates four dual-wavelength light-emitting diodes (LEDs) operating at 730 nm and 850 nm. Each LED () is surrounded by four photodetectors (), placed at a distance of 2.5 cm from the LED center, as illustrated in Figure 3. A measurement channel is formed by pairing an LED with each of its surrounding detectors. Due to shared detectors between adjacent LED sites, a total of 16 channels () are available.
Because light intensity detected is inversely proportional to the square of the distance between the source and detector, long-range channels (e.g., between and , , or ) were excluded from data collection.
2.4. fNIRS Data Preprocessing
The fNIRS HbO signals contain both neuronally driven and systemic physiological hemodynamic components that span a broad frequency range and are intermingled within the recorded data. While neuronally induced fluctuations reflect spontaneous and task-related cortical activity, systemic components arise from physiological processes such as cardiac pulsation, respiration, blood pressure fluctuations, and vascular tone regulation.
To accurately compute correlation-based functional connectivity between HbO signals from different channel pairs, it was essential to attenuate the influence of global systemic effects of non-neuronal origin. These global components can artificially inflate inter-channel correlations, potentially confounding interpretations of neuronal connectivity.
To address this, a partial correlation approach was implemented following the methodology proposed in [1,33]. First, all HbO signals were high-pass filtered using an 8th-order Butterworth filter with a cut-off frequency of 0.009 Hz, consistent with prior studies [1,20,26,29,30,33]. The filtered signals across all channels were then averaged to obtain a single global regressor, which was subsequently used as a partial regressor in the correlation analysis. This procedure effectively minimized the contribution of shared systemic noise and allowed for the estimation of partial correlations more specifically reflecting neuronally induced signal components.
To compute functional connectivity between channel pairs, task-related HbO time series were extracted for each channel. Specifically, the segments of the HbO signal corresponding to each stimulus block were isolated from block onset to offset and then concatenated across all blocks of the same session, resulting in a single task-related time series for each channel (Figure 4). The same segmentation and concatenation procedure was applied to the global signal regressor to ensure temporal alignment. This regressor was then used in a partial correlation framework to account for global systemic influences (Figure 4).
The partial correlation coefficient between two channels i and j given the regressor k was computed according to the analytical formulation described by [35]:
Here, represents the simple correlation between channels i and j, while and denote their correlations with the global regressor. In this way, the influence of systemic components was minimized, and the resulting coefficients more specifically reflected neuronally driven connectivity between fNIRS channels.
Using these aligned time series, partial correlation (PC)-corrected functional connectivity matrices (FCM) were generated for each subject by removing the influence of the global regressor during correlation estimation [1].
2.5. Functional Connectivity Matrices
After preprocessing, partial correlation analysis was performed to compute FCMs between all pairs of fNIRS channels. For each participant and each stimulus type (Neutral, Congruent, and Incongruent), a FCM was generated based on partial correlation coefficients between HbO signals. These matrices captured stimulus type-specific pairwise relationships between channels.
Within each diagnostic group, individual FCMs were averaged across participants to obtain group-level FCMs for each stimulus type. To enable statistical comparisons between groups, the partial correlation values were converted to z-scores using Fisher’s r-to-z transformation.
2.6. MST Generation and Metrics
Minimum spanning trees (MSTs) were constructed individually for each participant and each stimulus type using the corresponding partial correlation-based FCMs. To retain the strongest network connections while removing loops, FCM values were transformed into distances using the metric , where represents the absolute partial correlation coefficient between channels [36].
MSTs were generated using Kruskal’s algorithm [37], which iteratively adds the shortest available edge that does not form a cycle until all nodes are connected. In this context, nodes represent fNIRS channels and edges reflect the distance-transformed partial correlation values. The resulting MSTs are acyclic, binary graphs that preserve full connectivity with minimal total edge weight.
Seven global metrics were extracted from each MST to characterize the overall network topology: diameter, leaf fraction (lf), tree hierarchy (Th), maximum degree (Dmax), assortativity (r), degree divergence (ka), and average path length (path). Definitions of these metrics are summarized in Table 1 [13].
MST metrics were computed for each participant separately for the three Stroop stimulus types (neutral, congruent, and incongruent). For subject-level analysis, each metric was calculated from the MST corresponding to that participant and stimulus type. Group-level averages were then obtained by calculating the mean metric value across all participants within the same group for each stimulus type separately.
Outliers were defined, following Canario et al. [15], as values exceeding two standard deviations from the group mean for a given metric and stimulus type. These outliers were removed prior to further analysis. Behavioral performance measures, including reaction time (RT) and accuracy (ACC), were also examined for outliers using the same criterion. Participants identified as outliers in either MST metrics or behavioral measures were excluded before performing correlation analyses.
To assess the similarity of MST structures, the survival ratio (SR) was computed. This metric quantifies the proportion of shared edges between two MSTs and is defined as , where and are the sets of edges in two MSTs and is the total number of edges in a spanning tree for n nodes [36].
SR values were calculated across participants to evaluate network similarity for each diagnostic group and each stimulus type separately. In addition, pairwise comparisons were performed between all group pairs within the same stimulus type, and between all stimulus type pairs within the same group, to further examine self-similarity patterns in MST topology.
To statistically assess differences in SR, nonparametric permutation testing was performed with 5000 random permutations [15]. For each iteration, participants were randomly reassigned to groups or stimulus types depending on the comparison being tested, and SR values were recomputed. The observed differences were then compared to the null distribution, and values were obtained by computing the proportion of permutations that yielded differences equal to or greater than the observed values.
To evaluate the regional distribution of MST connectivity, the number of edges within and between brain hemispheres was quantified for each participant. Specifically, connections were categorized as left intrahemispheric, right intrahemispheric, or interhemispheric. The number of edges falling into each category was counted from the binary MST structure of each participant to assess the relative contribution of regional connectivity.
2.7. Statistical Analysis
Statistical analyses were performed to assess group and stimulus type effects on MST metrics and behavioral performance measures. The Shapiro–Wilk test was used to assess the normality of each MST metric, reaction time (RT), accuracy (ACC), and hemispheric connection counts (Table 2).
In cases where the assumption of normality was violated (), non-parametric alternatives were used.
To evaluate group and stimulus type effects on global MST metrics, a mixed-design ANOVA was performed with ’group’ (Control, Migraine, OCD, SCHIZO) as the between-subjects factor and ’stimulus type’ (Neutral, Congruent, Incongruent) as the within-subject factor. For within-subject factors that violated the sphericity assumption, the Greenhouse–Geisser correction was applied. When the mixed ANOVA revealed no significant group or interaction effects, stimulus type-averaged values were computed, and between-group comparisons were performed using one-way ANOVA for normally distributed metrics or the Kruskal–Wallis test otherwise.
Post hoc comparisons were conducted using independent-samples t-tests for normally distributed metrics or the Wilcoxon rank-sum test for non-normally distributed data. Bonferroni correction was applied to adjust for multiple comparisons, and the corrected level was determined based on the number of group or stimulus type comparisons in each analysis (e.g., for three comparisons, for four, etc.). All statistical analyses were performed in MATLAB (R2023b, MathWorks Inc., Natick, MA, USA) using the Statistics and Machine Learning Toolbox.
3. Results
3.1. Behavioral Results
Figure 5 shows the reaction times and accuracy values for all participants across different stimulus types.
The mixed-design ANOVA revealed significant main effects of both group (RT: ; ACC: ) and stimulus type (RT: ; ACC: , Greenhouse-Geisser corrected), while the interaction between group and stimulus type was not statistically significant.
To further investigate the effect of stimulus type, paired comparisons between stimulus types (neutral, congruent, and incongruent) were conducted across all participants. Depending on normality, paired t-tests or Wilcoxon signed-rank tests were used. Bonferroni correction was applied to control for multiple comparisons across three stimulus type pairs (). For RT, the incongruent stimulus type yielded significantly longer reaction times compared to both the neutral (, Wilcoxon) and congruent (, Wilcoxon) stimulus types. In addition, RT was significantly longer in the neutral stimulus type compared to the congruent stimulus type (, paired t-test), indicating that participants responded fastest to congruent stimuli and slowest to incongruent stimuli.
For ACC, Wilcoxon signed-rank tests revealed significantly lower accuracy scores in the incongruent stimulus type compared to both the neutral () and congruent () stimulus types. No significant difference was observed between neutral and congruent stimulus types (). These results indicate that the incongruent stimuli induced greater cognitive interference, reflected by both slower responses and reduced accuracy.
To examine the effect of group, stimulus type-averaged RT and ACC scores were compared across the four clinical groups. Depending on normality, either independent samples t-tests or Wilcoxon rank-sum tests were used. Bonferroni correction was applied for six pairwise group comparisons, resulting in a significance threshold of .
For RT, OCD patients exhibited significantly longer reaction times than the control group (, independent t-test). Similarly, participants with SCHIZO had longer RTs than controls (, independent t-test). Reaction times were also longer in the SCHIZO group compared to the migraine group (, Wilcoxon), and in the OCD group compared to the migraine group (, Wilcoxon). No significant difference was found between the control and migraine groups (, Wilcoxon).
For ACC, OCD participants had significantly lower accuracy scores than the control group (, independent t-test), and SCHIZO participants scored lower than controls as well (, independent t-test). Accuracy was also lower in the SCHIZO group compared to the migraine group (, Wilcoxon). No significant differences were found between the OCD and SCHIZO groups or between OCD and migraine groups.
These findings confirm group-related differences in behavioral performance, independent of stimulus type.
3.2. Functional Connectivity Analysis
Figure 6 shows group-averaged partial-correlation FC matrices for each group and stimulus type. Neither the mixed-design ANOVA nor the subsequent pairwise comparisons revealed statistically significant differences between groups. Two-sample t-tests performed on each channel pair and corrected using the Benjamini–Hochberg false discovery rate (BH-FDR) procedure also yielded no significant effects.
Given the absence of interaction, we collapsed across stimulus type (subject-wise means) to test group effects on condition-averaged metrics, following our preregistered/planned analysis scheme.
3.3. MST Analysis
3.3.1. MST Metric Analysis
Figure 7 displays the distribution of all seven global MST metrics for the Control, Migraine, OCD, and SCHIZO groups, averaged across stimulus types (Neutral, Congruent, Incongruent). Mixed-design ANOVA revealed significant main effects of group for tree diameter (), characteristic path length (), and leaf fraction (), with no significant stimulus-type or group × stimulus-type interaction effects. Given the absence of interaction, stimulus-type–averaged values were computed and re-tested between groups according to distributional assumptions, revealing an additional group effect for degree divergence (). Bonferroni-adjusted post hoc tests indicated that the only pair meeting the corrected threshold (; six group pairs) was a higher characteristic path length in SCHIZO versus Control (). Several other contrasts reached nominal significance but did not meet the Bonferroni threshold, including higher diameter in SCHIZO versus Control () and SCHIZO versus Migraine (), lower characteristic path length in Control versus OCD (), lower leaf fraction in SCHIZO versus Control () and SCHIZO versus Migraine (), and lower degree divergence in SCHIZO versus Control () and SCHIZO versus Migraine (). Overall, SCHIZO tended to show the highest tree diameter and characteristic path length, together with the lowest leaf fraction and degree divergence, whereas Control and Migraine exhibited patterns consistent with a more integrated topology.
Figure 8 summarizes within-subject (paired) comparisons between stimulus types for metrics showing stimulus type effects. The only contrast meeting the Bonferroni-corrected threshold (; three stimulus type pairs) was a higher characteristic path length in the Incongruent compared to the Congruent stimulus type (paired t-test, ). Additional differences were observed at the nominal level but did not reach the Bonferroni threshold, namely for the Congruent versus Incongruent comparison in diameter (), leaf fraction (), and degree divergence (). No other stimulus type pairs approached significance.
3.3.2. Correlations Between Global MST Metrics and Behavioral Measures
Table 3 details the correlations between MST metrics and behavioral measures. Only associations with are reported. Significant effects were observed exclusively for reaction time (RT): RT correlated positively with tree diameter and characteristic path length, and negatively with leaf fraction and degree divergence. Collectively, these findings indicate that slower responses are associated with a less integrated MST topology—i.e., longer trees and paths alongside fewer leaves and lower degree diversity. No significant associations were observed with accuracy (ACC).
3.3.3. MST Similarities by Survival Ratio
Figure 9 shows within-group similarities (SR)—i.e., similarity among participants within the same diagnostic group under a given stimulus type—for each group and stimulus type (Neutral, Congruent, Incongruent). For every group–stimulus-type cell, participant-by-participant SR matrices were computed and averaged, and differences were assessed with permutation tests (5,000 iterations).
Table 4 summarizes mean SR values and associated p-values. Between-group effects were detected for Neutral () and Congruent (), but not for Incongruent (). In pairwise permutation contrasts, Controls showed higher similarity than OCD in Neutral () and than SCHIZO in Congruent (); additional Neutral differences were observed for Control–Migraine () and OCD–SCHIZO (), while Control–OCD also differed in Congruent (). No pairwise differences emerged in Incongruent. Higher SR values indicate greater within-group similarity (i.e., more overlapping MST edges across participants).
3.3.4. Hemispheric MST Connections
Figure 10 shows the number of MST edges within the left and right hemispheres and between hemispheres for each group and stimulus type (Neutral, Congruent, Incongruent). A mixed-design ANOVA with group as a between-subjects factor and stimulus type and hemisphere type (left, right, inter-hemispheric) as within-subjects factors revealed a robust main effect of hemisphere type (Greenhouse–Geisser ). Across groups and stimulus types, intra-hemispheric edge counts were consistently higher than inter-hemispheric counts, whereas left–right counts were broadly comparable (, , , ). No other main or interaction effects were detected, indicating a stable hemispheric organization that does not differ by diagnosis or stimulus type.
4. Discussion
This study leveraged MSTs to characterize fNIRS-based large-scale brain networks during a Stroop paradigm across four diagnostic groups (Control, Migraine, OCD, SCHIZO). While edge-wise analyses of partial-correlation FC (120 channel pairs) yielded no group effects after Benjamini–Hochberg FDR correction, MST summaries revealed coherent group-level topology shifts. This pattern aligns with prior work emphasizing that MSTs provide a threshold-free, density-invariant backbone that improves cross-subject comparability and robustness to noise, thereby increasing sensitivity to principled topological differences that dense FC maps can obscure [15,16].
At the global level, the SCHIZO group tended to exhibit the least integrated organization: tree diameter and characteristic path length were the highest, whereas leaf fraction and degree divergence were the lowest; the only Bonferroni-significant post-hoc contrast was a longer path length in SCHIZO versus Control. In MST terms, longer trees and paths together with fewer leaves and reduced degree diversity indicate a more “line-like,” less efficient backbone. This pattern dovetails with the transdiagnostic shift summarized by [16]—increased diameter and decreased leaf fraction—and with graph-theoretical reports of reduced small-worldness/efficiency and increased path length in SCHIZO across modalities, including recent fNIRS small-world analyses during Stroop [7,8,9,22].
Behavior-network coupling supported this interpretation: slower responses (longer RTs) correlated positively with tree diameter and path length and negatively with leaf fraction and degree divergence, indicating that decreased behavioral efficiency coexists with less integrated backbones. Conceptually, characteristic path length indexes global integration and is inversely related to global efficiency, so increases in path length are expected to accompany behavioral slowing when distributed processing becomes less efficient [6].
Task manipulations produced the expected Stroop interference at the behavioral level (incongruent > neutral/congruent for RT; accuracy decrements in incongruent), yet effects on MST metrics were modest: only a slight increase in path length for incongruent versus congruent survived correction. This suggests that diagnostic status exerts a larger influence on the MST backbone than momentary task demands in this paradigm, while the behavioral pattern replicates classic Stroop findings. One parsimonious interpretation is that incongruent trials transiently weaken long-range integration and hub efficiency. In such states the MST tends to select slightly less direct backbone routes, which manifests as a modest increase in characteristic path length while other global descriptors remain comparatively stable. Consistent task-based graph studies report transient reductions in global efficiency and concomitant increases in characteristic path length during incongruent or high-load conditions (and after Stroop-induced fatigue), indicating a brief shift toward a more line-like backbone [20,38].
We further examined within-group MST similarity using the survival ratio (SR). Controls showed higher within-group overlap than OCD in Neutral and than SCHIZO in Congruent, with no differences for Incongruent—consistent with more heterogeneous individual backbones in diseased groups under lower-interference conditions. These observations indicate that separability here arises primarily from systematic shifts in backbone topology rather than wholesum re-wiring of dense edge sets.
Hemispheric MST edge counts (left, right, inter-hemispheric) displayed a robust main effect of hemisphere type (intra-hemispheric > inter-hemispheric) but no diagnosis or interaction effects, suggesting broadly stable lateralization at this coarse summary level. Given evidence for spatially specific alterations in clinical populations, finer-grained (lobe/parcel) analyses may reveal focal asymmetries that hemisphere-level totals cannot detect.
Methodologically, our findings highlight two practical advantages of MSTs for clinical fNIRS: (i) direct cross-subject comparability without arbitrary density/threshold choices, and (ii) resilience to SNR variability across participants and conditions. These features—emphasized in reviews and simulations—likely explain why MST metrics captured coherent group patterns where FC did not [15,16].
Relation to Prior MST Literature and Disorder Specificity
Our SCHIZO-related pattern (higher diameter/path, lower leaf fraction/degree diversity) dovetails with the transdiagnostic “line-like” shift reported by [16] and with widely observed reductions in small-worldness/efficiency in SCHIZO across modalities [7,8,9,22]. At the same time, the modest number of Bonferroni-significant pairs cautions that effects are not large and may depend on modality and preprocessing choices—points repeatedly emphasized by systematic reviews [16].
For the Migraine group, the lack of robust separation from controls in global MST metrics is consistent with interictal (pain-free) literature, where effects tend to be subtle and heterogeneous. Broad reviews catalogue network alterations but emphasize strong dependence on aura status, disease duration/severity, chronic versus episodic subtype, and medication—factors that can render group-level effects inconsistent in mixed interictal cohorts [39,40]. Null findings are particularly plausible in resting or low-stimulation paradigms, and interictal migraine without aura can show intact neurovascular coupling during Stroop, whereas subgroup-focused/task studies reveal clearer effects (e.g., reduced prefrontal oxygenation during Stroop in migraine with aura) [41,42]. Notably, the MST evidence base in migraine remains sparse, underscoring sensitivity to modality and preprocessing choices and the need for harmonized reporting (e.g., node counts, connectivity measures) [16]. Taken together, our migraine–control non-separation likely reflects (i) interictal, pain-free acquisition windows, (ii) aura heterogeneity and medication factors, (iii) local/band-limited effects that do not strongly impact global MST summaries, and (iv) the limited MST literature in migraine to date. Notably, prior fNIRS work showing migraine–control confusability in classification was conducted on the same cohort with different features, so we treat it as methodological convergence rather than external validation [21]. Future work should stratify by aura, distinguish chronic vs episodic subtypes, incorporate local MST descriptors, and pursue cross-modal validation to improve sensitivity and interpretability (cf. [16]).
Notably, similar observations have been made in Alzheimer’s disease, where MSTs captured segregation/integration imbalances even when conventional contrasts were weak or heterogeneous. Using fNIRS-based MSTs, [15] reported increased path length and hemisphere-specific re-organization in AD, underscoring that MSTs can expose backbone-level disruptions across imaging modalities and clinical populations. Beyond external reviews, converging analyses on the same cohort using fNIRS-derived global efficiency and the Neurocognitive Ratio likewise reported strong separability for SCHIZO/OCD and weaker interictal differences for migraine [1,21]. Because these studies analyze the same dataset with different pipelines, these consistencies should be interpreted as convergent re-analyses rather than independent replications. Using a distinct graph-theoretic pipeline on the same cohort, a small-world analysis reported reduced clustering/modularity and altered efficiency during Stroop, which triangulates our MST-based pattern while not constituting an independent sample [22].
Limitations and Future Directions
Several limitations merit mention. First, we summarized spatial organization at the hemisphere level; lobe/parcel analyses may increase sensitivity to focal asymmetries and hub shifts. Second, although multiple MST metrics showed coherent trends, only a subset of post-hoc contrasts survived stringent correction; replication in larger samples is warranted. Third, cross-study generalization is complicated by heterogeneity in node definitions, node counts, and connectivity measures; reporting—and where possible adjusting for—network size is particularly important for leaf fraction [16]. Fourth, the present study employed a 16-channel fNIRS system with optodes restricted to the prefrontal cortex. This restriction precludes assessment of wider cortical networks such as frontoparietal or default mode systems. While this configuration has been validated in prior work, modern high-density systems with broader cortical coverage and larger channel counts are now available and may provide more reliable and fine-grained mapping of connectivity, thereby strengthening the robustness of MST-based analyses. Finally, several reference studies we cite were conducted on the same dataset using alternative processing/feature pipelines. While this triangulation is informative, independent-cohort replication is needed to establish generalizability [1,21,22].
In summary, MST analysis revealed disease-related shifts toward less integrated, more line-like backbones—most prominently in SCHIZO—that were not apparent in edge-wise FC tests. The coupling between MST topology and response speed further links network organization to behavior. These findings support MSTs as a principled, threshold-free complement to conventional FC for detecting clinically relevant alterations in large-scale brain organization.
5. Conclusions
Applying minimum spanning trees (MSTs) to fNIRS-derived connectivity during a Stroop paradigm, we identified diagnosis-related alterations in global network topology across Control, Migraine, OCD, and SCHIZO groups. SCHIZO showed the clearest deviation from controls, characterized by a longer characteristic path length (Bonferroni-corrected) together with trends toward larger diameter, lower leaf fraction, and lower degree divergence—features consistent with a less integrated, more line-like backbone.
MST organization was behaviorally meaningful: reaction times correlated positively with tree diameter and characteristic path length and negatively with leaf fraction and degree divergence, linking slower responses to reduced network integration. Task manipulations produced only modest changes at the backbone level (a slight increase in path length for incongruent versus congruent), suggesting that diagnostic status exerts a stronger influence on global topology than momentary conflict in this paradigm.
Beyond global metrics, within-diagnosis similarity analyses revealed more heterogeneous backbones in clinical cohorts (lower survival ratio in OCD under Neutral and in SCHIZO under Congruent), whereas hemispheric edge counts exhibited a stable pattern (intra-hemispheric > inter-hemispheric) without diagnosis- or stimulus-type interactions. The migraine group did not separate robustly from controls on global MST metrics, consistent with subtle, phenotype- and state-dependent alterations in interictal recordings.
Taken together, these findings support MST-derived metrics as compact, threshold-free descriptors that capture clinically relevant variation in large-scale brain organization, with fNIRS. Future work should test whether combining MST features with task-informed and frequency-aware markers, and validating in larger, independent cohorts (potentially with machine-learning classifiers), can enhance diagnostic specificity and prognostic utility.
Author Contributions
Conceptualization, P.A.K., A.A., and A.Ak.; methodology, P.A.K., A.A., and A.Ak.; software, P.A.K.; validation, P.A.K., A.A., and A.Ak.; formal analysis, P.A.K.; investigation, P.A.K.; resources, P.A.K., A.A., and A.Ak.; data curation, P.A.K. and A.Ak.; writing—original draft preparation, P.A.K.; writing—review and editing, P.A.K., A.A., and A.Ak.; visualization, P.A.K. and A.Ak.; supervision, A.A. All authors have read and agreed to the published version of the manuscript.
Funding
This research received no external funding.
Institutional Review Board Statement
The research was carried out in compliance with the ethical standards of the Declaration of Helsinki and was approved by the Institutional Review Board of Pamukkale University (Protocol Code: B.30.2.PAU.0.01.00.00-200/130-0146; Approval Date: 15 January 2007).
Informed Consent Statement
Informed consent was obtained from all subjects involved in the study.
Data Availability Statement
Data is available upon request.
Acknowledgments
The authors gratefully acknowledge Deniz Nevşehirli for his assistance in the development of fNIRS optodes, and Dr. Nermin Topaloğlu together with Dr. Sinem Burcu Erdoğan for their support in data collection.
Conflicts of Interest
The authors declare no conflicts of interest.
Abbreviations
The following abbreviations are used in this manuscript:
| ACC | Accuracy |
| AD | Alzheimer’s Disease |
| ANOVA | Analysis of Variance |
| BH-FDR | Benjamini–Hochberg False Discovery Rate |
| C | Congruent |
| Dmax | Maximum Degree |
| FC | Functional Connectivity |
| FCM | Functional Connectivity Matrix (or Matrices) |
| fNIRS | Functional Near-Infrared Spectroscopy |
| HbO | Oxyhemoglobin Concentration |
| IC | Incongruent |
| ka | Degree Divergence |
| LD | Linear Dichroism |
| LED | Light Emitting Diode |
| lf | Leaf Fraction |
| MCI | Mild Cognitive Impairment |
| MDPI | Multidisciplinary Digital Publishing Institute |
| MST | Minimum Spanning Tree |
| N | Neutral |
| NCR | Neurocognitive Ratio |
| OCD | Obsessive–Compulsive Disorder |
| path | Characteristic Path Length |
| PC | Partial Correlation |
| RT | Reaction Time |
| SCHIZO | Schizophrenia |
| SCI | Subjective Cognitive Impairment |
| SD | Standard Deviation |
| SNR | Signal-to-Noise Ratio |
| SR | Survival Ratio |
| Th | Tree Hierarchy |
References
- Akın, A. fNIRS-derived Neurocognitive Ratio as a biomarker for neuropsychiatric diseases. Neurophotonics 2021, 8, 035008. [Google Scholar] [CrossRef]
- Menzies, L.; Chamberlain, S.R.; Laird, A.R.; Thelen, S.M.; Sahakian, B.J.; Bullmore, E.T. Integrating evidence from neuroimaging and neuropsychological studies of obsessive-compulsive disorder: The orbitofronto-striatal model revisited. Neuroscience & Biobehavioral Reviews 2008, 32, 525–549. [Google Scholar] [CrossRef]
- Schwedt, T.J.; Chiang, C.C.; Chong, C.D.; Dodick, D.W. Functional MRI of migraine. The Lancet Neurology 2015, 14, 81–91. [Google Scholar] [CrossRef]
- Minzenberg, M.J.; Laird, A.R.; Thelen, S.; Carter, C.S.; Glahn, D.C. Meta-analysis of 41 functional neuroimaging studies of executive function in schizophrenia. Archives of General Psychiatry 2009, 66, 811–822. [Google Scholar] [CrossRef] [PubMed]
- Insel, T.; Cuthbert, B.; Garvey, M.; Heinssen, R.; Pine, D.S.; Quinn, K.; Sanislow, C.; Wang, P. Research Domain Criteria (RDoC): Toward a new classification framework for research on mental disorders. American Journal of Psychiatry 2010, 167, 748–751. [Google Scholar] [CrossRef]
- Stam, C.J.; Reijneveld, J.C. Graph theoretical analysis of complex networks in the brain. Nonlinear Biomedical Physics 2007, 1, 3. [Google Scholar] [CrossRef]
- Lynall, M.E.; Bassett, D.S.; Kerwin, R.; McKenna, P.J.; Kitzbichler, M.; Muller, U.; Bullmore, E.T. Functional connectivity and brain networks in schizophrenia. Journal of Neuroscience 2010, 30, 9477–9487. [Google Scholar] [CrossRef] [PubMed]
- van den Heuvel, M.P.; Mandl, R.C.; Stam, C.J.; Kahn, R.S.; Pol, H.E.H. Aberrant frontal and temporal complex network structure in schizophrenia: A graph theoretical analysis. Journal of Neuroscience 2010, 30, 15915–15926. [Google Scholar] [CrossRef]
- Zhu, J.; Song, L.; Wang, X.; et al. . Alterations of Functional and Structural Networks in Schizophrenia: A Systematic Review. Neuroscience and Biobehavioral Reviews 2016, 62, 101–122. [Google Scholar] [CrossRef]
- van Wijk, B.C.M.; Stam, C.J.; Daffertshofer, A. Comparing brain networks of different size and connectivity density using graph theory. PLoS ONE 2010, 5, e13701. [Google Scholar] [CrossRef]
- Fornito, A.; Zalesky, A.; Breakspear, M. Graph analysis of the human connectome: Promise, progress, and pitfalls. NeuroImage 2013, 80, 426–444. [Google Scholar] [CrossRef]
- Stam, C.J.; Tewarie, P.; van Dellen, E.; van Straaten, E.C.W.; Hillebrand, A.; Mieghem, P.V. The trees and the forest: Characterization of complex brain networks with minimum spanning trees. International Journal of Psychophysiology 2014, 92, 129–138. [Google Scholar] [CrossRef]
- Tewarie, P.; van Dellen, E.; Hillebrand, A.; Stam, C.J. The minimum spanning tree: An unbiased method for brain network analysis. NeuroImage 2015, 104, 177–188. [Google Scholar] [CrossRef]
- van Dellen, E.; de Witt Hamer, J.; Douw, P.; Otte, W.M.; Hillebrand, A.; Stam, C.J.; Hogendoorn, P.C.W.; van den Heuvel, M.J. Minimum spanning tree analysis of the human connectome. Brain Connectivity 2018, 8, 129–143. [Google Scholar] [CrossRef] [PubMed]
- Canario, E.; Chen, D.; Han, Y.; Niu, H.; Biswal, B.B. Global Network Analysis of Alzheimer’s Disease with Minimum Spanning Trees. Journal of Alzheimer’s Disease 2022, 89, 571–581. [Google Scholar] [CrossRef] [PubMed]
- Blomsma, N.; de Rooy, B.; Gerritse, F.; van der Spek, R.; Tewarie, P.; Hillebrand, A.; Otte, W.M.; Stam, C.J.; van Dellen, E. Minimum spanning tree analysis of brain networks: A systematic review of network size effects, sensitivity for neuropsychiatric pathology, and disorder specificity. Network Neuroscience 2022, 6, 301–327. [Google Scholar] [CrossRef]
- Zhou, Y.; Li, M.; Zhang, J.; Zhou, J.; Liu, Y.; Gao, S.; Niu, H. Frontal Functional Network Disruption Associated with Amyotrophic Lateral Sclerosis: An fNIRS-Based Minimum Spanning Tree Analysis. Frontiers in Neuroscience 2020, 14, 613990. [Google Scholar] [CrossRef]
- Wang, B.; Wang, X.; Li, W.; Chen, Y.; Zhang, X.; Zhou, F.; Zhang, Y.; Wang, Y.; Xu, Z. Abnormal Functional Brain Networks in Mild Cognitive Impairment and Alzheimer’s Disease: A Minimum Spanning Tree Analysis. Journal of Alzheimer’s Disease 2018, 65, 1093–1107. [Google Scholar] [CrossRef]
- Zhou, Y.; Fan, X.; Wu, L.; Nie, B.; Guo, W.; Zhang, J.; Gao, S.; Niu, H. Exploring Brain Network Changes During Mental Arithmetic Task With Minimum Spanning Tree. Frontiers in Human Neuroscience 2022, 16, 959053. [Google Scholar] [CrossRef]
- Einalou, Z.; Maghooli, K.; Setarehdan, S.K.; Akın, A. Graph theoretical approach to functional connectivity in prefrontal cortex via fNIRS. Neurophotonics 2017, 4, 041407. [Google Scholar] [CrossRef]
- Erdoğan, S.B.; Yüksel, M.; Açıkel, B.Ç.; et al. . Four-Class Classification of Neuropsychiatric Disorders by Use of fNIRS-Derived Global Efficiency Metrics During a Stroop Task. Sensors 2022, 22, 5407. [Google Scholar] [CrossRef]
- Akın, A.; Dumlu, S.N.; Açıkel, B.Ç.; et al. . Small world properties of schizophrenia and OCD patients derived from fNIRS-based functional brain network connectivity metrics. Scientific Reports 2024, 14, 24314. [Google Scholar] [CrossRef] [PubMed]
- Akgul, C.B.; Akin, A.; Sankur, B. Extraction of cognitive activity-related waveforms from functional near-infrared spectroscopy signals. Med Biol Eng Comput 2006, 44, 945–958. [Google Scholar] [CrossRef]
- Ata Akin. ; Didem Bilensoy.; Uzay E Emir.; Murat Gulsoy.; Selçuk Candansayar.; Hayrunnisa Bolay. Cerebrovascular dynamics in patients with migraine: near-infrared spectroscopy study. Neurosci Lett 2006, 400, 86–91. [Google Scholar] [CrossRef] [PubMed]
- Ciftci, K.; Sankur, B.; Kahya, Y.P.; Akin, A. Multilevel statistical inference from functional near-infrared spectroscopy data during stroop interference. IEEE Transactions on biomedical engineering 2008, 55, 2212–2220. [Google Scholar] [CrossRef] [PubMed]
- Dadgostar, M.; Setarehdan, S.K.; Shahzadi, S.; Akin, A. Functional connectivity of the PFC via partial correlation. Optik-International Journal for Light and Electron Optics 2016, 127, 4748–4754. [Google Scholar] [CrossRef]
- Dalmis, M.U.; Akin, A. Similarity analysis of functional connectivity with functional near-infrared spectroscopy. J Biomed Opt 2015, 20, 86012. [Google Scholar] [CrossRef]
- Einalou, Z.; Maghooli, K.; Setarehdan, S.K.; Akin, A. Functional near Infrared Spectroscopy for Functional Connectivity during Stroop test via Mutual Information. Adv. Biores. 2015, 6, 62–67. [Google Scholar]
- Einalou, Z.; Maghooli, K.; Setarehdan, S.K.; Akin, A. Effective channels in classification and functional connectivity pattern of prefrontal cortex by functional near infrared spectroscopy signals. Optik-International Journal for Light and Electron Optics 2016, 127, 3271–3275. [Google Scholar] [CrossRef]
- Aydöre, S.; Mihçak, M.K.; Çiftçi, K.; Akın, A. On temporal connectivity of PFC via Gauss-Markov modeling of fNIRS signals. Biomedical Engineering, IEEE Transactions on 2010, 57, 761–768. [Google Scholar] [CrossRef]
- Zysset, S.; Müller, K.; Lohmann, G.; von Cramon, D.Y. Color-word matching stroop task: separating interference and response conflict. Neuroimage 2001, 13, 29–36. [Google Scholar] [CrossRef]
- Erdoĝan, S.B.; Yücel, M.A.; Akın, A. Analysis of task-evoked systemic interference in fNIRS measurements: insights from fMRI. Neuroimage 2014, 87, 490–504. [Google Scholar] [CrossRef] [PubMed]
- Akin, A. Partial correlation-based functional connectivity analysis for functional near-infrared spectroscopy signals. Journal of Biomedical Optics 2017, 22, 126003. [Google Scholar] [CrossRef] [PubMed]
- Einalou, Z.; Maghooli, K.; Setarehdan, S.K.; Akin, A. Functional Near Infrared Spectroscopy to Investigation of Functional Connectivity in Schizophrenia Using Partial Correlation. Universal Journal of Biomedical Engineering 2014, 2, 5–8. [Google Scholar] [CrossRef]
- Marrelec, G.; Krainik, A.; Duffau, H.; Pélégrini-Issac, M.; Lehéricy, S.; Doyon, J.; Benali, H. Partial correlation for functional brain interactivity investigation in functional MRI. Neuroimage 2006, 32, 228–237. [Google Scholar] [CrossRef]
- Lee, U.; Kim, S.; Jung, K.Y. Classification of epilepsy types through global network analysis of scalp electroencephalograms. Physical Review E—Statistical, Nonlinear, and Soft Matter Physics 2006, 73, 041920. [Google Scholar] [CrossRef]
- Kruskal, J.B. On the shortest spanning subtree of a graph and the traveling salesman problem. Proceedings of the American Mathematical society 1956, 7, 48–50. [Google Scholar] [CrossRef]
- Wu, J.; Guan, Z.; Li, C.; Wang, W.; Sun, R.; Zhu, Z.; Song, L.; Gong, W. Brain functional connectivity after Stroop task induced cognitive fatigue. Scientific Reports 2025, 15, 22342. [Google Scholar] [CrossRef] [PubMed]
- Schramm, S.; Goadsby, P.J.; May, A.; Ashina, M.; Schulte, L.H. Functional magnetic resonance imaging in migraine: A systematic review. Cephalalgia 2023, 43, 333–354. [Google Scholar] [CrossRef]
- Chou, B.C.; Chen, B. Functional MRI and Diffusion Tensor Imaging in Migraine: A Review of Migraine Functional and White Matter Microstructural Changes. Brain Sciences 2023, 13, 1521. [Google Scholar] [CrossRef]
- Schytz, H.W. Near infrared spectroscopy–investigations in neurovascular diseases. Danish Medical Journal 2015, 62, B5166. [Google Scholar] [PubMed]
- Zengin, N.; Güdücü, Ç.; Çağlayanel, I.; Öztürk, V. Reduced oxygen supply to the prefrontal cortex during the Stroop task in migraine patients with aura: A preliminary functional near-infrared spectroscopy study. Brain Research 2025, 1849, 149344. [Google Scholar] [CrossRef] [PubMed]
Figure 1.
neutral, congruent and incongruent stimuli blocks in Stroop task.

Figure 2.
Examples of stimulus configurations used in the color–word Stroop task. Schematic representations illustrate match (top row) and non-match (bottom row) trials for (A) Neutral, (B) Congruent, and (C) Incongruent stimulus types.
Figure 2.
Examples of stimulus configurations used in the color–word Stroop task. Schematic representations illustrate match (top row) and non-match (bottom row) trials for (A) Neutral, (B) Congruent, and (C) Incongruent stimulus types.
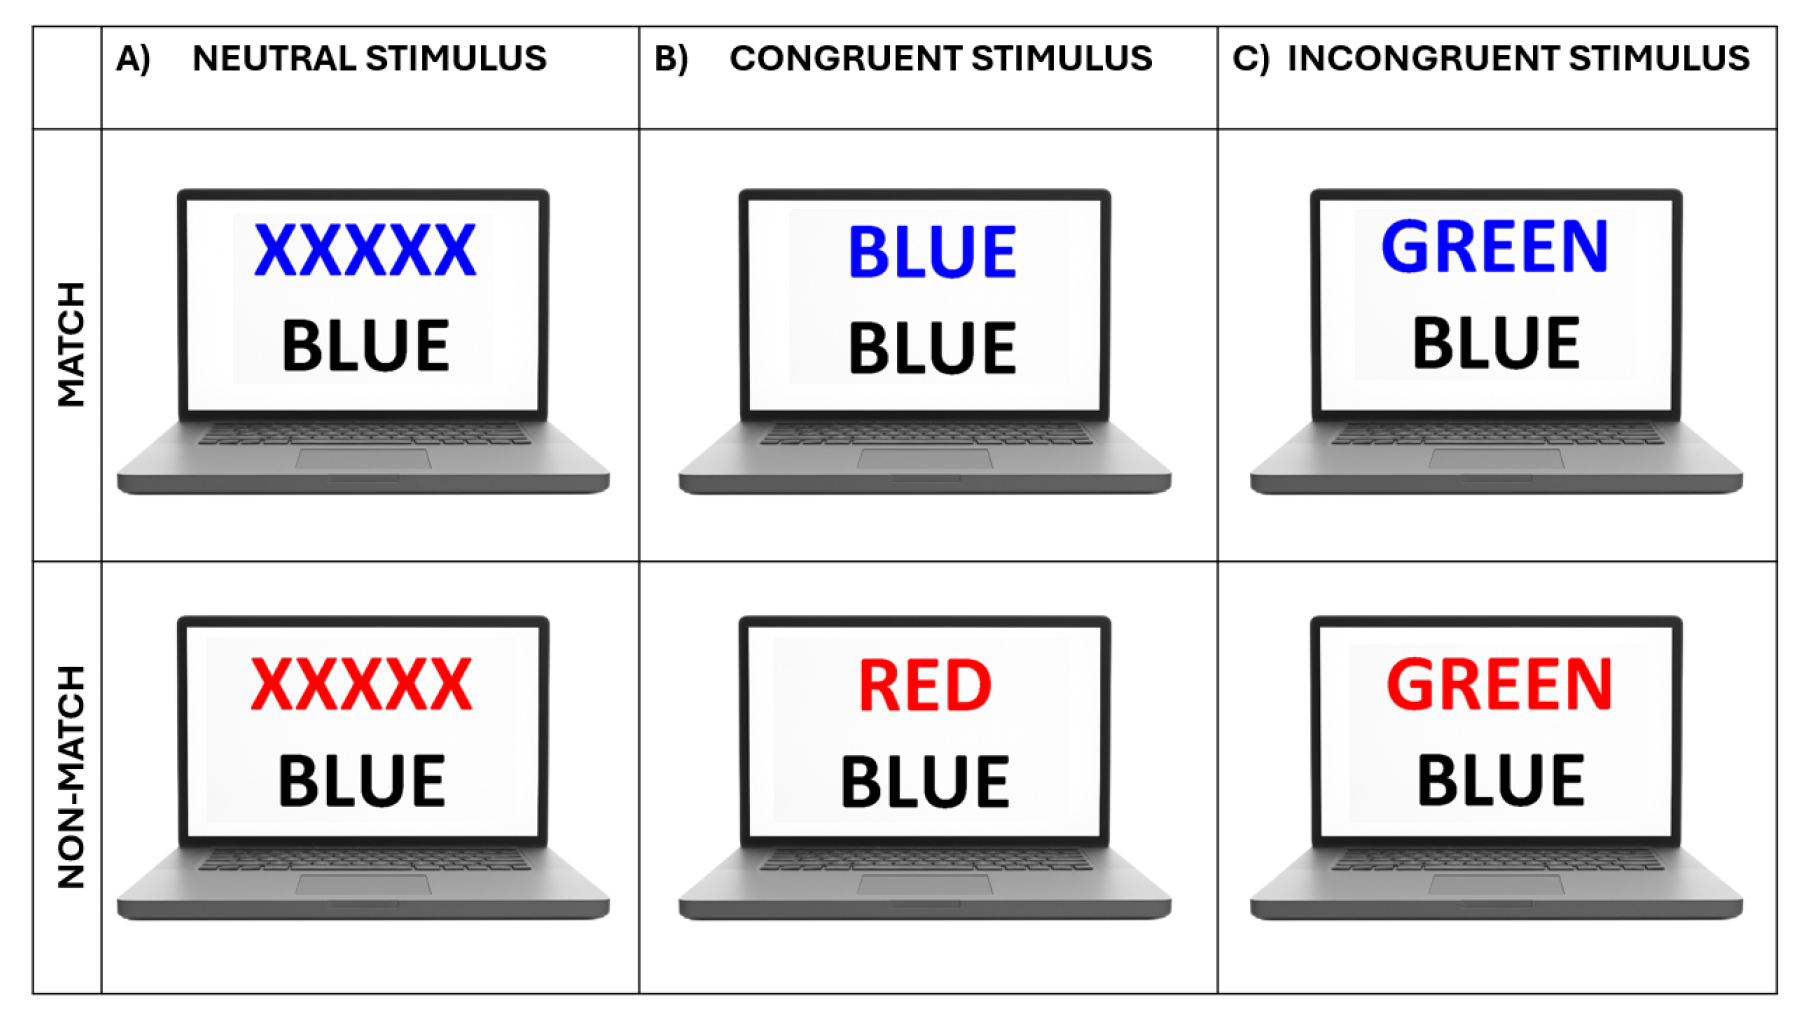
Figure 3.
Rectangular probe geometry of the fNIRS NIROXCOPE 301. are the LEDs, the detectors, and the channels [1].
Figure 3.
Rectangular probe geometry of the fNIRS NIROXCOPE 301. are the LEDs, the detectors, and the channels [1].
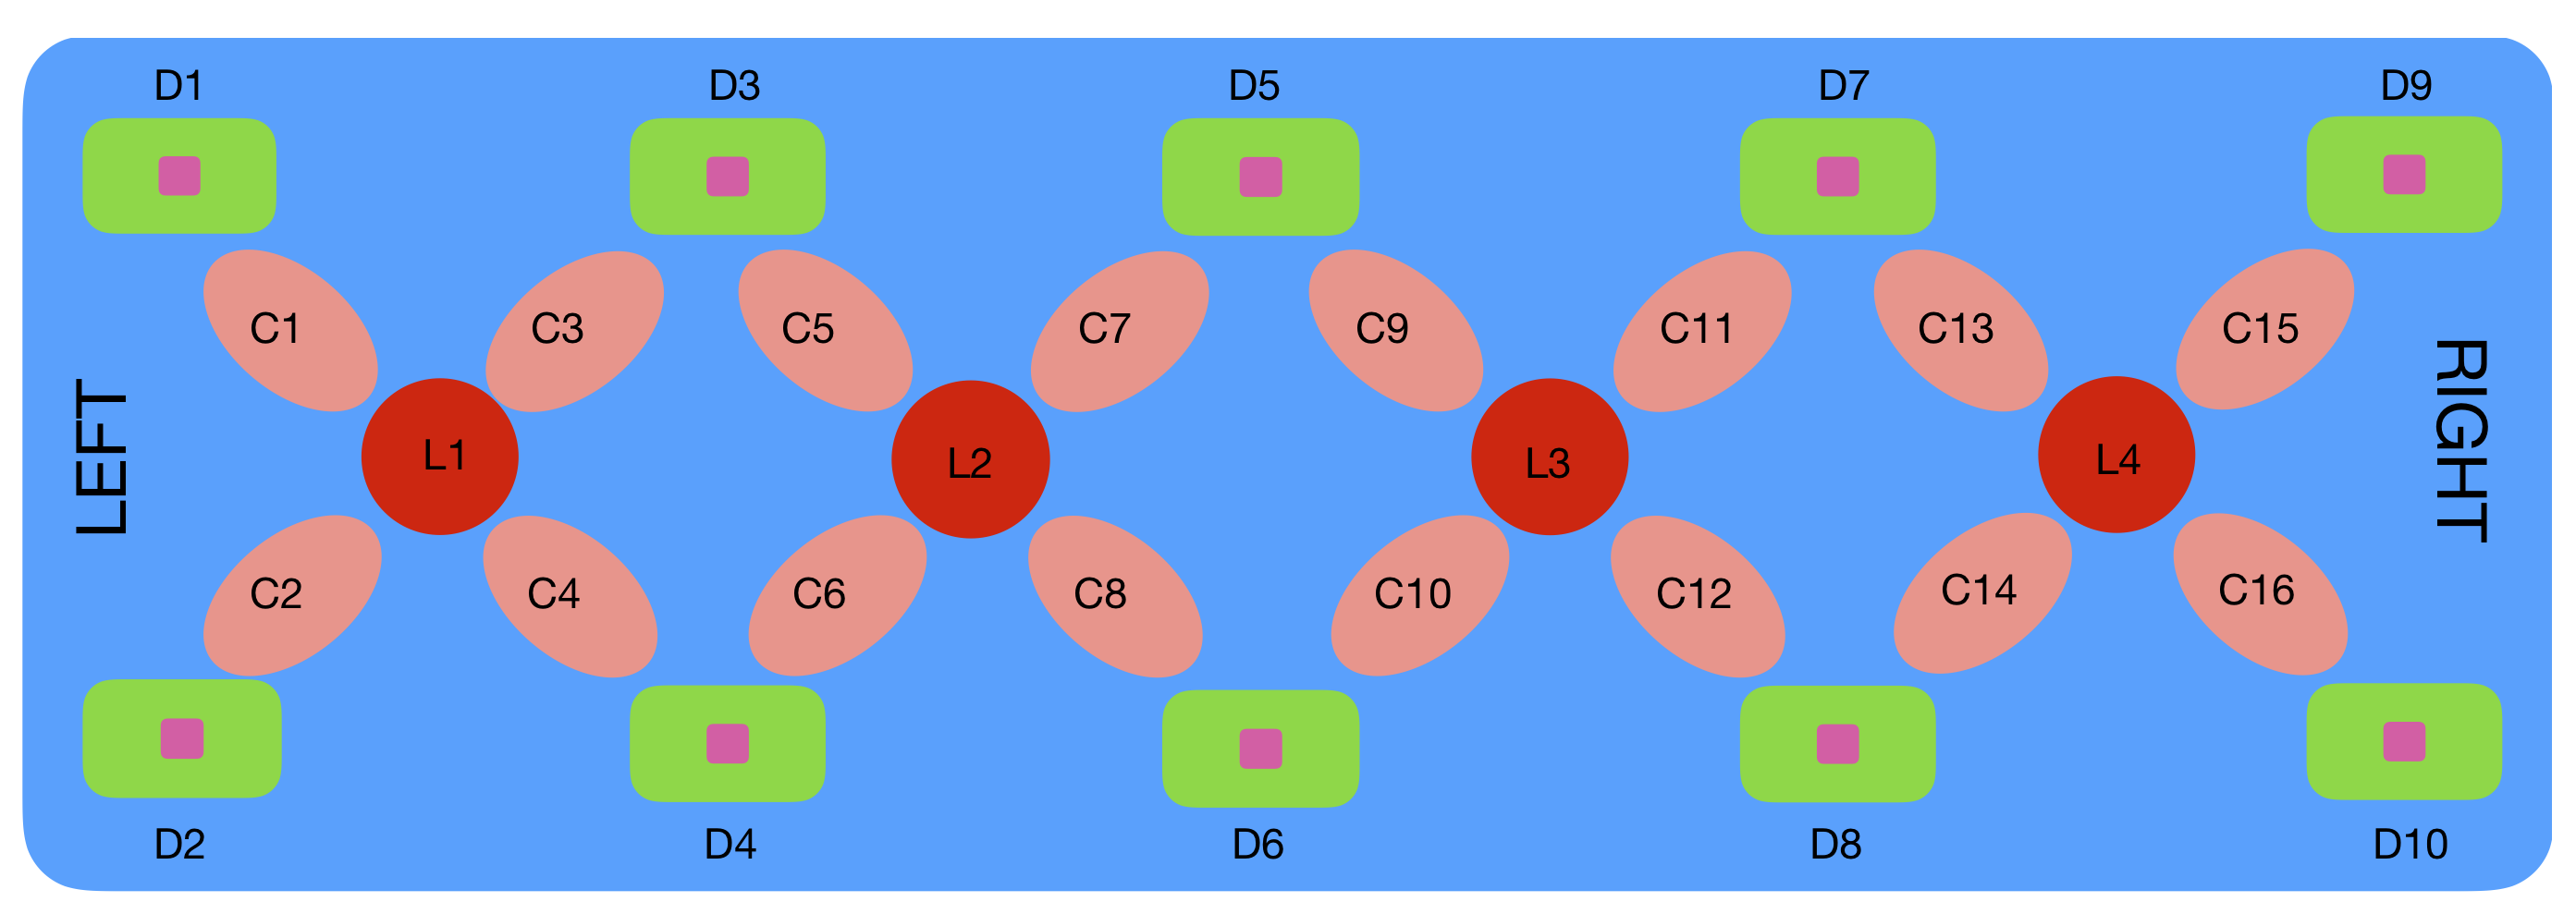
Figure 4.
Preparation steps illustrated on a sample [HbO] signal. (a) Raw, unprocessed [HbO] data from subject 1 (Control), channel 12, with shaded regions marking stimulus blocks. (b) Concatenated [HbO] time series for the Neutral (N) stimulus type, generated by sequentially joining five segments (, ) from the raw data. (c) Concatenated [HbO] time series for the Congruent (C) stimulus type. (d) Concatenated [HbO] time series for the Incongruent (IC) stimulus type. (e) Global regressor signal computed as described in Section 2.4 [1].
Figure 4.
Preparation steps illustrated on a sample [HbO] signal. (a) Raw, unprocessed [HbO] data from subject 1 (Control), channel 12, with shaded regions marking stimulus blocks. (b) Concatenated [HbO] time series for the Neutral (N) stimulus type, generated by sequentially joining five segments (, ) from the raw data. (c) Concatenated [HbO] time series for the Congruent (C) stimulus type. (d) Concatenated [HbO] time series for the Incongruent (IC) stimulus type. (e) Global regressor signal computed as described in Section 2.4 [1].
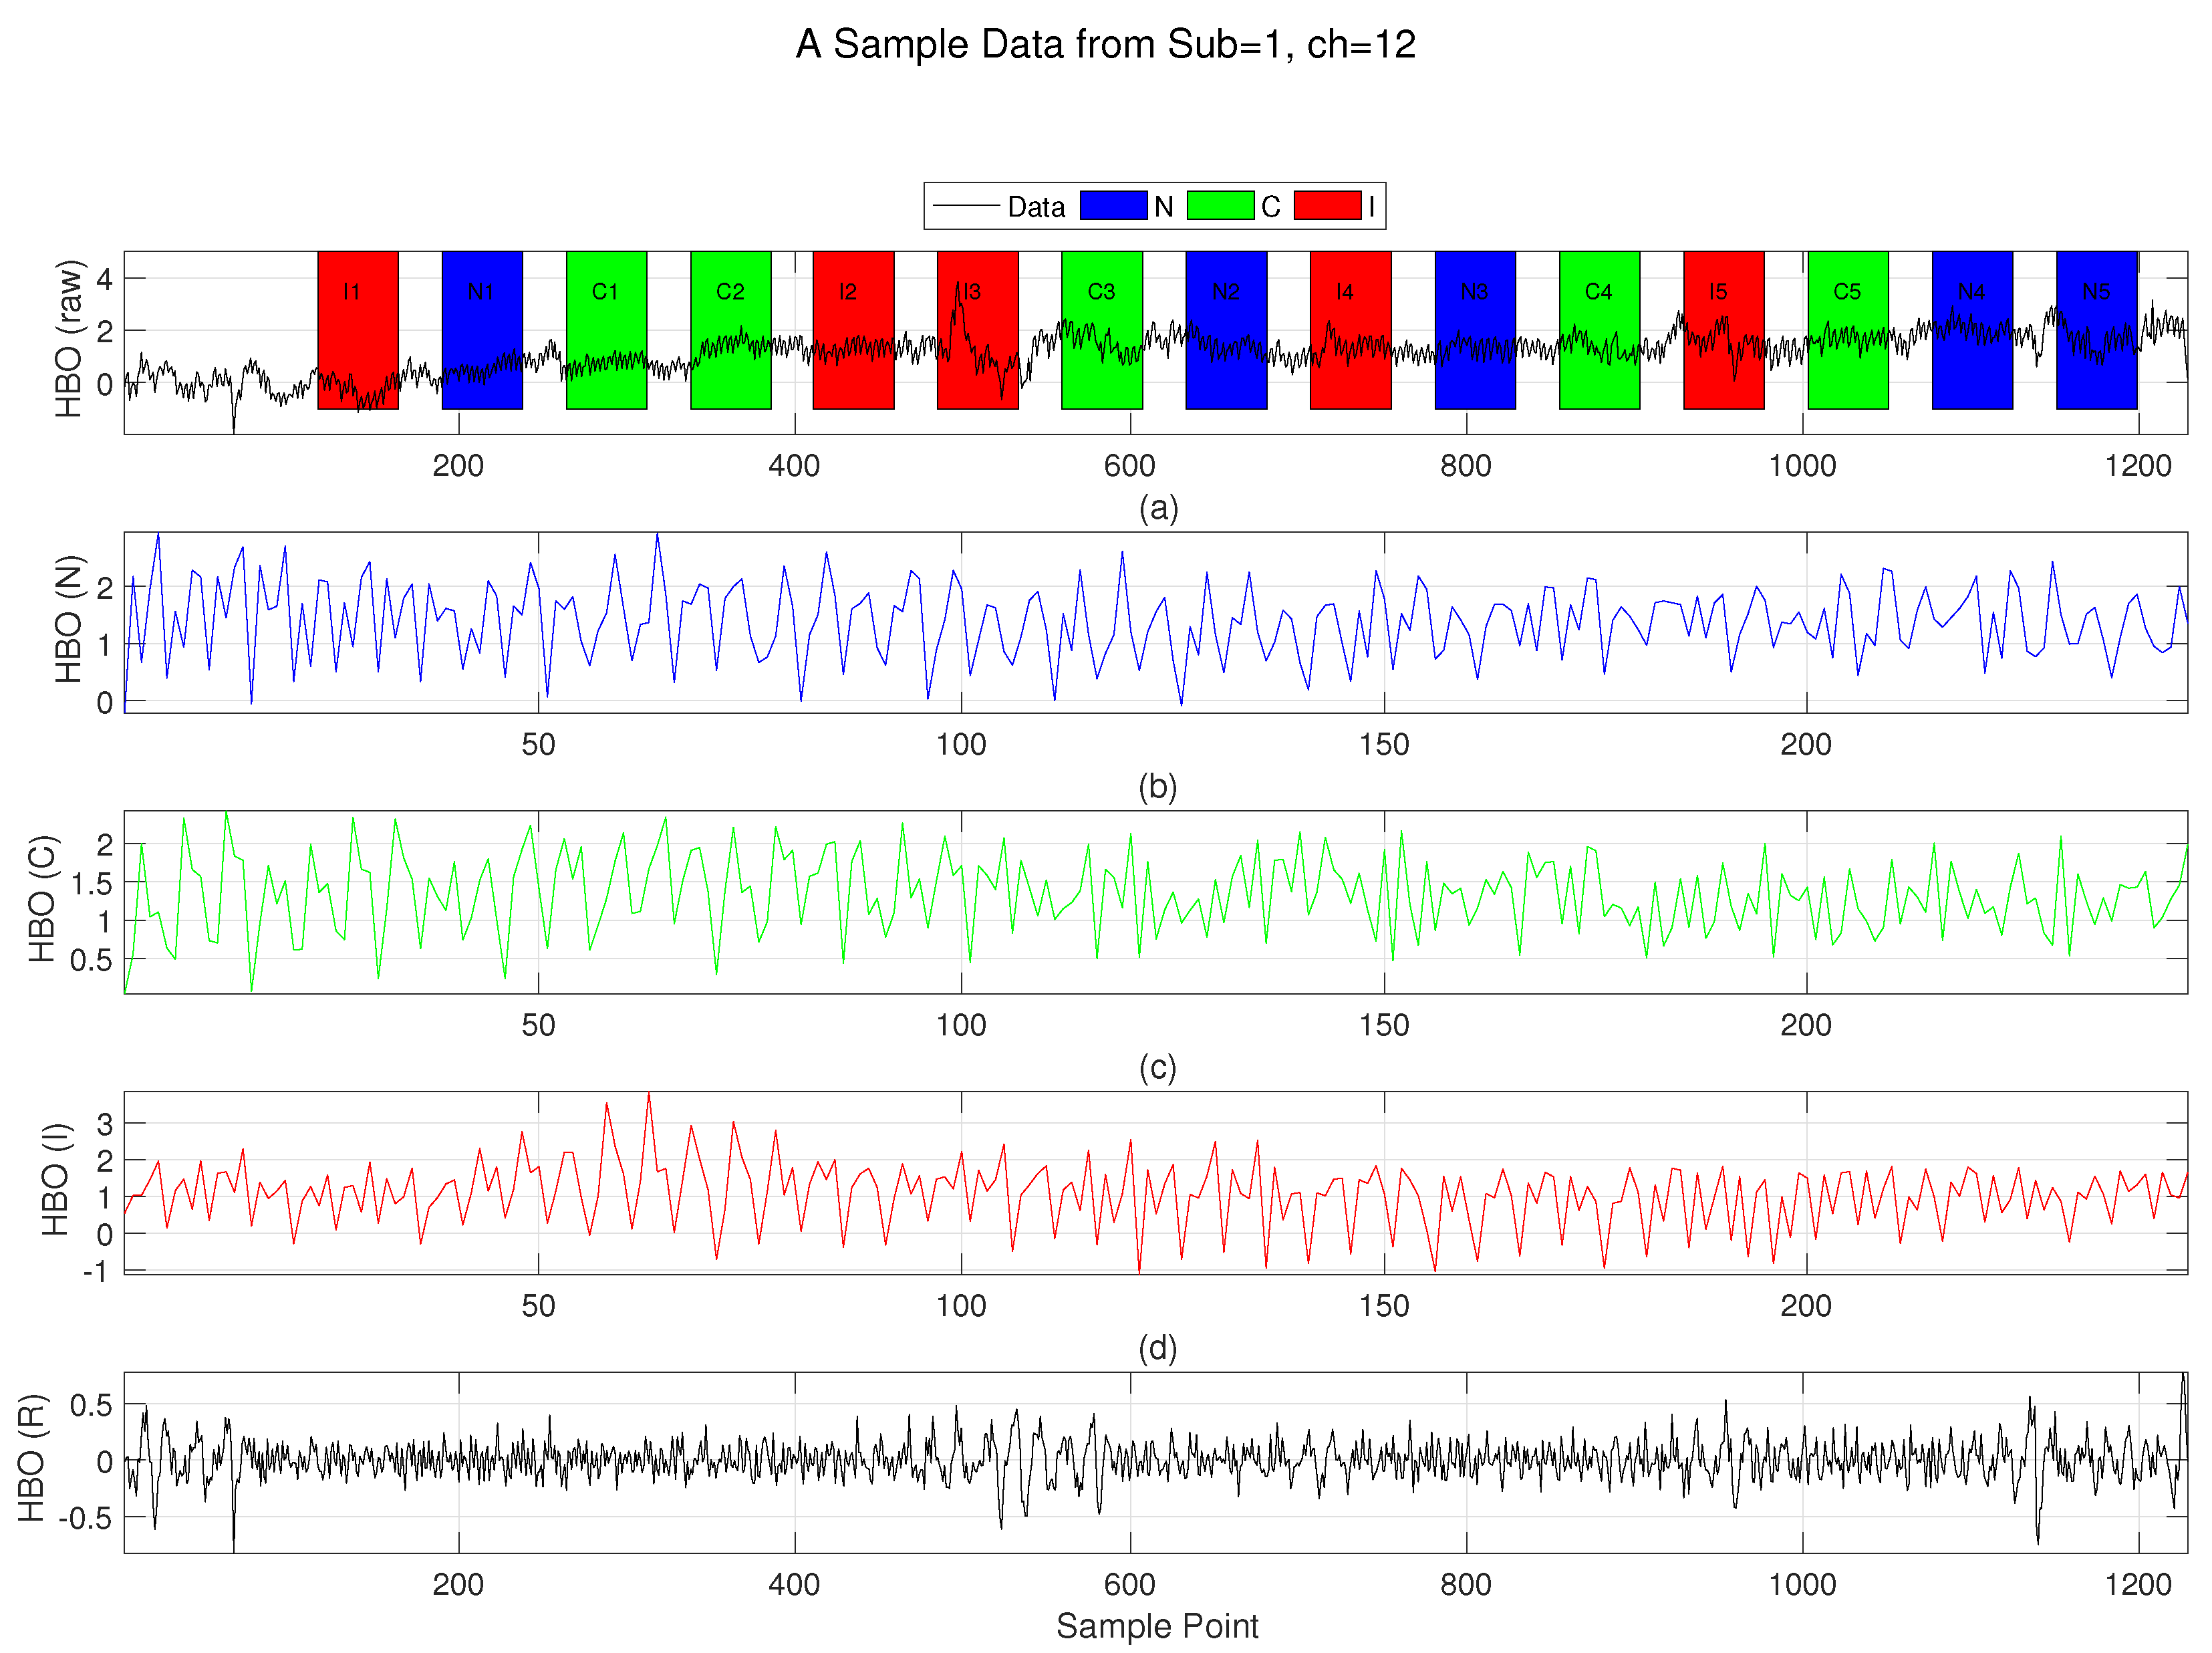
Figure 5.
Bar plots of group-wise (Controls, Migraine, OCD, SCHIZO) average reaction time (RT) and accuracy (ACC) across stimulus types (neutral, congruent, incongruent), as well as their overall means. A mixed-design ANOVA revealed significant main effects of stimulus type (RT: ; ACC: ) and group (RT: ; ACC: ), with no significant group × stimulus type interaction.
Figure 5.
Bar plots of group-wise (Controls, Migraine, OCD, SCHIZO) average reaction time (RT) and accuracy (ACC) across stimulus types (neutral, congruent, incongruent), as well as their overall means. A mixed-design ANOVA revealed significant main effects of stimulus type (RT: ; ACC: ) and group (RT: ; ACC: ), with no significant group × stimulus type interaction.
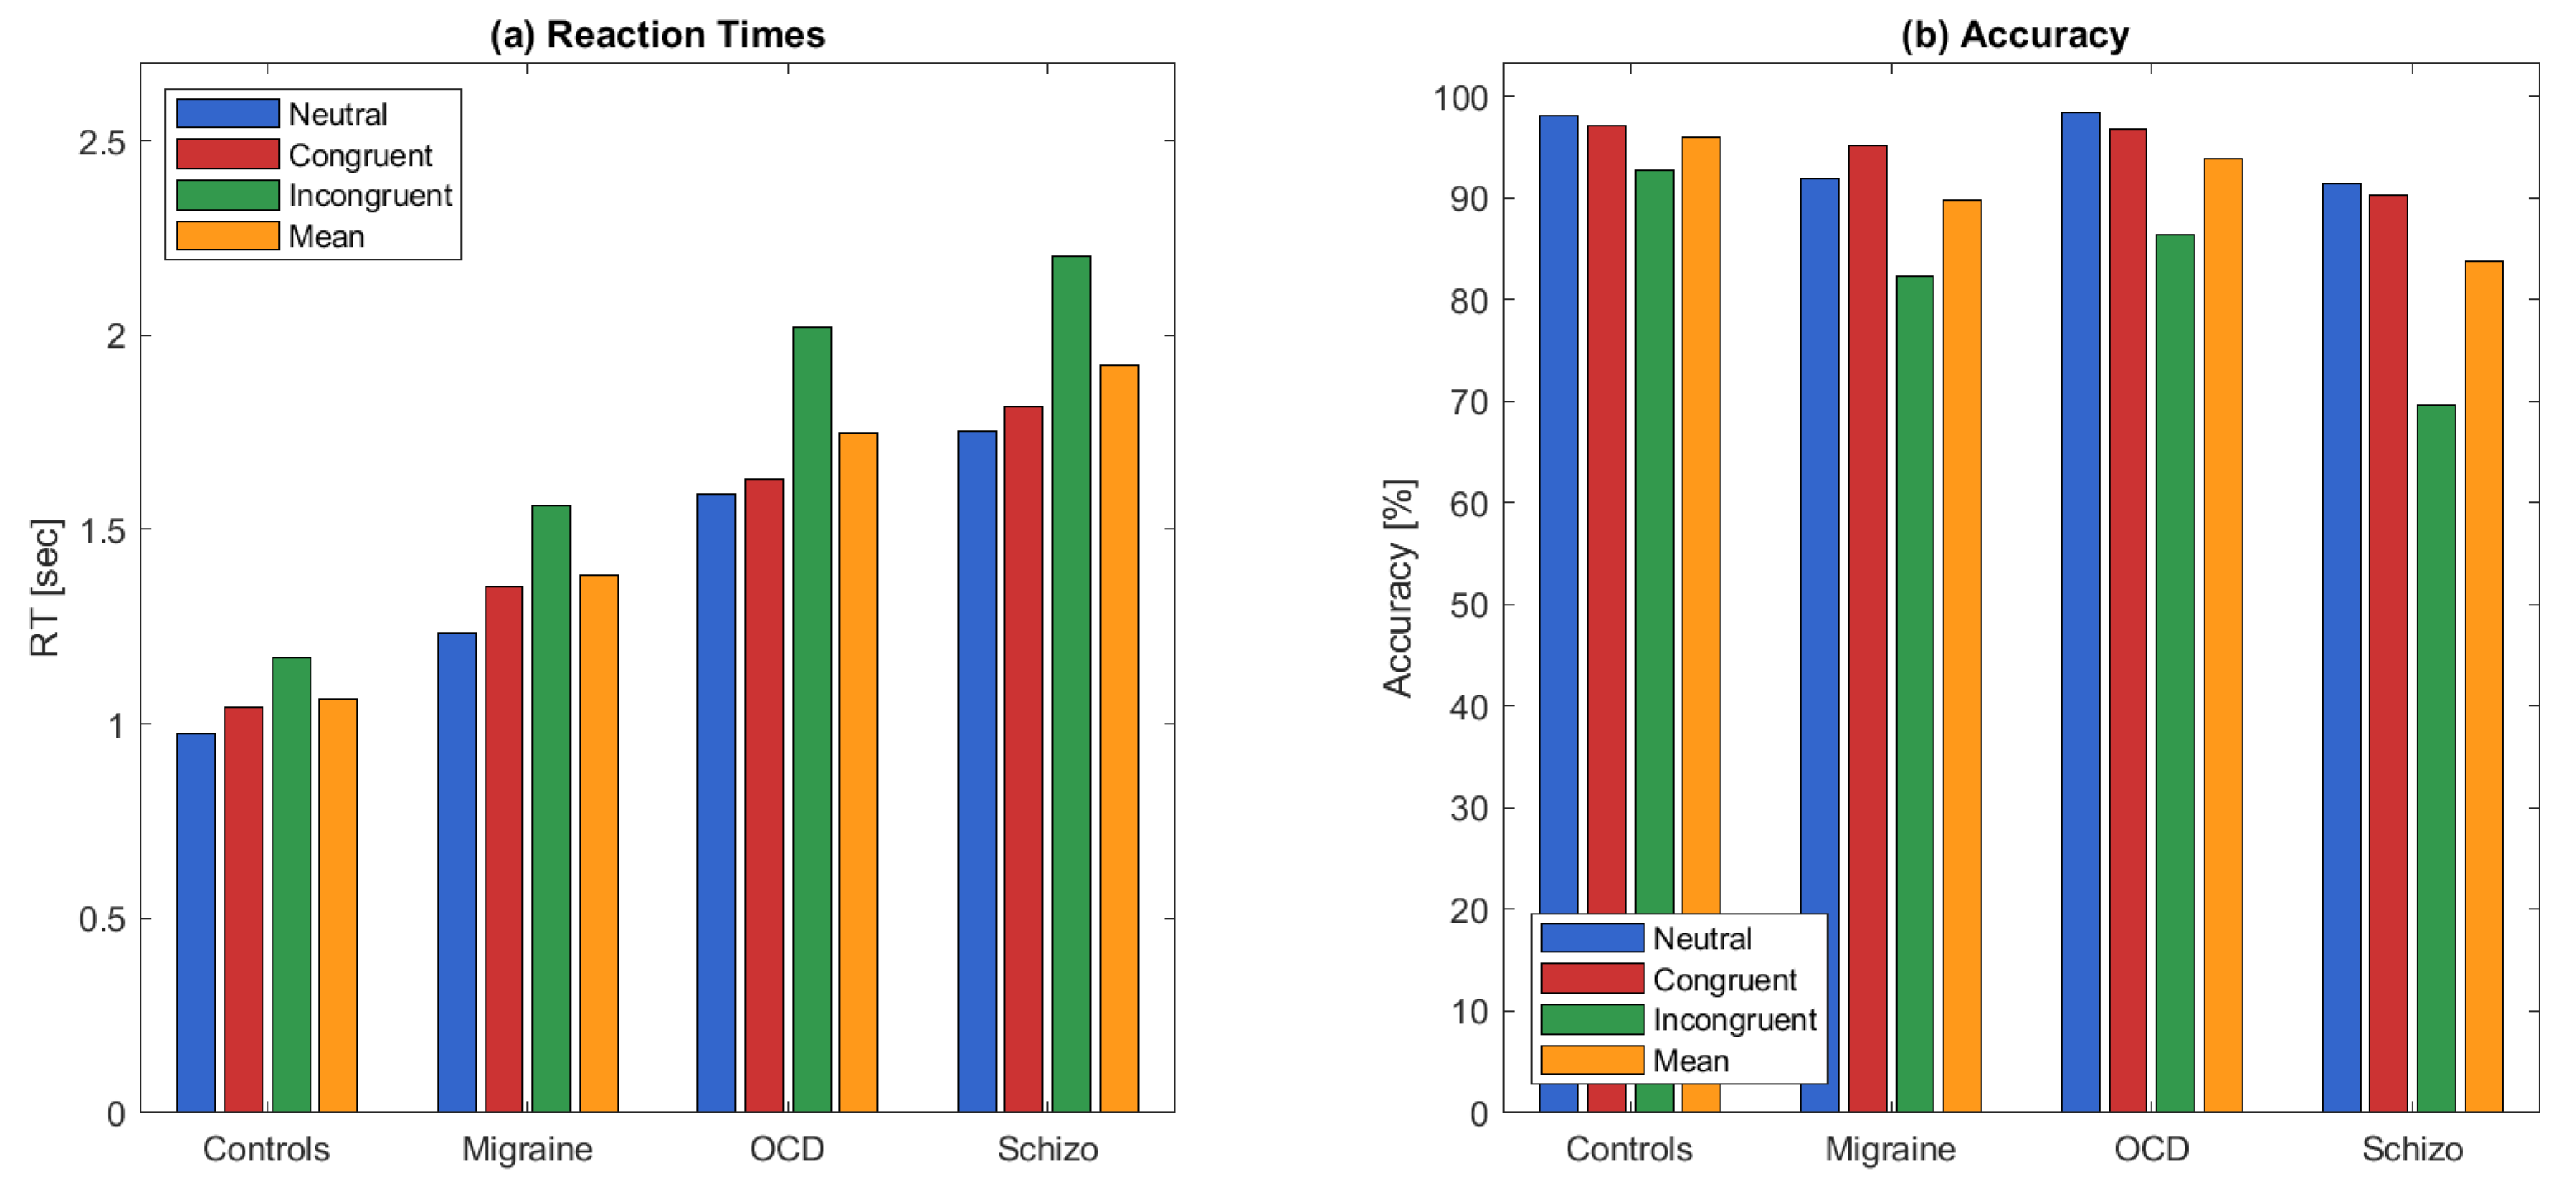
Figure 6.
Maps of average functional connectivity (FC) matrices of each group and stimulus type (Neutral, Congruent, Incongruent). Partial correlation coefficients were computed between all channel pairs from HbO signals and averaged within group and stimulus type. For each channel pair, a mixed-design ANOVA with group (between-subjects) and stimulus type (within-subjects) detected no significant main effects; edge-wise two-sample tests with BH–FDR control found no significant differences either.
Figure 6.
Maps of average functional connectivity (FC) matrices of each group and stimulus type (Neutral, Congruent, Incongruent). Partial correlation coefficients were computed between all channel pairs from HbO signals and averaged within group and stimulus type. For each channel pair, a mixed-design ANOVA with group (between-subjects) and stimulus type (within-subjects) detected no significant main effects; edge-wise two-sample tests with BH–FDR control found no significant differences either.
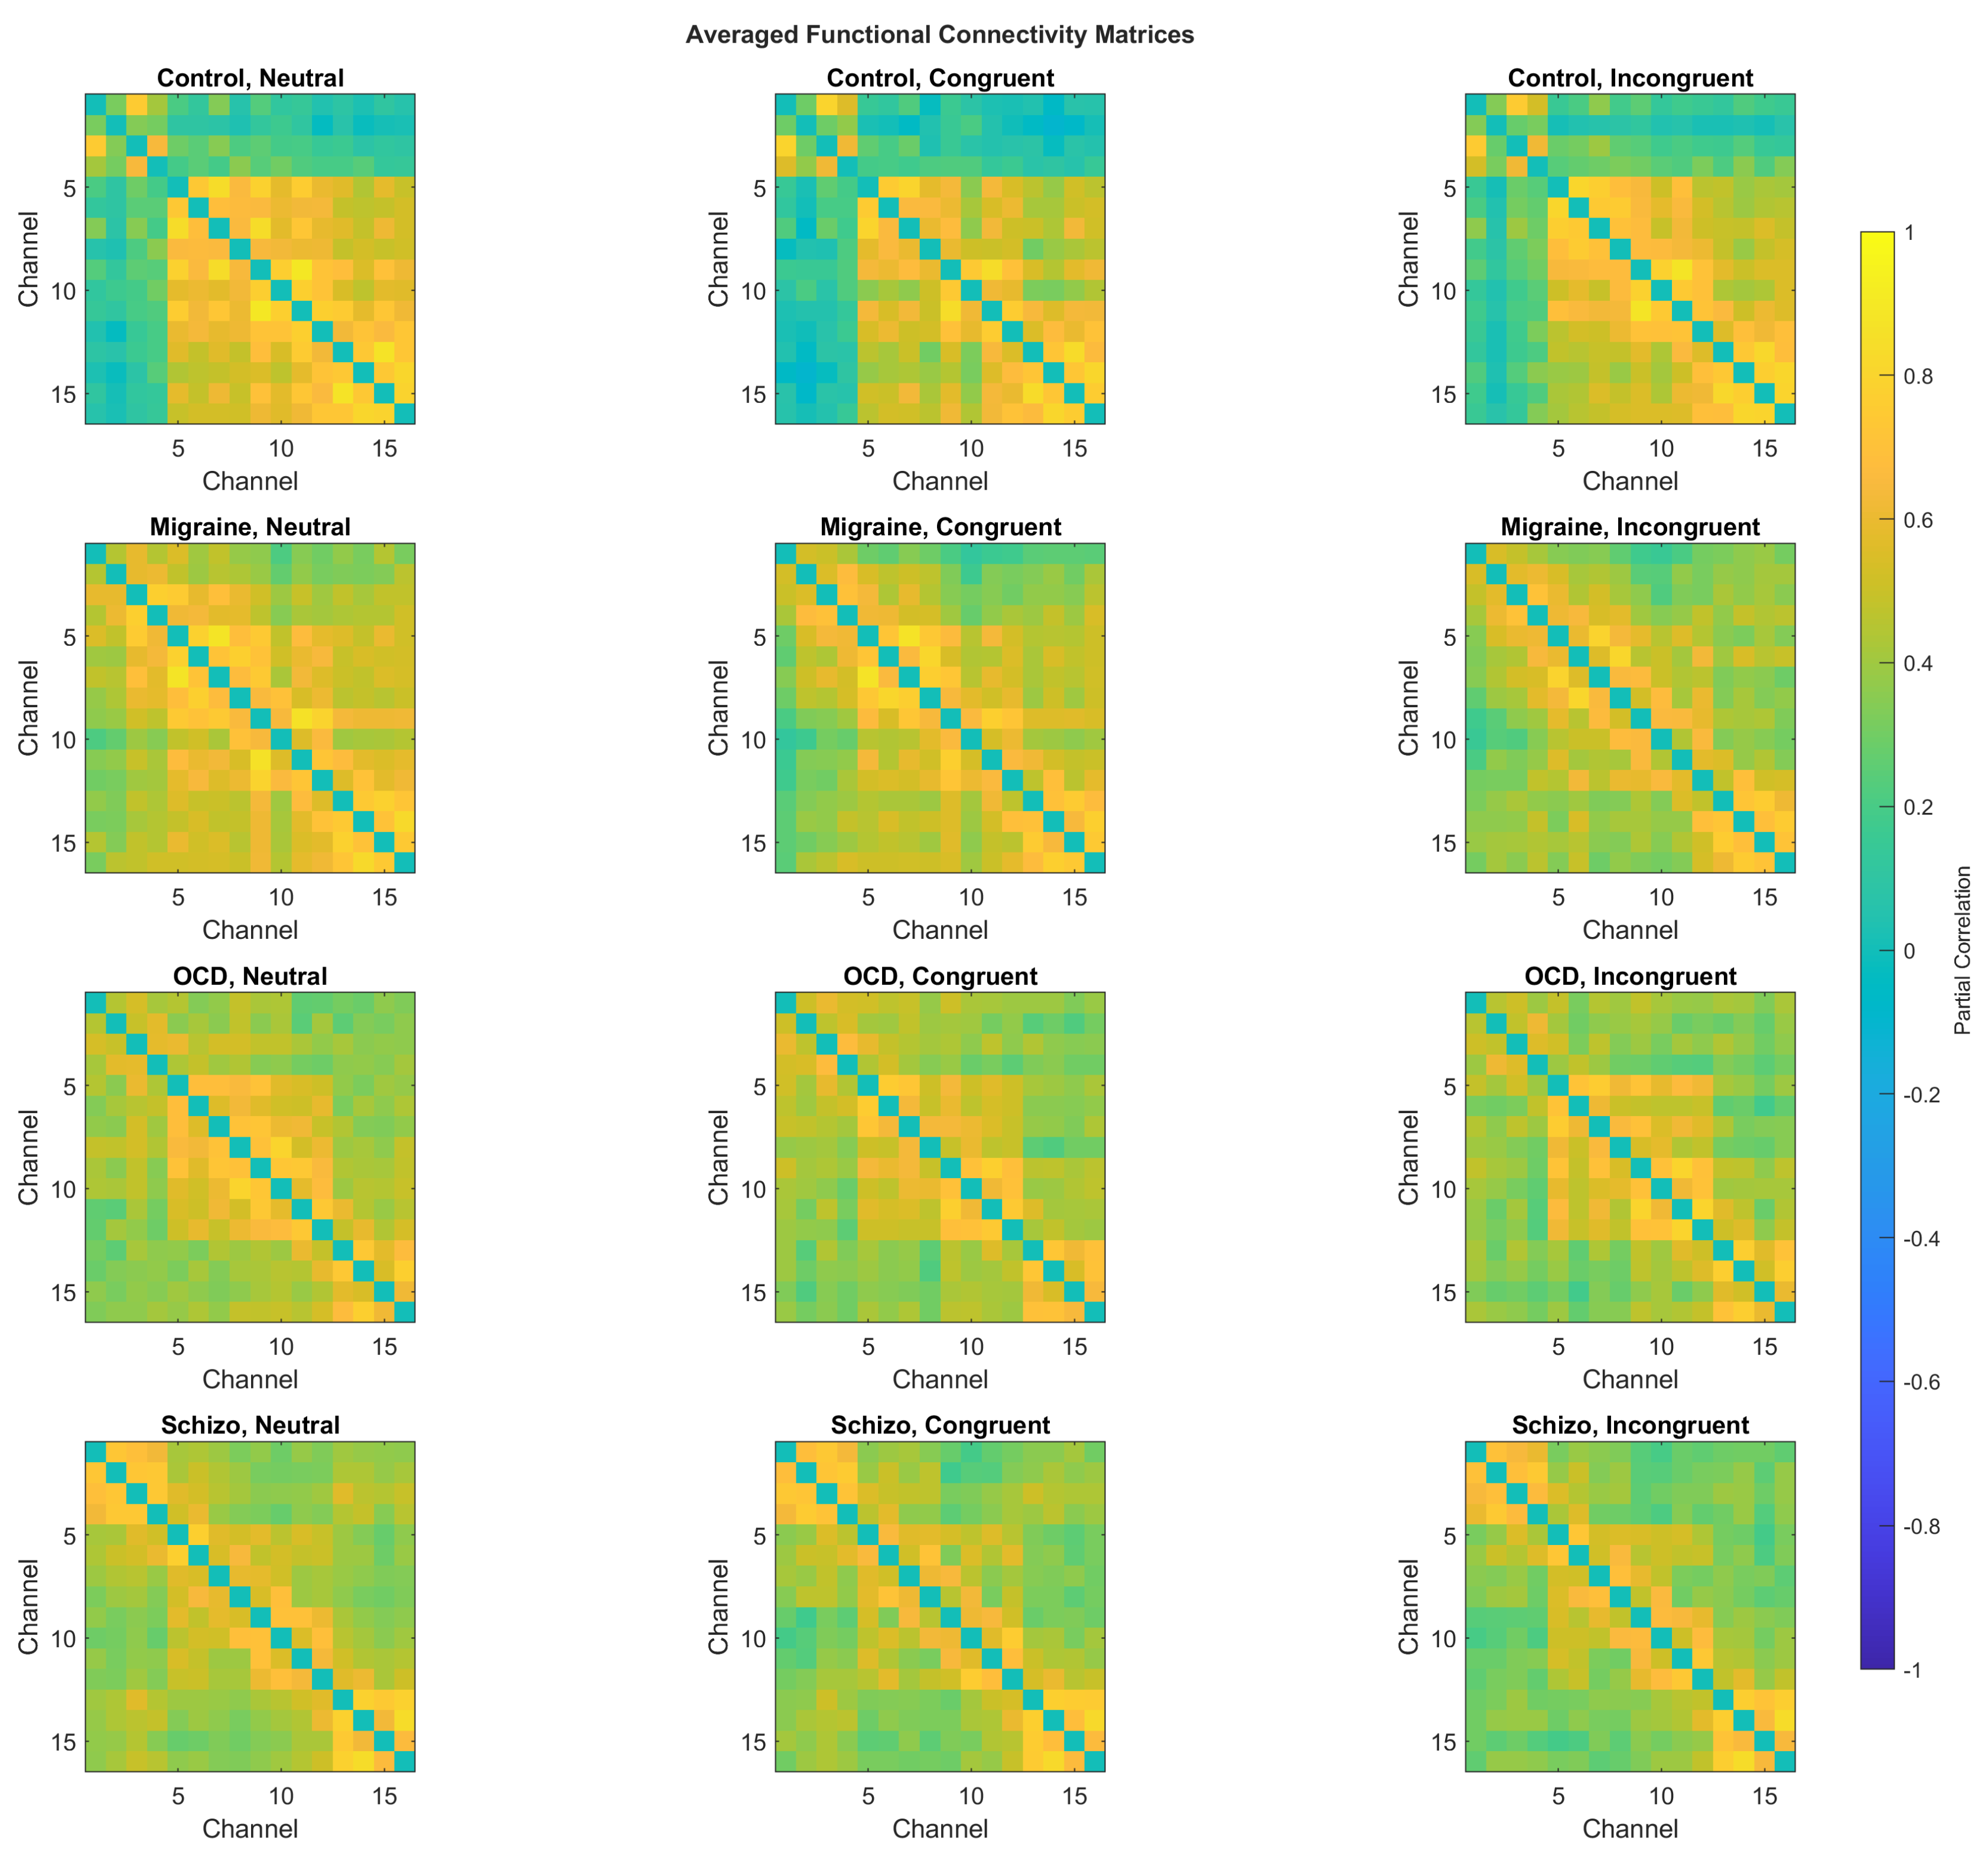
Figure 7.
Group-wise distributions of global MST metrics, averaged across stimulus types. Asterisks in titles mark significant overall group effects (ANOVA/Kruskal–Wallis). Horizontal bars denote post-hoc contrasts: red = Bonferroni-corrected significant pair (), black = contrasts that did not reach the corrected threshold. White circles denote means; horizontal ticks denote medians. Panels (left-to-right, top-to-bottom): (a) Tree Diameter, (b) Characteristic Path Length, (c) Leaf Fraction, (d) Tree Hierarchy, (e) Maximum Degree, (f) Assortativity, (g) Degree Divergence.
Figure 7.
Group-wise distributions of global MST metrics, averaged across stimulus types. Asterisks in titles mark significant overall group effects (ANOVA/Kruskal–Wallis). Horizontal bars denote post-hoc contrasts: red = Bonferroni-corrected significant pair (), black = contrasts that did not reach the corrected threshold. White circles denote means; horizontal ticks denote medians. Panels (left-to-right, top-to-bottom): (a) Tree Diameter, (b) Characteristic Path Length, (c) Leaf Fraction, (d) Tree Hierarchy, (e) Maximum Degree, (f) Assortativity, (g) Degree Divergence.
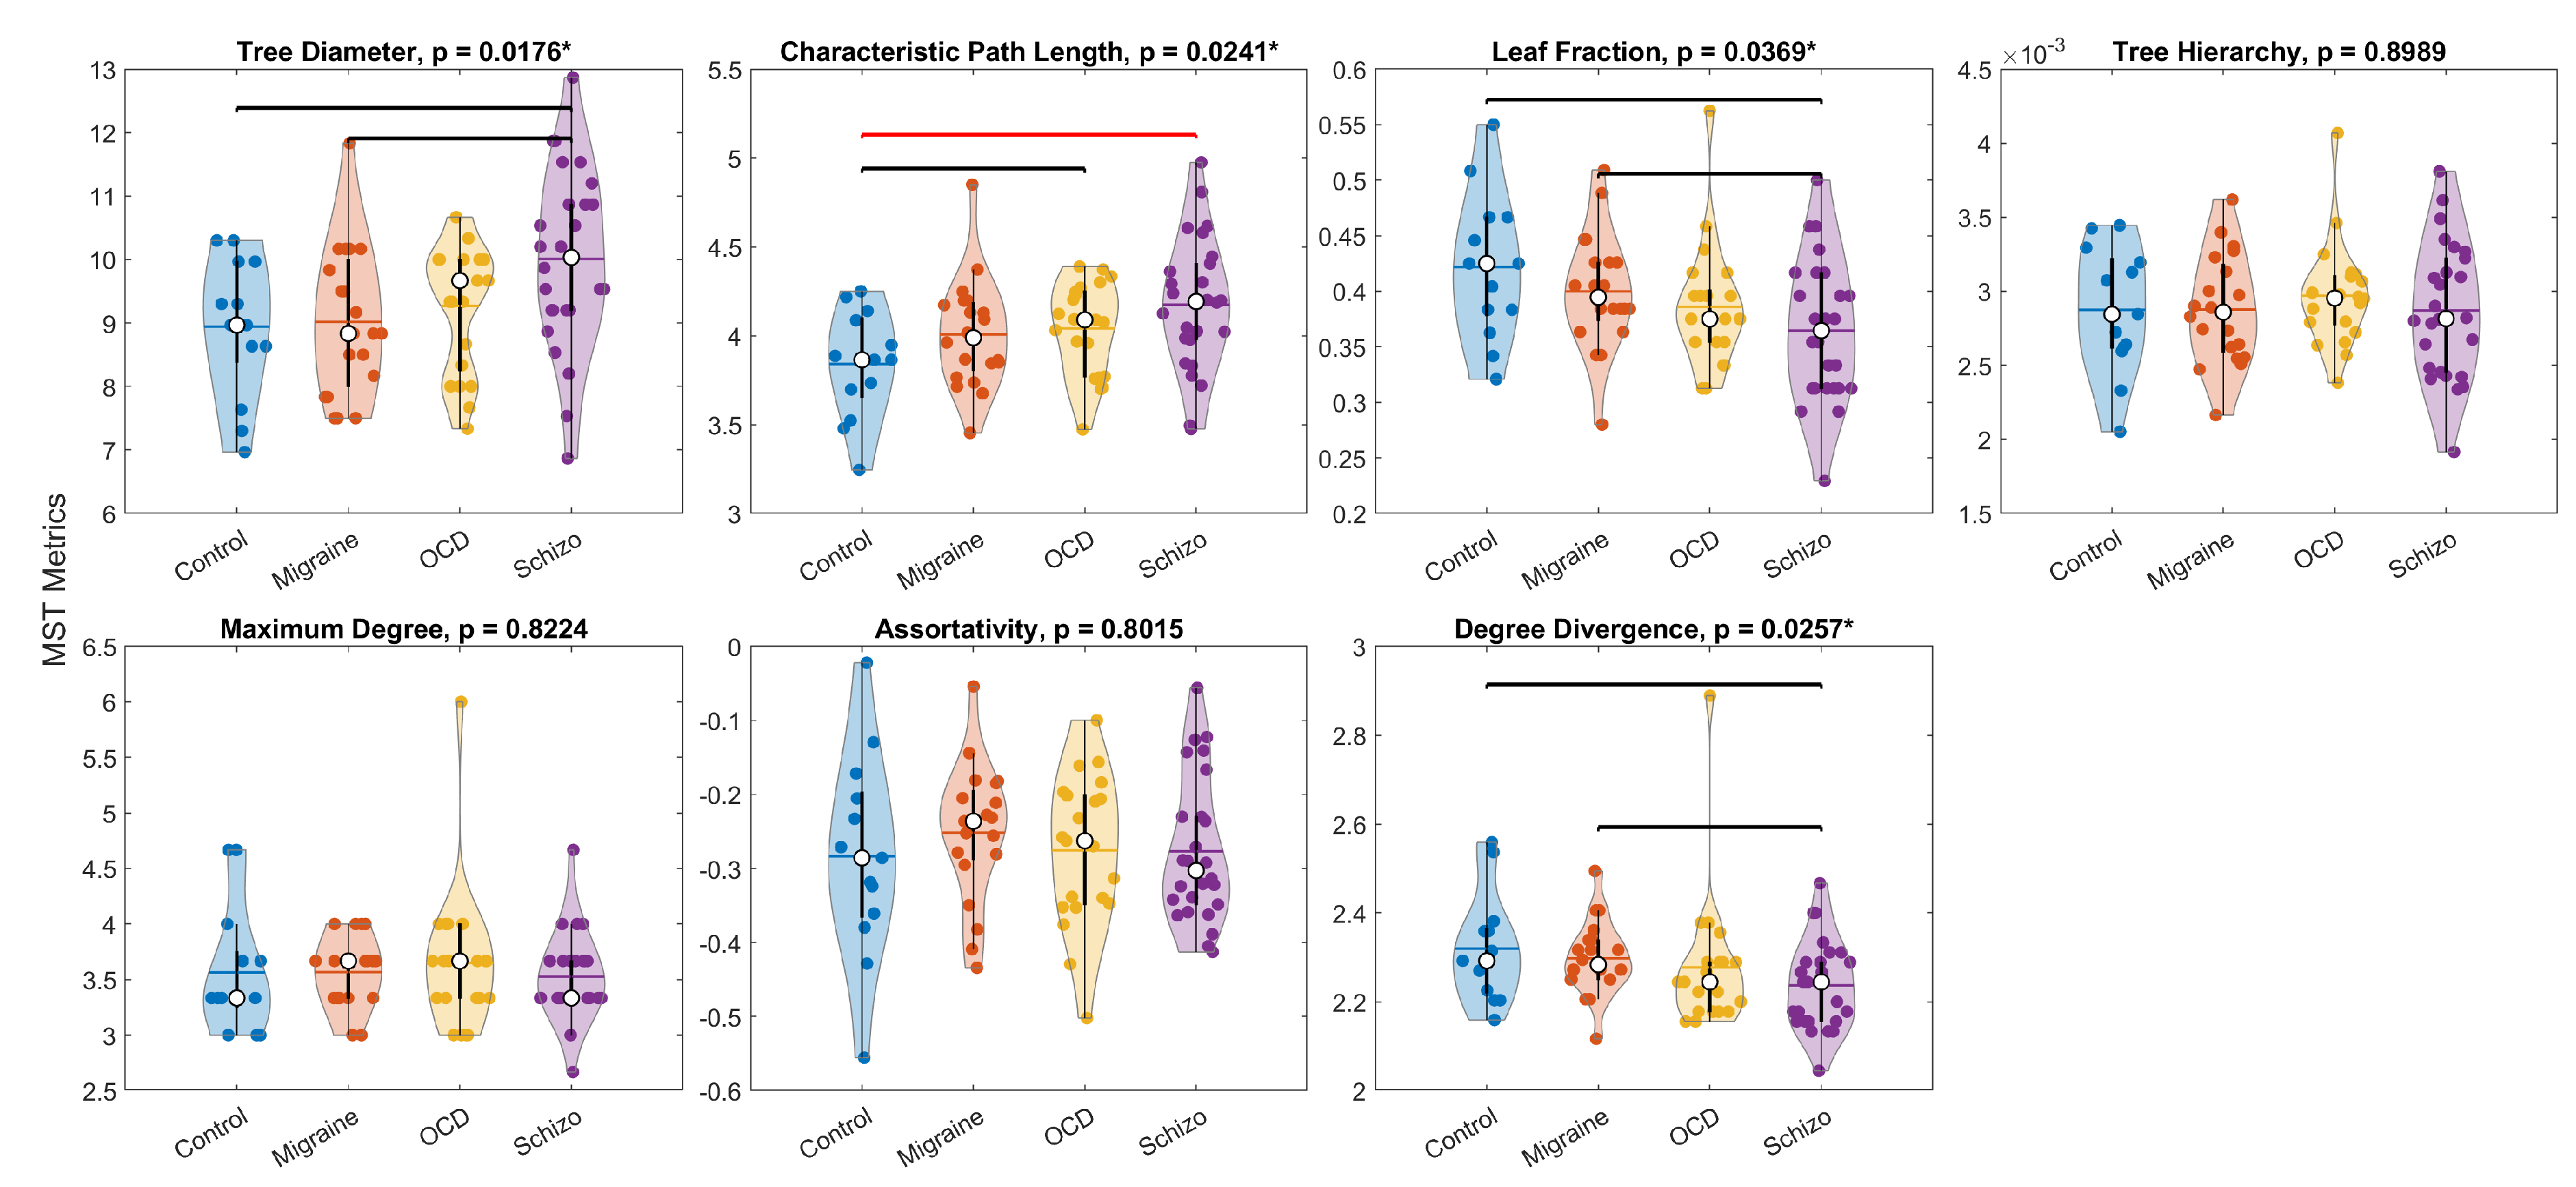
Figure 8.
Within-subject stimulus-type comparisons (paired tests) shown only for metric–pair combinations with significant tests. Asterisks mark contrasts meeting the Bonferroni-corrected threshold (). Panels: (a) Tree Diameter, (b) Characteristic Path Length, (c) Leaf Fraction, (d) Degree Divergence.
Figure 8.
Within-subject stimulus-type comparisons (paired tests) shown only for metric–pair combinations with significant tests. Asterisks mark contrasts meeting the Bonferroni-corrected threshold (). Panels: (a) Tree Diameter, (b) Characteristic Path Length, (c) Leaf Fraction, (d) Degree Divergence.
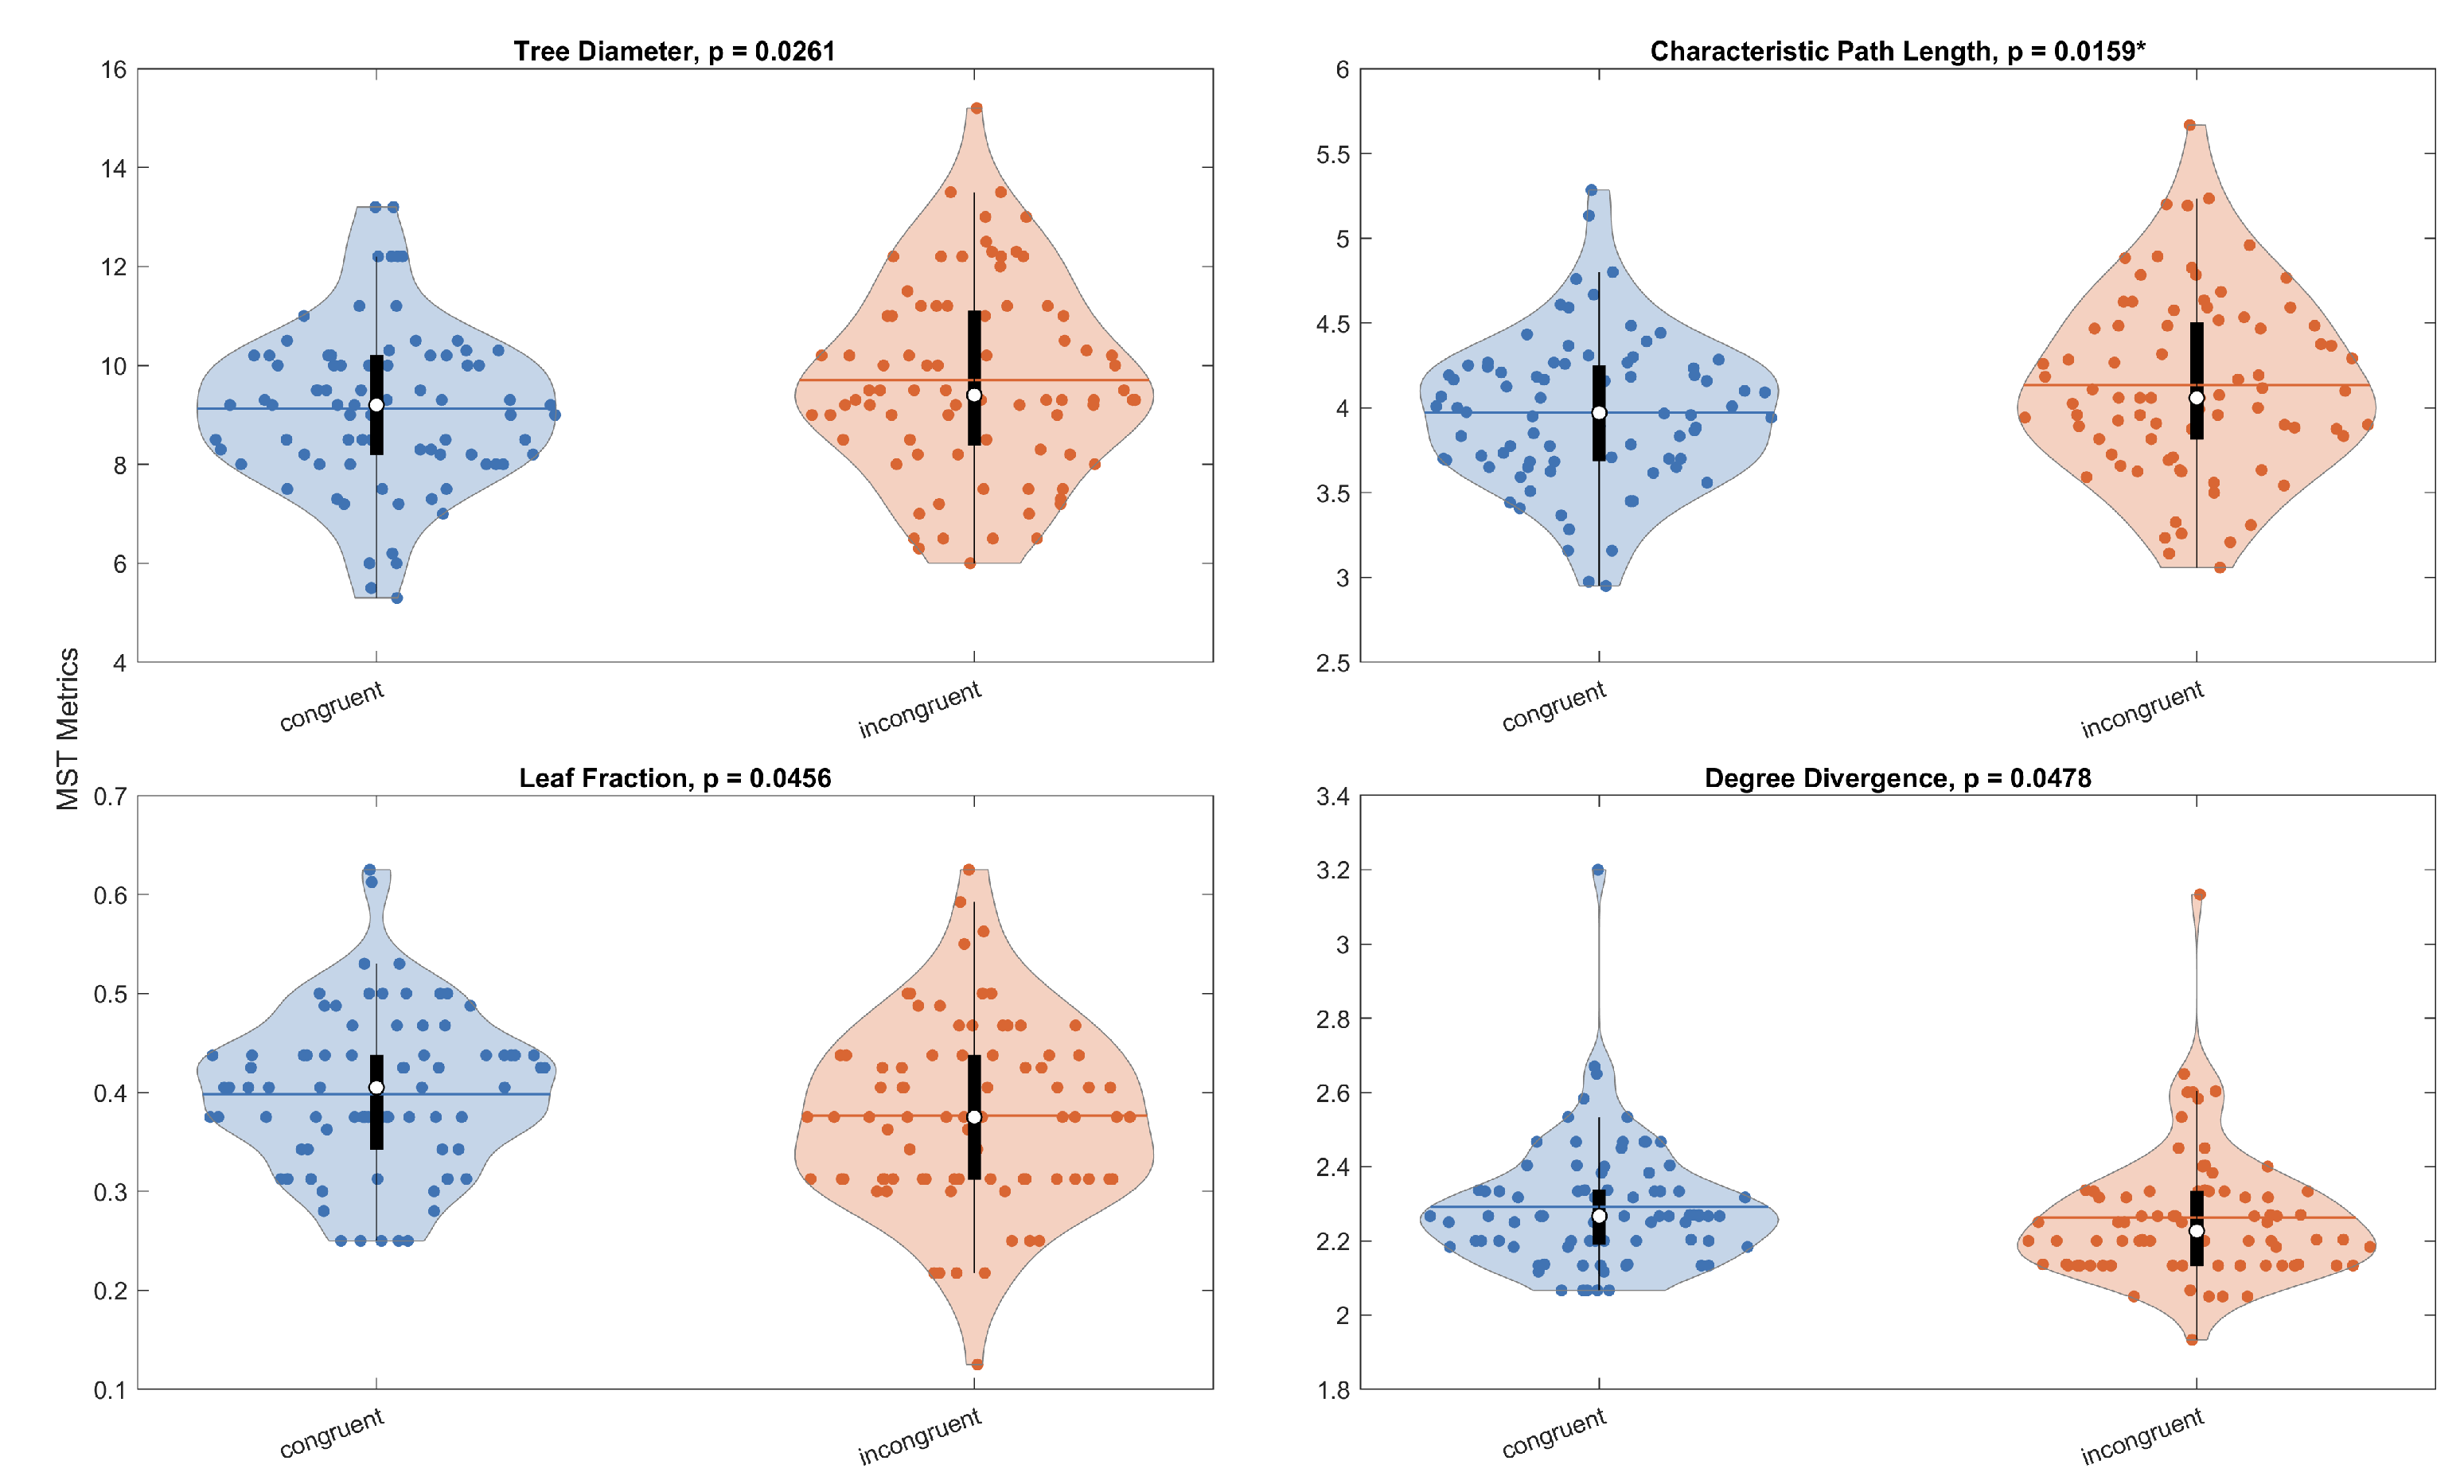
Figure 9.
Within-group MST similarity measured by the survival ratio (SR). Warmer colors indicate higher SR (greater overlap of MST edges). Permutation tests (5,000 iterations) showed between-group effects for Neutral () and Congruent () but not for Incongruent (). Pairwise contrasts highlighted higher similarity for Controls vs. OCD in Neutral () and for Controls vs. SCHIZO in Congruent (); no pairwise differences were found for Incongruent. A within-group stimulus-type effect was present only in Controls (; Congruent > Incongruent, ). Panels: (a–c) Control [Neutral, Congruent, Incongruent]; (d–f) Migraine [Neutral, Congruent, Incongruent]; (g–i) OCD [Neutral, Congruent, Incongruent]; (j–l) SCHIZO [Neutral, Congruent, Incongruent].
Figure 9.
Within-group MST similarity measured by the survival ratio (SR). Warmer colors indicate higher SR (greater overlap of MST edges). Permutation tests (5,000 iterations) showed between-group effects for Neutral () and Congruent () but not for Incongruent (). Pairwise contrasts highlighted higher similarity for Controls vs. OCD in Neutral () and for Controls vs. SCHIZO in Congruent (); no pairwise differences were found for Incongruent. A within-group stimulus-type effect was present only in Controls (; Congruent > Incongruent, ). Panels: (a–c) Control [Neutral, Congruent, Incongruent]; (d–f) Migraine [Neutral, Congruent, Incongruent]; (g–i) OCD [Neutral, Congruent, Incongruent]; (j–l) SCHIZO [Neutral, Congruent, Incongruent].
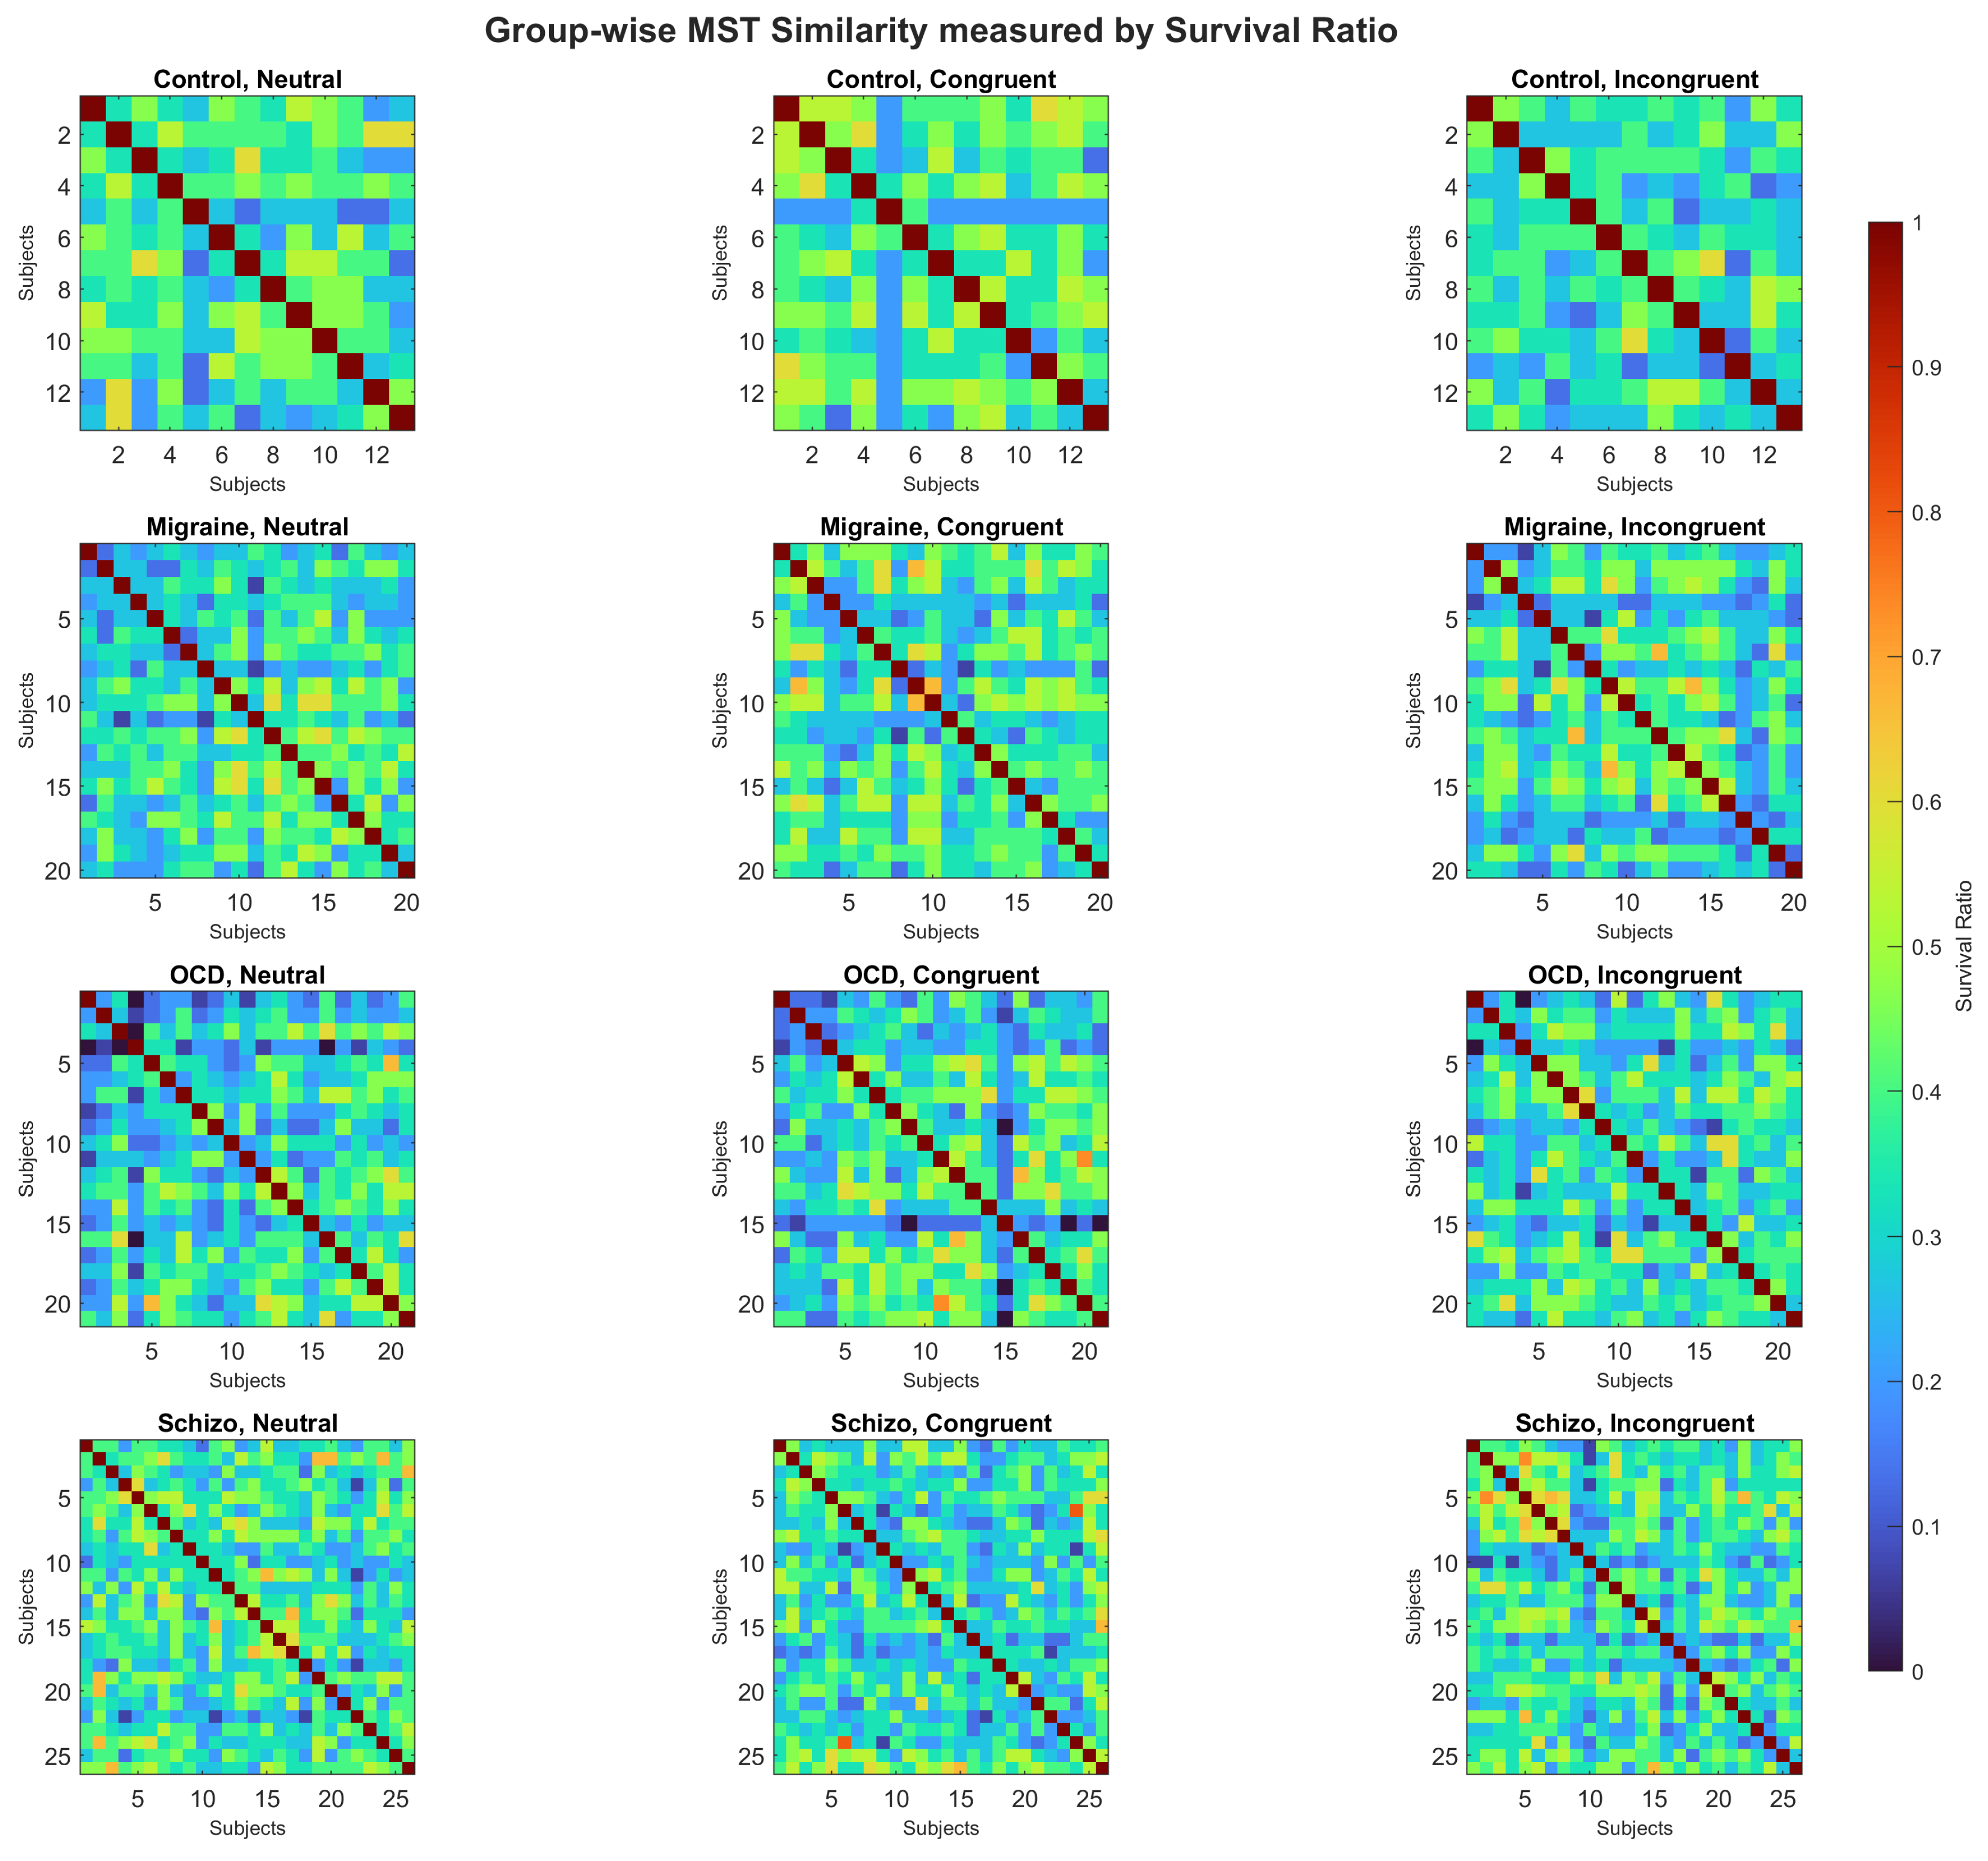
Figure 10.
Hemispheric MST connectivity. Boxplots show the distribution of MST edge counts within the left and right hemispheres and between hemispheres, across stimulus types, for each group. Intra-hemispheric counts were consistently higher than inter-hemispheric counts, whereas left–right counts were broadly comparable (mean ± SE: Left , Right , Inter ; ).
Figure 10.
Hemispheric MST connectivity. Boxplots show the distribution of MST edge counts within the left and right hemispheres and between hemispheres, across stimulus types, for each group. Intra-hemispheric counts were consistently higher than inter-hemispheric counts, whereas left–right counts were broadly comparable (mean ± SE: Left , Right , Inter ; ).
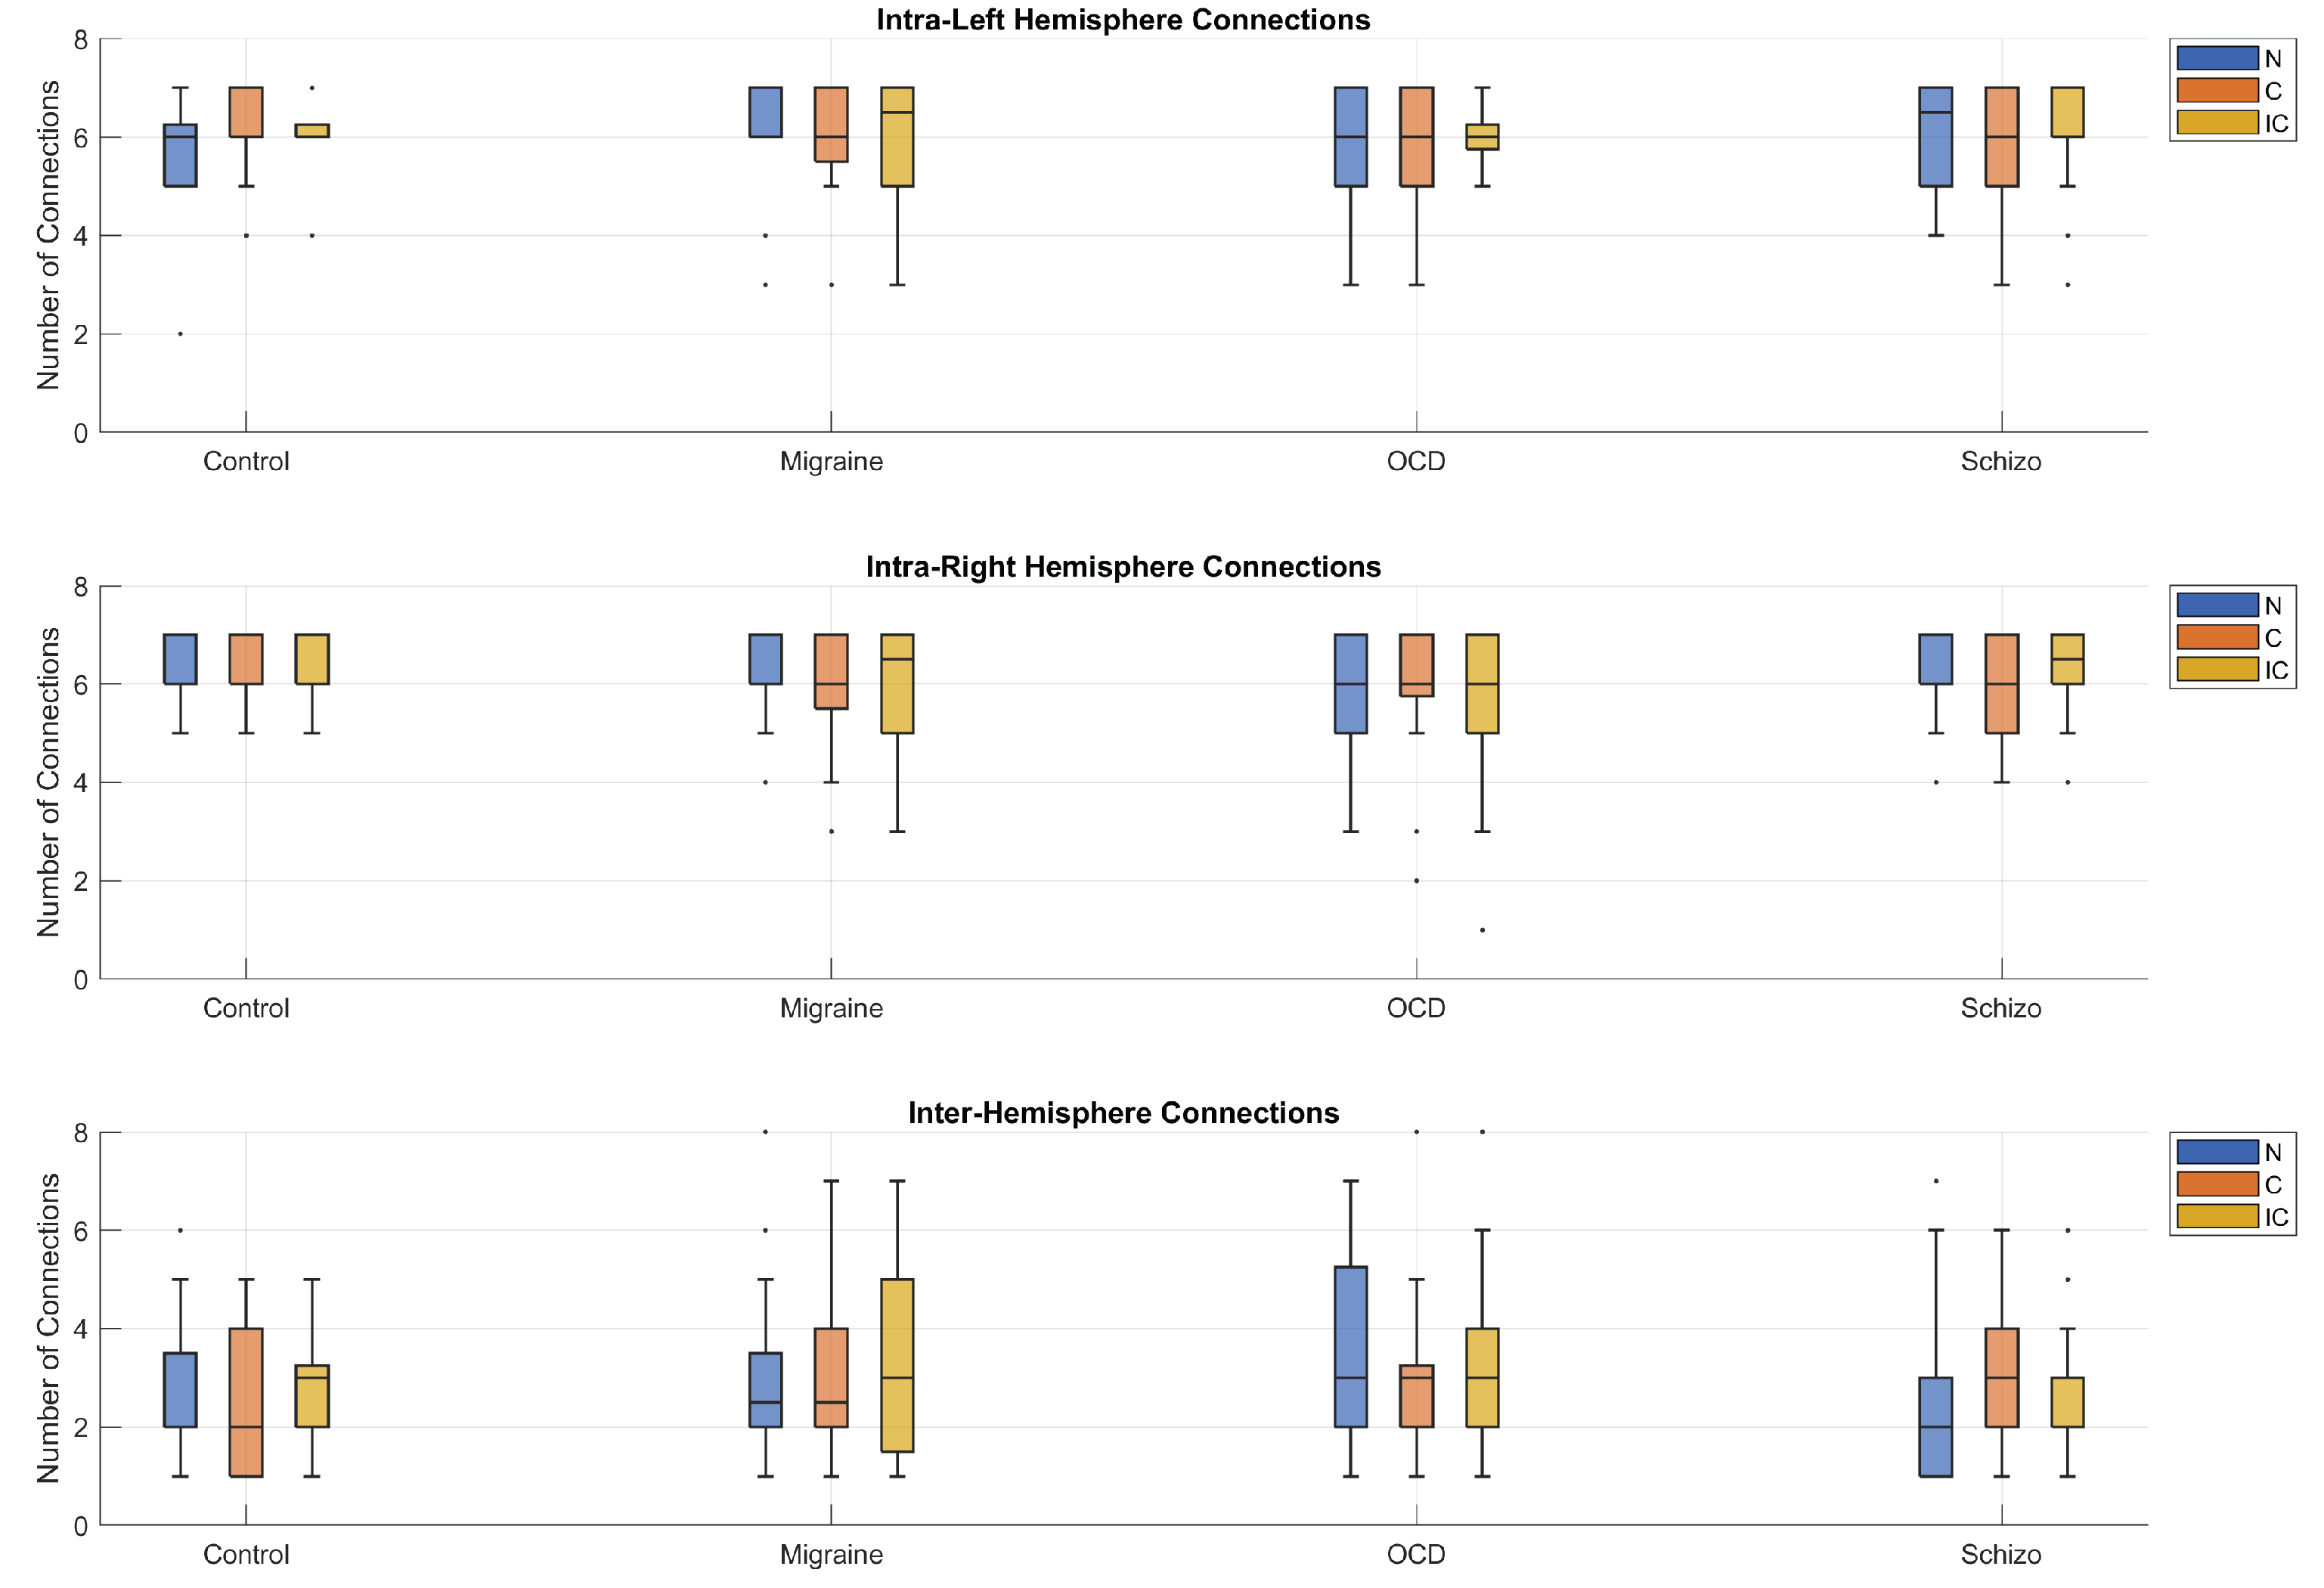

Table 1.
Summary and definitions of global metrics computed from the MST graphs.
| Abbreviation | Metric Name | Description |
|---|---|---|
| path | Characteristic Path Length | Average shortest path length between all pairs of nodes in the MST; reflects network efficiency. |
| lf | Leaf Fraction | Proportion of nodes with degree equal to 1; higher values indicate a more star-like, centralized network. |
| Th | Tree Hierarchy | Ratio between the number of leaf nodes and the maximum betweenness centrality; indicates structural hierarchy. |
| Dmax | Maximum Degree | Highest node degree in the MST; represents the most connected node or "hub". |
| r | Assortativity | Correlation between degrees of connected node pairs; reflects tendency of nodes to connect to similar-degree nodes. |
| ka | Degree Divergence | Variability in node degrees across the network; higher values imply more heterogeneity. |
Table 2.
Shapiro–Wilk normality test results across groups and stimulus types.
| Control | Migraine | OCD | SCHIZO | |||||||||
|---|---|---|---|---|---|---|---|---|---|---|---|---|
| N | C | IC | N | C | IC | N | C | IC | N | C | IC | |
| Graph Metrics | ||||||||||||
| Tree Diameter | 0.606 | 0.095 | 0.041 | 0.123 | 0.029 | 0.049 | 0.046 | 0.044 | 0.649 | 0.523 | 0.389 | 0.155 |
| Characteristic Path Length | 0.611 | 0.178 | 0.610 | 0.204 | 0.943 | 0.090 | 0.491 | 0.075 | 0.759 | 0.798 | 0.802 | 0.116 |
| Leaf Fraction | 0.226 | 0.072 | 0.131 | 0.075 | 0.147 | 0.009 | 0.073 | 0.002 | 0.016 | 0.151 | 0.013 | 0.002 |
| Tree Hierarchy | 0.168 | 0.153 | 0.501 | 0.609 | 0.388 | 0.249 | 0.179 | 0.078 | 0.486 | 0.679 | 0.319 | 0.825 |
| Maximum Degree | <0.001 | 0.002 | 0.002 | <0.001 | <0.001 | <0.001 | <0.001 | <0.001 | <0.001 | <0.001 | <0.001 | <0.001 |
| Assortativity | 0.849 | 0.452 | 0.621 | 0.123 | 0.908 | 0.068 | 0.035 | 0.268 | 0.011 | 0.462 | 0.461 | 0.601 |
| Degree Divergence | 0.038 | 0.070 | 0.094 | 0.105 | 0.031 | 0.155 | 0.463 | <0.001 | <0.001 | 0.039 | 0.037 | 0.011 |
| Hemispheric Connections | ||||||||||||
| Intra Left Connections | 0.003 | 0.009 | 0.002 | <0.001 | 0.002 | <0.001 | 0.018 | 0.002 | <0.001 | <0.001 | <0.001 | <0.001 |
| Intra Right Connections | <0.001 | 0.002 | 0.003 | 0.001 | 0.002 | <0.001 | 0.004 | <0.001 | <0.001 | <0.001 | 0.002 | <0.001 |
| Interhemispheric Connections | 0.045 | 0.047 | 0.386 | 0.005 | 0.049 | 0.035 | 0.018 | <0.001 | 0.010 | 0.003 | 0.029 | 0.002 |
| Behavioral Data | ||||||||||||
| Reaction Time | 0.506 | 0.190 | 0.531 | 0.001 | 0.029 | 0.008 | 0.339 | 0.225 | 0.438 | 0.367 | 0.206 | 0.093 |
| Accuracy | 0.002 | <0.001 | 0.060 | <0.001 | <0.001 | <0.001 | <0.001 | <0.001 | <0.001 | <0.001 | <0.001 | 0.139 |
Table 3.
All significant () correlations between global MST metrics and behavioral measures.
| Correlation | r | p |
|---|---|---|
| RT vs. Tree Diameter | 0.334 | 0.0028 |
| RT vs. Characteristic Path Length | 0.327 | 0.0042 |
| RT vs. Leaf Fraction | -0.318 | 0.0052 |
| RT vs. Degree Divergence | -0.313 | 0.0059 |
Table 4.
Survival Ratio (SR) summary across groups and stimulus types.
| Group | Neutral SR (mean) | Congruent SR (mean) | Incongruent SR (mean) | p-value (within-group, N vs C vs IC) |
|---|---|---|---|---|
| Control | 0.365 | 0.382 | 0.333 | 0.0458* |
| Migraine | 0.337 | 0.356 | 0.331 | 0.5648 |
| OCD | 0.314 | 0.337 | 0.338 | 0.4346 |
| SCHIZO | 0.362 | 0.335 | 0.354 | 0.1392 |
| p-value (between-group, per condition) | 0.0086* | 0.0410* | 0.5810 | — |
*.
Disclaimer/Publisher’s Note: The statements, opinions and data contained in all publications are solely those of the individual author(s) and contributor(s) and not of MDPI and/or the editor(s). MDPI and/or the editor(s) disclaim responsibility for any injury to people or property resulting from any ideas, methods, instructions or products referred to in the content. |
© 2025 by the authors. Licensee MDPI, Basel, Switzerland. This article is an open access article distributed under the terms and conditions of the Creative Commons Attribution (CC BY) license (http://creativecommons.org/licenses/by/4.0/).
Copyright: This open access article is published under a Creative Commons CC BY 4.0 license, which permit the free download, distribution, and reuse, provided that the author and preprint are cited in any reuse.